Embed Size (px)
Citation preview

Resolving Sub-Diffraction LimitEncounters in Nanoparticle TrackingUsing Live Cell Plasmon CouplingMicroscopyGuoxin Rong, Hongyun Wang, Lynell R. Skewis, and Bjorn M. Reinhard*
Department of Chemistry and The Photonics Center, Boston UniVersity,Boston, Massachusetts 02215
Received July 11, 2008; Revised Manuscript Received August 20, 2008
ABSTRACT
We use plasmon coupling between individual gold nanoparticle labels to monitor subdiffraction limit distances in live cell nanoparticle trackingexperiments. While the resolving power of our optical microscope is limited to ∼500 nm, we improve this by more than an order of magnitudeby detecting plasmon coupling between individual gold nanoparticle labels using a ratiometric detection scheme. We apply this plasmoncoupling microscopy to resolve the interparticle separations during individual encounters of gold nanoparticle labeled fibronectin-integrincomplexes in living HeLa cells.
Single particle tracking is an important tool to investigatedynamic biological processes by following the movementof individual labeled molecules with high spatial andtemporal resolution. By tracking the movement of particle-labeled plasma membrane components, deep insights intothe dynamic properties of membrane domains and thesignaling mechanisms of different surface receptors wereobtained.1-4 Single particle tracking has also been indispen-sable to unravel the working mechanism of different mo-lecular motors in vitro5-7 and recently also in vivo.8-12
Another field where “particle” tracking has enabled signifi-cant scientific progress lies in the area of virus trafficking.Single virus tracking in living cells has revealed many detailsof the interactions between viruses and cellular structuresand has provided us with a better understanding of themolecular mechanisms of viral infection.13-15 Finally, nano-particle tracking has also been successfully applied to monitorcell developmental processes in vivo.16
These examples highlight the wide use of single particletracking as a tool in biophysics and cell biology. Part of theappeal of the technology is that despite its relative simplicity,in its basic form it requires only a microscope and a camera,localization of individual particles with high spatial andtemporal resolution can be achieved in a wide-field micro-scope. The spatial precision with which an isolated particlecan be localized is limited only by the number of photonsthat are collected per time unit.17 Particles with large opticalcross-sections are therefore advantageous for achieving a high
spatial resolution with high temporal bandwidth. Fortynanometer gold nanoparticles are efficient light scattererswhich have long been used as probes in single particletracking applications.5 Recently, Nan et al. demonstratedtracking of individual gold nanoparticles with a spatialresolution of ∼1.5 nm at 25 µs temporal resolution in vivo.10
The excellent optical properties of the gold nanoparticlesresult from the resonant excitation of collective oscillationsof the particles’ free electrons, also called surface plasmons,which cause large optical cross-sections at their respectiveresonance wavelengths.18,19 Gold nanoparticles are not onlyvery bright but they also display an extreme photophysicalstability. Since their signal is based on light scattering, goldnanoparticles do not blink or bleach and enable, unlikefluorescent dyes or quantum dots, continuous, intermittence-free observation without limitations in total observation time.While an individual, isolated nanoparticle can be localizedwith nanometer spatial precision, the resolution in discerningtwo identical particles is limited by the diffraction limit to∼250 nm at best in the visible. One constraint of conven-tional single particle tracking methods is therefore theinability to detect short-range interactions between multiplelabeled molecules. These short-range interactions play apivotal role in virtually all cellular processes that involvetransient interactions between multiple components. In orderto unravel the complex mechanisms that govern dynamicbiological processes, imaging tools are desirable that enablethe tracking of individual components with high spatial andtemporal resolution and in addition facilitate the monitoring* To whom correspondence should be addressed. E-mail: [email protected].
NANOLETTERS
2008Vol. 8, No. 10
3386-3393
10.1021/nl802058q CCC: $40.75 2008 American Chemical SocietyPublished on Web 09/13/2008
of distances on the nanometer scale. Multicolor colocalizationof single fluorescent probes is a viable approach to overcomethis problem in cases where the interactions of two differentmoieties labeled with two distinct colors are investigated.20-23
However, this approach fails for discerning interactionsbetween identical labels. This limitation has spurred thedevelopment of different ultraresolution fluorescent micros-copy techniques that can distinguish identical fluorescentitems with subdiffraction limit resolution.24-28 Despite theexciting possibilities that these superresolution methods offerfor cell biology, the tracking of several individual objects inliving cells with subdiffraction spatial resolution remains asignificant challenge. In addition, like any other fluorescencemicroscopy superresolution methods are subject to theconstraints in continuous observation time that result fromthe limited photostability of the fluorescent probes. For thosesuperresolution methods that require the use of high-intensitypulsed lasers, this is an even greater concern.
Herein we explore an alternative approach to trackindividual objects in living cells with high temporal band-width and spatial precision, which is not limited in observa-tion time, and is capable of detecting interactions betweenidentically labeled objects on subdiffraction length scales.We augment conventional gold nanoparticle tracking withthe capability to probe distances below the diffraction limitusing the distance dependent near-field interactions betweenindividual gold particles. Plasmons of individual particlescan interact with each other over tens of nanometers29-32
and although these interactions occur in the near-field,plasmon coupling can be detected in the far-field as a shiftin the resonance wavelength of the interacting particles.33
We apply this technology here to monitor the interactionsbetween individual gold nanoparticles on the plasma mem-brane of living HeLa cells.
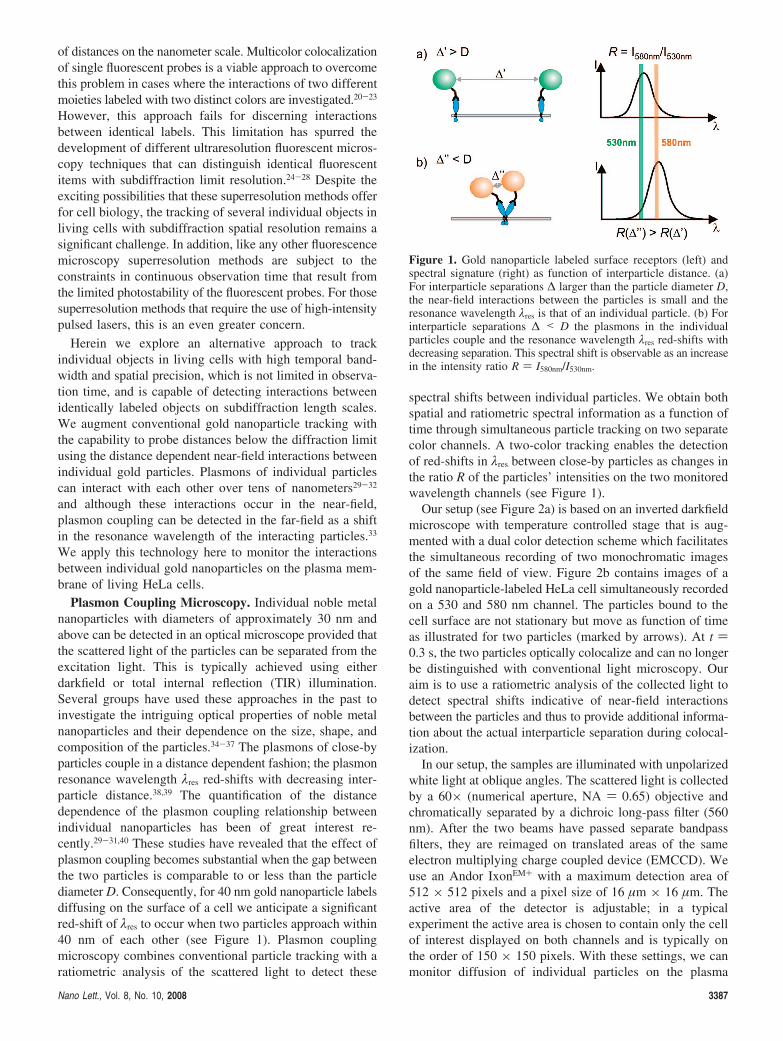
Plasmon Coupling Microscopy. Individual noble metalnanoparticles with diameters of approximately 30 nm andabove can be detected in an optical microscope provided thatthe scattered light of the particles can be separated from theexcitation light. This is typically achieved using eitherdarkfield or total internal reflection (TIR) illumination.Several groups have used these approaches in the past toinvestigate the intriguing optical properties of noble metalnanoparticles and their dependence on the size, shape, andcomposition of the particles.34-37 The plasmons of close-byparticles couple in a distance dependent fashion; the plasmonresonance wavelength λres red-shifts with decreasing inter-particle distance.38,39 The quantification of the distancedependence of the plasmon coupling relationship betweenindividual nanoparticles has been of great interest re-cently.29-31,40 These studies have revealed that the effect ofplasmon coupling becomes substantial when the gap betweenthe two particles is comparable to or less than the particlediameter D. Consequently, for 40 nm gold nanoparticle labelsdiffusing on the surface of a cell we anticipate a significantred-shift of λres to occur when two particles approach within40 nm of each other (see Figure 1). Plasmon couplingmicroscopy combines conventional particle tracking with aratiometric analysis of the scattered light to detect these
spectral shifts between individual particles. We obtain bothspatial and ratiometric spectral information as a function oftime through simultaneous particle tracking on two separatecolor channels. A two-color tracking enables the detectionof red-shifts in λres between close-by particles as changes inthe ratio R of the particles’ intensities on the two monitoredwavelength channels (see Figure 1).
Our setup (see Figure 2a) is based on an inverted darkfieldmicroscope with temperature controlled stage that is aug-mented with a dual color detection scheme which facilitatesthe simultaneous recording of two monochromatic imagesof the same field of view. Figure 2b contains images of agold nanoparticle-labeled HeLa cell simultaneously recordedon a 530 and 580 nm channel. The particles bound to thecell surface are not stationary but move as function of timeas illustrated for two particles (marked by arrows). At t )0.3 s, the two particles optically colocalize and can no longerbe distinguished with conventional light microscopy. Ouraim is to use a ratiometric analysis of the collected light todetect spectral shifts indicative of near-field interactionsbetween the particles and thus to provide additional informa-tion about the actual interparticle separation during colocal-ization.
In our setup, the samples are illuminated with unpolarizedwhite light at oblique angles. The scattered light is collectedby a 60× (numerical aperture, NA ) 0.65) objective andchromatically separated by a dichroic long-pass filter (560nm). After the two beams have passed separate bandpassfilters, they are reimaged on translated areas of the sameelectron multiplying charge coupled device (EMCCD). Weuse an Andor IxonEM+ with a maximum detection area of512 × 512 pixels and a pixel size of 16 µm × 16 µm. Theactive area of the detector is adjustable; in a typicalexperiment the active area is chosen to contain only the cellof interest displayed on both channels and is typically onthe order of 150 × 150 pixels. With these settings, we canmonitor diffusion of individual particles on the plasma
Figure 1. Gold nanoparticle labeled surface receptors (left) andspectral signature (right) as function of interparticle distance. (a)For interparticle separations ∆ larger than the particle diameter D,the near-field interactions between the particles is small and theresonance wavelength λres is that of an individual particle. (b) Forinterparticle separations ∆ < D the plasmons in the individualparticles couple and the resonance wavelength λres red-shifts withdecreasing separation. This spectral shift is observable as an increasein the intensity ratio R ) I580nm/I530nm.
Nano Lett., Vol. 8, No. 10, 2008 3387
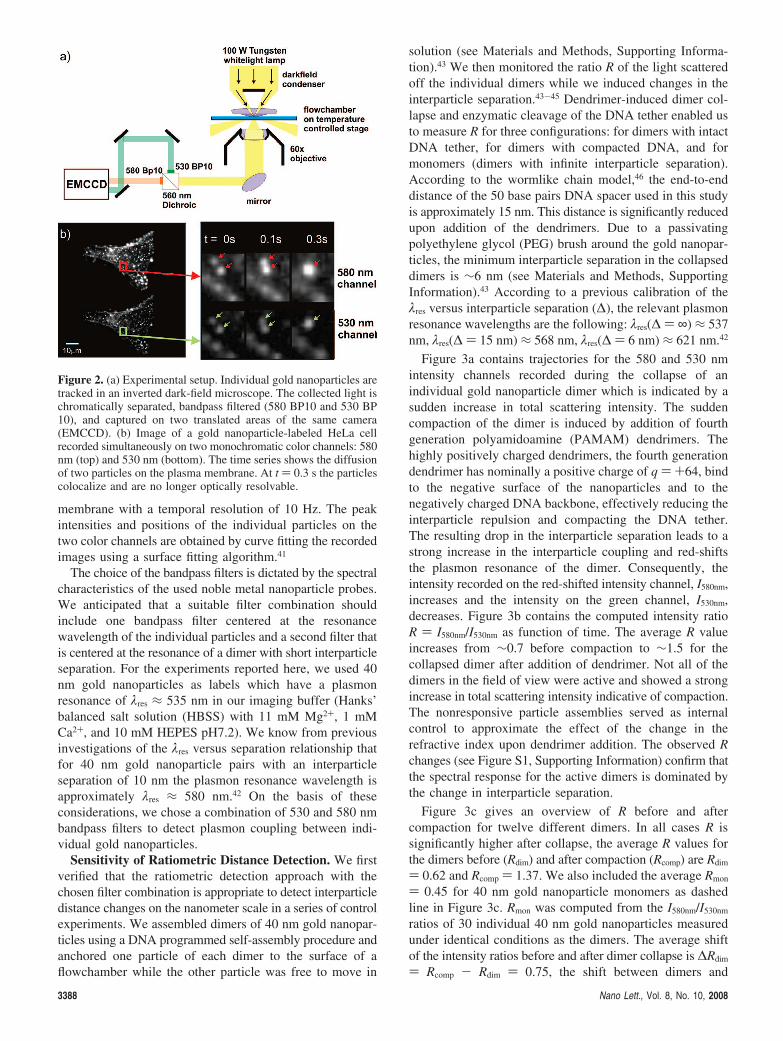
membrane with a temporal resolution of 10 Hz. The peakintensities and positions of the individual particles on thetwo color channels are obtained by curve fitting the recordedimages using a surface fitting algorithm.41
The choice of the bandpass filters is dictated by the spectralcharacteristics of the used noble metal nanoparticle probes.We anticipated that a suitable filter combination shouldinclude one bandpass filter centered at the resonancewavelength of the individual particles and a second filter thatis centered at the resonance of a dimer with short interparticleseparation. For the experiments reported here, we used 40nm gold nanoparticles as labels which have a plasmonresonance of λres ≈ 535 nm in our imaging buffer (Hanks’balanced salt solution (HBSS) with 11 mM Mg2+, 1 mMCa2+, and 10 mM HEPES pH7.2). We know from previousinvestigations of the λres versus separation relationship thatfor 40 nm gold nanoparticle pairs with an interparticleseparation of 10 nm the plasmon resonance wavelength isapproximately λres ≈ 580 nm.42 On the basis of theseconsiderations, we chose a combination of 530 and 580 nmbandpass filters to detect plasmon coupling between indi-vidual gold nanoparticles.
Sensitivity of Ratiometric Distance Detection. We firstverified that the ratiometric detection approach with thechosen filter combination is appropriate to detect interparticledistance changes on the nanometer scale in a series of controlexperiments. We assembled dimers of 40 nm gold nanopar-ticles using a DNA programmed self-assembly procedure andanchored one particle of each dimer to the surface of aflowchamber while the other particle was free to move in
solution (see Materials and Methods, Supporting Informa-tion).43 We then monitored the ratio R of the light scatteredoff the individual dimers while we induced changes in theinterparticle separation.43-45 Dendrimer-induced dimer col-lapse and enzymatic cleavage of the DNA tether enabled usto measure R for three configurations: for dimers with intactDNA tether, for dimers with compacted DNA, and formonomers (dimers with infinite interparticle separation).According to the wormlike chain model,46 the end-to-enddistance of the 50 base pairs DNA spacer used in this studyis approximately 15 nm. This distance is significantly reducedupon addition of the dendrimers. Due to a passivatingpolyethylene glycol (PEG) brush around the gold nanopar-ticles, the minimum interparticle separation in the collapseddimers is ∼6 nm (see Materials and Methods, SupportingInformation).43 According to a previous calibration of theλres versus interparticle separation (∆), the relevant plasmonresonance wavelengths are the following: λres(∆ ) ∞) ≈ 537nm, λres(∆ ) 15 nm) ≈ 568 nm, λres(∆ ) 6 nm) ≈ 621 nm.42
Figure 3a contains trajectories for the 580 and 530 nmintensity channels recorded during the collapse of anindividual gold nanoparticle dimer which is indicated by asudden increase in total scattering intensity. The suddencompaction of the dimer is induced by addition of fourthgeneration polyamidoamine (PAMAM) dendrimers. Thehighly positively charged dendrimers, the fourth generationdendrimer has nominally a positive charge of q ) +64, bindto the negative surface of the nanoparticles and to thenegatively charged DNA backbone, effectively reducing theinterparticle repulsion and compacting the DNA tether.The resulting drop in the interparticle separation leads to astrong increase in the interparticle coupling and red-shiftsthe plasmon resonance of the dimer. Consequently, theintensity recorded on the red-shifted intensity channel, I580nm,increases and the intensity on the green channel, I530nm,decreases. Figure 3b contains the computed intensity ratioR ) I580nm/I530nm as function of time. The average R valueincreases from ∼0.7 before compaction to ∼1.5 for thecollapsed dimer after addition of dendrimer. Not all of thedimers in the field of view were active and showed a strongincrease in total scattering intensity indicative of compaction.The nonresponsive particle assemblies served as internalcontrol to approximate the effect of the change in therefractive index upon dendrimer addition. The observed Rchanges (see Figure S1, Supporting Information) confirm thatthe spectral response for the active dimers is dominated bythe change in interparticle separation.
Figure 3c gives an overview of R before and aftercompaction for twelve different dimers. In all cases R issignificantly higher after collapse, the average R values forthe dimers before (Rdim) and after compaction (Rcomp) are Rdim
) 0.62 and Rcomp ) 1.37. We also included the average Rmon
) 0.45 for 40 nm gold nanoparticle monomers as dashedline in Figure 3c. Rmon was computed from the I580nm/I530nm
ratios of 30 individual 40 nm gold nanoparticles measuredunder identical conditions as the dimers. The average shiftof the intensity ratios before and after dimer collapse is ∆Rdim
) Rcomp - Rdim ) 0.75, the shift between dimers and
Figure 2. (a) Experimental setup. Individual gold nanoparticles aretracked in an inverted dark-field microscope. The collected light ischromatically separated, bandpass filtered (580 BP10 and 530 BP10), and captured on two translated areas of the same camera(EMCCD). (b) Image of a gold nanoparticle-labeled HeLa cellrecorded simultaneously on two monochromatic color channels: 580nm (top) and 530 nm (bottom). The time series shows the diffusionof two particles on the plasma membrane. At t ) 0.3 s the particlescolocalize and are no longer optically resolvable.
3388 Nano Lett., Vol. 8, No. 10, 2008

monomers is ∆Rmon ) Rdim - Rmon ) 0.17. Due to thedistance dependent decay of the plasmon coupling in noblemetal nanoparticles ∆Rdim is much larger than ∆Rmon. Asdiscussed elsewhere29,40,42 the difference in λres betweencoupled dimers and noninteracting particles decays expo-nentially with interparticle separation.
The obtained average shift in R between monomers anddimers is smaller than that between dimers and collapseddimers. However, it is evident from Figure 3c that allobserved Rdim values lie higher than Rmon indicating that thechosen filter combination is also capable of discerningmonomers from DNA tethered dimers. We anticipate that ifvariations in R due to heterogeneities in the size and shapeof the used particles are eliminated by following singleparticle trajectories, individual gold nanoparticles can beunambiguously discerned from weakly interacting goldnanoparticle dimers. This argument is corroborated by theplots of I530nm and I580nm recorded during a DNA cleavageexperiment in Figure 4. In this experiment, the DNA tetheringtwo gold nanoparticles contains an EcoRV recognition siteand is cleaved by the enzyme. Upon DNA cleavage marked
by the arrow in Figure 4a, the intensities on both colorchannels drop steeply as the number of particles is reducedfrom two to one; only one of the particles is anchored to thesurface, the second particle is free to diffuse away once theDNA tether has been cleaved. In addition to the decrease inscattering cross-section, the transition from a dimer to amonomer is accompanied by a blue-shift of the plasmonresonance by approximately ∆λres ≈ -31 nm leading to anincrease in the relative contribution from the green channelto the spectrum of the scattered light. As indicated in Figure4b, this shift is clearly detected by the drop in R.
The performed calibration experiments at variable inter-particle distances confirm that the chosen filter combinationis appropriate to discern noninteracting gold nanoparticlesfrom nanoparticles that have approached each other to withinapproximately 15 nm. As illustrated by the DNA condensa-tion experiments, distance changes below this threshold leadto strong changes in R due to strong red-shifts of λres. Thedistance sensitivity of the ratiometric detection approach canbe further optimized and tuned by the choice of the appliedfilter combination. Filter combinations in the green arepreferable for a high sensitivity at long interparticle separa-tions whereas filter combinations in the red will lead to animproved spatial resolution at short interparticle separations.For the main goal of this study, the detection of closeencounters between gold nanoparticle labeled surface recep-tors on living cells, the detection threshold at around 15 nmobtained with the chosen 530 nm/580 nm filter set isappropriate.
Resolving Gold Nanoparticle Encounters Below theDiffraction Resolution Limit in Living Cells. Colocaliza-tion of individual components is often used in biologicalimaging as an indication for direct interactions between thelabeled components. However, due to the diffraction resolu-tion limit, individual components can be hundreds ofnanometers apart and still appear colocalized in conventionallight microscopy. In our setup, we used a 60× objective witha NA ) 0.65. Under these conditions, two individual gold
Figure 3. Ratiometric detection of interparticle distance changes. (a) Intensities I580nm (red), I530nm (green), and total intensity (black) recordedduring dendrimer induced collapse of a pair of DNA (50 base pairs) tethered gold nanoparticles (“dimer”). Upon collapse, marked by thearrow, I580nm increases while I530nm decreases, indicative of a spectral red-shift. (b) Corresponding intensity ratio R ) I580nm/I530nm duringdimer collapse. (c) Time-averaged intensity ratios R for twelve dimers before and after dendrimer induced collapse. The average interparticleseparation before compaction is ∆ ≈ 15 nm and ∆ ≈ 6 nm after compaction (see text). In all cases, we observe a significant increase inR upon compaction. The average R value calculated from 30 monomers is included as dashed line.
Figure 4. (a) Intensities I580nm and I530nm during enzymatic cleavageof the 50 base pairs long DNA spacer tethered between two goldnanoparticles. (b) Corresponding ratio R ) I580nm/I530nm.
Nano Lett., Vol. 8, No. 10, 2008 3389
nanoparticles with λres ≈ 535 nm can be discerned opticallyonly if they are separated by more than 500 nm. Plasmoncoupling microscopy now offers additional information about
very short interparticle separations by detecting the near-field interactions between individual noble metal nanoparticlelabels which occur only if the particles have approached each
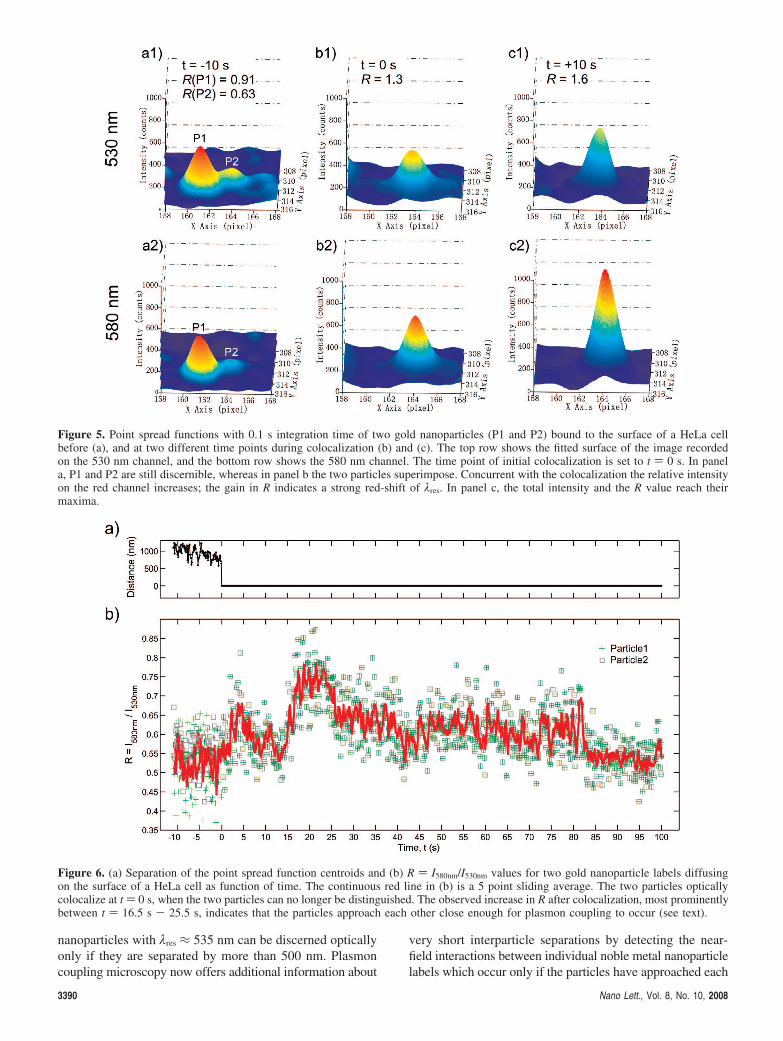
Figure 5. Point spread functions with 0.1 s integration time of two gold nanoparticles (P1 and P2) bound to the surface of a HeLa cellbefore (a), and at two different time points during colocalization (b) and (c). The top row shows the fitted surface of the image recordedon the 530 nm channel, and the bottom row shows the 580 nm channel. The time point of initial colocalization is set to t ) 0 s. In panela, P1 and P2 are still discernible, whereas in panel b the two particles superimpose. Concurrent with the colocalization the relative intensityon the red channel increases; the gain in R indicates a strong red-shift of λres. In panel c, the total intensity and the R value reach theirmaxima.
Figure 6. (a) Separation of the point spread function centroids and (b) R ) I580nm/I530nm values for two gold nanoparticle labels diffusingon the surface of a HeLa cell as function of time. The continuous red line in (b) is a 5 point sliding average. The two particles opticallycolocalize at t ) 0 s, when the two particles can no longer be distinguished. The observed increase in R after colocalization, most prominentlybetween t ) 16.5 s - 25.5 s, indicates that the particles approach each other close enough for plasmon coupling to occur (see text).
3390 Nano Lett., Vol. 8, No. 10, 2008
other to within approximately one particle diameter. Weapplied this approach to detect direct interactions betweenindividual nanoparticle labeled integrin surface receptors onliving cells during colocalization. Integrins are a family ofcell surface receptors that mediate a series of cell-cell andcell-matrix interactions, for instance, with the cell adhesionmolecule fibronectin.47-50 We bound fibronectin to integrinson the plasma membrane of a cervical cancer cell line (HeLa)and used 40 nm gold nanoparticles that were functionalizedwith antifibronectin (see Supporting Information) as labelsfor the integrin bound fibronectin. All experiments wereperformed in a flowchamber at 37 °C.
In a typical experiment, the cells were first incubated witha 0.2 mg/mL solution of fibronectin in imaging buffer for10 min. Then the cells were washed with an excess ofimaging buffer and a solution of antifibronectin-functional-ized gold nanoparticles in imaging buffer was added. Theconcentration of the particles was chosen sufficiently low toallow the tracking of individual particles. We started record-ing with the addition of gold nanoparticles and detected goldnanoparticle binding from solution in real time. Since thecells always contained some particulate scattering sources,we restricted our analysis to gold nanoparticles whosebinding from solution was recorded. To confirm that theseattachments were caused by specific interactions betweenthe fibronectin and the gold nanoparticle bound antibody,we performed different control experiments. First, we usedbovine serum albumin (BSA)-functionalized nanoparticlesto test the “stickiness” of the cell surface for protein-coatednanoparticles. We observed no binding under our experi-mental conditions. Next, we incubated antifibronectin-functionalized particles with HeLa cells without priorincubation with fibronectin. Again, we did not observe anyparticle binding, giving confidence that the observed bindingwas not caused by nonspecific membrane-particle interac-tions but was indeed caused by the antibody binding to itsepitope.
To track particles that bound to the cell from solution andto monitor their R value, we fitted the scattering images onthe two color channels.41 The obtained fits were thenbackground corrected with fits to nearby areas that were voidof nanoparticles. We used the fitted peak intensities on thetwo color channels I580nm and I530nm to calculate the ratio R) I580nm/I530nm for the individual particles. The spatialcoordinates of the individual particles were obtained fromthe fitted peak position on the 530 nm channel. The surface-mobilities of the nanoparticle labels varied significantly, theobserved behaviors varied from immobilization to rapidsurface diffusion with diffusion coefficients up to 1.8 × 10⁻¹⁴
m2/s. It has been observed before that the lateral mobility ofindividual integrins can vary substantially.51,52 The mobilityof the gold nanoparticle-labeled fibronectin-integrin com-plexes on the cell surface depends on the oligomerizationstate of the integrin and the interactions with the cytoskeletonof the cell.47,48,51,53 We observed that some of the trackedgold nanoparticle-labeled fibronectin-integrin complexesapproached each other to within the diffraction resolutionlimit of our microscope so that we could no longer resolvethe individual particles optically. Colocalization durationsranged from a single frame to hundreds of frames, and insome cases the particles remained colocalized after initialcontact for the entire remaining observation period. Althoughfor very short colocalization durations we assumed that thevicinity was accidental, different processes can cause longerperiods of colocalization. It is conceivable that gold nano-particle-labeled fibronectin-integrin complexes cluster dueto direct or mediated short-range interactions. However,alternative processes exist that can account for the opticalcolocalization that do not require direct interactions betweenthe integrins. For instance, it has been observed before thatmembrane-spanning proteins can be locally stopped, slowed,or temporarily confined due to the compartmentalization ofthe cell membrane.54 These compartments can have dimen-sions on the order of the diffraction resolution limit or below.If two nanoparticle-labeled fibronectin-integrin complexesget temporarily trapped in the same compartment, they appearcolocalized for the time they remain in the same compart-ment.
Plasmon coupling offers valuable additional informationabout the interparticle separation during colocalization; itenables one to experimentally probe interactions between theparticles that occur only on the tens of nanometer lengthscale and is therefore a promising tool to unravel theinteractions between gold nanoparticle labeled surface recep-tors. Figure 5 contains an example that illustrates how short-range interactions between individual gold nanoparticles canbe detected by plasmon coupling on a cell surface. We showthe curve-fitted images, or point-spread-functions (PSF), fortwo particles at three time points during aggregation. InFigure 5a, the two particles are still discernible. It is strikingthat one of the particles (P1) is brighter than the other particle(P2). For both P1 and P2 the intensity is higher on the greenthan on the red channel, albeit the computed R values implythat λres for P1 is redder than for P2. The differences in theoptical properties of P1 and P2 indicate differences in the
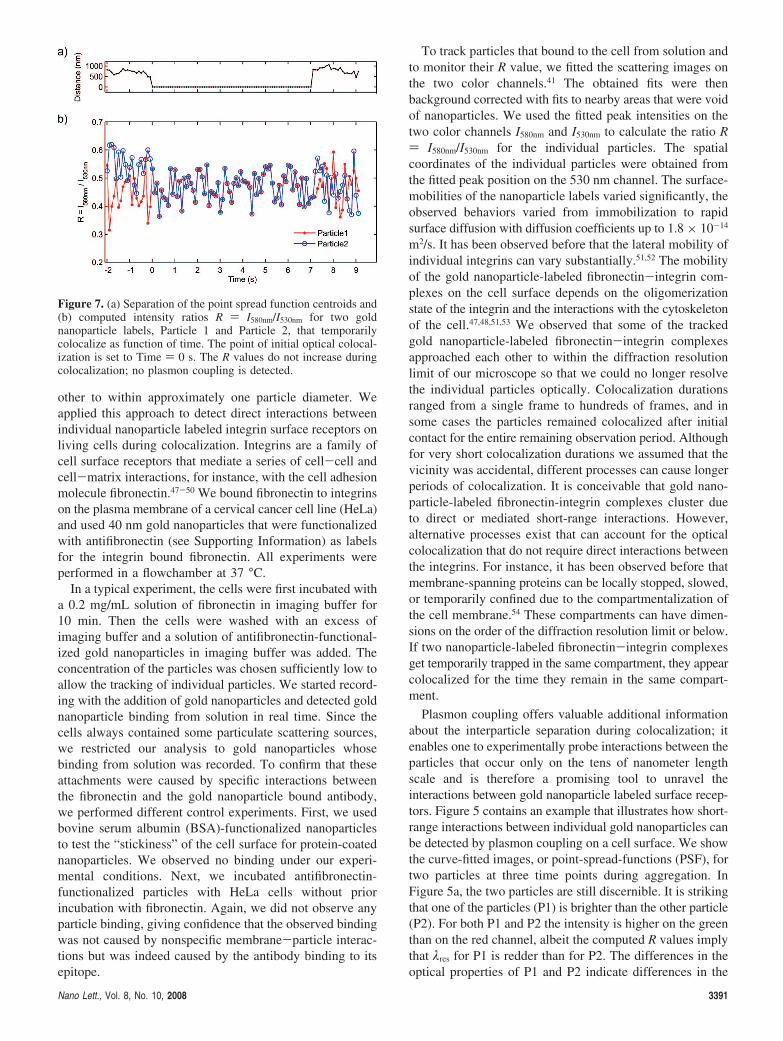
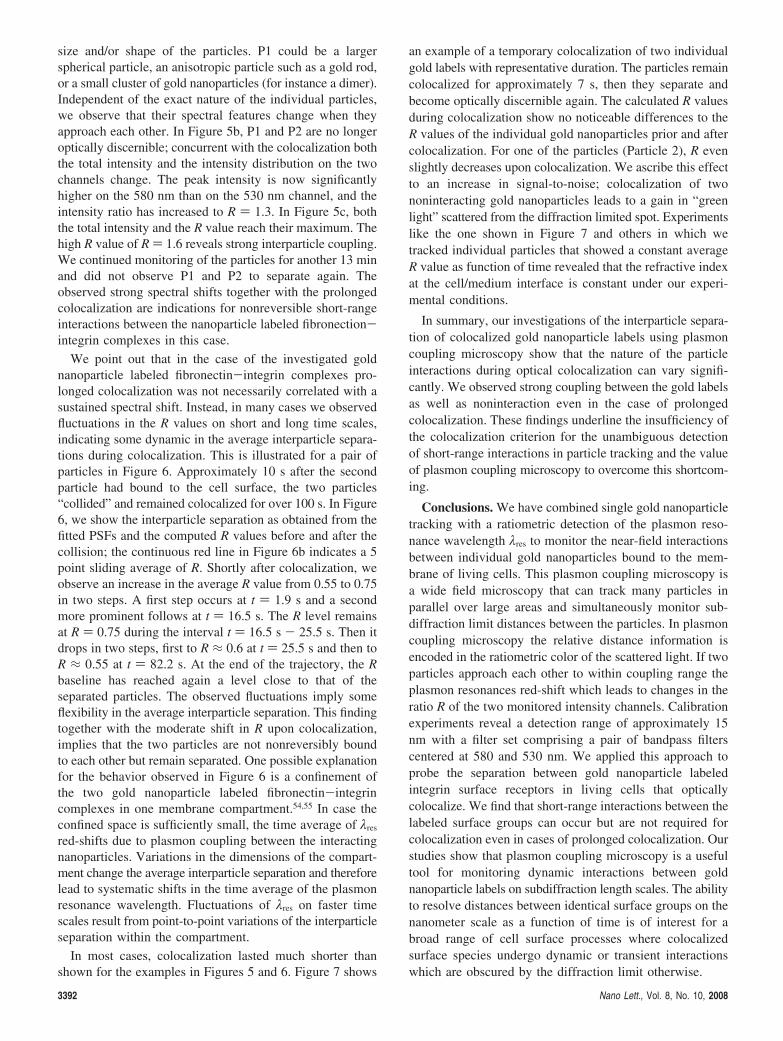
Figure 7. (a) Separation of the point spread function centroids and(b) computed intensity ratios R ) I580nm/I530nm for two goldnanoparticle labels, Particle 1 and Particle 2, that temporarilycolocalize as function of time. The point of initial optical colocal-ization is set to Time ) 0 s. The R values do not increase duringcolocalization; no plasmon coupling is detected.
Nano Lett., Vol. 8, No. 10, 2008 3391
size and/or shape of the particles. P1 could be a largerspherical particle, an anisotropic particle such as a gold rod,or a small cluster of gold nanoparticles (for instance a dimer).Independent of the exact nature of the individual particles,we observe that their spectral features change when theyapproach each other. In Figure 5b, P1 and P2 are no longeroptically discernible; concurrent with the colocalization boththe total intensity and the intensity distribution on the twochannels change. The peak intensity is now significantlyhigher on the 580 nm than on the 530 nm channel, and theintensity ratio has increased to R ) 1.3. In Figure 5c, boththe total intensity and the R value reach their maximum. Thehigh R value of R ) 1.6 reveals strong interparticle coupling.We continued monitoring of the particles for another 13 minand did not observe P1 and P2 to separate again. Theobserved strong spectral shifts together with the prolongedcolocalization are indications for nonreversible short-rangeinteractions between the nanoparticle labeled fibronection-integrin complexes in this case.
We point out that in the case of the investigated goldnanoparticle labeled fibronectin-integrin complexes pro-longed colocalization was not necessarily correlated with asustained spectral shift. Instead, in many cases we observedfluctuations in the R values on short and long time scales,indicating some dynamic in the average interparticle separa-tions during colocalization. This is illustrated for a pair ofparticles in Figure 6. Approximately 10 s after the secondparticle had bound to the cell surface, the two particles“collided” and remained colocalized for over 100 s. In Figure6, we show the interparticle separation as obtained from thefitted PSFs and the computed R values before and after thecollision; the continuous red line in Figure 6b indicates a 5point sliding average of R. Shortly after colocalization, weobserve an increase in the average R value from 0.55 to 0.75in two steps. A first step occurs at t ) 1.9 s and a secondmore prominent follows at t ) 16.5 s. The R level remainsat R ) 0.75 during the interval t ) 16.5 s - 25.5 s. Then itdrops in two steps, first to R ≈ 0.6 at t ) 25.5 s and then toR ≈ 0.55 at t ) 82.2 s. At the end of the trajectory, the Rbaseline has reached again a level close to that of theseparated particles. The observed fluctuations imply someflexibility in the average interparticle separation. This findingtogether with the moderate shift in R upon colocalization,implies that the two particles are not nonreversibly boundto each other but remain separated. One possible explanationfor the behavior observed in Figure 6 is a confinement ofthe two gold nanoparticle labeled fibronectin-integrincomplexes in one membrane compartment.54,55 In case theconfined space is sufficiently small, the time average of λres
red-shifts due to plasmon coupling between the interactingnanoparticles. Variations in the dimensions of the compart-ment change the average interparticle separation and thereforelead to systematic shifts in the time average of the plasmonresonance wavelength. Fluctuations of λres on faster timescales result from point-to-point variations of the interparticleseparation within the compartment.
In most cases, colocalization lasted much shorter thanshown for the examples in Figures 5 and 6. Figure 7 shows
an example of a temporary colocalization of two individualgold labels with representative duration. The particles remaincolocalized for approximately 7 s, then they separate andbecome optically discernible again. The calculated R valuesduring colocalization show no noticeable differences to theR values of the individual gold nanoparticles prior and aftercolocalization. For one of the particles (Particle 2), R evenslightly decreases upon colocalization. We ascribe this effectto an increase in signal-to-noise; colocalization of twononinteracting gold nanoparticles leads to a gain in “greenlight” scattered from the diffraction limited spot. Experimentslike the one shown in Figure 7 and others in which wetracked individual particles that showed a constant averageR value as function of time revealed that the refractive indexat the cell/medium interface is constant under our experi-mental conditions.
In summary, our investigations of the interparticle separa-tion of colocalized gold nanoparticle labels using plasmoncoupling microscopy show that the nature of the particleinteractions during optical colocalization can vary signifi-cantly. We observed strong coupling between the gold labelsas well as noninteraction even in the case of prolongedcolocalization. These findings underline the insufficiency ofthe colocalization criterion for the unambiguous detectionof short-range interactions in particle tracking and the valueof plasmon coupling microscopy to overcome this shortcom-ing.
Conclusions. We have combined single gold nanoparticletracking with a ratiometric detection of the plasmon reso-nance wavelength λres to monitor the near-field interactionsbetween individual gold nanoparticles bound to the mem-brane of living cells. This plasmon coupling microscopy isa wide field microscopy that can track many particles inparallel over large areas and simultaneously monitor sub-diffraction limit distances between the particles. In plasmoncoupling microscopy the relative distance information isencoded in the ratiometric color of the scattered light. If twoparticles approach each other to within coupling range theplasmon resonances red-shift which leads to changes in theratio R of the two monitored intensity channels. Calibrationexperiments reveal a detection range of approximately 15nm with a filter set comprising a pair of bandpass filterscentered at 580 and 530 nm. We applied this approach toprobe the separation between gold nanoparticle labeledintegrin surface receptors in living cells that opticallycolocalize. We find that short-range interactions between thelabeled surface groups can occur but are not required forcolocalization even in cases of prolonged colocalization. Ourstudies show that plasmon coupling microscopy is a usefultool for monitoring dynamic interactions between goldnanoparticle labels on subdiffraction length scales. The abilityto resolve distances between identical surface groups on thenanometer scale as a function of time is of interest for abroad range of cell surface processes where colocalizedsurface species undergo dynamic or transient interactionswhich are obscured by the diffraction limit otherwise.
3392 Nano Lett., Vol. 8, No. 10, 2008
Acknowledgment. This work was partially supported byGrant 1 R21 EB008822-01 from the National Institute ofHealth.
Supporting Information Available: Materials and Meth-ods and Figure S1. This material is available free of chargevia the Internet at http://pubs.acs.org.
References(1) Saxton, M. J.; Jacobson, K. Annu. ReV. Biophys. Biomol. Struct. 1997,
26, 373–399.(2) Kusumi, A.; Nakada, C.; Ritchie, K.; Murase, K.; Suzuki, K.;
Murakoshi, H.; Kasai, R. S.; Kondo, J.; Fujiwara, T. Annu. ReV.Biophys. Biomol. Struct. 2005, 34, 351–378.
(3) Sheetz, M. P.; Turney, S.; Qian, H.; Elson, E. L. Nature 1989, 340,284–288.
(4) Suzuki, K. G. N.; Fujiwara, T. K.; Sanematsu, F.; Iino, R.; Edidin,M.; Kusumi, A. J. Cell Biol. 2007, 177, 717–730.
(5) Gelles, J.; Schnapp, B. J.; Sheetz, M. P. Nature 1988, 331, 450–453.(6) Yasuda, R.; Noji, H.; Yoshida, M.; Kinosita, K.; Itoh, H. Nature 2001,
410, 898–904.(7) Muthukrishnan, G.; Hutchins, B. M.; Williams, M. E.; Hancock, W. O.
Small 2006, 2, 626–630.(8) Kural, C.; Kim, H.; Syed, S.; Goshima, G.; Gelfand, V. I.; Selvin,
P. R. Science 2005, 308, 1469–1472.(9) Watanabe, T. M.; Higuchi, H. Biophys. J. 2007, 92, 4109–4120.
(10) Nan, X. L.; Sims, P. A.; Xie, X. S. ChemPhysChem. 2008, 9, 707–712.
(11) Nan, X. L.; Sims, P. A.; Chen, P.; Xie, X. S. J. Phys. Chem. B 2005,109, 24220–24224.
(12) Balci, H.; Blehm, B. H.; Toprak, E.; Serpinskaya, A. S.; Gelfand, V. I.;Selvin, P. R. Biophys. J. 2007, 527a–527a.
(13) Seisenberger, G.; Ried, M. U.; Endress, T.; Buning, H.; Hallek, M.;Brauchle, C. Science 2001, 294, 1929–1932.
(14) Babcock, H. P.; Chen, C.; Zhuang, X. W. Biophys. J. 2004, 87, 2749–2758.
(15) Brandenburg, B.; Zhuang, X. W. Nat. ReV. Microbiol. 2007, 5, 197–208.
(16) Lee, K. J.; Nallathamby, P. D.; Browning, L.; Osgood, C. J.; Xu, X.ACS Nano 2007, 1, 133–143.
(17) Thompson, R. E.; Larson, D. R.; Webb, W. W. Biophys. J. 2002, 82,2775–2783.
(18) Kreibig, U.; Vollmer, M. Optical Properties of Metal Clusters;Springer-Verlag: Berlin, 1995.
(19) Kelly, K. L.; Coronado, E.; Zhao, L. L.; Schatz, G. C. J. Phys. Chem.B 2003, 107, 668–677.
(20) Lacoste, T. D.; Michalet, X.; Pinaud, F.; Chemla, D. S.; Alivisatos,A. P.; Weiss, S. Proc. Natl. Acad. Sci. U.S.A. 2000, 97, 9461–9466.
(21) Churchman, L. S.; Okten, Z.; Rock, R. S.; Dawson, J. F.; Spudich,J. A. Proceedings of the National Academy of Sciences of the UnitedStates of America 2005, 102, 1419–1423.
(22) Agrawal, A.; Deo, R.; Wang, G. D.; Wang, M. D.; Nie, S. M. Proc.Natl. Acad. Sci. U.S.A. 2008, 105, 3298–3303.
(23) Koyama-Honda, I.; Ritchie, K.; Fujiwara, T.; Iino, R.; Murakoshi, H.;Kasai, R. S.; Kusumi, A. Biophys. J. 2005, 88, 2126–2136.
(24) Hell, S. W. Science 2007, 316, 1153–1158.(25) Hell, S. W.; Wichmann, J. Opt. Lett. 1994, 19, 780–782.(26) Betzig, E.; Patterson, G. H.; Sougrat, R.; Lindwasser, O. W.; Olenych,
S.; Bonifacino, J. S.; Davidson, M. W.; Lippincott-Schwartz, J.; Hess,H. F. Science 2006, 313, 1642–1645.
(27) Gustafsson, M. G. L. Proc. Natl. Acad. Sci. U.S.A. 2005, 102, 13081–13086.
(28) Rust, M. J.; Bates, M.; Zhuang, X. W. Nat. Methods 2006, 3, 793–795.
(29) Jain, P. K.; Huang, W. Y.; El-Sayed, M. A. Nano Lett. 2007, 7, 2080–2088.
(30) Rechberger, W.; Hohenau, A.; Leitner, A.; Krenn, J. R.; Lamprecht,B.; Aussenegg, F. R. Opt. Commun. 2003, 220, 137–141.
(31) Wei, Q. H.; Su, K. H.; Durant, S.; Zhang, X. Nano Lett. 2004, 4,1067–1071.
(32) Elghanian, R.; Storhoff, J. J.; Mucic, R. C.; Letsinger, R. L.; Mirkin,C. A. Science 1997, 277, 1078–1081.
(33) Maier, S. A.; Brongersma, M. L.; Kik, P. G.; Atwater, H. A. Phys.ReV. B 2002, 65, 193408.
(34) Sonnichsen, C.; Geier, S.; Hecker, N. E.; von Plessen, G.; Feldmann,J.; Ditlbacher, H.; Lamprecht, B.; Krenn, J. R.; Aussenegg, F. R.; Chan,V. Z. H.; Spatz, J. P.; Moller, M. Appl. Phys. Lett. 2000, 77, 2949–2951.
(35) Nehl, C. L.; Grady, N. K.; Goodrich, G. P.; Tam, F.; Halas, N. J.;Hafner, J. H. Nano Lett. 2004, 4, 2355–2359.
(36) Sherry, L. J.; Chang, S. H.; Schatz, G. C.; Van Duyne, R. P.; Wiley,B. J.; Xia, Y. N. Nano Lett. 2005, 5, 2034–2038.
(37) Novo, C.; Gomez, D.; Perez-Juste, J.; Zhang, Z. Y.; Petrova, H.;Reismann, M.; Mulvaney, P.; Hartland, G. V. Phys. Chem. Chem.Phys. 2006, 8, 3540–3546.
(38) Quinten, M.; Kreibig, U. Appl. Opt. 1993, 32, 6173–6182.(39) Storhoff, J. J.; Lazarides, A. A.; Mucic, R. C.; Mirkin, C. A.; Letsinger,
R. L.; Schatz, G. C. J. Am. Chem. Soc. 2000, 122, 4640–4650.(40) Su, K. H.; Wei, Q. H.; Zhang, X.; Mock, J. J.; Smith, D. R.; Schultz,
S. Nano Lett. 2003, 3, 1087–1090.(41) D’Errico, J. Surface Fitting using Gridfit, available at http://www.
mathworks.com/matlabcentral/fileexchange.(42) Reinhard, B. M.; Siu, M.; Agarwal, H.; Alivisatos, A. P.; Liphardt, J.
Nano Lett. 2005, 5, 2246–2252.(43) Reinhard, B. M.; Sheikholeslami, S.; Mastroianni, A.; Alivisatos, A. P.;
Liphardt, J. Proc. Natl. Acad. Sci. U.S.A. 2007, 104, 2667–2672.(44) Sonnichsen, C.; Reinhard, B. M.; Liphardt, J.; Alivisatos, A. P. Nat.
Biotechnol. 2005, 23, 741–745.(45) Skewis, L. R.; Reinhard, B. M. Nano Lett. 2008, 8, 214–220.(46) Kratky, O.; Porod, G. Rec. TraV. Chim. Des Pays-Bas 1949, 68, 1106–
1122.(47) Nishizaka, T.; Shi, Q.; Sheetz, M. P. Proc. Natl. Acad. Sci. U.S.A.
2000, 97, 692–697.(48) Auer, K. L.; Jacobson, B. S. Mol. Biol. Cell 1995, 6, 1305–1313.(49) Hynes, R. O. Cell 1992, 69, 11–25.(50) Garcia, A. J.; Boettiger, D. Biomaterials 1999, 20, 2427–2433.(51) Hirata, H.; Ohki, K.; Miyata, H. Biochim. Biophys. Acta 2005, 1723,
100–105.(52) Duband, J. L.; Nuckolls, G. H.; Ishihara, A.; Hasegawa, T.; Yamada,
K. M.; Thiery, J. P.; Jacobson, K. J. Cell Biol. 1988, 107, 1385–1396.
(53) Pankov, R.; Cukierman, E.; Katz, B. Z.; Matsumoto, K.; Lin, D. C.;Lin, S.; Hahn, C.; Yamada, K. M. J. Cell Biol. 2000, 148, 1075–1090.
(54) Tomishige, M.; Sako, Y.; Kusumi, A. J. Cell Biol. 1998, 142, 989–1000.
(55) Murase, K.; Fujiwara, T.; Umemura, Y.; Suzuki, K.; Iino, R.;Yamashita, H.; Saito, M.; Murakoshi, H.; Ritchie, K.; Kusumi, A.Biophys. J. 2004, 86, 4075–4093.
NL802058Q
Nano Lett., Vol. 8, No. 10, 2008 3393