Embed Size (px)
Citation preview
Resolution Recommendation for Event Tickets inService Management
Wubai Zhou, Liang Tang and Tao LiSchool of Computer Science
Florida International UniversityMiami, FL, USA
Email:{wzhou005,ltang002, taoli}@cs.fiu.edu
Larisa ShwartzOperational Innovations
IBM T.J. Watson Research CenterYorktown Heights, NY, USAEmail: [email protected]
Genady Ya. GrabarnikDept. of Math & Computer Science
St. John’s UniversityQueens, NY, USA
Email:[email protected]
Abstract—In recent years, IT Service Providers have beenrapidly transforming to an automated service delivery model.This is due to advances in technology and driven by theunrelenting market pressure to reduce cost and maintain quality.Tremendous progress has been made to date towards attainmentof truly automated service delivery; that is, the ability to deliverthe same service automatically using the same process withthe same quality. However, automating Incident and ProblemManagement continuous to be a difficult problem, particularlydue to the growing complexity of IT environments.
Software monitoring systems are designed to actively collectand signal event occurrances and, when necessary, automaticallygenerate incident tickets. Repeating events generate similartickets, which in turn have a vast number of repeated problemresolutions likely to be found in earlier tickets. In this paperwe find an appropriate resolution by making use of similaritiesbetween the events and previous resolutions of similar events.Traditional KNN (K Nearest Neighbor) algorithm has been usedto recommend resolutions for incoming tickets. However, theeffectiveness of recommendation heavily relies on the underlyingsimilarity measure in KNN. In this paper, we significantlyimprove the similarity measure used in KNN by utilizing boththe event and resolution information in historical tickets via atopic-level feature extraction using the LDA (Latent DirichletAllocation) model. In addition, when resolution categories areavailable, we propose to learn a more effective similarity measureusing metric learning. Extensive empirical evaluations on threeticket data sets demonstrate the effectiveness and efficiency ofour proposed methods.
Index Terms—IT Service Management, Recommender System,LDA (Latent Dirichlet Allocation), Metric Learning
I. INTRODUCTION
Today’s competitive business climate, as well as the com-plexity of service environments, dictate the need for efficientand cost-effective service delivery and support. This is largelyachieved through service-providing facilities that collaboratewith system management tools, combined with automation ofroutine maintenance procedures such as problem detection,determination and resolution for the service infrastructure [1],[2], [3], [4], [5]. Automatic problem detection is typicallyrealized by system monitoring software, such as IBM TivoliMonitoring [6] and HP OpenView [7]. Monitoring continu-ously captures the events and generates incident tickets whenalerts are raised. Deployment of monitoring solutions is a firststep towards fully automated delivery of a service. Automatedproblem resolution, however, is a hard problem.
With the development of e-commerce, a substantial amountof research has been devoted to recommendation systems.These recommendation systems determine items or productsto be recommended based on prior behavior of the user orsimilar users and on the item itself. An increasing amountof user interactions have provided these applications with avast amount of historical information that can be convertedinto practical knowledge. In this paper we apply a similarapproach and develop a methodology that finds a resolutionfor an event by making use of similarities between the eventsand previous resolutions of monitoring tickets. Most serviceproviders keep years’ worth of historical tickets with theirresolutions. The resolution is usually collected as a free-form text and describes steps taken to remediate the issuedescribed in the ticket. We analyzed historical monitoringtickets collected from three different accounts managed by oneof the large service providers (an account is as an aggregate ofservices that use common infrastructure). We noticed that thereare many repeating resolutions for monitoring tickets withinan account. It is natural to expect that if events are similar,then their respective tickets probably have the same resolution.Therefore, we can recommend a resolution for an incomingticket based on the event information and historical tickets.
A KNN-based approach has been proposed in [8] to provideresolution recommendations for incoming tickets in servicemanagement. Although the approach has been successfullyused in practice, it has the following two major limitations:
• Representation of monitoring tickets: In the KNN-based approach, attribute-based features are used to rep-resent monitoring tickets. However, attribute-level featurerepresentation is not interpretable and often contains lotsof noise. In practice, each monitoring ticket describesthe existing problems (e.g., low capacity, high CPUutilization) in service and the associated ticket resolutionsshould be highly relevant to the problems. Therefore,it is better to use features semantically capturing theseproblems, instead of attribute-level features, to representmonitoring tickets.
• Similarity Measurement: The similarity measure usedin [8] only considers the event information, and ignoresthe related resolutions. In addition, each attribute is
978-3-901882-76-0 @2015 IFIP 287
treated equally when computing the similarity measure.However, the resolutions often reveal their prevalencein historical tickets and contain important informationabout the events, which can be used to improve the rec-ommendation performance. Moreover, different attributesshould have different weights in computing the similaritymeasure as they often play different roles in representingthe tickets.
In this paper, we propose an approach to address theaforementioned limitations in recommending ticket resolutionsfor service management. In particular, we make the followingcontributions:• We analyze historical monitoring tickets from three pro-
duction accounts and observe that their resolutions arerecommendable for current monitoring tickets on thebasis of event information.
• We propose a feature extraction approach capable ofrepresenting both the event and resolution informationusing topic-level features obtained via the LDA model.
• We propose to further improve the similarity measure-ment using metric learning when resolution categoriesare available.
• We conducted extensive experiments for our proposedalgorithms on real ticket datasets, and experimental re-sults demonstrate the effectiveness and efficiency of theproposed approaches.
The rest of the paper is organized as follows: Section IIbriefly introduces the workflow of the infrastructure manage-ment of an automated service and shares our observations onthree sets of monitoring tickets. In Section III, we presentresolution recommendation algorithms for monitoring tickets.Section IV discusses some detailed implementation issues. InSection V, we present experimental studies on real monitoringtickets. Section VI describes related work about service infras-tructure management and recommendation systems. Finally,Section VII concludes our paper and discusses our futurework.
II. BACKGROUND
In this section, we first provide an overview of automatedservice infrastructure monitoring with ticket generation andresolution. Then we present our analysis on real ticket datasets.
A. Automated Services Infrastructure Monitoring and EventTickets
The typical workflow of problem detection, determination,and resolution in services infrastructure management is pre-scribed by the ITIL specification [9]. Problem detection isusually provided by monitoring software, which computesmetrics for hardware and software performance at regularintervals. The metrics are then matched against acceptablethresholds. A violation induces an alert. If the violationpersists beyond a specified period, the monitor emits an event.Events from the entire service infrastructure are accumulated
in an enterprise console that uses rule-, case- or knowledge-based engines to analyze the monitoring events and decidewhether to open an incident ticket in the ticketing system.The incident tickets created from the monitoring events arecalled monitoring tickets. Additional tickets are created uponcustomer request. The information accumulated in the ticketis used by technical support for problem determination andresolution. In this paper, we consider tickets generated by aservice management system (see Figure 1).
Fig. 1: Service Management System
Each event is stored as a database record that consists ofseveral related attributes with values describing the systemstatus at the time this event was generated. For example,a CPU-related event usually contains the CPU utilizationand paging utilization information. A capacity-related eventusually contains the disk name and the size of disk used/freespace. Typically, different types of events have different setsof related attributes. The problem resolution of every ticket isstored as a textual description of the steps taken by the systemadministrator to resolve this problem.
B. Repeated Resolutions of Monitoring Tickets
We analyzed ticket data from three different accountsmanaged by IBM Global Services. Many ticket resolutionsrepeatedly appear in the ticket database. For example, fora low disk capacity ticket, usual resolutions are deletion oftemporal files, backup data, or addition of a new disk. Unusualresolutions are very rare.
TABLE I: Data Summary
Data set Num. of Tickets Time Frameaccount1 31,447 1 monthaccount2 37,482 4 monthsaccount2 29,057 5 months
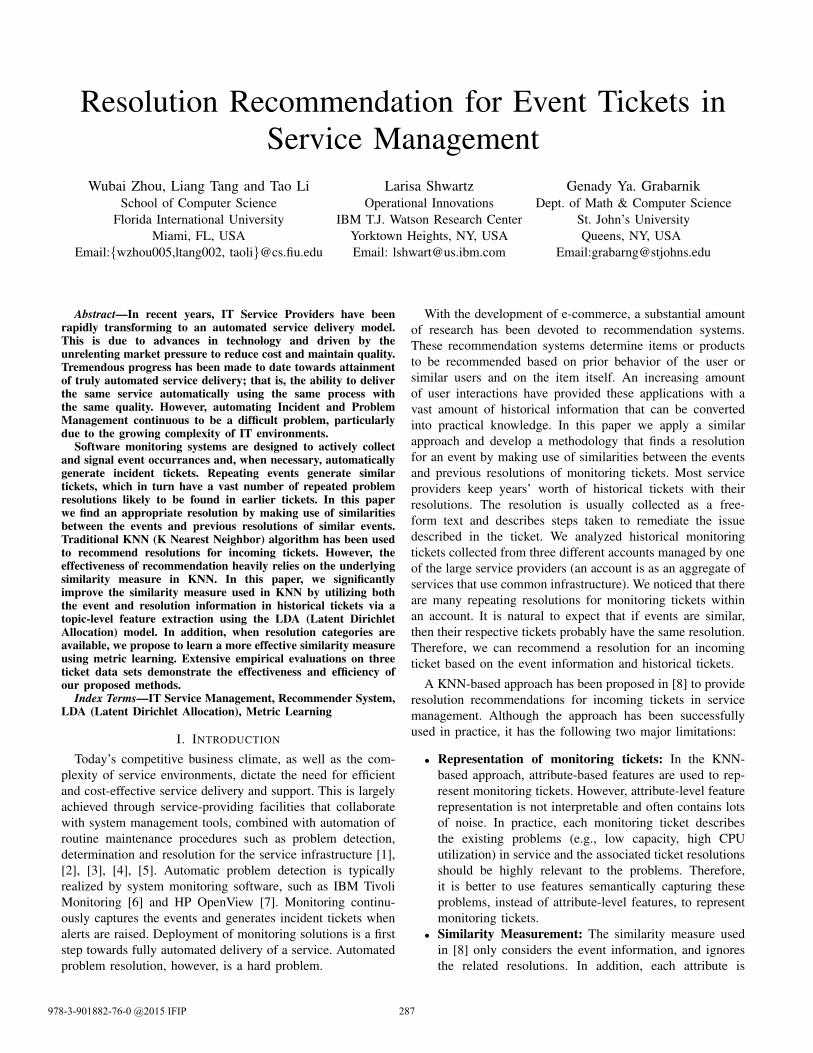
The collected ticket sets from the three accounts are denotedby “account1”, “account2” and “account3”, respectively. TableI summarizes the three data sets. Figure 2 shows the numbers
2015 IFIP/IEEE International Symposium on Integrated Network Management (IM2015)288
account1 account2 account30
5000
10000
15000
20000
25000
30000
35000
40000
#ticket #resolution
Fig. 2: Numbers of Tickets and Distinct Resolutions
0 20 40 60 80 100 120 140resolution ID
0
50
100
150
200
250
300
350
number of events
#event tickets solved by each resolutions
Fig. 3: number of monitoring tickets resolved by each resolu-tions denoted by “resolution ID” in account1
of tickets and distinct resolutions and Figure 3 shows thetop repeated resolutions in “account1” denoted by “resolutionID”. We observe that a single resolution can resolve multiplemonitoring tickets. In other words, multiple tickets share thesame resolutions.
III. RESOLUTION RECOMMENDATION
In this section, we first introduce the basic KNN-basedrecommendation algorithm, and then present our improvedalgorithms.
A. Workflow
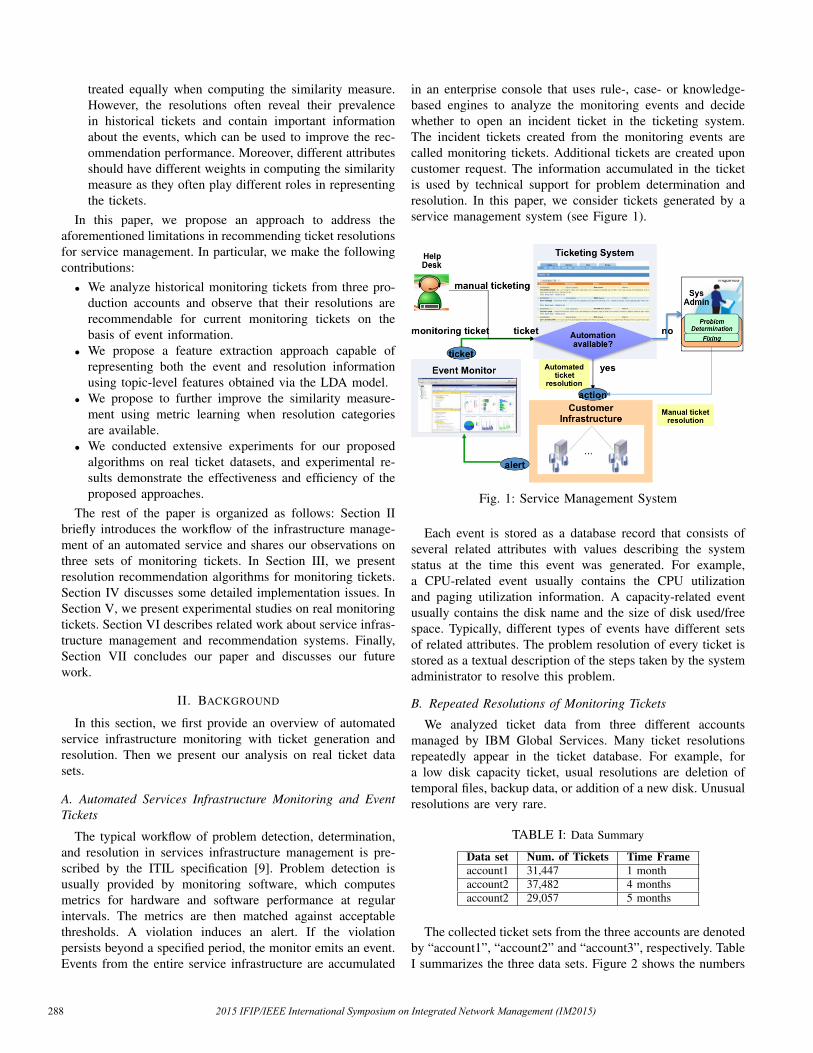
Figure 4 shows the workflow of resolution recommendation.Four different algorithms are included in the workflow:• KNN: the algorithm using attribute-level features• LDABaselineKNN: the algorithm using topic-level fea-
tures obtained via LDA• CombinedLDAKNN: the algorithm incorporating both
the event and resolution information with top-level fea-tures
• MLCombinedLDAKNN: the algorithm using the sim-ilarity measure obtained using metric learning (whenresolution categories are available)
The first algorithm was used in [8] and the last three algorithmsare proposed in this paper. Figure 4 clearly illustrates thedifferences among these four recommendation methods. Thedetails of the three proposed algorithms will be described
in detail in Section III-C, Section III-D, and Section III-E,respectively.
Fig. 4: Algorithms’ workflow
B. Basic KNN-based Recommendation
Given an incoming monitoring ticket, the objective of theresolution recommendation is to find k resolutions as closeas possible to the true one for some user-specified parameterk. The recommendation problem is often related to that ofpredicting the top k possible resolutions. A straightforwardapproach is to apply the KNN algorithm, which searches theK nearest neighbors of the given ticket (K is a predefinedparameter), and recommends the top k ≤ K representativeresolutions among them [10], [11]. The nearest neighbors areindicated by similarities of the associated events of the tickets.In this paper, the representativeness is measured by the numberof occurrences in the K neighbors.
TABLE II: Notations
Notation DescriptionD Set of historical tickets| · | Size of a setti i-th monitoring ticketr(ti) Resolution description of tie(ti) The associated event of ticket tiA(e) Set of attributes of event esim(e1, e2) Similarity of events e1 and e2sima(e1, e2) Similarity of a values of event e1 and e2K Number of nearest neighbors in the KNN algorithmk Number of recommended resolutions for a ticket, k ≤
K
Table II lists the notations used in this paper. Let D ={t1, ..., tn} be the set of historical monitoring tickets and ti
2015 IFIP/IEEE International Symposium on Integrated Network Management (IM2015) 289
be the i-th ticket in D, i = 1, ..., n. Given a monitoring tickett, the nearest neighbor of t is the ticket ti which maximizessim(e(t), e(ti)), ti ∈ D, where sim(·, ·) is a similarityfunction for events. Each event consists of event attributeswith values. Let A(e) denote the set of attributes of event e.The similarity for events is computed as the summation of thesimilarities for all attributes. There are three types of eventattributes: categorical, numeric and textual (shown by TableIII). Given an attribute a and two events e1 and e2, a ∈ A(e1)
TABLE III: Event Attribute Types
Type ExampleCategorical OSTYPE, NODE, ALERTKEY,...Numeric SERVERITY, LASTUPDATE, ...Textual SUMMARY,...
and a ∈ A(e2), the values of a in e1 and e2 are denoted bya(e1) and a(e2). The similarity of e1 and e2 with respect toa is
sima(e1, e2) =
I[a(e1) = a(e2)], if a is categorical,|a(e1)−a(e2)|
max|a(ei)−a(ej)| , if a is numeric,Jaccard(a(e1), a(e2)), if a is textual,
where I(·) is the indicator function returning 1 if the inputcondition holds, and 0 otherwise. Let max|a(ei) − a(ej)| bethe size of the value range of a. Jaccard(·, ·) is the Jaccardindex for bag of words model [12], frequently used to computethe similarity of two texts. Its value is the proportion ofcommon words in the two texts. Note that for any type ofattribute, inequality 0 ≤ sima(e1, e2) ≤ 1 holds. Then, thesimilarity for two events e1 and e2 is computed as
sim(e1, e2) =
∑a∈A(e1)∩A(e2)
sima(e1, e2)
|A(e1) ∪A(e2)|. (1)
Clearly, 0 ≤ sim(e1, e2) ≤ 1. To identify the type of attributea, we only need to scan all appearing values of a. If all valuesare composed of digits and a dot, a is numeric. If some valueof a contains a sentence or phrase, then a is textual. Otherwise,a is categorical.
C. Representation of Monitoring Tickets
As shown in Section III-B, attribute level features are usedin the traditional KNN algorithm for recommendation. How-ever, attribute-level feature representation is not interpretableand often contains a lot of noise.
Our observation indicates that each monitoring ticket de-scribes the existing problems (e.g., low capacity, high CPU,utilization) in service, and the associated ticket resolutionshould be highly relevant to the problems. For example,Table IV presents some sample monitoring tickets for “lowfree space” and their corresponding resolutions. The problemsin these tickets are described by the “SUMMARY” attributeand they all share the similar semantic meaning “low freespace”. Therefore, it is better to use features semanticallycapturing these problems, instead of attribute-level features,to represent monitoring tickets.
In this paper, we propose to apply Latent Dirichlet Alloca-tion [13](LDA) to perform feature extraction, which can firstextract hidden topics and then encode monitoring tickets usingtopic level features.
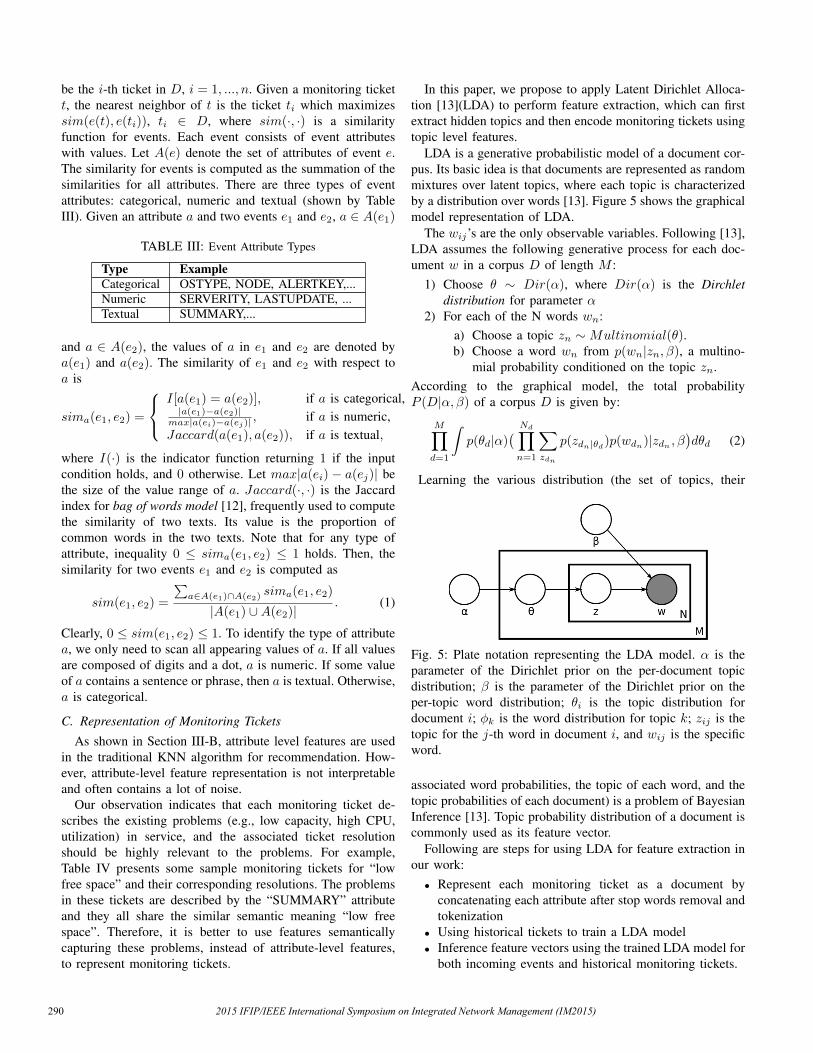
LDA is a generative probabilistic model of a document cor-pus. Its basic idea is that documents are represented as randommixtures over latent topics, where each topic is characterizedby a distribution over words [13]. Figure 5 shows the graphicalmodel representation of LDA.
The wij’s are the only observable variables. Following [13],LDA assumes the following generative process for each doc-ument w in a corpus D of length M :
1) Choose θ ∼ Dir(α), where Dir(α) is the Dirchletdistribution for parameter α
2) For each of the N words wn:a) Choose a topic zn ∼Multinomial(θ).b) Choose a word wn from p(wn|zn, β), a multino-
mial probability conditioned on the topic zn.According to the graphical model, the total probabilityP (D|α, β) of a corpus D is given by:
M∏d=1
∫p(θd|α)
( Nd∏n=1
∑zdn
p(zdn|θd)p(wdn)|zdn , β)dθd (2)
Learning the various distribution (the set of topics, their
Fig. 5: Plate notation representing the LDA model. α is theparameter of the Dirichlet prior on the per-document topicdistribution; β is the parameter of the Dirichlet prior on theper-topic word distribution; θi is the topic distribution fordocument i; φk is the word distribution for topic k; zij is thetopic for the j-th word in document i, and wij is the specificword.
associated word probabilities, the topic of each word, and thetopic probabilities of each document) is a problem of BayesianInference [13]. Topic probability distribution of a document iscommonly used as its feature vector.
Following are steps for using LDA for feature extraction inour work:• Represent each monitoring ticket as a document by
concatenating each attribute after stop words removal andtokenization
• Using historical tickets to train a LDA model• Inference feature vectors using the trained LDA model for
both incoming events and historical monitoring tickets.
2015 IFIP/IEEE International Symposium on Integrated Network Management (IM2015)290
After those steps, monitoring tickets can be encoded as featurevectors and the cosine similarity can then be applied to mea-sure their similarities. Experiments in Section V demonstratethat the algorithm performance based on topic level featuresis better than that on attribute level features.
D. Incorporating the Resolution Information
In previous KNN-based recommendation approaches, reso-lutions are ranked according to the similarity measurementusing the event information only. However, the resolutionsoften reveal their prevalence in historical tickets and containimportant information about the events, which can be usedto improve the recommendation performance. There are twopractical motivations for incorporating the resolution informa-tion:
1) In a K nearest neighbor search, historical tickets withresolutions that are highly relevant to an incoming eventshould be ranked higher than those tickets having similarevent descriptions, but with less related resolutions.
2) In a K nearest neighbor search, those tickets withresolutions that are more prevalent should be rankedhigher than those with less prevalent resolution, evenif their event descriptions are similar.
Table IV presents four tickets having similar event descrip-tions (shown in the “SUMMARY” attribute) from account1.All four tickets are describing a “low free space” problem. Inpractice, however, the resolution from Ticket 1 should have ahigher rank than the one from Ticket 4 since the resolutionfrom Ticket 1 is more informative. Similarly, resolutions fromTicket 1 and Ticket 2 should have higher ranks than the onefrom Ticket 3 because of their higher prevalence.
TABLE IV: Tickets for explaining motivation of incorporatingresolution information
ticketID SUMMARY RESOLUTION1 The logical disk has a low
amount of free space. Percentavailable: 2 Threshold: 5
After deleting old uninstallfiles, the logical disk has nowover 10% of free disk space.
2 The percentage of used spacein the logic disk is 90 percent.Threshold: 90 percent
After deleting old uninstallfiles, the logical disk has nowover 15% of free disk space.
3 File system is low. The per-centage of available space inthe file system is 10 percent.Threshold: 90 percent
After delprof run, the servernow has more than 4gb of freespace
4 The logical disk has a lowamount of free space. Percentavailable: 3 Threshold: 5
No trouble was found, situa-tion no longer persists.
In Section III-B, sim(e, e(ti)) is computed to find the Knearest neighbors of an incoming event e, in which e(ti)is the event information associated with the i-th ticket. Toincorporate the resolution information, sim(e, ti) (i.e., simi-larity between an incoming event and the i-th ticket), ratherthan sim(e, e(ti)), is used in the algorithm. sim(e, ti) canbe easily computed since e and ti can be vectorized with thesame dimensions after using topic-level features. Experimentsin Section V demonstrate the effectiveness of this proposedapproach.
E. Metric Learning
In previous sections, we improve the recommendation algo-rithm by using topic-level features and incorporating resolutioninformation into a K nearest neighbor search. However, westill treat each feature equally in computing the similaritymeasure. According to our observation, topics extracted fromthe LDA model should have different contributions to thesimilarity measurement since some topics contain the majordescriptive words about events while the others may consist ofless meaningful words. For example, Table V lists two topicsfor illustration. Apparently Topic 30 contains more descriptivewords than Topic 14 and thus we should assign a larger weightto Topic 30 in the similarity measurement. We adopt metriclearning [14] to achieve this goal.
TABLE V: First 6 words are extracted to represent topics trainedfrom LDA
topicID SUMMARY14 server wsfpp1 lppza0 lppzi0 nalac application30 server hung condition responding application apps
The metric learning problem aims at learning a distancefunction tuned to a particular task, and has been shown tobe useful when used in conjunction with nearest-neighbormethods and other techniques that rely on distances or similar-ities [15]. Mahalanobis Distance is commonly used for vector-ized inputs, which can avoid the scenario in which one featuredominates in the computation of the Euclidean distance. In themetric learning literature, the term “Mahalanobis distance” isoften used to denote any distance function of the followingform:
dA(x, y) = (x− y)TA(x− y), (3)
where A is some positive semi-definite (PSD) matrix, and x, yare the feature vectors. To facilitate the learning process, inmetric learning, a slightly modified form of distance functionis commonly used, as described below [14]:
dA(x, y) = xTAy. (4)
In our work, we have n historical tickets t1, t2, . . . , tnand n corresponding resolutions r(t1), r(t2), . . . , r(tn). Weconsider the resolution categories as supervision for metriclearning since intuitively similar resolutions solve similarissues. We pre-calculate matrix R ∈ Rn∗n in which Ri,j =sim(r(ti), r(tj)). Our goal is to learn a similarity functionSA(~ti, ~tj) by solving following an optimization problem:
f(A) = min
n∑i=1
n∑j=1
||Ri,j − SA(~ti, ~tj)||2
= min||R− SAST ||2, (5)
in which we use SA(~ti, ~tj) = ~tiT ∗ A ∗ ~tj (~ti and ~tj are
feature vector for ticket ti and tj) instead of SA( ~e(ti), ~e(tj))as we want to keep benefits of incorporating the resolutioninformation into K nearest search. Since matrix A is con-strained to be a PSD matrix, the projected gradient descent
2015 IFIP/IEEE International Symposium on Integrated Network Management (IM2015) 291
algorithm can be directly applied to solve the optimizationproblem in Equation 5. In each iteration of gradient descent,the new updated matrix A will be projected into a PSD matrixas the initial value for the next iteration. The singular valuethresholding [16] has been applied to project A into a PSDmatrix by setting all A’s negative eigenvalues to be zero.
The following is the gradient for Equation 5:
∂f(A)
∂A=
∂((R− SAST )T (R− SAST ))∂A
= 2STSASTS − 2STAS (6)
The resolution categories are usually provided by systemadministrators. With the available category information, thesimilarity between two resolutions is computed as follows:
sim(r(ti), r(tj)) =
{1, if r(ti), r(tj) are in same category,0, otherwise.
IV. IMPLEMENTATION
In this section, we discuss several issues in implementingthe resolution recommendation system.
A. Redundancy Removal in Recommendation
KNN-based recommendation algorithms recommend the topk representative resolutions in the K nearest tickets. However,since all of these are similar to the incoming ticket, theresolutions of the K tickets may also be similar to each other,so that there may be some redundancy in the recommendedresults. To avoid this, another validation step is applied. First,the K nearest tickets’ resolutions are sorted according totheir representativeness in descending order. Then, we gothrough all K resolutions and check whether or not eachof them is redundant to any previously selected resolution.If it is, we skip this resolution and jump to the next one;otherwise, we add it to the selection. Since the resolutionsare textual descriptions, the redundancy of two resolutions ismeasured by the Jaccard index, Jaccard(·, ·), introduced inSection III-B. In practice, if the descriptions of two resolutionsr(t1) and r(t2) have more than one half common words (i.e.Jaccard(r(t1), r(t2)) > 0.5), the two resolutions are quitelikely to be the same.
B. Finding Nearest Neighbors
Finding the K nearest neighbors in a large collection ofhistorical tickets is time-consuming. There are many standardindexing search methods, such as k-d Tree [17], R-Tree[18], VP-Tree [19], cover tree [20]. But the search space ofour monitoring tickets is not metric and the dimensionalityis high. Therefore, locality sensitive hashing [21] is morepractical. Another heuristic solution is the attribute clusteringbased method. Different system events have different systemattributes, and the clustering algorithm can easily separateall tickets into categories based on their attribute names. Iftwo events share very few common attributes, their similaritycannot be high. Therefore, in most cases, the nearest neighborssearch only needs to access these tickets in the same category.
V. EVALUATION
A. ImplementationWe implemented four algorithms: Weighted KNN [22]
using attribute level feature, the Weighted KNN method usingtopic level feature, the method incorporating historical resolu-tions information and the method using improved similaritymetric after applying metric learning, which are denotedby “WKNN”, “LDABaselineKNN”, “CombinedLDAKNN”and “MLCombinedLDAKNN” respectively. Those algorithms,“WKNN”, “LDABaselineKNN”, “CombinedLDAKNN” and“MLCombinedLDAKNN”, are all based on the weightedKNN algorithm framework. We still show experimental re-sults between “WKNN” and “LDABaselineKNN” since theyprove that topic level features do not cause information losscompared to attribute level features. The “LDABaselineKNN”algorithm is the baseline for “CombinedLDAKNN”, whichitself is the baseline for “MLCombinedLDAKNN”. We use theWeighted KNN algorithm as the underlying algorithm becauseit is the most widely used Top-N item-based recommendationalgorithm.
B. Experimental DataExperimental monitoring tickets are collected from three
accounts managed by IBM Global Services, denoted later “ac-count1”, “account2” and “account3”. The monitoring eventsare captured by IBM Tivoli Monitoring [23]. The ticketsets are summarized in Table I. To evaluate metric learning,1000 labeled tickets with resolution categories are obtainedfrom “account1”. Table VI shows three sample categories ofresolutions [24].
TABLE VI: Three resolution types with the event description theyresolved
resolution class resolved event key wordsServer Unavailable Server unavailable due to unex-
pected shutdown, reboot, defecthardware, system hanging
Disk/FS Capacity shortage Disk or file system capacity prob-lems and disk failure
Performance inefficiency Performance and capacity prob-lems of CPU or memory
C. Evaluation MetricThe following evaluation measures are used in our experi-
ments.1) average similarity: In general, several resolutions can
be recommended for a single testing instance. To considerthe relativeness of all recommended resolutions, the averagesimilarity (avgSim) is used as one evaluation metric which isgiven by the following equation:
avgSim =1
N
N∑i=1
ni∑j=1
sim(rio, rj)/ni,
in which N is the number of testing instances, and ni is thenumber of recommended resolutions for testing instance i andrio is its original resolution, and rj is its jth recommendedresolution. Jaccard Similarity is used to calculate sim(rio, rj).
2015 IFIP/IEEE International Symposium on Integrated Network Management (IM2015)292
2) mean average precision: Mean Average Precision(MAP) [25] is widely used for recommendation evaluation. Itconsiders not only the relativeness of all recommended results,but also the ranks of the recommended results.
MAP@n =N∑i=1
ap@ni/N,
N is the number of a testing instance, ap@n is given by thefollowing equation:
ap@n =n∑k=1
p(k)δr(k),
where k is the rank in the sequence of retrieved resolutions,n is the number of retrieved resolutions, p(k) is the precisionat cut-off k in the list, and δr(k) is the change in recall fromitems k − 1 to k.
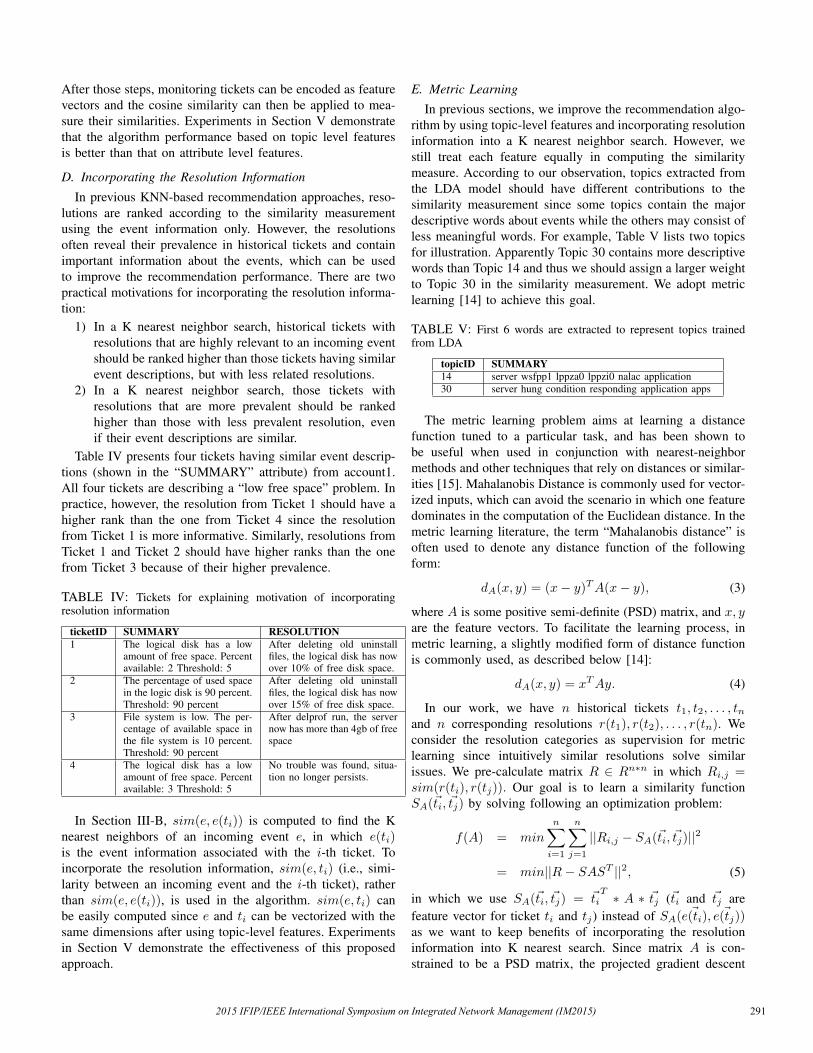
D. Choosing the Number of Topics
Figure 6 shows the experimental results of choosing theproper number of topics for training the LDA model usingdata set “account1”. The results show that numTopics = 300is a proper setup for the number of topics. Thus, we choosenumTopics = 300 for all the following experiments.
50 100 150 200 250 300 350numTopics
0.32
0.34
0.36
0.38
0.40
avgSim
WKNNLDABaselineKNNCombinedLDAKNN
Fig. 6: Accuracy varies for different numTopics for dataset“account1”
E. Overall Recommendation Performance
The average similarity is used for comparing the perfor-mance among “WKNN”, “LDABaselineKNN” and “Com-binedLDAKNN”. When resolution categories are available,MAP@n is used for comparing the performance between“CombinedLDAKNN” and “MLCombinedLDAKNN” sinceit explicitly considers the relativeness of the recommendedresults.
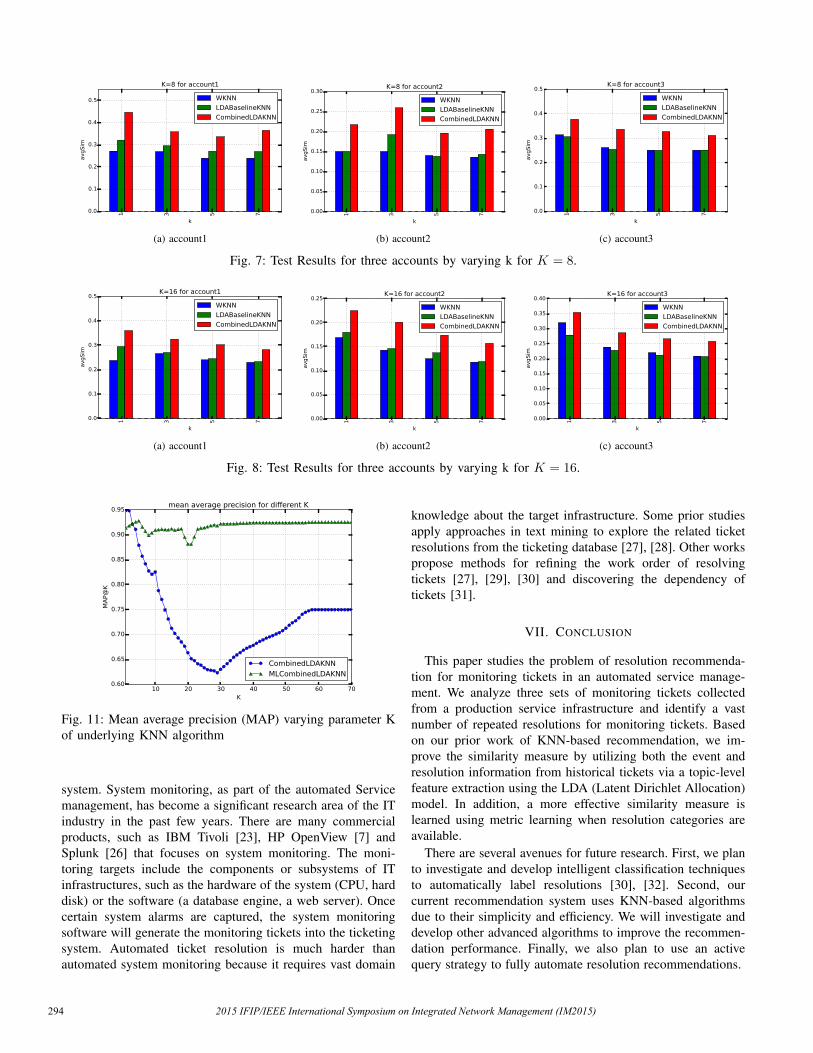
To compare the results of each algorithm, we vary thenumber of recommended resolutions, k. Figures 7, and 8show the average similarity scores by setting k = 1, 3, 5, 7separately, with K = 8 and K = 16. As shown by Figure7 and Figure 8, topic level features are better than attributelevel features for account1 and account2 and slightly worse
for account3 by comparing algorithm “WKNN” and “LD-ABaselineKNN”. “CombinedLDAKNN” always outperforms“LDABaselineKNN”, which proves the effectiveness of incor-porating the resolution information into K nearest neighborsearch.
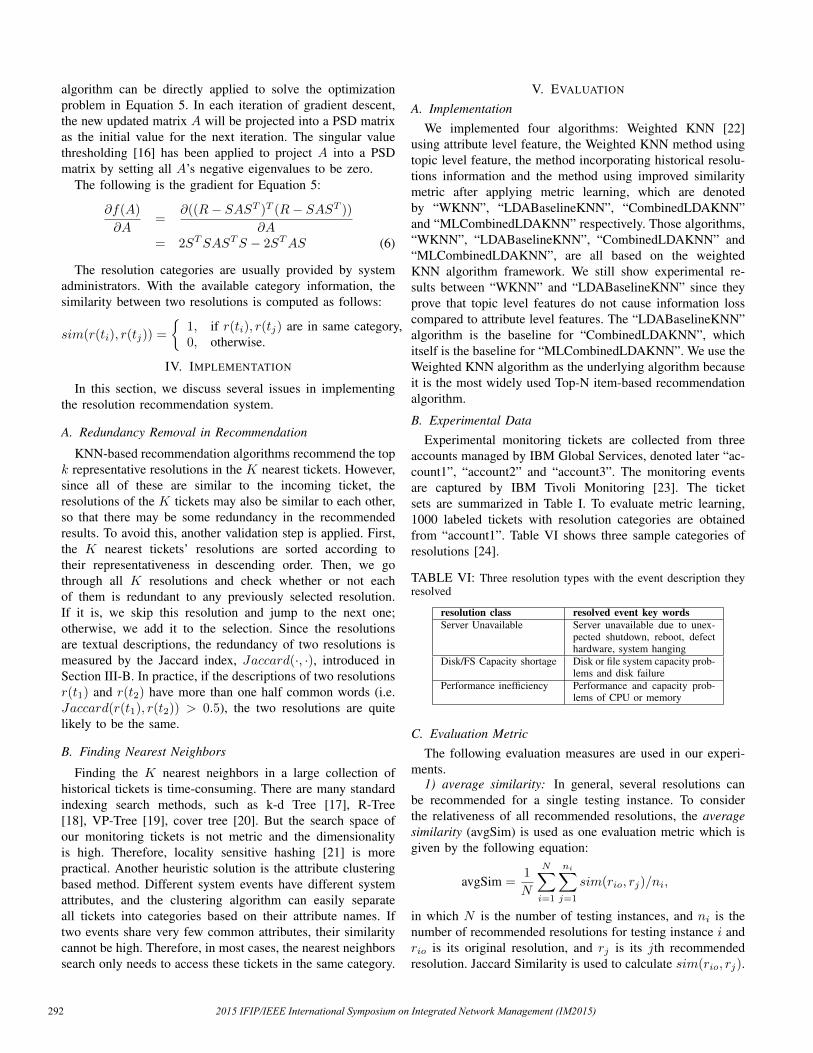
1) Metric Learning Performance: Figure 9, Figure 10 andFigure 11 are used to illustrate the usefulness of metriclearning. In these figures, X-axis and Y-axis are the event id’sordered by the resolution categories, and the color indicatesthe similarity score. As shown in Figure 9 and Figure 10,similarity scores between monitoring tickets with resolutionsfrom the same category will be enhanced while similarityscores between monitoring tickets with resolutions from dif-ferent categories will be reduced. Therefore, for example, for atesting instance whose original resolution belongs to categoryi, more resolutions from category i will be retrieved first afterapplying metric learning.
0
0.5
0
0.5
Fig. 9: similarity measure before and after metric learning fortraining set
0
0.5
0
0.5
Fig. 10: Similarity measure before and after metric learningfor testing set
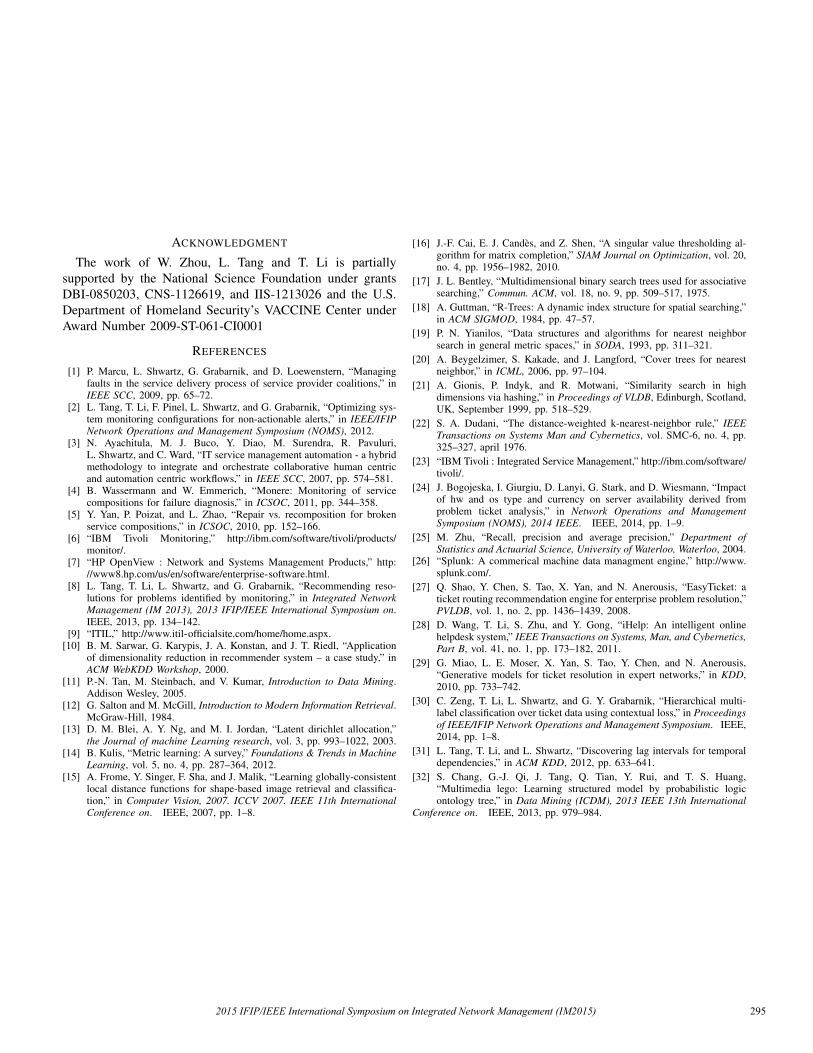
Figure 11 uses MAP to evaluate the performance of “Com-binedLDAKNN” and “MLCombinedLDAKNN”. As shown inFigure 11, overall MAP scores of “MLCombinedLDAKNN”are higher and more stable than “CombinedLDAKNN” whenK increases. It indicates that “MLCombinedLDAKNN” canretrieve more related resolutions first and thus is more robust tonoisy resolutions compared to “CombinedLDAKNN”, whichproves the effectiveness of metric learning.
VI. RELATED WORK
This section reviews prior research studies related to theautomated IT service management and the recommendation
2015 IFIP/IEEE International Symposium on Integrated Network Management (IM2015) 293
1 3 5 7
k
0.0
0.1
0.2
0.3
0.4
0.5
avgSim
K=8 for account1
WKNN
LDABaselineKNN
CombinedLDAKNN
(a) account1
1 3 5 7
k
0.00
0.05
0.10
0.15
0.20
0.25
0.30
avgSim
K=8 for account2
WKNN
LDABaselineKNN
CombinedLDAKNN
(b) account2
1 3 5 7
k
0.0
0.1
0.2
0.3
0.4
0.5
avgSim
K=8 for account3
WKNN
LDABaselineKNN
CombinedLDAKNN
(c) account3
Fig. 7: Test Results for three accounts by varying k for K = 8.
1 3 5 7
k
0.0
0.1
0.2
0.3
0.4
0.5
avgSim
K=16 for account1
WKNN
LDABaselineKNN
CombinedLDAKNN
(a) account1
1 3 5 7
k
0.00
0.05
0.10
0.15
0.20
0.25avgSim
K=16 for account2
WKNN
LDABaselineKNN
CombinedLDAKNN
(b) account2
1 3 5 7
k
0.00
0.05
0.10
0.15
0.20
0.25
0.30
0.35
0.40
avgSim
K=16 for account3
WKNN
LDABaselineKNN
CombinedLDAKNN
(c) account3
Fig. 8: Test Results for three accounts by varying k for K = 16.
10 20 30 40 50 60 70K
0.60
0.65
0.70
0.75
0.80
0.85
0.90
0.95
MAP@K
mean average precision for different K
CombinedLDAKNNMLCombinedLDAKNN
Fig. 11: Mean average precision (MAP) varying parameter Kof underlying KNN algorithm
system. System monitoring, as part of the automated Servicemanagement, has become a significant research area of the ITindustry in the past few years. There are many commercialproducts, such as IBM Tivoli [23], HP OpenView [7] andSplunk [26] that focuses on system monitoring. The moni-toring targets include the components or subsystems of ITinfrastructures, such as the hardware of the system (CPU, harddisk) or the software (a database engine, a web server). Oncecertain system alarms are captured, the system monitoringsoftware will generate the monitoring tickets into the ticketingsystem. Automated ticket resolution is much harder thanautomated system monitoring because it requires vast domain
knowledge about the target infrastructure. Some prior studiesapply approaches in text mining to explore the related ticketresolutions from the ticketing database [27], [28]. Other workspropose methods for refining the work order of resolvingtickets [27], [29], [30] and discovering the dependency oftickets [31].
VII. CONCLUSION
This paper studies the problem of resolution recommenda-tion for monitoring tickets in an automated service manage-ment. We analyze three sets of monitoring tickets collectedfrom a production service infrastructure and identify a vastnumber of repeated resolutions for monitoring tickets. Basedon our prior work of KNN-based recommendation, we im-prove the similarity measure by utilizing both the event andresolution information from historical tickets via a topic-levelfeature extraction using the LDA (Latent Dirichlet Allocation)model. In addition, a more effective similarity measure islearned using metric learning when resolution categories areavailable.
There are several avenues for future research. First, we planto investigate and develop intelligent classification techniquesto automatically label resolutions [30], [32]. Second, ourcurrent recommendation system uses KNN-based algorithmsdue to their simplicity and efficiency. We will investigate anddevelop other advanced algorithms to improve the recommen-dation performance. Finally, we also plan to use an activequery strategy to fully automate resolution recommendations.
2015 IFIP/IEEE International Symposium on Integrated Network Management (IM2015)294
ACKNOWLEDGMENT
The work of W. Zhou, L. Tang and T. Li is partiallysupported by the National Science Foundation under grantsDBI-0850203, CNS-1126619, and IIS-1213026 and the U.S.Department of Homeland Security’s VACCINE Center underAward Number 2009-ST-061-CI0001
REFERENCES
[1] P. Marcu, L. Shwartz, G. Grabarnik, and D. Loewenstern, “Managingfaults in the service delivery process of service provider coalitions,” inIEEE SCC, 2009, pp. 65–72.
[2] L. Tang, T. Li, F. Pinel, L. Shwartz, and G. Grabarnik, “Optimizing sys-tem monitoring configurations for non-actionable alerts,” in IEEE/IFIPNetwork Operations and Management Symposium (NOMS), 2012.
[3] N. Ayachitula, M. J. Buco, Y. Diao, M. Surendra, R. Pavuluri,L. Shwartz, and C. Ward, “IT service management automation - a hybridmethodology to integrate and orchestrate collaborative human centricand automation centric workflows,” in IEEE SCC, 2007, pp. 574–581.
[4] B. Wassermann and W. Emmerich, “Monere: Monitoring of servicecompositions for failure diagnosis,” in ICSOC, 2011, pp. 344–358.
[5] Y. Yan, P. Poizat, and L. Zhao, “Repair vs. recomposition for brokenservice compositions,” in ICSOC, 2010, pp. 152–166.
[6] “IBM Tivoli Monitoring,” http://ibm.com/software/tivoli/products/monitor/.
[7] “HP OpenView : Network and Systems Management Products,” http://www8.hp.com/us/en/software/enterprise-software.html.
[8] L. Tang, T. Li, L. Shwartz, and G. Grabarnik, “Recommending reso-lutions for problems identified by monitoring,” in Integrated NetworkManagement (IM 2013), 2013 IFIP/IEEE International Symposium on.IEEE, 2013, pp. 134–142.
[9] “ITIL,” http://www.itil-officialsite.com/home/home.aspx.[10] B. M. Sarwar, G. Karypis, J. A. Konstan, and J. T. Riedl, “Application
of dimensionality reduction in recommender system – a case study,” inACM WebKDD Workshop, 2000.
[11] P.-N. Tan, M. Steinbach, and V. Kumar, Introduction to Data Mining.Addison Wesley, 2005.
[12] G. Salton and M. McGill, Introduction to Modern Information Retrieval.McGraw-Hill, 1984.
[13] D. M. Blei, A. Y. Ng, and M. I. Jordan, “Latent dirichlet allocation,”the Journal of machine Learning research, vol. 3, pp. 993–1022, 2003.
[14] B. Kulis, “Metric learning: A survey,” Foundations & Trends in MachineLearning, vol. 5, no. 4, pp. 287–364, 2012.
[15] A. Frome, Y. Singer, F. Sha, and J. Malik, “Learning globally-consistentlocal distance functions for shape-based image retrieval and classifica-tion,” in Computer Vision, 2007. ICCV 2007. IEEE 11th InternationalConference on. IEEE, 2007, pp. 1–8.
[16] J.-F. Cai, E. J. Candes, and Z. Shen, “A singular value thresholding al-gorithm for matrix completion,” SIAM Journal on Optimization, vol. 20,no. 4, pp. 1956–1982, 2010.
[17] J. L. Bentley, “Multidimensional binary search trees used for associativesearching,” Commun. ACM, vol. 18, no. 9, pp. 509–517, 1975.
[18] A. Guttman, “R-Trees: A dynamic index structure for spatial searching,”in ACM SIGMOD, 1984, pp. 47–57.
[19] P. N. Yianilos, “Data structures and algorithms for nearest neighborsearch in general metric spaces,” in SODA, 1993, pp. 311–321.
[20] A. Beygelzimer, S. Kakade, and J. Langford, “Cover trees for nearestneighbor,” in ICML, 2006, pp. 97–104.
[21] A. Gionis, P. Indyk, and R. Motwani, “Similarity search in highdimensions via hashing,” in Proceedings of VLDB, Edinburgh, Scotland,UK, September 1999, pp. 518–529.
[22] S. A. Dudani, “The distance-weighted k-nearest-neighbor rule,” IEEETransactions on Systems Man and Cybernetics, vol. SMC-6, no. 4, pp.325–327, april 1976.
[23] “IBM Tivoli : Integrated Service Management,” http://ibm.com/software/tivoli/.
[24] J. Bogojeska, I. Giurgiu, D. Lanyi, G. Stark, and D. Wiesmann, “Impactof hw and os type and currency on server availability derived fromproblem ticket analysis,” in Network Operations and ManagementSymposium (NOMS), 2014 IEEE. IEEE, 2014, pp. 1–9.
[25] M. Zhu, “Recall, precision and average precision,” Department ofStatistics and Actuarial Science, University of Waterloo, Waterloo, 2004.
[26] “Splunk: A commerical machine data managment engine,” http://www.splunk.com/.
[27] Q. Shao, Y. Chen, S. Tao, X. Yan, and N. Anerousis, “EasyTicket: aticket routing recommendation engine for enterprise problem resolution,”PVLDB, vol. 1, no. 2, pp. 1436–1439, 2008.
[28] D. Wang, T. Li, S. Zhu, and Y. Gong, “iHelp: An intelligent onlinehelpdesk system,” IEEE Transactions on Systems, Man, and Cybernetics,Part B, vol. 41, no. 1, pp. 173–182, 2011.
[29] G. Miao, L. E. Moser, X. Yan, S. Tao, Y. Chen, and N. Anerousis,“Generative models for ticket resolution in expert networks,” in KDD,2010, pp. 733–742.
[30] C. Zeng, T. Li, L. Shwartz, and G. Y. Grabarnik, “Hierarchical multi-label classification over ticket data using contextual loss,” in Proceedingsof IEEE/IFIP Network Operations and Management Symposium. IEEE,2014, pp. 1–8.
[31] L. Tang, T. Li, and L. Shwartz, “Discovering lag intervals for temporaldependencies,” in ACM KDD, 2012, pp. 633–641.
[32] S. Chang, G.-J. Qi, J. Tang, Q. Tian, Y. Rui, and T. S. Huang,“Multimedia lego: Learning structured model by probabilistic logicontology tree,” in Data Mining (ICDM), 2013 IEEE 13th International
Conference on. IEEE, 2013, pp. 979–984.
2015 IFIP/IEEE International Symposium on Integrated Network Management (IM2015) 295


![CALIFORNIA LAW REVISION · PDF file2003] 689 STATE OF CALIFORNIA CALIFORNIA LAW REVISION COMMISSION RECOMMENDATION Alternative Dispute Resolution](https://img.pdfslide.us/doc/110x75/5a7884637f8b9ab8768c2a61/california-law-revision-689-state-of-california-california-law-revision-commission.jpg)