Embed Size (px)
Citation preview
1
Supporting Information
Air Flow-Driven Triboelectric Nanogenerators for Self-Powered Real-Time Respiratory
Monitoring
Meng Wang,a Jiahao Zhang,
a Yingjie Tang,
a Jun Li,
b Baosen Zhang,
a Erjun Liang,
a
Yanchao Mao,a,*
Xudong Wangb,*
aMOE Key Laboratory of Materials Physics, School of Physics and Engineering, Zhengzhou
University, Zhengzhou 450001, China
* E-mail: [email protected] bDepartment of Materials Science and Engineering, University of Wisconsin-Madison, Madison,
WI 53706, USA
* Email: [email protected]
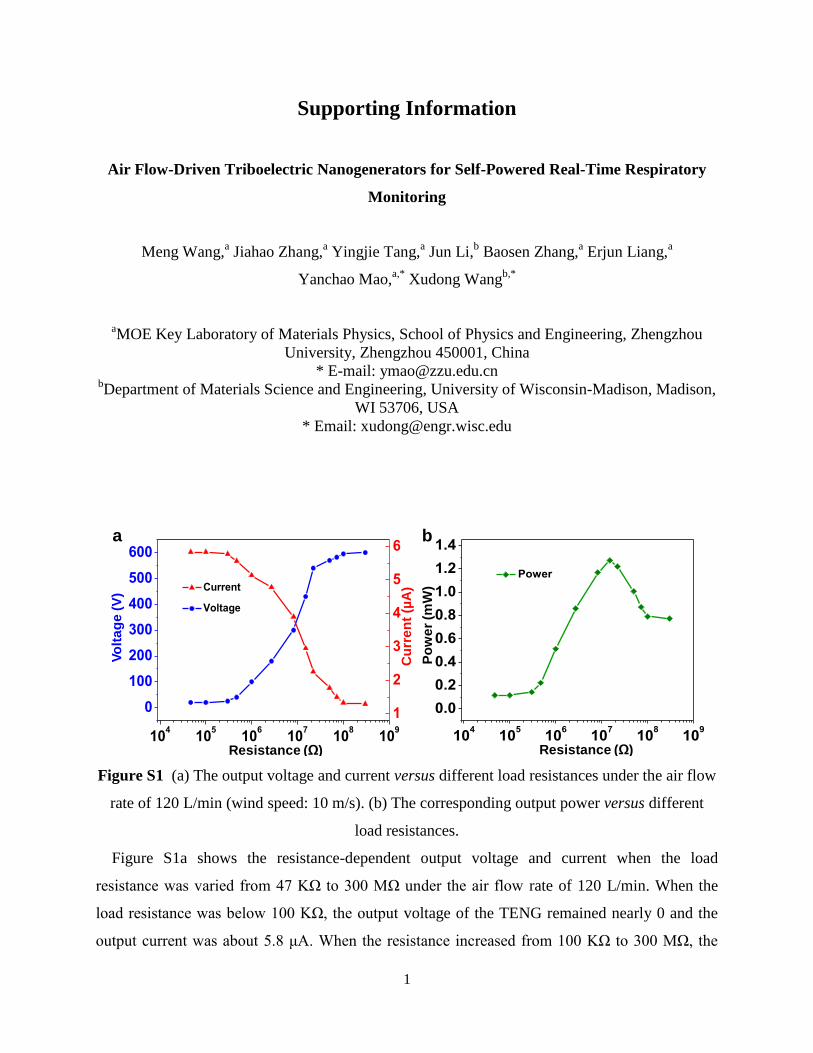
Figure S1 (a) The output voltage and current versus different load resistances under the air flow
rate of 120 L/min (wind speed: 10 m/s). (b) The corresponding output power versus different
load resistances.
Figure S1a shows the resistance-dependent output voltage and current when the load
resistance was varied from 47 KΩ to 300 MΩ under the air flow rate of 120 L/min. When the
load resistance was below 100 KΩ, the output voltage of the TENG remained nearly 0 and the
output current was about 5.8 μA. When the resistance increased from 100 KΩ to 300 MΩ, the
104
105
106
107
108
109
0
100
200
300
400
500
600
Voltage
1
2
3
4
5
6
Current
Vo
lta
ge
(V
)
Cu
rre
nt
(µA
)
Po
we
r (m
W)
Resistance (Ω) Resistance (Ω)
a b
104
105
106
107
108
109
0.0
0.2
0.4
0.6
0.8
1.0
1.2
1.4
Power

2
output voltage increased to 600 V, while the output current decreased to 1.3 μA. Correspondingly,
the maximum output power was found to be 1.3 mW at the load resistance of 15.1 MΩ, as
illustrated in Figure S1b.
Figure S2 (a) The output voltage and (b) current signals recorded under different relative
humidity at the flow rate of 85 L/min. The corresponding average peak values were plotted as a
function of relative humidity as depicted by the blue curves.
The effect of the humidity on the TENG performance was also investigated. The output
voltage and current measured from the TENG under different relative humidity at the flow rate
of 85 L/min are shown in Figure S2a and b, respectively. When the relative humidity increased
from 50 to 90%, the average peak values of output voltage and current decreased from 1.5 to 0.4
V and 0.8 to 0.2 μA, respectively. These results demonstrated that the TENG was still able to
generate appropriate responses under highly humid conditions.
50%
60%
70%
80%
90%
0 5 10 15 20 25
-2
-1
0
1
2
3
50% 60% 70% 80% 90%
0 5 10 15 20 25-1.5
-1.0
-0.5
0.0
0.5
1.0
1.5
2.0 50%
60%
70%
80%
90%
50% 60% 70% 80% 90%
Vo
ltag
e(V
)
Cu
rren
t (μA
)
Time (s)
a b
Time (s)
Relative Humidity Relative Humidity

3
Figure S3 The rectified output voltage of the TENG under an air flow rate of 120 L/min.
A bridge circuit composed of four diodes was used to rectify the AC output into DC output.
Figure S3 depicts the output voltage of the TENG after rectification under an air flow rate of 120
L/min. The output voltage of the TENG was successfully rectified by the bridge circuit with
negligible decrease in the peak amplitude.
0 1 2 3 4 5
-1
0
1
2
3
4
Time (s)
Vo
ltag
e (
V)

4
Figure S4 (a) Schematic diagrams of the intelligent wireless respiratory monitoring and alert
system. (b) The circuits for signal processing and transmitting. (c) (i) The original respiratory
signal generated from the TENG, (ii) converted square signal by the relay, and (iii) switched
signal by the SCM. (d) The TENG based wireless respiratory monitoring and alert system for
providing alerts through an alarm. (e) When a person stopped breathing more than 5 s, the alarm
Micro-
controllersReceiverTransmitter
GSM
module
TENG
Voltage
comparator
Micro-
controllers
Alerting
Emergency
call
Breathing
Breathing
No breathing
No breathing
Wireless
transmitter
Wireless
receiver
Alerting
GSM transmitter
Emergency call
a
d e
f g
Voltage
comparator
-2
0
2
0
2
4
Vo
lta
ge
(V
)
Time (s)
No breathingBreathing Alertingc (i)
(iii)
(ii)
0 2 4 6 8 10 12 14 16 18 20
0
5
10
Relay
GSM
SCM
b
Transmitter

5
could be triggered to alert. (f) The TENG based wireless respiratory monitoring and alert system
for providing alerts through a cell phone. (g) When a person stopped breathing more than 5 s, the
cell phone could be dialed to give alerts.
An intelligent wireless respiratory monitoring and alert system was constructed based on the
air flow driven TENG, a signal processing circuit, a wireless transmitter, an alarm, and a cell
phone, as schematically shown in Figure S4a. Figure S4b exhibits four circuit boards used in the
signal processing circuit: a latching relay to convert the original electric signal into square signal
for triggering a single-chip microcomputer (SCM), a SCM to switch the signal (the detailed
circuit diagram is shown in Figure S5), a wireless transmitter to transmit the signal, and a
global system for mobile communications (GSM) module to dial. As shown in Figure S4c, from
top to bottom, the first signal is the original respiratory signal generated from the TENG (i),
followed by the square signal (ii), and the switched signal (iii), respectively. When the person is
breathing, the TENG could generate electric output signals and the converted square signals were
displayed in the oscilloscope, as shown in Figure S4d. When the person stopped breathing for
more than 5 s, the switched signal by the SCM could wirelessly trigger the alarm (Figure S4e and
Video S3). A cell phone can also be used to wirelessly provide alerts in this respiratory
monitoring and alert system. When the person stopped breathing more than 5 s, the cell phone
could be dialed for timely alerting (Figure S4f and g, and Video S4).

6
Figure S5 The detailed circuit diagram of the SCM.
Video S1 The air flow driven vibration behavior of the PTFE/Cu film captured using a high-
speed camera.
Video S2 4 commercial white LEDs were directly powered up under an air flow rate of 120
L/min.
Video S3 When a person stop breathing more than 5 s, an alarm could be wirelessly triggered
through the respiratory monitoring and alert system.
Video S4 When a person stop breathing more than 5 s, a cell phone could be dialed through the
respiratory monitoring and alert system.