Embed Size (px)
Citation preview
Cement and Concrete Research 35 (2005) 658–670
Resistance of geopolymer materials to acid attack
T. Bakharev*
Department of Civil Engineering, Monash University, Wellington Road, Clayton, Victoria 3168, Australia
Received 23 June 2003; accepted 3 June 2004
Abstract
This article presents an investigation into durability of geopolymer materials manufactured using a class F fly ash (FA) and alkaline
activators when exposed to 5% solutions of acetic and sulfuric acids. The main parameters studied were the evolution of weight, compressive
strength, products of degradation and microstructural changes. The degradation was studied using X-ray diffraction (XRD), Fourier transform
infrared spectroscopy (FTIR) and scanning electron microscopy (SEM). The performance of geopolymer materials when exposed to acid
solutions was superior to ordinary Portland cement (OPC) paste. However, significant degradation of strength was observed in some
geopolymer materials prepared with sodium silicate and with a mixture of sodium hydroxide and potassium hydroxide as activators. The
deterioration observed was connected to depolymerisation of the aluminosilicate polymers in acidic media and formation of zeolites, which in
some cases lead to a significant loss of strength. The best performance was observed in the geopolymer material prepared with sodium
hydroxide and cured at elevated temperature, which was attributed to a more stable cross-linked aluminosilicate polymer structure formed in
this material.
D 2004 Elsevier Ltd. All rights reserved.
Keywords: Fly Ash; Alkali-activated cement; Durability; Acid attack
1. Introduction
Acid resistance is a desirable property for structural
materials used in the aggressive environment of chemical,
mining, mineral processing and other industries. Basic in
nature, concretes made with Portland cement and alkali-
activated slag deteriorate in the acid environment [1,2]. In
the case of acid attack on ordinary Portland cement (OPC)
concrete, calcium salts of the attacking acid rapidly form and
the concrete loses its strength and deteriorates quickly. When
tested in acetic acid solution of pH 4 for 12 months, AAS
concrete had about 33% strength reduction as compared to
47% reduction in OPC. Thus, AAS was found superior in
durability to OPC. Its good performance was attributed to
low Ca content (f 40% CaO) compared to Portland cement
(f 65% CaO) and the glassy state of the slag, which is
poorly soluble in the acid solution [2]. Geopolymer materials
prepared with the class F fly ash (FA) contain very low
calcium (3–4% CaO) and it could be expected that they
possess high durability in the acid environment.
0008-8846/$ – see front matter D 2004 Elsevier Ltd. All rights reserved.
doi:10.1016/j.cemconres.2004.06.005
* Tel.: +61-3-9905-5549; fax: +61-3-9905-4944.
E-mail address: [email protected] (T. Bakharev).
Geopolymers are synthetic minerals belonging to the
same family of aluminosilicates as zeolites, but unlike
zeolites, they are essentially amorphous polymers. The
properties of these geopolymer materials prepared using
FA are not well studied but there are reports of superior
durability and heat-resistant properties of geopolymer mate-
rials prepared using metakaolin [3–5]. Geopolymer materi-
als are produced by a sol–gel process utilising alumina and
silica oxides activated by alkali hydroxides and/or alkali
silicates. The starting materials dissolve in high pH alkaline
solution and the geopolymers are precipitated; this process
being facilitated by heat. In the process of the polymerisa-
tion reactions, polysialates, polysialate siloxo, and polysia-
late disiloxo are formed [3]. The mineral polymers have
empirical formula: Mn[–(SiO2)z–AlO2]n�wH2O, where z is
1, 2 or 3; M is an alkali cation, such as potassium or sodium,
and n is the degree of polymerisation [4,5]. In a previous
article, the processing and characterisation of geopolymer
materials made using class F FA and formed at elevated
temperature were discussed [6]. This article presents a study
of durability in the acid environment of three geopolymer
materials utilising class F FA activated by sodium silicate,
sodium hydroxide and a mixture of sodium and potassium
hydroxides.

T. Bakharev / Cement and Concrete Research 35 (2005) 658–670 659
2. Experimental
2.1. Materials
The chemical and mineral compositions of FA are shown
in Table 1 and Fig. 1, respectively. FA used was sourced
from Gladstone in Queensland, Australia. It is mainly glassy
with some crystalline inclusions of mullite, hematite and
quartz. Laboratory grade sodium silicate solution type D
with Ms (ratio of silica to sodium oxide) equal to 2, and
14.7% Na2O and 29.4% SiO2 was supplied by PQ Australia,
while 60% w/v sodium hydroxide solution was supplied by
Sigma. Potassium hydroxide pellets were supplied by
Aldrich. Sodium hydroxide, potassium hydroxide, and so-
dium silicate solutions were used for FA activation.
2.2. Test procedures
FA was activated by sodium hydroxide, a mixture of
sodium and potassium hydroxides and sodium silicate
solutions, providing 8–9% Na in the mixtures and wa-
ter/binder (w/b) ratio of 0.3. The preparation process and
composition of the investigated materials were developed
in a previous article [6]. Concentration of alkalis and w/b
ratio in the materials was similar to corresponding numb-
ers of geopolymer materials studied in [7–9]. Table 2
shows the details of the samples and curing conditions.
The pastes were cast in plastic cylinders and sealed with
the lid. The mixtures were cured for 24 h at room
temperature, after which temperature was ramped to 95
jC and maintained at this level for 24 h. The materials
were then cooled down to room temperature in the oven
for 2 days, and initial compressive strengths was deter-
mined (8FAK, 56–58 MPa; 8FASS, 66 MPa; 8FA, 57–
59.5 MPa). The samples were then exposed to immersion
tests.
The resistance of materials to acid attack was studied by
immersion of cylindrical specimens (F25� 50 mm) in 5%
solutions of acetic and sulfuric acids. The strength of acid
solutions used in the test was not equal. The solution of
sulfuric acid had pH 0.8 and was much stronger than
solution of acetic acid, which had pH of 2.4. The choice
of acids solutions and their concentrations were based on
practical utilisation of concrete as a construction material in
sewage pipes, mining, and food processing industries. The
testing media were replaced monthly with fresh solutions.
The compressive strength of cylinders (F25� 50 mm) was
Table 1
Composition of dry materials (mass %) by XRF
Oxide SiO2 Al2O3 Fe2O3 CaO MgO K2O
FAa 50.0 28.0 12.0 3.5 1.3 0.7
Portland cementb 19.9 4.62 3.97 64.27 1.73 0.57
a Pozzolanic Enterprises, Port Melbourne, Australia.b Type I/II, Geelong, Victoria, Australia.
measured at 30, 60, 90, 120 and 150 days of exposure. Neat
Portland cement paste (OPC) and Portland cement paste
with 20% FA replacement (OPC + FA) with w/b ratio 0.4
were used for comparison in the tests. The specimens
containing Portland cement at w/b = 0.4 had the same
consistency as the geopolymer specimens at w/b = 0.3.
Thus, the specimens were compared as having the same
consistency at the time of moulding. The compressive
strengths of OPC and OPC+ FA specimens at the age of 2
months, when they were used in immersion tests, were 45
and 42.9 MPa, respectively.
The deterioration was studied by X-ray diffraction
(XRD), Fourier transform infrared spectroscopy (FTIR)
and scanning electron microscopy (SEM). For the analy-
sis, the samples were taken from the surface (1–2 mm
depth) exposed to solutions. XRD analyses were made
using a Rigaku Geigerflex D-max II automated diffrac-
tometer with the following conditions: 40 kV, 22.5 mA,
Cu–Ka radiation. The XRD patterns were obtained by
scanning at 0.1j (2h) per min and in steps of 0.05j (2h).SEM (Hitachi S-2300, Japan) was used for microstruc-
tural observations of the fracture surfaces, which were
coated with evaporated gold for examination in the
secondary electron mode. FTIR was performed on the
samples using a Perkin Elmer 1600 spectrometer and the
KBr pellet technique (3 mg powder sample mixed with
100 mg KBr).
3. Results
Geopolymer specimens had very small change in appear-
ance after 5 months of immersion in the acidic solutions.
Some softening of the surface cover and insignificant
lightening of the colour could be noticed in the 8FA, 8FASS
and 8FAK geopolymer specimens after exposure to the
solution of sulfuric acid. In the acetic acid, there was no
change in appearance of 8FAK specimens and very small
change in appearance of 8FASS and 8FA specimens.
Visual examination of specimens exposed to the sulfuric
acid solution showed severe deterioration of the OPC and
OPC+ FA specimens that is consistent with high content of
calcium in these samples. Within days, OPC samples had a
thick layer of white paste formed on the surface. After 2
weeks, the surface layer of the samples was converted to
some reaction products to a depth of 8 mm. After 1 month,
OPC samples were severely deteriorated. The surface layer
Na2O TiO2 P2O5 MnO SO3 Loss on ignition
0.2 3.2 0.42 0.03 0.12 0.53
0.15 0.23 0.12 0.06 2.56 2.9

Fig. 1. XRD traces of FA. Q = quartz, M =mullite, H = hematite.
T. Bakharev / Cement and Concrete Research 35 (2005) 658–670660
of OPC+ FA samples deteriorated to a depth of 4 mm after 1
month and 10 mm after 3 months. In acetic acid solution,
there was a significant loss of cement paste material from
the surface in OPC specimens and change in the colour of
the surface layer in OPC+ FA specimens.
Table 3 gives the weight changes for the specimens
exposed to acidic solutions for 2 months. The most signif-
icant weight change in both acetic and sulfuric acids was in
OPC and OPC+ FA samples, which had weight losses in
acetic acid solution of 10% and 5.47%, respectively. In
sulfuric acid, both OPC and OPC+FA samples had weight
gain. OPC samples gained more than 40% and severely
deteriorated, while OPC+ FA samples gained 19.15% and
exhibited severely deteriorated surface layer.
Among geopolymer samples, the best performance in
both tests was by samples activated by sodium hydroxide,
which had weight losses in acetic and sulfuric acid solutions
of 0.45% and 1.96%, respectively. Next in performance
were samples activated by sodium silicate solution, which
had 3.83% weight gain in the acetic acid solution and 2.56%
weight loss in the sulfuric acid solution. The performance of
the samples prepared with sodium hydroxide and potassium
hydroxide solutions was good in acetic acid solution with
Table 2
Alkali-activated FA samples
Sample Type of activator
and w/b ratio
Concentration Curing conditions
8FASS Sodium silicate,
w/b = 0.3
8% Na
8FA Sodium hydroxide,
w/b = 0.3
8% Na 24 h at room temperature,
24 h at 95 jC for all cases
8FAK Sodium hydroxide +
potassium hydroxide,
w/b = 0.3
8%Na and
1% K
1.15% weight loss, but rather poor in sulfuric acid solution
with 12.43% weight loss.
3.1. Compressive strength
Fig. 2 shows the evolution of the compressive strength of
the samples exposed to the acetic acid solution. The 8FAK
samples activated by sodium and potassium hydroxide
solution performed well with 4.5% strength loss in the first
month and about 10% strength decline in the second month
of exposure, which continued over the next 4 months,
reaching 38.3% after 6 months of the test. Next in perfor-
mance were 8FA samples activated by sodium hydroxide
solution, which had a rapid strength loss of about 45% after
2 months of exposure, but recovered slightly and had about
40% strength reduction after 6 months of the test. 8FASS
samples activated by sodium silicate had about 60%
strength decline after 6 months of exposure. Polynomial
trend lines were used to show the trend of strength evolution
in 8FA and 8FASS specimens, because very significant
fluctuations of strength were observed in these two materials
in the acetic acid solution. OPC and OPC + FA paste
samples had 91% and 69% strength loss, respectively, after
2 months, and about 91% and 84%, respectively, after 6
months of exposure. Significant fluctuations of strength
Table 3
Weight changes of the samples exposed to 5% solutions of sulfuric and
acetic acids
Sample Acetic acid (%) Sulfuric acid (%)
OPC � 10 >40
OPC+FA � 5.47 19.15
8FA � 0.45 � 1.96
8FASS 3.83 � 2.56
8FAK � 1.15 � 12.43

Fig. 2. Compressive strength evolution of the geopolymer and Portland cement specimens exposed to 5% acetic acid solution.
T. Bakharev / Cement and Concrete Research 35 (2005) 658–670 661
measured in 8FASS and 8FA specimens were possibly
connected to the breakdown of some geopolymer compo-
nents and migration of alkalis from the specimens into
solution superimposed by the acid attack.
Fig. 3 shows the evolution of the compressive strength of
the samples exposed to the sulfuric acid solution. The 8FA
samples activated by sodium hydroxide had the best per-
formance with 6.4% strength decline in the first month of
the test and additional 4% strength decline every month
afterward. The 8FA samples had 17.5% strength loss after 4
months of the test and the strength of the specimens was
stabilised afterward. The 8FAK and 8FASS samples had
very small change in appearance, but the samples had 89%
and 82% strength loss, respectively, after 2 months of the
test. The OPC samples completely deteriorated in the first
month of the test and OPC+ FA samples had 77% strength
loss and were severely deteriorated.
Fig. 3. Compressive strength evolution of the geopolymer and Port
3.2. X-ray diffraction
Fig. 4 shows XRD pattern of the geopolymer samples
before the test. Peaks due to quartz, mullite and hematite of
the crystalline component of the FA can be seen in addition
to the broad peak in the region 20–32j 2h arising from the
glassy phase of the FA and broad peak in the region 6–10j2h arising from aluminosilicate gel. In addition, peaks for
hydroxysodalite and Na–P1 (gismondine) zeolites were
present in the XRD spectra of the 8FA and 8FAK specimens.
The 8FA specimen contained more ordered hydroxysodalite
and Na–P1 (gismondine) zeolites than 8FAK specimen.
Fig. 5 shows the XRD spectra of the geopolymer
materials exposed to the acetic acid solution for 2 months.
Traces of hydroxysodalite and Na–P1 zeolites disappeared
in the XRD spectrum of 8FA, and a broad peak in the region
11–20j 2h, attributed to amorphous aluminosilicate gel,
land cement specimens exposed to 5% sulfuric acid solution.

Fig. 4. XRD analysis of the geopolymer materials before tests: (a) 8FA, (b) 8FASS, and (c) 8FAK. P=Na–P1 (gismondine), N = hydroxysodalite, Q = quartz,
M=mullite, H = hematite.
T. Bakharev / Cement and Concrete Research 35 (2005) 658–670662
was observed instead. The 8FAK specimen underwent
significant changes when exposed to acetic acid solution.
A broad peak in the region 7–10j 2h arising from the
amorphous aluminosilicate gel dominates the XRD spec-
trum after the immersion test. It is suggested that disappear-
ance of peaks of quartz and some other crystalline residue of
FA in the pattern of 8FAK specimen is due to the crystal
surface being covered by amorphous phases formed as a
result of the reaction of aluminosilicate gel with acetic acid
Fig. 5. XRD pattern of the geopolymer materials exposed to 5%
solution, thereby masking the XRD reflections that would
have otherwise been generated by these minerals. There
were only small changes in the XRD spectrum of 8FASS
after the exposure to the acetic acid solution.
Fig. 6 presents XRD spectra of the geopolymer materials
exposed to 5% sulfuric acid solution for 2 months. The 8FA
specimen has undergone significant changes by exposure to
sulfuric acid solution. It can be seen that peaks for zeolitic
phases have disappeared, and a broad peak at 7–10j 2h,
acetic acid solution. Q = quartz, M=mullite, H = hematite.

Fig. 6. XRD pattern of the geopolymer materials exposed to 5% sulfuric acid solution. Ch = chabazite, P=Na–P1 (gismondine), Q = quartz, M=mullite,
H = hematite.
T. Bakharev / Cement and Concrete Research 35 (2005) 658–670 663
arising from aluminosilicate gel, dominates the traces.
Similar to the case of the acetic acid solution, precipitation
of new amorphous phases on the surfaces of quartz, mullite
Fig. 7. Representative SEM images of geopolymer samples
and hematite crystals may cause a reduction of their peak
intensities in the XRD pattern. On the contrary, in the
spectra of 8FASS and 8FAK some new peaks can be seen
before the test: (A) 8FA, (B) 8FASS, and (C) 8FAK.
T. Bakharev / Cement and Concrete Research 35 (2005) 658–670664
arising from crystalline zeolitic phases. After 2 months of
exposure to the sulfuric acid solution, the 8FASS specimen
contained chabazite and Na–P1 (gismondine) zeolites,
while the 8FAK specimen contained Na–P1 (gismondine)
zeolite in addition to the amorphous aluminosilicate gel and
crystalline residue of the FA.
3.3. Scanning electron microscopy
Fig. 7(A-C) shows SEM images of the 8FA, 8FASS, and
8FAK geopolymer specimens, respectively, before the im-
mersion test. The specimens activated by sodium hydroxide
(8FA) had more crystalline appearance, particularly than the
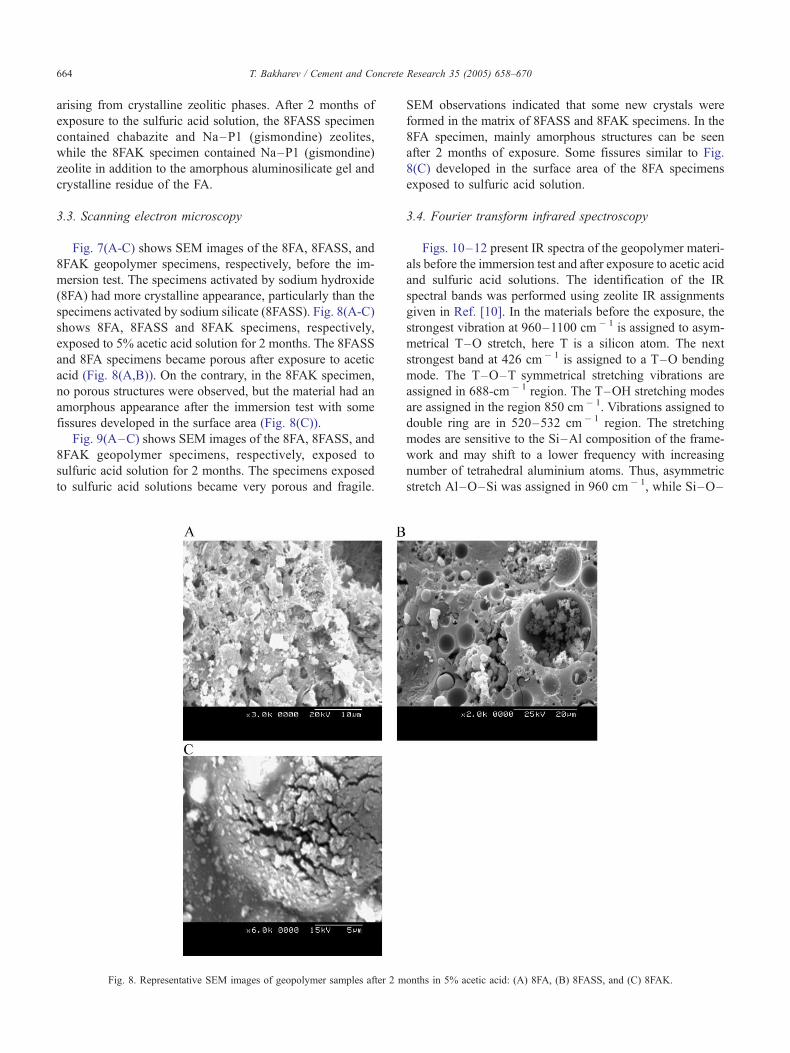
specimens activated by sodium silicate (8FASS). Fig. 8(A-C)
shows 8FA, 8FASS and 8FAK specimens, respectively,
exposed to 5% acetic acid solution for 2 months. The 8FASS
and 8FA specimens became porous after exposure to acetic
acid (Fig. 8(A,B)). On the contrary, in the 8FAK specimen,
no porous structures were observed, but the material had an
amorphous appearance after the immersion test with some
fissures developed in the surface area (Fig. 8(C)).
Fig. 9(A–C) shows SEM images of the 8FA, 8FASS, and
8FAK geopolymer specimens, respectively, exposed to
sulfuric acid solution for 2 months. The specimens exposed
to sulfuric acid solutions became very porous and fragile.
Fig. 8. Representative SEM images of geopolymer samples after 2 m
SEM observations indicated that some new crystals were
formed in the matrix of 8FASS and 8FAK specimens. In the
8FA specimen, mainly amorphous structures can be seen
after 2 months of exposure. Some fissures similar to Fig.
8(C) developed in the surface area of the 8FA specimens
exposed to sulfuric acid solution.
3.4. Fourier transform infrared spectroscopy
Figs. 10–12 present IR spectra of the geopolymer materi-
als before the immersion test and after exposure to acetic acid
and sulfuric acid solutions. The identification of the IR
spectral bands was performed using zeolite IR assignments
given in Ref. [10]. In the materials before the exposure, the
strongest vibration at 960–1100 cm � 1 is assigned to asym-
metrical T–O stretch, here T is a silicon atom. The next
strongest band at 426 cm � 1 is assigned to a T–O bending
mode. The T–O–T symmetrical stretching vibrations are
assigned in 688-cm � 1 region. The T–OH stretching modes
are assigned in the region 850 cm � 1. Vibrations assigned to
double ring are in 520–532 cm � 1 region. The stretching
modes are sensitive to the Si–Al composition of the frame-
work and may shift to a lower frequency with increasing
number of tetrahedral aluminium atoms. Thus, asymmetric
stretch Al–O–Si was assigned in 960 cm � 1, while Si–O–
onths in 5% acetic acid: (A) 8FA, (B) 8FASS, and (C) 8FAK.

Fig. 9. Representative SEM images of geopolymer samples after 2 month in 5% sulfuric acid solution: (A) 8FA, (B) 8FASS, and (C) 8FAK.
T. Bakharev / Cement and Concrete Research 35 (2005) 658–670 665
Si stretch was assigned in 1000-cm� 1 region. The bending
mode, that is, the 420–500 cm � 1 band, is not as sensitive to
aluminium substitution.
Exposure to acetic acid produced significant shifts in all
the aluminosilicate spectral bands, by comparison with
Fig. 10. IR spectra of 8FA specimens (a) before the test, (b) exposed to 5% acetic
months.
those of the materials before this treatment (Figs. 10–12),
e.g.,
(i) The asymmetrical Si–O–Al and Si–O–Si stretching
vibrations shifted from 960 and 1026–1120 cm� 1 to
acid solution for 2 months, and (c) exposed to sulfuric acid solution for 2

Fig. 11. IR spectra of 8FASS specimens (a) before the test, (b) exposed to 5% acetic acid solution for 2 months, and (c) exposed to sulfuric acid solution for 2
months.
T. Bakharev / Cement and Concrete Research 35 (2005) 658–670666
986 and 1080–1130 cm � 1, respectively, in 8FASS
sample; from 976 and 1100 cm � 1 to 994 and 1064–
1118 cm� 1, respectively, in 8FA sample; shifted from
970 and 1100 cm � 1 to 986 and 1088–1106 cm � 1,
respectively, in 8FAK sample.
(ii) The Si–OH and Al–OH stretching vibrations in 854
cm�1 region became stronger and shifted to 878 and
880 cm�1 in 8FA and 8FASS samples, respectively;
and to 868 cm �1 in 8FAK sample.
(iii) The Si–O–Si and Si–O–Al symmetric stretching
vibrations in 688 cm � 1 region shifted to 704 cm � 1 in
Fig. 12. IR spectra of 8FAK specimens (a) before the test, (b) exposed to 5% acetic
2 months.
8FA sample, 664–746 cm � 1 in 8FASS and 684 cm� 1
in 8FAK sample.
(iv) The O–Si–O bending vibrations at 426 cm � 1 shifted
to 416 cm � 1 in 8FA sample and 424 cm � 1 in 8FAK
and had no change in 8FASS sample spectra.
(v) Double-ring vibrations at 520–532 cm � 1 shifted to
530–602 cm � 1 in 8FA sample, 520 cm� 1 in 8FASS,
and 520–592 cm � 1 in 8FAK sample.
To summarise, after exposure to the acetic acid solution,
in the 8FA, 8FASS and 8FAK samples, there was an
acid solution for 2 months, and (c) exposed to 5% sulfuric acid solution for

T. Bakharev / Cement and Concrete Research 35 (2005) 658–670 667
increase of Si/Al atom ratio in the polymers and an increase
of the chain length. In addition, there was an increase of the
Si–OH and Al–OH groups in 8FA and 8FASS samples. In
acetic acid, the least changes were induced in IR spectra of
the 8FAK sample.
Exposure to sulfuric acid also produced very significant
shifts in the aluminosilicate spectral bands, by comparison
with those of the materials before this treatment (Figs. 10–
12), e.g.,
(vi) The asymmetrical Si–O–Al and Si–O–Si stretching
vibrations shifted from 960 and 1026–1120 cm � 1 to
1022 and 1056–1130 cm � 1, respectively, in 8FASS
sample; from 976 and 1100 cm� 1 to 980 and 1046–
1170 cm � 1, respectively, in 8FA sample; from 970
and 1100 cm � 1 to 1056 and 1062–1152 cm � 1
respectively, in 8FAK sample.
(vii) The Si–OH and Al–OH stretching vibrations in 854
cm� 1 region became much stronger and shifted to
916 cm � 1 in 8FAK sample, 900 cm � 1 in 8FASS,
and had no change in 8FA sample.
(viii) The Si–O–Si and Si–O–Al symmetric stretching
vibrations at 688 cm � 1 shifted to 782 cm � 1 in
8FAK, 770 cm � 1 in 8FASS sample, and had no
change in 8FA sample.
(ix) The O–Si–O bending vibrations at 426 cm� 1 became
stronger and shifted to 444 and 430 cm� 1 in 8FAK
and 8FASS, respectively, and had no change in 8FA
sample.
(x) Double-ring vibrations at 520–532 cm � 1 shifted to
520–574 cm� 1 in 8FASS, 542–572 cm� 1 in 8FAK,
and had no change in 8FA sample.
(xi) New band due to sodium sulfate at 636 cm � 1
appeared in 8FAK and 8FASS samples.
In summary, after exposure to sulfuric acid, there was an
increase of the Si/Al atom ratio in the 8FA, 8FASS and 8FAK
samples. There was also some increase in the chain length in
8FAK sample. In addition, after treatment by sulfuric acid,
concentration of ring silicates and the Si–OH and Al–OH
groups significantly increased in 8FAK and 8FASS samples.
The least changes were found in the IR spectra of the 8FA
sample.
In both acidic solutions, there was an increase in the wave
number of the bands in the region of 1600 and 3450 cm � 1,
which were attributed to bending vibrations (H–O–H) and
stretching vibration (–OH) due to weakly bound H2O mol-
ecules adsorbed on the surface or trapped in the large cavities.
4. Discussion
To understand the process that takes place in the geo-
polymer materials immersed in the acidic solution, let us start
with the reactions that occur in the materials before immer-
sion. The possible chemical processes of dissolution of the
starting materials and condensation of silicon and aluminium
monomers can be represented as the following reactions [11]:
ðAl� Si solidÞðfly ash particleÞ þ OH�ðAqÞ ()
AlðOHÞ�4monomer
þ � OSiðOHÞ3monomer
ð1Þ
�OSiðOHÞ3OH�Z�OSiðOHÞ2O�þH2O ð2Þ
ð3Þ
�OSiðOHÞ3 þMþZMþ�OSiðOHÞ3monomer
ð4Þ
�OSiðOHÞ2O�þ2M
þZMþ�OSiðOHÞ2monomer
O�Mþ ð5Þ
�OSiðOHÞ3monomer
þMþ þMþ�OSiðOHÞ3monomer
Z
Mþ�OSiðOHÞ2 � O� O
dimer
SiðOHÞ3 þMOH ð6Þ
�OSiðOHÞ2monomer
O� þMþ þMþ�OSiðOHÞ3monomer
Z
Mþ�OSiðOHÞ2 � O� O
dimer
SiðOHÞ2O� þMOH ð7Þ
ð8Þ
2 Silicate monomer þ 2 Silicate dimersþ 2 Mþ ()
Mþcyclic trimer þMþlinear trimer þ 2OH�; ð9Þ
where M is an alkali metal, Na, K.

T. Bakharev / Cement and Concrete Research 35 (2005) 658–670668
Reaction (1) describes dissolution reaction for the FA
particle, which depends on the pH of the solution, the
structure and the surface properties of the FA particle [9].
Eqs. (1)–(3) describe chemical hydration reactions, where
the OH � anions react with the Al–Si solid surface to form
Al(OH)4� , –OSi(OH)3, divalent orthosilicic acid and tri-
valent orthosilicic acid ions. Reactions (4) and (5) present
physical electrostatic reactions, where the alkali metal cation
M + reacts with Al(OH)4� , –OSi(OH)3, divalent orthosili-
cic acid and trivalent orthosilicic acid ions to balance
Coulombic electrostatic repellence [12]. The cation–anion
pair condensation interactions presented by Reactions (6)–
(9) lead to condensation of dimer and trimer ions. In the
system with sodium silicate activator, more polymerised
silicate ions than dimer and trimer may be present, such as
tetramer, pentamer, hexamer, octamer, nonamer and their
compounds [13]. From the nine reactions given above, it
can be seen that decreasing the concentration of the alkaline
solution in acidic media favours the equilibrium in these
nine reactions shifting to the left-hand side.
In the acidic solution, the concentration of monomer,
dimer and trimer ions would increase as a result of shifting
the balance in Reactions (1)–(9) to the left-hand side by
neutralising the MOH with the acid. In Reactions (6)–(9), a
shift of the balance due to reduced pH will induce depoly-
merisation of the silicate species formed. In addition, in
Reactions (4))–(9), H + ions may substitute for M + , which
could change the condensation process. An increased
amount of silicic acid ions and dimers will be present in
the system. It is in agreement with Iller, who states that in
the acidic conditions silicic acid may be liberated from
silicates, which contain unpolymerised SiO4 tetrahedra [14].
In the sulfuric acid solution, we observe formation of
amorphous silica outside the geopolymeric samples. Iller
states that silicic acid is most stable at pH 2–3. However,
ageing of a supersaturated solution of silicic acid produces a
‘‘solid’’ phase of amorphous silica. This silica appears in a
form of colloidal particles, a precipitate or a gel. The
polymerisation of silicic acid involves the condensation of
silanol (SiOH) groups to form siloxane (Si–O–Si) bonds
[14].
Interaction of geopolymers with the acid solutions can
also cause replacement of the exchangeable cations (Na, K)
in polymers by hydrogen or hydronium ions [10]:
ð10Þ
However, treatment of a geopolymer with a strong acid
may result in a direct attack on the aluminosilicate frame-
work and dealumination. This attack will cause breakage of
the Si–O–Al bonds, increased number of Si–OH and Al–
OH groups in geopolymers and an increased amount of
silicic acid ions and dimers in solution. Therefore, this
process leads to a mass loss of the geopolymer materials.
Polymer structures with a Si/Al ratio of 1 are more subject
to the attack by the acid than more siliceous polymers [10].
The observation of the mass changes of the samples
exposed to acidic solutions and XRD and FTIR data support
the hypothesis of aluminosilicate polymer depolymerisation
and liberation of silicic acid from the samples, replacement
of Na and K cations by hydrogen or hydronium ion and
dealumination of the geopolymer as a result of exposure to
acidic solutions. These processes induced mass loss in 8FA
and 8FAK samples in both acetic and sulfuric acid solutions.
The 8FAK samples experienced very significant 12.4%
weight loss in the sulfuric acid solution. Precipitation of
silica gel was observed in both 8FAK and 8FA samples in
the acid solutions. The 8FASS samples lost weight in
sulfuric acid solution. However, 8FASS samples gained
weight as the result of reaction with the acetic acid solution.
Possibly, products of depolymerisation precipitated as gel or
zeolites in the 8FASS sample, thus increasing its weight.
Liberation of Na in 8FASS and 8FAK samples in sulfuric
acid solution is evident from IR data, which indicated
presence of sodium sulfate in the samples subjected to
sulfuric acid solution.
IR data show an increase in Si–OH and Al–OH groups
concentration resulting from the sulfuric and acetic acid
attack on aluminosilicate polymer structure. FTIR observa-
tions of the shift of the Si–O–Si asymmetric stretching
band at 960–1000 cm� 1 indicate an increase in the Si/Al
ratio in the polymer. The increase of the intensity of the
band 980–1100 cm� 1 indicates an increase of the length of
siloxane and aluminosilicate chains. Therefore, in 8FA,
8FASS and 8FAK samples, dealumination of the geopol-
ymers and condensation process caused an increase of the
Si/Al ratio and the polymer chain length in the acetic acid
solution. However, there was less significant increase in the
intensity of the band 980–1100 cm� 1 in sulfuric acid
solution than in acetic acid solution. There was more
significant shift in IR spectral bands of 8FA and 8FASS
samples caused by immersion in sulfuric acid than in acetic
acid solution. Hence, sulfuric acid was more aggressive than
acetic acid in its action on geopolymers and caused more
severe dealumination and depolymerisation of geopolymers.
It is consistent with higher strength of sulfuric acid solution
than acetic acid solution used in the test as a medium. In
addition, some new zeolitic phases formed in 8FASS and
8FAK samples in the sulfuric acid medium. According to
XRD and SEM data, either amorphous polymers, or zeolites
are precipitated in geopolymers as a result of exposure to
acidic solutions. Thus, in a medium of low pH, depolymer-
isation of geopolymers is followed by condensation of
polymeric ions enriched with silicon. This general descrip-
tion of the processes that take place in the geopolymer
materials exposed to acid solutions is modified in each case
because of peculiarities of the polymer structure influenced
by the type of activator and heat curing procedure.

T. Bakharev / Cement and Concrete Research 35 (2005) 658–670 669
The durability properties of the 8FA, 8FASS and 8FAK
geopolymer materials were very different. The difference in
performance must be linked to different pore structure of
these materials. Table 4 presents results of BET nitrogen
adsorption analysis, which indicated that the materials had
significantly different total porosity, average pore diameters
and BET surface areas [15]. The 8FA specimens had a
porosity of 17.5%, while 8FASS and 8FAK had 0.36% and
1.98%, respectively. The average pore diameter was found to
be f 45, f 63 and 116 A in 8FA, 8FASS and 8FAK speci-
mens, respectively. The BET surface area was measured
f 43 m2/g in 8FA and only f 14 m2/g in 8FASS and
8FAK specimens. These results correlate well with the
performance of the materials in sulfuric acid solution, where
8FA specimen having the smallest pore diameter had better
resistance than the 8FASS and 8FAK materials despite its
high porosity. The 8FAK samples with the largest average
pore diameter had a poor durability in sulfuric acid solution,
but were rather durable in the acetic acid solution. This
discrepancy is possibly connected to different products of
reaction with the acid solutions. In case of sulfuric acid, Na–
P1 zeolite (gismondine) formed, while in a solution of acetic
acid, amorphous products were produced. Possibly, increased
formation of Na–P1 zeolite caused a loss of strength in 8FAK
specimens in sulfuric acid solution. Previously, Brough et
al.[16] reported a loss of strength in alkali-activated blends
with high content of FA, which was attributed to phase
transformations in zeolites. Performance of 8FAK and 8FASS
geopolymer specimens was significantly better in acetic acid
than in sulfuric acid solution possibly due to higher strength
of the sulfuric acid solution of pH 0.8 compared to the acetic
acid solution of pH 2.4.
OPC specimens did not perform well in both sulfuric and
acetic acid solutions. The severe deterioration of OPC
samples in acidic environment is connected to the chemical
composition with high calcium content (Table 1) and
relatively large pore size in the OPC paste at w/c = 0.4
(Table 4). OPC, OPC+FA and 8FA specimens had very
similar porosity measured by BET, but their performance in
durability tests was very different: The geopolymer speci-
mens 8FA were the most durable, while OPC specimens
were the least durable in the acidic environment. The
specimens had significantly different median pore sizes:
Table 4
Results of BET nitrogen adsorption analysis
Specimen BET
surface area
(m2/g)
Average
pore diameter
(4V/A by BET)
(A)
Total
porosity
(%)
8FA 42.9 45.2 17.5
8FAK 14.2 116 3.13
8FASS 13.8 62.8 1.67
Portland cement paste,
w/b = 0.4
41.6 100.1 16.6
Portland cement + FA paste,
w/b = 0.4
44 82.5 18
f 45, f 82 and f 100 A, respectively, in 8FA, OPC+ FA
and OPC specimens. Thus, the median pore size was of
more importance for the durability in acidic solutions than
the total porosity. The chemistry of the material was
undoubtedly very important for its durability. Geopolymer
specimens with very low Ca content performed significantly
better than OPC specimens. Among geopolymer and OPC
materials, the 8FA material performed significantly better
than others, although 8FA specimens had the highest po-
rosity among the geopolymer materials. The good perfor-
mance of the 8FA material was possibly due to a stable
cross-linked aluminosilicate structure and the small, nano-
meter-sized pores contained in this material.
The peculiarities of the aluminosilicate structure of the
geopolymers are possibly responsible for their different
performance in the tests. The active centres on the surface
of the alumina silicate gel influence its reactions with the
aggressive media. Evidently, the introduction of potassium
ions created active sites in 8FAK material that caused its
susceptibility to reaction with the sulfuric acid solution and
rapid deterioration in this medium. The difference in the
effects of the two acid solutions on 8FAK material may also
be due to the difference in the anions of acids used in the test.
In the acetic acid, the reactions in 8FAK samples produced
amorphous polymers that ensured good durability, while in
the sulfuric acid, precipitation of Na–P1 zeolite occurred,
which was associated with the loss of strength. However,
chemistry is not the only factor that affects properties.
Morphology is also important for the durability performance
of the materials. XRD results suggested different degrees of
intrinsic ordering in the 8FA, 8FASS and 8FAK geopolymer
samples. The presence of traces of poorly crystalline zeolites
in 8FA showed that there were regions of the ordered
structures in this material. High durability of the 8FA
samples in sulfuric acid solution was attributed to the
presence of cross-linked polymer structures that successfully
resisted the attack. In the 8FASS sample, only amorphous
phases were present. In solutions of both acids, the 8FASS
samples initially rapidly lost strength; in the case of acetic
acid, the strength loss was stabilised; and in sulfuric acid, the
loss of strength was continuous. Chemical stability of the
polymers is improved when intrinsic order is present in one
or all phases. This observation appeared to be correct for a
wide range of polymeric materials, including organic and
inorganic polymers and minerals.
Fluctuations of strength in the 8FASS and 8FA speci-
mens in acetic acid solution may be linked to migration of
alkalis from geopolymers into solutions. Very significant
fluctuations of strength, which were observed in geopol-
ymer specimens immersed in sulfate solutions, were linked
to migration of alkalis from geopolymers into solution [17].
Instability of strength is a serious issue for geopolymer
materials used in structural applications and additional
research is needed to investigate this problem.
SEM observations show that geopolymer materials may
have different mode of deterioration. Deteriorationmay occur

T. Bakharev / Cement and Concrete Research 35 (2005) 658–670670
through formation of fissures in the amorphous polymer
matrix or through crystallisation of zeolites in the amorphous
matrix. In this study, the first type of deterioration was
characteristic of high-performance materials, and the second
type was characteristic of low-performance materials. It is
likely that the fissures formed as a result of disintegration of
the aluminosilicate gel in the aggressive media, due to
breaking of Si–O–Si and Si–O–Al bonds in the polymer.
No indication of expansive reaction was observed. The geo-
polymer materials, which did not perform well in the aggres-
sive environment formed zeolites and grains that caused
significant loss of strength due to low intercrystalline bond
strength.
5. Conclusions
The deterioration of geopolymer materials in acidic
media is connected to depolymerisation of aluminosilicate
polymers and liberation of silicic acid, replacement of Na
and K cations by hydrogen or hydronium ion and deal-
umination of the geopolymer structure. It is also connected
to condensation of siliceous polymers and zeolites, which in
some cases lead to a significant loss of strength.
In acidic environment, high-performance geopolymer
materials deteriorate with the formation of fissures in
amorphous polymer matrix, while low-performance geo-
polymers deteriorate through crystallisation of zeolites and
formation of fragile grainy structures.
The materials tested had a significant difference in the
degrees of intrinsic ordering within the polymer gel. The
8FA sample had more ordered structure and the smallest
average pore diameter than 8FASS and 8FAK samples. The
8FA specimens had the best resistance in sulfuric acid
solution. Introduction of potassium hydroxide in 8FAK
samples caused an increase of the average pore diameter
and reduced its durability in sulfuric acid solution.
Stability of geopolymer materials in aggressive environ-
ments depends on the intrinsic ordering present within
aluminosilicate gel. More crystalline geopolymer material
prepared with sodium hydroxide was more stable in the
aggressive environment of sulfuric and acetic acid solutions
than amorphous geopolymers prepared with the sodium
silicate activator. The chemical instability would also depend
on the presence of the active sites on the aluminosilicate gel
surface, which appeared to increase in presence of K ions.
Instability of strength in some geopolymers is of concern
in their use as a construction material, and careful consid-
eration should be given to this aspect.
Acknowledgements
The author is grateful to the Australian Research Council
for financial support under Grant DP0209501 and to Civil
Engineering Department and School of Physics and
Materials Engineering, Monash University, for providing
access to equipment used in this investigation.
References
[1] W.H. Harrison, Durability of concrete in acidic soils and waters, Con-
crete 1 (2) (1987) 18–24.
[2] T. Bakharev, J.G. Sanjayan, Y.-B. Chen, Resistance of alkali-activated
slag concrete to acid attack, Cem. Concr. Res. 33 (2003) 1607–1611.
[3] J. Davidovits, Properties of geopolymer cements, Proceedings of the
First International Conference on Alkaline Cements and Concretes,
vol. 1, SRIBM, Kiev, Ukraine, 1994, pp. 131–149.
[4] J. Davidovits, Mineral polymers and methods of making them, US
Patent 4349386, 1982.
[5] J. Davidovits, Synthetic mineral polymer compound of the silicoalu-
minates family and preparation process, US Patent 4472199, 1984.
[6] T. Bakharev, Geopolymer materials prepared using class F fly ash
and elevated temperature curing, Cem. Concr. Res. (2004) (in press).
[7] A. Palomo, M.W. Grutzeck, M.T. Blanco, Alkali-activated fly ashes a
cement for the future, Cem. Concr. Res. 29 (1999) 1323–1329.
[8] J.C. Swanepoel, C.A. Strydom, Utilisation of fly ash in a geopoly-
meric material, Appl. Geochem. 17 (2002) 1143–1148.
[9] J.G.S. van Jaarsveld, J.S.J. van Deventer, The effect of metal contam-
inants on the formation and properties of waste-based geopolymers,
Cem. Concr. Res. 29 (1999) 1189–1200.
[10] D.W. Breck, Zeolite Molecular Sieves: Structure, Chemistry and Use,
Wiley-Interscience, New York, 1974, pp. 415–418.
[11] V.I. Babushkin, G.M. Matveyev, O.P. Mchedlov-Petrossyan, Thermo-
dynamics of Silicates, Springer-Verlag, Berlin, 1985, pp. 276–281.
[12] H. Xu, J.S.J. Van Deventer, The geopolymerisation of alumino-silicate
minerals, Int. J. Miner. Process. 59 (2000) 247–266.
[13] W.M. Hendricks, A.T. Bell, C.J. Radke, Effect of organic and alkali
metal cations on the distribution of silicate anions in aqueous solu-
tions, J. Phys. Chem. 95 (1991) 9513–9518.
[14] R.K. Iller, The Colloid Chemistry of Silica and Silicates, Cornell
Univ. Press, Ithaca, NY, 1955, pp. 27–37.
[15] T. Bakharev, Effect of curing regime and type of activator on proper-
ties of alkali-activated fly ash, 1st International Symposium on Nano-
technology in Construction, Paisley, Scotland, June, 2004 (in press).
[16] A.R. Brough, A. Katz, T. Bakharev, G.-K. Sun, R.J. Kirkpatrick, L.J.
Struble, J.F. Young, Microstructural aspects of zeolite formation in
alkali activated cements containing high levels of fly ash, in: S.
Diamond, et al. (Ed.), Microstructure of Cement Based Systems/
Bonding and Interfaces in Cementitious Materials, Mater. Res.
Soc. Proc., vol. 370, 1996, pp. 199–208.
[17] T. Bakharev, Durability of geopolymer materials in sodium and mag-
nesium sulfate solutions, Cem. Cancr. Res. (in press).


![INVESTIGATION OF GEO POLYMER CONCRE TE …€¦nebulous microstructure [Davidovits, 1994]. Two principle constituents of geopolymer (GP) are: geopolymer source materials (GSMs) also,](https://img.pdfslide.us/doc/110x75/5b355f067f8b9aad388bc9a0/investigation-of-geo-polymer-concre-te-microstructure-davidovits-1994-two-principle.jpg)

![HempCreate: the art of hemp based Geopolymer extrusion. · The material aspect Extrude [print] buildings Necessary to; understand Geopolymer chemistry discover a suitable Geopolymer](https://img.pdfslide.us/doc/110x75/5f6499b949fcf85d37753e59/hempcreate-the-art-of-hemp-based-geopolymer-the-material-aspect-extrude-print.jpg)