Embed Size (px)
Citation preview

Resin transfer molding of natural fiber reinforced composites:cure simulation
David Rouisona, M. Sainb,*, M. Couturiera
aDepartment of Chemical Engineering, University of New Brunswick, NB, CanadabEarth Science Centre/Forestry/Chemical Engineering, 33 Willcocks Street, University of Toronto, ON, Canada M55 363
Received 7 January 2003; received in revised form 30 May 2003; accepted 29 June 2003
Abstract
In this work hemp/kenaf fiber-unsaturated polyester composites were manufactured using a resin transfer molding (RTM) pro-cess. The fiber mats, with a moisture content of 4.3% at 50% relative humidity, were dried in the mold under vacuum to reach a
moisture content around 1–2%. RTM composites with various fiber contents, up to 20.6% by volume, were manufactured. Thewetting of the fibers was very good. The resin injection time was observed to increase dramatically at high fiber contents due to thelow permeability of the mat. Keeping a constant mold temperature is the key to obtain fast and homogeneous curing of the part.The cure of the resin in the mold was simulated. It was shown to be in good agreement with experimental results obtained by
thermal measurements at different positions in the cavity. The performance of these samples was evaluated by measuring tensilestrength and flexural strength.# 2003 Elsevier Ltd. All rights reserved.
Keywords: B. Curing; B. Mechanical properties; C. Finite element analysis (FEA); Natural composite
1. Introduction
In recent years there has been a growing interest forthe use of natural fibers in composite applications,especially in the automotive industry. These types ofcomposites present many advantages compared to syn-thetic fiber reinforced plastics such as low tool wear,low density, cheap cost, availability and biodegrad-ability. The most common natural fibers used in com-posite applications are the bast and leaf qualities (hardfibers) with fibers such as hemp, jute, flax, kenaf orsisal. These materials have already been embraced byEuropean carmakers. This trend has reached NorthAmerica and the Natural Fiber Composite Industryhas registered a 40–50% growth in 2000. An annualgrowth rate of 54% is projected in the comprehensivereport on the Opportunities for Natural Fibers inplastic composites 2000–2005 by Kline & CompanyInc. (http://www.klineonline.com/Studies).Natural fibers consist mainly of cellulose fibers. These
fibers are made of microfibrils in a matrix of lignin (or
pectin) and hemicellulose. The strength and stiffness ofthe fibers are provided by hydrogen bonds and otherlinkages. The overall properties of the fibers depend onthe individual properties of each of its components.Hemicellulose is responsible for the biodegradation,moisture absorption and thermal degradation of thefiber. On the other hand lignin (or pectin) is thermallystable but is responsible for the UV degradation of thefiber. On average natural fibers contain 60–80% cellulose,5–20% lignin (or pectin) and up to 20% moisture [1].The thermal stability of the reinforcing fibers is a key
parameter in composite processing, especially in thecase of thermosetting resins and their exothermic curingbehavior. Wielage et al. [2] studied the thermal stabilityof flax and hemp fibers using differential scanningcalorimetric (DSC) and thermo-gravimetric (TGA)methods. They noticed a slight decrease of the mass ofnatural fibers between 200 and 220 �C. Above this lasttemperature irreversible degradation was observed.Below 160 �C no degradation is taking place. Theseresults suggest that hemp and flax fibers have the ther-mal stability to endure thermoset cure reactionsencountered during composite manufacturing. Saheband Jog [1] reported similar results for jute fibers. They
0266-3538/$ - see front matter # 2003 Elsevier Ltd. All rights reserved.
doi:10.1016/j.compscitech.2003.06.001
Composites Science and Technology 64 (2004) 629–644
www.elsevier.com/locate/compscitech
* Corresponding author. Fax: +1-416-978-3834.
E-mail address: [email protected] (M. Sain).
explained that the degradation of hemicellulose wasresponsible for the low temperature degradation of thefiber. In the higher temperature range the degradationwas due to lignin (or pectin).Another important aspect is the moisture content of
natural fibers. These fibers are hydrophilic and absorbwater. As stated before the moisture content can go ashigh as 20%, but in most cases it will be in the range5–10%. This can affect the final properties of the com-posites. During processing the presence of water cancreate voids in the matrix and also lead to a poor adhe-sion of the fibers with the hydrophobic resin.1,3 Thehydrophilic nature of natural fibers can be a problem inthe finished composites as well.Li et al. [4] reviewed many papers concerning the
mechanical properties of natural fibers. It was shownthat the tensile properties of these fibers are not uniformalong their length. Much research has also been donevarying the experimental conditions. Parameters such asfiber length, test speed, gauge length, fiber age or tem-perature were all found to have effects on the mechan-ical properties of sisal and sun-hemp fibers. Most ofthese effects are explained by the internal structure ofthe fibers (cell structure, microfibrillar angle, imperfec-tions, water content. . .). However Van Voor et al. [5]found that the temperature and the moisture contenthave a limited influence on the tensile strength of sisaland flax fibers.
In their extensive report on ‘‘Composites Reinforcedwith cellulose based fibres’’ Bledzki and Gassan [3] gavesome data for various natural fibers as well. Asobserved previously the characteristic values of naturalfibers are comparable to those of glass fibers. Thestrength of natural fibers greatly depends on the processused to produce them. In theory the elastic moduli ofcellulose chains can reach values of 250 GPa. Howeverthere is no existing procedure to separate these chainsfrom the microfibrils and therefore obtain such values.Right now the pulp and paper industry is able to pro-duce cellulose fibers with moduli around 70 GPa.Moreover some experimental data obtained from flaxand pineapple fibers show that the tensile strength ofthese fibers is significantly more dependent on the lengthof the fiber than for the case of glass fibers. Naturalfibers seem to be less homogeneous than syntheticfibers. From these papers it can be concluded that evenif natural fibers are well suited to replace glass fibers incomposite materials many improvements can still bedone concerning their mechanical properties. Experi-mental data giving the tensile strength, flexural strength,modulus, impact force and compressive force are avail-able in the literature for different types of natural-fibercomposites.New systems using biodegradable resins were also
investigated. Williams and Wool [6] prepared all-naturalcomposites using hemp and flax fibers with recentlydeveloped soy oil resins. The tensile and flexural prop-erties of the resins were shown to be improved by theaddition of the fibers as observed for regular thermosetresins. However this type of composite gave lowervalues than traditional composites. Wollerdorfer andBader [7] made similar observations for different all-natural composites.In the literature most of the natural fiber composites
studied are produced by hand lay-up or press moldingtechniques. Very little research is available for industrialprocesses such as resin transfer molding (RTM). TheRTM process is commonly used in the aerospace andautomotive industry. The process consists of mixingresin with a hardener and injecting at low pressure thecombination into a mold, which contains fibers. Theresulting part is cured at room temperature or above tillthe end of the curing reaction. Several types of resins(epoxy, polyester, phenolic and acrylic) can be used forthis process as long as their viscosity is low enough toensure a proper wetting of the fibers.Richardson and Zhang [8] presented an experimental
study of the mold filling process for a non woven hemp-phenolic resin system. Fiber washing (unexpected dis-placement of the reinforcement in the mold during theRTM process) was shown to be a problem at low fiberconcentration due to poor clamping. This could lead tothe failure of the process. This effect was reduced byincreasing the fiber concentration and improving the
Nomenclature
r, f and c subscripts are used for resin, fiber andcomposite respectively
a,b adjustable parameters in the wall’stemperature expression
Cp heat capacityHu ultimate heat of curek, kx thermal conductivityk2 cure rate constantkinhib inhibitor rate constantmr, mf resin and fiber mass fraction respectivelym, n kinetic parameters in the rate of cure
expressiondQ/dt heat generationt timeT temperature in KelvinT0 initial temperature of the moldVr resin volume fractionZ inhibitor concentrationZ0 original inhibitor concentration� degree of cure�max maximum degree of cure� correcting factor� density
630 D. Rouison et al. / Composites Science and Technology 64 (2004) 629–644
clamping system. Edge flow was observed during themold filling as well. It was found to be very sensitive tofiber concentration. Using preforms larger than themold solved this problem. Finally, in the rectangularmold used for this study, the ‘‘quasi-one dimensionalsteady state’’ flow (equal resin advancement distance orvelocity at any moment during the injection in the resinadvancement direction) was required to obtain a com-plete preform impregnation. All these parameters werefound to depend greatly on the injection pressure andon the fiber concentration.A few other studies investigated the possibility of
using the RTM process to prepare natural fibers com-posites. O’Dell [9] made similar observations for juteand glass composites prepared in a RTM mold. Theflow and the fiber wet-out were found to be the same inboth cases. Some increase in backpressure occurredwhen the resin was injected through five plies of jute.Sebes et al. [10] obtained very good results for hempfiber-reinforced polyester composites. No major prob-lem was noticed during the RTM process. Williams andWool [6] did not report any problems as well with nat-ural fibers–soy oil resins systems. More recently Oks-man [11] manufactured high quality flax fibercomposites using a RTM process. Good flow propertieswere observed in the mold and high fiber content wasattained. The composites were found to have very pro-mising mechanical properties.A great number of studies can be found in the litera-
ture concerning the RTM process for synthetic fibercomposites. Number of simulations of the mold fillingprocess and cure processes are proposed, many experi-mental data sets have been presented. The knowledge ofall the operating steps is very important to obtain highquality parts. Lebrun and Gauvin [12] investigated thetemperature and pressure evolution in a heated moldusing thermocouples and pressure transducers. The fillingand curing stage of the process were studied. Parameters
such as injection pressure, fiber content or mold tem-perature were shown to have a great influence on thedevelopment of the temperature profiles and the thermalboundary layers, especially for thin cavities. An impor-tant temperature gradient was measured through thethickness of the resin during filling, which could resultin important defects in the part. They also observed thatthe resin cure started at mid-thickness (the peak tem-perature was observed first at mid-thickness) and pro-gressed towards the mold surface.The mold filling is a critical stage of the RTM process
as discussed previously. Models predicting the flow ofthe resin in the mold can avoid defects such as voids andpoor wetting of the fibers. Lim and Lee [13] presented athree-dimensional mold filling process simulation usingthe control volume finite element method. They con-sidered a moving boundary problem and discretized thegoverning differential equations. The degree of cure andthe temperature were computed as well. The resultswere compared to exact solutions for simple geometriesand to experimental data. They were found to be ingood agreement. With this model any three dimensionalgeometry can be simulated. Simacek and Advani [14]used a finite element/control volume approach to modelthe mold filling in three dimensions for a RTM system.They found that the accuracy of the predictions depen-ded mainly on the accuracy of the permeability of thepreform. Various aspects of the mold filling such asdraping, compacting and corner deformation wereaddressed as well.Another approach was presented by Chiu et al. [15]
who compared an experimental analysis of the heattransfer and resin reaction in flow with a numericalsimulation based on a mixed Eulerian–Lagrangianmodel. The cure reaction kinetics was based onmechanistic considerations. Once again good agreementwas found between the simulations and the experiments.A more specific work on the curing simulation of
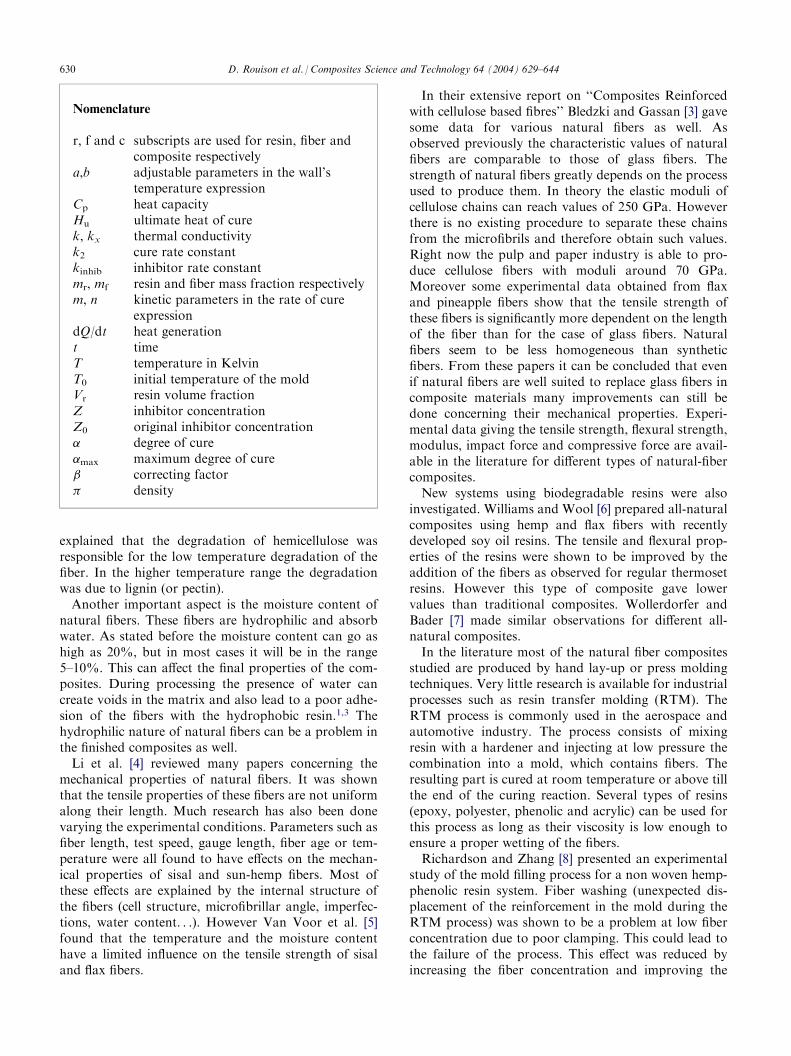
Fig. 1. Diagram of resin transfer molding equipment.
D. Rouison et al. / Composites Science and Technology 64 (2004) 629–644 631
thermoset composites was done by Blest et al. [16]. Theysolved resin flow, heat transfer and the curing of multi-layer composites in an autoclave. Using a finite differencescheme on a moving grid they discretized the governingdifferential equations. More precisely the energy equa-tion with an internal heat generation term was solved byan alternating-direction implicit method. Some of theresults were compared with experiments and showedgood agreement. One important comment from thiswork is that most of the assumptions made in this kindof simulation—such as constant thermal conductivity,specific heat and density or the use of the rule of mixtureto calculate the composite thermal conductivity—arenot fully valid. If greater precision in the results is nee-ded these parameters’ variations should be taken intoconsideration. At this point it is worth mentioning thereference study of Bogetti and Gillepsie [17] on the curesimulation of thick composites. This extensive workgave in details the procedure to solve the energy equa-tion with an internal heat generation in two dimensions.As discussed before important temperature and degreeof cure gradients were predicted. Michaud et al. [18]presented a similar study and predicted the thermalgradients during cure of thick-sectioned composites.Semling et al. [19] proposed an algorithm to calculatethe optimal process temperature for a RTM system.This method permitted to minimize the processing time,which is a very important parameter in the industry.Most of these numerical studies are usually associated
with experimental works to validate the numericalmodels proposed. In a closed mold process such asRTM the online monitoring of temperature, pressure ordegree of cure for instance is not an easy task. A fewtechniques are now well accepted and well documented.For the online monitoring of temperature the use ofthermocouples seems the easiest solution [12].From this review it can be noticed that all the curing
experiments and simulations deal with composites rein-forced with synthetic fibers. There are no such studiesinvolving natural fibers. Most of the papers focus on themechanical properties obtained using a specific processand only a few give some information about the flowand wetting part of the process. The purpose of thiswork is to provide a model predicting the cure behaviorof a natural fiber composites and to optimize the RTMprocess to obtain a high degree of cure in a minimumtime.
2. Experiments
2.1. Resin transfer molding
A number of polyester/natural fiber composites weremanufactured in the lab. The final dimensions of theparts were 380 by 380 by 6.7 mm thick. The mold, made
entirely of aluminum, was opened and closed manuallywith 16 screws distributed around the cavity. The twoinlet ports were situated under the mold and a vent portwas located on the top (Fig. 1). It was kept at constanttemperature during the curing reaction by water flowinginside its upper and lower sections. The water, circulatedin a closed loop through a tank, was kept at constanttemperature with a temperature controller connected toa thermocouple and an immersion heater of 2000 watts.To compensate for the heat produced during theexothermic crosslinking reaction cold water was keptrunning permanently in a copper coil placed in the tank.This system balanced itself around the preset temperatureduring the experiment. It should be noted that thethickness of the composite was defined by a frameplaced between the upper and lower sections of themold; it could therefore be modified in furtherexperiments.Prior to a typical experiment the surfaces of the mold
were cleaned with the Frekote1 PM mold cleaner andthen coated with the Frekote1 B-15 Sealer and theFrekote1 700-NC mold release agent. Once these coat-ings were cured layers of natural fibers’ mats having themold’s size were placed in the cavity. The mold wastightly closed and a vacuum of 725 mm of mercury wascreated in the cavity through the vent port connected toa venturi aspirator placed on a tap. At this point thefibers were dried for 2 h by circulating water at 55 �C.The mold was then cooled down with cold water. In themeantime the resin was mixed with the initiator andplaced in the injection pot. From there the resin wasinjected in the mold with compressed air at a constantgauge pressure of 1.72�105 Pa. This pressure was keptconstant in the pressure pot by continuously adjustingmanually the compressed air valve. The injection timeof course varied with the amount of fibers present in themold. This will be commented in the discussion part ofthis paper. Once the resin was observed at the outlet, thevent port was closed. A small flask was placed betweenthe vent port and the tap for safety, to prevent any resinfrom flowing to the tap water. The resin was left flowingat the inlet for 5 min more to make sure that the moldwas filled completely. Then the inlet ports were closed aswell and hot water at constant temperature was circu-lated in the mold. The composite was cured under theseconditions for 1 h. Meanwhile the injection pot and allthe tubes were cleaned with acetone to avoid any clog-ging due to cured resin.The evolution of temperatures in the part was monitored
at four different locations with bare type T thermocouples.One wire was situated at the wall of the mold’s cavityand the three others at evenly spaced positions betweenthe surface and the center of the part. After eachexperiment a new set of thermocouple wires had to beused. The signals from the wires were recorded on acomputer through a data acquisition system.
632 D. Rouison et al. / Composites Science and Technology 64 (2004) 629–644
2.2. Thermophysical properties
A good knowledge of the composites’ thermophysicalproperties is essential to predict accurately the curingbehavior of the resin in the mold. The densities of theliquid resin and composite parts with different fibercontents were measured by weighing samples of wellknown volumes. The thermal properties at differentfiber contents were measured for the solid compositeusing the k-a apparatus described by Couturier etal.[20]. The steady state portion of one experiment wasused to obtain the thermal conductivity (k) of the partwhereas the transient portion allowed to calculate(�kCp)
1/2 and hence get the heat capacity (Cp). Howeverit is well known that thermal properties of plastics varywith temperature as well as the degree of cure. A briefstudy of these variations seemed therefore necessary toevaluate their magnitude. First the thermal conductivityof the liquid resin was measured using the hot wiremethod [21].The evolution of Cp with temperature for the solid
and liquid resin was measured using a differential scan-ning calorimeter (DSC) TA Instruments DSC 2010 fol-lowing the Standard ASTM Method E1269-99. Asimilar experiment was performed for the fibers as well.The measurements were taken between 25 and 200 �C ata heating rate of 10 �C. The variations of the resin’s Cp
with the degree of cure were recorded at 35 �C using amodulated temperature differential scanning calorimeter(MTDSC) TA Instruments DSC 2920 with a tempera-ture modulation of 0.5 �C every 80 s. Van Assche etal.[22] gave a detailed description of this method appliedto thermosetting systems.Finally the moisture content of the fibers, which is
another essential parameter, was determined as a func-tion of the relative humidity. Various saturated saltsolutions were prepared in sealed buckets to have con-stant relative humidity environments. Three fiber matsamples, previously dried at 105 �C for 2 h and weighed,were kept in these buckets for 48 h. They were thenweighed again and their moisture content was calcu-lated. Table 1 summarizes the different salt solutionused and the relative humidity achieved. The rate ofmoisture absorption by the fibers was also determined.Various fiber mat samples were dried at 105 �C for 2 hand then swiftly placed on a scale where the weight’s
evolution with time was recorded. These experimentswere performed in a standard room at 23 �C, 50%RH.
2.3. Mechanical properties
The tensile and flexural strength of the compositeswere determined using a SATEC T10000 MaterialsTesting System. The tensile properties of the materialswere measured following the ASTM standard methodD638-99. The flexural properties were obtained accord-ing to the ASTM standard method D790-99. The sizeand shape of the different samples were chosen depend-ing of their thickness as mentioned in these methods.
2.4. Materials
In this study the commercial unsaturated polyesterresin Stypol 040-8086 from Cook Composites andPolymers was chosen. This resin is manufactured for usein closed mold processes such as RTM. It is a low vis-cosity resin, which starts reacting by addition of aninitiator. In this case the chosen initiator was MEKPDDM-9 from Ato-FINA. The resin manufacturerrecommends to use an initiator concentration between0.9 and 2.3% by weight. Therefore three different con-centrations were investigated during the kinetic study: 1,1.5 and 2%. Following this kinetic study it was decidedthat a MEKP concentration of 1.5% should give thebest results. As most commercial products this resincontains small amounts of inhibitor and promoters.The fibers used in this study were manufactured by
Flaxcraft, Inc. The Bastmat 100 was a 4 mm mat madeof 67% hemp fibers and 33% kenaf fibers.
3. Model
In this study a one-dimensional curing model wasused. The dimensions of the mold allowed the one-dimensional model to predict accurately the tempera-ture variations in the part at a reasonable distance fromits sides. If one wanted to predict the temperatures closeto the mold’s sides a two or three-dimensional modelwould have to be implemented. The process as well asthe nature of the resin permitted a few more assump-tions that simplified the problem greatly:
� the resin was assumed to start curing after thefilling process, once the mold was heated up. Thisis a valid assumption, even though the filling timeincreased with increasing fiber content, since themold was filled at a temperature between 15 and20 �C at which the resin did not cure right away[23].
� it was assumed that there was no significantdeformation during curing. The resin was
Table 1
Equilibrium relative humidity values for selected saturated aqueous
salt solutions
Temperature
(�C)
Magnesium nitrate
Mg(NO3)2 (%)
Sodium chloride
NaCl (%)
Potassium nitrate
KNO3 (%)
20
54.4�0.2 75.5�0.1 94.6�0.725
52.9�0.2 75.3�0.1 93.6�0.530
51.4�0.2 75.1�0.1 92.3�0.6D. Rouison et al. / Composites Science and Technology 64 (2004) 629–644 633
expected to shrink during curing, however thepresence of fibers limited this effect.
� the radiative and convective heat transfer wereneglected. For unsaturated polyester resin thechemical gelation (when a macroscopic networkis formed for the first time in the curing material)is known to occur at a conversion lower than 5%[24]. This effect added to the presence of fibers inthe composite limited greatly the effect of con-vection. The fact that the reaction took place in aclosed mold heated with water allowed to neglectradiative heat transfer.
With the assumptions made above the temperaturesolutions are based on Fourier’s heat conduction equa-tion for one-dimensional, transient heat transfer and aninternal heat generation term [16–18]:
�cCpc
@T
@t¼ kx
@2T
@x2þ@Q
@tð1Þ
where �c, Cpc and kx are density, heat capacity andthermal conductivity of the composite materialrespectively. These parameters depend on the fibercontent, the degree of cure of the resin and tempera-ture. The study of these thermophysical propertiesallowed to decide whether they should be kept con-stant or not. The results are presented and commentedlater.The heat generation source in Eq. (1) represents the
exothermic effect of the curing reaction. This term isdirectly related to the rate of cure by the followingequation:
dQ
dt¼ �rVrHu
d�
dtð2Þ
where � is the degree of cure, Hu the ultimate enthalpyof cure per unit mass of resin, Vr the volume fraction ofresin in the composite, �r the density of the resin andd�/dt the rate of cure reaction.The curing rate of the resin was studied by DSC in a
previous publication [23] using the following empiricalautocatalytic model:
d�
dt¼ k2�
m �max �ð Þn
ð3Þ
The different parameters were found to be tempera-ture dependent and were defined as follow for a 1.5%initiator concentration:
m ¼ 0:5 ð4Þ
k2 ¼ 50147:8 exp 43755:2
RT
� �ð5Þ
n ¼ 0:00022 T2 0:1155 Tþ 15:6181 ð6Þ
�max¼0:3339þ0:6661= 1þ exp T 284:725ð Þ=18:798ð Þð Þ
ð7Þ
The Crank–Nicholson finite difference method wasused to integrate the governing equations [25]. For aone-dimensional problem this method was shown to bevery stable with time step size. First the domain wasdivided in N1 equal intervals with the grid size being�x=e/(N1), where e is the thickness of the mold. Thenodes i=1 and i=N corresponded to the boundaries ofthe domain (the upper and lower wall of the mold’scavity). In the time domain the grid size was �t and theindex j was used to count the time, such as tj=j(�t).The partial differential equations in Eq. (1) were eval-uated at time tj+�t/2:
@T
@t
� �i;jþ1=2
�Ti;jþ1 Ti;j
Dtð8Þ
@2T
@x2
� �i;jþ1=2
�1
2
Tiþ1;j 2 Ti;j þ Ti1;j
Dxð Þ2
þTiþ1;jþ1 2 Ti;jþ1 þ Ti1;jþ1
Dxð Þ2
� �
ð9Þ
The source term in Eq. (1) could not be evaluated attj+�t/2, therefore, as an approximation, it was eval-uated at t using Eq. (2), giving:
�cCpc
@T
@t
� �i;jþ1=2
¼ kx@2T
@x2
� �i;jþ1=2
þ@Q
@t
� �i;j
ð10Þ
For each j this system had to be solved on all thespatial domain, for i=2..N1. The temperatures atthe wall (i=1 and i=N) were known as functions oftime and used as boundary conditions. This led to a(N2,N2) tridiagonal matrix that was solved usingthe Thomas algorithm [25]. Once the temperature inthe domain at tj+�t were found the cure rateexpression had to be integrated as well, to track thedegree of cure at each node. The degree of cure attj+�t was:
�i;jþ1 ¼ �i;j þd�
dt
� �i;jþ1
Dt ð11Þ
The cure rate was computed from Eq. (3), whichmade Eq. (11) nonlinear. A dichotomy method was usedto solve this system at each node.A Visual Basic code was written to solve all these
equations and compute the evolution of temperature,degree of cure and cure rate in the mold during a typicalexperiment. The wall temperature were measuredexperimentally and used as boundary conditions toincrease the accuracy of the modeling work.
634 D. Rouison et al. / Composites Science and Technology 64 (2004) 629–644
4. Results and discussion
4.1. Thermophysical properties
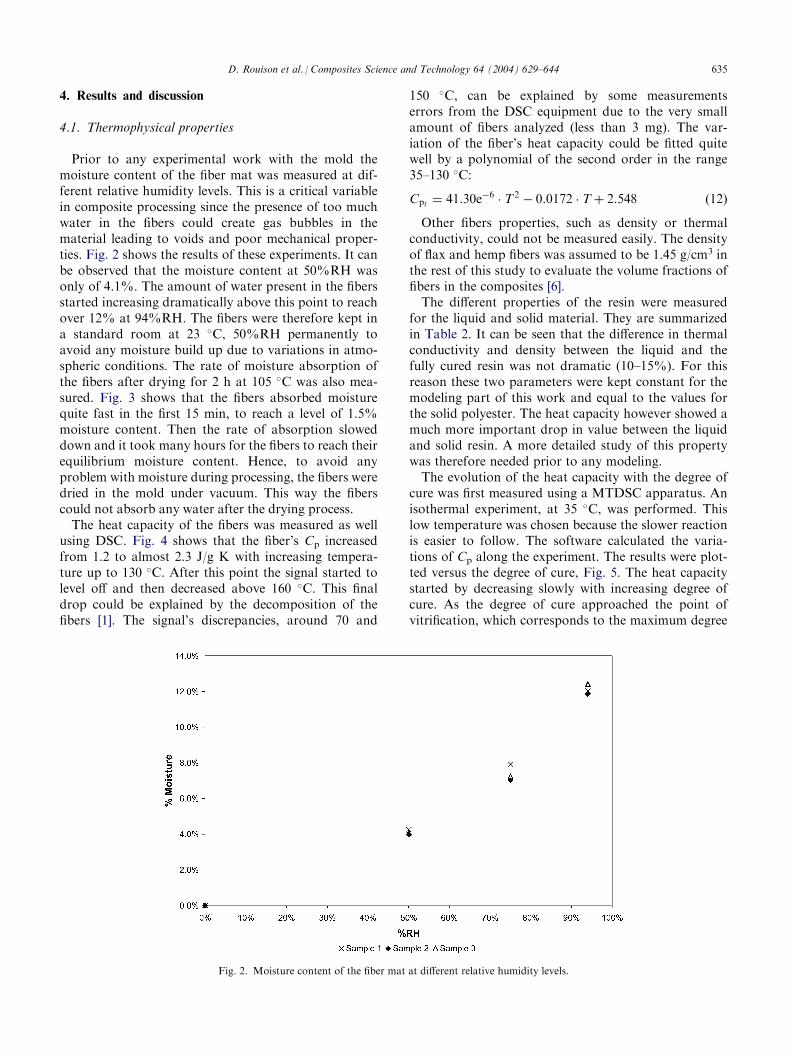
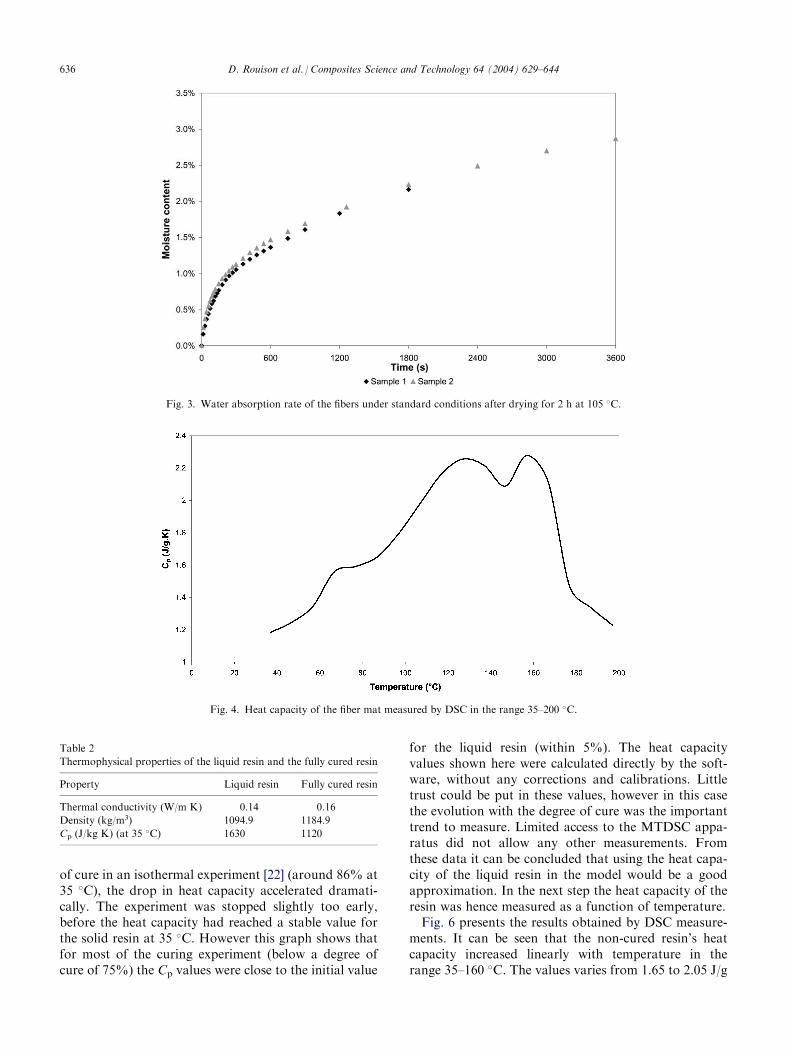
Prior to any experimental work with the mold themoisture content of the fiber mat was measured at dif-ferent relative humidity levels. This is a critical variablein composite processing since the presence of too muchwater in the fibers could create gas bubbles in thematerial leading to voids and poor mechanical proper-ties. Fig. 2 shows the results of these experiments. It canbe observed that the moisture content at 50%RH wasonly of 4.1%. The amount of water present in the fibersstarted increasing dramatically above this point to reachover 12% at 94%RH. The fibers were therefore kept ina standard room at 23 �C, 50%RH permanently toavoid any moisture build up due to variations in atmo-spheric conditions. The rate of moisture absorption ofthe fibers after drying for 2 h at 105 �C was also mea-sured. Fig. 3 shows that the fibers absorbed moisturequite fast in the first 15 min, to reach a level of 1.5%moisture content. Then the rate of absorption sloweddown and it took many hours for the fibers to reach theirequilibrium moisture content. Hence, to avoid anyproblem with moisture during processing, the fibers weredried in the mold under vacuum. This way the fiberscould not absorb any water after the drying process.The heat capacity of the fibers was measured as well
using DSC. Fig. 4 shows that the fiber’s Cp increasedfrom 1.2 to almost 2.3 J/g K with increasing tempera-ture up to 130 �C. After this point the signal started tolevel off and then decreased above 160 �C. This finaldrop could be explained by the decomposition of thefibers [1]. The signal’s discrepancies, around 70 and
150 �C, can be explained by some measurementserrors from the DSC equipment due to the very smallamount of fibers analyzed (less than 3 mg). The var-iation of the fiber’s heat capacity could be fitted quitewell by a polynomial of the second order in the range35–130 �C:
Cpf ¼ 41:30e6 T2 0:0172 Tþ 2:548 ð12Þ
Other fibers properties, such as density or thermalconductivity, could not be measured easily. The densityof flax and hemp fibers was assumed to be 1.45 g/cm3 inthe rest of this study to evaluate the volume fractions offibers in the composites [6].The different properties of the resin were measured
for the liquid and solid material. They are summarizedin Table 2. It can be seen that the difference in thermalconductivity and density between the liquid and thefully cured resin was not dramatic (10–15%). For thisreason these two parameters were kept constant for themodeling part of this work and equal to the values forthe solid polyester. The heat capacity however showed amuch more important drop in value between the liquidand solid resin. A more detailed study of this propertywas therefore needed prior to any modeling.The evolution of the heat capacity with the degree of
cure was first measured using a MTDSC apparatus. Anisothermal experiment, at 35 �C, was performed. Thislow temperature was chosen because the slower reactionis easier to follow. The software calculated the varia-tions of Cp along the experiment. The results were plot-ted versus the degree of cure, Fig. 5. The heat capacitystarted by decreasing slowly with increasing degree ofcure. As the degree of cure approached the point ofvitrification, which corresponds to the maximum degree
Fig. 2. Moisture content of the fiber mat at different relative humidity levels.
D. Rouison et al. / Composites Science and Technology 64 (2004) 629–644 635
of cure in an isothermal experiment [22] (around 86% at35 �C), the drop in heat capacity accelerated dramati-cally. The experiment was stopped slightly too early,before the heat capacity had reached a stable value forthe solid resin at 35 �C. However this graph shows thatfor most of the curing experiment (below a degree ofcure of 75%) the Cp values were close to the initial value
for the liquid resin (within 5%). The heat capacityvalues shown here were calculated directly by the soft-ware, without any corrections and calibrations. Littletrust could be put in these values, however in this casethe evolution with the degree of cure was the importanttrend to measure. Limited access to the MTDSC appa-ratus did not allow any other measurements. Fromthese data it can be concluded that using the heat capa-city of the liquid resin in the model would be a goodapproximation. In the next step the heat capacity of theresin was hence measured as a function of temperature.Fig. 6 presents the results obtained by DSC measure-
ments. It can be seen that the non-cured resin’s heatcapacity increased linearly with temperature in therange 35–160 �C. The values varies from 1.65 to 2.05 J/g
Fig. 3. Water absorption rate of the fibers under standard conditions after drying for 2 h at 105 �C.
Fig. 4. Heat capacity of the fiber mat measured by DSC in the range 35–200 �C.
Table 2
Thermophysical properties of the liquid resin and the fully cured resin
Property
Liquid resin Fully cured resinThermal conductivity (W/m K)
0.14 0.16Density (kg/m3)
1094.9 1184.9Cp (J/kg K) (at 35 �C)
1630 1120636 D. Rouison et al. / Composites Science and Technology 64 (2004) 629–644
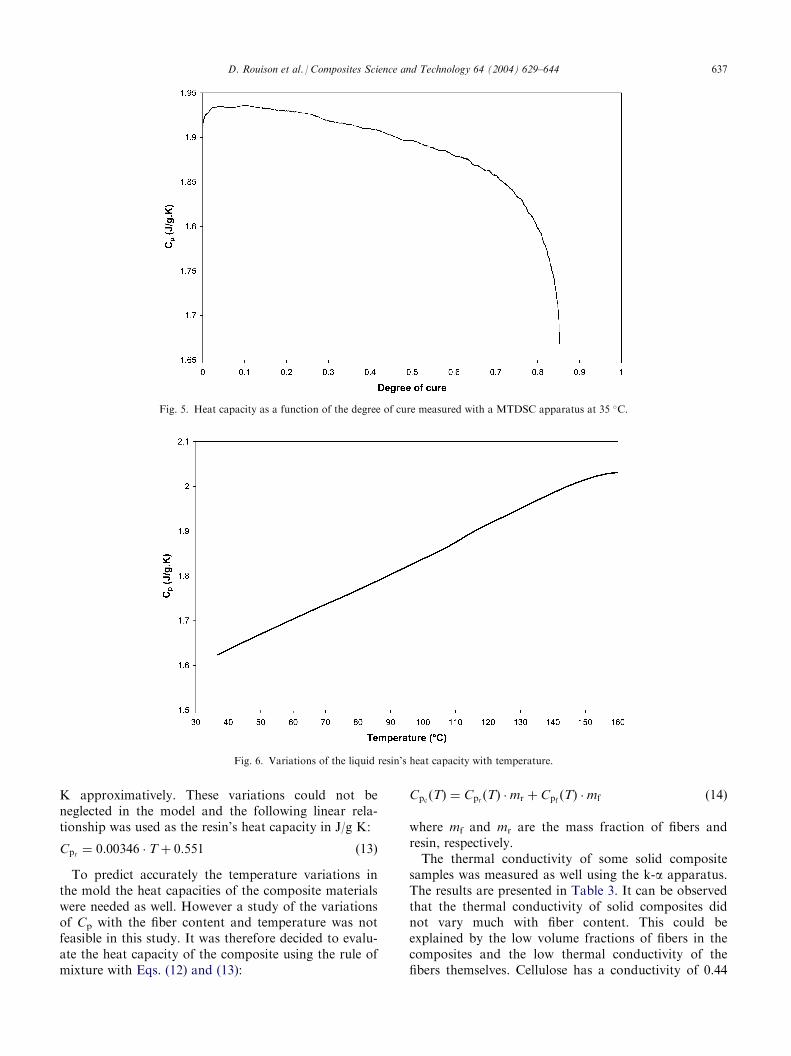
K approximatively. These variations could not beneglected in the model and the following linear rela-tionship was used as the resin’s heat capacity in J/g K:
Cpr ¼ 0:00346 Tþ 0:551 ð13Þ
To predict accurately the temperature variations inthe mold the heat capacities of the composite materialswere needed as well. However a study of the variationsof Cp with the fiber content and temperature was notfeasible in this study. It was therefore decided to evalu-ate the heat capacity of the composite using the rule ofmixture with Eqs. (12) and (13):
Cpc Tð Þ ¼ Cpr Tð Þ mr þ Cpf Tð Þ mf ð14Þ
where mf and mr are the mass fraction of fibers andresin, respectively.The thermal conductivity of some solid composite
samples was measured as well using the k-a apparatus.The results are presented in Table 3. It can be observedthat the thermal conductivity of solid composites didnot vary much with fiber content. This could beexplained by the low volume fractions of fibers in thecomposites and the low thermal conductivity of thefibers themselves. Cellulose has a conductivity of 0.44
Fig. 5. Heat capacity as a function of the degree of cure measured with a MTDSC apparatus at 35 �C.
Fig. 6. Variations of the liquid resin’s heat capacity with temperature.
D. Rouison et al. / Composites Science and Technology 64 (2004) 629–644 637
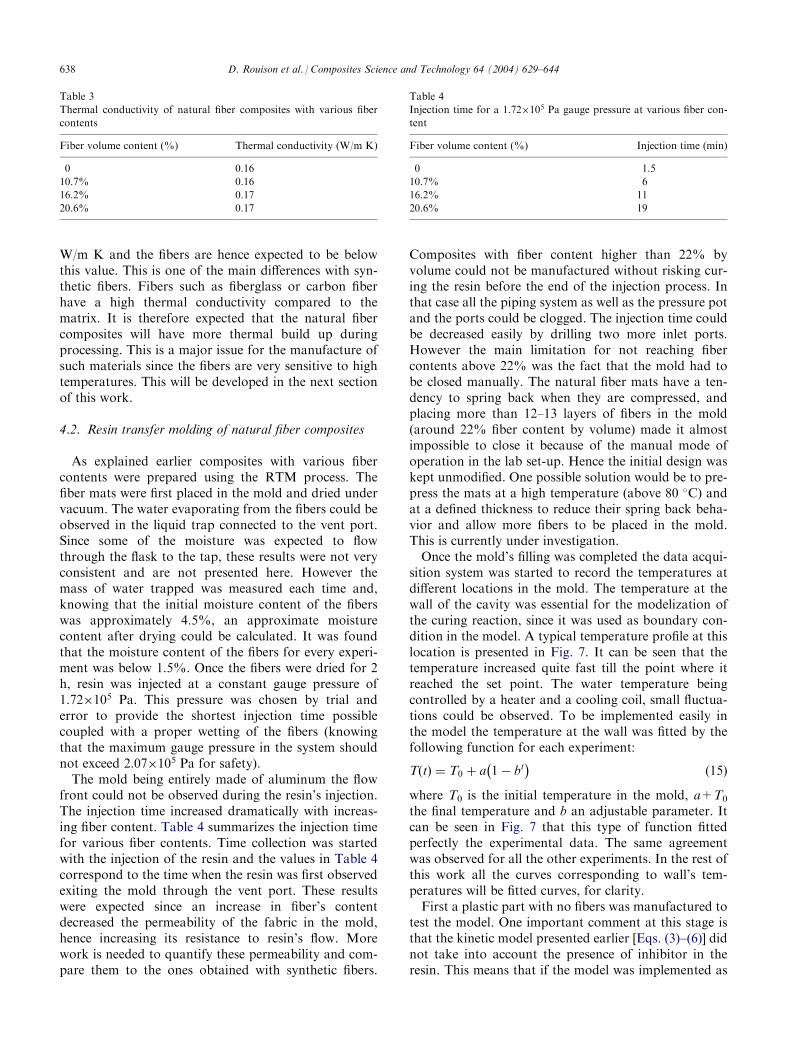
W/m K and the fibers are hence expected to be belowthis value. This is one of the main differences with syn-thetic fibers. Fibers such as fiberglass or carbon fiberhave a high thermal conductivity compared to thematrix. It is therefore expected that the natural fibercomposites will have more thermal build up duringprocessing. This is a major issue for the manufacture ofsuch materials since the fibers are very sensitive to hightemperatures. This will be developed in the next sectionof this work.
4.2. Resin transfer molding of natural fiber composites
As explained earlier composites with various fibercontents were prepared using the RTM process. Thefiber mats were first placed in the mold and dried undervacuum. The water evaporating from the fibers could beobserved in the liquid trap connected to the vent port.Since some of the moisture was expected to flowthrough the flask to the tap, these results were not veryconsistent and are not presented here. However themass of water trapped was measured each time and,knowing that the initial moisture content of the fiberswas approximately 4.5%, an approximate moisturecontent after drying could be calculated. It was foundthat the moisture content of the fibers for every experi-ment was below 1.5%. Once the fibers were dried for 2h, resin was injected at a constant gauge pressure of1.72�105 Pa. This pressure was chosen by trial anderror to provide the shortest injection time possiblecoupled with a proper wetting of the fibers (knowingthat the maximum gauge pressure in the system shouldnot exceed 2.07�105 Pa for safety).The mold being entirely made of aluminum the flow
front could not be observed during the resin’s injection.The injection time increased dramatically with increas-ing fiber content. Table 4 summarizes the injection timefor various fiber contents. Time collection was startedwith the injection of the resin and the values in Table 4correspond to the time when the resin was first observedexiting the mold through the vent port. These resultswere expected since an increase in fiber’s contentdecreased the permeability of the fabric in the mold,hence increasing its resistance to resin’s flow. Morework is needed to quantify these permeability and com-pare them to the ones obtained with synthetic fibers.
Composites with fiber content higher than 22% byvolume could not be manufactured without risking cur-ing the resin before the end of the injection process. Inthat case all the piping system as well as the pressure potand the ports could be clogged. The injection time couldbe decreased easily by drilling two more inlet ports.However the main limitation for not reaching fibercontents above 22% was the fact that the mold had tobe closed manually. The natural fiber mats have a ten-dency to spring back when they are compressed, andplacing more than 12–13 layers of fibers in the mold(around 22% fiber content by volume) made it almostimpossible to close it because of the manual mode ofoperation in the lab set-up. Hence the initial design waskept unmodified. One possible solution would be to pre-press the mats at a high temperature (above 80 �C) andat a defined thickness to reduce their spring back beha-vior and allow more fibers to be placed in the mold.This is currently under investigation.Once the mold’s filling was completed the data acqui-
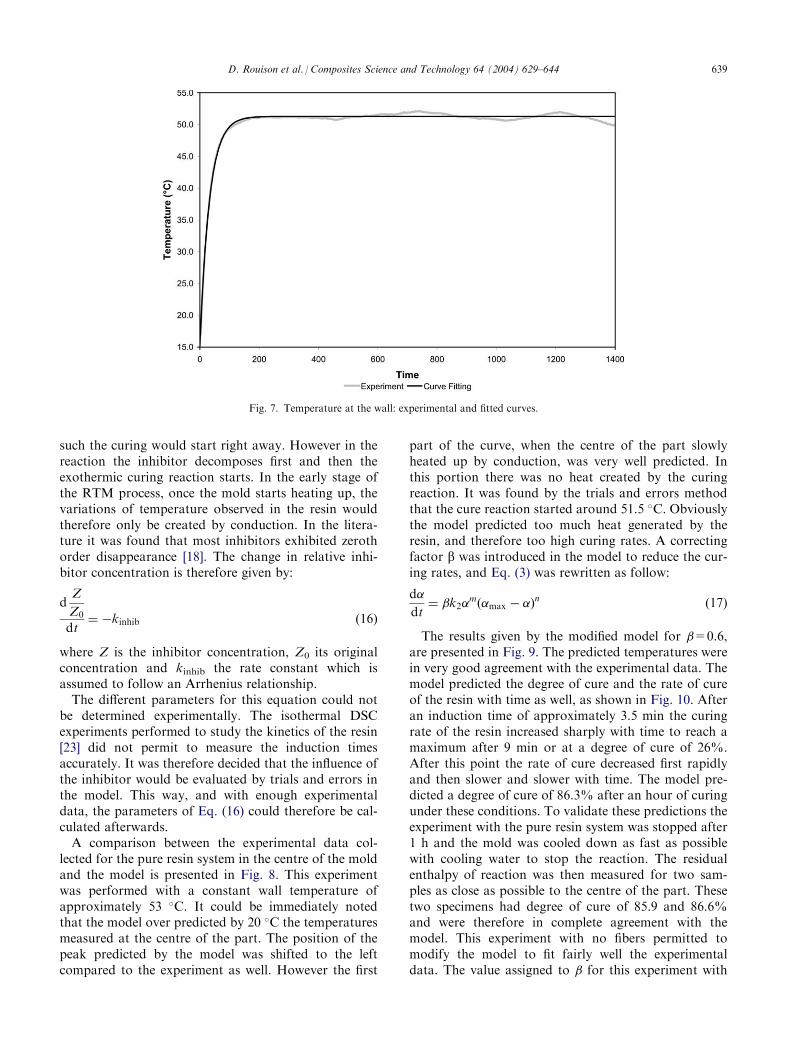
sition system was started to record the temperatures atdifferent locations in the mold. The temperature at thewall of the cavity was essential for the modelization ofthe curing reaction, since it was used as boundary con-dition in the model. A typical temperature profile at thislocation is presented in Fig. 7. It can be seen that thetemperature increased quite fast till the point where itreached the set point. The water temperature beingcontrolled by a heater and a cooling coil, small fluctua-tions could be observed. To be implemented easily inthe model the temperature at the wall was fitted by thefollowing function for each experiment:
T tð Þ ¼ T0 þ a 1 bt� �
ð15Þ
where T0 is the initial temperature in the mold, a+T0
the final temperature and b an adjustable parameter. Itcan be seen in Fig. 7 that this type of function fittedperfectly the experimental data. The same agreementwas observed for all the other experiments. In the rest ofthis work all the curves corresponding to wall’s tem-peratures will be fitted curves, for clarity.First a plastic part with no fibers was manufactured to
test the model. One important comment at this stage isthat the kinetic model presented earlier [Eqs. (3)–(6)] didnot take into account the presence of inhibitor in theresin. This means that if the model was implemented as
Table 3
Thermal conductivity of natural fiber composites with various fiber
contents
Fiber volume content (%)
Thermal conductivity (W/m K)0
0.1610.7%
0.1616.2%
0.1720.6%
0.17Table 4
Injection time for a 1.72�105 Pa gauge pressure at various fiber con-
tent
Fiber volume content (%)
Injection time (min)0
1.510.7%
616.2%
1120.6%
19638 D. Rouison et al. / Composites Science and Technology 64 (2004) 629–644
such the curing would start right away. However in thereaction the inhibitor decomposes first and then theexothermic curing reaction starts. In the early stage ofthe RTM process, once the mold starts heating up, thevariations of temperature observed in the resin wouldtherefore only be created by conduction. In the litera-ture it was found that most inhibitors exhibited zerothorder disappearance [18]. The change in relative inhi-bitor concentration is therefore given by:
dZ
Z0
dt¼ kinhib ð16Þ
where Z is the inhibitor concentration, Z0 its originalconcentration and kinhib the rate constant which isassumed to follow an Arrhenius relationship.The different parameters for this equation could not
be determined experimentally. The isothermal DSCexperiments performed to study the kinetics of the resin[23] did not permit to measure the induction timesaccurately. It was therefore decided that the influence ofthe inhibitor would be evaluated by trials and errors inthe model. This way, and with enough experimentaldata, the parameters of Eq. (16) could therefore be cal-culated afterwards.A comparison between the experimental data col-
lected for the pure resin system in the centre of the moldand the model is presented in Fig. 8. This experimentwas performed with a constant wall temperature ofapproximately 53 �C. It could be immediately notedthat the model over predicted by 20 �C the temperaturesmeasured at the centre of the part. The position of thepeak predicted by the model was shifted to the leftcompared to the experiment as well. However the first
part of the curve, when the centre of the part slowlyheated up by conduction, was very well predicted. Inthis portion there was no heat created by the curingreaction. It was found by the trials and errors methodthat the cure reaction started around 51.5 �C. Obviouslythe model predicted too much heat generated by theresin, and therefore too high curing rates. A correctingfactor b was introduced in the model to reduce the cur-ing rates, and Eq. (3) was rewritten as follow:
d�
dt¼ �k2�
m �max �ð Þn
ð17Þ
The results given by the modified model for �=0.6,are presented in Fig. 9. The predicted temperatures werein very good agreement with the experimental data. Themodel predicted the degree of cure and the rate of cureof the resin with time as well, as shown in Fig. 10. Afteran induction time of approximately 3.5 min the curingrate of the resin increased sharply with time to reach amaximum after 9 min or at a degree of cure of 26%.After this point the rate of cure decreased first rapidlyand then slower and slower with time. The model pre-dicted a degree of cure of 86.3% after an hour of curingunder these conditions. To validate these predictions theexperiment with the pure resin system was stopped after1 h and the mold was cooled down as fast as possiblewith cooling water to stop the reaction. The residualenthalpy of reaction was then measured for two sam-ples as close as possible to the centre of the part. Thesetwo specimens had degree of cure of 85.9 and 86.6%and were therefore in complete agreement with themodel. This experiment with no fibers permitted tomodify the model to fit fairly well the experimentaldata. The value assigned to � for this experiment with
Fig. 7. Temperature at the wall: experimental and fitted curves.
D. Rouison et al. / Composites Science and Technology 64 (2004) 629–644 639
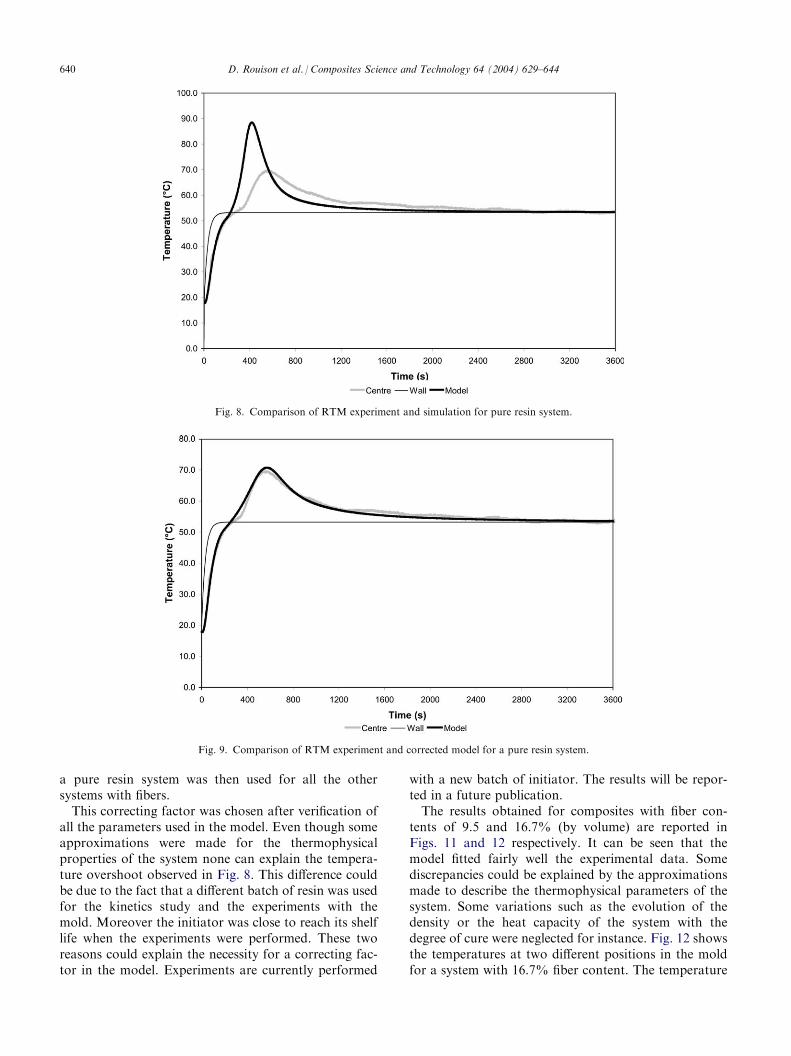
a pure resin system was then used for all the othersystems with fibers.This correcting factor was chosen after verification of
all the parameters used in the model. Even though someapproximations were made for the thermophysicalproperties of the system none can explain the tempera-ture overshoot observed in Fig. 8. This difference couldbe due to the fact that a different batch of resin was usedfor the kinetics study and the experiments with themold. Moreover the initiator was close to reach its shelflife when the experiments were performed. These tworeasons could explain the necessity for a correcting fac-tor in the model. Experiments are currently performed
with a new batch of initiator. The results will be repor-ted in a future publication.The results obtained for composites with fiber con-
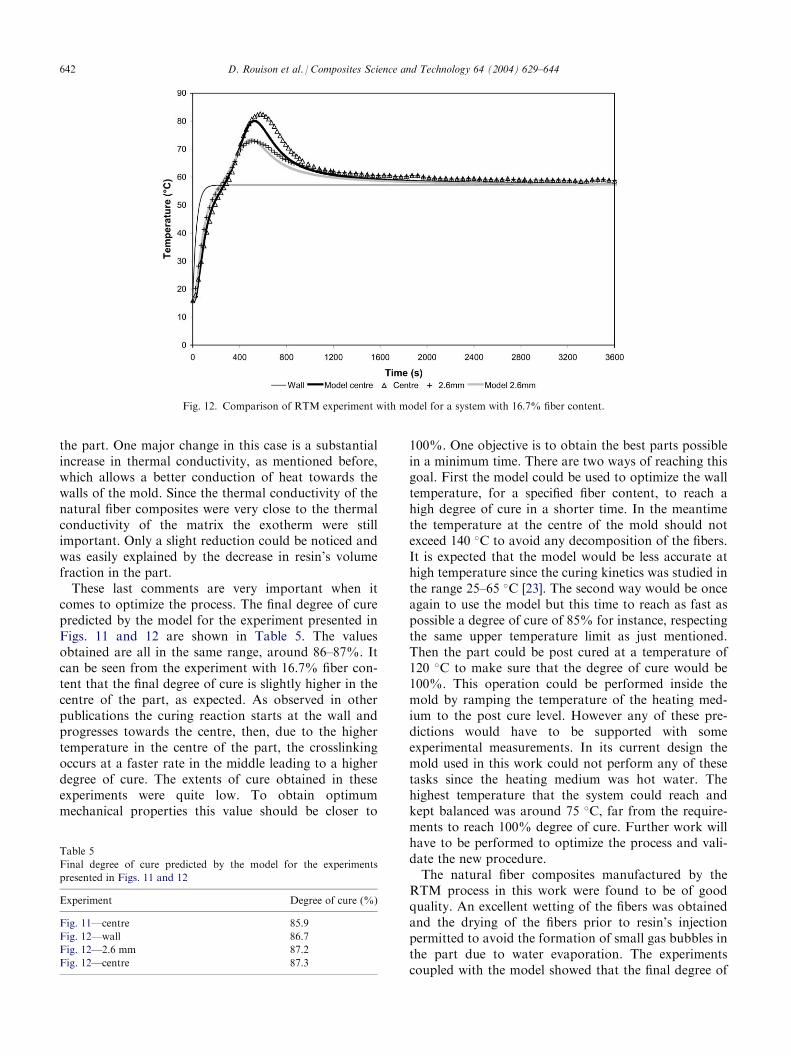
tents of 9.5 and 16.7% (by volume) are reported inFigs. 11 and 12 respectively. It can be seen that themodel fitted fairly well the experimental data. Somediscrepancies could be explained by the approximationsmade to describe the thermophysical parameters of thesystem. Some variations such as the evolution of thedensity or the heat capacity of the system with thedegree of cure were neglected for instance. Fig. 12 showsthe temperatures at two different positions in the moldfor a system with 16.7% fiber content. The temperature
Fig. 8. Comparison of RTM experiment and simulation for pure resin system.
Fig. 9. Comparison of RTM experiment and corrected model for a pure resin system.
640 D. Rouison et al. / Composites Science and Technology 64 (2004) 629–644
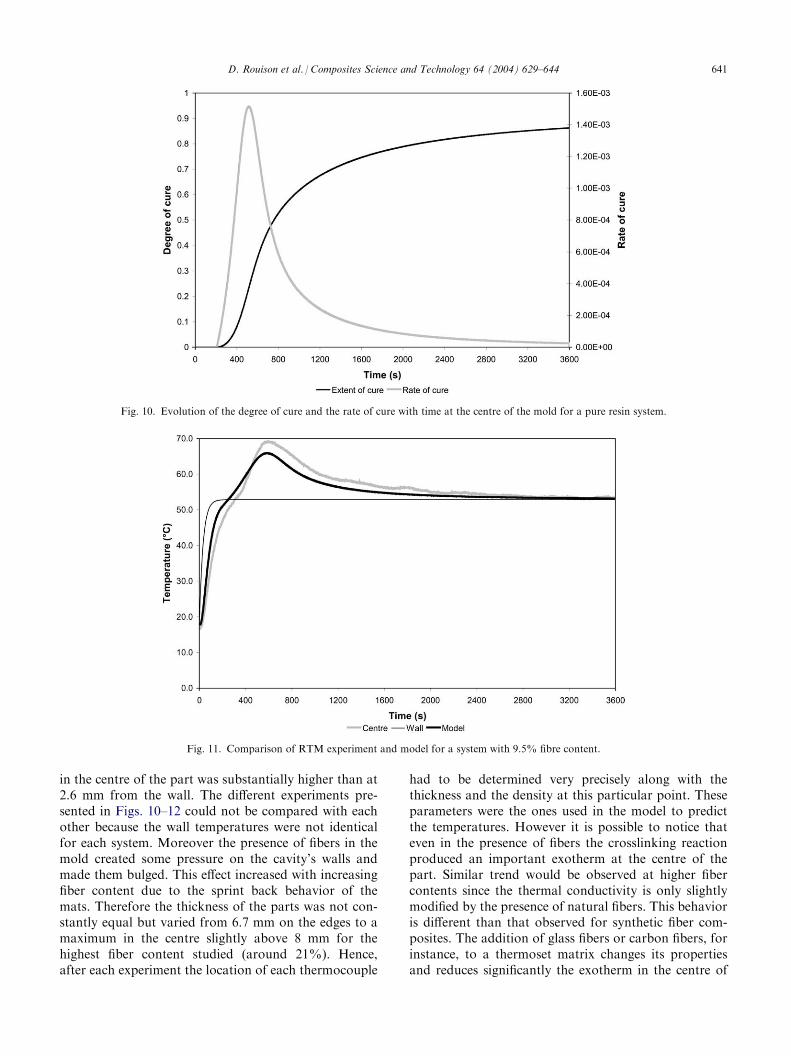
in the centre of the part was substantially higher than at2.6 mm from the wall. The different experiments pre-sented in Figs. 10–12 could not be compared with eachother because the wall temperatures were not identicalfor each system. Moreover the presence of fibers in themold created some pressure on the cavity’s walls andmade them bulged. This effect increased with increasingfiber content due to the sprint back behavior of themats. Therefore the thickness of the parts was not con-stantly equal but varied from 6.7 mm on the edges to amaximum in the centre slightly above 8 mm for thehighest fiber content studied (around 21%). Hence,after each experiment the location of each thermocouple
had to be determined very precisely along with thethickness and the density at this particular point. Theseparameters were the ones used in the model to predictthe temperatures. However it is possible to notice thateven in the presence of fibers the crosslinking reactionproduced an important exotherm at the centre of thepart. Similar trend would be observed at higher fibercontents since the thermal conductivity is only slightlymodified by the presence of natural fibers. This behavioris different than that observed for synthetic fiber com-posites. The addition of glass fibers or carbon fibers, forinstance, to a thermoset matrix changes its propertiesand reduces significantly the exotherm in the centre of
Fig. 10. Evolution of the degree of cure and the rate of cure with time at the centre of the mold for a pure resin system.
Fig. 11. Comparison of RTM experiment and model for a system with 9.5% fibre content.
D. Rouison et al. / Composites Science and Technology 64 (2004) 629–644 641
the part. One major change in this case is a substantialincrease in thermal conductivity, as mentioned before,which allows a better conduction of heat towards thewalls of the mold. Since the thermal conductivity of thenatural fiber composites were very close to the thermalconductivity of the matrix the exotherm were stillimportant. Only a slight reduction could be noticed andwas easily explained by the decrease in resin’s volumefraction in the part.These last comments are very important when it
comes to optimize the process. The final degree of curepredicted by the model for the experiment presented inFigs. 11 and 12 are shown in Table 5. The valuesobtained are all in the same range, around 86–87%. Itcan be seen from the experiment with 16.7% fiber con-tent that the final degree of cure is slightly higher in thecentre of the part, as expected. As observed in otherpublications the curing reaction starts at the wall andprogresses towards the centre, then, due to the highertemperature in the centre of the part, the crosslinkingoccurs at a faster rate in the middle leading to a higherdegree of cure. The extents of cure obtained in theseexperiments were quite low. To obtain optimummechanical properties this value should be closer to
100%. One objective is to obtain the best parts possiblein a minimum time. There are two ways of reaching thisgoal. First the model could be used to optimize the walltemperature, for a specified fiber content, to reach ahigh degree of cure in a shorter time. In the meantimethe temperature at the centre of the mold should notexceed 140 �C to avoid any decomposition of the fibers.It is expected that the model would be less accurate athigh temperature since the curing kinetics was studied inthe range 25–65 �C [23]. The second way would be onceagain to use the model but this time to reach as fast aspossible a degree of cure of 85% for instance, respectingthe same upper temperature limit as just mentioned.Then the part could be post cured at a temperature of120 �C to make sure that the degree of cure would be100%. This operation could be performed inside themold by ramping the temperature of the heating med-ium to the post cure level. However any of these pre-dictions would have to be supported with someexperimental measurements. In its current design themold used in this work could not perform any of thesetasks since the heating medium was hot water. Thehighest temperature that the system could reach andkept balanced was around 75 �C, far from the require-ments to reach 100% degree of cure. Further work willhave to be performed to optimize the process and vali-date the new procedure.The natural fiber composites manufactured by the
RTM process in this work were found to be of goodquality. An excellent wetting of the fibers was obtainedand the drying of the fibers prior to resin’s injectionpermitted to avoid the formation of small gas bubbles inthe part due to water evaporation. The experimentscoupled with the model showed that the final degree of
Fig. 12. Comparison of RTM experiment with model for a system with 16.7% fiber content.
Table 5
Final degree of cure predicted by the model for the experiments
presented in Figs. 11 and 12
Experiment
Degree of cure (%)Fig. 11—centre
85.9Fig. 12—wall
86.7Fig. 12—2.6 mm
87.2Fig. 12—centre
87.3642 D. Rouison et al. / Composites Science and Technology 64 (2004) 629–644
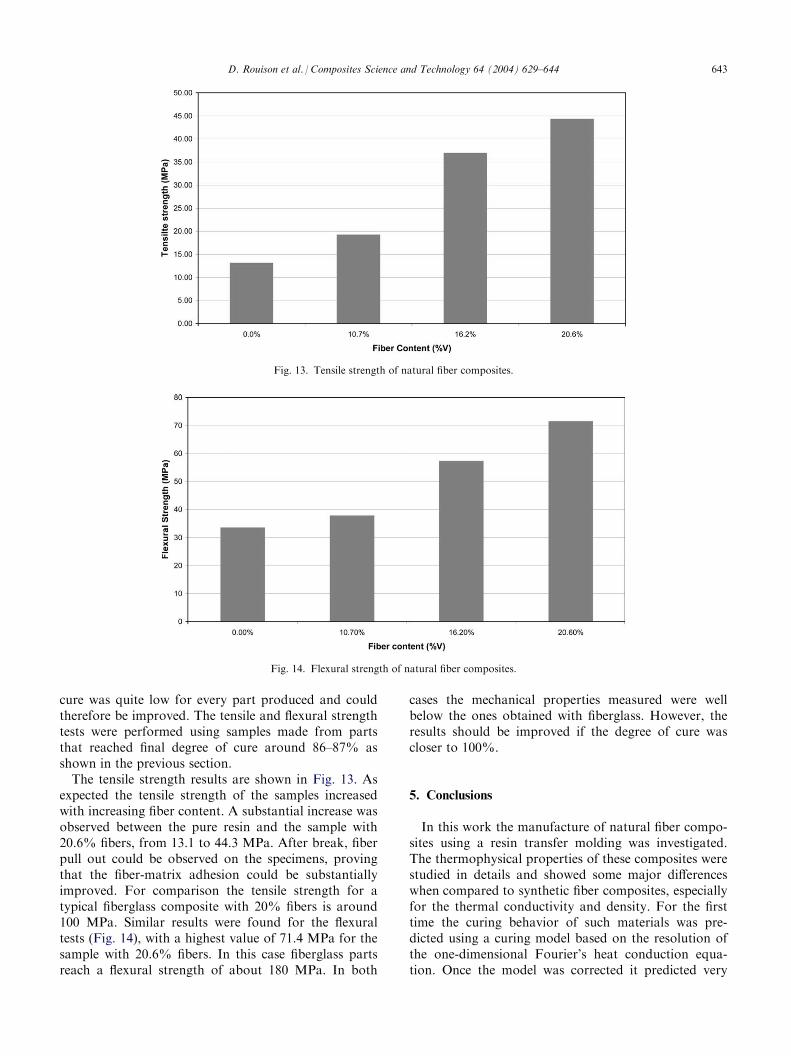
cure was quite low for every part produced and couldtherefore be improved. The tensile and flexural strengthtests were performed using samples made from partsthat reached final degree of cure around 86–87% asshown in the previous section.The tensile strength results are shown in Fig. 13. As
expected the tensile strength of the samples increasedwith increasing fiber content. A substantial increase wasobserved between the pure resin and the sample with20.6% fibers, from 13.1 to 44.3 MPa. After break, fiberpull out could be observed on the specimens, provingthat the fiber-matrix adhesion could be substantiallyimproved. For comparison the tensile strength for atypical fiberglass composite with 20% fibers is around100 MPa. Similar results were found for the flexuraltests (Fig. 14), with a highest value of 71.4 MPa for thesample with 20.6% fibers. In this case fiberglass partsreach a flexural strength of about 180 MPa. In both
cases the mechanical properties measured were wellbelow the ones obtained with fiberglass. However, theresults should be improved if the degree of cure wascloser to 100%.
5. Conclusions
In this work the manufacture of natural fiber compo-sites using a resin transfer molding was investigated.The thermophysical properties of these composites werestudied in details and showed some major differenceswhen compared to synthetic fiber composites, especiallyfor the thermal conductivity and density. For the firsttime the curing behavior of such materials was pre-dicted using a curing model based on the resolution ofthe one-dimensional Fourier’s heat conduction equa-tion. Once the model was corrected it predicted very
Fig. 13. Tensile strength of natural fiber composites.
Fig. 14. Flexural strength of natural fiber composites.
D. Rouison et al. / Composites Science and Technology 64 (2004) 629–644 643
well the temperatures in the mold. It was observed thatthe temperature in the centre of the mold increasedsubstantially compared to other kinds of compositesdue to their lower thermal conductivity. The degree ofcure in the parts was predicted as well. The values werefound to be below 90% for all cases, which is quite lowfor such materials. The model could be used to optimizethis process and find the proper procedure to producehighly cured parts in a minimum time.The parts obtained in this work were of good quality.
The drying process before the resin’s injection permittedto obtain a good wetting of the fibers as well as to avoidany formation of gas bubbles during curing. Themechanical properties of the specimens were acceptableand increased with the fiber content. However there is alot of room to improve these properties, first by makingsure that the matrix is fully cured and, more impor-tantly, by improving the fiber-matrix adhesion. But thiswill be the topic of another study.
Acknowledgements
The author sincerely acknowledges the financial sup-port from Network of Centre of Excellence-Auto 21-Canada, NSERC and Industry partners. Author wouldlike to take this opportunity to thank the techniciansKeith Rollins and Jody Chessie, for all their help tomake this work possible.
References
[1] Saheb DN, Jog JP. Natural fiber polymer composites: a review.
Advances in Polymer Technology 1999;18(4):351–63.
[2] Wielage B, Lampke TR, Marx G, Nestler K, Starke D. Thermo-
gravimetric and differential scanning calorimetric analysis of natural
fibres and polypropylene. Thermochimica Acta 1999;337:169–77.
[3] Bledzki AK, Gassan J. Composites reinforced with cellulose
based fibres. Progress in Polymer Science 1999;24:221–74.
[4] Li Y, Mai Y-W, Ye L. Sisal fibre and its composites: a review of
recent developments. Composites Science and Technology 2000;
60:2037–57.
[5] Van Voorn B, Smit HHG, Sinke RJ, de Klerk B. Natural fibre
reinforced sheet moulding compound. Composites: Part A 2001;
32:1271–9.
[6] Williams GI, Wool RP. Composites from natural fibers and soy
oil resins. Applied Composite Materials 2000;7:421–32.
[7] Wollerdorfer M, Bader H. Influence of natural fibres on the
mechanical properties of biodegradable polymers. Industrial
Crops and Products 1998;8:105–12.
[8] Richardson MOW, Zhang ZY. Experimental investigation and
flow visualization of the resin transfer mould filling process for
non-woven hemp reinforced phenolic composites. Composites:
part A 2000;31:1303–10.
[9] O’Dell JL. Natural fibers in resin transfer molded composites. In:
Proceedings Wood-Fiber-Plastics Composites Symposium, For-
est Prod. Soc. Madisson, WI, 1997. p. 280.
[10] Sebes G, Cetin NS, Hill CAS, Hugues M. RTM hemp fibre-rein-
forced polyester composites. Applied Composite Materials 2000;
7:341–9.
[11] Oksman K. High quality flax fibre composites manufactured by
the resin transfer moulding process. Journal of Reinforced Plas-
tics and Composites 2001;20(7):621–7.
[12] Lebrun G, Gauvin R. Experimental investigation of resin tem-
perature and pressure during filling and curing in a flat steel
RTM mould. Composites: part A 1996;27A:347–55.
[13] Lim ST, Lee WI. An analysis of the three dimensional resin
transfer mold filling process. Composites Science and Technology
2000;60:961–75.
[14] Simacek P, Sozer EM, Advani SG. Numerical simulations of
mold filling for design and control of RTM process. Annual
Technical Conference—ANTEC, Conference Proceedings 1998;
vol. 2, p.2327–35.
[15] Chiu H-T, Yu B, Chen SC, Lee LJ. Heat transfer during flow and
resin reaction through fiber reinforcement. Chemical Engineering
Science 2000;55:3365–76.
[16] Blest DS, Duffy BR, McKee S, Zulkifle AK. Curing simulation of
thermoset composites. Composites: part A 1999;30:1289–309.
[17] Bogetti TA, Gillepsie Jr JW. Two dimensional cure simulation of
thick thermosetting composites. Journal of Composite Materials
1991;25:239–73.
[18] Michaud DJ, Beris AN, Dhurjati PS. Curing behavior of thick
sectioned RTM composites. Journal of Composite Materials
1998;32(14):1273–96.
[19] Semling M, Channer K, Smith GF. Temperature optimization in
RTM. 43rd International SAMPE Symposium and Exhibition
(Anaheim, CA), 1998; 43(2):1289–301.
[20] Couturier MF, George K, Schneider MH. Thermophysical
properties of wood-polymer composites. Wood Science and
Technology 1996;30:179–96.
[21] Rouison D. Thermal transport in oriented polymer and fiberglass
composites. MscE thesis, Dept. of Chemical Engineering, Uni-
versity of New Brunswick, 2000.
[22] Van Assche G, Van Hemelrijck A, Rahier H, Van Mele B.
Modulated temperature differential scanning calorimetry: cure,
vitrification, and devitrification of thermosetting systems. Ther-
mochimica Acta 1997;304/305:317–34.
[23] Rouison D, Sain M, Couturier M. Kinetic study of an unsatu-
rated polyester resin containing an inhibitor. Journal of Applied
Polymer Science 2003;89:2553–61.
[24] Van Assche G, Verdonck E, Van Mele B. Interrelations
between mechanism, kinetics, and rheology in an isothermal
cross-linking chain-growth copolymerisation. Polymer 2001;42:
2959–68.
[25] Chapra SC, Canale RP. Numerical methods for engineers: with
programming and software applications. 3rd ed. Boston: WCB/
McGraw-Hill; 1998.
644 D. Rouison et al. / Composites Science and Technology 64 (2004) 629–644
![Resin transfer molding process: a numerical and … Resin transfer molding process: a numerical and experimental investigation gradient are the main factors [2], so their optimizations](https://img.pdfslide.us/doc/110x75/5aa25be67f8b9a436d8cdb13/resin-transfer-molding-process-a-numerical-and-resin-transfer-molding-process.jpg)