Embed Size (px)
Citation preview
Resilient through challenging timesMajor banks analysis – South Africa
PwC analysis of major banks’ results for the reporting period ended 30 June 2015
15 September 2015
www.pwc.co.za/banking
Contents
Major banks analysis – South Africa 15 September 2015
1. The big picture 1
2. Economic outlook 13
3. Net interest income 16
4. Non-interest revenue 20
5. Efficiency 23
6. Asset quality 25
7. Capital and funding 31
8. Project Blue 2.0 36
9. Hot off the press 40
10. Key banking statistics 42
11. Industry data 45
12. Contacts 48
Major banks analysis – South Africa 15 September2015 101PwC
Major banks in a minute
Operating costs
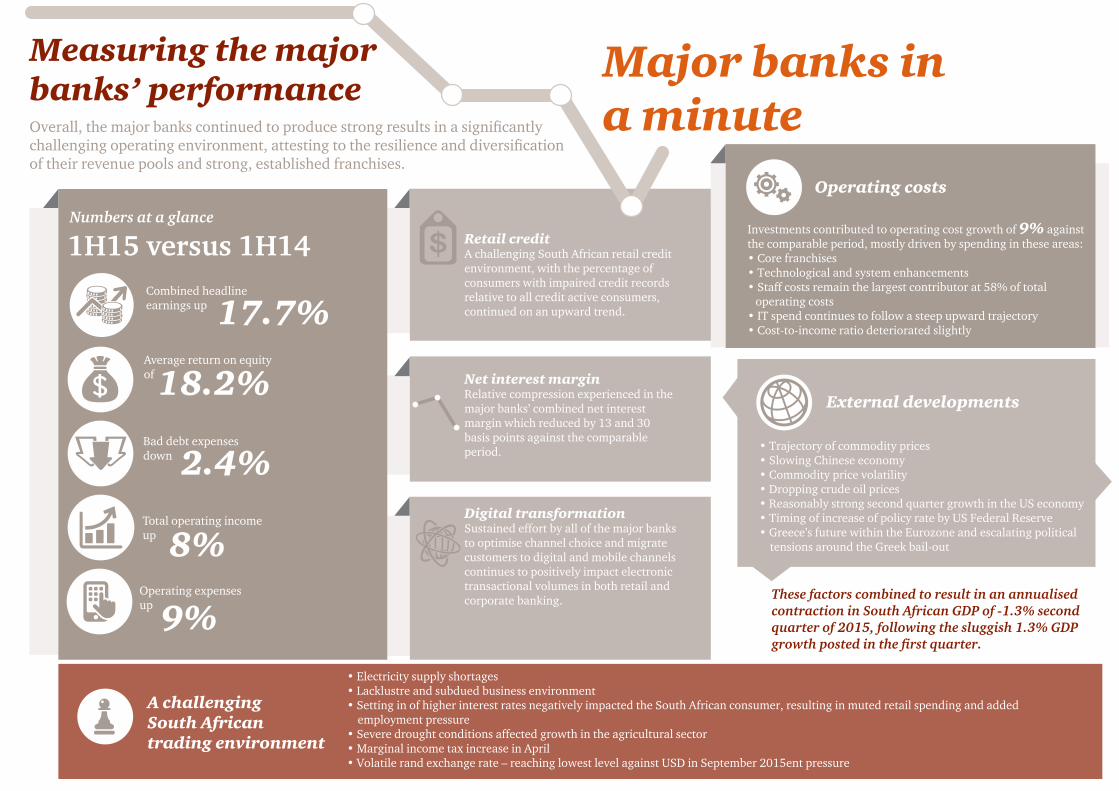
Overall, the major banks continued to produce strong results in a significantly challenging operating environment, attesting to the resilience and diversificationof their revenue pools and strong, established franchises.
Retail creditA challenging South African retail credit environment, with the percentage of consumers with impaired credit records relative to all credit active consumers, continued on an upward trend.
Investments contributed to operating cost growth of 9% against the comparable period, mostly driven by spending in these areas:• Core franchises• Technological and system enhancements• Staff costs remain the largest contributor at 58% of total operating costs• IT spend continues to follow a steep upward trajectory• Cost-to-income ratio deteriorated slightly
Net interest marginRelative compression experienced in the major banks’ combined net interest margin which reduced by 13 and 30 basis points against the comparable period.
Measuring the majorbanks’ performance
Total operating incomeup
Operating expensesup
Combined headline earnings up
Bad debt expensesdown
Numbers at a glance
17.7%
1H15 versus 1H14
8%
9%
2.4%
18.2%Average return on equityof
External developments
• Trajectory of commodity prices• Slowing Chinese economy• Commodity price volatility• Dropping crude oil prices• Reasonably strong second quarter growth in the US economy• Timing of increase of policy rate by US Federal Reserve• Greece’s future within the Eurozone and escalating political tensions around the Greek bail-out
Digital transformationSustained effort by all of the major banksto optimise channel choice and migrate customers to digital and mobile channels continues to positively impact electronic transactional volumes in both retail and corporate banking. These factors combined to result in an annualised
contraction in South African GDP of -1.3% second quarter of 2015, following the sluggish 1.3% GDP growth posted in the first quarter.
A challenging South African trading environment
• Electricity supply shortages• Lacklustre and subdued business environment• Setting in of higher interest rates negatively impacted the South African consumer, resulting in muted retail spending and added employment pressure• Severe drought conditions affected growth in the agricultural sector• Marginal income tax increase in April• Volatile rand exchange rate – reaching lowest level against USD in September 2015ent pressure
1PwCMajor banks analysis – South Africa 15 September 2015
Limpopo
Gauteng
Free State
Northern Cape
North West
Eastern Cape
Western Cape
KwaZulu-Natal
Mpumalanga
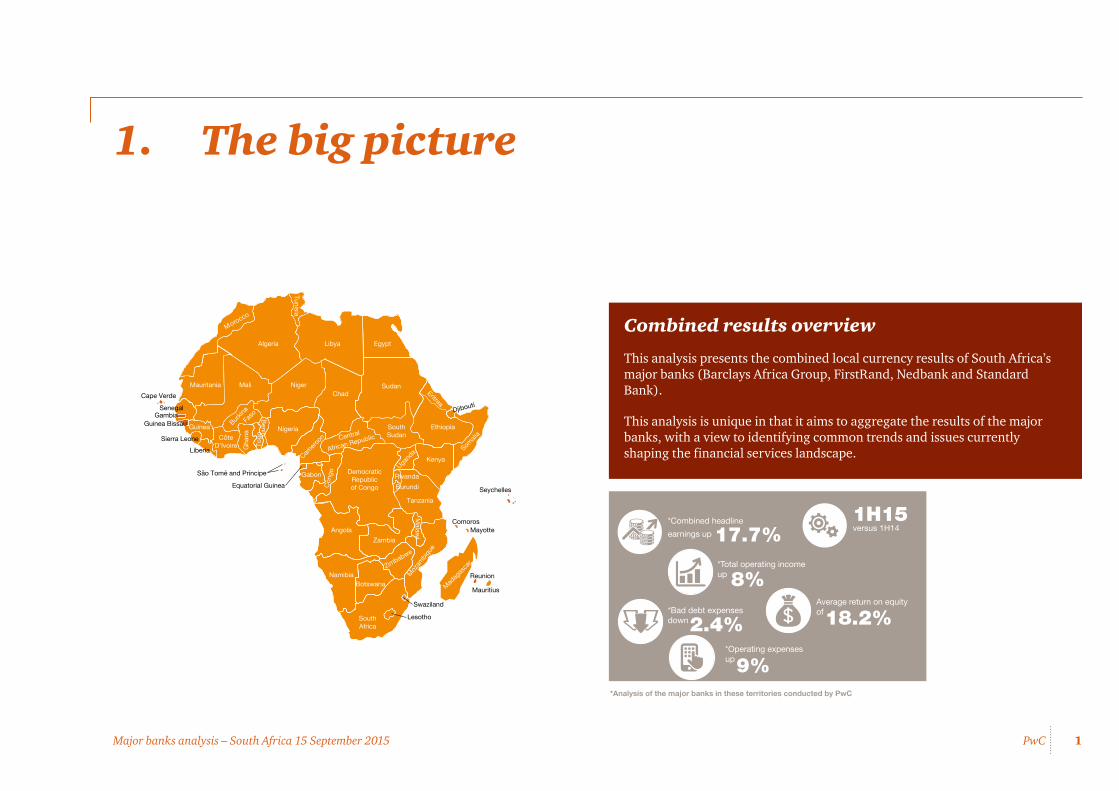
*Total operating incomeup
*Operating expensesup
*Combined headline
earnings up
*Bad debt expensesdown
SA major banks at a glance*
17.7%1H15versus 1H14
8%
9%
2.4% 18.2%
*Analysis of the major banks in these territories conducted by PwC
Average return on equityof
1. The big picture
Combined results overview
This analysis presents the combined local currency results of South Africa’s major banks (Barclays Africa Group, FirstRand, Nedbank and Standard Bank).
This analysis is unique in that it aims to aggregate the results of the major banks, with a view to identifying common trends and issues currently shaping the financial services landscape.
Algeria
Tunisia
Egypt
Sudan
SouthSudan
Mauritania NigerChad Eritrea
EthiopiaCentral
African Republic
KenyaUga
nda
DemocraticRepublicof Congo
Camero
onNigeria
Benin
Togo
Gha
naCôteD’Ivoire
Burkina
Faso
LiberiaSierra Leone
Guinea
SenegalGambia
Guinea Bissau
Gabon
Cong
o
AngolaZambia
Malaw
i
Mozam
bique
Zimbabwe
NamibiaBotswana
SouthAfrica
Lesotho
Swaziland
Madag
asca
r
Mauritius
Comoros
Seychelles
Mayotte
Cape Verde
Morocco
Mali
Somalia
Djibouti
RwandaBurundi
Tanzania
Libya
Reunion
Equatorial Guinea
São Tomé and Príncipe
2PwCMajor banks analysis – South Africa 15 September 2015
Although nearly a decade since the onset of the global financial crisis, efforts to strengthen the resilience of the banking sector and global capital markets continue unabated. At the same time, operating in a rapidly evolving regulatory, economic and deeply interconnected world means banks today have to invest focused management time and effort on continually evaluating the relevance of bank strategy, maximising organisational strengths and fortifying around areas of potential weakness.
Critically, this implies the need for a deep understanding of the future drivers of capital markets, keeping pace with trends in technological and digital innovation and ensuring organisational readiness to mine the wealth of opportunity that change inevitably brings.
To harness our global perspective on the important issues facing all financial services players, in this edition of our Major Banks Analysis we assembled insights from PwC teams and our clients from around the world. We assess challenges and opportunities the evolving global capital marketplace is creating for financial market participants and how they plan to respond.
We subsequently developed a point of view regarding global megatrends and how they will impact the future of the global financial system using PwC’s proprietary Project Blue framework. We consider how these trends will drive various scenarios for the future of capital markets, focusing on questions such as: Where will our clients be in 2020? Where will capital come from? What will be the potential roles of capital markets participants in the economy and in the context of government policy?
Our global thinking on this important topic is presented in the section entitled Project Blue 2.0.
Consistent with the themes discussed in our previous Major Banks Analysis, and within the context of a rapidly evolving operating environment, the global and domestic economic backdrop against which our major banks results have been achieved remains subject to a variety of significant challenges and overall financial market volatility.
External developments1 As we go to press, a range of global economic events remain in a state of flux and are subject to fast-moving dynamics. Key among them – and likely to be one of the biggest economic events of 2015 – is the question of when the US Federal Reserve will increase its policy rate for the first time in nearly a decade. In addition, various other global economic factors could have a significant impact. These include the trajectory of global oil prices and other commodity prices, Greece’s future within the Eurozone and asset market and growth conditions in China – an increasingly important economy whose fortunes invariably influence economic developments around the world, and particularly Africa.
How each of these dynamics plays out will have material implications for the global economy, and in particular for emerging market economies like South Africa, which is dependent on capital flows to fund domestic deficits and support local economic growth expectations.
What must be emphasised is that the US Federal Reserve’s monetary policies have an impact far beyond the US economy. The US dollar’s unique role as the world’s reserve currency means that monetary policy decisions in the US have real and direct consequences for the global economy. The expectation of higher policy rates in the US has already had an appreciating impact on the value of the dollar, which has increased by around 19% in trade-weighted terms since July 2014. This is a worrying sign for emerging economies that have benefitted from relatively cheap dollar debt to fund either large-scale investment projects or consumption.
Our recent global economic research investigated the potential vulnerability of 14 emerging markets, including South Africa, with regards to holdings of foreign debt. We found that Turkey may be particularly vulnerable to a strong dollar while other large emerging markets, such as Brazil and Indonesia, also warrant some concern. In short, we think the biggest impact of the US Federal Reserve’s monetary policy may be felt outside the US, and in particular, in emerging markets like ours.
1 PwC Global Economy Watch - May – August 2015
3PwCMajor banks analysis – South Africa 15 September 2015
Globally, a number of other economic headwinds persist. Within the Eurozone, economic news over the first half of 2015 was dominated by escalating political tensions around the Greek bailout, alongside broader discussions about the future of Greece in the bloc, and the future of the Eurozone itself. However, apart from Greek crisis concerns, economic recovery in the Eurozone has continued on a firm and positive path, with signs emerging of the recovery broadening across peripheral and core European economies.
While the Eurozone’s economy, in aggregate terms, is on the mend, five years after entering its first financial assistance programme, Greece is seeking a new bailout. With a deal having been worked out, fears associated with a possible Greek exit from the Eurozone (‘Grexit’) have eased for now, although the country’s underlying economic problems and challenging fundamentals will take years to resolve, with the risk of a future crisis not entirely extinguished.
Amid these factors, recent months have also seen some other important global events that will impact the macro economy. In the US, reasonably strong second quarter growth of 2.3% (at an annual rate) makes the possibility of a rate rise all the more imminent. Aside from the US and the Eurozone, recent dramatic events in Chinese2 stock markets have rippled across global financial markets and reignited fears of another downward leg to the global financial crisis. The Chinese economy is clearly slowing down and authorities are grappling with the aftermath of the perceived property investment bubble.
Chinese export growth was also hit by a real appreciation of the yuan while it was linked to the strong US dollar, making Chinese goods less competitive. Slower growth in China has reduced its demand for commodities from some other emerging economies (including Russia and Brazil, both of whom are currently experiencing recession, as well as South Africa and the Middle East) and added to downward pressure on global oil and other commodity prices.
A key development over the second half of 2014, which has continued into 2015, is dramatic decline in global oil prices, alongside significant commodity price volatility, which has been amplified by weak Chinese demand. Oil prices have taken a significant toll on the global oil & gas industry, with real implications being felt across the continent.
2 “How worried should we be about China and the global economy?”, John Hawksworth, PwC UK Chief Economist, August 2015
In December 2014, West Texas Intermediate (WTI) crude prices dropped from more than US$100 per barrel to less than US$60, with Brent crude prices following suit. The slide continued into 2015, dropping below $45 per barrel, before making a modest recovery. As oil prices have plunged, the industry’s response has been far-reaching, leading to reductions in headcount and other cost cutting measures. Capital budgets have been cut, and frontier exploration activity has significantly declined.
The relative oversupply of global oil, coupled with significant developments in the US to move towards greater energy independence, amid lacklustre global demand, is reshaping trade flows and impacting sectors far beyond those operating in upstream oil.
While there remain significant frontier exploration opportunities across Africa (explored in our latest Africa oil & gas review: From fragile to agile and discussed briefly in the Hot off the press section), the fragile political situation in North Africa continues to have an impact on production levels. This saw another year-on-year decline in oil production in the region of 22%. Libya alone, in the throes of civil war, saw production decline by almost half.
Domestically, the South African economy experienced a range of challenges during the first half of 2015, amplified by the macroeconomic developments outlined above. Household consumption remained constricted by higher debt service costs, while significant electricity supply shortages and weak global demand resulted in a lacklustre and subdued business environment. At the same time, severe drought conditions affected growth in the agricultural sector, while a marginal income tax increase in April and the setting in of higher interest rates have negatively impacted the South African consumer, resulting in muted retail spending and added employment pressure. In addition, in the current third quarter, South Africa’s business confidence index extended losses to its weakest level since 2011, with sentiment particularly low among retailers and wholesalers.
The rand exchange rate continued to experience a cycle of significant volatility during the period, continuing the volatile trend seen during late 2014, with the local currency reaching its lowest recorded levels against the US dollar in September 2015.
These deteriorating factors combined to result in an annualised contraction in South African GDP of 1.3% for the second quarter of 2015, which offset the less than optimistic GDP growth of the same quantum posted in the first quarter of the year.
4PwCMajor banks analysis – South Africa 15 September 2015
Major banks’ performanceDespite this challenging, complex and volatile operating environment, the major banks posted strong results for the first half of 2015. In aggregate, the major banks reported combined growth in headline earnings of 17.7% against the comparable period to reach R32.8bn.
Key drivers influencing headline earnings remain strong, with net interest income growth of 9%, non-interest revenue growth of 6.7% and a reduction in impairment charges of 2.4% against 1H14. However, when compared to the previous six-month period, the combined impairment charge of the major banks increased 12.9% as a result of inherent stresses still considered to be prevalent within the major banks’ loan portfolios.
Overall, the major banks continued to produce a strong set of results within a significantly challenging operating environment, attesting to the resilience and diversification of their revenue pools and strong, established franchises.
Gross loans and advances experienced double-digit growth of 11.6% for the six months to June 2015, and 8.4% against the second half of 2014. Consistent with our observations at December 2014, growth in gross loans and advances continues to be driven by healthy demand in the corporate and investment banking sector outpacing retail credit demand.
All of the major banks continue to highlight their application of prudent judgements in relation to credit provisioning as a result of latent stresses reflected within parts of their loan portfolios, particularly on the back of the declining macro and domestic economic conditions that characterised the period under review.
Combined non-performing loans (NPLs) fell slightly by 0.3% against the comparable period, but grew by 2.2% when compared to the six months to December 2014, reflecting a changing NPL trend to that seen previously. NPLs as a percentage of average advances declined by 10.5% against the comparable period.
At the same time, focus on debt workout and tighter collection strategies have resulted in combined credit impairment charges falling 2.4% against the comparable period, but increasing by 12.9% compared against December 2014. However, there are certain general performing book provisioning factors at play driving the six-month increase in impairment charges, which we unpack further in the Asset quality section of our analysis.
The latest edition of the National Credit Regulator’s quarterly Credit Bureau Monitor (for Q1-2015) provides insight into the challenging South African retail credit environment, showing that the percentage of consumers with impaired credit records relative to all credit active consumers continued on an upward trend and increased marginally to 45% at the end of March 2015 (compared to 44.9% at December 2014).
Net interest income growth of 9% benefitted from a continued positive endowment impact as the higher interest rate environment contributed to faster asset repricing relative to fixed-rate liabilities, equity and non-rate sensitive funding sources.
In spite of net interest income growth, an important theme that emerged in the current period is the relative compression experienced in the major banks’ combined net interest margin, which reduced by 13 and 30 basis points against the comparable period and the six-month period ended December 2014, respectively.
In many ways, this trend confirms our earlier-held view that margin pressure was to be expected given the challenging operating environment, weak economic context and regulatory developments impacting the banks from a liquidity perspective.
While non-interest revenue (NIR) growth continues to be uplifted by net fee and commission income in absolute terms, the strategic emphasis placed by the major banks on growing their asset management, bancassurance and wealth franchises has resulted in healthy growth of 29.3% in this income stream. However, this growth needs to be seen in the context of its still relatively minor contribution to total NIR, amounting to 5.1% at June 2015.
Sustained effort by all of the major banks to optimise channel choice and migrate customers to digital and mobile channels continues to positively impact electronic transactional volumes in both the retail and corporate transactional banking sectors.
5PwCMajor banks analysis – South Africa 15 September 2015
The various pressures impacting total combined NIR is evident in the contraction of 1.6% when compared against 2H14. Factors such as intense pricing competition, as well as regulatory changes, which include the reduced interchange fees effective since March 2015 and preparation in the form of systems readiness for the Retail Distribution Review (RDR), are starting to restrain the levels of NIR growth seen previously.
While effective cost management remains an important focus for the banks, investments in their core franchises, technological and system enhancements and human capital spend all contributed to operating cost growth of 9% against the comparable period.
At 58%, staff costs remain the largest contributor to the major banks total cost base.
strong earnings growth, solid capital buffers and a consistently prudent approach to capital management. Consequently, all of the banks remain comfortably in compliance with present minimum required capital ratios across all capital tiers. From an industry perspective, growth in risk-weighted assets (RWAs) over the current period can, in some part, be attributed to an industry-wide requirement by the South African Reserve Bank (SARB) for a credit valuation adjustment (CVA) capital charge for over-the-counter (OTC) rand-denominated and local derivatives that are not cleared through a central counterparty.
Stakeholder expectationsGlobal regulatory developments continued during the first half of 2015, as international standard setters continue the task of strengthening the global financial system on the back of key lessons learnt during the crisis. During 2015, the Basel Committee on Banking Supervision (BCBS) issued a range of consultations that may likely influence banks’ regulatory capital levels in future.
In particular, significant revisions to the standardised approaches for measuring credit and operational risk capital have been proposed, while revisions to capital floors (based on the revised standardised approaches) for banks using internal ratings-based (IRB) approaches are also being consulted on.
Another key global regulatory development that is expected to be watched closely by the banking industry in the coming months is the Financial Stability Board’s recent consultation issued at the end of 2014, which defines a global standard for minimum amounts of total loss absorbency capacity (TLAC) to be held by global systemically important banks (G-SIBs).
At the global level and in response to lessons learnt during the financial crisis, TLAC is meant to ensure that G-SIBs have the necessary loss-absorbing and recapitalisation capacity so that, in and immediately following resolution, critical functions can continue without requiring taxpayer support or threatening financial stability.
Locally, National Treasury in conjunction with the SARB and the Financial Services Board issued for comment a discussion document (Strengthening South Africa’s Resolution Framework for Financial Institutions), which introduced the concept of TLAC to explicitly subordinate specified capital instruments in order to allow them to be loss-absorbing at the point of resolution.
However, other areas within the banks’ combined cost structure are now showing interesting developments. In particular, as a result of more stringent regulatory requirements to ensure the integrity and granularity of risk data, sophistications in cybercrime and the need to respond to customers’ increasingly online presence, IT spend continues to increase steeply, both in terms of period-on-period growth and in absolute terms.
These factors combined to place pressure on the major banks’ aggregate cost-to-income ratio, which deteriorated slightly to 54.9%, compared to 54.7% at 1H14 and 54.6% at 2H14. The negative impact of dollar-based costs for those banks with large physical footprints in the rest of Africa in the context of a weak rand to dollar exchange rate, continues to add to operating cost pressure.
At 18.2%, the combined return on equity (ROE) of the major banks grew by 108 basis points against the comparable period – an admirable achievement that clearly reflects the extent of resilience within the banks’ earnings profiles and the strength of their franchises. Individually, however, each of the four major banks experienced different growth stories and operating circumstances over the period.
In line with expectations, the implications of higher capital requirements being phased in under Basel III has continued to influence regulatory capital levels. The combined total capital adequacy ratio of the major banks remained flat against the comparable period at 15.4% (15.3% at 2H14) and is underpinned by
6PwCMajor banks analysis – South Africa 15 September 2015
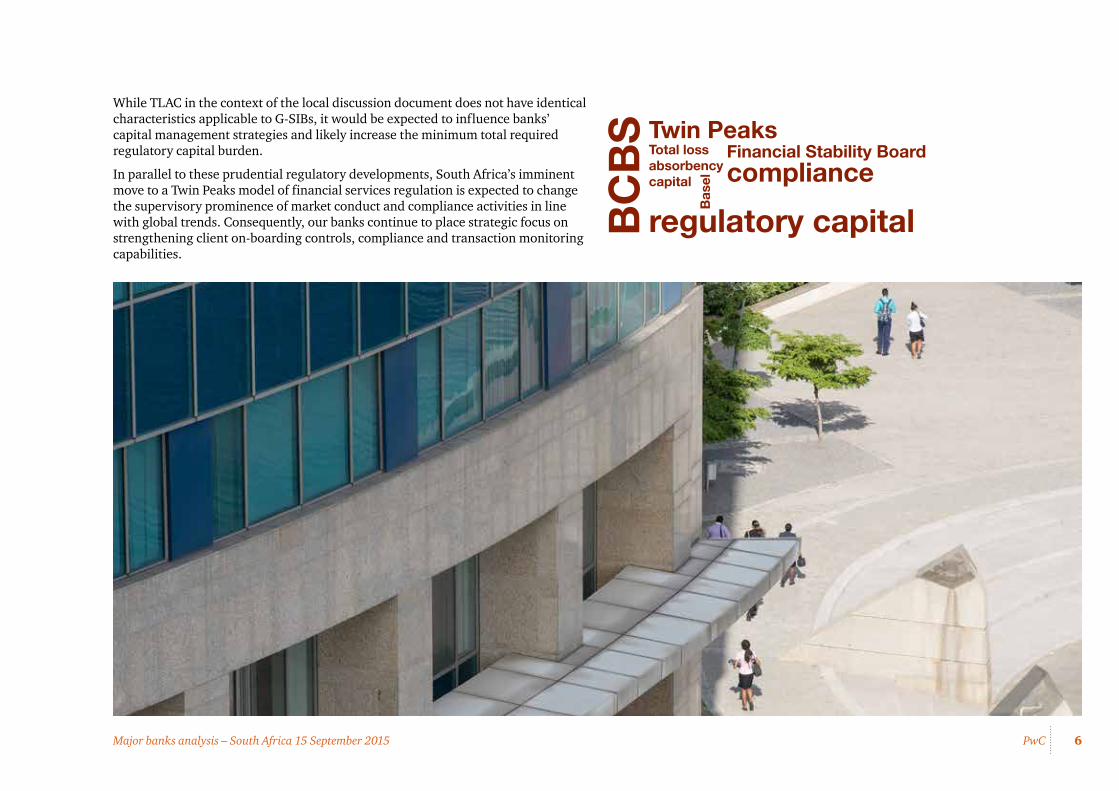
While TLAC in the context of the local discussion document does not have identical characteristics applicable to G-SIBs, it would be expected to influence banks’ capital management strategies and likely increase the minimum total required regulatory capital burden.
In parallel to these prudential regulatory developments, South Africa’s imminent move to a Twin Peaks model of financial services regulation is expected to change the supervisory prominence of market conduct and compliance activities in line with global trends. Consequently, our banks continue to place strategic focus on strengthening client on-boarding controls, compliance and transaction monitoring capabilities.
BC
BS
Twin Peaks
Bas
el
Total loss absorbency capital
Financial Stability Board
compliance
regulatory capital
7PwCMajor banks analysis – South Africa 15 September 2015
Internal responses
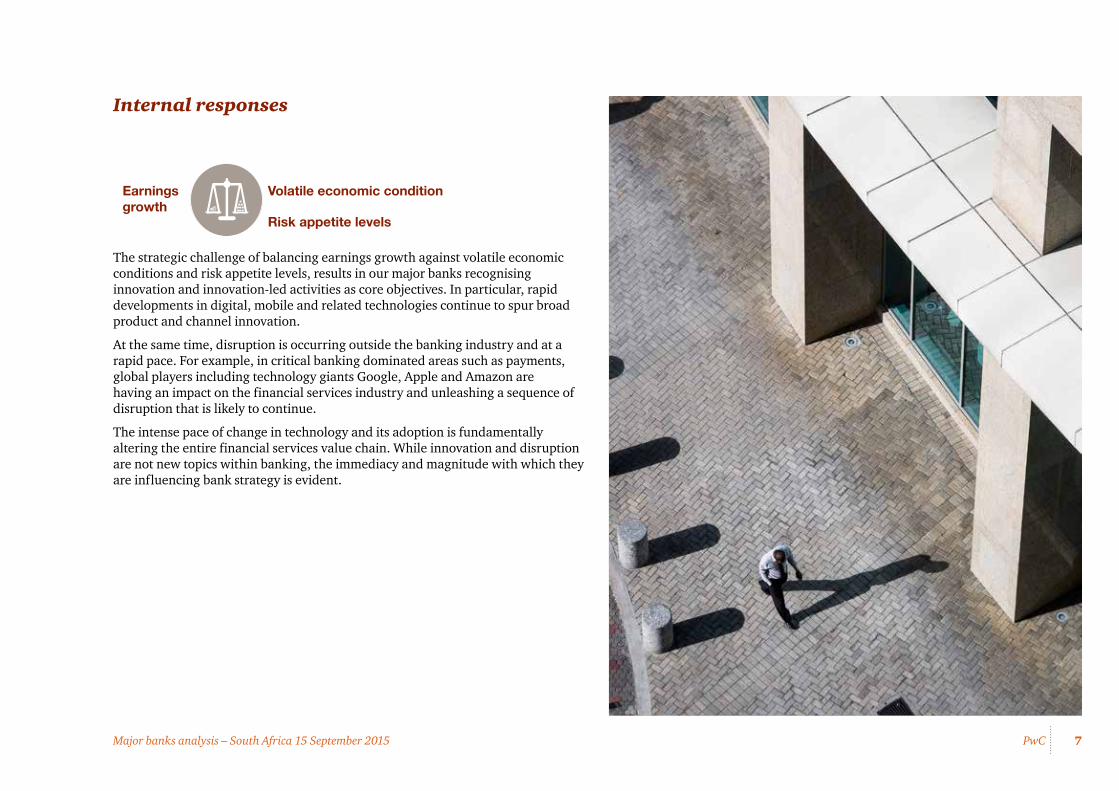
The strategic challenge of balancing earnings growth against volatile economic conditions and risk appetite levels, results in our major banks recognising innovation and innovation-led activities as core objectives. In particular, rapid developments in digital, mobile and related technologies continue to spur broad product and channel innovation.
At the same time, disruption is occurring outside the banking industry and at a rapid pace. For example, in critical banking dominated areas such as payments, global players including technology giants Google, Apple and Amazon are having an impact on the financial services industry and unleashing a sequence of disruption that is likely to continue.
The intense pace of change in technology and its adoption is fundamentally altering the entire financial services value chain. While innovation and disruption are not new topics within banking, the immediacy and magnitude with which they are influencing bank strategy is evident.
Earnings growth
Volatile economic condition
Risk appetite levels
8PwCMajor banks analysis – South Africa 15 September 2015
Embracing disruption
The competitive landscape is rapidly and radically reshaping for businesses in all sectors. Competition is now coming from new and previously unseen sources. At the same time, a wide range of industries is being disrupted by regulatory changes, increasing competition and new patterns of consumer behaviour.
Despite the challenges, opportunities abound. In PwC’s 18th Annual Global CEO Survey*, published in January 2015, many CEOs confirmed that while they are less confident overall about the prospects for the global economy, they believe that there are significant opportunities for their own businesses to grow in the year ahead.
The majority of CEOs surveyed believe that investments in digital technologies have created value for their business, and around 80% say that mobile technologies and data analytics are key strands of their strategy.
One-third of CEOs say they have entered new industries in the last three years, and more than half (56%) believe that organisations will increasingly be competing in new sectors in the next three years.
• 56% Think that cross-sector competition will become more common
• 81% Think mobile technologies for customer engagement are strategically important for their business
• 32% believe technology is the sector from which significant competitors are emerging
• CEOs concerned about threats to their organisation’s growth prospects:
– 58% Speed of technological change
– 60% Consumer behaviours
– 54% New market entrants
18th Annual Global CEO Survey
*1 322 CEOs from across a range of industries in 77 countries were surveyed in the fourth quarter of 2014.www.pwc.com/ceosurvey
A marketplace without boundaries?Responding to disruption
18th Annual Global CEO SurveyNew ways to compete p2 / Growth, but not as we know it p6/ What business are you in? p12 / Creating new value in new ways through digital transformation p18/ Developing diverse and dynamic partnerships p24 / Finding different ways of thinking and working p28 / The CEO agenda p34
1,322CEOs interviewed in 77 countries
78%of CEOs are concerned about over-regulation
56%of CEOs think cross-sector competition is on the rise
9PwCMajor banks analysis – South Africa 15 September 2015
Innovation is fast becoming a business-as-usual priority
Building, strengthening and enhancing IT architectures and systems also continues to rank high on the strategic agenda of the major banks as they prepare themselves to maximise future growth expectations. However, the motivation for IT change is also being driven by a range of external factors. IT resilience amid growing global concern about banks’ vulnerabilities to potential cyberattacks now ranks alongside enhancing the customer experience and customer centricity in the IT change agenda.
Consistent with our previous observations, significantly expanding their presence, product and technological capabilities in key African markets beyond South Africa remains a headline strategic objective for all of the major banks.
While growth and execution strategies differ for each of the banks, enhancing and diversifying earnings’ contribution from their operations across Africa remains a central strategy in the context of domestic economic challenges and significant economic opportunities that remain largely unlocked in high-growth markets across the continent.
Volatility
ProspectsDevelopments in the macro economy have become increasingly complex and global in their implications. In the short to medium term, European businesses are likely to be moderately optimistic about their prospects, largely as a result of firm economic fundamentals and positive prospects across most of the continent, and the relative easing in disruptive concerns associated with a Greek exit from the Eurozone. As a key South African trading partner, a positive trajectory in the Eurozone is an important contributor to local economic and business sentiment.
As a result, financial market expectations will be that the SARB, in terms of its mandate to remain within a targeted inflation band, will act to restrain domestic inflationary pressure through a possible increase in the repo rate from its current level of 6%.
However, any consideration of monetary policy action by the SARB to arrest inflationary concerns will have to be weighed up against the very real circumstances of a weak South African economy that is finding meaningful economic growth elusive.
The prospect of a further interest rate increase during the second of half of 2015 is considered to be a real possibility by a number of market commentators and economists. If it materialises, a higher interest rate environment will likely have the effect of assisting interest margin expansion on the one hand for the major banks, while restraining asset growth in rate sensitive portfolios, adding to credit impairment concerns and further burdening the already indebted South African consumer. Banks will therefore have to ensure that their hedging strategies are appropriate and can act to absorb the market risk volatility that is expected to remain throughout the rest of the year.
Across the Atlantic, the prospect of a US policy rate increase will have critical implications for the South African economy, as a higher interest rate environment in the US would likely amplify current rand/dollar weaknesses and directly increase domestic inflationary pressure.
Ris
k ap
pet
ite Innovation
Disruption Technology IT systemsIT resilience
Africa
10PwCMajor banks analysis – South Africa 15 September 2015
From a credit perspective, most banks continue to expect growth prospects to be stronger in the corporate and wholesale sectors as opposed to retail sectors, and will continue to actively seek to grow lending in their rest of the Africa portfolios as a means to sustain earnings growth. However, the major banks have noted a reduced appetite for large wholesale credit origination given current economic uncertainty. Since many African economies are largely resources led, sustaining this credit growth is likely to be a challenging task given the fall in global commodity prices and demand.
Focusing on innovation, bank strategy, proactive risk management and, importantly, their execution, will be critical for the banks to ensure that they can mitigate forecast risk and navigate the headwinds and challenging conditions that are likely to prevail for the rest of 2015.
Greece
Rep
o r
ate
Inflationary pressure
Monetary policy
Hedging strategiesRisk
management
Corporate and wholesale sectors
Major banks analysis – South Africa 15 September 2015
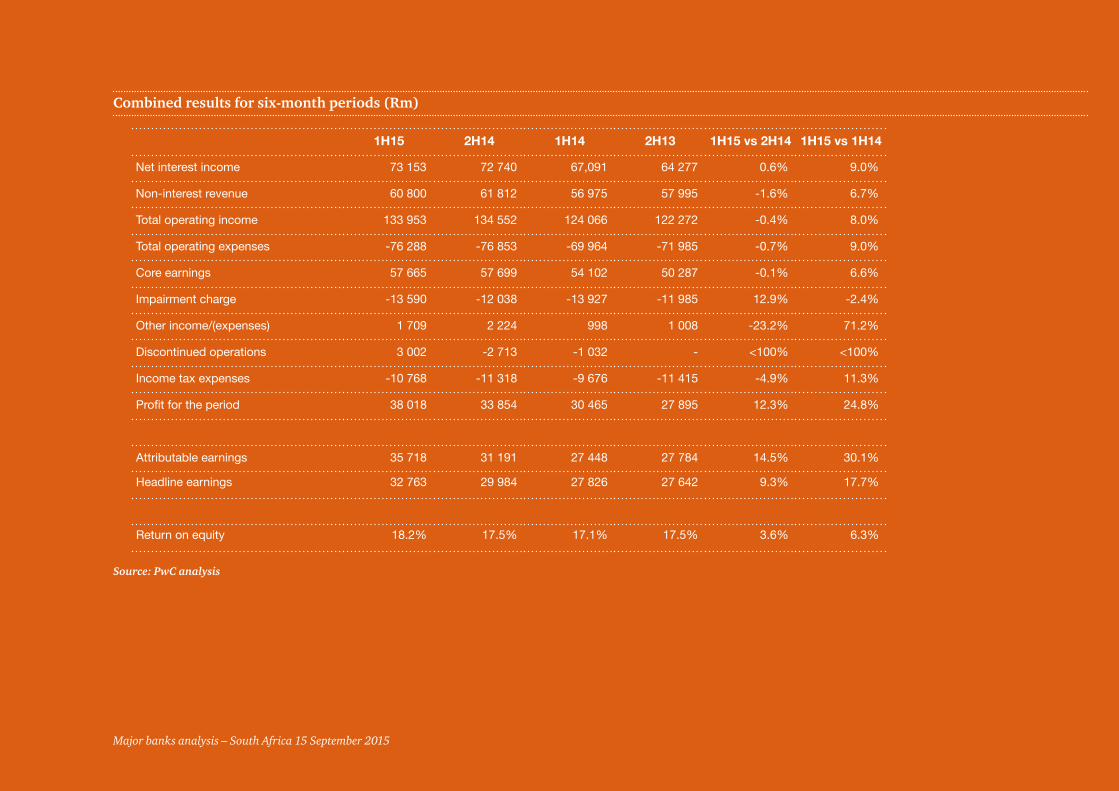
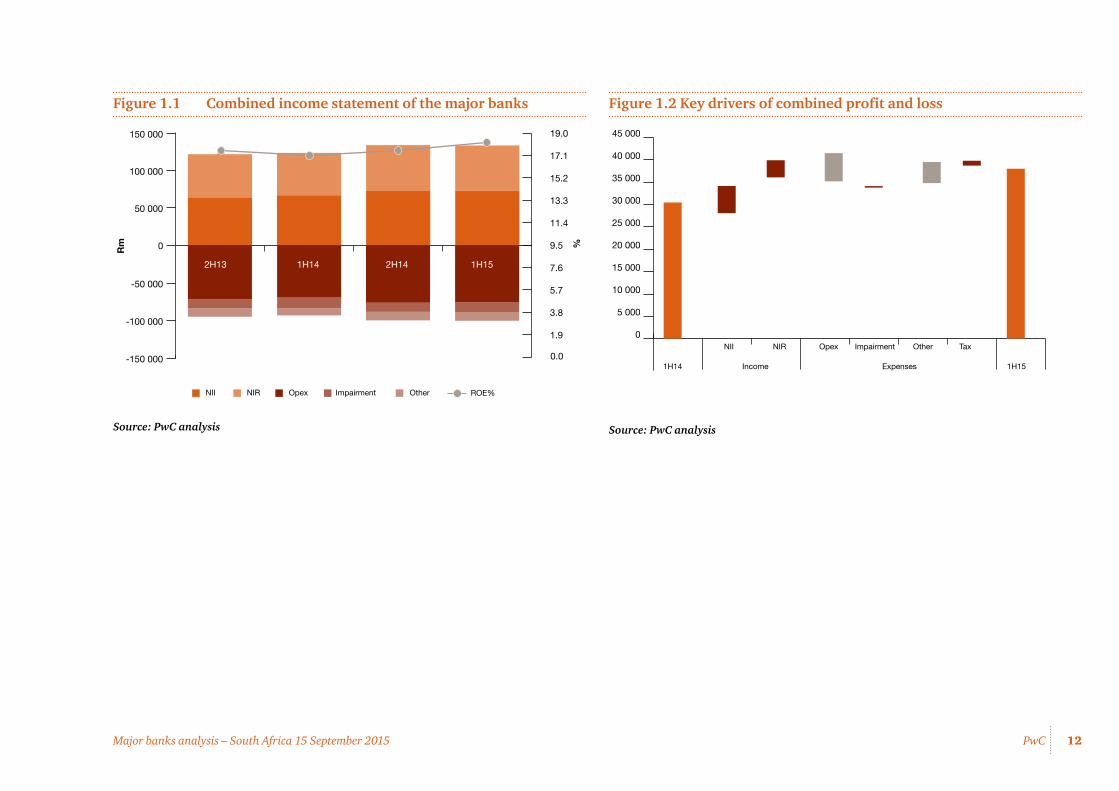
Combined results for six-month periods (Rm)
1H15 2H14 1H14 2H13 1H15 vs 2H14 1H15 vs 1H14
Net interest income 73 153 72 740 67,091 64 277 0.6% 9.0%
Non-interest revenue 60 800 61 812 56 975 57 995 -1.6% 6.7%
Total operating income 133 953 134 552 124 066 122 272 -0.4% 8.0%
Total operating expenses -76 288 -76 853 -69 964 -71 985 -0.7% 9.0%
Core earnings 57 665 57 699 54 102 50 287 -0.1% 6.6%
Impairment charge -13 590 -12 038 -13 927 -11 985 12.9% -2.4%
Other income/(expenses) 1 709 2 224 998 1 008 -23.2% 71.2%
Discontinued operations 3 002 -2 713 -1 032 - <100% <100%
Income tax expenses -10 768 -11 318 -9 676 -11 415 -4.9% 11.3%
Profit for the period 38 018 33 854 30 465 27 895 12.3% 24.8%
Attributable earnings 35 718 31 191 27 448 27 784 14.5% 30.1%
Headline earnings 32 763 29 984 27 826 27 642 9.3% 17.7%
Return on equity 18.2% 17.5% 17.1% 17.5% 3.6% 6.3%
Source: PwC analysis
12PwCMajor banks analysis – South Africa 15 September 2015
Figure 1.1 Combined income statement of the major banks
NII NIR Opex Impairment Other
Rm
ROE%
0
50 000
100 000
150 000
-150 000
-100 000
-50 000
0.0
1.9
3.8
5.7
7.6
9.5
11.4
13.3
15.2
17.1
19.0
2H13 1H15 2H14 1H14
%
Source: PwC analysis
Figure 1.2 Key drivers of combined profit and loss
0
5 000
10 000
15 000
20 000
25 000
30 000
35 000
40 000
45 000
NII NIR Opex Impairment Other Tax
1H151H14 Income Expenses
Source: PwC analysis
13PwCMajor banks analysis – South Africa 15 September 2015
2. Economic outlookBy Dr Roelof Botha, economic advisor to PwC
Major banks analysis – South Africa 15 September 2015
Retail trade shines in the midst of a gloomy economySince the end of the worst phases of the global recession, volatility has remained a characteristic of South Africa’s economic output performance, with a downward growth trend having been prevalent since 2011.
Last year, real GDP expanded by a paltry 1.5%, down from 2.2 % in 2013 and less than half the growth rate recorded in 2011. In 2014, first quarter growth turned negative for the first time since 2009 (on a quarter-on-quarter basis), but rebounded marginally in the second quarter.
This year, the roles were reversed, with positive first quarter GDP growth turning into a decline in the second quarter. On a year-on-year basis, however, the country has recorded its 22nd consecutive quarter of positive real GDP growth, but the negative growth trajectory remains cause for concern.
14PwCMajor banks analysis – South Africa 15 September 2015
Inventory build-up of virtually every commodity in the world has been caused by the slowdown in the Chinese economy, where true growth figures are apparently lower than official GDP growth data.
Several leading research agencies have lowered their growth forecasts for China over the next two years and the fairly sharp decline in the GDP growth gap between the world’s two largest economies (the US and China) may be regarded as a megatrend that will have a long-term impact on most economies. To set the context, the combined GDP of these two countries accounts for more than one-third of global GDP.
China’s transition from an export-led to a consumption-led economy, combined with increasing labour costs and weak demand from Europe, are among the most important reasons for an economic slowdown that is assuming a structural dimension.
In South Africa, closer scrutiny of the latest GDP data released by Statistics SA reveals a sharp declining trend in gross operating surplus by sector, which poses a significant threat to National Treasury’s revenue budget.
Real change in gross operating surplus by sector Q2 2014 to Q 2 2015
% %
Manufacturing -13.2 Total economy -2.8
Agriculture -8.2 Construction -2.0
Personal services -6.0 Transport and communication -1.7
Mining -5.8 Trade and catering -0.2
Electricity and water -4.3 Finance and business services 2.1
Source: Statistics SA
Corporate profits are under severe pressure as a result of the contraction being experienced in a number of industry sectors, including agriculture, manufacturing and tourism-related businesses. Although salaries and wages in the economy have continued to expand in real terms, the brunt of the general economic lethargy is clearly being faced by the corporate sectors’ bottom line.
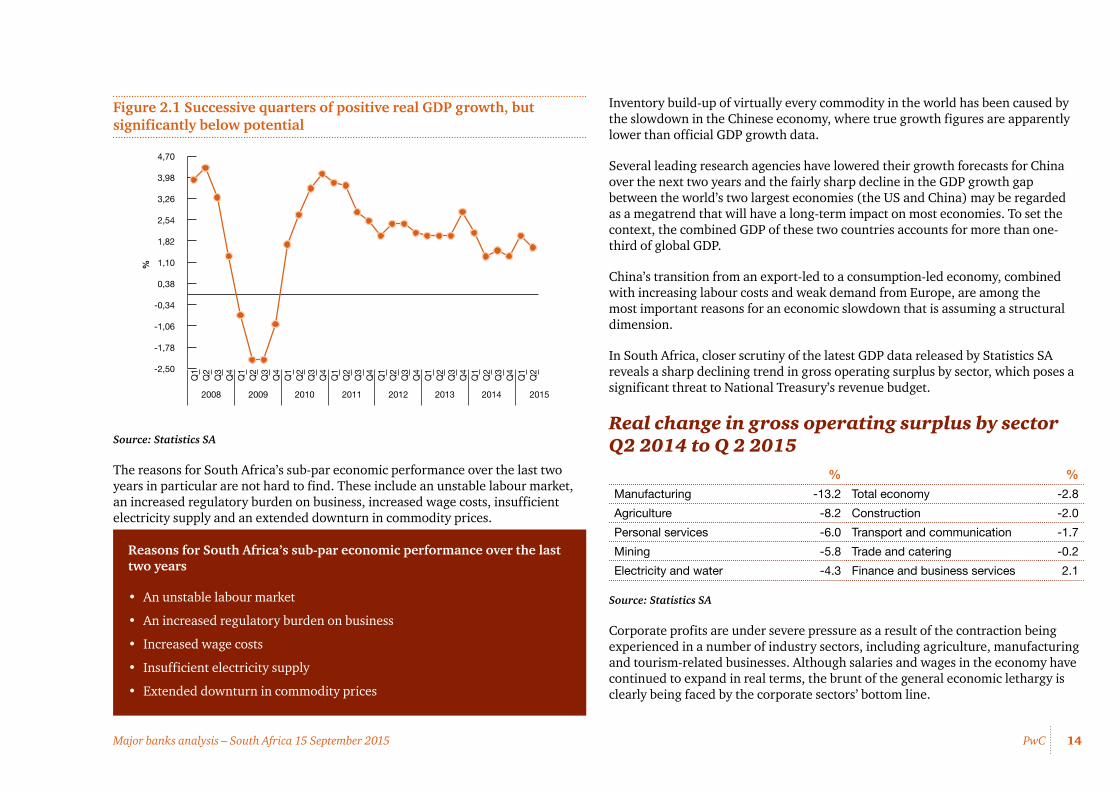
Figure 2.1 Successive quarters of positive real GDP growth, but significantly below potential
Source: Statistics SA
The reasons for South Africa’s sub-par economic performance over the last two years in particular are not hard to find. These include an unstable labour market, an increased regulatory burden on business, increased wage costs, insufficient electricity supply and an extended downturn in commodity prices.
%
-2,50
-1,78
-1,06
-0,34
0,38
1,10
1,82
2,54
3,26
3,98
4,70
Q2
Q1
Q4
Q3
Q2
Q1
Q4
Q3
Q2
Q1
Q4
Q3
Q2
Q1
Q4
Q3
Q2
Q1
Q4
Q3
Q2
Q1
Q4
Q3
Q2
Q1
Q4
Q3
Q2
Q1
2010 2011 2012 2013 2014 20152008 2009
Reasons for South Africa’s sub-par economic performance over the last two years
• An unstable labour market
• An increased regulatory burden on business
• Increased wage costs
• Insufficient electricity supply
• Extended downturn in commodity prices
15PwCMajor banks analysis – South Africa 15 September 2015
The contribution of corporate taxes to total government revenue has declined to its lowest level in more than a decade and speculation is growing about the possibility of a hike in the VAT rate, which now seems unavoidable.
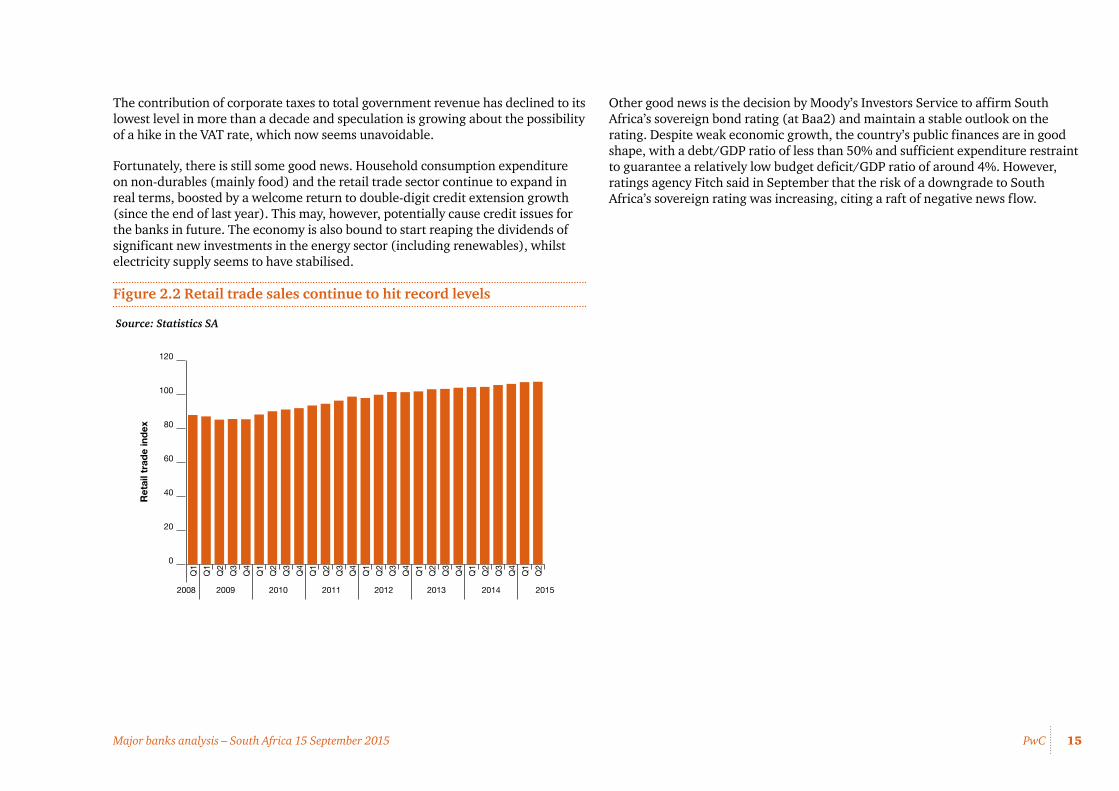
Fortunately, there is still some good news. Household consumption expenditure on non-durables (mainly food) and the retail trade sector continue to expand in real terms, boosted by a welcome return to double-digit credit extension growth (since the end of last year). This may, however, potentially cause credit issues for the banks in future. The economy is also bound to start reaping the dividends of significant new investments in the energy sector (including renewables), whilst electricity supply seems to have stabilised.
Figure 2.2 Retail trade sales continue to hit record levels
Source: Statistics SA
2008 2009 2010 2011 2012 2013 20152014
0
20
40
60
80
100
120
Q2
Q1
Q4
Q3
Q2
Q1
Q4
Q3
Q2
Q1
Q4
Q3
Q2
Q1
Q4
Q3
Q2
Q1
Q4
Q3
Q2
Q1
Q4
Q3
Q2
Q1
Q1
Ret
ail t
rad
e in
dex
Other good news is the decision by Moody’s Investors Service to affirm South Africa’s sovereign bond rating (at Baa2) and maintain a stable outlook on the rating. Despite weak economic growth, the country’s public finances are in good shape, with a debt/GDP ratio of less than 50% and sufficient expenditure restraint to guarantee a relatively low budget deficit/GDP ratio of around 4%. However, ratings agency Fitch said in September that the risk of a downgrade to South Africa’s sovereign rating was increasing, citing a raft of negative news flow.
16PwCMajor banks analysis – South Africa 15 September 2015
3. Net interest income
Net interest margin (Rm)
Combined
1H15 2H14 1H14 2H13
Gross loans and advances 3 287 314 3 033 571 2 945 912 2 859 262
Net interest margin (% of average interest earning assets)
4.34% 4.64% 4.47% 4.37%
Figure 3.1 Net interest margin and advances
Source: PwC analysis2H
13
1H14
2H14
1H15
2H13
1H14
2H14
1H15
2H13
1H14
2H14
1H15
2H13
1H14
2H14
1H15
0
100 000
200 000
300 000
400 000
500 000
600 000
700 000
800 000
900 000
1 000 000
BAGL FSR NED SBK
0
1
2
3
4
5
6
Gross loans and advances Net interest margin (% of average interest earning assets)
Rm %
Major banks analysis – South Africa 15 September 2015
17PwCMajor banks analysis – South Africa 15 September 2015
Growth in net interest income continued in absolute terms over the current period, albeit at a moderate pace. However, a key development in the current period has been compression in the major banks’ combined net interest margin.
Balance sheet mix and focus on asset pricing continue to benefit NII, which was also strengthened by the positive impact of the endowment effect as a result of the dual interest rate increases in 2014.
Growth in loans and advances amounted to 8.4% compared to 2H14 and a healthy 11.6% against 1H14. A key driver of loan growth for the major banks remains a strong contribution from corporate and wholesale advances compared to more moderate retail credit growth, which is consistent with the theme observed in our previous analyses.
Overall balance sheet growth across both advances and deposits continues to support net interest income growth for the major banks, with resilient loan growth being observed in corporate lending on the back of healthy corporate credit demand over the period, in spite of a difficult and challenging business environment.
Net interest income has grown steadily year on year across all the banks consistently over a number of periods. It continued to grow in absolute terms over the current period at 9% against 1H14, but at a much more moderate 0.6% against 2H14.
However, for the first time following sustained increases across multiple previous periods, the combined net interest margin across the four banks has compressed, consistent with our expectations in previous periods that sustaining margin growth in the current operating environment would represent a challenge.
In the current period, the combined net interest margin has moved from 4.64% at 2H14 and 4.47% at 1H14 to 4.34% at 1H15, reflecting a 30-basis-point movement in the last six months. This movement is considered to be a consequence of the following factors:
• Endowment impact and economic sentiment;
• Regulatory change, in particular the impact of the liquidity coverage ratio;
• Asset and liability mix and pricing; and
• The effect of foreign exchange rates.
Endowment impact and economic sentiment
At the start of an increasing rate cycle, the endowment effect positively impacts the earning capacity of assets, as the change in market interest rates result in variable-rate assets re-pricing faster than non-rate sensitive liabilities or equity that funds those assets. Naturally, this is positive for the banks’ income statements as it uplifts income potential from the banks’ asset base and enhances interest earned on loans advanced.
While the upward cycle in interest rates facilitates margin expansion, the effect of higher interest rates and consumer price inflation (CPI) adds strain to household balance sheets and debt-service costs. Consequently, the disposable income of South African consumers becomes more pressured, which may reduce general credit appetite in higher yielding retail advances. In addition, more significant interest rate increases will ultimately lead to increased impairment charges.
18PwCMajor banks analysis – South Africa 15 September 2015
Regulatory change
A significant impact over the current period has been the need for banks to maintain a stock of high-quality liquid assets (HQLA) to meet contractual liabilities over a 30-day simulated period of stress. This concept is being implemented through the liquidity coverage ratio (LCR), introduced as a key measure of the Basel III regulatory reform package.
Effective 1 January 2015, the LCR has become a prudential requirement with a minimum ratio of 60% required. This will step up to 100% at full implementation over the Basel III implementation timeline through to 2019.
As a result, margins from interest-generating assets have come under pressure in light of a greater stock of HQLA being held as a result of the LCR, increased term funding being sought in anticipation of the Net Stable Funding Ratio, which comes into effect on 1 January 2018, and generally increased liquidity and funding costs.
The LCR, and in particular the NSFR, which we expand on the in the Capital and Funding section of this report, has direct implications for liquidity management and the cost of bank funding. Higher proportions of HQLA place negative pressure on bank margins since HQLA instruments are typically low-to-zero yielding from an interest perspective.
As the journey to a 100% LCR requirement continues, we expect that the banks’ interest margin will continue to experience further strain as a result of the limited income generating capacity of HQLA.
Asset and liability mix and pricing
Consistent with our observations in previous periods, the major banks have continued to place strategic focus on improving pricing strategies and appropriately pricing for risk taken on in their balance sheets. Income generated from lending activities continues to dominate NII growth.
We continue to note improvements in balance sheet mix being counteracted by competitive pricing strategies. In line with where the greatest credit demand lies, our banks are concentrating on adapting their focus towards maximising corporate lending, while remaining mindful of the need to build up their retail deposit-taking franchises in light of regulatory developments.
At the same time, regulatory developments will result in banks placing greater emphasis on the liability side of their balance sheets. Asset and liability mix efforts include moving towards shorter-term assets rather than longer-term assets such as retail mortgages, which in an NSFR world will require access to stable sources of funding that are difficult to attract in the context of an emerging market like South Africa. Our analysis suggests that it is likely that cheaper overnight and call deposits are growing faster than more expensive notice or term deposits.
Some banks have seen strong asset growth in some of the lower-margin asset businesses such as vehicle and instalment finance in the current period. However, this asset growth has the effect of offsetting the repricing benefits achieved in comparatively stronger net interest income earned on the back of book growth in higher-yielding asset businesses of the banks, such as unsecured personal loans.
19PwCMajor banks analysis – South Africa 15 September 2015
The effect of foreign exchange
The major banks currently have different business models and strategies with regards to foreign-denominated advances. While some have large physical footprints (and separate legal entities through which they lend in foreign currency), others utilise their South African balance sheets to lend in currency, typically in US dollars.
Given the volatile rand/dollar exchange rate that prevailed over the period, those banks using their physical footprint will have seen an increase in foreign currency translation reserves due to exchange rate movements, whereas those utilising their South African balance sheets will have seen the translation effect positively impact their domestic results. However, the benefit of the depreciation in the rand will complement both approaches and enhance interest income earned on the back of foreign currency assets.
The way forward
Pressure on the major banks’ net interest margin will continue to be a challenge. Changes in regulatory requirements, in particular, will have a significant impact on the banks’ strategic objectives as they look to accumulate liquid assets, focus on liquefying their balance sheets and lengthening the tenor of their funding profiles. The effects of these changes could potentially lead to added pressure on margins.
We expect that the banks’ strategic direction will move towards growing fee-based income i.e. transactional income and therefore strengthening the capabilities of their transactional businesses is expected to be a primary focus in periods to come.
20PwCMajor banks analysis – South Africa 15 September 2015
4. Non-interest revenue
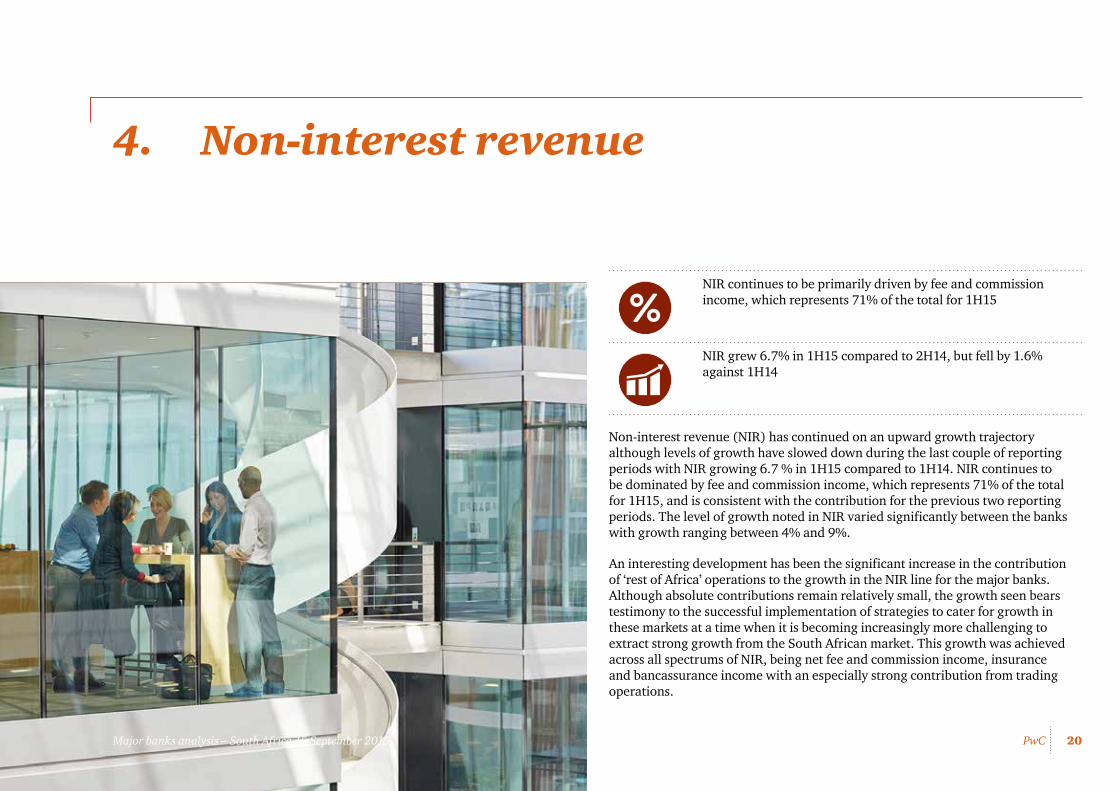
NIR continues to be primarily driven by fee and commission income, which represents 71% of the total for 1H15
NIR grew 6.7% in 1H15 compared to 2H14, but fell by 1.6% against 1H14
Non-interest revenue (NIR) has continued on an upward growth trajectory although levels of growth have slowed down during the last couple of reporting periods with NIR growing 6.7 % in 1H15 compared to 1H14. NIR continues to be dominated by fee and commission income, which represents 71% of the total for 1H15, and is consistent with the contribution for the previous two reporting periods. The level of growth noted in NIR varied significantly between the banks with growth ranging between 4% and 9%.
An interesting development has been the significant increase in the contribution of ‘rest of Africa’ operations to the growth in the NIR line for the major banks. Although absolute contributions remain relatively small, the growth seen bears testimony to the successful implementation of strategies to cater for growth in these markets at a time when it is becoming increasingly more challenging to extract strong growth from the South African market. This growth was achieved across all spectrums of NIR, being net fee and commission income, insurance and bancassurance income with an especially strong contribution from trading operations.
Major banks analysis – South Africa 15 September 2015
21PwCMajor banks analysis – South Africa 15 September 2015
Net fee and commission income
Net fee and commission income grew by 6.2% compared to 1H14, which represents a continuation of the growth trajectory recorded in the past.
The banks have commented that this growth is attributable to net growth in customer numbers and inflation-related increases on selected products. This is a remarkable achievement despite headwinds faced during the period in the form of the revised lower interchange fees, effective March 2015, and the continued migration of customers to cheaper digital channels. The majority of banks also commented that they have seen strong growth in card acquiring volumes that have softened the impact of lower interchange fees.
Management continues to diversify the net fee and commission income revenue streams across various geographical regions in Africa given the relatively mature state of the banking market in South Africa and muted opportunities for significant further growth in this region.
The success of these diversification programmes is expected to be one of the factors that will distinguish the winners from the losers in this area. An interesting recent development has been the increased intervention by regulators in other African countries regarding the appropriateness of fees charged to customers as the ‘Treating Customers Fairly’ campaign, which has been prevalent in South Africa for a number of years, gains traction in these territories and increased regulatory oversight is exercised over fees and commissions charged.
Knowledge-based fee income, largely associated with investment banking advisory activities, has also continued to show resilience despite tough trading conditions. The current economic uncertainty could negatively impact this line item in the near term as big financing decisions, listings and takeovers are delayed.
Fair value income
Fair value income continued to follow the volatile pattern observed in previous reporting periods and was up 10.2% on 1H14 with marginal growth of 2.8% recorded on 2H14.
Trade flows within the major banks generally benefited from increased demand for hedging and risk management products in light of the levels of market volatility prevalent over the current review period. At the same time, the trading environments remained challenging due to increased competition, compressed margins and lower volumes. We have observed that trading activities are moving towards less complex client flow activities.
The growing contribution of trading operations in the rest of Africa has been a positive development, as the banks capitalise on the increase in cross-border trading activities. The relative contribution of trading operations in the rest of Africa now constitutes a significant portion of the banks’ fair value income, although the banks have commented that given weaker fundamentals and increased competition, the strong growth experienced in the rest of Africa portfolio is expected to moderate in the near term.
Fair value income has also been affected by downward private equity revaluations at some banks and a partial recovery of insurance claims related to a commodity exposure that involved external fraud at one bank offset by a write down of the residual exposure. On the positive side, some banks have had favourable realisations/revaluations of property investments, which boosted their fair value income.
22PwCMajor banks analysis – South Africa 15 September 2015
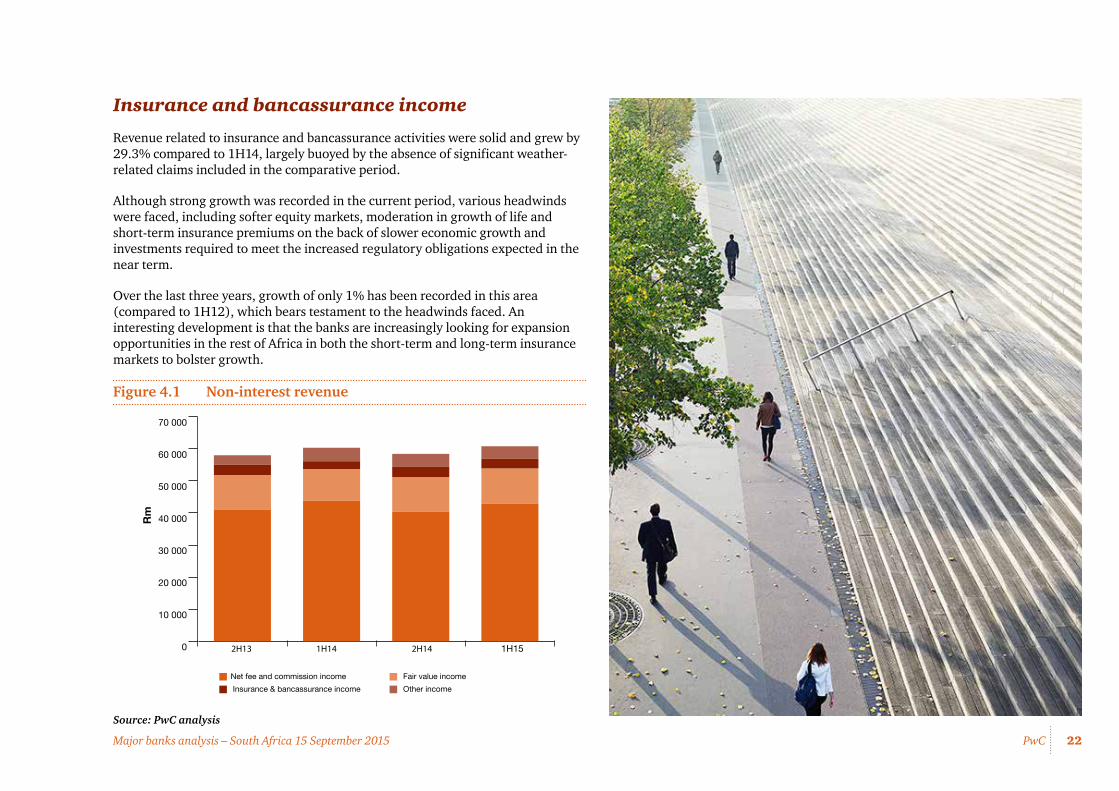
Insurance and bancassurance income
Revenue related to insurance and bancassurance activities were solid and grew by 29.3% compared to 1H14, largely buoyed by the absence of significant weather-related claims included in the comparative period.
Although strong growth was recorded in the current period, various headwinds were faced, including softer equity markets, moderation in growth of life and short-term insurance premiums on the back of slower economic growth and investments required to meet the increased regulatory obligations expected in the near term.
Over the last three years, growth of only 1% has been recorded in this area (compared to 1H12), which bears testament to the headwinds faced. An interesting development is that the banks are increasingly looking for expansion opportunities in the rest of Africa in both the short-term and long-term insurance markets to bolster growth.
Figure 4.1 Non-interest revenue
Source: PwC analysis
0
10 000
20 000
30 000
40 000
50 000
60 000
70 000
2H13 1H14 2H14 1H15
Net fee and commission income Fair value income
Insurance & bancassurance income Other income
Rm
23PwCMajor banks analysis – South Africa 15 September 2015
5. Efficiency
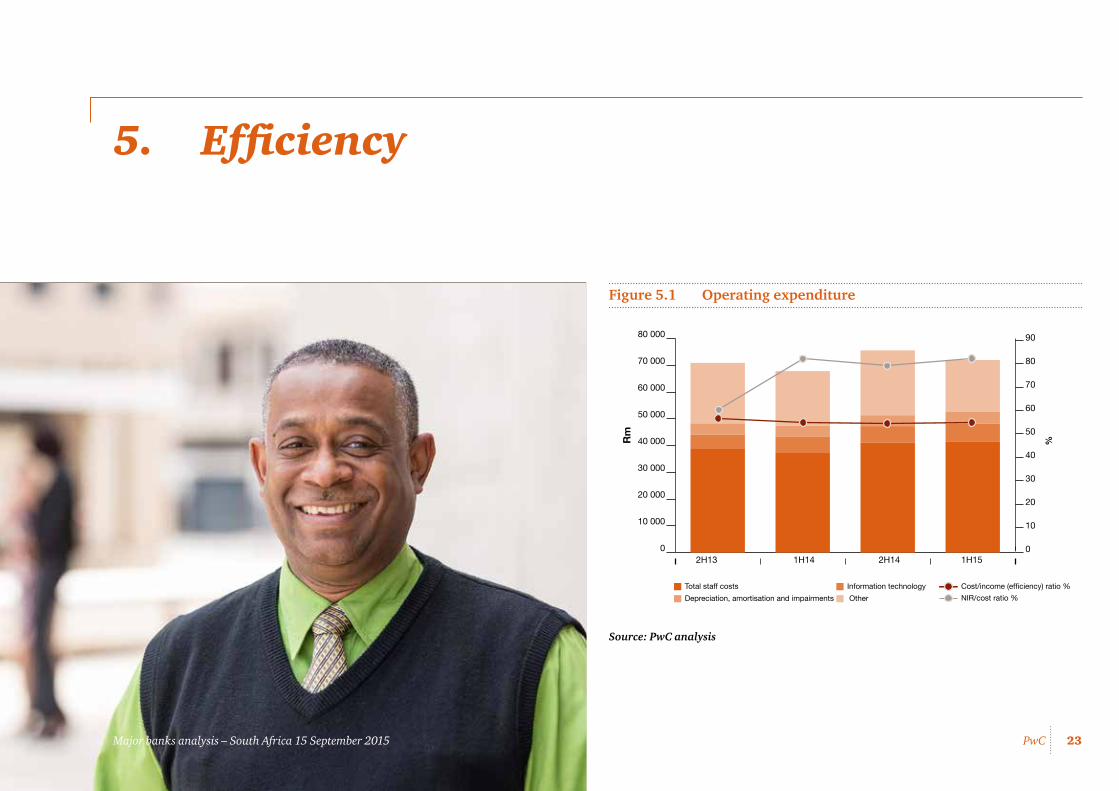
Figure 5.1 Operating expenditure
Source: PwC analysis
2H13 1H14 2H14 1H15
Total staff costs Information technology Cost/income (efficiency) ratio %
Depreciation, amortisation and impairments Other
Rm
0
10 000
20 000
30 000
40 000
50 000
60 000
70 000
80 000
0
10
20
30
40
50
60
70
80
90
NIR/cost ratio %
%
Major banks analysis – South Africa 15 September 2015
24PwCMajor banks analysis – South Africa 15 September 2015
Combined total operating expenses increased 9.0% against 1H14, while total operating income increased 8.0%. Consequently, the combined cost-to-income ratio deteriorated to 54.9 % in 1H15 (1H14: 54.7%)
Disciplined cost containment strategies, which have been in place for a number of years, continue to be an important strategic lever as achieving robust revenue growth remains challenging
Sizeable investments in information technology and adapting the retail banking franchises and physical branch networks towards the ‘bank of the future’ are being made
The major banks have continued to extract efficiencies from operations, which are reflected in a cost-to-income ratio that has marginally decreased to 54.9% (1H14: 54.7%). This is largely reflective of pressure being experienced on top-line growth. This ratio has continued on its downward trend from the highs of 59% in 2H11, as banks continue to intensify their efforts to manage costs effectively and focus on revenue growth.
As previously observed, in the short term we expect further pressure on this ratio as the major banks’ invest for future growth. A few areas where these increased costs may manifest include:
• Initiatives to right-size the branch networks and consolidate branches, coupled with increased costs to build out a branch network that is fit for the future and responsive to the changing needs of customers. As part of this strategy there may be an increase in costs in the short term as onerous lease contracts are terminated for unprofitable branches and new branches are set up.
• The banks are critically looking at internal processes and levels of automation with the aim of simplifying processes and rationalising systems where possible, with the goal of leveraging available data and ensuring an enhanced customer experience.
• Initiatives to invest in the rest of Africa, where significant investment is currently being made in infrastructure/IT systems. The inflationary environment outside South Africa is generally higher than domestically. The average USD/ZAR rate weakened from R10.70 in 1H14 to R11.91 in 1H15, placing significant additional pressure on the cost line for imported IT services. A further deterioration in the currency post 1H15 will add additional pressure.
• The major banks have commented that they are making significant investments in IT systems to meet increased regulatory requirements and heightened customer expectations of seamless transactional banking and digital solutions. Increased amortisation charges as these systems come online could also negatively impact costs. Specific areas receiving focus include the banks’ responses to the rising threat of cyber risk and overall readiness for new regulation in the form of the Basel Committee’s Principles for effective risk data aggregation and risk reporting (BCBS 239). The principles contained in this BCBS document are effective on 1 January 2017 for the majority of banks and require greater linkage between risk and finance systems and also seeks to ensure the integrity of risk data.
More than 58% of the total operating expenses of the major banks relate to staff costs, which represents an increase of the contribution of 55% at 1H14. Increased operating expenses are primarily driven by increased salary costs over the period and greater performance-related payments on the back of improved financial performance at some banks. We expect this trend to continue as specialist and skilled resources are employed to assist the banks with the IT transformation described above and to help meet the heightened levels of regulatory compliance.
Marketing and innovation costs have increased on the whole. This is testimony to the banks’ drive to improve efficiencies and growth as well as the increased competition in the context of a tough economic environment.
The major banks have to be commended on their cost utilisation strategies over the current period, which have resulted in a stable cost-to-income ratio. Over the coming period it will be interesting to see how banks react to deal with subdued global growth, a depreciating currency, creeping inflation and continuing levels of investment in IT-related costs to meet their future ambitions.
25PwCMajor banks analysis – South Africa 15 September 2015
6. Asset quality
Asset quality (Rm)
Combined
1H15 2H14 1H14 2H13
Gross loans and advances 3 287 314 3 033 571 2 945 912 2 859 262
Non-performing loans 93 685 91 690 93 923 92 714
Impairments -62 486 -60 926 -62 015 -59 764
Portfolio provisions -23 050 -21 602 -21 019 -19 418
Specific provisions -39 436 -39 324 -40 996 -40 346
Gross loans and advances
The major banks’ combined loans and advances grew by 8.4% in 1H15 compared to 2H14 and by a healthy 11.6% on a year-on-year basis. These growth rates reflect a notable increase when compared to previous rates of 3.0% in the six months to 2H14, and the 5.4% year-on-year growth recorded at 1H14.
A key factor driving rates of growth in the major banks’ gross loans and advances has been the robust demand for bank intermediated funding by the corporate sector during the first half of 2015. However, from a retail perspective, growth continues to be lacklustre.
Major banks analysis – South Africa 15 September 2015
26PwCMajor banks analysis – South Africa 15 September 2015
Corporate lending
The contrasting growth trends we observed over the last two reporting periods with regards to the corporate and retail sectors now appears to have embedded. Growth in corporate credit significantly outpaced retail credit and grew by 13.3% in the six months to 1H15, compared to 3.7% across all retail portfolios for the same period.
Nearly all of the major banks have commented on healthy corporate overdraft and general loan demand during the current period, stimulated by healthy growth in corporate credit advanced to counterparties in the rest of Africa – both in terms of credit written on the South African balance sheets and the in-country franchises of some of the major banks.
Along with general overdrafts and short-term working capital finance, key product drivers of growth in corporate lending continue to be term lending and trade finance products, which include discounted trade letters of credit and non-financial guarantees for those corporates engaged in cross-border trading activities.
At the same time, there have been a number of large transactions undertaken by corporates - and in particular private equity houses - to channel investment into the corporate sectors of some of the advanced economies, and it will be interesting to note how this trend plays out.
In addition, continued activity related to government-initiated renewable energy projects, in which all of the major banks have participated, also assisted corporate deal flows, although the significant decline in global oil prices will cast some questions over the short-term sustainability of some of these projects.
SARB data for all South African banks for the six months to June 2015 indicates that corporate credit growth in the first quarter of 2015 was dominated by these economic sectors: electricity, gas, water, agriculture, mining, real estate, construction and finance.3
Looking to the second half of 2015, a range of economic factors may restrain corporate and commercial business activity and weigh negatively on corporate credit demand. At the same time, the impact of lower oil prices is expected to continue to have a variety of implications for different sectors of the economy. Upstream oil producers will remain negatively impacted as a result of a drop-off in expected revenues, while those on the demand side are expected to continue to benefit from lower input costs of production.
However, any respite offered by lower oil prices may be short-lived given the various other commodity prices and economic variables now materially influencing the country’s economic prospects. As a result, we maintain our view that the outlook for corporate credit demand is less optimistic than it was at December 2014.
3 SARB, “Quarterly Bulletin”, June 2015 - https://www.resbank.co.za/Lists/News%20and%20Publications/Attachments/6776/01Full%20Quarterly%20Bulletin%20%E2%80%93%20June%202015.pdf
27PwCMajor banks analysis – South Africa 15 September 2015
Retail mortgages
A key trend that is now clearly evident in the major banks’ combined loan portfolios is that significant restraint has been exercised in growing retail mortgage portfolios – which now account for 27.3% of the major banks’ total gross loans and advances, down from approximately 37% just four years ago. For the current period, retail mortgage credit extended by the major banks increased by just 1.1% against 2H14, and 1.8% against the comparable period.
From an industry perspective, however, mortgages appear to still be reflecting much higher rates of growth than that seen by the major banks in their retail portfolios, suggesting that mortgage loan growth from an industry perspective considers commercial property advances, which the major banks generally report outside of their retail portfolios.
The SARB confirms this view, as reflected in this statement in its June 2015 Quarterly Bulletin:
Instalment sale credit
On a year-on-year basis, instalment sale advances grew by 8.5%, offset by a reduced rate of growth of 3% in this portfolio over the six months to 1H15.
Lending products in this portfolio are generally highly sensitive to the market interest rate cycle. Consequently, the slowdown in growth rates in this category is relatively unsurprising given the interest rate increases experienced in South Africa during 2014, with the result that higher monthly debt repayments will now start to restrain credit appetite in the sector.
The relative slowdown in this credit category reflects the extent of caution being exercised by South African households and a debt constraint by others given weak growth in national employment and income levels, which has been exacerbated by relatively tight lending conditions and a more risk-averse banking sector. At the same time, the currency weakness impacting the rand will have an implication of growth levels within this portfolio given the extent of import/export activity that affects the vehicle industry.
Card debtors and other unsecured lending
Continued strategic focus on optimising balance sheet mix relative to risk appetite levels within the various lending categories, together with adequately pricing and provisioning for risk taken on, remains a key area of focus for all of the banks, particularly in view of the volatile economic conditions and weak fundamentals at play within the country at present.
Interestingly, the other loans and advances category within the retail sector – comprised primarily of personal and unsecured lending products – saw healthy growth of 10.3% for the period to 1H15 (7% growth against 1H14). However, the contribution of other retail advances to the major banks’ total loan portfolios declined to 8.3% at 1H15 compared to 8.6% a year ago, reflecting the caution being exercised by the major banks in managing their unsecured retail credit portfolios and restricting them to remain a relatively small proportion of their total loan books.
Looking to the rest of the year, as economic uncertainty is expected to persist both from a macro and domestic perspective, together with lingering prospects of higher interest rates amid inflationary expectations, a relatively subdued outlook is expected for retail credit demand.
… the current recovery in mortgage advances has been skewed towards commercial property, while growth in mortgage advances on residential property also gained pace, albeit more modestly. The increase in mortgage advances on commercial property could partly be attributed to a rise in loans to listed property funds, some of which have been bulking up their property portfolios.
Increases in the value of new mortgage business written during the period would also have been offset to some extent by higher rates of repayment. However, accelerated capital repayments on mortgage advances – which have partly been contributing to the moderate growth in net mortgage advances over the past four years – continued to slow during 2014 and the first half of 2015, as the dual interest rate increases seen in 2014 began to set into monthly repayment obligations.
We maintain our view that incentives for the major banks to focus significantly on growing their retail mortgage portfolios appears limited, as they will rather look to deploy capital resources in higher-margin asset businesses and grow their deposit franchises given the regulatory implications on the horizon.
28PwCMajor banks analysis – South Africa 15 September 2015
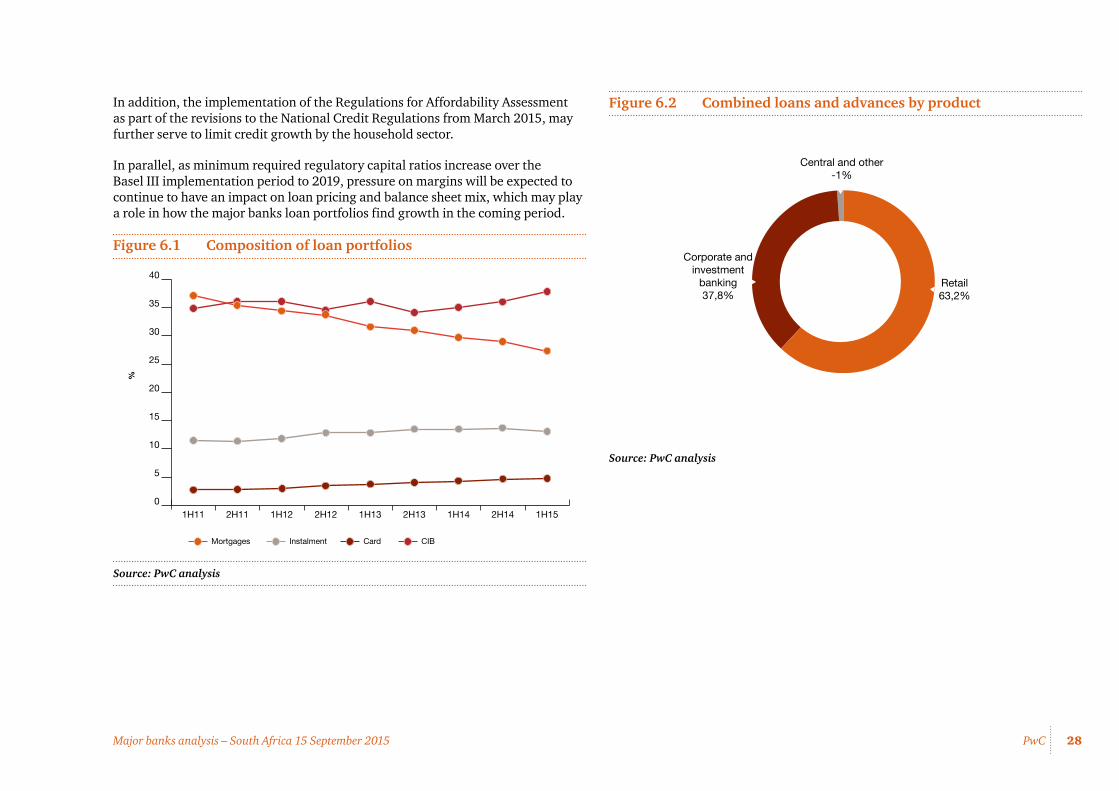
In addition, the implementation of the Regulations for Affordability Assessment as part of the revisions to the National Credit Regulations from March 2015, may further serve to limit credit growth by the household sector.
In parallel, as minimum required regulatory capital ratios increase over the Basel III implementation period to 2019, pressure on margins will be expected to continue to have an impact on loan pricing and balance sheet mix, which may play a role in how the major banks loan portfolios find growth in the coming period.
Figure 6.1 Composition of loan portfolios
Source: PwC analysis
0
5
10
15
20
25
30
35
40
1H152H141H142H131H132H121H122H111H11
Mortgages Instalment Card CIB
%
Figure 6.2 Combined loans and advances by product
Source: PwC analysis
Retail63,2%
Corporate andinvestment
banking37,8%
Central and other-1%
29PwCMajor banks analysis – South Africa 15 September 2015
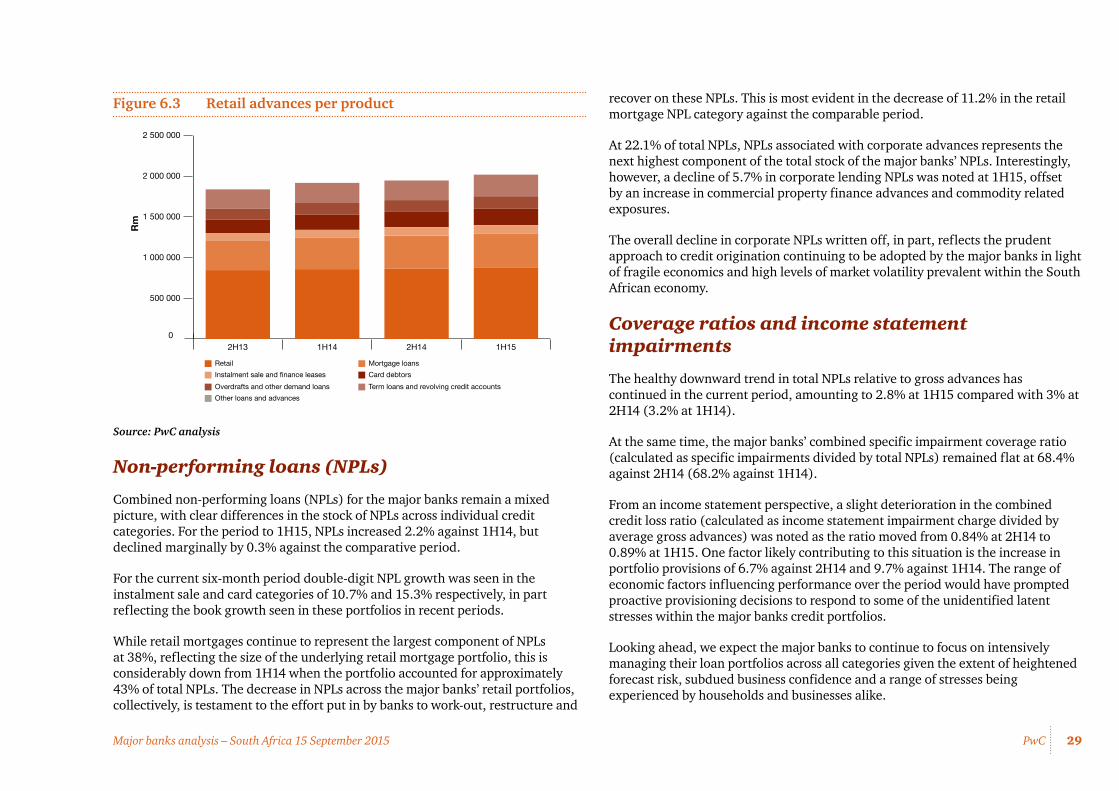
Figure 6.3 Retail advances per product
Source: PwC analysis
Non-performing loans (NPLs)
Combined non-performing loans (NPLs) for the major banks remain a mixed picture, with clear differences in the stock of NPLs across individual credit categories. For the period to 1H15, NPLs increased 2.2% against 1H14, but declined marginally by 0.3% against the comparative period.
For the current six-month period double-digit NPL growth was seen in the instalment sale and card categories of 10.7% and 15.3% respectively, in part reflecting the book growth seen in these portfolios in recent periods.
While retail mortgages continue to represent the largest component of NPLs at 38%, reflecting the size of the underlying retail mortgage portfolio, this is considerably down from 1H14 when the portfolio accounted for approximately 43% of total NPLs. The decrease in NPLs across the major banks’ retail portfolios, collectively, is testament to the effort put in by banks to work-out, restructure and
Retail Mortgage loans
Instalment sale and finance leases Card debtors
Overdrafts and other demand loans Term loans and revolving credit accounts
Other loans and advances
Rm
0
500 000
1 000 000
1 500 000
2 000 000
2 500 000
1H15 2H14 1H14 2H13
recover on these NPLs. This is most evident in the decrease of 11.2% in the retail mortgage NPL category against the comparable period.
At 22.1% of total NPLs, NPLs associated with corporate advances represents the next highest component of the total stock of the major banks’ NPLs. Interestingly, however, a decline of 5.7% in corporate lending NPLs was noted at 1H15, offset by an increase in commercial property finance advances and commodity related exposures.
The overall decline in corporate NPLs written off, in part, reflects the prudent approach to credit origination continuing to be adopted by the major banks in light of fragile economics and high levels of market volatility prevalent within the South African economy.
Coverage ratios and income statement impairments
The healthy downward trend in total NPLs relative to gross advances has continued in the current period, amounting to 2.8% at 1H15 compared with 3% at 2H14 (3.2% at 1H14).
At the same time, the major banks’ combined specific impairment coverage ratio (calculated as specific impairments divided by total NPLs) remained flat at 68.4% against 2H14 (68.2% against 1H14).
From an income statement perspective, a slight deterioration in the combined credit loss ratio (calculated as income statement impairment charge divided by average gross advances) was noted as the ratio moved from 0.84% at 2H14 to 0.89% at 1H15. One factor likely contributing to this situation is the increase in portfolio provisions of 6.7% against 2H14 and 9.7% against 1H14. The range of economic factors influencing performance over the period would have prompted proactive provisioning decisions to respond to some of the unidentified latent stresses within the major banks credit portfolios.
Looking ahead, we expect the major banks to continue to focus on intensively managing their loan portfolios across all categories given the extent of heightened forecast risk, subdued business confidence and a range of stresses being experienced by households and businesses alike.
30PwCMajor banks analysis – South Africa 15 September 2015
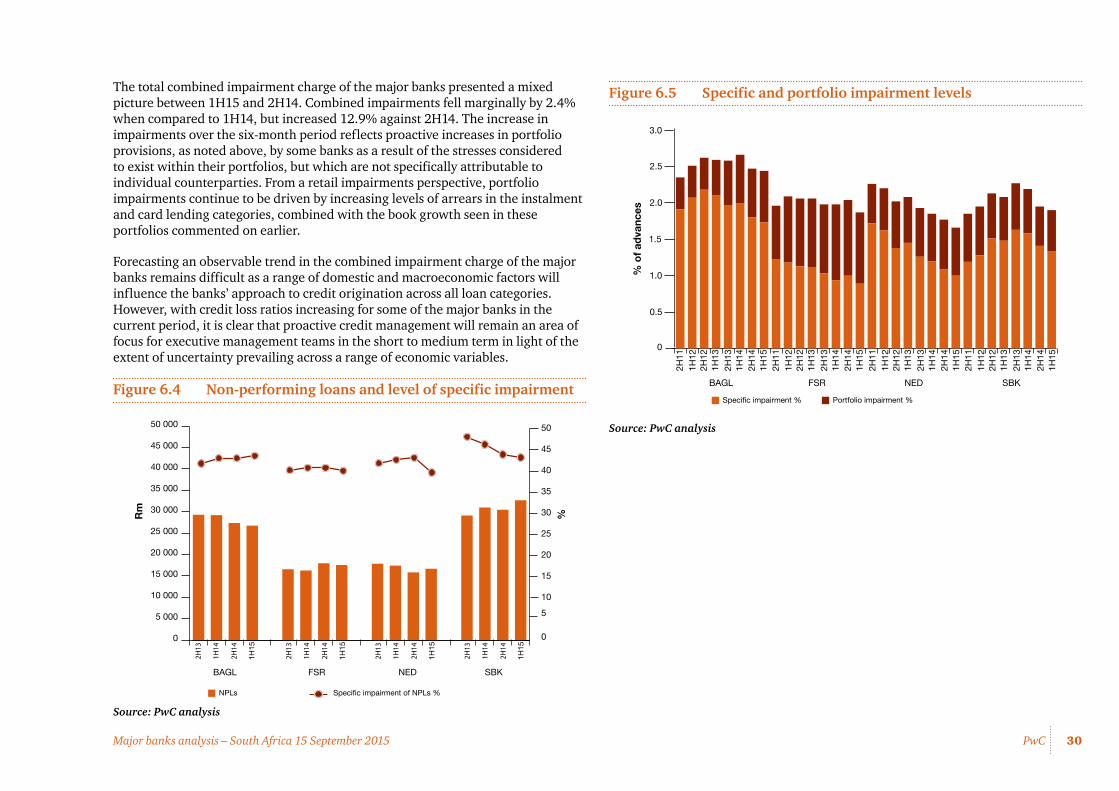
The total combined impairment charge of the major banks presented a mixed picture between 1H15 and 2H14. Combined impairments fell marginally by 2.4% when compared to 1H14, but increased 12.9% against 2H14. The increase in impairments over the six-month period reflects proactive increases in portfolio provisions, as noted above, by some banks as a result of the stresses considered to exist within their portfolios, but which are not specifically attributable to individual counterparties. From a retail impairments perspective, portfolio impairments continue to be driven by increasing levels of arrears in the instalment and card lending categories, combined with the book growth seen in these portfolios commented on earlier.
Forecasting an observable trend in the combined impairment charge of the major banks remains difficult as a range of domestic and macroeconomic factors will influence the banks’ approach to credit origination across all loan categories. However, with credit loss ratios increasing for some of the major banks in the current period, it is clear that proactive credit management will remain an area of focus for executive management teams in the short to medium term in light of the extent of uncertainty prevailing across a range of economic variables.
Figure 6.4 Non-performing loans and level of specific impairment
2H13
1H14
2H14
1H15
2H13
1H14
2H14
1H15
2H13
1H14
2H14
1H15
2H13
1H14
2H14
1H15
0
5 000
10 000
15 000
20 000
25 000
30 000
35 000
40 000
45 000
50 000
BAGL FSR NED SBK
0
5
10
15
20
25
30
35
40
45
50
NPLs Specific impairment of NPLs %
Rm
%
Figure 6.5 Specific and portfolio impairment levels
Source: PwC analysis
0
0.5
1.0
1.5
2.0
2.5
3.0
1H15
2H12
2H11
1H12
1H13
2H13
1H14
2H14
1H15
2H12
2H11
1H12
1H13
2H13
1H14
2H14
1H15
2H12
2H11
1H12
1H13
2H13
1H14
2H14
1H15
2H12
2H11
1H12
1H13
2H13
1H14
2H14
BAGL SBKNEDFSR
Specific impairment % Portfolio impairment %
% o
f ad
vanc
es
Source: PwC analysis
31PwCMajor banks analysis – South Africa 15 September 2015
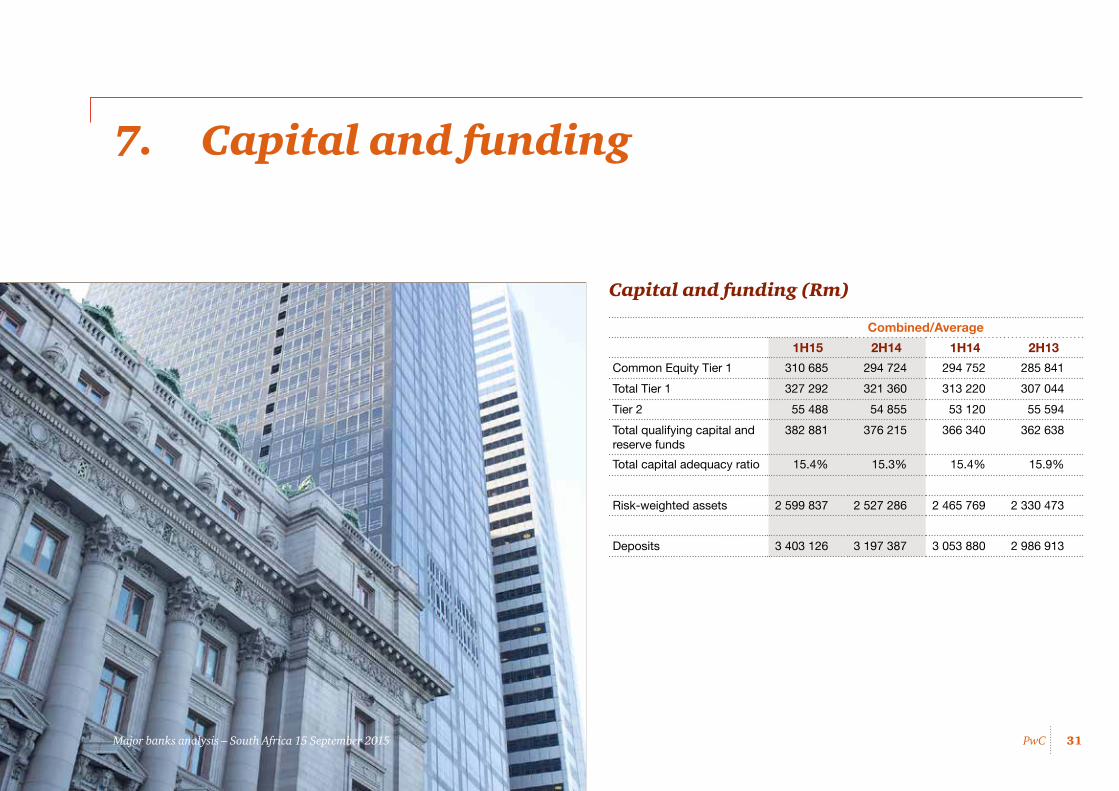
7. Capital and funding
Capital and funding (Rm)
Combined/Average
1H15 2H14 1H14 2H13
Common Equity Tier 1 310 685 294 724 294 752 285 841
Total Tier 1 327 292 321 360 313 220 307 044
Tier 2 55 488 54 855 53 120 55 594
Total qualifying capital and reserve funds
382 881 376 215 366 340 362 638
Total capital adequacy ratio 15.4% 15.3% 15.4% 15.9%
Risk-weighted assets 2 599 837 2 527 286 2 465 769 2 330 473
Deposits 3 403 126 3 197 387 3 053 880 2 986 913
Major banks analysis – South Africa 15 September 2015
32PwCMajor banks analysis – South Africa 15 September 2015
Consistent with our observations in previous periods, the major banks remain well capitalised, with total regulatory capital adequacy ratios comfortably above required minimums. However, the effects of higher risk-weighted assets and the slowing growth trend in qualifying capital resulted in a flat combined total capital adequacy ratio of 15.4% (compared to 15.4% at 1H14 and 15.3% at 2H14).
The trend of slow growth in total qualifying capital for the major banks has continued at 1H15, with total qualifying capital having grown just 1.8% compared to 2H14 (with the previous period having seen 2.7% growth for the six months to 2H14).
The combined total capital adequacy ratio of the major banks for the current review period remained largely flat at 15.4%, compared to 15.3% at 2H14 and 15.4% at 1H14.
The trend of flat capital adequacy ratios is largely consistent with the major banks’ own expectations and those of the market given the evolving prudential capital regulatory landscape, as banks move along the Basel III implementation timeline to full implementation in 2019.
A key factor that has made growing capital adequacy ratios difficult over the current period has been the growth in risk-weighted assets (RWA), which has been observed in the current period across three of the four major banks. In aggregate, total combined RWAs grew by 2.9% and 5.4% against 2H14 and 1H14 respectively, driven in particular by growth in credit RWAs, which remains the most significant component of the major banks total RWAs.
From an industry perspective, growth in credit RWAs over the current period can, in some part, be attributed to an industry-wide requirement by the SARB for a credit valuation adjustment (CVA) capital charge for over-the-counter (OTC) rand-denominated and local derivatives that are not cleared through a central counterparty.
There continues to be no central clearer for OTC derivatives in South Africa, with discussions underway at an industry level to potentially introduce a central clearer to cater for the South African market. However, the juristic form and structure that this entity may take is yet to be determined.
Additionally, growth in credit RWAs for some of the banks can be attributed to increased levels of conservatism applied in rating corporate exposures given the range of uncertain and difficult macroeconomic factors that prevailed over the current period.
At well above the required minimum of 10% (excluding the Pillar 2b bank-specific capital requirements), the total capital adequacy ratios of the major banks are indicative of the sound capital buffers they have built up and their measured approach to capital management over previous years in anticipation of regulatory changes.
While resilient growth in underlying earnings continues to positively generate capital for the banks, this has been offset by sustained growth in RWAs, as mentioned above. Given the implications of Basel III, we continue to see legacy issued additional Tier I and Tier II capital instruments being phased out in line with transitional regulatory requirements.
As expansion and earnings contribution from businesses across the continent remains a strategic focus for the major banks, South African balance sheets will need to continue to capitalise for the effect of different capital regimes across jurisdictions outside South Africa, as many countries on the continent still adopt more capital-punitive standardised approaches to risk measures for regulatory capital purposes.
It is positive to note that the banks’ combined Common Equity Tier 1 (CET 1) capital ratio – the core measure of regulatory capital under Basel III – remains resilient at 12.6% at 1H15 (12.5% at 1H14 and 12.4% at 2H14), comfortably above the required regulatory minimum.
As required regulatory capital ratios continue to rise through to 2019, with additional capital buffers including both the capital conservation and countercyclical buffers being phased in from 2016 in line with the Basel III implementation timeline, the future capital landscape is expected to remain an area of focus for the major banks.
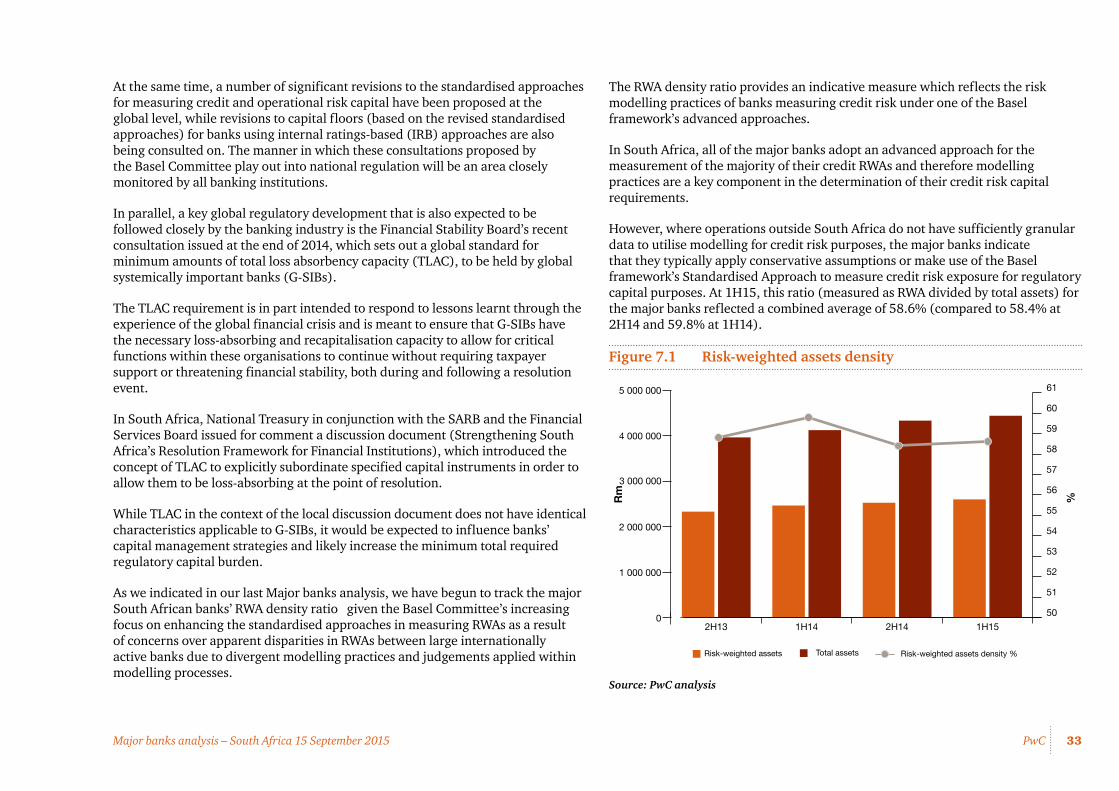
33PwCMajor banks analysis – South Africa 15 September 2015
At the same time, a number of significant revisions to the standardised approaches for measuring credit and operational risk capital have been proposed at the global level, while revisions to capital floors (based on the revised standardised approaches) for banks using internal ratings-based (IRB) approaches are also being consulted on. The manner in which these consultations proposed by the Basel Committee play out into national regulation will be an area closely monitored by all banking institutions.
In parallel, a key global regulatory development that is also expected to be followed closely by the banking industry is the Financial Stability Board’s recent consultation issued at the end of 2014, which sets out a global standard for minimum amounts of total loss absorbency capacity (TLAC), to be held by global systemically important banks (G-SIBs).
The TLAC requirement is in part intended to respond to lessons learnt through the experience of the global financial crisis and is meant to ensure that G-SIBs have the necessary loss-absorbing and recapitalisation capacity to allow for critical functions within these organisations to continue without requiring taxpayer support or threatening financial stability, both during and following a resolution event.
In South Africa, National Treasury in conjunction with the SARB and the Financial Services Board issued for comment a discussion document (Strengthening South Africa’s Resolution Framework for Financial Institutions), which introduced the concept of TLAC to explicitly subordinate specified capital instruments in order to allow them to be loss-absorbing at the point of resolution.
While TLAC in the context of the local discussion document does not have identical characteristics applicable to G-SIBs, it would be expected to influence banks’ capital management strategies and likely increase the minimum total required regulatory capital burden.
As we indicated in our last Major banks analysis, we have begun to track the major South African banks’ RWA density ratio given the Basel Committee’s increasing focus on enhancing the standardised approaches in measuring RWAs as a result of concerns over apparent disparities in RWAs between large internationally active banks due to divergent modelling practices and judgements applied within modelling processes.
The RWA density ratio provides an indicative measure which reflects the risk modelling practices of banks measuring credit risk under one of the Basel framework’s advanced approaches.
In South Africa, all of the major banks adopt an advanced approach for the measurement of the majority of their credit RWAs and therefore modelling practices are a key component in the determination of their credit risk capital requirements.
However, where operations outside South Africa do not have sufficiently granular data to utilise modelling for credit risk purposes, the major banks indicate that they typically apply conservative assumptions or make use of the Basel framework’s Standardised Approach to measure credit risk exposure for regulatory capital purposes. At 1H15, this ratio (measured as RWA divided by total assets) for the major banks reflected a combined average of 58.6% (compared to 58.4% at 2H14 and 59.8% at 1H14).
Figure 7.1 Risk-weighted assets density
Source: PwC analysis
Risk-weighted assets Total assets
0
1 000 000
2 000 000
3 000 000
4 000 000
5 000 000
1H152H141H142H13
50
51
52
53
54
55
56
57
58
59
60
61
Risk-weighted assets density %
Rm
%
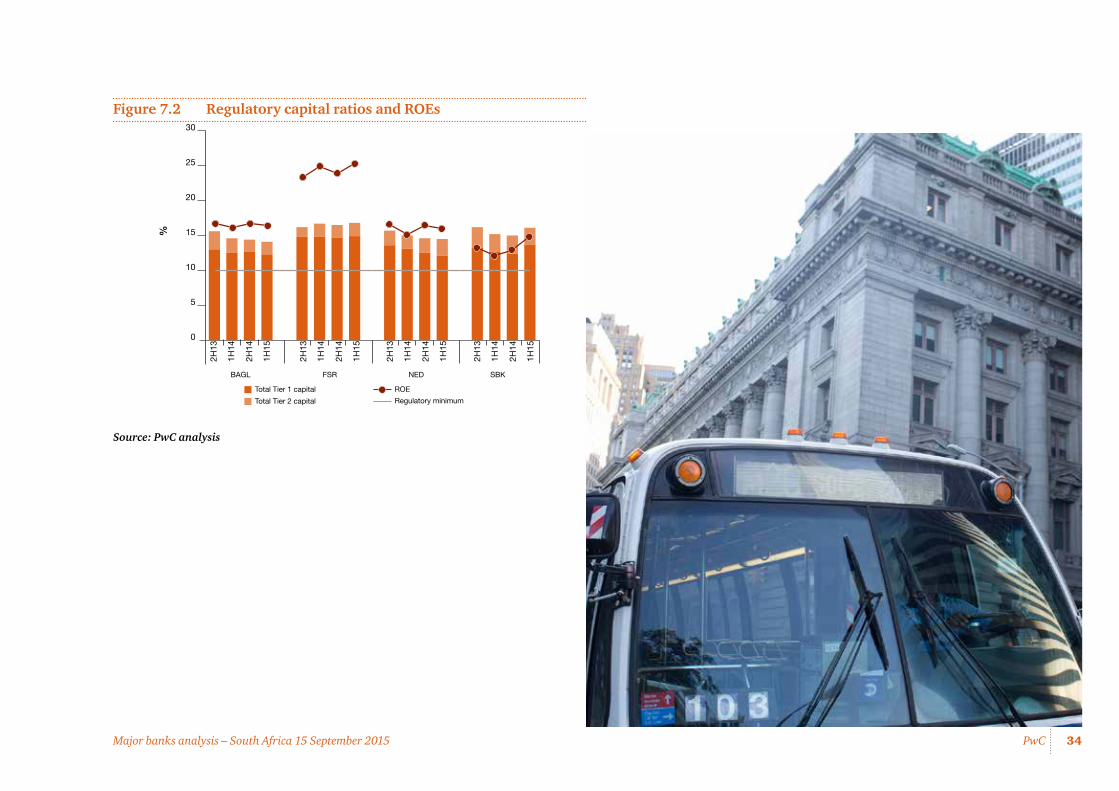
34PwCMajor banks analysis – South Africa 15 September 2015
Figure 7.2 Regulatory capital ratios and ROEs
Source: PwC analysis
Total Tier 1 capital
BAGL FSR NED SBK
ROE
Total Tier 2 capital
%
Regulatory minimum
0
5
10
15
20
25
30
2H13
1H14
2H14
1H15
2H13
1H14
2H14
1H15
2H13
1H14
2H14
1H15
2H13
1H14
2H14
1H15
Resilient growth in transactional banking attracting deposits
Growth in the major banks’ total deposits for 1H15 was admirable, growing by 6.4% compared to 2H14, and by a healthy 11.4% against 1H14.
The major banks have consistently reported robust loan-to-deposit ratios (calculated as total deposits divided by total banking-book assets) and this trend continued in the current period boosted by healthy deposit book growth, with the combined ratio of 96.6% at 1H15 reflecting the success achieved in growing and enhancing their deposit-taking franchises. However, when compared to the 96.5% reported at 1H14, the intensity of competition for wallet share, across both the retail and corporate transactional banking sectors, remains evident.
Given the regulatory requirements regarding liquidity, we continue to observe significant efforts by the banks to diversify their deposit bases, particularly as a result of the introduction of the first prudential liquidity ratio the liquidity coverage ratio (LCR) – which came into effect on 1 January 2015 as a prudential requirement.
The LCR is currently being phased in over the Basel III implementation timeline to reach 100% by 2019, with the requirement for 2015 being 60%. All of the banks indicate that they believe they are well-positioned to meet the increasing LCR requirements over the phase-in period as a result of accumulating surplus liquidity buffers in previous periods in anticipation of these regulatory requirements.
However, as is the case in numerous other emerging market economies, the complying with the Net Stable Funding Ratio (NSFR), which was also introduced as part of the Basel III regulatory reform package, will present an increasingly severe challenge to South African banks. The NSFR will require banks to ensure that longer-dated assets are funded with longer-dated and more stable sources of funding, both of which are difficult to source to the extent required by the NSFR in emerging market economies like South Africa.
The generally short-term funding structure of the South African economy, together with relatively longer-dated banking assets on the back of strong mortgage loan growth in previous periods, results in material contractual liquidity mismatches in the domestic banking sector.
Consequently, liquidity management is typically undertaken on a behavioural as opposed to a contractual basis. As we have noted in our previous version of the Major banks analysis, while some of these contractual liquidity mismatches are mitigated by the closed-rand settlement system operated in South Africa, the NSFR in particular will present strategic challenges to the banks and will require an active focus on lengthening the tenor of their funding profiles.
Ongoing impact analysis and engagement by all of the major banks through the Banking Association of South Africa and the SARB is underway to address the current shortfall in available stable funding for the NSFR, which becomes effective on 1 January 2018.
At the same time, the South African economy remains underpinned by persistently high levels of unemployment, challenges in driving up real wage growth, a relatively low discretionary savings rate and household debt-to-income ratios that remain at high levels relative to a number of both advanced and emerging economies. As the fight for deposits intensifies, the structural weaknesses in the domestic economy will remain a challenge to contend with for the banks as they seek to innovate and actively grow their deposit-taking products and franchises.
An interesting topic under discussion at present is the potential introduction of deposit insurance in the South African market. South Africa does not presently have a privately-financed deposit insurance or resolution fund, and where bank failures have been encountered in the past, retail depositors would have been compensated primarily through public funds, without explicit arrangements for the recovery of these funds.
While there are considerations being discussed both in favour and against deposit insurance, it will be interesting to see what impact the introduction of a deposit insurance scheme in South Africa would have on the major banks’ LCR and NSFR ratios.
The evolving regulatory environment continues to impact the major banks’ funding strategies and business models, which has led them to focus in recent years on enhancing and diversifying their retail and corporate transactional banking franchises, while strategically considering where within the banking groups these businesses and their product sets are best positioned.
36PwCMajor banks analysis – South Africa 15 September 2015
8. Project Blue 2.0
Assessingthefuturetrendsforfinancialservices
The financial services industry is set for transformation as its role, industry structure and commercial realities are disrupted by the major trends reshaping the global economy and competitive landscape. As smart and agile players leapfrog slower moving competitors, many businesses will be unrecognisable and the list of market leaders could be very different by the end of the decade.
PwC’s proprietary Project Blue framework:
• Helps financial services institutions assess these trends and how they impact their strategy and business model. Seeing the future clearly and developing a proactive response – rather than simply reacting to events – will be a key source of competitive advantage in a fast-evolving market;
• Considers the rise and inter-connectivity of emerging markets and state-directed approaches to economic development; and
• Examines the impact of new technology, demographics, changing customer behaviour and mounting pressure on the world’s most critical natural resources.
Rather than offering one way forward, the Project Blue framework recognises that whether these developments are threats or opportunities depends on the nature of a particular organisation. The results will help to target investment, identify talent requirements and develop the necessary operational capabilities needed to make the most of competitive potential.
Major banks analysis – South Africa 15 September 2015
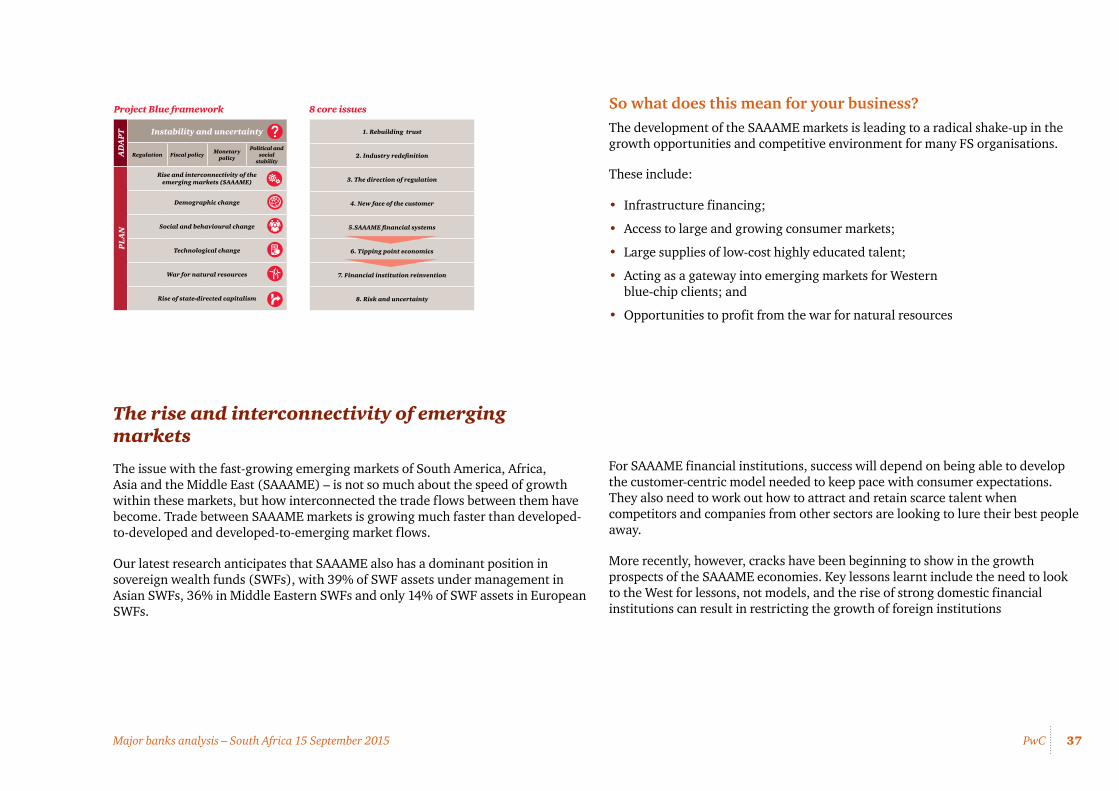
37PwCMajor banks analysis – South Africa 15 September 2015
The rise and interconnectivity of emerging markets
The issue with the fast-growing emerging markets of South America, Africa, Asia and the Middle East (SAAAME) – is not so much about the speed of growth within these markets, but how interconnected the trade flows between them have become. Trade between SAAAME markets is growing much faster than developed-to-developed and developed-to-emerging market flows.
Our latest research anticipates that SAAAME also has a dominant position in sovereign wealth funds (SWFs), with 39% of SWF assets under management in Asian SWFs, 36% in Middle Eastern SWFs and only 14% of SWF assets in European SWFs.
So what does this mean for your business?The development of the SAAAME markets is leading to a radical shake-up in the growth opportunities and competitive environment for many FS organisations.
1. Rebuilding trust
2. Industry redefinition
3. The direction of regulation
4. New face of the customer
5.SAAAME financial systems
6. Tipping point economics
7. Financial institution reinvention
8. Risk and uncertainty
Blue 2.0: Redefining financial services explores the eight core issues that are transforming the financial services landscape
Blue 1.0: Global trends Blue 2.0: Redefining financial services
PwC Project Blue 2.0: Redefining financial services
The FS sector 2020 series
Relevant Megatrends
So what for the industry
So what for companies
8 core issuesProject Blue frameworkA
DA
PT
Instability and uncertainty
Regulation Fiscal policy Monetary policy
Political and social
stability
PL
AN
Rise and interconnectivity of the emerging markets (SAAAME)
Demographic change
Social and behavioural change
Technological change
War for natural resources
Rise of state-directed capitalism
1 2 3
These include:
• Infrastructure financing;
• Access to large and growing consumer markets;
• Large supplies of low-cost highly educated talent;
• Acting as a gateway into emerging markets for Western blue-chip clients; and
• Opportunities to profit from the war for natural resources
For SAAAME financial institutions, success will depend on being able to develop the customer-centric model needed to keep pace with consumer expectations. They also need to work out how to attract and retain scarce talent when competitors and companies from other sectors are looking to lure their best people away.
More recently, however, cracks have been beginning to show in the growth prospects of the SAAAME economies. Key lessons learnt include the need to look to the West for lessons, not models, and the rise of strong domestic financial institutions can result in restricting the growth of foreign institutions
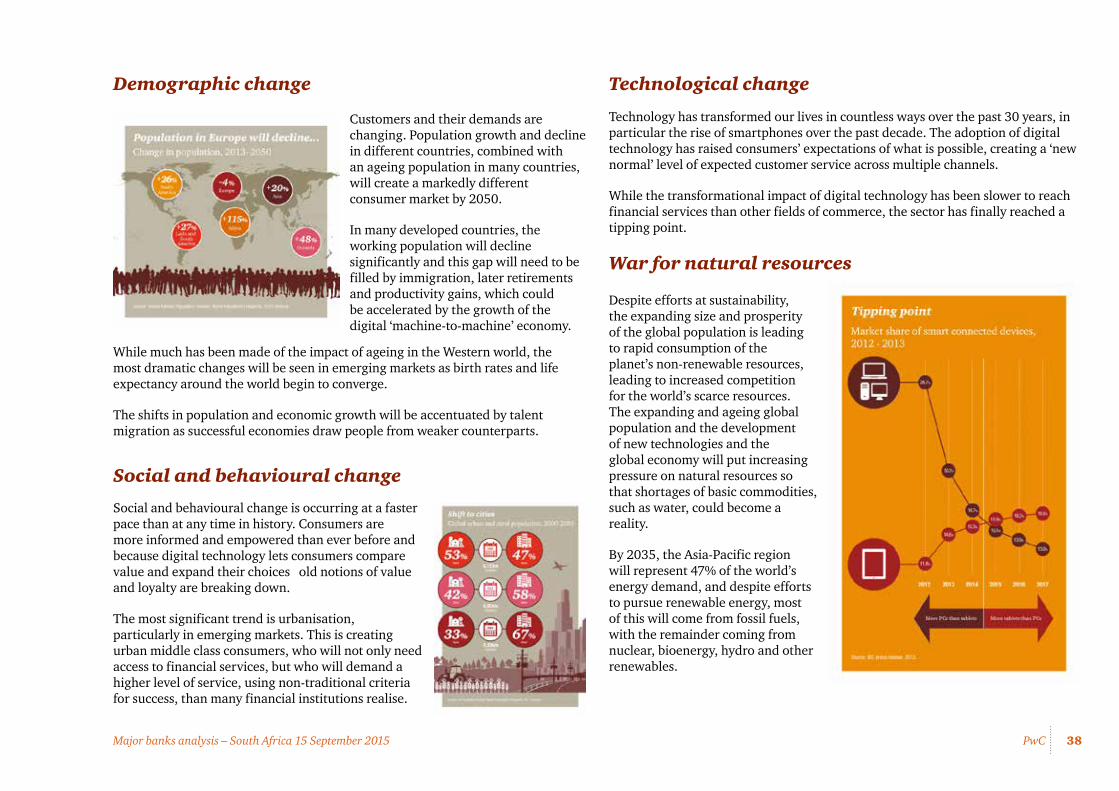
38PwCMajor banks analysis – South Africa 15 September 2015
Demographic change Technological change
Technology has transformed our lives in countless ways over the past 30 years, in particular the rise of smartphones over the past decade. The adoption of digital technology has raised consumers’ expectations of what is possible, creating a ‘new normal’ level of expected customer service across multiple channels.
While the transformational impact of digital technology has been slower to reach financial services than other fields of commerce, the sector has finally reached a tipping point.
War for natural resources
Social and behavioural change
Customers and their demands are changing. Population growth and decline in different countries, combined with an ageing population in many countries, will create a markedly different consumer market by 2050.
In many developed countries, the working population will decline significantly and this gap will need to be filled by immigration, later retirements and productivity gains, which could be accelerated by the growth of the digital ‘machine-to-machine’ economy.
While much has been made of the impact of ageing in the Western world, the most dramatic changes will be seen in emerging markets as birth rates and life expectancy around the world begin to converge.
The shifts in population and economic growth will be accentuated by talent migration as successful economies draw people from weaker counterparts.
Social and behavioural change is occurring at a faster pace than at any time in history. Consumers are more informed and empowered than ever before and because digital technology lets consumers compare value and expand their choices old notions of value and loyalty are breaking down.
The most significant trend is urbanisation, particularly in emerging markets. This is creating urban middle class consumers, who will not only need access to financial services, but who will demand a higher level of service, using non-traditional criteria for success, than many financial institutions realise.
Despite efforts at sustainability, the expanding size and prosperity of the global population is leading to rapid consumption of the planet’s non-renewable resources, leading to increased competition for the world’s scarce resources. The expanding and ageing global population and the development of new technologies and the global economy will put increasing pressure on natural resources so that shortages of basic commodities, such as water, could become a reality.
By 2035, the Asia-Pacific region will represent 47% of the world’s energy demand, and despite efforts to pursue renewable energy, most of this will come from fossil fuels, with the remainder coming from nuclear, bioenergy, hydro and other renewables.
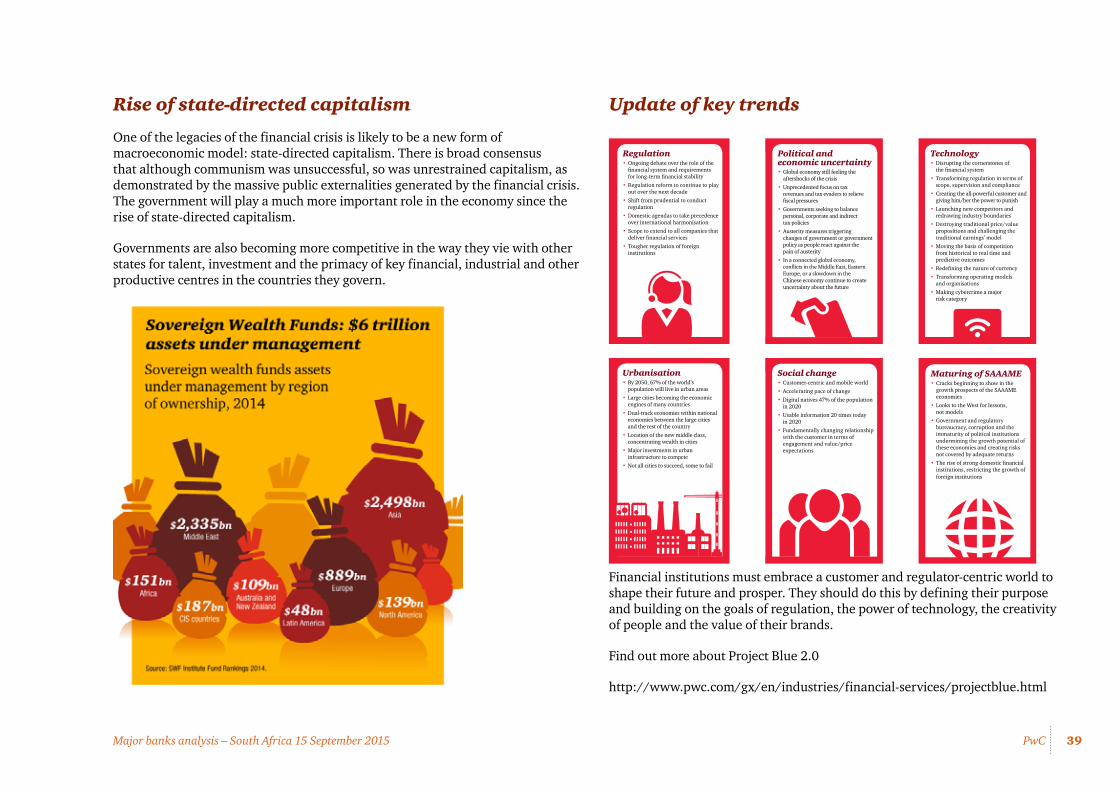
39PwCMajor banks analysis – South Africa 15 September 2015
Rise of state-directed capitalism
One of the legacies of the financial crisis is likely to be a new form of macroeconomic model: state-directed capitalism. There is broad consensus that although communism was unsuccessful, so was unrestrained capitalism, as demonstrated by the massive public externalities generated by the financial crisis. The government will play a much more important role in the economy since the rise of state-directed capitalism.
Governments are also becoming more competitive in the way they vie with other states for talent, investment and the primacy of key financial, industrial and other productive centres in the countries they govern.
Update of key trends
PwC Project Blue 2.0: Redefining financial services
Update on key trends
Regulation• Ongoing debate over the role of the
financial system and requirements for long-term financial stability
• Regulation reform to continue to play out over the next decade
• Shift from prudential to conduct regulation
• Domestic agendas to take precedence over international harmonisation
• Scope to extend to all companies that deliver financial services
• Tougher regulation of foreign institutions
Technology• Disrupting the cornerstones of
the financial system• Transforming regulation in terms of
scope, supervision and compliance• Creating the all-powerful customer and
giving him/her the power to punish • Launching new competitors and
redrawing industry boundaries• Destroying traditional price/value
propositions and challenging the traditional earnings’ model
• Moving the basis of competition from historical to real time and predictive outcomes
• Redefining the nature of currency• Transforming operating models
and organisations• Making cybercrime a major
risk category
Political and economic uncertainty• Global economy still feeling the
aftershocks of the crisis • Unprecedented focus on tax
revenues and tax evaders to relieve fiscal pressures
• Governments seeking to balance personal, corporate and indirect tax policies
• Austerity measures triggering changes of government or government policy as people react against the pain of austerity
• In a connected global economy, conflicts in the Middle East, Eastern Europe, or a slowdown in the Chinese economy continue to create uncertainty about the future
Social change• Customer-centric and mobile world• Accelerating pace of change • Digital natives 47% of the population
in 2020• Usable information 20 times today
in 2020• Fundamentally changing relationship
with the customer in terms of engagement and value/price expectations
Urbanisation• By 2050, 67% of the world’s
population will live in urban areas• Large cities becoming the economic
engines of many countries• Dual-track economies within national
economies between the large cities and the rest of the country
• Location of the new middle class, concentrating wealth in cities
• Major investments in urban infrastructure to compete
• Not all cities to succeed, some to fail
Maturing of SAAAME• Cracks beginning to show in the
growth prospects of the SAAAME economies
• Looks to the West for lessons, not models
• Government and regulatory bureaucracy, corruption and the immaturity of political institutions undermining the growth potential of these economies and creating risks not covered by adequate returns
• The rise of strong domestic financial institutions, restricting the growth of foreign institutions
Financial institutions must embrace a customer and regulator-centric world to shape their future and prosper. They should do this by defining their purpose and building on the goals of regulation, the power of technology, the creativity of people and the value of their brands.
Find out more about Project Blue 2.0
http://www.pwc.com/gx/en/industries/financial-services/projectblue.html
40PwCMajor banks analysis – South Africa March 2015
9. Hot off the press
RecentPwCfinancialservicesandrelatedpublications
http://www.pwc.com/gx/en/banking-capital-markets/capital-markets-2020/download.jhtml
Capital Markets 2020 – Will it change for good?
The world of 2020 will be more complex for the users of capital markets. More fragmented providers, fewer products, less customisation and higher cost of services will be the order of the day.
Successfully managing risk, liquidity, funding and investment returns in this world will require greater focus, attention and creativity than before.
www.pwc.com/banking
Capital Markets 2020 Will it change for good?
Key messages and questions for relationship teams to put to clients/prospective clientsFor internal use only
Are capital markets participants and users prepared and capable to re-imagine the future, innovate and compete against this still unfolding backdrop?
Major banks analysis – South Africa 15 September 2015
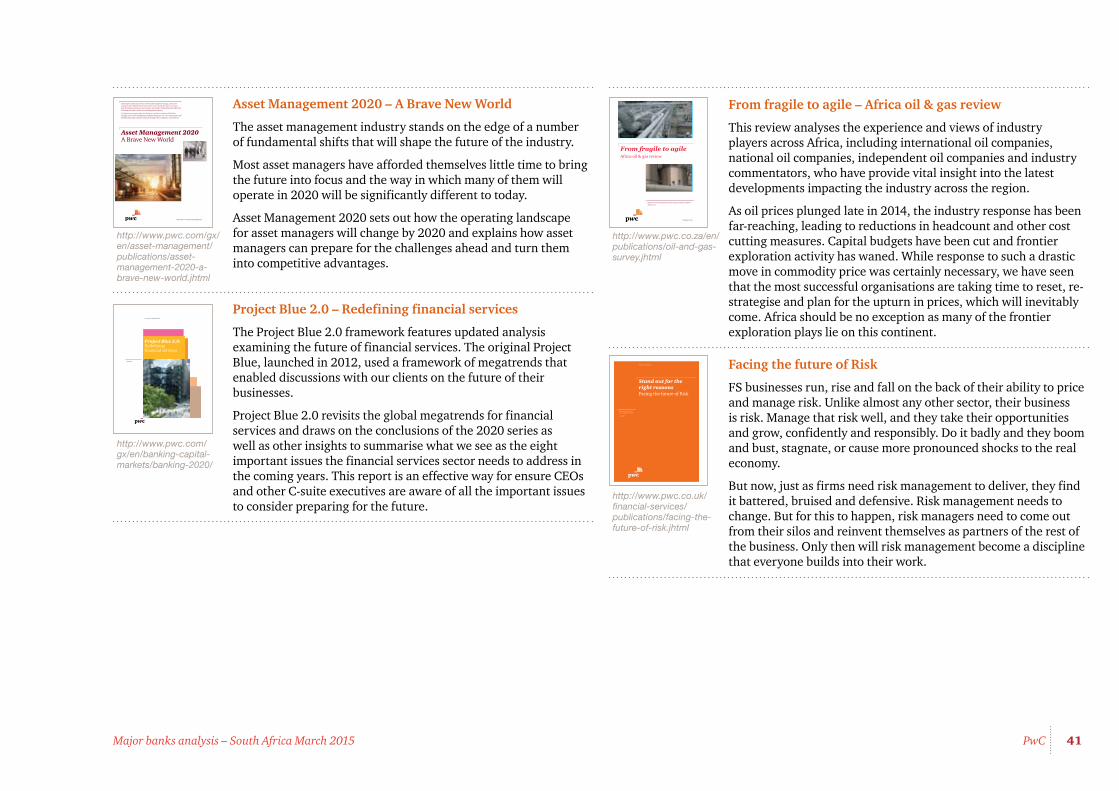
41PwCMajor banks analysis – South Africa March 2015
http://www.pwc.com/gx/en/asset-management/publications/asset-management-2020-a-brave-new-world.jhtml
Asset Management 2020 – A Brave New World
The asset management industry stands on the edge of a number of fundamental shifts that will shape the future of the industry.
Most asset managers have afforded themselves little time to bring the future into focus and the way in which many of them will operate in 2020 will be significantly different to today.
Asset Management 2020 sets out how the operating landscape for asset managers will change by 2020 and explains how asset managers can prepare for the challenges ahead and turn them into competitive advantages.
http://www.pwc.com/gx/en/banking-capital-markets/banking-2020/
Project Blue 2.0 – Redefining financial services
The Project Blue 2.0 framework features updated analysis examining the future of financial services. The original Project Blue, launched in 2012, used a framework of megatrends that enabled discussions with our clients on the future of their businesses.
Project Blue 2.0 revisits the global megatrends for financial services and draws on the conclusions of the 2020 series as well as other insights to summarise what we see as the eight important issues the financial services sector needs to address in the coming years. This report is an effective way for ensure CEOs and other C-suite executives are aware of all the important issues to consider preparing for the future.
www.pwc.com/assetmanagement
Asset Management 2020 A Brave New World
Amid unprecedented economic turmoil and regulatory change, most asset managers have afforded themselves little time to bring the future into focus. But the industry stands on the precipice of a number of fundamental shifts that will shape the future of the asset management industry.
To help asset managers plan for the future, we have considered the likely changes in the asset management industry landscape over the coming years and identified key gamechangers which will impact the competitive environment.
Project Blue 2.0:Redefining financial services
www.pwc.com/projectblue
July 2015
http://www.pwc.co.za/en/publications/oil-and-gas-survey.jhtml
From fragile to agile – Africa oil & gas review
This review analyses the experience and views of industry players across Africa, including international oil companies, national oil companies, independent oil companies and industry commentators, who have provide vital insight into the latest developments impacting the industry across the region.
As oil prices plunged late in 2014, the industry response has been far-reaching, leading to reductions in headcount and other cost cutting measures. Capital budgets have been cut and frontier exploration activity has waned. While response to such a drastic move in commodity price was certainly necessary, we have seen that the most successful organisations are taking time to reset, re-strategise and plan for the upturn in prices, which will inevitably come. Africa should be no exception as many of the frontier exploration plays lie on this continent.
http://www.pwc.co.uk/financial-services/publications/facing-the-future-of-risk.jhtml
Facing the future of Risk
FS businesses run, rise and fall on the back of their ability to price and manage risk. Unlike almost any other sector, their business is risk. Manage that risk well, and they take their opportunities and grow, confidently and responsibly. Do it badly and they boom and bust, stagnate, or cause more pronounced shocks to the real economy.
But now, just as firms need risk management to deliver, they find it battered, bruised and defensive. Risk management needs to change. But for this to happen, risk managers need to come out from their silos and reinvent themselves as partners of the rest of the business. Only then will risk management become a discipline that everyone builds into their work.
www.pwc.co.za
From fragile to agileAfrica oil & gas review
Report on current developments in the oil & gas industry in Africa. August 2015
Stand out for the right reasonsFacing the future of Risk
www.pwc.co.uk/fsrr
How financial services firms can get risk-ready
July 2015
42PwCMajor banks analysis – South Africa 15 September 2015
10. Key banking statistics
Major banks analysis – South Africa 15 September 2015
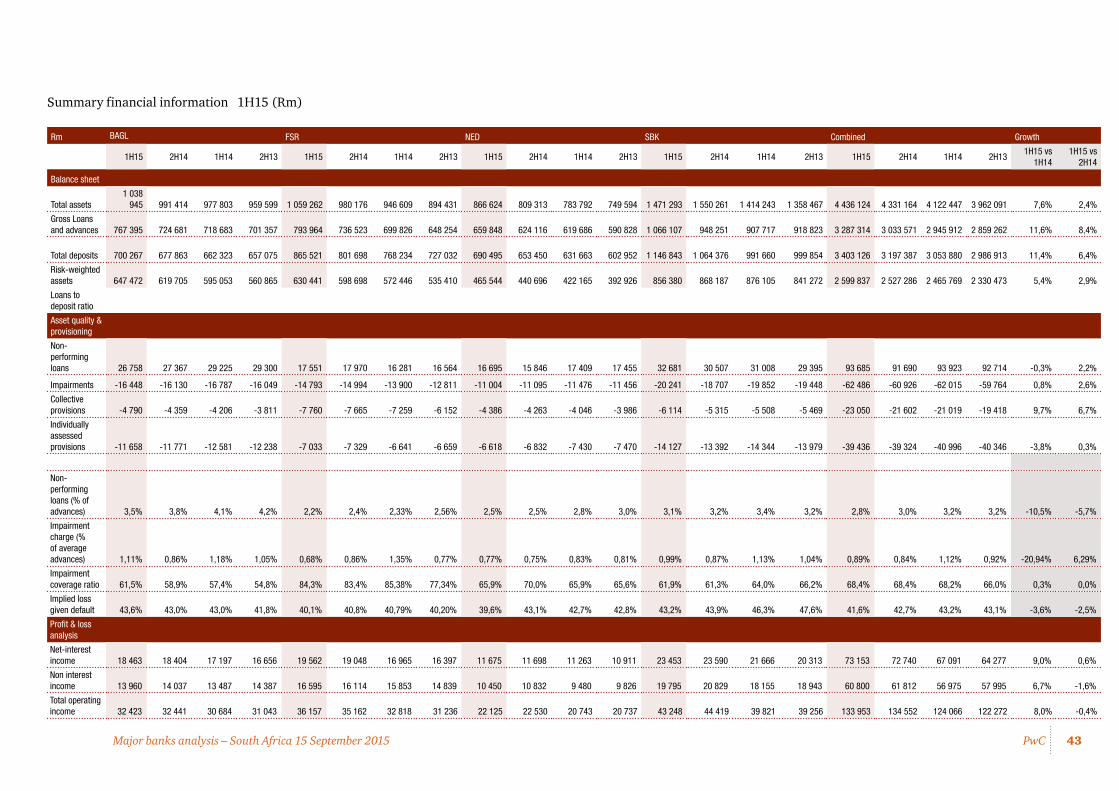
43PwCMajor banks analysis – South Africa 15 September 2015
Summary financial information 1H15 (Rm)
Rm BAGL FSR NED SBK Combined Growth
1H15 2H14 1H14 2H13 1H15 2H14 1H14 2H13 1H15 2H14 1H14 2H13 1H15 2H14 1H14 2H13 1H15 2H14 1H14 2H13 1H15 vs
1H141H15 vs
2H14
Balance sheet
Total assets 1 038
945 991 414 977 803 959 599
1 059 262 980 176 946 609 894 431 866 624 809 313 783 792 749 594
1 471 293 1 550 261 1 414 243 1 358 467 4 436 124 4 331 164
4 122 447
3 962 091 7,6% 2,4%
Gross Loans and advances 767 395 724 681 718 683 701 357 793 964 736 523 699 826 648 254 659 848 624 116 619 686 590 828
1 066 107 948 251 907 717 918 823 3 287 314 3 033 571
2 945 912
2 859 262 11,6% 8,4%
Total deposits 700 267 677 863 662 323 657 075 865 521 801 698 768 234 727 032 690 495 653 450 631 663 602 952
1 146 843 1 064 376 991 660 999 854 3 403 126 3 197 387
3 053 880
2 986 913 11,4% 6,4%
Risk-weighted assets 647 472 619 705 595 053 560 865 630 441 598 698 572 446 535 410 465 544 440 696 422 165 392 926 856 380 868 187 876 105 841 272 2 599 837 2 527 286
2 465 769
2 330 473 5,4% 2,9%
Loans to deposit ratio
Asset quality & provisioning
Non-performing loans 26 758 27 367 29 225 29 300 17 551 17 970 16 281 16 564 16 695 15 846 17 409 17 455 32 681 30 507 31 008 29 395 93 685 91 690 93 923 92 714 -0,3% 2,2%
Impairments -16 448 -16 130 -16 787 -16 049 -14 793 -14 994 -13 900 -12 811 -11 004 -11 095 -11 476 -11 456 -20 241 -18 707 -19 852 -19 448 -62 486 -60 926 -62 015 -59 764 0,8% 2,6%
Collective provisions -4 790 -4 359 -4 206 -3 811 -7 760 -7 665 -7 259 -6 152 -4 386 -4 263 -4 046 -3 986 -6 114 -5 315 -5 508 -5 469 -23 050 -21 602 -21 019 -19 418 9,7% 6,7%
Individually assessed provisions -11 658 -11 771 -12 581 -12 238 -7 033 -7 329 -6 641 -6 659 -6 618 -6 832 -7 430 -7 470 -14 127 -13 392 -14 344 -13 979 -39 436 -39 324 -40 996 -40 346 -3,8% 0,3%
Non-performing loans (% of advances) 3,5% 3,8% 4,1% 4,2% 2,2% 2,4% 2,33% 2,56% 2,5% 2,5% 2,8% 3,0% 3,1% 3,2% 3,4% 3,2% 2,8% 3,0% 3,2% 3,2% -10,5% -5,7%
Impairment charge (% of average advances) 1,11% 0,86% 1,18% 1,05% 0,68% 0,86% 1,35% 0,77% 0,77% 0,75% 0,83% 0,81% 0,99% 0,87% 1,13% 1,04% 0,89% 0,84% 1,12% 0,92% -20,94% 6,29%
Impairment coverage ratio 61,5% 58,9% 57,4% 54,8% 84,3% 83,4% 85,38% 77,34% 65,9% 70,0% 65,9% 65,6% 61,9% 61,3% 64,0% 66,2% 68,4% 68,4% 68,2% 66,0% 0,3% 0,0%
Implied loss given default 43,6% 43,0% 43,0% 41,8% 40,1% 40,8% 40,79% 40,20% 39,6% 43,1% 42,7% 42,8% 43,2% 43,9% 46,3% 47,6% 41,6% 42,7% 43,2% 43,1% -3,6% -2,5%
Profit & loss analysis
Net-interest income 18 463 18 404 17 197 16 656 19 562 19 048 16 965 16 397 11 675 11 698 11 263 10 911 23 453 23 590 21 666 20 313 73 153 72 740 67 091 64 277 9,0% 0,6%
Non interest income 13 960 14 037 13 487 14 387 16 595 16 114 15 853 14 839 10 450 10 832 9 480 9 826 19 795 20 829 18 155 18 943 60 800 61 812 56 975 57 995 6,7% -1,6%
Total operating income 32 423 32 441 30 684 31 043 36 157 35 162 32 818 31 236 22 125 22 530 20 743 20 737 43 248 44 419 39 821 39 256 133 953 134 552 124 066 122 272 8,0% -0,4%
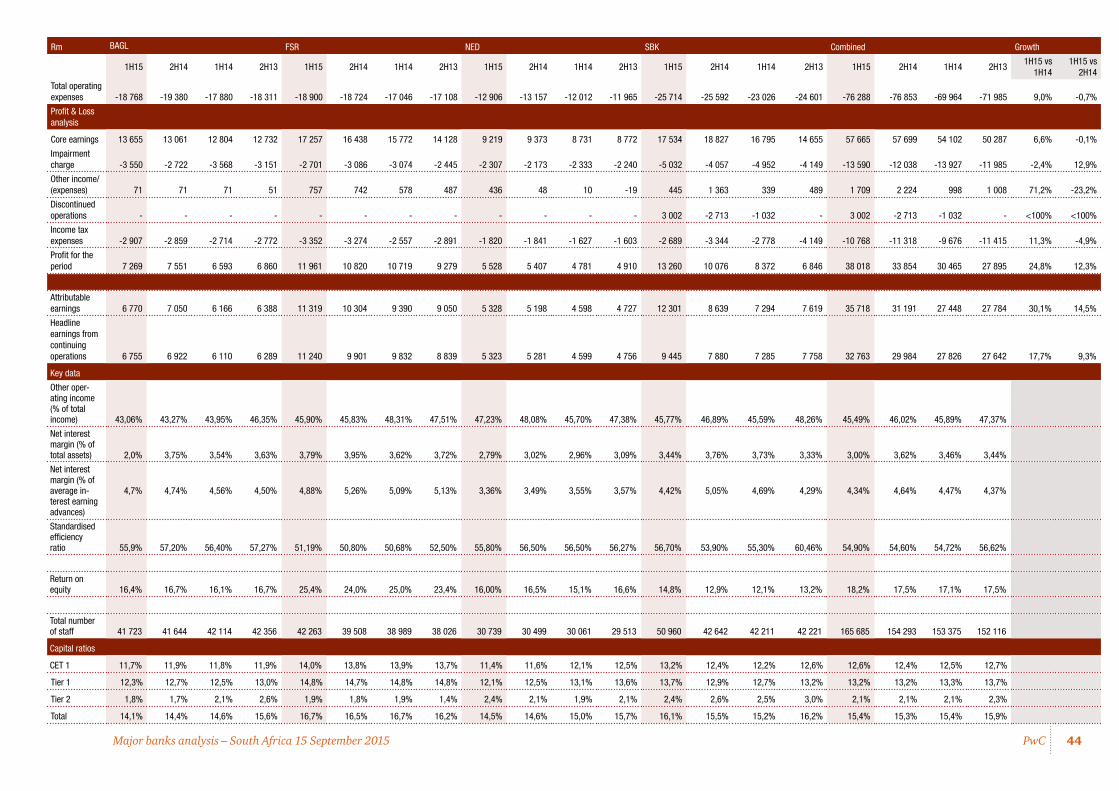
44PwCMajor banks analysis – South Africa 15 September 2015
Rm BAGL FSR NED SBK Combined Growth
1H15 2H14 1H14 2H13 1H15 2H14 1H14 2H13 1H15 2H14 1H14 2H13 1H15 2H14 1H14 2H13 1H15 2H14 1H14 2H13 1H15 vs
1H141H15 vs
2H14
Total operating expenses -18 768 -19 380 -17 880 -18 311 -18 900 -18 724 -17 046 -17 108 -12 906 -13 157 -12 012 -11 965 -25 714 -25 592 -23 026 -24 601 -76 288 -76 853 -69 964 -71 985 9,0% -0,7%
Profit & Loss analysis
Core earnings 13 655 13 061 12 804 12 732 17 257 16 438 15 772 14 128 9 219 9 373 8 731 8 772 17 534 18 827 16 795 14 655 57 665 57 699 54 102 50 287 6,6% -0,1%
Impairment charge -3 550 -2 722 -3 568 -3 151 -2 701 -3 086 -3 074 -2 445 -2 307 -2 173 -2 333 -2 240 -5 032 -4 057 -4 952 -4 149 -13 590 -12 038 -13 927 -11 985 -2,4% 12,9%
Other income/(expenses) 71 71 71 51 757 742 578 487 436 48 10 -19 445 1 363 339 489 1 709 2 224 998 1 008 71,2% -23,2%
Discontinued operations - - - - - - - - - - - - 3 002 -2 713 -1 032 - 3 002 -2 713 -1 032 - <100% <100%
Income tax expenses -2 907 -2 859 -2 714 -2 772 -3 352 -3 274 -2 557 -2 891 -1 820 -1 841 -1 627 -1 603 -2 689 -3 344 -2 778 -4 149 -10 768 -11 318 -9 676 -11 415 11,3% -4,9%
Profit for the period 7 269 7 551 6 593 6 860 11 961 10 820 10 719 9 279 5 528 5 407 4 781 4 910 13 260 10 076 8 372 6 846 38 018 33 854 30 465 27 895 24,8% 12,3%
Attributable earnings 6 770 7 050 6 166 6 388 11 319 10 304 9 390 9 050 5 328 5 198 4 598 4 727 12 301 8 639 7 294 7 619 35 718 31 191 27 448 27 784 30,1% 14,5%
Headline earnings from continuing operations 6 755 6 922 6 110 6 289 11 240 9 901 9 832 8 839 5 323 5 281 4 599 4 756 9 445 7 880 7 285 7 758 32 763 29 984 27 826 27 642 17,7% 9,3%
Key data
Other oper-ating income (% of total income) 43,06% 43,27% 43,95% 46,35% 45,90% 45,83% 48,31% 47,51% 47,23% 48,08% 45,70% 47,38% 45,77% 46,89% 45,59% 48,26% 45,49% 46,02% 45,89% 47,37%
Net interest margin (% of total assets) 2,0% 3,75% 3,54% 3,63% 3,79% 3,95% 3,62% 3,72% 2,79% 3,02% 2,96% 3,09% 3,44% 3,76% 3,73% 3,33% 3,00% 3,62% 3,46% 3,44%
Net interest margin (% of average in-terest earning advances)
4,7% 4,74% 4,56% 4,50% 4,88% 5,26% 5,09% 5,13% 3,36% 3,49% 3,55% 3,57% 4,42% 5,05% 4,69% 4,29% 4,34% 4,64% 4,47% 4,37%
Standardised efficiency ratio 55,9% 57,20% 56,40% 57,27% 51,19% 50,80% 50,68% 52,50% 55,80% 56,50% 56,50% 56,27% 56,70% 53,90% 55,30% 60,46% 54,90% 54,60% 54,72% 56,62%
Return on equity 16,4% 16,7% 16,1% 16,7% 25,4% 24,0% 25,0% 23,4% 16,00% 16,5% 15,1% 16,6% 14,8% 12,9% 12,1% 13,2% 18,2% 17,5% 17,1% 17,5%
Total number of staff 41 723 41 644 42 114 42 356 42 263 39 508 38 989 38 026 30 739 30 499 30 061 29 513 50 960 42 642 42 211 42 221 165 685 154 293 153 375 152 116
Capital ratios
CET 1 11,7% 11,9% 11,8% 11,9% 14,0% 13,8% 13,9% 13,7% 11,4% 11,6% 12,1% 12,5% 13,2% 12,4% 12,2% 12,6% 12,6% 12,4% 12,5% 12,7%
Tier 1 12,3% 12,7% 12,5% 13,0% 14,8% 14,7% 14,8% 14,8% 12,1% 12,5% 13,1% 13,6% 13,7% 12,9% 12,7% 13,2% 13,2% 13,2% 13,3% 13,7%
Tier 2 1,8% 1,7% 2,1% 2,6% 1,9% 1,8% 1,9% 1,4% 2,4% 2,1% 1,9% 2,1% 2,4% 2,6% 2,5% 3,0% 2,1% 2,1% 2,1% 2,3%
Total 14,1% 14,4% 14,6% 15,6% 16,7% 16,5% 16,7% 16,2% 14,5% 14,6% 15,0% 15,7% 16,1% 15,5% 15,2% 16,2% 15,4% 15,3% 15,4% 15,9%
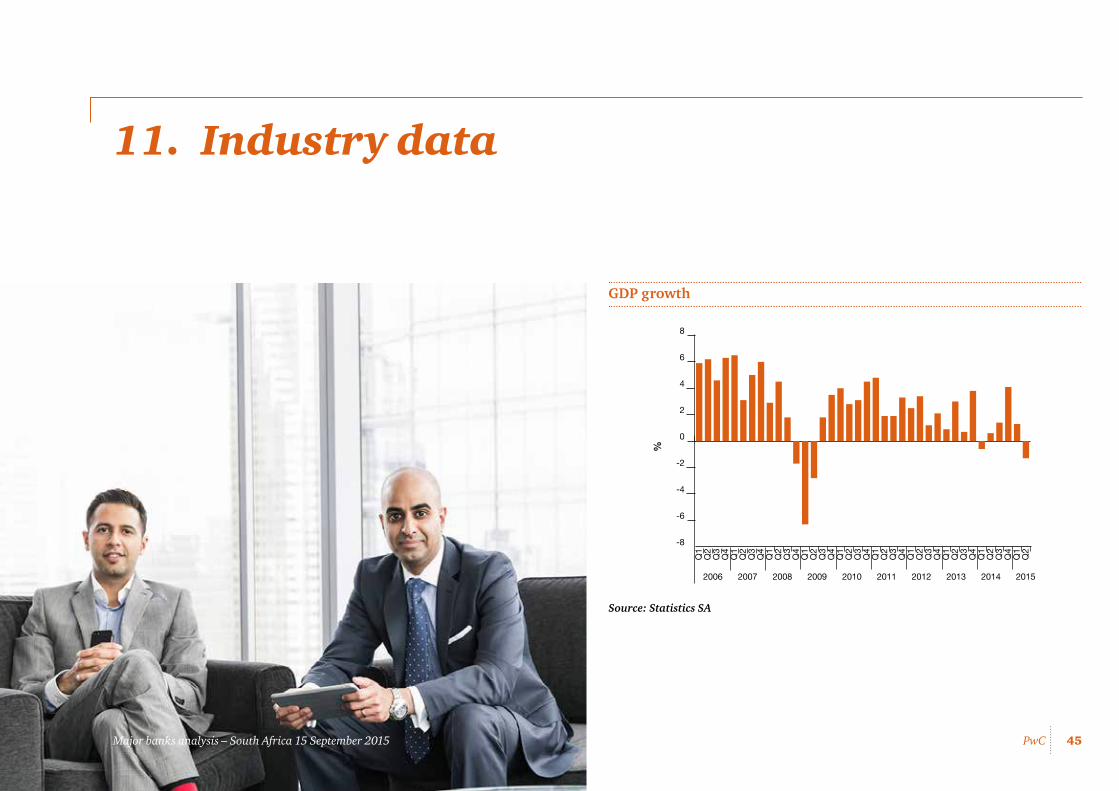
45PwCMajor banks analysis – South Africa 15 September 2015
11. Industry data
GDP growth
Source: Statistics SA
20092006 2007 2008 2010 2011 2012 2013 20152014
-8
-6
-4
-2
0
2
4
6
8
Q2
Q1
Q4
Q3
Q2
Q1
Q4
Q3
Q2
Q1
Q4
Q3
Q2
Q1
Q4
Q3
Q2
Q1
Q4
Q3
Q2
Q1
Q4
Q3
Q2
Q1
Q4
Q3
Q2
Q1
Q4
Q3
Q2
Q1
Q4
Q3
Q2
Q1
%
Major banks analysis – South Africa 15 September 2015
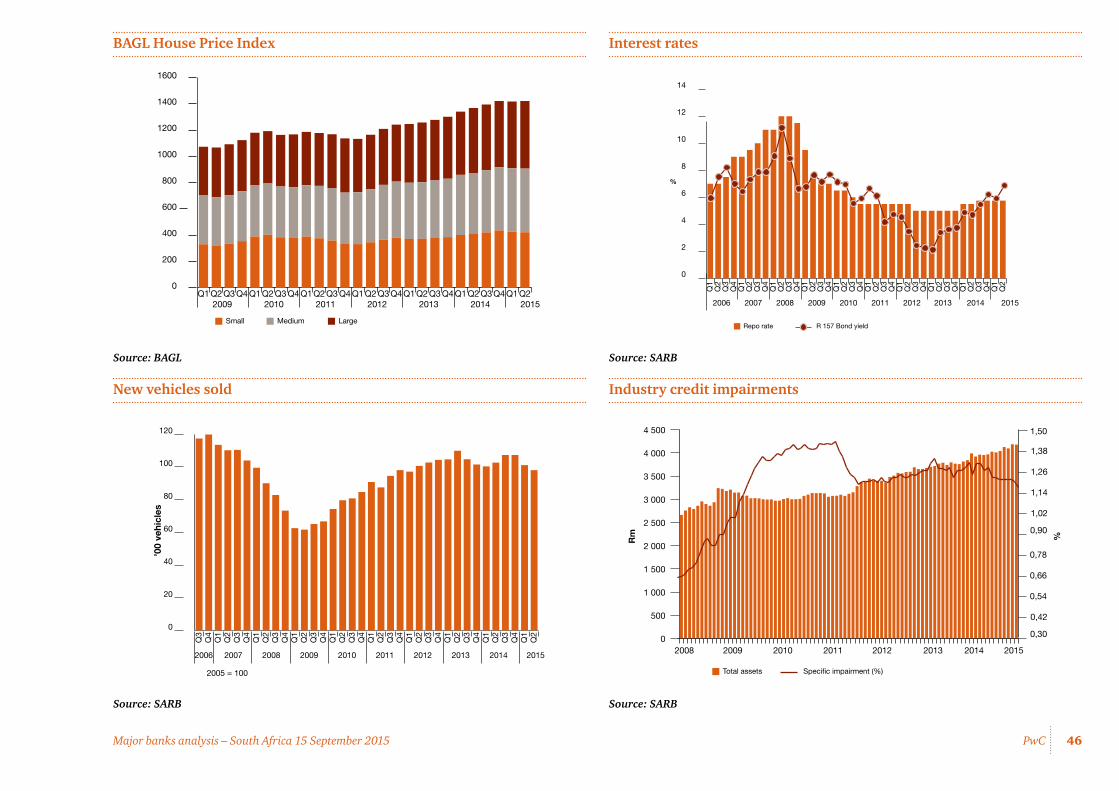
46PwCMajor banks analysis – South Africa 15 September 2015
BAGL House Price Index
Source: BAGL
New vehicles sold
Source: SARB
0
200
400
600
800
1000
1200
1400
1600
Q2Q1Q4Q3Q2Q1Q4Q3Q2Q1Q4Q3Q2Q1Q4Q3Q2Q1Q4Q3Q2Q1Q4Q3Q2Q1
Small Medium Large
2009 2010 2011 2012 2013 2014 2015
20082006 2007 2009
2005 = 100
2010 2011 2012 2013 2014 2015
0
20
40
60
80
100
120
Q2
Q1
Q4
Q3
Q2
Q1
Q4
Q3
Q2
Q1
Q4
Q3
Q2
Q1
Q4
Q3
Q2
Q1
Q4
Q3
Q2
Q1
Q4
Q3
Q2
Q1
Q4
Q3
Q2
Q1
Q4
Q3
Q2
Q1
Q4
Q3
’00
vehi
cles
Interest rates
Source: SARB
Industry credit impairments
Source: SARB
0
2
4
6
8
10
12
14
Q2
Q1
Q4
Q3
Q2
Q1
Q4
Q3
Q2
Q1
Q4
Q3
Q2
Q1
Q4
Q3
Q2
Q1
Q4
Q3
Q2
Q1
Q4
Q3
Q2
Q1
Q4
Q3
Q2
Q1
Q4
Q3
Q2
Q1
Q4
Q3
Q2
Q1
20082006 2007 2009 2010 2011 2012 2013 2014 2015
Repo rate R 157 Bond yield
%
Total assets
2008 2010 2011 2012 2013 2014 20152009
Specific impairment (%)
0
500
1 000
1 500
2 000
2 500
3 000
3 500
4 000
4 500
0,30
0,42
0,54
0,66
0,78
0,90
1,02
1,14
1,26
1,38
1,50
Rm
%
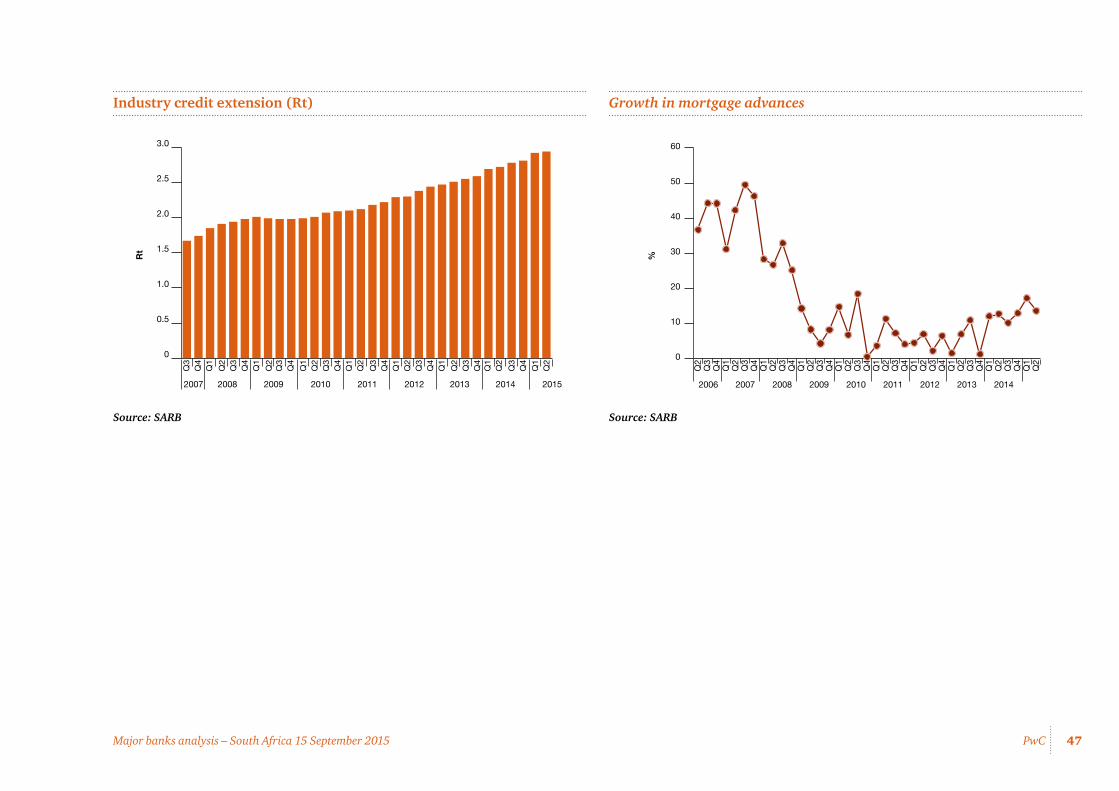
47PwCMajor banks analysis – South Africa 15 September 2015
Industry credit extension (Rt)
Source: SARB
Rt
0
0.5
1.0
1.5
2.0
2.5
3.0
20082007 2009 2010 2011 2012 2013 2014 2015
Q4
Q3
Q2
Q1
Q2
Q1
Q4
Q3
Q2
Q1
Q4
Q3
Q2
Q1
Q4
Q3
Q2
Q1
Q4
Q3
Q2
Q1
Q4
Q3
Q2
Q1
Q4
Q3
Q2
Q1
Q4
Q3
Growth in mortgage advances
Source: SARB
%
0
10
20
30
40
50
60
Q2
Q1
Q4
Q3
Q2
Q1
Q4
Q3
Q2
Q1
Q4
Q3
Q2
Q1
Q4
Q3
Q2
Q1
Q4
Q3
Q2
Q1
Q4
Q3
Q2
Q1
Q4
Q3
Q2
Q1
Q4
Q3
Q2
Q1
Q4
Q3
Q2
2008 2009 2010 2011 2012 2013 20142006 2007

48PwCMajor banks analysis – South Africa 15 September 2015
12. Contacts
Johannes GrosskopfBanking & Capital Markets Leader PwC Africa+27 11 797 [email protected]
Stefan BeyersBanking & Capital Markets Partner PwC Africa+27 11 797 [email protected]
Contributors
• Louwrens van Velden
• Rivaan Roopnarain
• Hemal Kana
• Nitish Mudgal
Major banks analysis – South Africa 15 September 2015

This document is protected under the copyright laws of South Africa and other countries as an unpublished work. This document contains information that is proprietary and confidential to PricewaterhouseCoopers Incorporated, which shall not be disclosed outside the recipient’s company or duplicated, used or disclosed in whole or in part by the recipient for any purpose other than to evaluate this proposal. Any other use or disclosure in whole or in part of this information without the express written permission of PricewaterhouseCoopers Incorporated is prohibited.
© 2015 PricewaterhouseCoopers (“PwC”), a South African firm, PwC is part of the PricewaterhouseCoopers International Limited (“PwCIL”) network that consists of separate and independent legal entities that do not act as agents of PwCIL or any other member firm, nor is PwCIL or the separate firms responsible or liable for the acts or omissions of each other in any way. No portion of this document may be reproduced by any process without the written permission of PwC (15-17632)