Embed Size (px)
Citation preview
R E S I L I E N C E I N S I G H T
B U R O H A P P O L D ’ S R E S I L I E N C E T O O L U S E R G U I D E
R E V I S I O N 0 1
F E B R U A R Y 2 0 1 6

2
R E S I L I E N C E T O O L
Resilience Insight - User Guide revision 01
3
B U R O H A P P O L D E N G I N E E R I N G
Copyright © 1976-2016 BuroHappold Engineering. All Rights Reserved
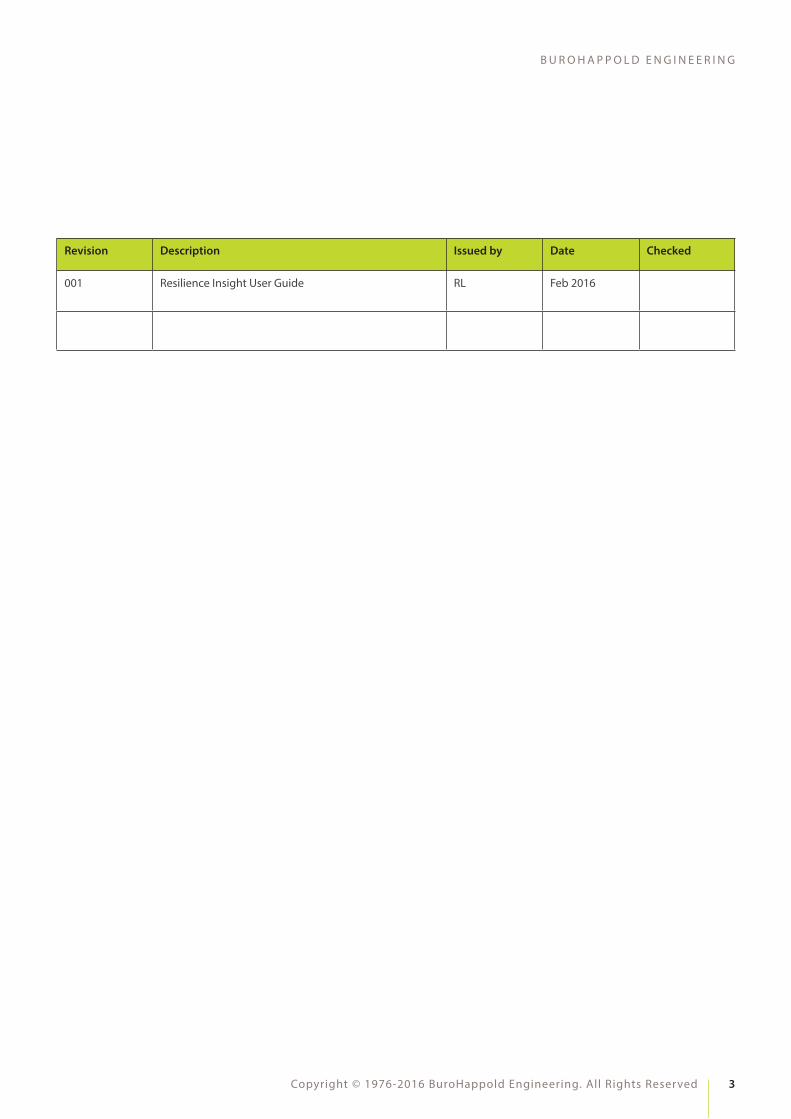
Revision Description Issued by Date Checked
001 Resilience Insight User Guide RL Feb 2016
4
R E S I L I E N C E T O O L
Resilience Insight - User Guide revision 01
CONTENTS
1 GENERAL INFORMATION 5
1.1 INTRODUCTION 5
1.2 OUTLINE 6
2 SYSTEM SUMMARY 6
2.1 SYSTEM CONFIGURATION 6
2.2 PROCESS FLOWS 7
2.3 USER ACCESS 7
2.4 RELIABILITY 7
3 THE TOOL 8
3.1 WELCOME 9
3.2 REGISTER 10
3.3 MANAGE YOUR ACCOUNT 11
3.4 SELECT 13
3.5 DEMAND 15
3.6 DIAGNOSE 18
3.7 CAPACITY 22
3.8 REPORT 26
4 NEXT STEPS 31
APPENDIX A – TERMS OF USE 32
APPENDIX B – GLOSSARY OF TERMS 35
5
B U R O H A P P O L D E N G I N E E R I N G
Copyright © 1976-2016 BuroHappold Engineering. All Rights Reserved
1 GENERAL INFORMATION
1.1 INTRODUC TIONAll cities face the need to adapt, to meet accelerating economic, social and environmental change. This changing environment requires cities to work proactively to prepare for the future by harnessing a robust understanding of the factors that provide both threats and opportunities. The � rst step is identifying these change factors, quantifying the opportunities or risks and prioritise action/investment.
The importance of resilience is well recognised by city leaders, as are the broad bene� ts that a systematic approach can bring. It is no longer enough to respond rapidly to an emergency, adapting and developing solutions as the situation unfurls, seeking only to return as soon as possible to the status quo. There is also an expectation that cities need to invest in their ability to prevent or mitigate future shocks and stresses, increasing their capability to react e� ectively to unavoidable or unpredictable events, and to bounce back better afterwards, learning and revitalising as part of the process. These capabilities are also valuable in creating and exploiting other opportunities – an additional ‘Resilience Dividend’ noted by Judith Rodin of the Rockefeller Foundation.
The United Nations’ UNISDR Sendai Framework reinforces the business case for investing in resilience, “Addressing underlying disaster risk factors through disaster risk-informed public and private investment is more cost e� ective than primary reliance on post-disaster response and recovery, and contributes to sustainable development”. The rapid development of new technologies, tools and techniques allows us to anticipate, understand and model the changing environment; further ahead and with greater accuracy. We can now develop and grow our cities, communities, and businesses not just to meet the challenges
of the current environment but with knowledge of how key factors, for example; climate change, urbanisation, and energy supply will change that environment in the future.
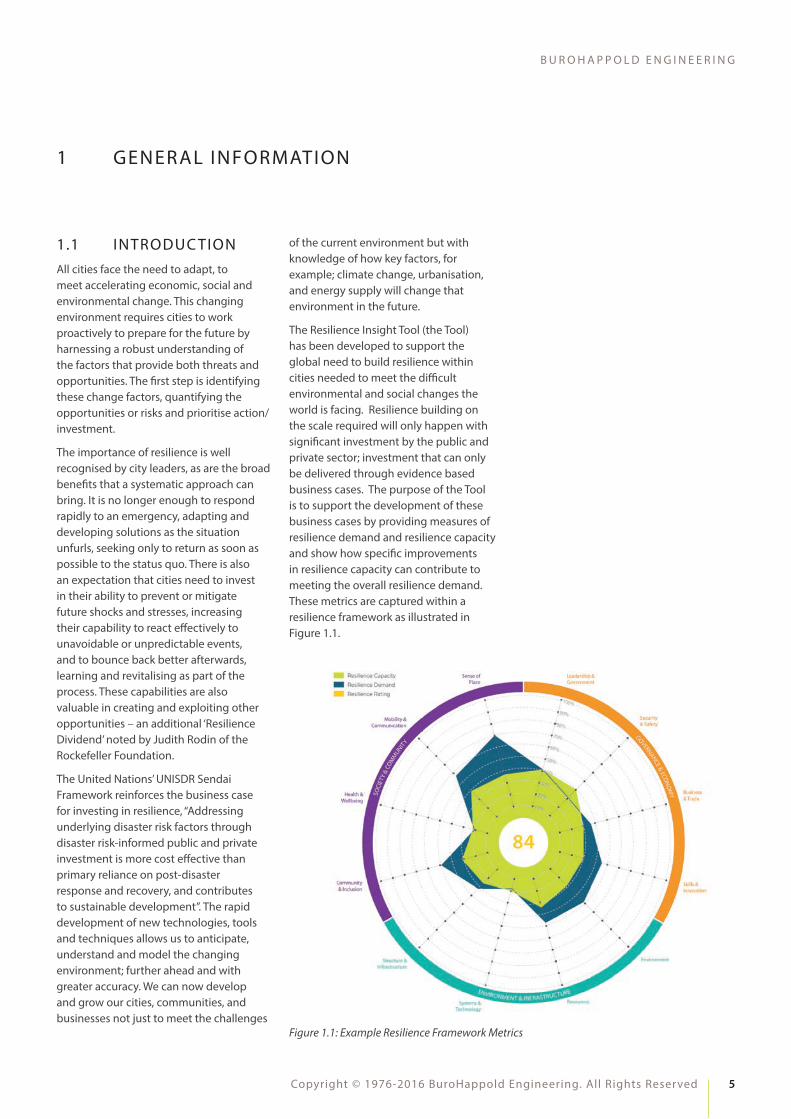
The Resilience Insight Tool (the Tool) has been developed to support the global need to build resilience within cities needed to meet the di� cult environmental and social changes the world is facing. Resilience building on the scale required will only happen with signi� cant investment by the public and private sector; investment that can only be delivered through evidence based business cases. The purpose of the Tool is to support the development of these business cases by providing measures of resilience demand and resilience capacity and show how speci� c improvements in resilience capacity can contribute to meeting the overall resilience demand. These metrics are captured within a resilience framework as illustrated in Figure 1.1.
Figure 1.1: Example Resilience Framework Metrics
6
R E S I L I E N C E T O O L
Resilience Insight - User Guide revision 01
The resilience framework has been designed to support the comprehensive assessment of the city by breaking it down to 12 universally critical components and assessing these individually.
1.2 OUTLINEThis guide shall include:
• General description
• Major functions performed by the Tool
• Structure, function, process and outcomes for each page
• Key issue and recommended solutions
• Terms of Use
References
For further information on the development of this online Tool, please refer to the BuroHappold Royal Charter International Research Award Report which can be accessed here: http://www.burohappold.com/think-again/specialisms/risk-resilience/
2 SYSTEM SUMMARY
2.1 SYSTEM CONFIGURATION
The BuroHappold Resilience Insight Tool is an online assessment process that allows the user to quickly generate a holistic view of the resilience of a city based on their knowledge. The Tool divides the resilience assessment into developing an understanding of the overall demand on the resilience system and balancing that against the capacity of the city to meet that demand. Demand is calculated from the select, assess and diagnostic sections of the Tool. Capacity is assessed as a combination of mitigation measures and adaptive capacity. These are generated from the diagnose and capacity sections
of the Tool. Refer to the Glossary in Appendix B for terms.
The Tool has been con�gured to work with Google Chrome. Although the Tool may work with other browsers, compatibility issues are more likely.
The Tool requires an internet connection. It has been designed to limit demands on bandwidth, however, very low bandwidths could cause problems refreshing back to the server. This could cause data loss or malfunctions.
The Tool is currently only available in English.
7
B U R O H A P P O L D E N G I N E E R I N G
Copyright © 1976-2016 BuroHappold Engineering. All Rights Reserved
2.4 RELIABILIT YThe Tool is cloud based with an anticipated 99.99% up time.
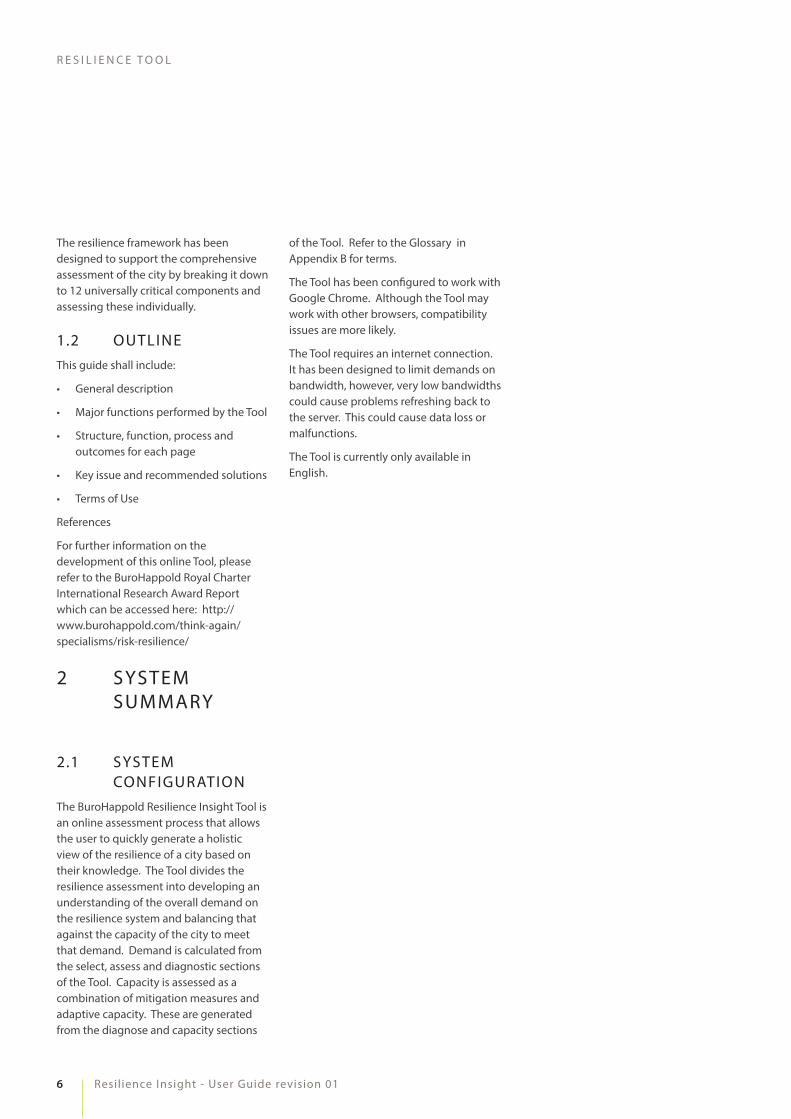
2.2 PROCESS FLOWSOnce registered and logged in, the Tool is structured into projects. These projects can be used to provide an overview resilience assessment for your city or separate assessments can be performed for various city neighbourhoods. This latter provides more depth and geospacial variation or resilience metrics. Multiple stakeholder assessments are preferred to provide breadth to the study. Each stakeholder is able to only answer the parts of the assessment based on their area of expertise, if preferred.
Figure 2.1: Process Flow
As illustrated in Figure 2.1 the outline process is to SELECT pertinent hazards, assess the resilience DEMAND of those hazards in relation to your city, DIAGNOSE the vulnerability of your city and then de� ne the city’s resilience CAPACITY. Once this process has been completed a series of REPORTs can be generated to deliver the data into a useful and manageable form.
2.3 USER ACCESSThe Tool has been designed primarily for a single, well informed user to create a resilience assessment of their chosen city. However, with proper management, this process can be opened up allowing multiple stakeholders to input into a single assessment. Users are able to open multiple projects and then share their log in details with various stakeholders who can all assess the Tool simultaneously allowing a multi-stakeholder view of the cities resilience to be quickly generated. If this option is taken, it will need close coordination as there are no protections in place to prevent users over writing each other’s work if they are using the same login.
8
R E S I L I E N C E T O O L
Resilience Insight - User Guide revision 01
3 THE TOOL
This guide has been divided into the following sections to mirror the layout of the Tool:
• WELCOME
• REGISTER
• MANAGE YOUR ACCOUNT - Ways to use and structure assessments
• SELECT – Select your main shocks/ stresses
• DEMAND – Assess your relative demand
• DIAGNOSE – Assess your city
• CAPACITY – Assess shock mitigation
• REPORTS – Resilience report
9
B U R O H A P P O L D E N G I N E E R I N G
Copyright © 1976-2016 BuroHappold Engineering. All Rights Reserved
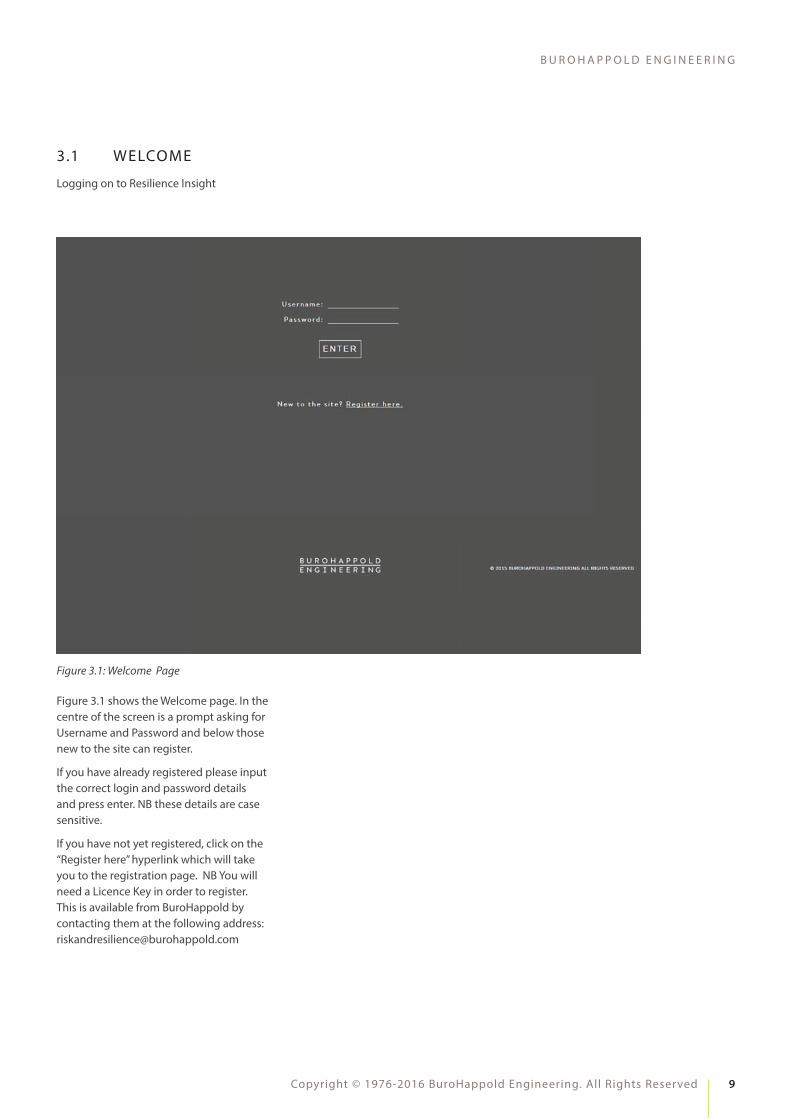
Figure 3.1 shows the Welcome page. In the centre of the screen is a prompt asking for Username and Password and below those new to the site can register.
If you have already registered please input the correct login and password details and press enter. NB these details are case sensitive.
If you have not yet registered, click on the “Register here” hyperlink which will take you to the registration page. NB You will need a Licence Key in order to register. This is available from BuroHappold by contacting them at the following address: [email protected]
Figure 3.1: Welcome Page
3.1 WELCOME
Logging on to Resilience Insight
10
R E S I L I E N C E T O O L
Resilience Insight - User Guide revision 01
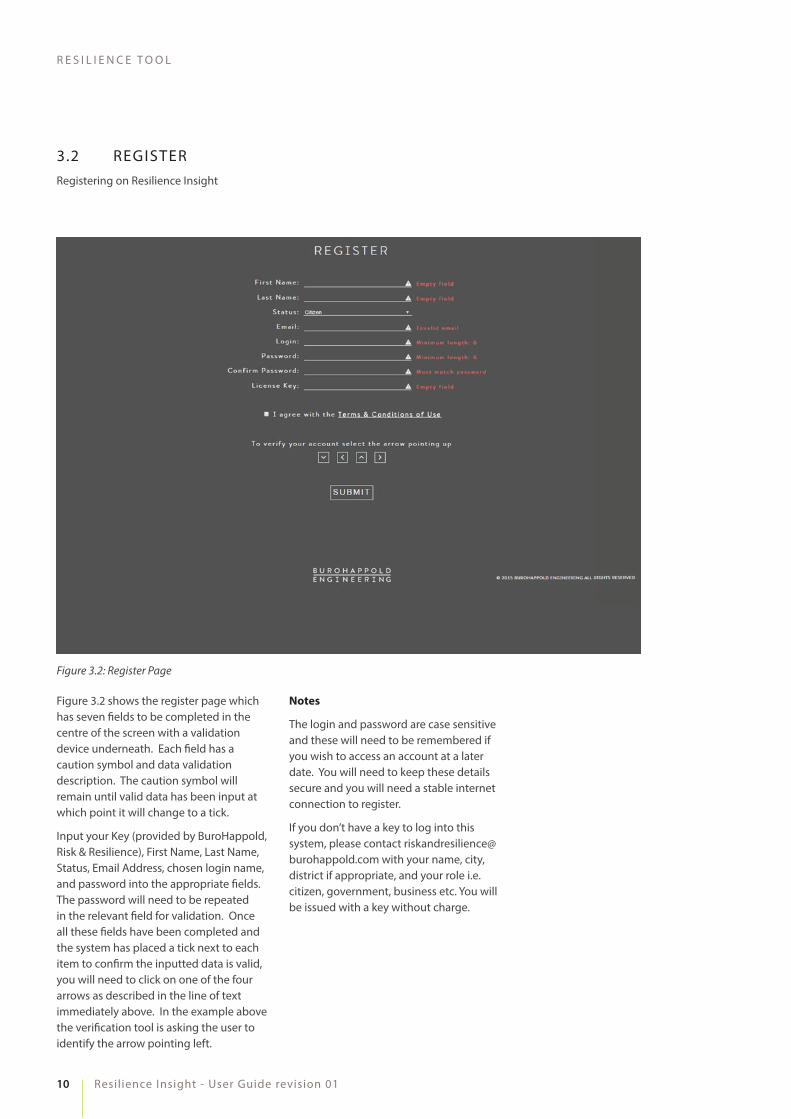
3.2 REGISTERRegistering on Resilience Insight
Figure 3.2 shows the register page which has seven � elds to be completed in the centre of the screen with a validation device underneath. Each � eld has a caution symbol and data validation description. The caution symbol will remain until valid data has been input at which point it will change to a tick.
Input your Key (provided by BuroHappold, Risk & Resilience), First Name, Last Name, Status, Email Address, chosen login name, and password into the appropriate � elds. The password will need to be repeated in the relevant � eld for validation. Once all these � elds have been completed and the system has placed a tick next to each item to con� rm the inputted data is valid, you will need to click on one of the four arrows as described in the line of text immediately above. In the example above the veri� cation tool is asking the user to identify the arrow pointing left.
Notes
The login and password are case sensitive and these will need to be remembered if you wish to access an account at a later date. You will need to keep these details secure and you will need a stable internet connection to register.
If you don’t have a key to log into this system, please contact [email protected] with your name, city, district if appropriate, and your role i.e. citizen, government, business etc. You will be issued with a key without charge.
Figure 3.2: Register Page
11
B U R O H A P P O L D E N G I N E E R I N G
Copyright © 1976-2016 BuroHappold Engineering. All Rights Reserved
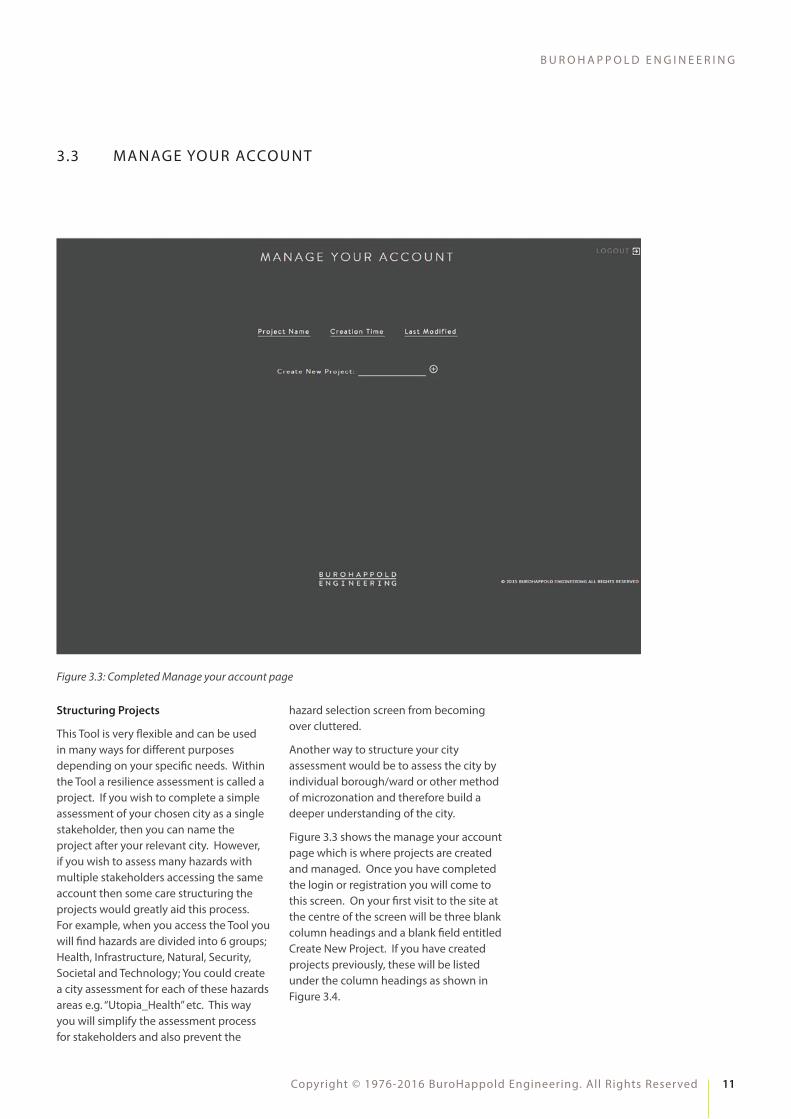
Structuring Projects
This Tool is very �exible and can be used in many ways for di�erent purposes depending on your speci�c needs. Within the Tool a resilience assessment is called a project. If you wish to complete a simple assessment of your chosen city as a single stakeholder, then you can name the project after your relevant city. However, if you wish to assess many hazards with multiple stakeholders accessing the same account then some care structuring the projects would greatly aid this process. For example, when you access the Tool you will �nd hazards are divided into 6 groups; Health, Infrastructure, Natural, Security, Societal and Technology; You could create a city assessment for each of these hazards areas e.g. “Utopia_Health” etc. This way you will simplify the assessment process for stakeholders and also prevent the
hazard selection screen from becoming over cluttered.
Another way to structure your city assessment would be to assess the city by individual borough/ward or other method of microzonation and therefore build a deeper understanding of the city.
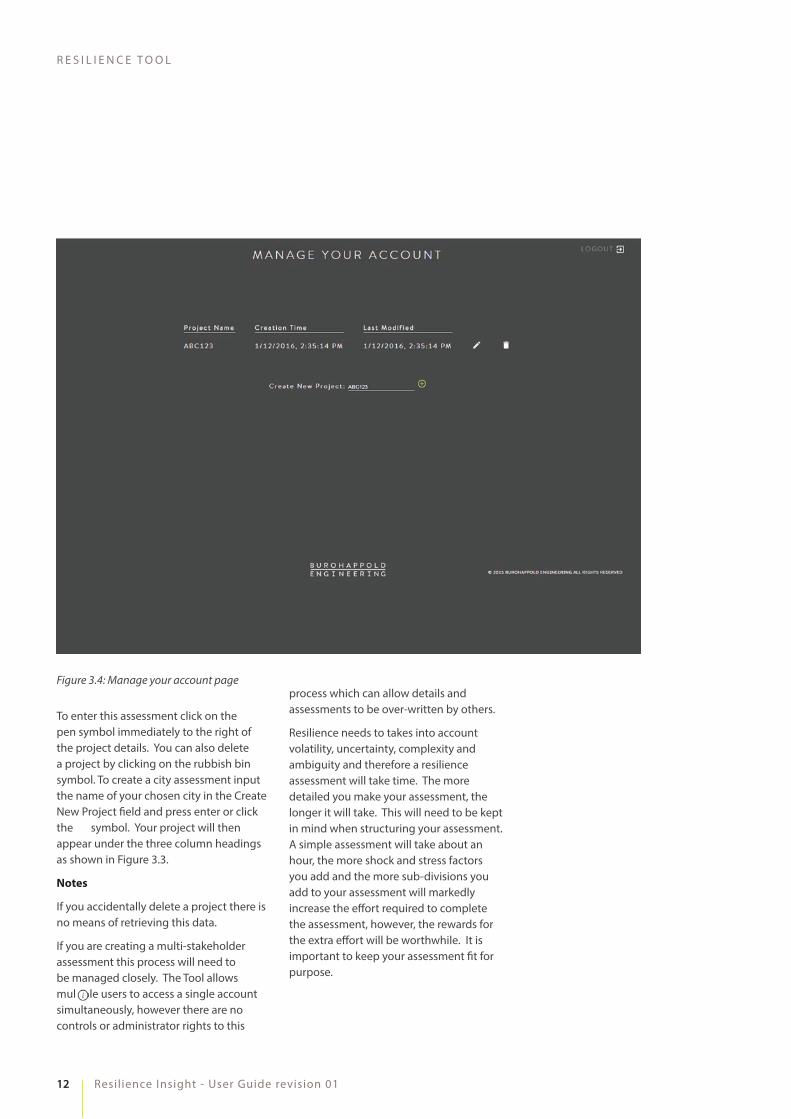
Figure 3.3 shows the manage your account page which is where projects are created and managed. Once you have completed the login or registration you will come to this screen. On your �rst visit to the site at the centre of the screen will be three blank column headings and a blank �eld entitled Create New Project. If you have created projects previously, these will be listed under the column headings as shown in Figure 3.4.
Figure 3.3: Completed Manage your account page
3.3 MANAGE YOUR ACCOUNT
12
R E S I L I E N C E T O O L
Resilience Insight - User Guide revision 01
To enter this assessment click on the pen symbol immediately to the right of the project details. You can also delete a project by clicking on the rubbish bin symbol. To create a city assessment input the name of your chosen city in the Create New Project �eld and press enter or click the symbol. Your project will then appear under the three column headings as shown in Figure 3.3.
Notes
If you accidentally delete a project there is no means of retrieving this data.
If you are creating a multi-stakeholder assessment this process will need to be managed closely. The Tool allows multiple users to access a single account simultaneously, however there are no controls or administrator rights to this
Figure 3.4: Manage your account pageprocess which can allow details and assessments to be over-written by others.
Resilience needs to takes into account volatility, uncertainty, complexity and ambiguity and therefore a resilience assessment will take time. The more detailed you make your assessment, the longer it will take. This will need to be kept in mind when structuring your assessment. A simple assessment will take about an hour, the more shock and stress factors you add and the more sub-divisions you add to your assessment will markedly increase the e�ort required to complete the assessment, however, the rewards for the extra e�ort will be worthwhile. It is important to keep your assessment �t for purpose.
13
B U R O H A P P O L D E N G I N E E R I N G
Copyright © 1976-2016 BuroHappold Engineering. All Rights Reserved
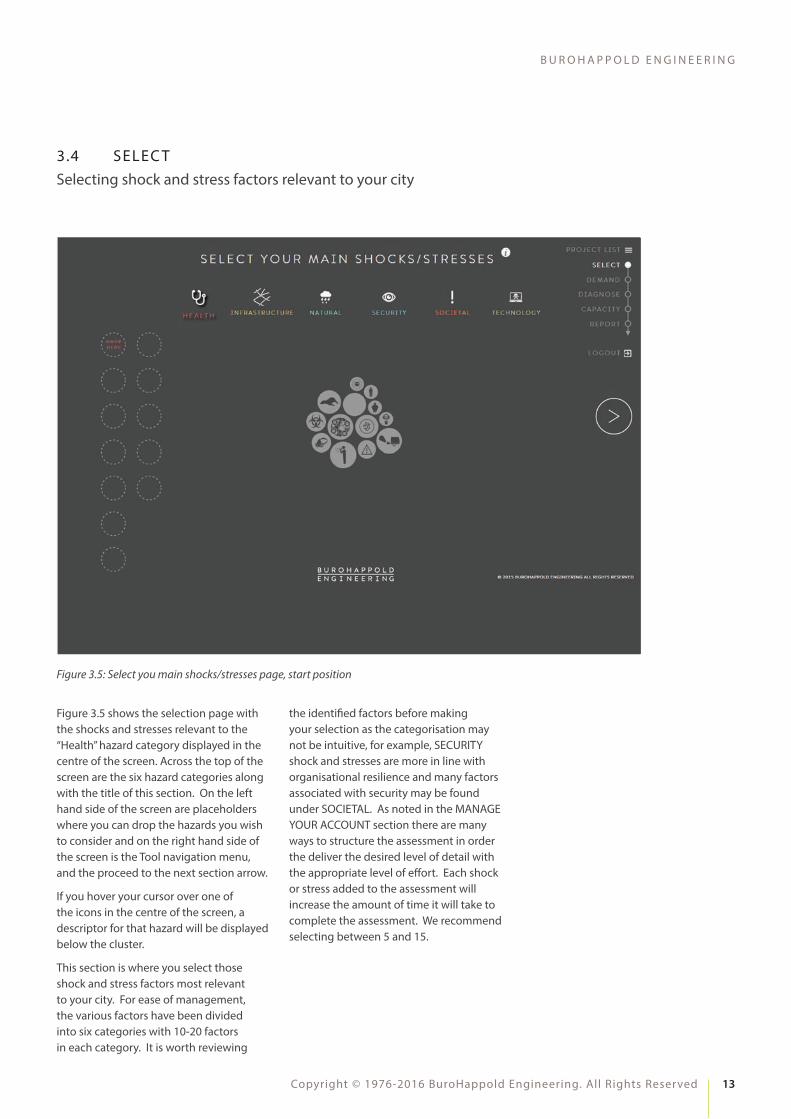
3.4 SELEC TSelecting shock and stress factors relevant to your city
Figure 3.5 shows the selection page with the shocks and stresses relevant to the “Health” hazard category displayed in the centre of the screen. Across the top of the screen are the six hazard categories along with the title of this section. On the left hand side of the screen are placeholders where you can drop the hazards you wish to consider and on the right hand side of the screen is the Tool navigation menu, and the proceed to the next section arrow.
If you hover your cursor over one of the icons in the centre of the screen, a descriptor for that hazard will be displayed below the cluster.
This section is where you select those shock and stress factors most relevant to your city. For ease of management, the various factors have been divided into six categories with 10-20 factors in each category. It is worth reviewing
the identi�ed factors before making your selection as the categorisation may not be intuitive, for example, SECURITY shock and stresses are more in line with organisational resilience and many factors associated with security may be found under SOCIETAL. As noted in the MANAGE YOUR ACCOUNT section there are many ways to structure the assessment in order the deliver the desired level of detail with the appropriate level of e�ort. Each shock or stress added to the assessment will increase the amount of time it will take to complete the assessment. We recommend selecting between 5 and 15.
Figure 3.5: Select you main shocks/stresses page, start position
14
R E S I L I E N C E T O O L
Resilience Insight - User Guide revision 01
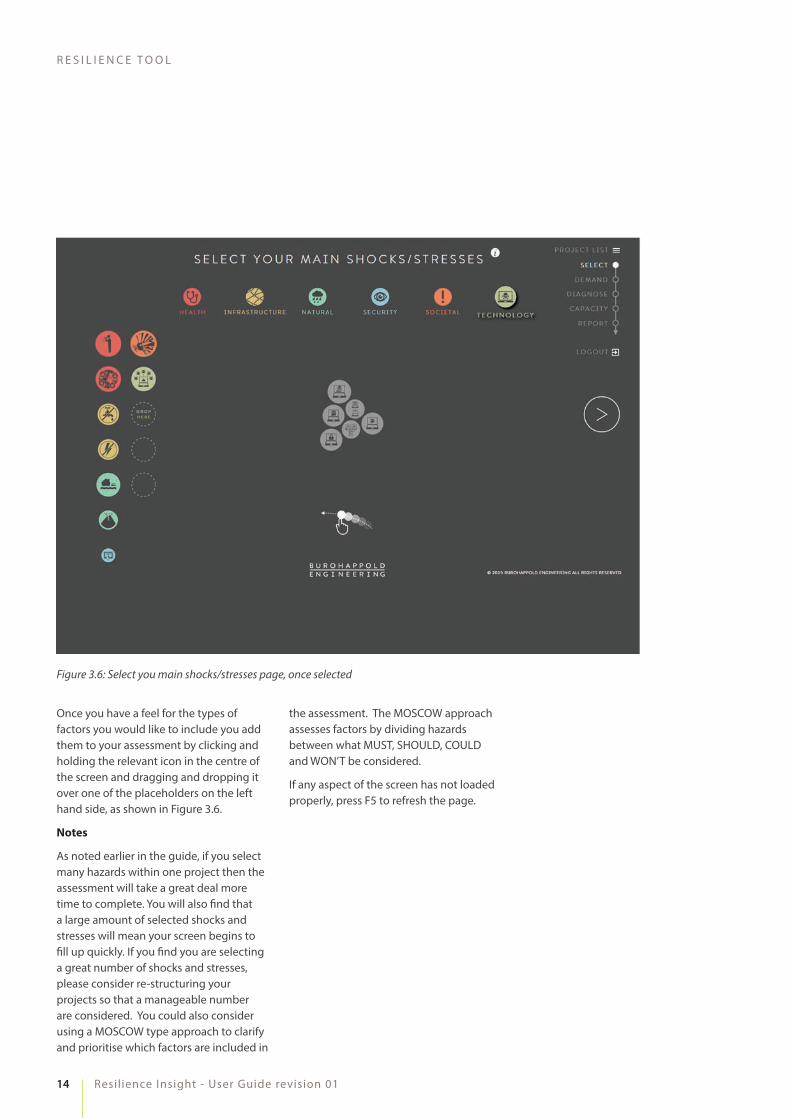
Once you have a feel for the types of factors you would like to include you add them to your assessment by clicking and holding the relevant icon in the centre of the screen and dragging and dropping it over one of the placeholders on the left hand side, as shown in Figure 3.6.
Notes
As noted earlier in the guide, if you select many hazards within one project then the assessment will take a great deal more time to complete. You will also �nd that a large amount of selected shocks and stresses will mean your screen begins to �ll up quickly. If you �nd you are selecting a great number of shocks and stresses, please consider re-structuring your projects so that a manageable number are considered. You could also consider using a MOSCOW type approach to clarify and prioritise which factors are included in
the assessment. The MOSCOW approach assesses factors by dividing hazards between what MUST, SHOULD, COULD and WON’T be considered.
If any aspect of the screen has not loaded properly, press F5 to refresh the page.
Figure 3.6: Select you main shocks/stresses page, once selected
15
B U R O H A P P O L D E N G I N E E R I N G
Copyright © 1976-2016 BuroHappold Engineering. All Rights Reserved
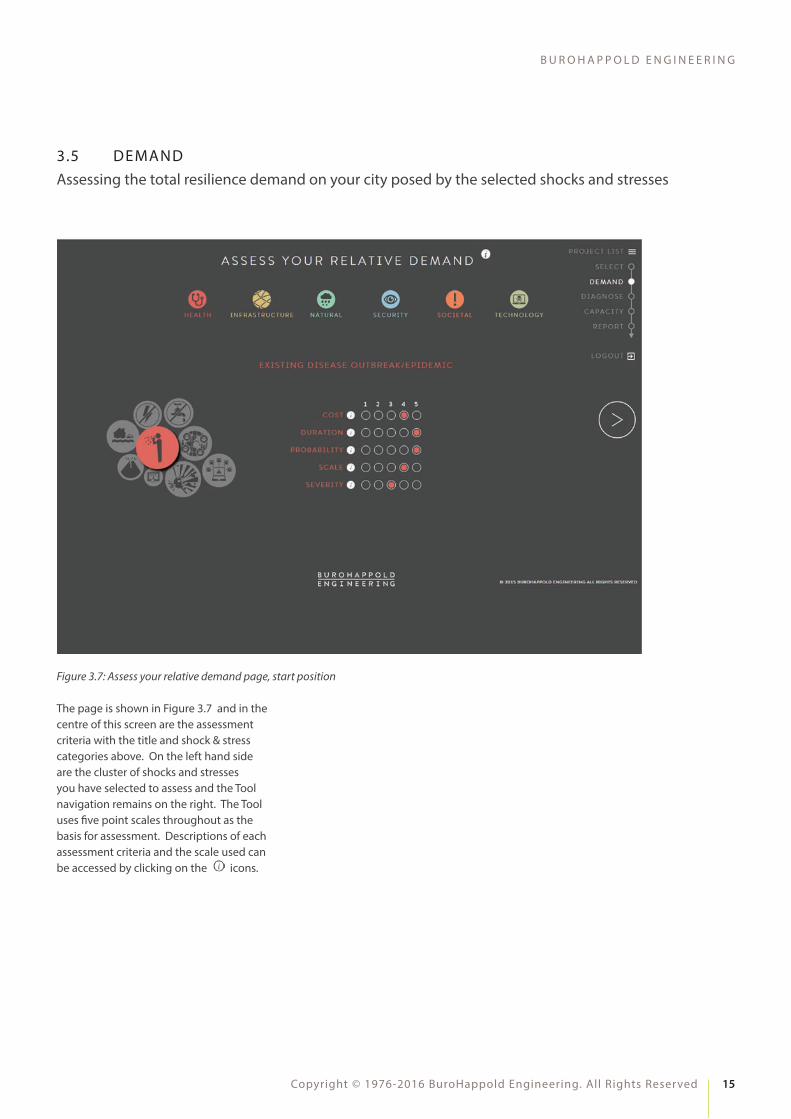
3.5 DEMANDAssessing the total resilience demand on your city posed by the selected shocks and stresses
The page is shown in Figure 3.7 and in the centre of this screen are the assessment criteria with the title and shock & stress categories above. On the left hand side are the cluster of shocks and stresses you have selected to assess and the Tool navigation remains on the right. The Tool uses �ve point scales throughout as the basis for assessment. Descriptions of each assessment criteria and the scale used can be accessed by clicking on the icons.
Figure 3.7: Assess your relative demand page, start position
16
R E S I L I E N C E T O O L
Resilience Insight - User Guide revision 01
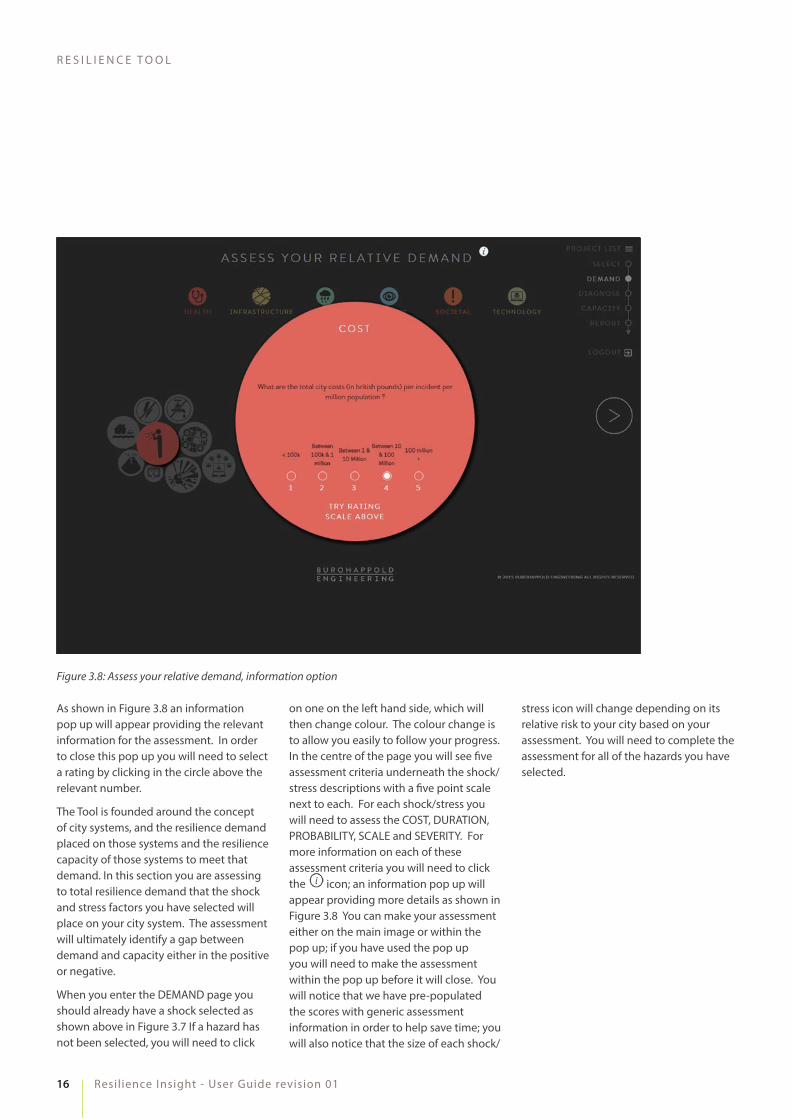
As shown in Figure 3.8 an information pop up will appear providing the relevant information for the assessment. In order to close this pop up you will need to select a rating by clicking in the circle above the relevant number.
The Tool is founded around the concept of city systems, and the resilience demand placed on those systems and the resilience capacity of those systems to meet that demand. In this section you are assessing to total resilience demand that the shock and stress factors you have selected will place on your city system. The assessment will ultimately identify a gap between demand and capacity either in the positive or negative.
When you enter the DEMAND page you should already have a shock selected as shown above in Figure 3.7 If a hazard has not been selected, you will need to click
on one on the left hand side, which will then change colour. The colour change is to allow you easily to follow your progress. In the centre of the page you will see �ve assessment criteria underneath the shock/stress descriptions with a �ve point scale next to each. For each shock/stress you will need to assess the COST, DURATION, PROBABILITY, SCALE and SEVERITY. For more information on each of these assessment criteria you will need to click the icon; an information pop up will appear providing more details as shown in Figure 3.8 You can make your assessment either on the main image or within the pop up; if you have used the pop up you will need to make the assessment within the pop up before it will close. You will notice that we have pre-populated the scores with generic assessment information in order to help save time; you will also notice that the size of each shock/
stress icon will change depending on its relative risk to your city based on your assessment. You will need to complete the assessment for all of the hazards you have selected.
Figure 3.8: Assess your relative demand, information option
17
B U R O H A P P O L D E N G I N E E R I N G
Copyright © 1976-2016 BuroHappold Engineering. All Rights Reserved
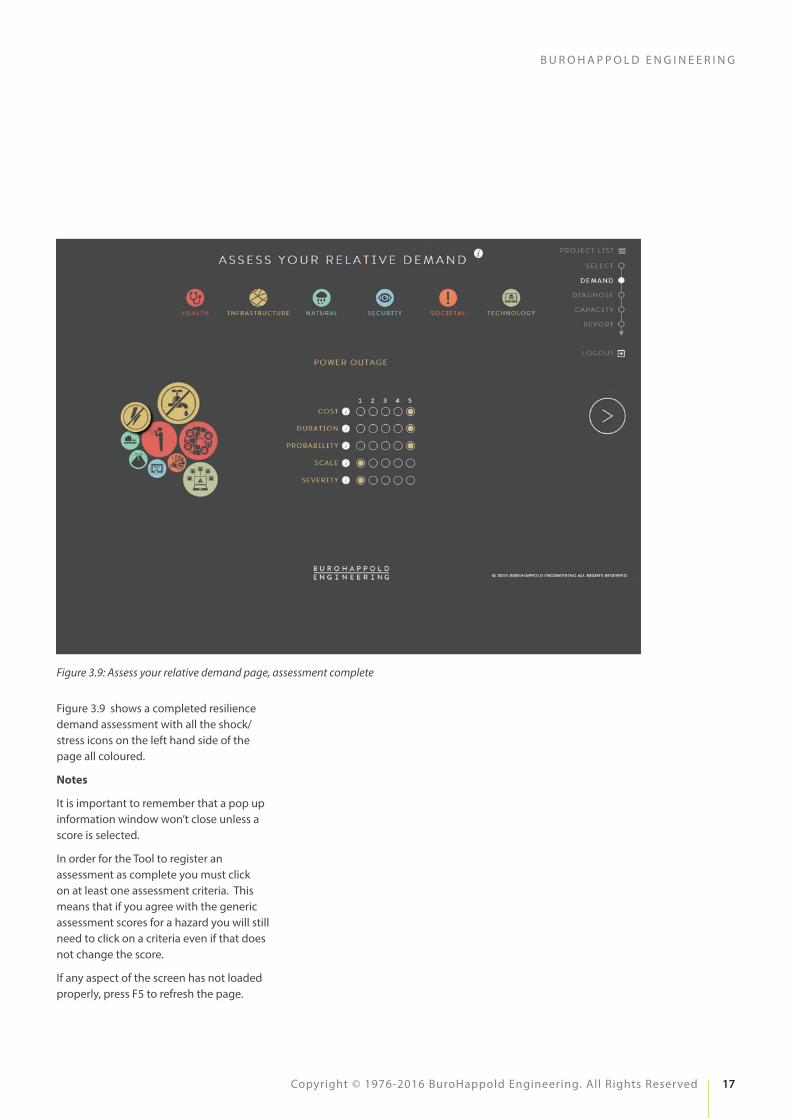
Figure 3.9 shows a completed resilience demand assessment with all the shock/stress icons on the left hand side of the page all coloured.
Notes
It is important to remember that a pop up information window won’t close unless a score is selected.
In order for the Tool to register an assessment as complete you must click on at least one assessment criteria. This means that if you agree with the generic assessment scores for a hazard you will still need to click on a criteria even if that does not change the score.
If any aspect of the screen has not loaded properly, press F5 to refresh the page.
Figure 3.9: Assess your relative demand page, assessment complete
18
R E S I L I E N C E T O O L
Resilience Insight - User Guide revision 01
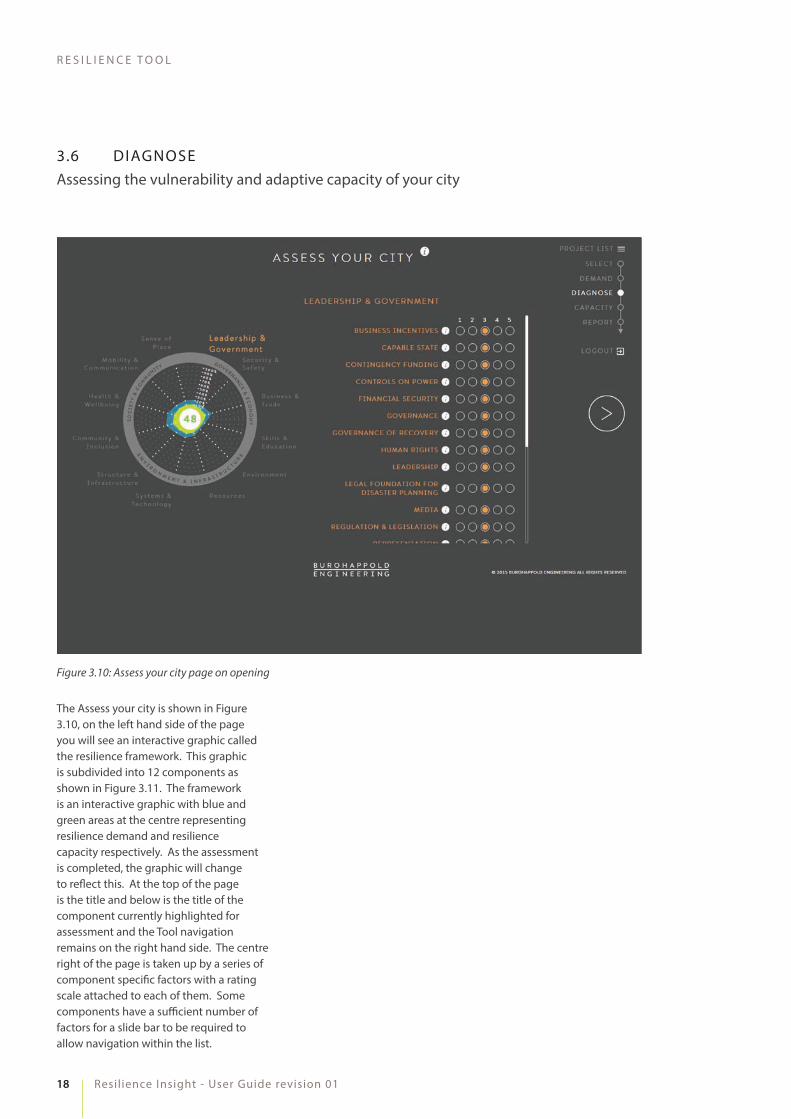
3.6 DIAGNOSEAssessing the vulnerability and adaptive capacity of your city
The Assess your city is shown in Figure 3.10, on the left hand side of the page you will see an interactive graphic called the resilience framework. This graphic is subdivided into 12 components as shown in Figure 3.11. The framework is an interactive graphic with blue and green areas at the centre representing resilience demand and resilience capacity respectively. As the assessment is completed, the graphic will change to re�ect this. At the top of the page is the title and below is the title of the component currently highlighted for assessment and the Tool navigation remains on the right hand side. The centre right of the page is taken up by a series of component speci�c factors with a rating scale attached to each of them. Some components have a su�cient number of factors for a slide bar to be required to allow navigation within the list.
Figure 3.10: Assess your city page on opening
19
B U R O H A P P O L D E N G I N E E R I N G
Copyright © 1976-2016 BuroHappold Engineering. All Rights Reserved
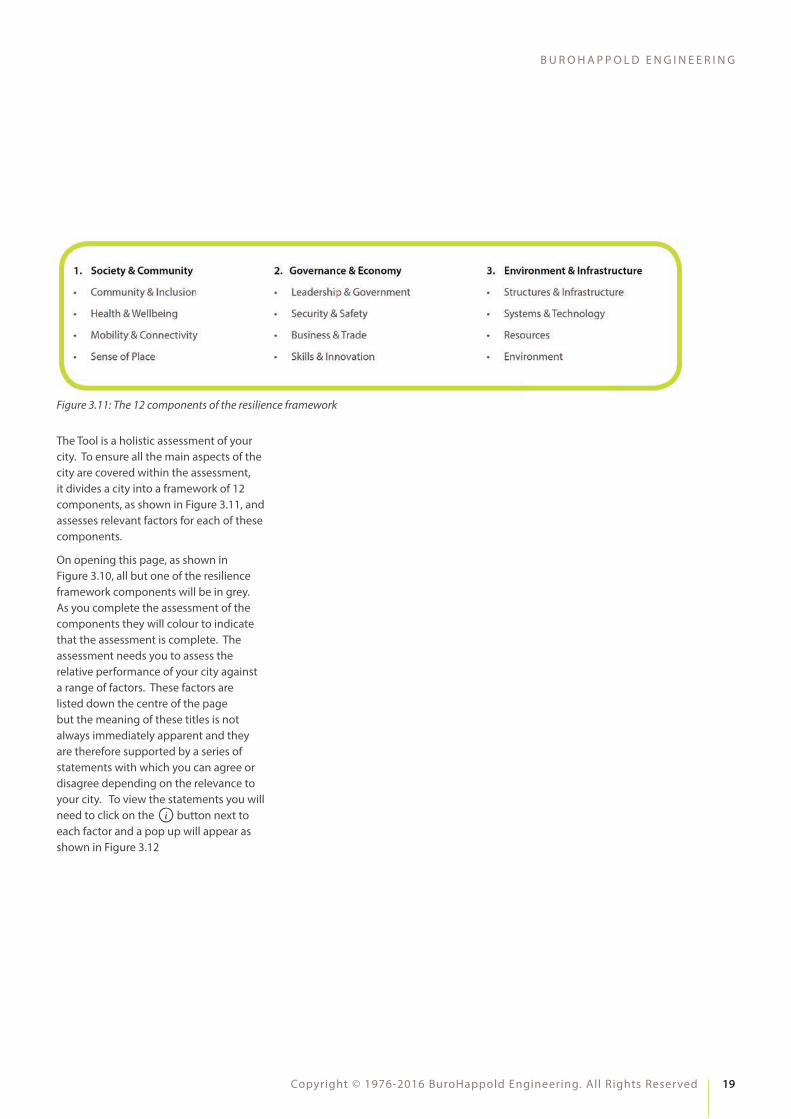
The Tool is a holistic assessment of your city. To ensure all the main aspects of the city are covered within the assessment, it divides a city into a framework of 12 components, as shown in Figure 3.11, and assesses relevant factors for each of these components.
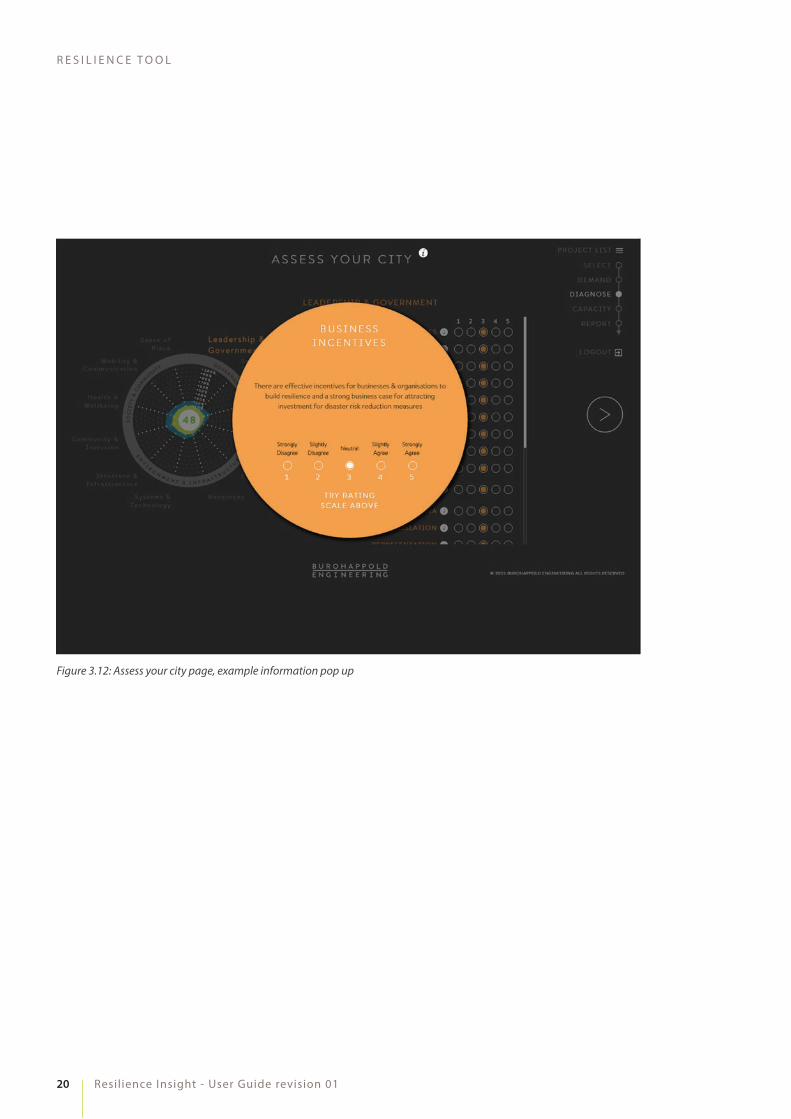
On opening this page, as shown in Figure 3.10, all but one of the resilience framework components will be in grey. As you complete the assessment of the components they will colour to indicate that the assessment is complete. The assessment needs you to assess the relative performance of your city against a range of factors. These factors are listed down the centre of the page but the meaning of these titles is not always immediately apparent and they are therefore supported by a series of statements with which you can agree or disagree depending on the relevance to your city. To view the statements you will need to click on the button next to each factor and a pop up will appear as shown in Figure 3.12
Figure 3.11: The 12 components of the resilience framework
20
R E S I L I E N C E T O O L
Resilience Insight - User Guide revision 01
Figure 3.12: Assess your city page, example information pop up
21
B U R O H A P P O L D E N G I N E E R I N G
Copyright © 1976-2016 BuroHappold Engineering. All Rights Reserved
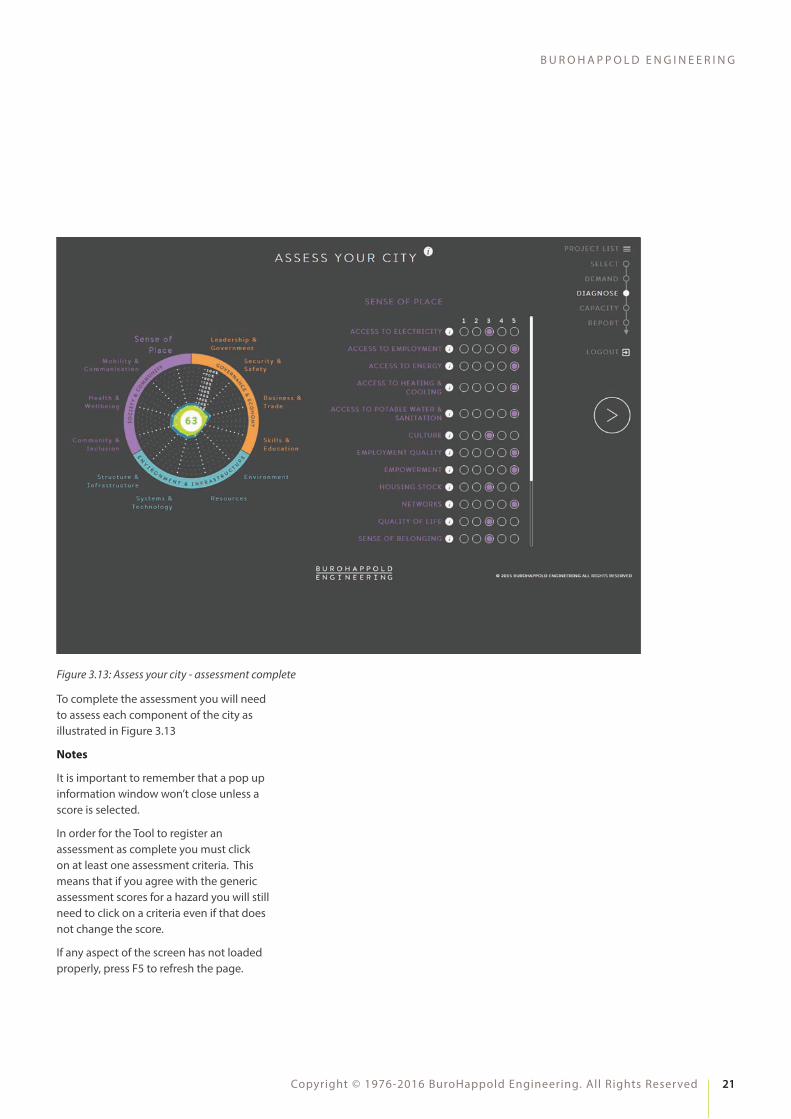
To complete the assessment you will need to assess each component of the city as illustrated in Figure 3.13
Notes
It is important to remember that a pop up information window won’t close unless a score is selected.
In order for the Tool to register an assessment as complete you must click on at least one assessment criteria. This means that if you agree with the generic assessment scores for a hazard you will still need to click on a criteria even if that does not change the score.
If any aspect of the screen has not loaded properly, press F5 to refresh the page.
Figure 3.13: Assess your city - assessment complete
22
R E S I L I E N C E T O O L
Resilience Insight - User Guide revision 01
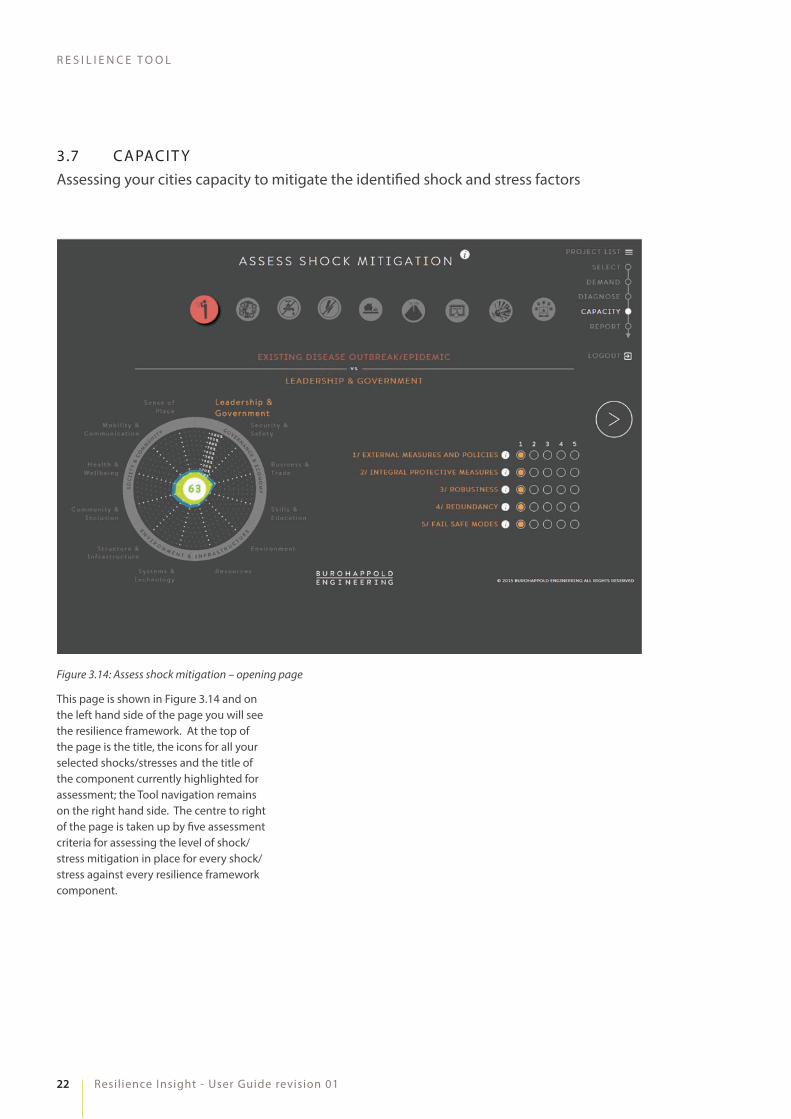
3.7 CAPACIT YAssessing your cities capacity to mitigate the identi�ed shock and stress factors
This page is shown in Figure 3.14 and on the left hand side of the page you will see the resilience framework. At the top of the page is the title, the icons for all your selected shocks/stresses and the title of the component currently highlighted for assessment; the Tool navigation remains on the right hand side. The centre to right of the page is taken up by �ve assessment criteria for assessing the level of shock/stress mitigation in place for every shock/stress against every resilience framework component.
Figure 3.14: Assess shock mitigation – opening page
23
B U R O H A P P O L D E N G I N E E R I N G
Copyright © 1976-2016 BuroHappold Engineering. All Rights Reserved
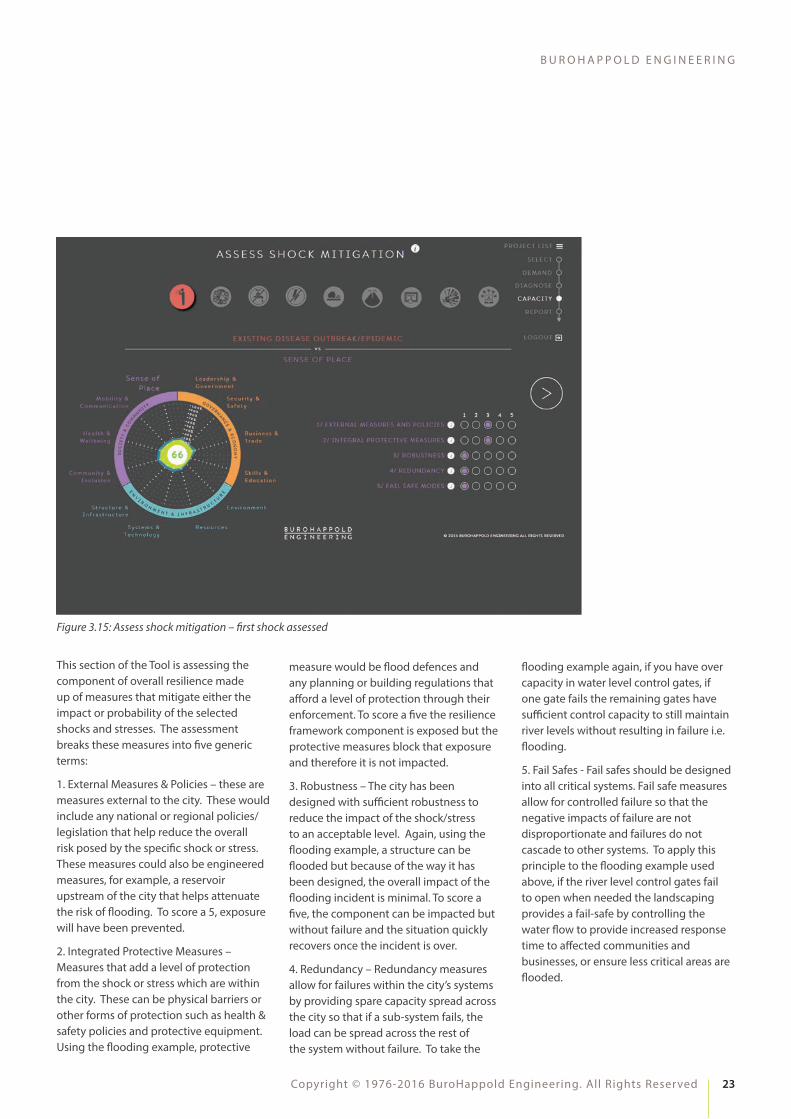
This section of the Tool is assessing the component of overall resilience made up of measures that mitigate either the impact or probability of the selected shocks and stresses. The assessment breaks these measures into �ve generic terms:
1. External Measures & Policies – these are measures external to the city. These would include any national or regional policies/legislation that help reduce the overall risk posed by the speci�c shock or stress. These measures could also be engineered measures, for example, a reservoir upstream of the city that helps attenuate the risk of �ooding. To score a 5, exposure will have been prevented.
2. Integrated Protective Measures – Measures that add a level of protection from the shock or stress which are within the city. These can be physical barriers or other forms of protection such as health & safety policies and protective equipment. Using the �ooding example, protective
measure would be �ood defences and any planning or building regulations that a�ord a level of protection through their enforcement. To score a �ve the resilience framework component is exposed but the protective measures block that exposure and therefore it is not impacted.
3. Robustness – The city has been designed with su�cient robustness to reduce the impact of the shock/stress to an acceptable level. Again, using the �ooding example, a structure can be �ooded but because of the way it has been designed, the overall impact of the �ooding incident is minimal. To score a �ve, the component can be impacted but without failure and the situation quickly recovers once the incident is over.
4. Redundancy – Redundancy measures allow for failures within the city’s systems by providing spare capacity spread across the city so that if a sub-system fails, the load can be spread across the rest of the system without failure. To take the
�ooding example again, if you have over capacity in water level control gates, if one gate fails the remaining gates have su�cient control capacity to still maintain river levels without resulting in failure i.e. �ooding.
5. Fail Safes - Fail safes should be designed into all critical systems. Fail safe measures allow for controlled failure so that the negative impacts of failure are not disproportionate and failures do not cascade to other systems. To apply this principle to the �ooding example used above, if the river level control gates fail to open when needed the landscaping provides a fail-safe by controlling the water �ow to provide increased response time to a�ected communities and businesses, or ensure less critical areas are �ooded.
Figure 3.15: Assess shock mitigation – �rst shock assessed
24
R E S I L I E N C E T O O L
Resilience Insight - User Guide revision 01
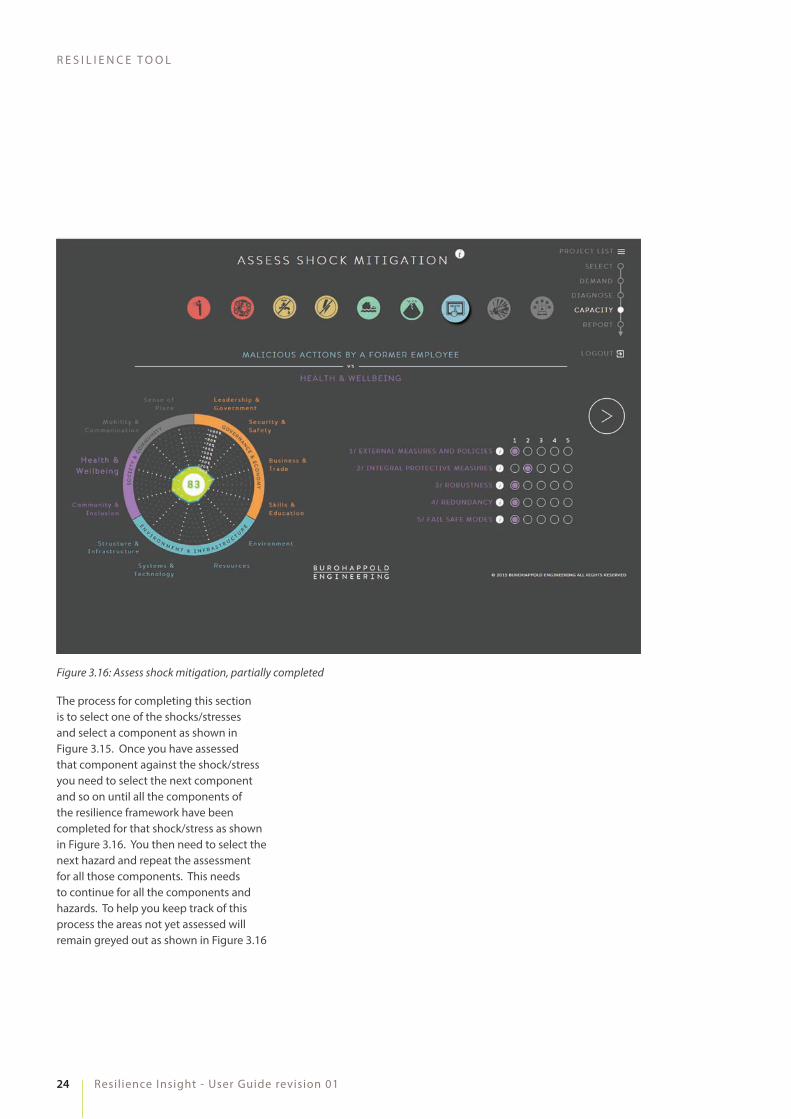
The process for completing this section is to select one of the shocks/stresses and select a component as shown in Figure 3.15. Once you have assessed that component against the shock/stress you need to select the next component and so on until all the components of the resilience framework have been completed for that shock/stress as shown in Figure 3.16. You then need to select the next hazard and repeat the assessment for all those components. This needs to continue for all the components and hazards. To help you keep track of this process the areas not yet assessed will remain greyed out as shown in Figure 3.16
Figure 3.16: Assess shock mitigation, partially completed
25
B U R O H A P P O L D E N G I N E E R I N G
Copyright © 1976-2016 BuroHappold Engineering. All Rights Reserved
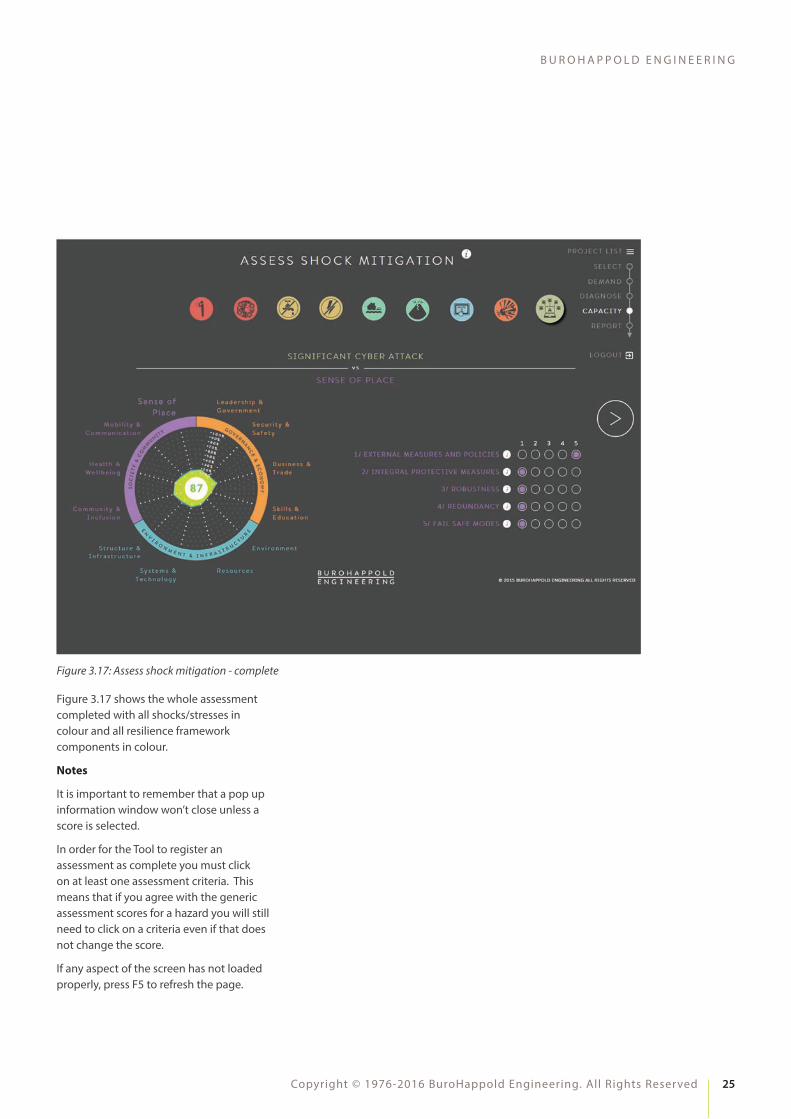
Figure 3.17 shows the whole assessment completed with all shocks/stresses in colour and all resilience framework components in colour.
Notes
It is important to remember that a pop up information window won’t close unless a score is selected.
In order for the Tool to register an assessment as complete you must click on at least one assessment criteria. This means that if you agree with the generic assessment scores for a hazard you will still need to click on a criteria even if that does not change the score.
If any aspect of the screen has not loaded properly, press F5 to refresh the page.
Figure 3.17: Assess shock mitigation - complete
26
R E S I L I E N C E T O O L
Resilience Insight - User Guide revision 01
3.8 REPORT
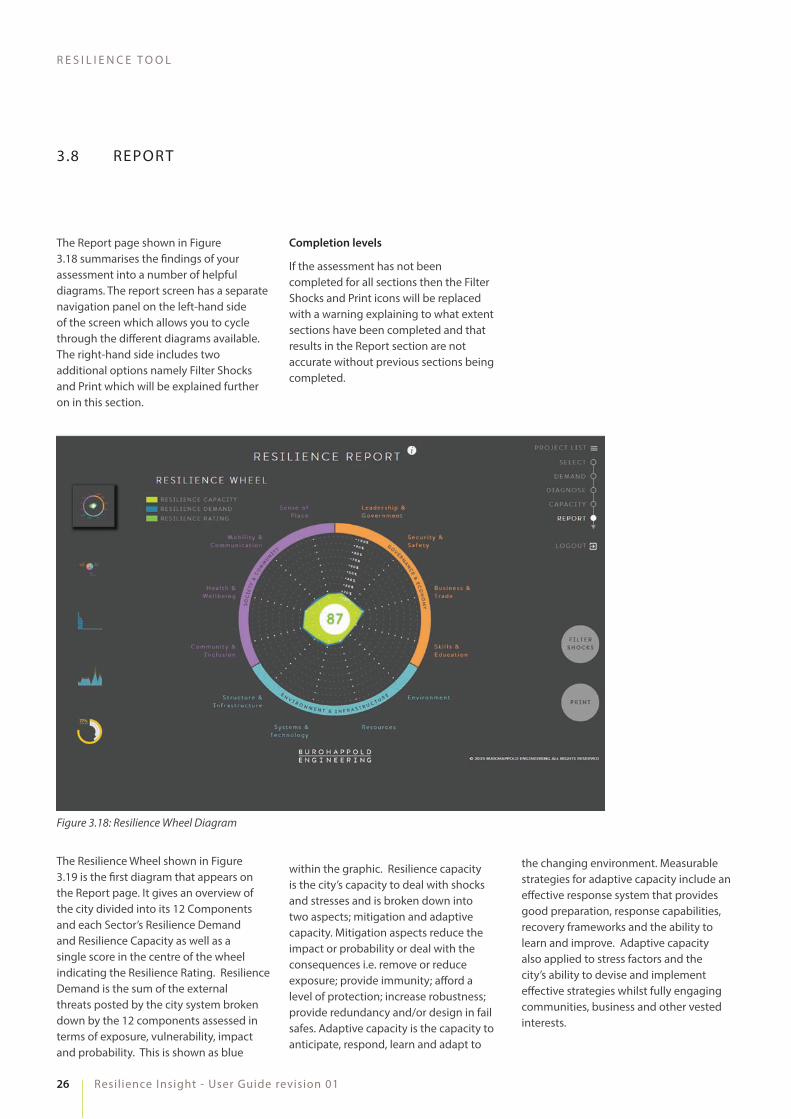
Figure 3.18: Resilience Wheel Diagram
The Report page shown in Figure 3.18 summarises the �ndings of your assessment into a number of helpful diagrams. The report screen has a separate navigation panel on the left-hand side of the screen which allows you to cycle through the di�erent diagrams available. The right-hand side includes two additional options namely Filter Shocks and Print which will be explained further on in this section.
Completion levels
If the assessment has not been completed for all sections then the Filter Shocks and Print icons will be replaced with a warning explaining to what extent sections have been completed and that results in the Report section are not accurate without previous sections being completed.
The Resilience Wheel shown in Figure 3.19 is the �rst diagram that appears on the Report page. It gives an overview of the city divided into its 12 Components and each Sector’s Resilience Demand and Resilience Capacity as well as a single score in the centre of the wheel indicating the Resilience Rating. Resilience Demand is the sum of the external threats posted by the city system broken down by the 12 components assessed in terms of exposure, vulnerability, impact and probability. This is shown as blue
within the graphic. Resilience capacity is the city’s capacity to deal with shocks and stresses and is broken down into two aspects; mitigation and adaptive capacity. Mitigation aspects reduce the impact or probability or deal with the consequences i.e. remove or reduce exposure; provide immunity; a�ord a level of protection; increase robustness; provide redundancy and/or design in fail safes. Adaptive capacity is the capacity to anticipate, respond, learn and adapt to
the changing environment. Measurable strategies for adaptive capacity include an e�ective response system that provides good preparation, response capabilities, recovery frameworks and the ability to learn and improve. Adaptive capacity also applied to stress factors and the city’s ability to devise and implement e�ective strategies whilst fully engaging communities, business and other vested interests.
27
B U R O H A P P O L D E N G I N E E R I N G
Copyright © 1976-2016 BuroHappold Engineering. All Rights Reserved
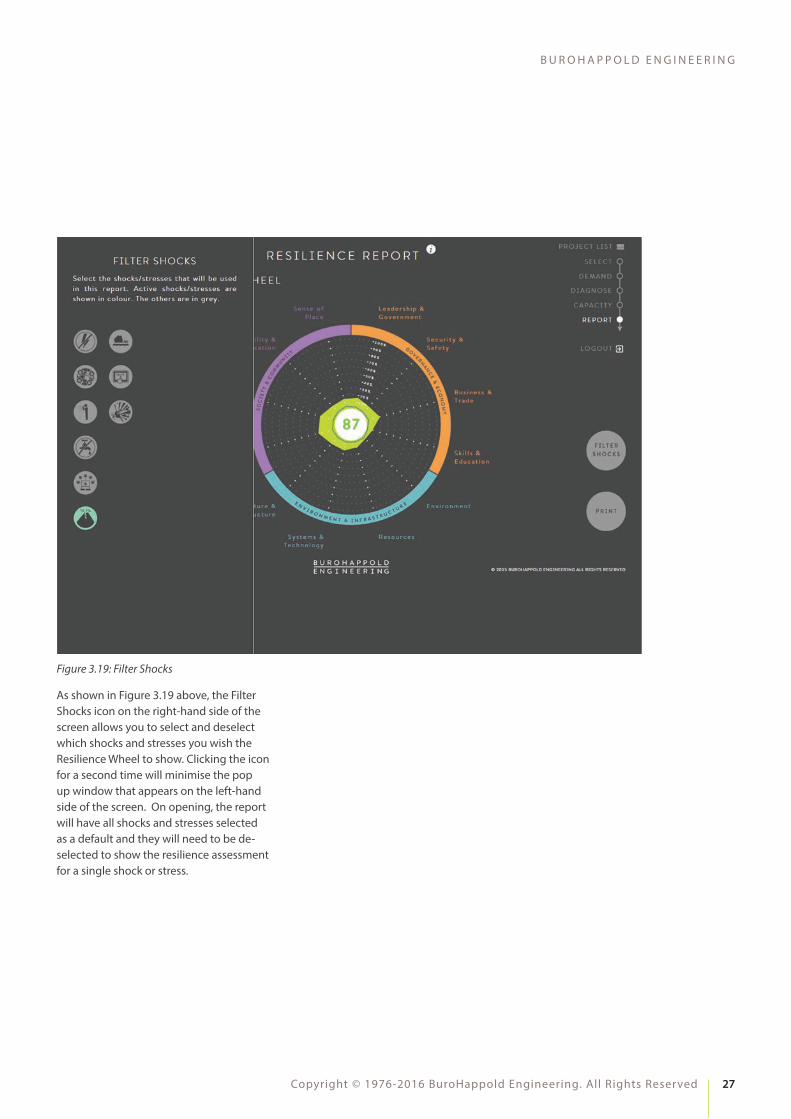
Figure 3.19: Filter Shocks
As shown in Figure 3.19 above, the Filter Shocks icon on the right-hand side of the screen allows you to select and deselect which shocks and stresses you wish the Resilience Wheel to show. Clicking the icon for a second time will minimise the pop up window that appears on the left-hand side of the screen. On opening, the report will have all shocks and stresses selected as a default and they will need to be de-selected to show the resilience assessment for a single shock or stress.
28
R E S I L I E N C E T O O L
Resilience Insight - User Guide revision 01
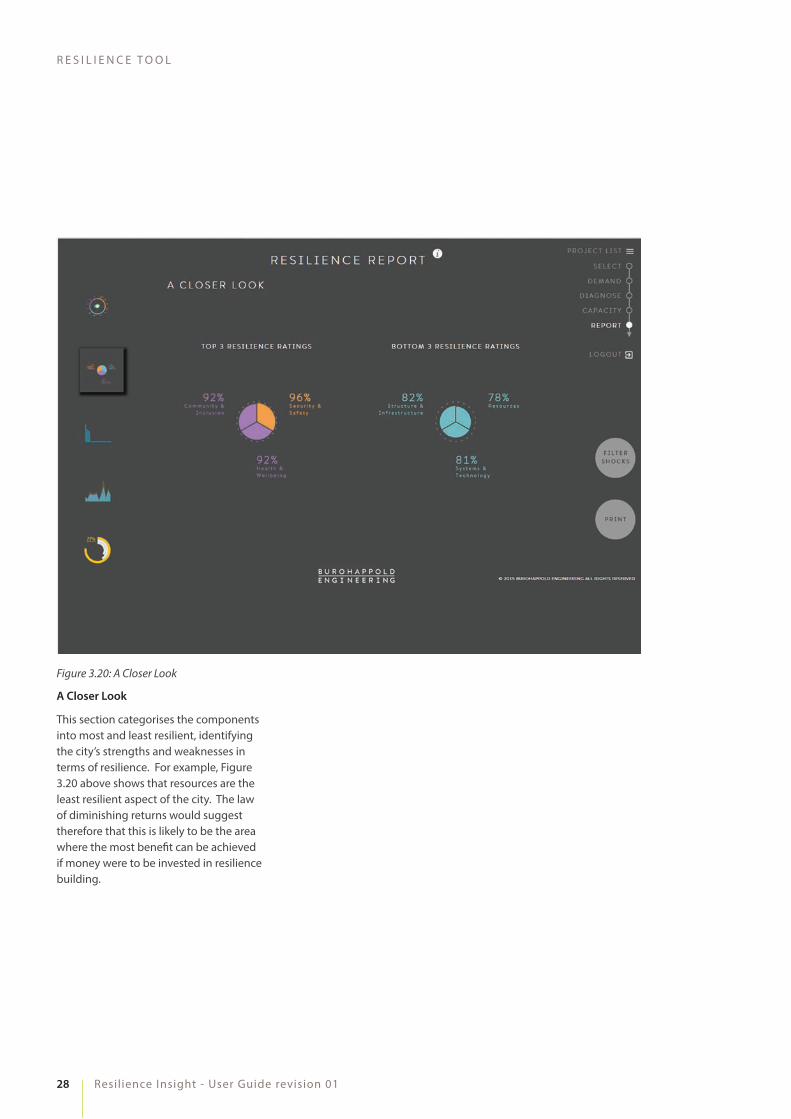
Figure 3.20: A Closer Look
A Closer Look
This section categorises the components into most and least resilient, identifying the city’s strengths and weaknesses in terms of resilience. For example, Figure 3.20 above shows that resources are the least resilient aspect of the city. The law of diminishing returns would suggest therefore that this is likely to be the area where the most bene�t can be achieved if money were to be invested in resilience building.
29
B U R O H A P P O L D E N G I N E E R I N G
Copyright © 1976-2016 BuroHappold Engineering. All Rights Reserved
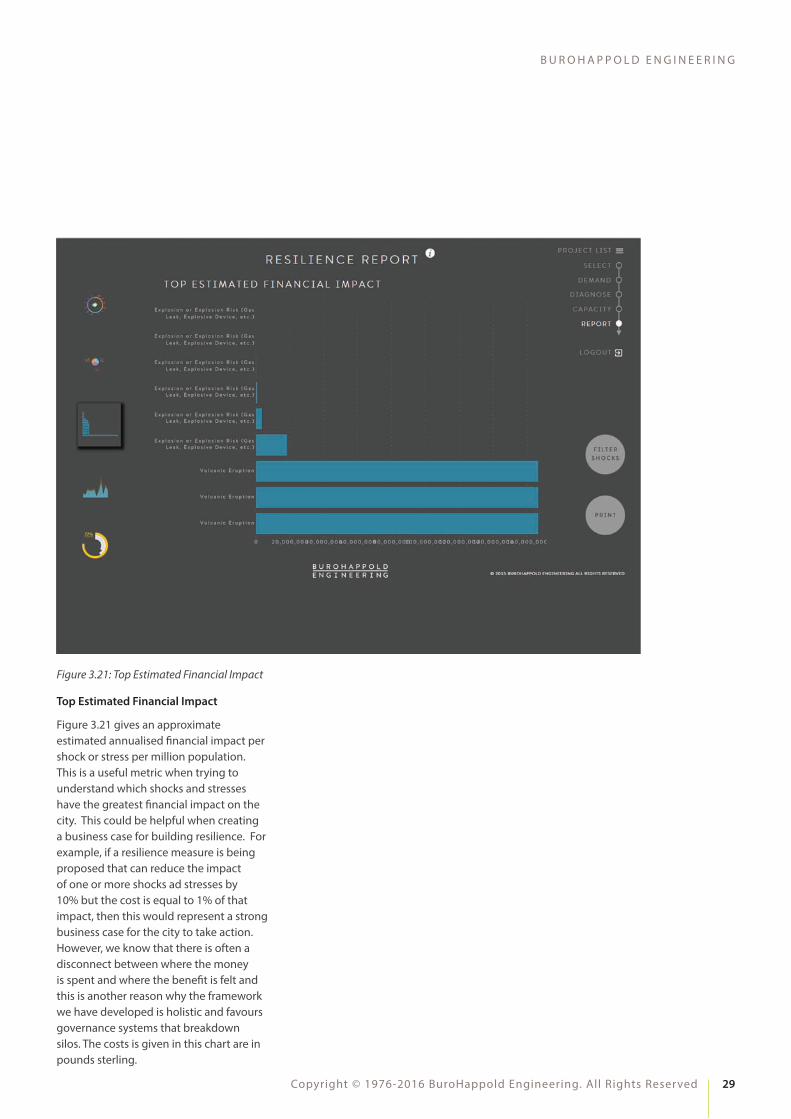
Figure 3.21: Top Estimated Financial Impact
Top Estimated Financial Impact
Figure 3.21 gives an approximate estimated annualised �nancial impact per shock or stress per million population. This is a useful metric when trying to understand which shocks and stresses have the greatest �nancial impact on the city. This could be helpful when creating a business case for building resilience. For example, if a resilience measure is being proposed that can reduce the impact of one or more shocks ad stresses by 10% but the cost is equal to 1% of that impact, then this would represent a strong business case for the city to take action. However, we know that there is often a disconnect between where the money is spent and where the bene�t is felt and this is another reason why the framework we have developed is holistic and favours governance systems that breakdown silos. The costs is given in this chart are in pounds sterling.
30
R E S I L I E N C E T O O L
Resilience Insight - User Guide revision 01
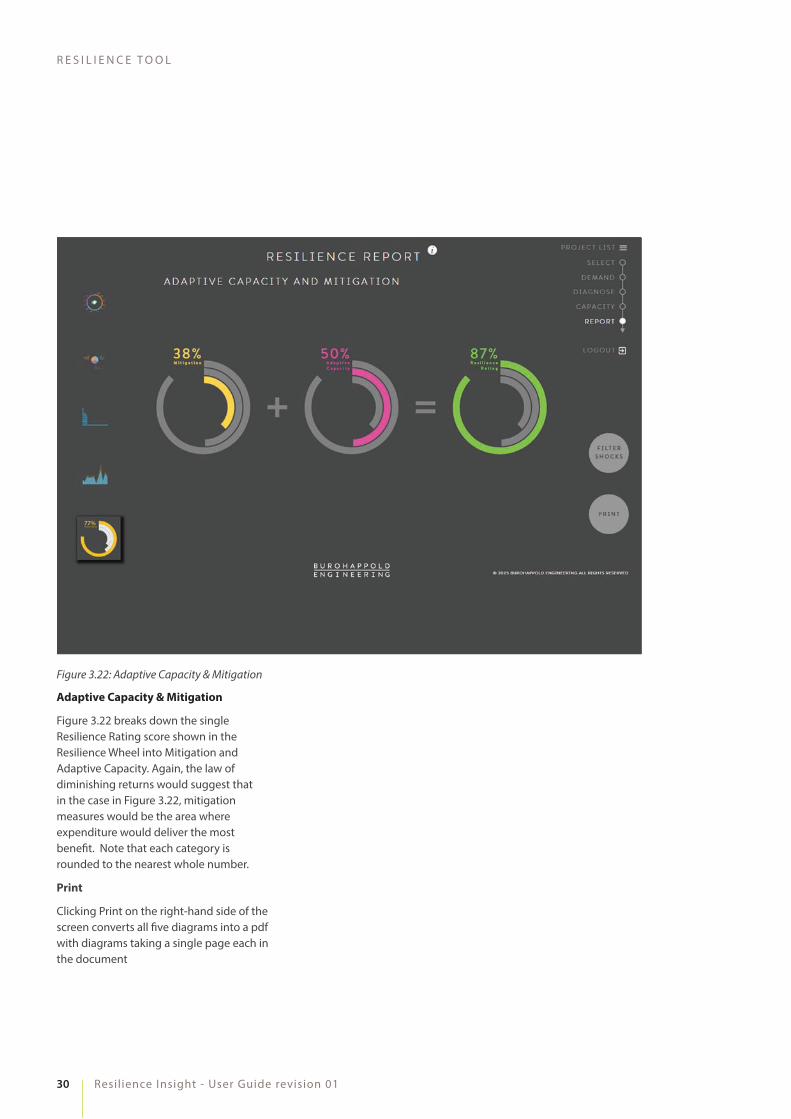
Figure 3.22: Adaptive Capacity & Mitigation
Adaptive Capacity & Mitigation
Figure 3.22 breaks down the single Resilience Rating score shown in the Resilience Wheel into Mitigation and Adaptive Capacity. Again, the law of diminishing returns would suggest that in the case in Figure 3.22, mitigation measures would be the area where expenditure would deliver the most bene�t. Note that each category is rounded to the nearest whole number.
Clicking Print on the right-hand side of the screen converts all �ve diagrams into a pdf with diagrams taking a single page each in the document
31
B U R O H A P P O L D E N G I N E E R I N G
Copyright © 1976-2016 BuroHappold Engineering. All Rights Reserved
4 NEXT STEPS
Further Development
This is the �rst iteration of the Tool and as such there are likely to be areas where improvements can be made. If you would like to suggest changes or amendments, please email: [email protected]
Resilience Building & Further Analysis
If you have found this tool useful and would like support in developing a deeper understanding of your city’s resilience please don’t hesitate to contact us. We use a number of tools to help us take a fresh look at all the key vulnerabilities. Our Resilience Diagnostic maps demand and capacity around three themes: Society & Community; Governance & Economy and Environment & Infrastructure. To complement the insight that this delivers, we often map vulnerabilities spatially to better appreciate physical proximity.
Working with a range of key city stakeholders and drawing on input from our experts in strategic planning, economics, and relevant technical disciplines (e.g. �ood risk or transport planning), we run a series of stakeholder workshops to de�ne strategies that will best address the identi�ed key vulnerabilities.
We believe it is important to resist the temptation to create individual strategies for the di�erent hazards, since this often results in siloed thinking and investment that does not deliver its full potential. We have found that successful resilience strategies address multiple vulnerabilities and deliver bene�ts across a wide range of areas. They also require interventions that cross boundaries between departments. This frequently reveals greatly di�ering interests and priorities, that impede progress. We have found that strategy workshops are invaluable in successfully aligning interests and uniting people around a common goal.
For example; In responding to the problems of �ood risk around the neglected and contaminated Wadi Hanifah water way that runs through the capital of Saudi Arabia, we created a solution
that improved water quality, addressed the �ood risk and also created a beautiful linear park, that has increased citizens’ access to high quality green space. This has proved highly popular, helping to also address issues with obesity and to create greater social cohesion.
Exploiting the capability of the Diagnostic Framework to model future trends, we are able to test possible scenarios against the current baseline, to assess the comparative impact and bene�ts of di�erent strategic options. Our baseline assessment also enables us to take insight into the cost and bene�t of di�erent options and compare them with the cost of inaction – of doing nothing.
Our economics team assesses the viability of propositions. Our evidence-based Integrated Development Plan approach tests the objectives for a particular planned programme against the realities of the economic, social and policy factors shaping market demand and the urban, environmental, infrastructure and organisational factors which shape the ability to meet that demand. Having helped our clients re�ne their thinking and establish robust and measurable objectives, and parameters against which design alternatives can subsequently be developed and tested.
This informs the creation of business cases around possible programmes of activity.
Many cities have hundreds of improvement projects underway at any one time, and in our experience success is driven by clarity on core programmes of work, aligned to the strategies and with appropriate levels of funding. Our experience indicates that there is a lot of duplicated and wasted e�ort, often due to lack of coordination and alignment with the core vision. Widely-agreed strategies supported by well-de�ned programmes of work, with projects that are aligned and well-managed, will maximise outcomes with the limited resources available.
Drawing on our extensive expertise in delivering technical, economic and societal solutions we perform in-depth
quantitative analysis to develop and implement our identi�ed strategies. This may be the detailed design and procurement of identi�ed infrastructure upgrades, the implementation of a community resilience plan through to the development of emergency response plans and training exercises. During this process our resilience consultants are ensuring that these deliverables are joined-up and in alignment with the resilience strategy to maximise the return on investment. They re-run the diagnostic tool to illustrate the measurable resilience bene�ts obtained through the implementation of these solutions.
Bene�ts for People and Governments
One of the key bene�ts noted when implementing this approach with city leaders is that stakeholders are brought together around a common goal. A comprehensive resilience strategy will touch all aspects of a city. It is therefore a great way to integrate a city and break down silos. Very few people understand the big picture, especially with cities; providing an overview for resilience means that the city is integrated around this goal which provides the co-bene�t of better collaboration and better understanding between departments, which results in resilient solutions that maximise bene�ts across multiple agencies.
For Businesses and Investors
Equally, clients investing millions if not billions into a development need to know their investment is protected and the business case supporting that investment will remain pertinent for the necessary period of repayment or for the development’s lifetime. The risk management model that sets the scene for our resilience approach is focused on creating and protecting value; looking at the underlying assumptions upon which business models are based and understanding how strategic risk factors can both challenge these assumptions but also reveal previously unidenti�ed opportunities.
32
R E S I L I E N C E T O O L
Resilience Insight - User Guide revision 01
2.5. Output Data shall only be reproduced in full including any and all assumptions and disclaimers.
3. Information Supplied by the User
3.1. In order to use the Tool, the User will be required to submit the Input Data.
3.2. Input Data shall remain the property of the User but the User grants to BuroHappold an irrevocable, perpetual, unrestricted, royalty-free licence to use and reproduce the Input Data for any purpose.
3.3. The User warrants that:
3.3.1. intellectual property rights in the Input Data are owned by the User and the User has obtained all permissions and consents required in order to enable the User to grant to BuroHappold the licence and permissions required under this clause 3;
3.3.2. use of the Input Data by BuroHappold will not infringe the intellectual property rights or other rights of any third party; and
3.3.3. it has used all reasonable skill and care to ensure that any Input Data submitted is accurate and correct at the time of submittal.
3.4. The User shall indemnify and hold harmless BuroHappold in respect of any claim, proceeding, loss or damage arising out of the breach of the User’s warranties under clause 3.3 or the use of the Input Data by BuroHappold.
3.5. BuroHappold shall use all reasonable endeavours to ensure that any Input Data will not be shared with any third party outside BuroHappold in a form that can be attributed to a speci�c User.
data which are produced by the Tool from the User’s Input Data.
2. Purpose and Acceptable Uses of the Tool
2.1. The Tool has been developed to support the global need to build resilience within cities and to meet the di�cult environmental and social changes the world is facing. Resilience building on the scale required will only happen with signi�cant investment by the public and private sector; investment that can only be delivered through evidence based business cases. The purpose of the Tool is to support the development of these business cases by providing a Tool that can provide measures of resilience demand and resilience capacity and show how speci�c improvements in resilience capacity can contribute to meeting the overall resilience demand.
2.2. The Output Data are a range of metrics that can be used within business cases and reports for building the case for resilience investment. Output Data is intended for the User’s internal review and use only. Output Data is not to be used for personal gain be that political, �nancial, commercial or otherwise.
2.3. Commercial Use. Output Data may not be used for or incorporated into a service o�ering by the User to a third party without the express written agreement of BuroHappold, which may be withheld or made subject to further conditions (including but not limited to the payment of royalties) at BuroHappold’s discretion.
2.4. Output Data may not be shared with third parties or put into the public domain without the express permission of BuroHappold.
APPENDIX A – TERMS OF USE
RESILIENCE INSIGHT TOOL - TERMS OF USE (V.1.2)
1. Agreement
1.1. These terms and conditions (the “Terms”) set out the terms on which Buro Happold Limited (a company registered in England & Wales with company number 02049511) (“BuroHappold”) agrees to be make available the Resilience Insight Tool (the “Tool”) for access and use by users (the “User”).
1.2. BuroHappold agrees to allow the User to access and use the Tool in consideration of the User’s acceptance of these Terms.
1.3. The User must set up an account (a “User Account”) in order to access the Tool. The User warrants that all information submitted to BuroHappold when setting up a User Account is accurate and not misleading.
1.4. No amendment to these Terms shall be e�ective unless it is in writing and signed by a company director of BuroHappold.
1.5. In these Terms, “Input Data” shall mean the data which the User submits in order to use the Tool, and “Output Data” shall mean the reports, metrics and other
33
B U R O H A P P O L D E N G I N E E R I N G
Copyright © 1976-2016 BuroHappold Engineering. All Rights Reserved
5.6. The Tool is available on a public website so it is advised that any personal details on the system are kept to a minimum. Although BuroHappold will take reasonable steps to maintain the security of the Tool and the Input Data, the User is asked to take steps to ensure that it does not make itself vulnerable by sharing information that could be later exploited for criminal purposes.
5.7. BuroHappold shall have no liability to the User for any indirect losses including but not limited to loss of production, loss of pro�ts, loss of business or any consequential losses or damage arising in connection with the use of the Tool or the Output Data by the User.
5.8. In any event the liability of BuroHappold to the User for any claim or claims arising out of or in connection with the Tool and/or the Output Data shall not exceed the sum of £10,000 in the aggregate.
4.4. The User shall not, without the express written permission of BuroHappold, use the Output Data or the name or any trademarks of BuroHappold and/or its a�liates in or for any publicity, advertising or marketing material.
5. Liability and Disclaimer
5.1. The Tool has been developed by BuroHappold using reasonable skill and care. However, Output Data is wholly dependent on the Input Data submitted by the User. The User acknowledges that it is solely responsible for the accuracy and completeness of the Input Data.
5.2. BuroHappold does not warrant that any Output Data is accurate or complete and shall have no liability to the User for any inaccuracies or omissions in the Output Data.
5.3. Output Data is based on the information available at the time the Output Data is delivered.
5.4. Any assumptions, projections, forecasts, analyses, opinions or conclusions in the Output Data are based on estimates and assumptions developed for the Tool. These estimates and assumptions are based on currently available data and information and the Output Data may not prove accurate if the assumptions do not occur or do not occur in the manner expected, or if unanticipated events take place. BuroHappold cannot accept responsibility for any such inaccuracy.
5.5. Nothing in the Tool or the Output Data constitutes speci�c advice to the User. The User is advised to undertake its own investigations and analysis before taking any decisions. Any conclusions drawn or decisions taken on the basis of Output Data are the responsibility of the User alone.
3.6. Aggregated Input Data will be used from time to time to produce global city resilience reports but BuroHappold will use all reasonable endeavours to anonymise such data prior to use.
4. Intellectual Property
4.1. The Tool and all its content is the property of BuroHappold and/or its a�liates. All copyright, patents, trademarks and other intellectual property rights in the Tool and in any reports or other data generated by the Tool remain vested in BuroHappold and/or its a�liates.
4.2. BuroHappold grants the User a limited and revocable licence to use the Tool and the Output Data in accordance with and for the purposes expressly set out in these Terms.
4.3. The User shall not:
4.3.1. use, copy, modify, create derivative works from or distribute the Tool or its associated software, any part of it, or any copy, adaptation, transcription, or merged portion of it, except to the extent that the foregoing acts are permitted by law;
4.3.2. decode, reverse engineer, disassemble, decompile or otherwise translate or convert any part of the Tool or its associated software;
4.3.3. remove or alter any copyright, proprietary or similar notices from the Tool or Output Data.
34
R E S I L I E N C E T O O L
Resilience Insight - User Guide revision 01
7.2. Subject to clause 7.1, which shall be a condition precedent to the User commencing any proceedings against BuroHappold, any other dispute or di�erence arising between the parties shall be submitted to the exclusive jurisdiction of the courts of England and Wales.
7.3. These Terms are governed by and shall be construed in all respects in accordance with the laws of England.
8. Miscellaneous
8.1. These Terms constitute the entire agreement between BuroHappold and the User in relation to access and use of the Tool.
8.2. BuroHappold may update or amend these Terms at any time by giving 30 days’ notice to the User. Continued use of the Tool by the User without objection, after the end of that 30 day notice period, constitutes acceptance of the updated Terms by the User.
5.9. The User acknowledges that the limitations of liability herein are reasonable in the context of BuroHappold providing access to the Tool free of charge and as a gesture of goodwill.
5.10. Nothing in these Terms shall be construed as limiting or excluding any liability for fraud, fraudulent misrepresentation, personal injury or death resulting from a party’s negligence, or any other liability which may not be so limited or excluded by law.
6. Suspension and Termination
6.1. BuroHappold may at any time suspend or cancel the availability of the Tool, remove or change any features or capabilities of the Tool, or may terminate any or all User Accounts, at its sole discretion, without incurring any liability to the User.
6.2. Access to the Tool may be temporarily suspended or restricted from time to time to allow for maintenance, repair, upgrade or other changes to the Tool.
6.3. If the User breaches these Terms then BuroHappold may immediately and without notice revoke the User’s licence to use the Tool and suspend or terminate the User’s Account. Any termination or suspension of the User’s Account is agreed to be at BuroHappold’s absolute discretion. On termination BuroHappold may delete the User’s data.
7. Law and Disputes
7.1. Any complaint about the Tool by the User or other dispute or di�erence raised by the User shall be submitted in writing with full details to Buro Happold Limited, Camden Mill, Lower Bristol Road, Bath BA2 3DQ, addressed for the attention of the Risk & Resilience Team. BuroHappold shall investigate the complaint, dispute or di�erence and shall notify the User of the outcome of the investigation within 3 months.
8.3. Save as set out expressly herein all representations, conditions or warranties whether express or implied by statute or common law are excluded to the maximum extent permitted by law.
8.4. In the event that any competent tribunal or court of law should decide that one or more of these Terms are unenforceable then that term shall be severed and deleted and the remaining Terms shall remain in full force and e�ect and shall remain binding upon the parties.
8.5. The User shall not be entitled to assign or transfer the bene�t of or any right or bene�t under these Terms.
8.6. It is not intended that any person not a party to these Terms shall have any rights hereunder pursuant to the Contracts (Rights of Third Parties) Act 1999 or otherwise.
8.7. Any notice or communication to BuroHappold shall be addressed to Buro Happold Limited at its registered address, marked for the attention of the Risk & Resilience Team.
1.4 Points of Contact
1.4.1 Information
User shall be submitted in writing with full details to Buro Happold Limited, Camden Mill, Lower Bristol Road, Bath BA2 3DQ, addressed for the attention of the Risk & Resilience Team
35
B U R O H A P P O L D E N G I N E E R I N G
Copyright © 1976-2016 BuroHappold Engineering. All Rights Reserved
Mitigation - Mitigations can remove or reduce exposure, provide immunity, implement protective measures, increase robustness, provide redundancy and design in fail safes. This are implemented prior to a shock occurring.
Measures
Protect - The action of protecting and often preserving the status quo.
Robust - A system’s ability to resist an impact without changing its initial stable form.
Redundant - The addition of components which are not necessary to functioning but are included in case of failure in other components.
Fail-Safe - In the event of a failure, the component fails in a way that prevents or mitigates the impact on the wider system.
Resilience - The ability to anticipate and adapt to shocks & stresses; implementing lessons learned to leverage emerging opportunities, and e�ectively reduce vulnerabilities.
Risk - Risk is a product of a hazard's severity and its probability.
Shocks - Any event or circumstance (happening with or without warning) or combination of events that cause or threaten immediate death or injury, disruption to the community, or damage to property or to the environment on such a scale that the e�ects cannot be dealt with as part of normal, day-to-day activities of the a�ected community. Shocks are short term and end when the underlying cause stops.
Stresses - A trend that over time change the circumstances and environment under which cities and buildings operate. Incrementally, these factors will challenge the base assumptions upon which many business models are founded; and challenge the norms, values and standards underpinning communities.
Demand - Numerical measurement of the strain placed on city’s systems and components due to various shocks and stresses. This is based on a risk calculations and is the product of 1) a city's exposure to a risk and 2) the severity and (3) the probability of occurrence. This value is rather arbitrary since the important measure is the percentage that is mitigated i.e. rating.
Vulnerability - Vulnerability is the susceptibility of a body (building, people, environments, assets, etc) to a hazard.
APPENDIX B – GLOSSARY OF TERMS
Adaptive Capacity - Adaptive capacity is the capacity of people, organisations, cities, regions, nations and trans-national organisations to adapt to the changing environment. Adaptive capacity can be characterised by the ability to observe the environment, detect changes, research and understand those changes, formulate options on how to deal with those changes, decide on a course of action and its implementation. Furthermore, these actions must also be understood for their impact and e�ectiveness. To ensure the situation develops and progress is achieved in the future, lessons must be learnt in order that behaviours do not revert back to the original set of circumstances.
Measures
Prepare - Proactive measures that reduce the risk of a hazard.
Respond - The ability to respond in a timely manner.
Recover - Measures to ensure a recovery period is planned for.
Learn & Improve - Measures to make sure the city reviews, learns and adapts its measures in order to improve their resilience in time for the next event.
Resilience Rating - The percentage of the resilience demand that is met through mitigation and adaptive capacity measures. Rating = resilience capacity / resilience demand.
Copy
right
© 1
976-
2016
Bur
oHap
pold
Eng
inee
ring.
All
Righ
ts R
eser
ved
C O N TA C TCaroline Field
T: +44 (0)1225 320 600M: +44 (0)7225 320 691
Email: [email protected]
w w w.burohappold.com
BUROHAPPOLD’S RESILIENCE TOOL
R E S I L I E N C E I N S I G H T U S E R G U I D ER E V I S I O N 0 1