Embed Size (px)
Citation preview

ResidualRetailMarketDemandAnalysis–420BathurstStreet,
Toronto,Ontario
Prepared for:
Riotrin Properties (Bathurst) Inc.
February 13, 2013

February13,2013
Mr.JordanRobinsSeniorVicePresidentDevelopmentRiotrinProperties(Bathurst)Inc.2300YongeStreet,Suite500Toronto,OntarioM4P1E4
DearMr.Robins:
Re:ResidualRetailMarketDemandAnalysis–420BathurstStreet–Toronto,Ontario
urbanMetricsinc.ispleasedtosubmitourreportthatsummariestheresultsofaresidualmarketdemandanalysis,whichassessesthecurrentandfuturemarketsupportavailabletotheproposedcommercialdevelopmentat420BathurstStreetintheCityofTorontoandwhethertheproposeddevelopmentwillhaveanyadverseeffectsontheeconomichealthofnearbyshoppingdistricts.
Thisreportrepresentsanupdatetoourearlierstudyentitled“RetailMarketReview–420BathurstStreet–Toronto,Ontario”datedDecember5,2011,whichexaminedthepotentialimpactoftheproposedredevelopmentonnearbyshoppingdistricts.Theproposeddevelopmentat420BathurstStreetwouldbecomprisedofsome135,000squarefeetofcommercialspaceonthreelevels.Some35,000squarefeetofretail/servicespacewouldbelocatedatstreetlevel,withtwofloorsoflargescaleretailuseslocatedabove,eitherastwoseparatetenantsorasonelargergeneralmerchandisetenantoccupyingthemajorityofthisupperlevelspace.
Theanalysesandappendicesintheattachedreportprovideourdetailedstudyfindingsandconclusions.Basedonthisresidualanalysis,itisourprofessionalopinionthatanyofthepotentialtenantsthatcouldlocateintheproposeddevelopmentcanbeeasilyaccommodatedinthemarketbasedonfuturemarketgrowthalonewithlimited,ifany,impactonexistinglocalshoppingdistrictsintheTradeArea.Inaddition,wehaveundertakenadetailedinventoryofallretailandservicefacilitiesinthefournearbyshoppingdistrictsandhavereviewedthisinventorydata.Itisstillourprofessionalopinionthatthesubjectproposalwillbeverydifferentfromtheseshoppingdistrictsintermsoftenanttypesandsizes.Inourview,thetenantslikely

tobeattractedtotheproposeddevelopmentonthesubjectsiteareverydifferentfromtenantsinnearbyshoppingdistricts.
IthasbeenapleasureconductingthisstudyonbehalfofRiotrinProperties(Bathurst)Inc.andwelookforwardtodiscussingourresults.
Yourstruly,
urbanMetrics inc.
DouglasR.Annand,CMC Partner

ResidualRetailMarketDemandAnalysis–420BathurstStreet
TABLE OF CONTENTS
1 INTRODUCTION........................................................................................................................1
2 TRADEAREAEXTENT.............................................................................................................3
3 POPULATIONANDINCOMEINTHETRADEAREA........................................................5
3.1 HISTORIC,CURRENTANDFUTUREPOPULATION...........................................................................................5 3.2 PERCAPITAINCOME...........................................................................................................................................7
4 RESIDUALMARKETANALYSIS............................................................................................8
4.1 RESIDUALFOODSTOREANALYSIS...................................................................................................................8 4.1.1 FSRExpenditurePotential..........................................................................................................................8 4.1.2 ResidualMarketAnalysisforaSupermarket.................................................................................10 4.1.3 ResidualMarketAnalysisforOtherFoodStoreSpace...............................................................11
4.2 RESIDUALNON‐FOODRETAILSTOREANALYSIS........................................................................................13 4.2.1 NFSRExpenditurePotential...................................................................................................................13 4.2.2 ResidualDepartmentStoreAnalysis...................................................................................................15 4.2.3 ResidualNon‐DepartmentStoreNFSRAnalysis...........................................................................16
5 NEARBYSHOPPINGDISTRICTS.........................................................................................18
5.1 KENSINGTONMARKETBUSINESSIMPROVEMENTAREA...........................................................................18 5.2 CHINATOWNBUSINESSIMPROVEMENTAREA.............................................................................................21 5.3 LITTLEITALYBUSINESSIMPROVEMENTAREA...........................................................................................23 5.4 TRINITYBELLWOODSBUSINESSIMPROVEMENTAREA.............................................................................26
APPENDIXA–RETAILMARKETREVIEW–420BATHURSTSTREET..........................28
APPENDIXB–TRADEAREAPOPULATIONPROJECTIONS..............................................45
APPENDIXC–TRADEAREAINVENTORY..............................................................................49

ResidualRetailMarketDemandAnalysis–420BathurstStreet
1
1 INTRODUCTION
Thefollowingreportoutlinestheresultsofaresidualretailmarketdemandanalysis,whichassessesthecurrentandfuturemarketsupportavailabletoaproposedcommercialprojecttobedevelopedbyRiotrinProperties(Bathurst)Inc.at420BathurstStreetintheCityofToronto.Thereportalsoassesseswhethertheproposeddevelopmentwilladverselyaffecttheeconomichealthofnearbyshoppingdistricts.
Theproposeddevelopmentwouldbecomprisedofsome135,000squarefeetofcommercialspaceonthreelevels.Some35,000squarefeetofretail/servicespacewouldbelocatedatstreetlevel,withtwofloorsoflargescaleretailuseslocatedabove,eitherastwoseparatetenantsorasonelargegeneralmerchandisetenant(likelyadepartmentstore)occupyingthemajorityofthisupperlevelspace.
Thisstudyrepresentsanupdatetoourearlierstudyentitled“RetailMarketReview‐420BathurstStreet‐Toronto,Ontario”datedDecember5,2011.Inthatstudy,whichisattachedasAppendixAtothisreport,weexaminedthepotentialimpactofthesubjectproposalonthenearbyshoppingdistricts,toaddressthepolicyconsiderationsetoutinOfficialPlanpolicy4.5.3(b).Fourlocalshoppingdistrictswereconsideredinthisstudy,including:theKensingtonMarketBIA,theChinatownBIA,theLittleItalyBIA,andtheretail/servicestripalongDundasStreetwestofBathurstStreet,knownastheTrinityBellwoodsBIA.
Thisearliermarketreviewconcludedthatthesubjectproposalat420BathurstStreetwouldbeverydifferentthanthesenearbyshoppingdistricts.Itwasourprofessionalopinionthattheseshoppingareasarenotonlydifferentinscaleandtype,butfunctionverydifferentlyfromthelargerformatstoresproposedfor420BathurstStreet,astheylargelyserveverydifferentanddiversesegmentsofabroaderGreaterTorontoArea(“GTA”)market.Consequently,itwasourconclusionthattheproposeddevelopment,onasitethathistoricallyhashadsignificantretailpermissions,wouldhavenoimpactonthenearbyshoppingdistrictsnotedabove.
TheearliermarketreviewwassubmittedtotheCityinsupportoftheminorvarianceapplicationforthe420BathurstStreetproject,andalsopresentedasevidenceattheOntarioMunicipalBoardhearingthatdealtwiththisapplication.TheBoardruledthattheproposeddevelopmentrequiredare‐zoning,andthisfurthermarketreport,alongwiththeearliermarketreview,isbeingsubmittedinsupportofthere‐zoningapplicationthatisnowbeingmadeforthesite.
Therefore,inthisstudywehavecarriedoutadetailedresidualmarketanalysisinaTradeAreadelineatedtorepresentthegeographicareafromwhichthevariouspotentialusesinthesubjectdevelopmentwoulddrawtheirsupport.Inthisarea,wehaveexaminedthecurrentandprojectedpopulationwhowillliveinthisarea,andtheadditionalmarketsupportthatthisfuturepopulationgrowthwillprovideforexistingandnewretailspaceintheTradeArea,includingthespaceproposedatthe420BathurstStreetsite.Weshouldnotethataresidual

ResidualRetailMarketDemandAnalysis–420BathurstStreet
2
typeanalysisisaconservativemethodfordeterminingthefuturemarketavailableinaTradeAreaandthefuturespacewarrantedasitprotectsexistingretailfacilitiesattheircurrentsalesperformancelevels.Therefore,notransferofsalesfromexistingstoresisrequiredtosupportnewretailspaceenteringtheTradeAreainfutureyears.
Inaddition,wehavecarriedoutadetailedinventoryofallretailandservicefacilitiesinthefournearbyshoppingdistrictsnotedabove,toidentifythedistributionoftenanttypesandsizesintheseareas.Thisdataassistsinillustratinghowtheseretailareasaredifferentfromanyofthepotentialtenantsthatwilllocateinthesubjectcommercialproject.
Theresultsofthisnewanalysisaresummarizedinthesectionsofthisreportthatfollow,whichstronglysupporttheconclusionsthatwerearrivedatfromourearlieranalysisinDecember,2011.

ResidualRetailMarketDemandAnalysis–420BathurstStreet
3
2 TRADEAREAEXTENT
Forthepurposesofthisresidualanalysis,twoTradeAreashavebeendelineated;aPrimaryTradeAreaandaSecondaryTradeArea(Figure2‐1).ThePrimaryTradeAreahasbeenutilizedtoestimatetheavailablefoodstoreretail(FSR)expenditurepotential,asasupermarketmaybeapotentialtenantintheproposeddevelopmentandwouldlikelydrawthemajorityofitssalesfromthisgeographicarea.ItshouldbenotedthatthePrimaryTradeAreacoversaslightlylargergeographicareathanthelocalmarketareainourearlierRetailMarketReview,whichwaslargelydelineatedtodeterminethelocationofthenearbylocalshoppingdistrictswhereimpactwastobetested.Thislocalareathatwasdefinedinourearlierstudywasonlypartoftheareawherethesubjectdevelopmentandthefournearbyshoppingareaswouldderivethemajorityoftheirsalessupport.Asnotedabovethesefourlocalshoppingdistrictsinclude:theKensingtonMarketBIA;theChinatownBIA;theLittleItalyBIA;andtheTrinityBellwoodsBIA,whichareallwhollycontainedwithinthePrimaryTradeArea.
BoththePrimaryandSecondaryTradeAreaswereutilizedtoestimatetheavailablenon‐foodstoreretail(NFSR)potential.ThislargerTradeAreaisusedtoestimatethefutureNFSRpotential,asapossibledepartmentstoretenantorotherlargeformatNFSRretailerslocatingonthesubjectsitewouldattractcustomersfromalargergeographicareathanasupermarket.
FIGURE2‐1:PRIMARYANDSECONDARYTRADEAREAZONES
Source: Google Maps

ResidualRetailMarketDemandAnalysis–420BathurstStreet
4
ThePrimaryTradeAreaisborderedbyBloorStreetWestinthenorth,UniversityAvenueintheeast,QueenStreetWestinthesouthandOssingtonAvenueinthewest.TheSecondaryTradeAreaislocatedtothesouthofthePrimaryTradeArea,andisborderedbyQueenStreetWestinthenorth,UniversityAvenueintheeast,FrontStreetWestandtheCNRaillineinthesouthandextendssouthfromOssingtonAvenueinthewest.
Thisistheareafromwhichthepotentialtenantsinthe420BathurstStreetprojectwillderivethemajorityoftheirsales,thoughitisouropinionthattheBIAsintheareaandinparticularKensington,ChinatownandLittleItalywilldrawfromamuchbroaderarea.ItshouldbenotedthatthereareotherretailareasandBIAsmostlyontheborderoftheTradeArea,thatservetosomedegreeresidentslivinginbothzonesoftheTradeArea.However,theOfficialPlanpolicyconsideration,asstatedinPolicy4.5.3(b),seekstoensurethatlargescaleretailusesinMixedUseAreaswillnotadverselyaffecttheeconomichealthofnearbyshoppingdistricts.Inouropinion,onlythefourBIA’snotedabovecanbeconsideredasnearbyshoppingdistricts.

ResidualRetailMarketDemandAnalysis–420BathurstStreet
5
3 POPULATIONANDINCOMEINTHETRADEAREA
TodeterminethepotentialdemandandmarketsupportforthevariouspotentialretailusesintheproposedcommercialdevelopmentonthesubjectsiteandtheirpotentialimpactonnearbyshoppingdistrictsintheTradeArea,itisnecessarytoestimatethefuturepopulationwithinthedefinedPrimaryandSecondaryTradeAreas.Populationchange,inadditiontoincome,representsthemostsignificantfactorsthatcaninfluencetheleveloffutureretailsalesavailableinanareaandtheretailspacewarrantedinfutureyears.
3.1 HISTORIC,CURRENTANDFUTUREPOPULATION
Figure3‐1summarizesthehistoric,currentandfuturepopulationinthePrimaryandSecondaryTradeAreas.ThehistoricpopulationisbasedonCensusofCanadadatafor1996,2001,2006and2011,asadjustedtoaccountfornetunder‐coverageintheCensus.
WhilethepopulationinthePrimaryTradeAreadeclinedduringthe1996to2001and2001to2006Censusperiods,itincreasedbetween2006and2011,recapturingallofthepopulationlostinthepreviousdecade.Conversely,theSecondaryTradeAreahasexperiencedstrongpopulationgrowthineachCensusperiodbetween1996and2011,duetothesignificantamountofnewcondominiumapartmentdevelopmentinthisarea.
FIGURE3‐1:TRADEAREAPOPULATION,1996TO2031
Current
1996 2001 2006 2011 2012 2014 2016 2021 2026 2031
Primary Trade Area 52,046 51,810 49,885 53,213 53,600 54,300 55,600 57,100 58,500 60,000
Periodic Growth (237) (1,924) 3,327 387 700 1,300 1,500 1,400 1,500
Periodic Growth Rate (%) ‐0.5% ‐3.7% 6.7% 0.7% 1.3% 2.4% 2.7% 2.5% 2.6%
Average Annual Growth (47) (385) 665 387 350 650 300 280 300
Average Annual Growth Rate (%) ‐0.1% ‐0.8% 1.3% 0.7% 0.7% 1.2% 0.5% 0.5% 0.5%
Secondary Trade Area 7,862 11,658 15,311 20,171 23,300 29,600 35,200 40,900 46,600 52,400
Periodic Growth 3,796 3,653 4,860 3,129 6,300 5,600 5,700 5,700 5,800
Periodic Growth Rate (%) 48.3% 31.3% 31.7% 15.5% 27.0% 18.9% 16.2% 13.9% 12.4%
Average Annual Growth 759 731 972 3,129 3,150 2,800 1,140 1,140 1,160
Average Annual Growth Rate (%) 8.2% 5.6% 5.7% 15.5% 12.7% 9.0% 3.0% 2.6% 2.4%
Total (Combined) Trade Area 59,909 63,468 65,197 73,384 76,900 83,900 90,800 98,000 105,100 112,400
Periodic Growth 3,559 1,729 8,187 3,516 7,000 6,900 7,200 7,100 7,300
Periodic Growth Rate (%) 5.9% 2.7% 12.6% 4.8% 9.1% 8.2% 7.9% 7.2% 6.9%
Average Annual Growth 712 346 1,637 3,516 3,500 3,450 1,440 1,420 1,460
Average Annual Growth Rate (%) 1.2% 0.5% 2.4% 4.8% 4.5% 4.0% 1.5% 1.4% 1.4%
1
2
Source: urbanMetrics inc. based on data from the Census of Canada and information from the City of Toronto
Historic1
Forecast2
Based on 1996, 2001, 2006 and 2011 Census of Canada. Data were adjusted to account for the net Census undercoverage, using Statistics Canada data
for the Toronto Census Division. The adjustment factors were 3.11% in 1996, 4.47% in 2001, 4.29% in 2006 and 4.92% in 2011.
Forecasts are based on residential development applications for the appropriate Trade Area, obtained from the City of Toronto in January 2013.
Forecast population has been rounded to the nearest 100 persons.

ResidualRetailMarketDemandAnalysis–420BathurstStreet
6
Toforecastpopulationgrowthoverthestudyperiod(to2031),wehavereviewedtrendsinaveragehouseholdsizeandresidentialdevelopmentapplicationsintheTradeArea,availablefromtheCityofTorontoinJanuary2013(detailscanarefoundinAppendixB).AsistypicalinolderareasoftheCity,householdsizesintheexistinghousingstockhavetrendedlower,althoughtherateofdeclinehasslowedineachsubsequentperiodfrom1996to2011.Itisexpectedthathouseholdsizeswillcontinuetodeclineinfutureperiods,butlikelyatamuchslowerrate,whichisconsistentwithrecenttrendsintheCity.Therefore,incalculatingtheforecastpopulationinexistingdwellingunits,wehaveassumedthatthepersonsperunit(PPU)factorcontinuestodeclineintheexistinghousingstock,butataslowerratethaninpastCensusperiods.
Inforecastingpopulationgrowthinnewdwellingunits(thoselikelytobecompletedbetween2011and2031),residentialdevelopmentapplicationsavailablefromtheCityofTorontowerereviewedtodeterminethenumberofproposeddwellingunitsbydwellingtype.Basedonthisdata,therearealmost4,200dwellingunitsinthePrimaryTradeAreathatwererecentlycompleted,areunderconstruction,orareproposedduringthe2011‐2031period.IntheSecondaryTradeArea,thereareapproximately23,500dwellingunitsthathavebeenrecentlycompleted,areunderconstruction,orareproposedoverthisforecastperiod.Whilemanyoftheproposedprojectswillproceedasscheduled,therewillbesomeprojectsthatarenotbuiltduringthestudyperiodordevelopedatlowerdensitiesthancurrentlyproposed.Thiscouldreduceourpopulationforecast.Ontheotherhandhowever,therewillbenewapplicationssubmittedtotheCityforresidentialdevelopmentsintheTradeAreainfutureyearsoftheforecastperiod,whichwilllikelymorethanoff‐setanycurrentapplicationsthatdonotmaterialize.Therefore,inouropiniontheforecastofpopulationlivingintheTradeAreaismorethanlikelyunderstated.Toforecastthepopulationgrowthexpectedfromthenewunits,estimatedPPU’sbydwellingtypefromthe2011CensuswereappliedtothesenewresidentialdwellingunitsincalculatingtheforecastpopulationineachTradeAreazone.
Basedonthismethodology,whichisfullydocumentedinAppendixBattached,wehaveforecastanincreaseinthepopulationinthePrimaryTradeAreaofapproximately2,400personsbetween2011and2016,andanadditional1,500personsby2021.IntheSecondaryTradeArea,populationisexpectedtoincreasebyapproximately15,000personsbetween2011and2016,withanadditional5,700personsaddedby2021.Whilewehaveforecastpopulationto2031,itisthepopulationgrowthexpectedoverthe2011to2021periodthatismostimportantinassessingthemarketsupportfortheproposedcommercialdevelopmentonthesubjectsite.
ThecombinedPrimaryandSecondaryTradeAreashaveaccountedforadisproportionateshareofthepopulationgrowthexperiencedintheCityofTorontoinrecentyears.Withthelargeinventoryofresidentialdevelopmentapplicationsinthepipeline,itislikelythatthePrimaryandSecondaryTradeAreaswillcontinuetoaccountforadisproportionateshareofpopulationgrowthintheCityoverthestudyperiod.
Therefore,itisouropinionthatthisincreaseinpopulationinthePrimaryandSecondaryTradeAreaswillsubstantiallyincreasetheavailablemarketsupportavailabletoretailersatthe

ResidualRetailMarketDemandAnalysis–420BathurstStreet
7
subjectsiteaswellasfortheexistinglocallyorientedretailersintheKensingtonMarketBIA,theChinatownBIA,theLittleItalyBIAandtheTrinity‐BellwoodsBIA.ItshouldalsobenotedthattheincreaseinmarketsupportavailablefortheTradeAreaswillonlyrepresentpartoftheoverallsourceofsalessupportfortheseuniqueretailareasthatcontinuetodrawfromthelargerGreaterTorontoArea.
3.2 PERCAPITAINCOME
PercapitaincomelevelsprovideareasonableguideorbasisfordeterminingtheexpenditurehabitsofthelocalpopulationlivingwithinadefinedTradeArea.Althoughcertaininterveningvariables,includingageandgeographiclocation,caninfluenceconsumerexpenditurehabitsandshoppingpreferences,populationgroupingswithsimilarincomecharacteristicstendtoexhibitsimilarexpenditurehabitsforbroadmerchandisegroupings.
FIGURE3‐2:PERCAPITAINCOME(2005),CENSUS2006
AreaPer Capita
IncomeIndex to Province
Ontario 30,723 100.0 City of Toronto 33,311 108.4
TRADE AREAPrimary Trade Area 27,035 88.0 Secondary Trade Area 50,837 165.5 Trade Area (Combined) 32,545 105.9
Source: urbanMetrics inc. based on the 2006 Census of Canada and Pcensus
Basedonthe2006Census(themostrecentdataavailable),theaverage2005percapitaincomesforthePrimaryandSecondaryTradeAreashavebeencalculated(Figure3‐2).TheaveragepercapitaincomeintheSecondaryTradeAreais65.5%abovetheprovincialaverage,whiletheaveragepercapitaincomeinthePrimaryTradeAreaisabout12%belowtheprovincialaverage.Overall,forthecombinedTradeArea,theaveragepercapitaincomewasabout6%higherthantheprovincialaverageandsimilartotheoverallCityofTorontoaverage.

ResidualRetailMarketDemandAnalysis–420BathurstStreet
8
4 RESIDUALMARKETANALYSIS
Forthepurposesofouranalysis,wehaveestimatedtheretailsalespotentialavailableinthevariousportionsoftheTradeAreaforthefollowingstoretypes:
Supermarkets; Otherfoodstores(includinggrocery,convenienceandspecialtyfoodstores); Departmentstores;and AllNFSR,excludingdepartmentstoresandautomotive.
Thesestoretypeshavebeenanalyzed,astheyarethelikelytenant(s)ofthesecondandthirdfloorsoftheproposeddevelopment.Thesmallerretail/serviceusesthatwilloccupythegroundfloorarenotthefocusofthisanalysis,astheydonotrepresenttheintroductionoflargerscaleretailusesthatarethefocusofthepolicyconsiderationssetforthinOfficialPlanpolicy4.5.3(b).
4.1 RESIDUALFOODSTOREANALYSIS
4.1.1 FSREXPENDITUREPOTENTIAL
ThefollowingsectionincludesananalysisofthepercapitaFSRexpenditures,thedistributionofthoseexpenditures,andthetotalexpenditurepotentialavailablefromPrimaryTradeArearesidents.
4.1.1.1 PERCAPITAFSREXPENDITURES
BasedonStatisticsCanadaRetailTradedata,the2012averagepercapitafoodstoreexpenditureinOntarioisestimatedat$2,230.Foodstoreexpendituresincludethosemadeinsupermarkets,grocerystores,conveniencestoresandspecialtyfoodstores.
AsindicatedinFigure4‐1,the2012averagepercapitafoodstoreexpenditureinthePrimaryTradeAreahasbeenestimatedbasedontheincomerelationshipbetweentheProvinceandthePrimaryTradeAreaandanexpenditurebasedregressionequation,whichcalculatesanexpenditureindexbasedonincomelevels.
ForPrimaryTradeArearesidents,the2012averagepercapitaFSRexpenditurepotentialhasbeenincreasedatarateof0.25%peryear(realgrowth)overthestudyperiod.Itshouldbenotedthatfuturechangesinexpenditurepatternssolelyduetoinflationhavenotbeenrecognized.Therefore,futureexpenditurelevelsreflectthe2012valueoftheCanadiandollar.
4.1.1.2 FSREXPENDITUREPOTENTIALFROMPRIMARYTRADEAREARESIDENTS
BymultiplyingtheaveragepercapitafoodstoreexpenditurebythecurrentandprojectedpopulationresidinginthePrimaryTradeArea,thetotalfoodstorepotentialhasbeencalculated

ResidualRetailMarketDemandAnalysis–420BathurstStreet
9
overthestudyperiod.Intotal,thefoodstorepotentialhasbeenestimatedat$118.1millionin2012,increasingto$128.6millionby2021,agrowthof$10.5millionovertheperiod(expressedin2012dollars).
4.1.1.3 DISTRIBUTIONOFFSREXPENDITURES
Thetotalfoodstoreexpenditurepotentialhasbeendividedbetweensupermarketandotherfoodstores(i.e.grocery,convenienceandspecialtyfoodstores).BasedonourreviewoffoodstoresinthePrimaryTradeArea,whichincludesavarietyofindependentgrocerystoresandspecialtyfoodstores,andStatisticsCanadaRetailTradeData,wehaveestimatedthesupermarketshareofFSRexpendituresat70%,withgrocery/otherfoodstoresat30%.Thisishigherthantheprovincialaverage,wheresupermarketexpendituresrepresentapproximately85.0%ofFSRandotherspecialtystores15.0%.ThehigherspecialtyfoodstoreshareinthemarketreflectsthelargenumberofsmallergroceryandotherfoodsstoresthroughouttheTradeAreaandspecificallyKensingtonMarketandChinatown.Infutureyears,wehaveassumedthatthesupermarketsharewillremainconstantasbothnewsupermarketsandspecialtyfoodstoresenterthemarket.
AsindicatedinFigure4‐1,thesupermarketpotentialavailablefromthePrimaryTradeAreahasbeencalculatedat$82.7millionin2012,increasingto$90.0millionby2021.ItshouldalsobestatedthatFigure4‐1excludesexpendituresofpersonswhoresideoutsidethePrimaryTradeArea(i.e.inflow).Thesepersonscouldincludevisitors,thetravellingpublic,andindividualswhoseworkplaceiswithinthePrimaryTradeAreabutresideoutside.Thisinflowofretailsalesisconsideredinourmarketanalysis.TheinflowinthePrimaryTradeAreaislikelysignificant,particularlyforsupermarkets,astheexistingsupermarketsinthePrimaryTradeAreaareonthePrimaryTradeAreaborder.Inaddition,manyofthespecialtyfoodstoreslocatedinKensington,LittleItalyandChinatown,willattractsignificantinflowsalesfromoutsidetheTradeAreaduetotheuniquedrawingpowerofthesecommercialareas.
ResidualRetailMarketDemandAnalysis–420BathurstStreet
10
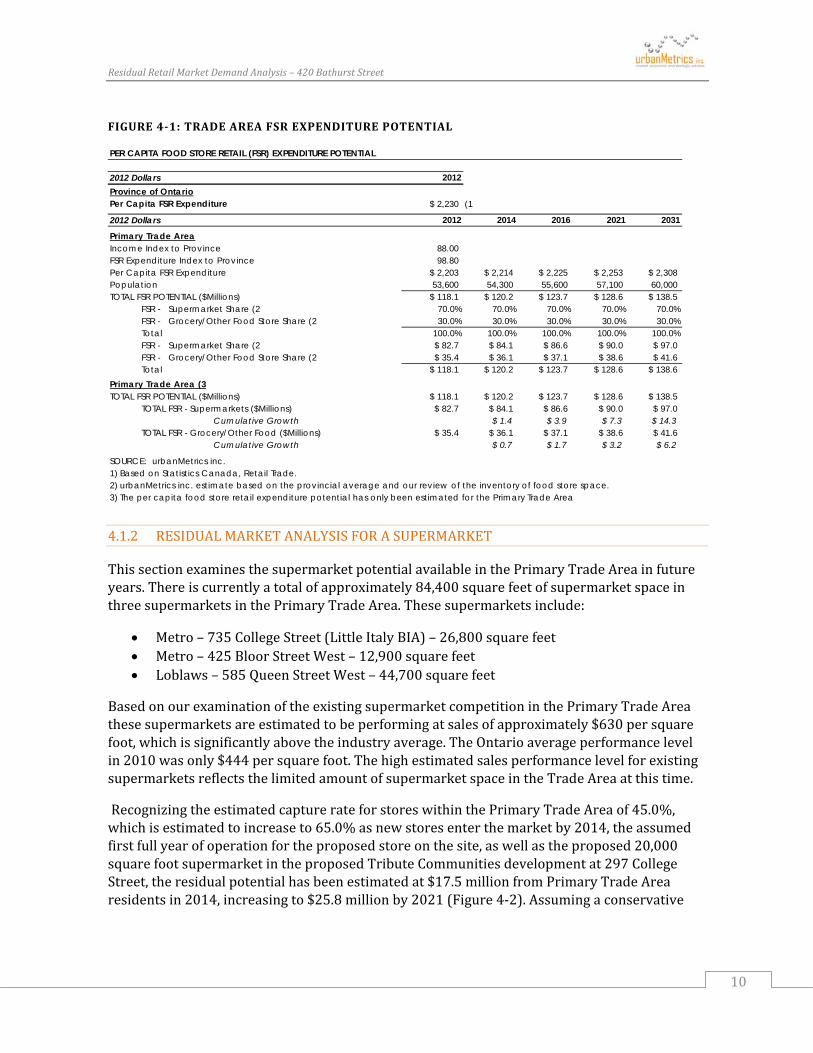
FIGURE4‐1:TRADEAREAFSREXPENDITUREPOTENTIAL
PER CAPITA FOOD STORE RETAIL (FSR) EXPENDITURE POTENTIAL
2012 Dollars 2012Province of OntarioPer Capita FSR Expenditure $ 2,230 (1
2012 Dollars 2012 2014 2016 2021 2031
Primary Trade AreaIncome Index to Province 88.00 FSR Expenditure Index to Province 98.80 Per Capita FSR Expenditure $ 2,203 $ 2,214 $ 2,225 $ 2,253 $ 2,308Population 53,600 54,300 55,600 57,100 60,000 TOTAL FSR POTENTIAL ($Millions) $ 118.1 $ 120.2 $ 123.7 $ 128.6 $ 138.5
FSR - Supermarket Share (2 70.0% 70.0% 70.0% 70.0% 70.0%FSR - Grocery/Other Food Store Share (2 30.0% 30.0% 30.0% 30.0% 30.0%
Total 100.0% 100.0% 100.0% 100.0% 100.0%FSR - Supermarket Share (2 $ 82.7 $ 84.1 $ 86.6 $ 90.0 $ 97.0FSR - Grocery/Other Food Store Share (2 $ 35.4 $ 36.1 $ 37.1 $ 38.6 $ 41.6Total $ 118.1 $ 120.2 $ 123.7 $ 128.6 $ 138.6
Primary Trade Area (3TOTAL FSR POTENTIAL ($Millions) $ 118.1 $ 120.2 $ 123.7 $ 128.6 $ 138.5
TOTAL FSR - Supermarkets ($Millions) $ 82.7 $ 84.1 $ 86.6 $ 90.0 $ 97.0Cumulative Growth $ 1.4 $ 3.9 $ 7.3 $ 14.3
TOTAL FSR - Grocery/Other Food ($Millions) $ 35.4 $ 36.1 $ 37.1 $ 38.6 $ 41.6Cumulative Growth $ 0.7 $ 1.7 $ 3.2 $ 6.2
SOURCE: urbanMetrics inc.1) Based on Statistics Canada, Retail Trade. 2) urbanMetrics inc. estimate based on the provincial average and our review of the inventory of food store space.3) The per capita food store retail expenditure potential has only been estimated for the Primary Trade Area
4.1.2 RESIDUALMARKETANALYSISFORASUPERMARKET
ThissectionexaminesthesupermarketpotentialavailableinthePrimaryTradeAreainfutureyears.Thereiscurrentlyatotalofapproximately84,400squarefeetofsupermarketspaceinthreesupermarketsinthePrimaryTradeArea.Thesesupermarketsinclude:
Metro–735CollegeStreet(LittleItalyBIA)–26,800squarefeet Metro–425BloorStreetWest–12,900squarefeet Loblaws–585QueenStreetWest–44,700squarefeet
BasedonourexaminationoftheexistingsupermarketcompetitioninthePrimaryTradeAreathesesupermarketsareestimatedtobeperformingatsalesofapproximately$630persquarefoot,whichissignificantlyabovetheindustryaverage.TheOntarioaverageperformancelevelin2010wasonly$444persquarefoot.ThehighestimatedsalesperformancelevelforexistingsupermarketsreflectsthelimitedamountofsupermarketspaceintheTradeAreaatthistime.
RecognizingtheestimatedcapturerateforstoreswithinthePrimaryTradeAreaof45.0%,whichisestimatedtoincreaseto65.0%asnewstoresenterthemarketby2014,theassumedfirstfullyearofoperationfortheproposedstoreonthesite,aswellastheproposed20,000squarefootsupermarketintheproposedTributeCommunitiesdevelopmentat297CollegeStreet,theresidualpotentialhasbeenestimatedat$17.5millionfromPrimaryTradeArearesidentsin2014,increasingto$25.8millionby2021(Figure4‐2).Assumingaconservative

ResidualRetailMarketDemandAnalysis–420BathurstStreet
11
30%inflow,at$500persquarefoot,some50,000squarefeetofadditionalsupermarketspacewouldbewarrantedinthePrimaryTradeAreaby2014,increasingto73,700squarefeetby2021.Therefore,by2016therewillbeadequatemarketsupportavailabletoaccommodatebotha45,000squarefootsupermarketonthesubjectsiteandtheproposalbyTributeCommunitiesfora20,000squarefootsupermarketinthemixed‐usedevelopmentat297CollegeStreet.Notransferofsalesfromexistingsupermarketsorfoodstoresisrequiredtosupportthisnewspace.
FIGURE4‐2:SUPERMARKETRESIDUALANALYSIS
SUPERMARKET ANALYSIS
2012 Dollars 2012 2014 2016 2021 2031
Primary Trade AreaSupermarket Expenditures ($Millions) $ 82.7 $ 84.1 $ 86.6 $ 90.0 $ 97.0
Estimated Trade Area Share %(1 45.0% 65.0% 70.0% 70.0% 70.0%Estimated Trade Area Share ($ Millions) $ 37.2 $ 54.7 $ 60.6 $ 63.0 $ 67.9Residual Potential $ 17.5 $ 23.4 $ 25.8 $ 30.7
Primary Trade AreaTotal Supermarket Expenditures ($Millions) $ 82.7 $ 84.1 $ 86.6 $ 90.0 $ 97.0Total Estimated Trade Area Share ($Millions) $ 37.2 $ 54.7 $ 60.6 $ 63.0 $ 67.9Estimated Trade Area Share % 45.0% 65.0% 70.0% 70.0% 70.0%
Existing Sales from Trade Area Residents ($Millions) $ 37.2 $ 37.2 $ 37.2 $ 37.2 $ 37.2Residual Potential ($Millions) $ 17.5 $ 23.4 $ 25.8 $ 30.7
TOTAL RESIDUAL POTENTIAL (including inflow)Additional Residual Potential Available $ 17.5 $ 23.4 $ 25.8 $ 30.7Plus Inflow Sales @ 30.0% (1 $ 7.5 $ 10.0 $ 11.1 $ 13.2TOTAL ADDITIONAL SALES POTENTIAL AVAILABLE $ 25.0 $ 33.4 $ 36.9 $ 43.9
WARRANTED ADDITIONAL SQUARE FEET (2
@ $475 per sq. ft. 52,600 70,400 77,600 92,300 @ $500 per sq. ft. 50,000 66,900 73,700 87,700 @ $525 per sq. ft. 47,600 63,700 70,200 83,500
SOURCE: urbanMetrics inc.
1) urbanMetrics estimate reflecting the assumption that new supermarkets will locate in the Trade Area in future years including a store at the subject site.
2) Rounded to the nearest 100 square feet.
4.1.3 RESIDUALMARKETANALYSISFOROTHERFOODSTORESPACE
Thissectionanalysestheexpenditurepotentialavailabletootherfoodstores(includinggrocerystores,conveniencestoresandspecialtyfoodstores)inthePrimaryTradeArea.Figure4‐3detailsthepotentialmarketopportunityavailabletoexistingandadditionalotherfoodstorespaceinthePrimaryTradeArea.ThePrimaryTradeAreacapturerateintheotherfoodstorecategoryishigherthanutilizedinthesupermarketanalysis,recognizingthatconvenienceandspecialtyfoodstorespacetypicallyislocalserving.TheestimatedinflowintheotherfoodstoreanalysisislowerthaninthesupermarketanalysisasitacknowledgesthatmanyoftheotherspecialtyfoodstoresaredistributedthroughoutthePrimaryTradeAreaandarealsolocalserving.Basedonthisanalysis,thereisresidualpotentialof$4.1millioninotherfoodstoreexpendituresavailablefromPrimaryTradeArearesidentsin2014,increasingto$6.1millionin

ResidualRetailMarketDemandAnalysis–420BathurstStreet
12
2021.WenotehoweverthattheresidualpotentialisanextremelyconservativeestimateasitfailstorecognizethesignificantdrawingpowerofthespecialtyfoodstoreslocatedinKensingtonMarket,ChinatownandtosomedegreeLittleItaly.ThesestoreslikelyachievesubstantiallyhigherlevelsofinflowthanothermorelocallyservingstoresthatarescatteredthroughouttheTradeArea.
Weshouldalsonotethatsincelimitedifanyspecialtyfoodstorespaceisbeingproposedinthe420BathurstStreetproject,theavailableresidualprovidesadditionalopportunityforincreasedsalesforexistingspecialtyfoodstoresinthenearbyshoppingdistricts,orforthedevelopmentofnewstoresintheseareas.AsshowninFigure4‐3,at$325persquarefoot,whichisconsideredareasonablesalesperformancelevelforstoresofthistypeinanurbanmarket,some15,800squarefeetofspecialtyfoodstorespacewouldbewarrantedby2014,increasingto23,500squarefeetby2021.
FIGURE4‐3:OTHERFOODSTORERESIDUALANALYSIS
OTHER FOOD STORE ANALYSIS
2012 Dollars 2012 2014 2016 2021 2031
Primary Trade AreaOther Food Store Expenditures ($Millions) $ 35.4 $ 36.1 $ 37.1 $ 38.6 $ 41.6
Estimated Trade Area Share %(1 70.0% 80.0% 80.0% 80.0% 80.0%Estimated Trade Area Share ($ Millions) $ 24.8 $ 28.9 $ 29.7 $ 30.9 $ 33.3Residual Potential $ 4.1 $ 4.9 $ 6.1 $ 8.5
Primary Trade AreaTotal Other Food Store Expenditures ($Millions) $ 35.4 $ 36.1 $ 37.1 $ 38.6 $ 41.6Total Estimated Trade Area Share ($Millions) $ 24.8 $ 28.9 $ 29.7 $ 30.9 $ 33.3Estimated Trade Area Share % 70.0% 80.0% 80.0% 80.0% 80.0%
Existing Sales from Trade Area Residents ($Millions) $ 24.8 $ 24.8 $ 24.8 $ 24.8 $ 24.8Residual Potential ($Millions) $ 4.1 $ 4.9 $ 6.1 $ 8.5
TOTAL RESIDUAL POTENTIAL (including inflow)Additional Residual Potential Available $ 4.1 $ 4.9 $ 6.1 $ 8.5Plus Inflow Sales @ 20.0% (1 $ 1.0 $ 1.2 $ 1.5 $ 2.1TOTAL ADDITIONAL SALES POTENTIAL AVAILABLE $ 5.1 $ 6.1 $ 7.6 $ 10.6
WARRANTED ADDITIONAL SQUARE FEET (2
@ $300 per sq. ft. 17,100 20,400 25,400 35,400 @ $325 per sq. ft. 15,800 18,800 23,500 32,700 @ $350 per sq. ft. 14,600 17,500 21,800 30,400
SOURCE: urbanMetrics inc.1) urbanMetrics estimate.
2) Rounded to the nearest 100 square feet.

ResidualRetailMarketDemandAnalysis–420BathurstStreet
13
4.2 RESIDUALNON‐FOODRETAILSTOREANALYSIS
4.2.1 NFSREXPENDITUREPOTENTIAL
ThefollowingsectionexaminesthepercapitaexpenditureandtotalNFSRexpenditurepotentialavailablefromPrimaryandSecondaryTradeArearesidents.
4.2.1.1 PERCAPITANFSREXPENDITURES
BasedonStatisticsCanadaRetailTradedata,the2012averagepercapitaNFSRexpenditureinOntarioisestimatedat$5,471.AsindicatedinFigure4‐4,forTradeArearesidents,the2012averagepercapitanon‐foodstoreretailexpenditurehasbeenestimatedbasedontheincomerelationshipbetweentheProvinceandeachTradeAreazone,andanexpenditurerelatedregressionequation,whichcalculatesanexpenditureindexbasedonincomelevels.ForTradeArearesidents,the2012averagepercapitaNFSRexpenditureisexpectedtoincreaseatarateof1.5%peryearonanun‐inflatedbasisoverthestudyperiod.Thisratereflectslongtermaveragegrowthrates.Futurechangesinexpenditurepatternssolelyduetoinflationhavenotbeenrecognizedinthisanalysis.
4.2.1.2 NFSREXPENDITUREPOTENTIALFROMTRADEAREARESIDENTS
ThetotalNFSRpotentialfromTradeArearesidentsoverthestudyperiodhasbeencalculatedbymultiplyingtheaveragepercapitaNFSRexpenditureineachTradeAreazonebythecurrentandfuturepopulation.
Intotal,thecurrentNFSRexpenditurepotentialavailablefromTradeArearesidentshasbeenestimatedat$440.0millionin2012,increasingto$592.8millionby2021,agrowthof$152.8million(expressedin2012dollars).ItshouldberecognizedthattheexpenditurepotentialindicatedinFigure4‐4isthatwhichisavailablefromTradeArearesidentsonly,andrepresentstheexpenditurepotentialavailabletostoreslocatedbothwithintheTradeAreaandelsewhere.ItdoesnotincludeexpenditurepotentialfromresidentsoutsidetheTradeArea(e.g.thosewholiveoutside,butworkinside,theTradeArea)
4.2.1.3 DISTRIBUTIONOFNFSREXPENDITURES
WehavedividedthetotalNFSRexpenditurepotential,ascalculatedinFigure4‐4,intotwomajorcategories:departmentstoreandnon‐departmentstoreNFSR,whichincludesallNFSRstorecategories,excludingdepartmentstores.ThepercentagedistributionbystoretypeintheTradeAreahasbeenbasedonourreviewoftheProvincialretailsalesdistribution.Fortheforecastperiod,thisdistributionhasbeenheldconstant.Departmentstorepotentialhasbeenestimatedseparatelyasthisisapotentialtenantthatcouldoccupybothlevelstwoandthreeofthesubjectdevelopment.
AsshowninFigure4‐4,TradeArearesidents’departmentstoreexpenditureshavebeenestimatedat$65.6millionin2012,increasingto$88.3millionin2021,agrowthof$22.7million.Non‐departmentstoreNFSRexpendituresareexpectedtoincreasefrom$374.4million

ResidualRetailMarketDemandAnalysis–420BathurstStreet
14
in2012,to$504.5millionby2021,agrowthof$130.1millionovertheperiod.Storetypesinthiscategorythatcouldlocateinthesubjectdevelopmentcouldincludeawiderangeoflargerformatstoresinthegeneralmerchandise,apparelandelectronics,etc.categories.
FIGURE4‐4:TRADEAREANFSREXPENDITUREPOTENTIAL
PER CAPITA NFSR EXPENDITURE POTENTIAL
2012 Dollars 2012
Province of OntarioPer Capita NFSR Expenditure $ 5,471 (1
2012 Dollars 2012 2014 2016 2021 2031
Primary Trade AreaIncome Index to Province 88.00 NFSR Expenditure Index to Province 95.20 Per Capita NFSR Expenditure $ 5,208 $ 5,234 $ 5,260 $ 5,325 $ 5,455Population 53,600 54,300 55,600 57,100 60,000 TOTAL NFSR POTENTIAL ($Millions) $ 279.1 $ 284.2 $ 292.5 $ 304.1 $ 327.3
Department Store (2 14.9% 14.9% 14.9% 14.9% 14.9%Non-Department Store NFSR (2 85.1% 85.1% 85.1% 85.1% 85.1%
100.0% 100.0% 100.0% 100.0% 100.0%
Department Store (2 $ 41.6 $ 42.4 $ 43.6 $ 45.3 $ 48.8Non-Department Store NFSR (2 $ 237.5 $ 241.8 $ 248.9 $ 258.8 $ 278.5Total $ 279.1 $ 284.2 $ 292.5 $ 304.1 $ 327.3
Secondary Trade AreaIncome Index to Province 165.50 NFSR Expenditure Index to Province 126.20 Per Capita NFSR Expenditure $ 6,904 $ 6,939 $ 6,973 $ 7,059 $ 7,232Population 23,300 29,600 35,200 40,900 52,400 TOTAL NFSR POTENTIAL ($Millions) $ 160.9 $ 205.4 $ 245.4 $ 288.7 $ 379.0
Department Store (2 14.9% 14.9% 14.9% 14.9% 14.9%Non-Department Store NFSR (2 85.1% 85.1% 85.1% 85.1% 85.1%
100.0% 100.0% 100.0% 100.0% 100.0%Department Store (2 $ 24.0 $ 30.6 $ 36.6 $ 43.0 $ 56.5Non-Department Store NFSR (2 $ 136.9 $ 174.8 $ 208.8 $ 245.7 $ 322.5
Total $ 160.9 $ 205.4 $ 245.4 $ 288.7 $ 379.0
TOTAL TRADE AREATOTAL NFSR POTENTIAL ($Millions) $ 440.0 $ 489.6 $ 537.9 $ 592.8 $ 706.3
Cumulative Growth $ 49.6 $ 97.9 $ 152.8 $ 266.3Department Store ($Millions) $ 65.6 $ 73.0 $ 80.2 $ 88.3 $ 105.3
Cumulative Growth $ 7.4 $ 14.6 $ 22.7 $ 39.7Non-Department Store NFSR ($Millions) $ 374.4 $ 416.6 $ 457.7 $ 504.5 $ 601.0
Cumulative Growth $ 42.2 $ 83.3 $ 130.1 $ 226.6
SOURCE: urbanMetrics inc.1) Based on Statistics Canada, Retail Trade. 2) urbanMetrics inc. estimate based on the provincial average.

ResidualRetailMarketDemandAnalysis–420BathurstStreet
15
4.2.2 RESIDUALDEPARTMENTSTOREANALYSIS
ThissectionexaminesthepotentialdepartmentstorepotentialavailableintheTradeArea(Figure4‐5).TherearenodepartmentstoresineitherthePrimaryorSecondaryTradeAreas.TheclosestdepartmentstorestothesubjectsitearetheWalmartintheDufferinMall,locatedapproximately2kilometerswestofthesite,andSearsandtheBayintheTorontoEatonCentre,whichareapproximately2kilometerstotheeast.
OurestimateofdepartmentstoreexpenditurepotentialintheTradeAreareflectsthefollowingassumptions:
Recapture:ItisassumedthatadepartmentstoreonthesubjectsitewillrecaptureexpendituresthatTradeArearesidentscurrentlymakeoutsidetheTradeArea.In2012theTradeAreashareinbothzonesis0%astherearenodepartmentstoresintheTradeAreaandlocalresidentsmustgoelsewheretomakedepartmentstorepurchases.TheTradeAreasharehasbeenincreasedto50%inthePrimaryTradeAreaand30%intheSecondaryTradeAreain2014toreflecttheentryofanewdepartmentstoresuchasaWalmartorTargetatthesubjectsite.
Inflow:Inflowsaleshavebeenassumedat20%forthenewdepartmentstore,whichinourviewisaveryconservativelevelinanurbanmarket.
SalesLevels:Theaveragesalesperformanceutilizedinouranalysisfornewdepartmentstorespacehasbeentestedat$450to$500persquarefoot,whichisconsideredatypical,ifnothigh,performancelevelfordepartmentstoressuchasWal‐MartorTarget.
Basedonouranalysis,itisestimatedthattheresidualsalespotentialintheTradeAreawillbe$30.4millionin2014,increasingto$35.6millionin2021.Assumingaconservative20%inflow,at$475persquarefoot,some80,000squarefeetofadditionaldepartmentstorespacewouldbewarrantedintheTradeAreaby2014,increasingto93,700squarefeetby2021atthesamesalesperformancelevel.

ResidualRetailMarketDemandAnalysis–420BathurstStreet
16
FIGURE4‐5:DEPARTMENTSTORERESIDUALANALYSIS
DEPARTMENT STORE ANALYSIS
2012 Dollars 2012 2014 2016 2021 2031
Primary Trade AreaDepartment Store ($Millions) $ 41.6 $ 42.4 $ 43.6 $ 45.3 $ 48.8
Estimated Trade Area Share %(1 0.0% 50.0% 50.0% 50.0% 50.0%Estimated Trade Area Share ($ Millions) $ - $ 21.2 $ 21.8 $ 22.7 $ 24.4Residual Potential $ 21.2 $ 21.8 $ 22.7 $ 24.4
Secondary Trade AreaDepartment Store ($Millions) $ 24.0 $ 30.6 $ 36.6 $ 43.0 $ 56.5
Estimated Trade Area Share %(1 0.0% 30.0% 30.0% 30.0% 30.0%Estimated Trade Area Share ($ Millions) $ - $ 9.2 $ 11.0 $ 12.9 $ 17.0Residual $ 9.2 $ 11.0 $ 12.9 $ 17.0
TOTAL TRADE AREATotal Department Store Expenditures ($Millions) $ 65.6 $ 73.0 $ 80.2 $ 88.3 $ 105.3Total Estimated Trade Area Share ($Millions) $ - $ 30.4 $ 32.8 $ 35.6 $ 41.4Estimated Trade Area Share % 0.0% 41.6% 40.9% 40.3% 39.3%
Existing Sales from Trade Area Residents ($Millions) $ - $ - $ - $ - $ -Residual Potential ($Millions) $ 30.4 $ 32.8 $ 35.6 $ 41.4
TOTAL DEPARTMENT STORE RESIDUAL POTENTIAL (including inflow)Additional Residual Potential Available $ 30.4 $ 32.8 $ 35.6 $ 41.4Plus Inflow Sales @ 20.0% (2 $ 7.6 $ 8.2 $ 8.9 $ 10.4TOTAL ADDITIONAL SALES POTENTIAL AVAILABLE $ 38.0 $ 41.0 $ 44.5 $ 51.8
WARRANTED ADDITIONAL SQUARE FEET (3
@ $450 per sq. ft. 84,400 91,100 98,900 115,000 @ $475 per sq. ft. 80,000 86,300 93,700 108,900 @ $500 per sq. ft. 76,000 82,000 89,000 103,500
SOURCE: urbanMetrics inc. NOTE: 1) urbanMetrics estimate. There are currently no department stores in the Primary or Secondary Trade Areas.
2) urbanMetrics estimate.
3) Rounded to the nearest 100 square feet.
4.2.3 RESIDUALNON‐DEPARTMENTSTORENFSRANALYSIS
Inthissectionwehaveexaminedthepotentialnon‐departmentstoreNFSRexpenditurepotentialavailableintheTradeArea(Figure4‐6).Aspartofthisanalysis,wehavepreparedadetailedinventoryoftheKensingtonMarketBIA,theChinatownBIA,theLittleItalyBIAandtheTrinity‐BellwoodsBIA.WhilethesefourBIA’sdonotrepresentallofthenon‐departmentstoreNFSRspaceintheTradeArea,theyrepresentasizableportion.Basedonthisanalysis,whichhasbeencarriedoutusingasimilarmethodologytothedepartmentstoreanalysis,thereisresidualpotentialof$40.2millioninthenon‐departmentstoreNFSRcategoryavailablefromTradeArearesidentsin2014,increasingto$62.0millionin2021.ThisgrowthinresidualpotentialwouldsupportasignificantamountofnewNFSRspaceintheTradeAreainfutureyears.Atasalesperformancelevelof$400persquarefoot,125,600squarefeetofnewnon‐departmentstoreNFSRspacewouldbewarrantedby2014,andthisincreasesto193,800

ResidualRetailMarketDemandAnalysis–420BathurstStreet
17
squarefeetby2021.Thisiswellinexcessoftheamountofnon‐departmentstoreNFSRspacethatisproposedatthe420BathurstStreetdevelopment.
FIGURE4‐6:NON‐DEPARTMENTSTORENFSRRESIDUALANALYSIS
NON-DEPARTMENT STORE NFSR ANALYSIS
2012 Dollars 2012 2014 2016 2021 2031
Primary Trade AreaNon-Department Store NFSR ($Millions) $ 237.5 $ 241.8 $ 248.9 $ 258.8 $ 278.5
Estimated Trade Area Share %(1 35.0% 45.0% 45.0% 45.0% 45.0%Estimated Trade Area Share ($ Millions) $ 83.1 $ 108.8 $ 112.0 $ 116.5 $ 125.3Residual Potential $ 25.7 $ 28.9 $ 33.4 $ 42.2
Secondary Trade AreaNon-Department Store NFSR ($Millions) $ 136.9 $ 174.8 $ 208.8 $ 245.7 $ 322.5
Estimated Trade Area Share %(1 15.0% 20.0% 20.0% 20.0% 20.0%Estimated Trade Area Share ($ Millions) $ 20.5 $ 35.0 $ 41.8 $ 49.1 $ 64.5Residual $ 14.5 $ 21.3 $ 28.6 $ 44.0
TOTAL TRADE AREATotal Non-Department Store NFSR ($Millions) $ 374.4 $ 416.6 $ 457.7 $ 504.5 $ 601.0Total Estimated Trade Area Share ($Millions) $ 103.6 $ 143.8 $ 153.8 $ 165.6 $ 189.8Estimated Trade Area Share % 27.7% 34.5% 33.6% 32.8% 31.6%
Existing Sales from Trade Area Residents ($Millions) $ 103.6 $ 103.6 $ 103.6 $ 103.6 $ 103.6Residual Potential ($Millions) $ 40.2 $ 50.2 $ 62.0 $ 86.2
TOTAL NON-DEPARTMENT STORE RESIDUAL POTENTIAL (including inflow)Additional Residual Potential Available $ 40.2 $ 50.2 $ 62.0 $ 86.2Plus Inflow Sales @ 20.0% (1 $ 10.1 $ 12.6 $ 15.5 $ 21.6TOTAL ADDITIONAL SALES POTENTIAL AVAILABLE $ 50.3 $ 62.8 $ 77.5 $ 107.8
WARRANTED ADDITIONAL SQUARE FEET (2
@ $375 per sq. ft. 134,000 167,300 206,700 287,300 @ $400 per sq. ft. 125,600 156,900 193,800 269,400 @ $425 per sq. ft. 118,200 147,600 182,400 253,500
SOURCE: urbanMetrics inc. NOTE: 1) urbanMetrics estimate.
2) Rounded to the nearest 100 square feet.
Basedonthisresidualanalysis,itisourprofessionalopinionthatanyofthepotentialnon‐departmentstoreNFSRtenantsthatcouldpossiblylocateintheproposeddevelopmentcanbeeasilyaccommodatedinthemarketbasedonfuturemarketgrowthalonewithlimited,ifany,impactonexistingnearbyshoppingdistrictsintheTradeArea.Infact,thesignificantgrowthexpectedwouldalsosupportadditionalretailspaceintheseareas,aswellasprovidetheopportunityforexistingstorestoincreasetheircurrentsalesperformance.

ResidualRetailMarketDemandAnalysis–420BathurstStreet
18
5 NEARBYSHOPPINGDISTRICTS
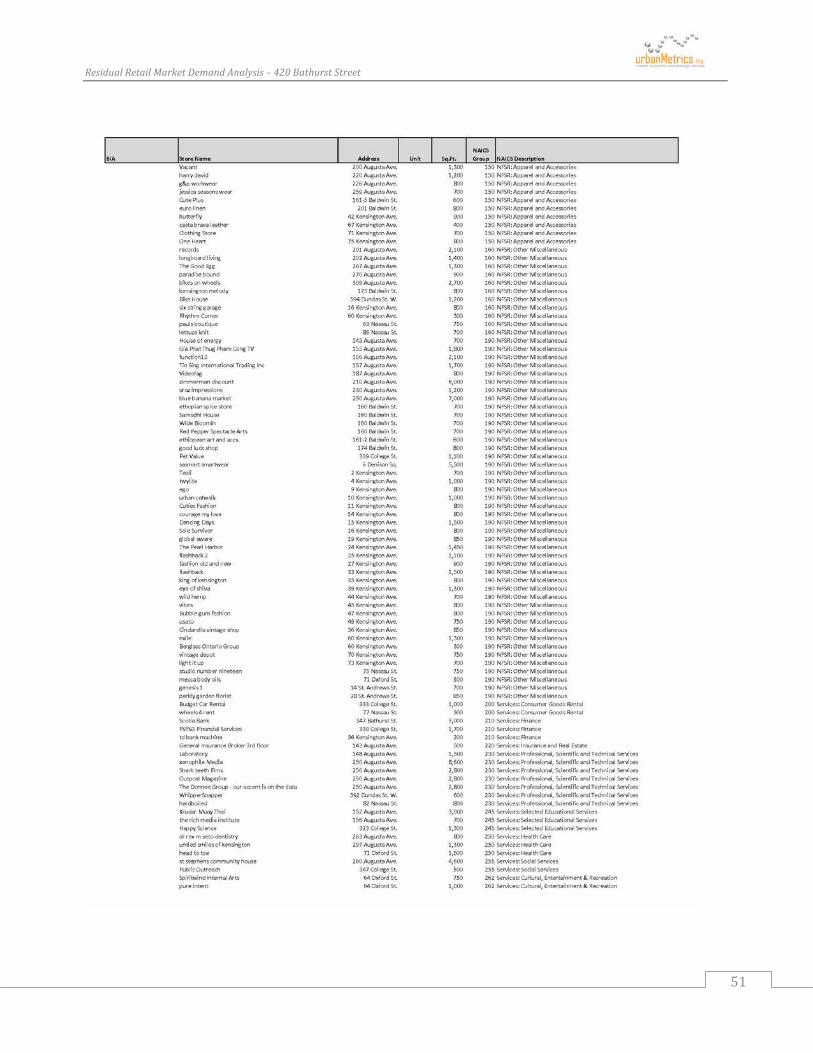
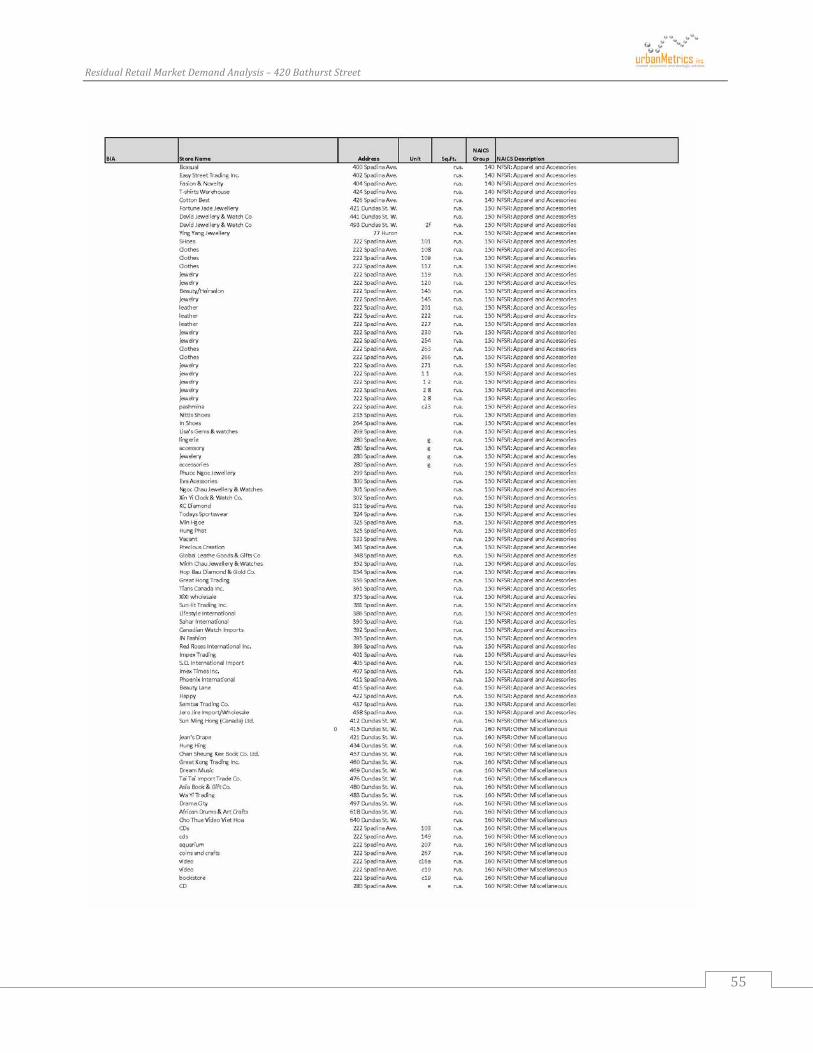
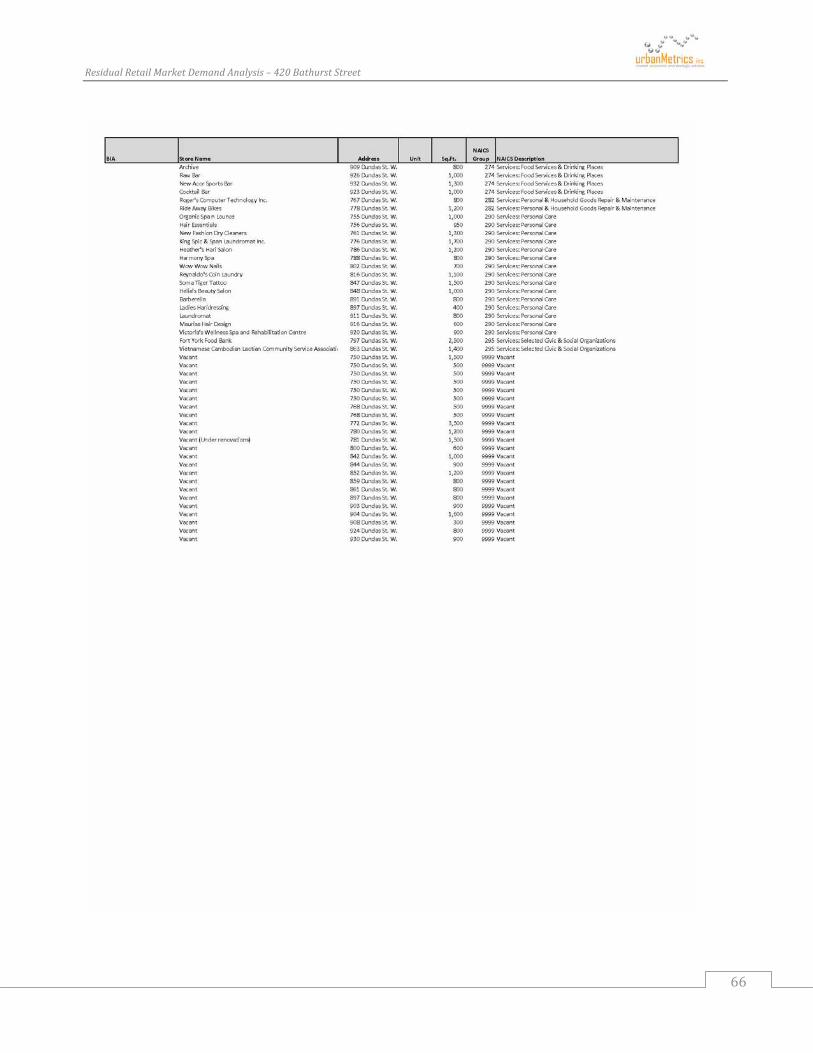
Thissectionofthereportexaminesthefournearbyshoppingdistrictsinthevicinityoftheproposeddevelopmentintermsoftheirretail/servicetenantmix,scaleandsizeofstores,existingfunctionandmarketsegmentsserved.TheshoppingdistrictsexaminedaretheKensingtonMarketBIA,theChinatownBIA,theLittleItalyBIA,andtheTrinityBellwoodsBIA.Eachoftheseareasisdescribedbelow.AcompleteretailandservicespaceinventoryhasbeenconductedbyurbanMetricsinc.oftheKensingtonMarketBIA,theLittleItalyBIAandtheTrinityBellwoodsBIAduringJanuary2013.IntheChinatownBIA,theinventoryincludedtheretailandserviceestablishments,asmeasuringtheactualspacebyspecificcategorywouldhavebeenimpossibleinthisarea.ThedetailedlistingofallstoresandservicesinthefourlocalshoppingdistrictsisattachedinAppendixC.
5.1 KENSINGTONMARKETBUSINESSIMPROVEMENTAREA
Figure5‐1illustratestheextentoftheKensingtonMarketBIA.AlthoughtheBIAboundaryextendsfromBathurstStreetinthewest,totheChinatownBIAintheeast,themajorityofretail/servicespaceislocatedsomedistancetotheeastoftheproposed420BathurstStreetdevelopment,alongAugustaAvenueandfurthereastalongKensingtonAvenueandBaldwinStreet.Nearlyalloftheretailersandservicesinthisareaareoneofakindandunique;infact,theBIAdiscourageschainstoresfromlocatingintheMarkettoretainitsuniquecharacter.Inadditiontotheretail/serviceoutletsalongAugustaAvenueandtotheeast,theBIAboundaryalsoincludesTorontoWesternHospital,whichhasasmallnumberofretail/serviceoutletsinthefoodcourtandinthevicinityofthebuilding.TorontoWesternHospitalalsoincludesmedicaloffices,butthesehavebeenexcludedfromtheanalysis.

ResidualRetailMarketDemandAnalysis–420BathurstStreet
19
FIGURE5‐1:KENSINGTONMARKETBIA
SOURCE:urbanMetricsinc.basedonCityofTorontoBIAmapsBasedonourinventory,therearealmost280retail/serviceoutletsintheBIA,accountingforover330,000squarefeetofspace(Figure5‐2).TheKensingtonMarketBIAisalsocharacterizedbyalowvacancyrateofunder4.0%.Atypicalvacancyrateisnormallyinthe6%‐8%range.ManyofthefoodstoreswithintheKensingtonMarketBIAarelocatedinthesoutheasternsectionoftheBIA,mainlyalongBaldwinStreetandKensingtonAvenue.Thesefoodstoresaresomewhatremovedfromtheproposeddevelopmentat420BathurstStreetandareuniqueandverydifferentfromatraditionalsupermarket,whichmaybeatenantatthesubjectsite.ManyofthesefoodstoresalsodrawsupportfromtheentireCityofToronto,universitystudentslivingintheareaandtouristsfrombeyondtheCity.FoodstoresinKensingtonMarketwillcompetemoredirectlywithfoodstoresintheChinatownBIA,ratherthanwithapossiblesupermarketintheproposeddevelopmentat420BathurstStreet.
SimilartofoodstoresinKensingtonMarket,manyoftheclothingandaccessorystores,andmiscellaneousretailers(manyofwhichareclothingstoresthatsellusedmerchandise)arelocatedinthesoutheasternportionoftheBIA,mainlyalongKensingtonAvenue.Theseclothing

ResidualRetailMarketDemandAnalysis–420BathurstStreet
20
andaccessorystores,andmiscellaneousretailersaccountforone‐thirdoftheretail/serviceoutletsandtheamountofspaceinKensingtonMarket.Thesestoresareuniqueandareverydifferentfromadepartmentstoreorotherlarge‐scalefashionretailer,whichmaybeatenantintheproposeddevelopmentat420BathurstStreet.ThesestoresinKensingtonMarketlargelycaternotonlytolocalarearesidentsbutalsotonearbyuniversitystudents,touristsandotherGreaterTorontoArearesidents.
FoodservicesanddrinkingplacesalsoaccountforasignificantshareofthebusinessestablishmentsinKensingtonMarket.ManyoftheseestablishmentsarelocatedalongAugustaAvenueanddrawCity‐wide,appealingalsotonearbyuniversitystudents.FoodservicesanddrinkingplacesinKensingtonMarketwillnotcompetedirectlywithtenantsattractedtotheproposeddevelopmentat420BathurstStreet,aslimitedtoanyfoodservicefacilitiesarelikelytobelocatedintheproposeddevelopment.
FIGURE5‐2:KENSINGTONMARKETBIARETAILCOMPOSITION
STORE TYPE
Square
Feet Percent
Number of
Establishments Percent
Average Size of
Establishment
FOOD STORE RETAIL (FSR) 44,250 12.6 42 14.4 1,054
Supermarkets & Grocery 5,200 1.5 2 0.7 2,600
Convenience and Specialty Food Stores 39,050 11.1 40 13.7 976
BEVERAGE STORES 0 0.0 0 0.0 n.a.
Beer, Wine and Liquor Stores 0 0.0 0 0.0 n.a.
NON‐FOOD STORE RETAIL (NFSR) 134,400 38.3 107 36.6 1,256
Automotive 3,400 1.0 2 0.7 1,700
Furniture, Home Furnishings and Electronics Stores 7,500 2.1 5 1.7 1,500
Building and Outdoor Home Supply Stores 2,700 0.8 1 0.3 2,700
Pharmacies and Personal Care Stores 6,900 2.0 5 1.7 1,380
Clothing and Accessory Stores 44,000 12.5 39 13.4 1,128
Miscallaneous Retailers 69,900 19.9 55 18.8 1,271
General Merchandise Stores 0 0.0 0 0.0 n.a.
SERVICES 158,450 45.2 130 44.5 1,219
Finance 4,900 1.4 3 1.0 1,633
Insurance and Real Estate 500 0.1 1 0.3 500
Professional, Scientific and Technical Services 19,900 5.7 7 2.4 2,843
Selected Other Administrative Services 0 0.0 0 0.0 n.a.
Travel Agencies 0 0.0 0 0.0 n.a.
Automobile Rental 1,000 0.3 1 0.3 1,000
Consumer Goods Rental 500 0.1 1 0.3 500
Selected Educational Services 5,000 1.4 3 1.0 1,667
Health Care 3,600 1.0 3 1.0 1,200
Social Services 5,100 1.5 2 0.7 2,550
Cultural, Entertainment and Recreation 6,550 1.9 6 2.1 1,092
Food Services and Drinking Places 86,000 24.5 79 27.1 1,089
Personal and Household Goods Repair and Maintenance 500 0.1 1 0.3 500
Personal Care Services 16,600 4.7 18 6.2 922
Civic & Social Organizations 6,900 2.0 4 1.4 1,725
Municipal Services/Government Offices 1,400 0.4 1 0.3 1,400
VACANT 13,700 3.9 13 4.5 1,054
TOTAL 350,800 100.0 292 100.0 1,201
SOURCE:urbanMetricsinc.basedoninventoryconductedinJanuary2013
AlsoshowninFigure5‐2,theaveragestoresizeintheKensingtonMarketBIAisonly1,201squarefeet,significantlydifferentfromthetypeofstoresproposedat420BathurstStreet.This
ResidualRetailMarketDemandAnalysis–420BathurstStreet
21
providesanotherindicatorofthedifferenceinthetypeofstoresinthelocalshoppingdistrictcomparedtothoseinthesubjectproposal.
Basedonourreviewoftheinventorydata,itremainsouropinionthatthelargeformatretailfacilitiesattractedtothesecondandthirdfloorsoftheproposeddevelopmentat420BathurstStreetwillbeunliketheretailersinKensingtonMarket,whichareuniqueandspecialized,andwillnotnegativelyaffectthecontinuedviabilityofbusinessesinthisarea.Thisisdue,inpart,totheKensingtonMarketBIAdoinganexcellentjobatpromotingitselfCity‐wideandtovisitingtourists.Eventssuchas“PedestrianSundays”,wherestreetsareclosedtotraffic,havebeenverysuccessfulinattractingnewpatronstotheBIAandwilllikelycontinuetodoso,evenwiththeproposeddevelopmentofaretailfacilityat420BathurstStreet.KensingtonMarket’suniquemixofretail/servicespacealsoappealstoandissupportedstronglybylocalresidents.Inouropinion,thisstronglocalsupportwillcontinue,andtheresidualanalysiscontainedearlierinthisreportdemonstratethatthenewspaceproposedat420BathurstStreetiswarranted,withoutanytransfersofsalesfromexistingstoresintheTradeArea.
5.2 CHINATOWNBUSINESSIMPROVEMENTAREA
TheboundariesoftheChinatownBIAareillustratedinFigure5‐1.Thisareaisamajorethnic‐orientedretailarealocatedonSpadinaAvenue,betweenCollegeStreetandSullivanStreet;andalongDundasStreetbetweenAugustaAvenueandBeverleyStreet.TheChinatownBIAistheshopping,culturalandsocialfocalpointfortheChinesecommunityintheCityofTorontoandtheGreaterTorontoArea.AsignificantportionoftheretailersintheBIAareEastAsianrestaurants,apparelandaccessories,giftandsouvenirstores,beautyparlorsandhairsalons,mainlyorientedtoToronto’slargeEastAsiancommunity.

ResidualRetailMarketDemandAnalysis–420BathurstStreet
22
FIGURE5‐3:CHINATOWNBIA
SOURCE:urbanMetricsinc.basedonCityofTorontoBIAmaps
ThesefourmostcommontypesoffacilitiesintheareacombinedmakeupnearlyhalfofallthestoresandservicesintheChinatownBIA.Figure5‐4showstheretailcompositionoftheChinatownBIA,categorizedbytheNAICS.Asindicatedearlierinthereport,theChinatownBIAinventoryinFigure5‐4includesretailandserviceestablishments,asmeasuringtheactualspacebyspecificcategorywouldhavebeenimpossibleinthisarea.ThereareafairnumberofvacanciesintheBIA,themajorityofwhicharelocatedinChinatownCentre(62ofthe87vacantunitsintheBIA),anenclosedmallfrontingSpadinaAvenuethatcontainsaSuper8HotelandHSBCasitsanchortenants.ItishoweverimportanttonotethatmostofthevacanciesinChinatownCentrearefoodcourtvendors,kiosksandsmallretailspaces.Itisimportanttonotethatvacanciesaccountforonly4.5%ofthetotalnumberofoutletsintheChinatownBIAthatarenotwithintheenclosedmallssuchasChinatownCentreandDragonCity.

ResidualRetailMarketDemandAnalysis–420BathurstStreet
23
FIGURE5‐4:CHINATOWNBIARETAILCOMPOSITION
SOURCE:urbanMetricsinc.basedoninventoryconducedinJanuary2013andChinatownBIAbusinessdirectory
TheChinatownBIAisrecognizedasamajortouristdestinationintheCity,andispromotedassuch.TheareahasbeenabletomaintainitsprominenceandattractionfortheEastAsiancommunity,despitetheformationofmultipleother“Chinatowns”inotherpartsoftheCityofTorontoandGreaterTorontoArea.TheChinatownBIAcatersnotonlytoalargelylocalizedethnicmarket,butmoreimportantlyrepresentsamajorregionalandtouristattraction.Inourprofessionalopinion,thelargeformatretailfacilitiesproposedforthesubjectdevelopmentat420BathurstStreetarevastlydifferentfromtheretailandservicetenantsintheChinatownBIA.Moreover,itishighlyunlikelythattheChinatownBIAwillbeadverselyimpactedbytheproposeddevelopmentastheBIAisaverypedestrianorientedandtransitaccessibleshoppingdistrict.
5.3 LITTLEITALYBUSINESSIMPROVEMENTAREA
Figure5‐5illustratestheboundariesoftheLittleItalyBIA,whichismainlylocatedonthenorthandsouthsidesofCollegeStreetfromShawStreetinthewesttoBathurstStreetintheeast.Basedonourinventory,thereareapproximately300retail/serviceoutletswithintheBIA,accountingforover500,000squarefeetofspace(Figure5‐6).Nearlythree‐quartersoftheseretail/serviceoutletsareserviceoriented,themajorityofwhicharefoodservicesanddrinkingplaces,andhealthcarerelated.

ResidualRetailMarketDemandAnalysis–420BathurstStreet
24
FIGURE5‐5:LITTLEITALYBIA
SOURCE:urbanMetricsinc.basedonCityofTorontoBIAmaps
BusinessesintheBIAarecharacterizedbyhigher‐endrestaurantsanddrinkingplacesthatareamajorCity‐wideattraction,cateringtopeopleinsideandoutsidetheTradeArea.ManyofthesefoodservicesanddrinkingplacesarelocatedinthewesternportionoftheBIA,awayfromtheproposeddevelopmentat420BathurstStreet.TheeasternpartoftheBIAischaracterizedbyhealthcarerelatedoutlets,dueinparttotheproximitytotheTorontoWesternHospital.Theseretail/serviceoutletsincludemedicalofficebuildings,andpharmaciesandpersonalcarestores.

ResidualRetailMarketDemandAnalysis–420BathurstStreet
25
FIGURE5‐6:LITTLEITALYBIARETAILCOMPOSITION
Store Type
Square
Feet Percent
Number of
Establishments Percent
Average Size of
Establishment
FOOD STORE RETAIL (FSR) 37,300 7.0 11 3.4 3,391
Supermarkets & Grocery 26,800 5.1 1 0.3 26,800
Convenience and Specialty Food Stores 10,500 2.0 10 3.1 1,050
BEVERAGE STORES 3,500 0.7 1 0.3 3,500
Beverage Stores 3,500 0.7 1 0.3 3,500
NON‐FOOD STORE RETAIL (NFSR) 82,200 15.5 53 16.6 1,551
Selected Automotive 0 0.0 0 0.0 n.a.
Furniture, Home Furnishings and Electronics Stores 15,300 2.9 5 1.6 3,060
Building and Outdoor Home Supply Stores 1,200 0.2 1 0.3 1,200
Pharmacies & Personal Care 25,700 4.9 12 3.8 2,142
Apparel and Accessories 16,500 3.1 14 4.4 1,179
Other Miscellaneous 22,200 4.2 20 6.3 1,110
General Merchandise 1,300 0.2 1 0.3 1,300
SERVICES 378,700 71.5 239 74.7 1,585
Finance 22,400 4.2 9 2.8 2,489
Other 67,050 12.7 34 10.6 1,972
Automobile Rental 0 0.0 0 0.0 n.a.
Consumer Goods Rental 1,000 0.2 1 0.3 1,000
Selected Educational Services 16,100 3.0 5 1.6 3,220
Health Care 70,500 13.3 66 20.6 1,068
Social Services 14,650 2.8 5 1.6 2,930
Cultural, Entertainment & Recreation 14,400 2.7 4 1.3 3,600
Food Services & Drinking Places 148,500 28.0 89 27.8 1,669
Personal & Household Goods Repair & Maintenance ‐ Auto 2,600 0.5 1 0.3 2,600
Personal & Household Goods Repair & Maintenance ‐ Other 1,800 0.3 3 0.9 600
Personal Care 17,400 3.3 20 6.3 870
Selected Civic & Social Organizations 1,100 0.2 1 0.3 1,100
Religious Organizations 0 0.0 0 0.0 n.a.
Municipal Services/Government Offices 1,200 0.2 1 0.3 1,200
VACANT 28,100 5.3 16 5.0 1,756
TOTAL 529,800 100.0 320 100.0 1,656
SOURCE:urbanMetricsinc.basedoninventoryconductedinJanuary2013
Overall,theLittleItalyBIAappearsveryhealthy,withalowvacancyrateof5.3%.ThelargeconcentrationoffoodservicesanddrinkingplaceslocatedthroughouttheBIAwillnotbeimpactedbythelargerformatretailfacilitiesattractedtothesubjectsite,aslimitedifanyspaceofthistypeisproposed.Whileasupermarketisapossibletenantinthe420BathurstStreetdevelopment,itisunlikelytohaveanimpactontheMetrolocatedalargedistanceawayatShawStreetandCollegeStreet.TheMetroislocatedonthewesternboundaryofthePrimaryTradeArea,andthereforelikelyattractsalargeshareofitssalesfromoutsidethePrimaryTradeAreaboundary.InadditiontotheMetro,mostofthespecializedgroceryandfreshfoodshopslocatedintheBIAareinthewesternportion,closetotheMetro,andthereforealsolikelyattractcustomersfromoutsidethePrimaryTradeAreaboundary.Therefore,itisouropinionthatthelargerformatretailfacilitiesthatwouldlikelybeattractedtotheproposeddevelopmentat420Bathurstareverydifferentfromtheretail/serviceoutletsintheLittleItalyBIA.Inaddition,thepredominantstoresizesintheLittleItalyBIA,whichaverage1,656squarefeet,areverydifferentfromthestoresizesproposedonthesubjectsite.

ResidualRetailMarketDemandAnalysis–420BathurstStreet
26
5.4 TRINITYBELLWOODSBUSINESSIMPROVEMENTAREA
TheboundariesoftheTrinityBellwoodsBIAareillustratedinFigure5‐7.TheareaextendsfromBathursttoGraceStreet(byTrinityBellwoodsPark)alongDundasStreetWest.Theshoppingdistrictcontainsover140establishmentsandisheavilyorientedtowardservicebasedfacilities.Withintheservicecategory,foodservicesanddrinkingplacescomprisethelargestamountofspaceandnumberofestablishmentsintheBIA.Furthermore,theretailandservicefacilitiesintheTrinityBellwoodsBIAarelargelyorientedtoservinglocalarearesidents.
FIGURE5‐7:TRINITYBELLWOODSBIA
SOURCE:urbanMetricsinc.basedonCityofTorontoBIAmaps
Figure5‐8showstheretailcompositionoftheTrinityBellwoodsBIA.Despitethelargenumberofvacancies,thisretailstripalongDundashasrecentlybeguntogentrify,asseveralnewrestaurants,cafesandbarshaveopened.Thesenewestablishmentsarehighlyunlikelytobenegativelyimpactedbythesubjectproposalastheyaredifferentfromtheusesproposedat420BathurstStreet.Furthermore,veryfewcomparisonretailstoresarelocatedinthisBIA,withlittleapparelandfurniture,homefurnishingsandelectronicsoutlets,whichmayultimatelybethetypeofstoresoccupyingthesecondandthirdfloorsoftheproposeddevelopment.Inaddition,nosupermarketsarelocatedintheareaandthereforeifsuchastoreweretobeincludedat420BathurstStreet,therewouldbenoimpactonthislocallyorientedretailarea.

ResidualRetailMarketDemandAnalysis–420BathurstStreet
27
FIGURE5‐8:TRINITYBELLWOODSBIARETAILCOMPOSITION
SOURCE:urbanMetricsinc.basedoninventoryconductedinJanuary2013
Thelargeformatretailfacilitieslikelytooccupythesecondandthirdfloorsoftheproposeddevelopmentat420BathurstStreetwillbeverydifferentfromtheestablishmentsintheTrinityBellwoodsBIAbothintypeandsize(theaveragestoresizewithintheBIAis1,503squarefeet).VirtuallyalltheestablishmentsintheBIAaresmallscale,localservingservicesandretailers.Theareaisheavilyorientedtowardservicefacilities,withfoodservicesanddrinkingplacescomprisingthelargestamountofspaceandestablishmentsintheBIA.ItisalsoimportanttonotethatthenewNeroCondoandtownhomedevelopmentsatDundasStreetandManningAvenuewillincreaselocalmarketsupportforstoresandservicesintheTrinityBellwoodsBIAaswellasprovideadditionalcustomersupportforthesubjectproposal.Inourprofessionalopinion,itishighlyunlikelythattheproposeddevelopmentwillhaveanadverseimpactontheTrinityBellwoodsBIA.Infact,thelackofasupermarketintheBIA,thedevelopmentofnewresidentialprojectsintheareaandtherecentadditionofnewindependentserviceestablishmentsarefactorswillhelprevitalizethatmorelocalservingBIA.
Basedonadetailedinventoryofallretailandservicefacilitiesinthefournearbyshoppingdistricts,ourprofessionalopinionremainsthatthesubjectproposalwillhaveverylittle,ifany,impactonthefourlocalshoppingdistricts,andtheeconomichealthofthesenearbyshoppingdistrictswillnotbeadverselyaffected.Tenantsattractedtotheproposeddevelopmentwillbeverydifferentfromthenearbyshoppingdistrictsintermsoftenanttypeandsize.

ResidualRetailMarketDemandAnalysis–420BathurstStreet
28
APPENDIXA–RETAILMARKETREVIEW–420BATHURSTSTREET

ResidualRetailMarketDemandAnalysis–420BathurstStreet
29

ResidualRetailMarketDemandAnalysis–420BathurstStreet
30
ResidualRetailMarketDemandAnalysis–420BathurstStreet
31

ResidualRetailMarketDemandAnalysis–420BathurstStreet
32

ResidualRetailMarketDemandAnalysis–420BathurstStreet
33
ResidualRetailMarketDemandAnalysis–420BathurstStreet
34

ResidualRetailMarketDemandAnalysis–420BathurstStreet
35
ResidualRetailMarketDemandAnalysis–420BathurstStreet
36

ResidualRetailMarketDemandAnalysis–420BathurstStreet
37
ResidualRetailMarketDemandAnalysis–420BathurstStreet
38

ResidualRetailMarketDemandAnalysis–420BathurstStreet
39

ResidualRetailMarketDemandAnalysis–420BathurstStreet
40

ResidualRetailMarketDemandAnalysis–420BathurstStreet
41
ResidualRetailMarketDemandAnalysis–420BathurstStreet
42

ResidualRetailMarketDemandAnalysis–420BathurstStreet
43
ResidualRetailMarketDemandAnalysis–420BathurstStreet
44
ResidualRetailMarketDemandAnalysis–420BathurstStreet
45
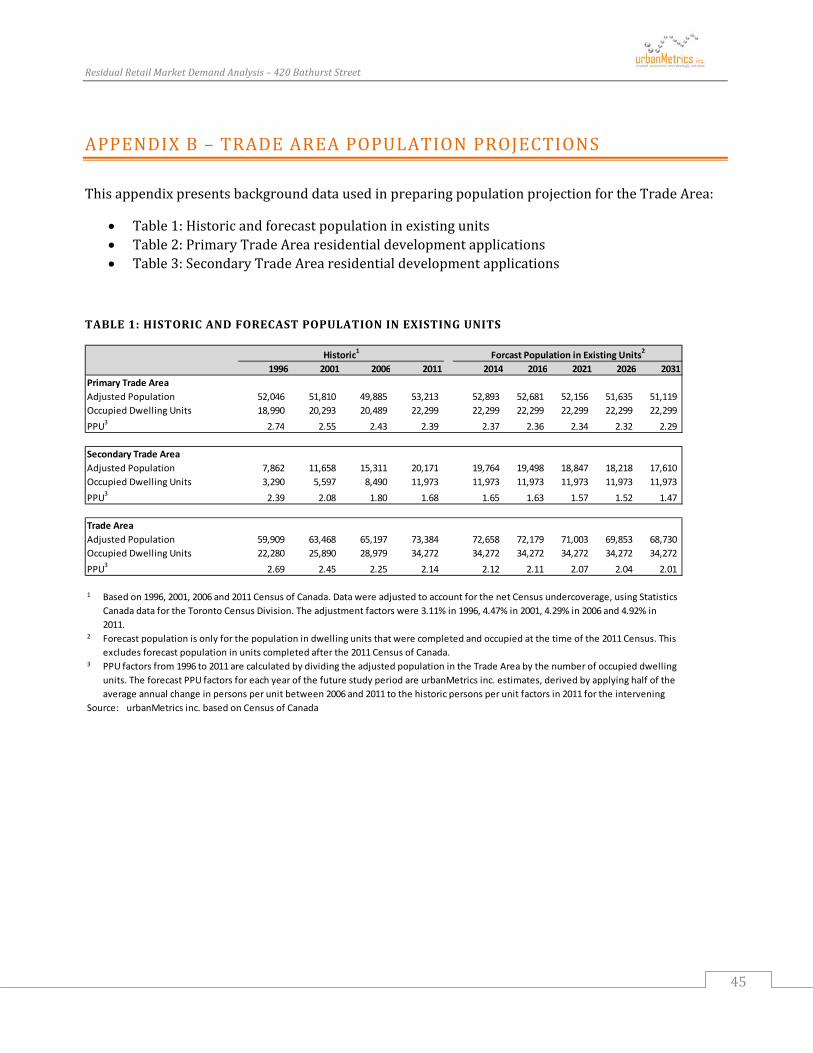
APPENDIXB–TRADEAREAPOPULATIONPROJECTIONS
ThisappendixpresentsbackgrounddatausedinpreparingpopulationprojectionfortheTradeArea:
Table1:Historicandforecastpopulationinexistingunits Table2:PrimaryTradeArearesidentialdevelopmentapplications Table3:SecondaryTradeArearesidentialdevelopmentapplications
TABLE1:HISTORICANDFORECASTPOPULATIONINEXISTINGUNITS
1996 2001 2006 2011 2014 2016 2021 2026 2031
Primary Trade Area
Adjusted Population 52,046 51,810 49,885 53,213 52,893 52,681 52,156 51,635 51,119
Occupied Dwelling Units 18,990 20,293 20,489 22,299 22,299 22,299 22,299 22,299 22,299
PPU3
2.74 2.55 2.43 2.39 2.37 2.36 2.34 2.32 2.29
Secondary Trade Area
Adjusted Population 7,862 11,658 15,311 20,171 19,764 19,498 18,847 18,218 17,610
Occupied Dwelling Units 3,290 5,597 8,490 11,973 11,973 11,973 11,973 11,973 11,973
PPU3
2.39 2.08 1.80 1.68 1.65 1.63 1.57 1.52 1.47
Trade Area
Adjusted Population 59,909 63,468 65,197 73,384 72,658 72,179 71,003 69,853 68,730
Occupied Dwelling Units 22,280 25,890 28,979 34,272 34,272 34,272 34,272 34,272 34,272
PPU3
2.69 2.45 2.25 2.14 2.12 2.11 2.07 2.04 2.01
1
2
3
Source: urbanMetrics inc. based on Census of Canada
Historic1
Forcast Population in Existing Units2
Based on 1996, 2001, 2006 and 2011 Census of Canada. Data were adjusted to account for the net Census undercoverage, using Statistics
Canada data for the Toronto Census Division. The adjustment factors were 3.11% in 1996, 4.47% in 2001, 4.29% in 2006 and 4.92% in
2011.
Forecast population is only for the population in dwelling units that were completed and occupied at the time of the 2011 Census. This
excludes forecast population in units completed after the 2011 Census of Canada.
PPU factors from 1996 to 2011 are calculated by dividing the adjusted population in the Trade Area by the number of occupied dwelling
units. The forecast PPU factors for each year of the future study period are urbanMetrics inc. estimates, derived by applying half of the
average annual change in persons per unit between 2006 and 2011 to the historic persons per unit factors in 2011 for the intervening

ResidualRetailMarketDemandAnalysis–420BathurstStreet
46
TABLE2:PRIMARYTRADEAREARESIDENTIALDEVELOPMENTAPPLICATIONS
Address
Single‐
Detached
Semi‐
Detached Row Apartment Total
Assumed Period
of Completion
15 Augusta Ave. 0 0 3 0 3 2011‐2014
202 Bathurst St. 0 0 0 24 24 2011‐2014
386 Bathurst St. 0 0 0 4 4 2011‐2014
783 Bathurst St. 0 0 6 195 201 2011‐2014
15 Beverley St. 0 0 0 96 96 2011‐2014
207 Beverley St. 0 0 8 0 8 2011‐2014
506 College St. 0 0 4 0 4 2011‐2014
799 College St. 0 0 0 21 21 2011‐2014
856 Dundas St. W. 0 0 10 82 92 2011‐2014
84 Harbord St. 0 0 0 3 3 2011‐2014
99 Harbord St. 0 0 0 1 1 2011‐2014
250 Manning Ave. 0 0 45 0 45 2011‐2014
103 & 109‐111 Ossington Ave. 0 0 0 86 86 2011‐2014
41 Ossington Ave. 0 0 5 23 28 2011‐2014
50 Ryerson Ave. 3 0 0 0 3 2011‐2014
682 Bathurst St. 0 0 0 19 19 2014‐2016
308 Dundas St. W. 0 0 0 10 10 2014‐2016
54 Kensington Ave. 0 0 0 6 6 2014‐2016
790 Queen St. W. 0 0 0 32 32 2014‐2016
486 Shaw St. 0 0 37 0 37 2014‐2016
210 Simcoe St. 0 0 0 298 298 2014‐2016
426 University Ave. 0 0 0 312 312 2014‐2016
243 College 0 0 0 121 121 2016‐2031
297 College St. 0 0 0 239 239 2016‐2031
571 Dundas St. W. 0 0 6 1,534 1,540 2016‐2031
944‐952 Queen St. W. 0 0 0 151 151 2016‐2031
170 Spadina Ave. 0 0 0 210 210 2016‐2031
270 Spadina Ave. 0 0 0 103 103 2016‐2031
480 Univeristy Ave. 0 0 0 453 453 2016‐2031
New Dwelling Units by Assumed Period of Completion
2011‐2014 3 0 81 535 619
2014‐2016 0 0 37 677 714
2016‐2031 0 0 6 2,811 2,817
2011‐2031 3 0 124 4,023 4,150
Estimated PPU1
3.05 3.00 3.12 2.10
Population in New Dwelling Units by Assumed Period of Completion
2011‐2014 9 0 252 1,124 1,385
2014‐2016 0 0 115 1,422 1,537
2016‐2031 0 0 19 5,903 5,922
2011‐2031 9 0 386 8,449 8,844
Source: urbanMetrics inc. based on information from the City of Toronto
1 urbanmetrics inc. estimate based on 2011 Census of Canada for the City of Toronto and the Primary
Trade Area.

ResidualRetailMarketDemandAnalysis–420BathurstStreet
47
TABLE3:SECONDARYTRADEAREARESIDENTIALDEVELOPMENTAPPLICATIONS
Address
Single‐
Detached
Semi‐
Detached Row Apartment Total
Assumed Period
of Completion
399 Adelaide St. W. 0 0 0 173 173 2011‐2014
32 Camden St. 0 0 0 87 87 2011‐2014
300 Front St. W. 0 0 0 671 671 2011‐2014
352 Front St. W. 0 0 0 458 458 2011‐2014
560 Front St. W. 0 0 0 305 305 2011‐2014
60 John. St. 0 0 0 412 412 2011‐2014
1030 King St. W. 0 0 0 602 602 2011‐2014
224 King St. W. 0 0 0 234 234 2011‐2014
375 King St. W. 0 0 0 274 274 2011‐2014
430 King St. W. 0 0 0 314 314 2011‐2014
478 King St. W. 0 0 0 180 180 2011‐2014
560 King St. W. 0 0 0 334 334 2011‐2014
650 King St. W. 0 0 0 233 233 2011‐2014
751 King St. W. 0 0 0 350 350 2011‐2014
2 Lisgar St. 0 0 0 212 212 2011‐2014
589 Queen St. W 0 0 0 90 90 2011‐2014
635 Queen St. W. 0 0 0 4 4 2011‐2014
25 Stafford St. 0 0 0 104 104 2011‐2014
170 Sudbury St. 0 0 0 135 135 2011‐2014
180 University Ave. 0 0 0 393 393 2011‐2014
83 Walnut Ave. 0 0 7 0 7 2011‐2014
175 Wellington St. W. 0 0 0 134 134 2011‐2014
350 Wellington St. W. 0 0 0 55 55 2011‐2014
354 Wellington St. W 0 0 0 280 280 2011‐2014
400 Wellington St. W. 0 0 0 102 102 2011‐2014
500 Wellington St. W. 0 0 0 16 16 2011‐2014
21 Widmer St. 0 0 0 444 444 2011‐2014
283 Adelaide St. W. 0 0 0 364 364 2014‐2016
295 Adelaide St. W. 0 0 0 564 564 2014‐2016
338 Adelaide St. W 0 0 0 429 429 2014‐2016
434 Adelaide St. W. 0 0 0 243 243 2014‐2016
103 Bathurst St. 0 0 0 255 255 2014‐2016
56 Blue Jays Way 0 0 0 342 342 2014‐2016
11 Charlotte St. 0 0 0 232 232 2014‐2016
620 King St. W. 0 0 0 15 15 2014‐2016
621 King St. W. 0 0 0 404 404 2014‐2016
24 Mercer St. 0 0 0 27 27 2014‐2016
8 Mercer St. 0 0 0 337 337 2014‐2016
90 Niagara St. 0 0 0 45 45 2014‐2016
117 Peter St. 0 0 0 410 410 2014‐2016
101 Portland St. 0 0 0 6 6 2014‐2016
431 Richmond St. W. 0 0 0 190 190 2014‐2016
842 Richmond St. W. 0 0 20 0 20 2014‐2016
456 Wellington St. W. 0 0 0 28 28 2014‐2016
508 Wellington St. W. 0 0 0 87 87 2014‐2016
263 Adelaide St W. 0 0 0 328 328 2016‐2031
290 Adelaide St. W 0 0 0 383 383 2016‐2031
525 Adelaide St. W. 0 0 0 440 440 2016‐2031
28 Bathurst St. 0 0 0 564 564 2016‐2031

ResidualRetailMarketDemandAnalysis–420BathurstStreet
48
99 Blue Jays Way 0 0 0 157 157 2016‐2031
156 Front St. W 0 0 0 620 620 2016‐2031
578 Front St. W. 0 0 0 1,200 1,200 2016‐2031
1071 King St. W. 0 0 0 205 205 2016‐2031
266‐322 King St. W. 0 0 0 2,709 2,709 2016‐2031
327 King St. W. 0 0 0 304 304 2016‐2031
355 King St. W. 0 0 0 807 807 2016‐2031
357 King St. W. 0 0 0 350 350 2016‐2031
367 King St. W. 0 0 0 62 62 2016‐2031
401‐409 King St. W. 0 0 0 443 443 2016‐2031
15 Mercer St. 0 0 0 566 566 2016‐2031
21 Nelson St. 0 0 0 383 383 2016‐2031
89‐109 Niagara St. 0 0 0 359 359 2016‐2031
353 Adelaide St. W. 0 0 0 35 35 2016‐2031
81 Peter St. 0 0 0 598 598 2016‐2031
1001 Queen St. W. 0 0 0 179 179 2016‐2031
219 Queen St. W. 0 0 0 196 196 2016‐2031
181 Richmond St. W. 0 0 0 746 746 2016‐2031
306 Richmond St. W. 0 0 0 402 402 2016‐2031
324 Richmond St. W. 0 0 0 295 295 2016‐2031
520 Richmond St. W. 0 0 0 108 108 2016‐2031
40 Widmer St. 0 0 0 380 380 2016‐2031
New Dwelling Units by Assumed Period of Completion
2011‐2014 0 0 7 6,596 6,603
2014‐2016 0 0 20 3,978 3,998
2016‐2031 0 0 0 12,819 12,819
2011‐2031 0 0 27 23,393 23,420
Estimated PPU1
2.15 2.12 2.20 1.48
Population in New Dwelling Units by Assumed Period of Completion
2011‐2014 0 0 15 9,779 9,794
2014‐2016 0 0 44 5,898 5,942
2016‐2031 0 0 0 19,005 19,005
2011‐2031 0 0 59 34,682 34,741
Source: urbanMetrics inc. based on information from the City of Toronto
1 urbanmetrics inc. estimate based on 2011 Census of Canada for the City of Toronto and the Secondary
Trade Area.

ResidualRetailMarketDemandAnalysis–420BathurstStreet
49
APPENDIXC–TRADEAREAINVENTORY

ResidualRetailMarketDemandAnalysis–420BathurstStreet
50
ResidualRetailMarketDemandAnalysis–420BathurstStreet
51

ResidualRetailMarketDemandAnalysis–420BathurstStreet
52

ResidualRetailMarketDemandAnalysis–420BathurstStreet
53

ResidualRetailMarketDemandAnalysis–420BathurstStreet
54
ResidualRetailMarketDemandAnalysis–420BathurstStreet
55

ResidualRetailMarketDemandAnalysis–420BathurstStreet
56

ResidualRetailMarketDemandAnalysis–420BathurstStreet
57

ResidualRetailMarketDemandAnalysis–420BathurstStreet
58

ResidualRetailMarketDemandAnalysis–420BathurstStreet
59

ResidualRetailMarketDemandAnalysis–420BathurstStreet
60

ResidualRetailMarketDemandAnalysis–420BathurstStreet
61

ResidualRetailMarketDemandAnalysis–420BathurstStreet
62

ResidualRetailMarketDemandAnalysis–420BathurstStreet
63

ResidualRetailMarketDemandAnalysis–420BathurstStreet
64

ResidualRetailMarketDemandAnalysis–420BathurstStreet
65
ResidualRetailMarketDemandAnalysis–420BathurstStreet
66