Embed Size (px)
Citation preview
Residential yard management and landscape cover affect urban birdcommunity diversity across the continental USA
SUSANNAH B. LERMAN ,1,17 DESIREE L. NARANGO ,2,3 MEGHAN L. AVOLIO ,4 ANIKA R. BRATT,5,6
JESSE M. ENGEBRETSON,7,8 PETER M. GROFFMAN,2,9 SHARON J. HALL ,10 JAMES B. HEFFERNAN,5 SARAH E. HOBBIE,11
KELLI L. LARSON,12 DEXTER H. LOCKE ,13 CHRISTOPHER NEILL ,14 KRISTEN C. NELSON,7,8
JOSEP PADULLES CUBINO ,11,15 AND TARA L. E. TRAMMELL16
1USDA Forest Service, Northern Research Station, Amherst, Massachusetts 01003 USA2Advanced Science Research Center at the Graduate Center, City University of New York, New York, New York 10031 USA
3Department of Biology, University of Massachusetts, Amherst, Massachusetts 01003 USA4Department of Earth and Planetary Sciences, Johns Hopkins University, Baltimore, Maryland 21218 USA
5Nicholas School of the Environment, Duke University, Durham, North Carolina 27708 USA6Department of Environmental Studies, Davidson College, Davidson, North Carolina 28035 USA
7Department of Forest Resources, University of Minnesota, St. Paul, Minnesota 55108 USA8Department of Fisheries, Wildlife, and Conservation Biology, University of Minnesota, St. Paul, Minnesota 55108 USA
9Cary Institute of Ecosystem Studies, Millbrook, New York 12545 USA10School of Life Sciences, Arizona State University, Tempe, Arizona 85287 USA
11Department of Ecology, Evolution and Behavior, University of Minnesota, St. Paul, Minnesota 55108 USA12School of Geographical Sciences and Urban Planning, School of Sustainability, Arizona State University, Tempe,
Arizona 85287 USA13USDA Forest Service, Northern Research Station, Baltimore, Maryland 21228 USA
14Woodwell Climate Research Center, Falmouth, Massachusetts 02540 USA15Department of Botany and Zoology, Masaryk University, Brno 62500 Czech Republic
16Department of Plant and Soil Sciences, University of Delaware, Newark, Delaware 19716 USA
Citation: Lerman, S. B., D. L. Narango, M. L. Avolio, A. R. Bratt, J. M. Engebretson, P. M. Groffman,S. J. Hall, J. B. Heffernan, S. E. Hobbie, K. L. Larson, D. H. Locke, C. Neill, K. C. Nelson, J. PadullesCubino, and T. L. E. Trammell. 2021. Residential yard management and landscape cover affect urban birdcommunity diversity across the continental USA. Ecological Applications 00(00):e02455. 10.1002/eap.2455
Abstract. Urbanization has a homogenizing effect on biodiversity and leads to communitieswith fewer native species and lower conservation value. However, few studies have exploredwhether or how land management by urban residents can ameliorate the deleterious effects ofthis homogenization on species composition. We tested the effects of local (land management)and neighborhood-scale (impervious surface and tree canopy cover) features on breeding birddiversity in six US metropolitan areas that differ in regional species pools and climate. We used aBayesian multiregion community model to assess differences in species richness, functional guildrichness, community turnover, population vulnerability, and public interest in each bird commu-nity in six land management types: two natural area park types (separate and adjacent to residen-tial areas), two yard types with conservation features (wildlife-certified and water conservation)and two lawn-dominated yard types (high- and low-fertilizer application), and surroundingneighborhood-scale features. Species richness was higher in yards compared with parks; however,parks supported communities with high conservation scores while yards supported species ofhigh public interest. Bird communities in all land management types were composed of primarilynative species. Within yard types, species richness was strongly and positively associated withneighborhood-scale tree canopy cover and negatively associated with impervious surface. At acontinental scale, community turnover between cities was lowest in yards and highest in parks.Within cities, however, turnover was lowest in high-fertilizer yards and highest in wildlife-certified yards and parks. Our results demonstrate that, across regions, preserving natural areas,minimizing impervious surfaces and increasing tree canopy are essential strategies to conserveregionally important species. However, yards, especially those managed for wildlife supportdiverse, heterogeneous bird communities with high public interest and potential to support spe-cies of conservation concern. Management approaches that include the preservation of protectedparks, encourage wildlife-friendly yards and acknowledge how public interest in local birds canadvance successful conservation in American residential landscapes.
Manuscript received 10 January 2021; accepted 6 April 2021;final version received 10 September 2021. CorrespondingEditor: Dianne Brunton.
17 E-mail: [email protected]
Article e02455; page 1
Ecological Applications, 0(0), 2021, e02455© 2021 The Ecological Society of America. This article has been contributed to by US Government employees and their work is in the public domainin the USA.
Key words: beta-diversity; biodiversity conservation; community ecology; habitat; occupancy; residentiallandscapes; urban homogenization.
INTRODUCTION
Urbanization has a homogenizing, or convergingeffect whereby ecological form and function amongcities are more similar to each other than to the nativeecosystems that they replaced (Groffman et al. 2014,Hall et al. 2016, Wheeler et al. 2017). This homogeniz-ing force can lead to more depauperate native animalcommunities in urban ecosystems (Czech et al. 2000,McKinney 2006). For birds, urbanization results in com-munities that are similar across cities (Devictor et al.2007, Luck and Smallbone 2011), less taxonomicallydiverse (Aronson et al. 2014, Batary et al. 2018), andless evolutionarily distinct (Morelli et al. 2016, Ibanez-Alamo et al. 2017, Sol et al. 2017, LaSorte et al. 2018)compared with those found in natural areas. However,most urban bird communities still include primarilylocally native species (Aronson et al. 2014), and citiescan provide important habitats for threatened species(Ives et al. 2016, Soanes and Lentini 2019). Yet, urbanareas tend to support habitat- and diet-generalist birdspecies at the expense of specialists (Evans et al. 2011,2018, Leveau 2013, Concepcion et al. 2015, Joyce et al.2018) and these losses can have significant impacts onspecies diversity in cities (Sol et al. 2020). These commu-nity patterns suggest that food resources and/or nestinghabitat may ultimately limit species occupancy in urbanlandscapes, and that restoring these features mayimprove local bird community diversity (Beninde et al.2015, Lepczyk et al. 2017).Because most studies of urban bird communities have
focused on the differences between urban and non-urban sites (e.g., Aronson et al. 2014, Sorte et al. 2014,Morelli et al. 2016, Ibanez-Alamo et al. 2017, Sol et al.2017), they have yet to fully account for the variation ofhabitats embedded within a particular city, limiting ourunderstanding of how to manage local features for biodi-versity. Zooming in from a landscape to a local (e.g.,household) perspective reveals a tremendous amount oflandscape heterogeneity within urban areas (Cadenassoet al. 2007). Socioeconomic processes are major driversof management and preferences (Avolio et al. 2015). Inaddition, legacies of systemic racism, for example,redlining, further define differences in types and amountof vegetation such as canopy cover, their associated landmanagement and subsequent ecological patterns andprocesses (Avolio et al. 2020, Schell et al. 2020). Land-scaping preferences for colorful and showy plants,and those easy to maintain also influence landscapeheterogeneity (Larson et al. 2016, Avolio et al. 2018,Cavender-Bares et al. 2020). Studies have exposed differ-ences between urban and peri-urban green spaces intheir ability to support local biodiversity; specifically,rural lands and large natural parks (e.g., National Forest
lands, large county parks with native vegetation andother protected open spaces) have higher bird diversitycompared with other land-use types embedded withinthe urban matrix (Chace and Walsh 2006). However,both “land sparing” for example, protecting local naturalhabitat and “land sharing” (e.g., managing developedland as habitat) strategies can be integrated in urbanplanning (Sushinsky et al. 2013, Ibanez-Alamo et al.2020). Yet, few studies have explored whether harnessingthe collective efforts of householder management hasthe potential to improve urban conservation effortsbeyond efforts reliant on government agencies or non-government organizations alone (Derby Lewis et al.2019, Soanes and Lentini 2019). Therefore, determiningwhich land uses and management strategies supportdiverse species assemblages will help to inform conserva-tion plans to curb negative impacts of development onbiodiversity in urban areas.In urban areas, private residential yards (from this
point forward “yards”) represent a substantial portionof urban green spaces (36–47%; Loram et al. 2008), andcontain the majority of plant biomass, including a mixof native and introduced plant and animal species(Nowak et al. 2001, Donnelly and Marzluff 2004,Loram et al. 2007). Households manage yards in diverseways (Goddard et al. 2017). For example, managementdecisions include whether to garden for wildlife, plantnative plants, maintain lawns, or fertilize and irrigateplants (Goddard et al. 2013, Larson et al. 2016), andcan vary between neighborhoods and within a city (Pol-sky et al. 2014, Locke et al. 2019). Variation in manage-ment can drive heterogeneity in bird habitat qualitywithin cities, influencing community assembly, diversity,and species turnover among yards (Daniels and Kirk-patrick 2006, Lerman and Warren 2011, Belaire et al.2014). However, the vast majority of studies have beenlimited in scope, focusing on a single species (e.g., Nar-ango et al. 2017), a single city (e.g., Goddard et al.2013), or a single dichotomy of landscape managementsuch as the use of native vs. non-native plants (Bur-ghardt et al. 2009). Studies conducted at continentalscales that investigate multiple taxa and assess the broadvariations in land management across scales are neces-sary to address the generalizability of these patterns(Heffernan et al. 2014). Furthermore, the methods forhow we assess biodiversity patterns (i.e., bird diversitymetrics such as taxonomic richness, phylogenetic andfunctional diversity) have importance for understandingbiodiversity conservation.Different diversity metrics present unique aspects of
biodiversity, and in combination provide a more com-plete description of the bird community (McGill et al.2015, Ibanez-Alamo et al. 2017), especially when consid-ering differences related to species identity within the
Article e02455; page 2 SUSANNAH B. LERMAN ET AL.Ecological Applications
Vol. 0, No. 0
local community. For example, species richness (i.e.,total number of species per unit area) can be similarbetween a residential yard and a natural park, or yardsmight have higher richness than parks because they con-tain both native and exotic vegetation, which may sup-port a broader array of species (Marzluff 2005, 2017,Lerman and Warren 2011). Yet the bird communities ineach are composed of different species that vary in iden-tity and functional traits such as dietary specialization.For example, yards may be more likely to contain non-native and generalist species, over native and specialistones. This distinction is important when consideringrelationships between ecosystem function and biodiver-sity as function may be primarily driven by the particu-lar traits of species that occupy a habitat, rather than bytaxonomic diversity per se (Cadotte et al. 2017). Simi-larly, yards can support comparable species richness butexhibit more homogenized communities (i.e., similarspecies composition in yards across cities) relative to thenative ecosystems that these yards have replaced (Soco-lar et al. 2016) meaning that, at scales larger than a sin-gle parcel (i.e., the metropolitan area), species richnesscould be reduced.In addition to the above biodiversity metrics, consider-
ing the conservation status or public interest of a particu-lar species can help to develop conservation strategiesaimed at improving urban biodiversity (Schuetz andJohnston 2019). For example, species differ in their vul-nerability to urban development because of habitat spe-cializations, limited distributions or regional populationtrends (Nuttle et al. 2003), which might be independentof functional traits. In addition, public interest in a spe-cies (e.g., “popularity” based on Google searches as perSchuetz and Johnston 2019) may help make the biodiver-sity crisis relevant to decision makers and stakeholders(Hiron et al. 2018) with implications for enhancing theconservation value of residential landscapes.Here, we tested for differences in the breeding bird
community among different urban land managementtypes including public parks and private yards. Theparks included two types of sites: interstitial areas thatabut residential lands and protected reference areaslocated at the edges of metropolitan areas. Both parktypes had unmanaged natural vegetation. The yardsincluded those managed for lawns (i.e., high or low-fertilizer inputs), or yards managed for conservation(i.e., wildlife or water) across six major US metropoli-tan regions (Baltimore, MD; Boston, MA; Miami, FL;Minneapolis-St. Paul, MN; Phoenix, AZ; Los Angeles,CA), which differed in regional bird communities, cli-mate, and ecological biomes (Trammell et al. 2016).Because birds respond at scales larger than an individ-ual parcel, we considered neighborhood-scale (1 km)effects of land cover within our models by simultane-ously assessing relationships between bird communitiesand tree canopy cover and impervious surface (fromthis point forward neighborhood-scale features). We(1) modeled bird species occupancy using multiregion
hierarchical community occupancy models thataccounted for detection (Kery and Royle 2016, Suther-land et al. 2016), and (2) used estimated predictions ofoccupancy for each species at each site to test whetherestimated species richness, functional traits, conserva-tion score, public interest score and community turn-over differed within and across cities for the differentland management types and land cover. We predictedthat, controlling for neighborhood-scale features,wildlife-certified management would support higherbird species richness and higher turnover among yardsrelative to yards managed as lawns or for water conser-vation. We further predicted that levels of richness andturnover in wildlife-certified yards would be compara-ble with those in parks. We also predicted thatwildlife-certified yards and parks would support spe-cies with higher conservation scores and public inter-est. Our empirical study expands upon previous workby explicitly testing bird community responses to mul-tiple land management regimes at a continental scalewith the goal to advance our understanding of thegeneralizability of urban bird patterns.
MATERIALS AND METHODS
Study sites
We selected six Metropolitan Statistical Areas (fromthis point forward “cities”) across the continental USAthat represented different climates and ecological biomes:Baltimore, MD (BAL; Southeastern USA Plains), Bos-ton, MA (BOS; Mixed Wood Plains), Los Angeles, CA(LA; Mediterranean California), Miami, FL (MIA; Ever-glades), Minneapolis-St. Paul, MN (MSP; TemperatePrairies/Mixed Wood Plains), and Phoenix, AZ (PHX,Warm Deserts; Trammell et al. 2016; Ecological RegionLevel II, https://www.epa.gov/eco-research/ecoregions-north-america). Within each city, we sampled two differ-ent land uses (public parks and private yards) and withinthese two land uses, six management types (two parktypes and four yard types).For the parks, the two management types included ref-
erence sites (n = 4 or 5 per city) and interstitial sites(n = 4 or 5 per city). We selected the reference sites inparks or preserves within or near each city that werecomposed of native vegetation and minimally managed.Additional selection criteria included sites where wecould secure permission or sites that coincided withlong-term monitoring as part of the Long-Term Ecologi-cal Research (LTER) network. The reference sites repre-sented the historical vegetation types for each city,including oak/tulip poplar forest (BAL), northern hard-wood forest (BOS), coastal sage scrub (LA), pine rock-land and subtropical hardwood hammock (MIA),tallgrass prairie/oak savanna/mixed hardwood forest(MSP), and Sonoran desert (PHX). We identified candi-date interstitial sites across each city using prior knowl-edge of locations of greenways and the edges of
Xxxxx 2021 MACROECOLOGICAL PATTERNS OF URBAN BIRDS Article e02455; page 3
unmanaged natural vegetation that share at least oneborder with a residential neighborhood. Interstitial areasthat matched our criteria included: patches of naturalvegetation within the city (e.g., edges of public openspace or unmanaged parks, edges of public trails, publicwooded areas behind homes), or patches of natural vege-tation at the edge of the city, at the interface with sub-urban residential land, and at least 50 m2. We thenrandomly selected four or five sites per city.To maximize our regional-scale inference based on a
limited sample size per city, for our yard site selectionprocess, we controlled for some of the variation inherentin residential landscapes that might confound bird com-munity structure (Lerman and Warren 2011, Belaireet al. 2014). We limited the census block groups fromwhich we selected potential sites using Tapestry Segmen-tation data in ArcGIS (ESRI 2017) which categorizesUS neighborhoods into 67 distinct lifestyle groups basedon market research (“LifeModes”; Grove et al. 2006). Aswe aimed to sample yards from detached, single-familyhousing stock, with similar housing density, and occu-pied by residents with relatively similar median house-hold income (US$45,000 in MIA to US$105,000 inBOS; range reflects regional variation), we targeted the“Urban Periphery,” “Metro Cities,” and “SuburbanPeriphery” urbanization groups (n = 22 LifeModes). Weincluded houses that were at least 10 yr old to avoidimmature vegetation of very new developments (Losset al. 2009), and at least 0.5 km away from a park, golfcourse, or other open spaces to reduce the influence ofnon-residential habitat features (e.g., water features,large tracts of land). We used these criteria when select-ing the four yard types: two yard types included lawn-dominated management and two yard types includedconservation management.The two lawn-dominated yards included “high-input
lawns” (n = 4 per city; yards with at least 75% of thefront or back yard pervious area covered in turfgrass forwhich homeowners self-reported either contracting witha lawn-care company that applied fertilizer or self-applied comparably consistent rates of fertilizer), and“low-input lawns” (n = 4 per city; yards with at least75% of the front or back yard pervious area covered inturfgrass, with “do it yourself” yard care and no fertilizerapplication within the last year). Within the census blockgroups identified by the above criteria, we randomlyselected 50 parcels per city and visually assessed yardtype using Google imagery. We then sent fliers thatdescribed the project to the randomly selected lawn-dominated households and provided a link to an onlinequestionnaire. We asked whether the household used alawn-care company, whether the lawn had received fertil-izer in the past year, and whether they would like to “optin” to the study. For households who opted in, we thenrandomly selected four yards per city for each lawn cate-gory.The two conservation yards included “wildlife-
certified” (n = 4 per city; yards certified as a wildlife
habitat through the National Wildlife Federation’s(NWF) certification program (https://www.nwf.org/Garden-for-Wildlife/Certify) that included food, water,cover, breeding locations and sustainable practices), and“low-impact on hydrology” (n = 4 per city; yards withhydrological features, for example, rain gardens in tem-perate or tropical BAL, MIA and MSP, or drought-tolerant landscaping in arid LA and PHX). BOS did nothave a hydrological treatment because of the difficulty ofidentifying yards with these features in yards in this city.All sites were at least 1 km from other sites. For wildlife-certified yards, we contacted the NWF for a list ofaddresses for certified yards for each city that met theyard selection criteria above. The NWF contactedhouseholds, provided a description of the study, askedwhether the yard still contained habitat features andwhether the household would like to participate in thestudy. For households who opted in, we then randomlyselected four yards per city. For the low-impact onhydrology yards, we contacted water districts for eachmunicipality and asked for a list of at least 25 addressesfor parcels that have received a rebate for installing ahydrology feature (rain garden or xeriscape). Ininstances when we were unable to get addresses from thewater districts or when the municipality did not have arebate program, we used Google Earth to find homeswith visible rain garden-like structures in the front yardor back yards. We sent fliers to all homes fitting the cri-teria, with a questionnaire about the presence of thehydrology feature and an option to opt in to theresearch. We then randomly selected four yards per cityfor inclusion. Mean parcel size for all yard types was0.1052 (� 0.0728 standard deviation [SD]) ha. SeeAppendix S1 for additional detail on the site selectionworkflow and examples of the yards.We emphasize that the study design aimed to compare
the bird communities in each yard and park manage-ment type and not to test the effects of specific activitieswithin a management type (e.g., community responsesto fertilizer application). This study design was used aspart of a broader assessment of yard management andthe impacts on biodiversity, ecosystem function, andsocial governance (www.residentialmacrosystems.com).
Bird surveys
At each site, a trained observer conducted two limited50-m radius, 10-min point count surveys (Ralph et al.1993) divided into three intervals of 3 min and 20 s eachduring the breeding season (Mar–Apr for PHX and LA,Apr–May for MIA, and Jun–Jul for BAL, BOS andMSP). Counts were conducted in 2017 for PHX, BAL,BOS and MSP, and in 2018 for LA and MIA. For theyards, the center of the point count survey was in front ofthe house in a location that maximized yard coverage,including the backyard. In the interstitial and referencesites, the point was randomly centered within the otherdata collection areas. During the count, every individual
Article e02455; page 4 SUSANNAH B. LERMAN ET AL.Ecological Applications
Vol. 0, No. 0
bird visually or aurally detected was identified, assigned adistance category from the observer (0–10 m, 10–20 m,20–30 m, 30–40 m, 40–50 m), a cardinal direction, andfor the yard sites, whether it was located within the focalyard. As the point counts covered a 50-m radius area(7,854 m2), we also observed birds in neighboring yardsthat may have had different yard management from thefocal yard. Although the 50-m did not capture theentirety of the parks, we aimed to make relative compar-isons among the different sites within a comparable area.All visits were conducted within four hours of sunrise,
on days of low wind, and no precipitation. We con-ducted two visits per site, separated by at least 10 daysbetween surveys. Our three intervals during each of thetwo visits resulted in six repeated counts in which weused to model detection of individuals (e.g., Chandleret al. 2011, Hill and Lloyd 2017). We chose this methodover collapsing counts to site visits to maximize availabledata to inform detection probabilities while minimizingnumber of visits to private land (for efficiency) and timebetween visit (for site closure; Rota et al. 2009). Modelsrun using the closure method did not produce resultsthat were meaningfully different from those using sixrepeated counts. Because we were primarily interested inspecies using the habitat in the yards, we excluded spe-cies with large home ranges that were not territorial tothe immediate site, such as raptors and scavengers (e.g.,hawks, Accipitridae; vultures, Cathartidae, 0.39% ofobservations), wading birds (e.g., herons, Ardeidae,0.29% of observations), and aerial foragers (e.g., swifts,Apodidae, 1.40%). We also excluded observations ofbirds that could not be identified to species (i.e.,unknowns, 0.04% of observations) and migratory speciesobserved in regions for which they are not known tobreed (e.g., American redstart, Setophaga ruticilla, inMiami, 4.50%). See Appendix S2 for more informationon processing the final bird observation data set.
Neighborhood-scale land cover
We accounted for neighborhood-scale features notrepresented by the differences in our land managementtypes as these features also contributed to local birdcommunities by facilitating or restricting colonization(Lerman and Warren 2011). As proxies for the degree ofsurrounding urbanization and habitat availability, weused % impervious surface and % tree canopy within a1 km buffer surrounding each point count location(Daniels and Kirkpatrick 2006, Strohbach et al. 2013,Evans et al. 2017). These two variables were derivedfrom national maps of land cover surface for the conter-minous United States in 2011 at 30 m2 resolution as partof the National Land Cover Data (NLCD) set (Homeret al. 2015) (https://www.mrlc.gov/nlcd2011.php). Thecanopy cover represented the percentage of the treecanopy’s vertical projection that covers the ground. Weused R package raster (Hijmans 2018) to create buffersand extract surface values from all 30 m × 30 m pixels
within the 1 km-radius buffer in which each pixel wasassigned a % impervious surface and % tree canopy. Wethen took the mean value of all pixels within the bufferfor both impervious surface and tree cover separately foreach location.We inspected for potential multicollinearity between
impervious surface, tree canopy, and land managementtype. Impervious surface was moderately correlated withtree canopy (R2 = 0.33), and the variation inflation fac-tor (VIF) was 1.12, suggesting that including both termswould not introduce problems with multicollinearity(Zuur et al. 2010). Similarly, when comparing the landmanagement types with impervious surface and treecanopy, VIF was 1.37 and 1.00, respectively; therefore,we included all three terms in our model. Both treecanopy and impervious surface were centered and stan-dardized to the grand mean (across all cities) prior toanalysis (Kery and Royle 2016).
Statistical analysis
Community occupancy model.—To predict species occu-pancy among the six management types and ourneighborhood-scale features, we used a Bayesian hierar-chical community occupancy model (Kery and Royle2016, Devarajan et al. 2020, Tingley et al. 2020). Thismethod produces estimates of occupancy for each spe-cies that allowed for inference on both site-level commu-nity richness and composition and accounted forimperfect detection. We modeled occupancy of species kin site i within city c as a Bernoulli process in whichoccupancy was a function of the land management typeof the site, as well as covariates for the degree of sur-rounding impervious surface and tree canopy cover. Inour model, observation of a species was conditional onoccupancy probability (ψ: probability an individualresides in the site), inclusion probability (ω: the probabil-ity a species resides in the city) and detection probability(p the probability that an individual is detected by thesurveyor given ψ), the latter included a covariate of cal-endar date to allow detection to vary over the season dueto intrinsic variation in activities that influence detection(e.g. singing frequency over the breeding season; Tingleyand Beissinger 2013, Kery and Royle 2016).To account for differences in the total species assem-
blages among the six cities, we integrated a multiregioncomponent to the community model (Sutherland et al.2016). This model structure allowed the estimation ofspecies richness of different regions (i.e., γ-diversity) thatvaried in potential species pools due to intrinsic environ-mental features such as ecological biome and climate. Inthe model, each city had its own community assemblagethat we modeled separately but compared via our com-mon parameter of interest, the land management types(i.e., the two park and the four yard types) and theneighborhood-scale land cover variables (impervioussurface and tree canopy). By incorporating a multiregioncommunity model, species information and variance can
Xxxxx 2021 MACROECOLOGICAL PATTERNS OF URBAN BIRDS Article e02455; page 5
be shared across both sites and regions (Sutherland et al.2016). This approach allowed us to estimate city (e.g.,BOS, BAL, PHX, etc.) and site-specific (e.g., one of foursampled wildlife-managed yards in a given city) commu-nity species pools, determine the effect of land manage-ment within each city, and make region-wide inferencesabout the general trend of land management and landcover across all six cities, the latter being our primaryscale of inference. In a hierarchical multispecies occu-pancy model, species information and variance is sharedacross the community and improves estimates of rarelydetected species (Kery and Royle 2016). In a multiregionmodel, information is also shared across regions,improving estimates for species that are possible within aregion but never detected (Sutherland et al. 2016).Because some species do not have distributions thatoverlap all six cities, we also modified the inclusionparameter (w) by a 0|1 binary modifier for whether aspecies could be observed in a given city based on visu-ally assessing range maps in eBird, the Cornell Labora-tory of Ornithology’s online citizen science birdobservation repository (https://www.ebird.org) (Sullivanet al. 2009). In this way, occupancy estimates for speciesthat would never be expected to occur in a region werealways zero. For example, our model only allowedAbert’s towhee (Melozone aberti) to be estimated forsites within Phoenix, AZ as this bird had an inclusionparameter of zero in all other cities because its distribu-tion did not overlap the boundaries of those cities.Because true richness within a site could also includespecies that were never detected by any observer but maystill be present, we also modeled occupancy using aug-mented communities (Dorazio and Royle 2005) suchthat a “hypercommunity” included all species observedas well as additional, non-observed species with detec-tion rates of zero. This method extends our scope ofinference beyond the species observed at least onceacross the six cities to estimate true richness. We aug-mented the region-wide (i.e., across all cities) speciespool to include an extra 50 hypothetical species thatcould be present within all sites of each city to accountfor the possibility that species were present but neverobserved.Our occupancy model is composed of two hierarchical
levels:
Level 1. Detection process: detection as a function ofdate
Ycijk ∼ Bernoulli Zcik; pcijk� �
where Y is whether or not a species was observed for spe-cies k in city c at site i and visit j. This follows a Bernoullidistribution where Zcik is a latent variable representingthe true occurrence state of species k in site i within city
c conditional on occupancy (ψ) and p is the probabilityof successful detection (given occupancy). Detection (p)is a function of a logit-linear model that includes a ran-dom intercept a for species k in city c, and covariates oflinear date and quadratic date on detection to allow rela-tionships with date to be non-linear.
logit pcijk� �
¼ ack þ dateck þ date2ck
Level 2. Occupancy process: Species presence as afunction of local land management and neigh-borhood-scale land cover
Zcik ∼ Bernoulli wck∗ψcikð Þ
where the predicted occupancy of species k in city c atsite i (Zcik) follows a Bernoulli distribution and wherewck is the inclusion parameter that a species k is presentin city c and ψcik is the expected occupancy (ψ) as afunction of the logit-linear model:
logit ψcikð Þ ¼ β imperviousck þ β impervious2ck þ β tree canopyckþ β tree canopy2ck þ α land managementcikt
where land management type t is one of the six treat-ments: high-input lawn, low-input lawn, water conserva-tion, wildlife-certified, reference parks and interstitialparks. The term impervious is the mean % impervioussurface and tree canopy is the mean % tree canopy in the1 km buffer. The squared terms allow relationships withimpervious and tree canopy to also be non-linear. Theeffect of land management was modeled as both a com-munity (i.e., region-specific) and species-specific meanresponse (μ) to land management type t as a normal dis-tribution (N) pulled from a global (i.e., all regions) meanand precision. We accounted for within-city inherentvariability between sites of land management type t bymodeling a site-specific response of each species (i), ineach city to each land management type (Gallo et al.2017), which was informed by a mean response of thatspecies to a management type.
μ globalt ∼ Logistic 0, 1ð Þ
μ communityct ∼ N μ globalt, τtð Þ
μ speciesckt ∼ N μ communityct, τctð Þ
α land managementcik ∼ N μ speciesckt½ci�, τckt½ci�� �
In our model, occurrence and detection could vary byregion and by species within a region, such that a givenspecies k could have different responses within eachregion to date, land cover, or land management. For alloccupancy hyperparameters, we specified a weakly
Article e02455; page 6 SUSANNAH B. LERMAN ET AL.Ecological Applications
Vol. 0, No. 0
informative logistic (0,1) prior distribution (Northrupand Gerber 2018) and non-informative Gamma (0.1,0.1)prior distributions for precision.
Model specifications and assessing fit.—We fitted ourmodel to estimate posterior distributions for eachparameter using a Markov Chain Monte Carlo(MCMC) method implemented in JAGS v.4.3.0 (Plum-mer 2003). We ran 300,000 iterations with a 25,000-iteration adaption phase, 25,000 burn-in, six parallelchains, and a thinning interval of 10. This analysis wasconducted with parallelization via the jagsUI package(Kellner 2018) using R version 3.5.1 (R Core Team2018). We assessed chain convergence by confirming thatthe Gelman-Rubin diagnostic statistic (R-hat) was <1.1(Gelman and Rubin 1992), visually inspecting traceplots,and ensuring sufficient number of effective samples. Wealso considered model fit using a posterior predictivecheck based on a chi-square discrepancy (Kery andRoyle 2016).
Derived community metrics.—1. Species and functionalguild richness.—To determine which site-level responsesto use in comparisons with management types, impervi-ous surface, and tree canopy, we used the occupancyestimates for each species from the posterior draws ofthe MCMC runs. We include the posterior distributionsof occupancy parameters for each species in each city inAppendix S3. Using estimates from these parameters,we derived several community metrics. For the estimatedtotal species pool for each metropolitan area (γ-diversity), we summed the city-specific inclusion param-eter w. For the estimated species richness of each site (α-diversity) at each iteration we summed the occupancy ofall predicted species (the presence or absence of a spe-cies; Z-matrix) as site richness and took the mean rich-ness and SD of all iterations.We were also interested in whether some land man-
agement types may filter species of functional guildsthat are more sensitive to habitat quality. To look atspecies richness within functional guilds, we used thepredicted presence/absence of each species in eachland management type at each iteration. We thengrouped species by guild attributes and considered thenumber of species within the following functionalguilds in each site: insectivorous diet, migratorybehavior, and origin (native or non-native). Weacquired diet from the EltonTraits 1.0 database (Wil-man et al. 2014) and origin and migratory behaviorfrom Rodewald (2017).
2. Conservation scores.—Because species differ in theirsensitivity to land-use conversion (i.e., habitat lossand alteration from residential development; Blair1996), we assessed whether the “conservation score”of the bird community differed between the landmanagement types. To quantify, we used the Partnersin Flight Avian Conservation Assessment Database
(Will et al. 2019) to assign each species a score basedon its population status, distribution range, and lifehistory traits (Smith et al. 2013). Each species wasassigned an ordinal value between 1 and 5 in increas-ing conservation importance, where 1 represented spe-cies of low concern and 5 represented highest concern(e.g., endangered species, see Nuttle et al. 2003 forspecific criteria for the index). Non-native species(e.g., introduced to the United States) were assigned avalue of zero. For each iteration, we multiplied the Z-matrix (presence/absence of a species) by the conser-vation index for each species and calculated thesummed conservation score of the bird community ata site. We then derived a posterior mean conservationscore and SD across all iterations for each site ofeach land management type.
3. Public interest scores.—We were also interested inwhether public interest in bird communities varied byland management types. We defined public interest asa desire to learn more about observed bird species bymembers of the public. To measure public interest in abird species, we used the “popularity” index for NorthAmerican birds from Schuetz and Johnston (2019). Inshort, they defined the “popularity” of a bird speciesas the residuals of a regression between interest in abird species (i.e., how often the full common name ofa bird is searched for based on Google trend data,https://trends.google.com) and how often that bird spe-cies is encountered via data from complete checklists(i.e., all birds seen, including common species) submit-ted to eBird (Sullivan et al. 2009). Positive scores indi-cate that a bird was searched for more often thanpredicted from encounter rates (see Schuetz and John-ston 2019 for additional details). For example, speciesthat are colorful, large and charismatic, visit feeders orprovide cultural service often have high public interest(Schuetz and Johnston 2019). We recognize that Goo-gle searches of bird species names may only sample asubset of the US population that encounters birds, andsearch trends do not contain qualitative informationabout why a species was searched. However, thismethod provides the most accessible and comprehen-sive measure of public interest in individual bird spe-cies at a national scale. The popularity index rangedfrom −1.56 (Abert’s towhee, Pipilo aberti) to 3.56(Wild Turkey, Meleagris gallopavo) and distribution ofthese scores was unaffected by the exclusion of speciesnot well sampled by point counts prior to analysis. Ateach iteration, we multiplied the Z-matrix by the pop-ularity index for each species at each site and deter-mined the summed popularity of the bird community.For species that were missing from the Schuetz andJohnston (2019) archived data (six species, mostlyPsittacidae), we substituted the mean popularity forthe family (see supplemental material for species). Foreach site, we derived the posterior mean communitypopularity and SD.
Xxxxx 2021 MACROECOLOGICAL PATTERNS OF URBAN BIRDS Article e02455; page 7
4. Community turnover.—To determine whether someland management types contained a more heterogenousbird community than others, we compared city-wideturnover in community composition (i.e., β-diversity)among land management types within and across cities.We used our Z-matrix for each site to estimate a metricof community turnover based on presence-absence data(i.e., Sørensen–Dice index, S) (Koleff et al. 2003, Keryand Royle 2016) between all site pairs within a givenmanagement type. For example, turnover between birdcommunities in site i = a and site i = b of managementtype (t) “wildlife yard” in city c were compared as:
Scti ¼ 1� 2∗∑abct¼1Zcti¼a, Zcti¼b
Ncti¼a þNcti¼b
where N is the number of species in the community. HighS values indicated high community turnover (e.g., birdcommunities were more heterogeneous across sampledareas) and low values indicated low community turnover(e.g., bird communities were more homogenous acrosssampled areas). Species observed in more than one citycould also contribute to continental-wide homogeniza-tion; therefore, we also looked at S indices between spe-cies assemblages within a land management type andacross different cities as well (e.g., pairwise comparisonof a wildlife yard in BOS with a wildlife yard in PHX).We also calculated species accumulation curves for thesix land management types at a continental scale to linkhow species richness scaled with community turnover.Using the Z-matrix from our occupancy model, we firstrandomized the order of sites, and then calculated thetotal supported species, given the number of additionalspecies, from 1 to 20 sites, for each land managementtype. We did this for each iteration from the model,determined the mean total species over all iterations,and plotted a smoothed logistic curve to visually assessdifferences in species richness as sampled locationsincreased.
Community difference models for hypothesis tests.—Wetested whether community species richness (α-diversity), functional guild richness (i.e., insectivore,migratory, native origin), conservation and public inter-est score, and turnover differed among our six landmanagement types and explored the relationships withneighborhood-scale impervious surface and treecanopy percentages. For each site, we used the meanposterior community measure (Y; i.e., species richness,etc.) as the response variable in a separate, complemen-tary Bayesian linear mixed model. To account foruncertainty in our estimates of species richness fromthe prior occupancy model, we propagated uncertaintyof each derived community measure by including theposterior estimates of the reciprocal squared standarderror as a residual component in the second model ( 1σ2;Kery and Royle 2016). For all comparisons except forcontinental-wide turnover, we included city as a
random effect in the model. The model for continentalturnover did not include any random effects becausecomparisons were made across cities. We assumed thateach city would have a specific trend in relation to eachof our parameters; therefore, we allowed both slopesand intercepts to be random and pulled from a region-wide hyperparameter.
μβregion ∼ N μ, τð Þ
βcity ∼ N μβregion, τ� �
Y species richness ∼ α5cityðland managementÞ∗land managementsiteþ β1city∗impervioussiteþβ2city∗impervious2siteþβ3city∗tree canopysite þ β4city∗tree canopy2siteþɛsite
The same model structure was used for subsequentmodels of insectivore richness, migratory species richness,native species richness, community turnover and conserva-tion, and public interest scores. We assessed distributionsof each of our responses using histogram shaped QQ plotsand used different error distributions for our separatemodels appropriate to the response of interest that alsoaccommodated our estimates of precision. Species rich-ness, community turnover, and public interest scores werenormally distributed and modeled using a normal distri-bution (function dnorm) with a mean and SD for each sitefor each metric. Insectivore richness, migratory bird rich-ness, non-native bird richness and conservation scoreswere bounded by zero and were modeled using a log-normal distribution (function dlnorm) with a mean valueand the log of the SD for each site. To make model predic-tions along our neighborhood-scale variables, we used val-ues in between the minimum and maximum valuesobserved for the city to avoid extrapolating past valuesthat were not trained by the data. Community differencemodels were fitted using the sameMCMC techniques withparallelization described above in the occupancy model.We ran 500,000 iterations with a 250,000-iteration adap-tion phase, 250,000 burn-in, three parallel chains, and athinning interval of 10. We assessed chain convergenceagain using R-hat, traceplots, and effective sample sizesand checked model fit using the chi-square statistic.
RESULTS
Summary
During our 2017–2018 surveys we observed 8,127individuals of 161 bird species. After discarding observa-tions of species that did not meet our criteria (AppendixS2), we analyzed occupancy of 118 bird species in 151sites across the six cities with a total of 906 samplingoccasions in our final analysis. Of the 118 species, 57were insectivores, 65 were migratory, and 12 were non-native. The most common conservation score was 1 and
Article e02455; page 8 SUSANNAH B. LERMAN ET AL.Ecological Applications
Vol. 0, No. 0
the average popularity score was 0.06 � 0.70. For a fullaccount of all species detected, their associated func-tional traits and diversity scores, see Appendix S4: TableS1. Estimated city species pools (γ-diversity) were higherthan those observed (BAL estimated 34, CI: 32–42;observed 32; BOS estimated 49, CI: 39–61; observed 36;LA estimated 49, CI: 44–56; observed 42; Miami esti-mated 36, CI: 29–43; observed 25; MSP estimated 51,CI: 47–56; observed 46; PHX estimated 40, CI: 35–48;observed 32; Appendix S3: Fig. S1).
Metacommunity occupancy models
Hyperparameters from our occupancy models indicatedthat, across cities, both neighborhood-scale and local-scale variables influenced the occupancy of the metacom-munity, albeit with high uncertainty due to variance acrossthe community (Appendix S3: Figs. S2–S6). Occupancywas negatively influenced by impervious surface at bothlow (impervious: −1.71 � 1.71 SD, 90% CI −3.91, 0.40)and high (impervious2: mean: −1.80 � 1.50 SD, 90% CI−3.73, −0.01) impervious cover, however credible intervalsof the relationship with low impervious surface cover over-lapped zero (Appendix S3: Fig. S2). There was negligibleinfluence of tree canopies on occupancy at low (treecanopy: 0.42 � 1.68, 90% CI −1.62, 2.53) and high (treecanopy2: −1.13 � 1.81, 90% CI −3.42, 1.06) canopy cover(Appendix S3: Fig. S3). For both variables, relationshipsbetween neighborhood cover and occupancy variedamong species and among cities. For example, at the cityscale, negative relationships with impervious surface weremost apparent for BAL, and BOS at low impervious coverand BOS at high impervious cover (Appendix S3: Fig.S2). Positive relationships between tree canopy and occu-pancy were most apparent in MSP and LA (Appendix S3:Fig. S3). Across cities, mean occupancy of the metacom-munity was highest in high-input lawns (0.48) and lowestin interstitial parks (0.09). For species-specific occupancyfor each land management type in each city, and
relationships with neighborhood-scale land cover, seeAppendix S3: Figs. S8–S31.
Derived community metrics
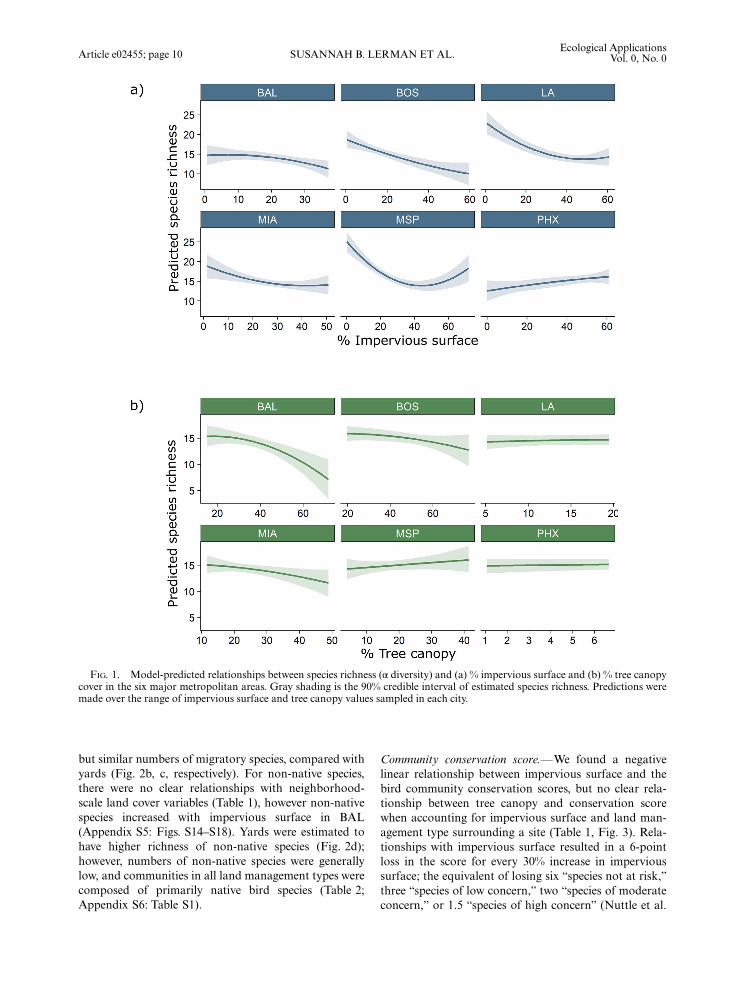
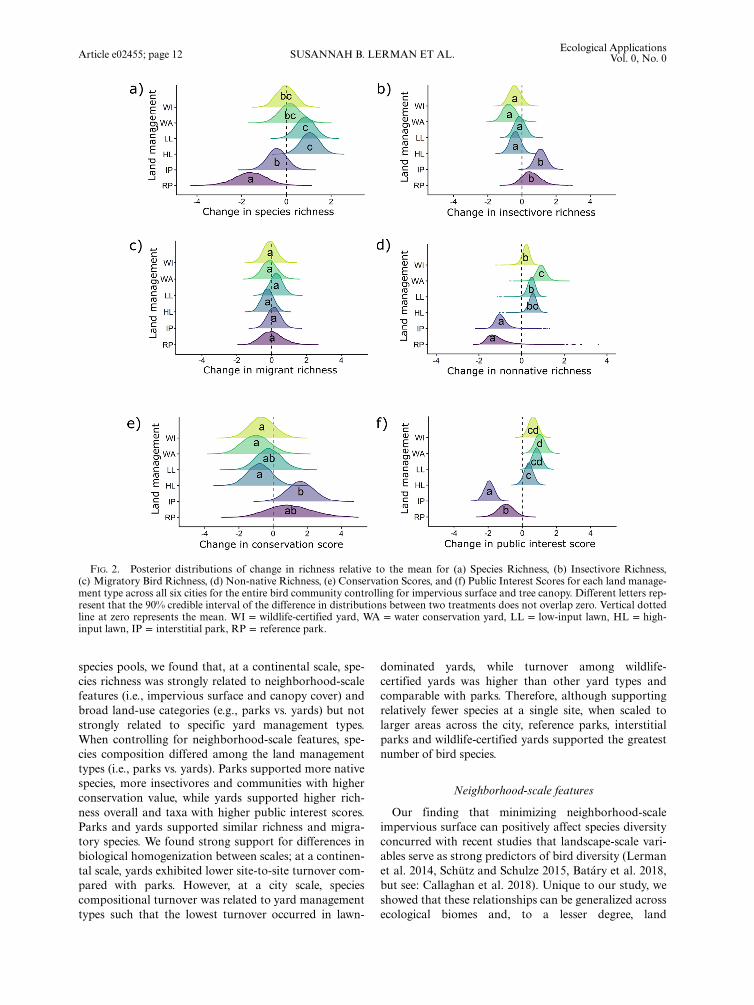
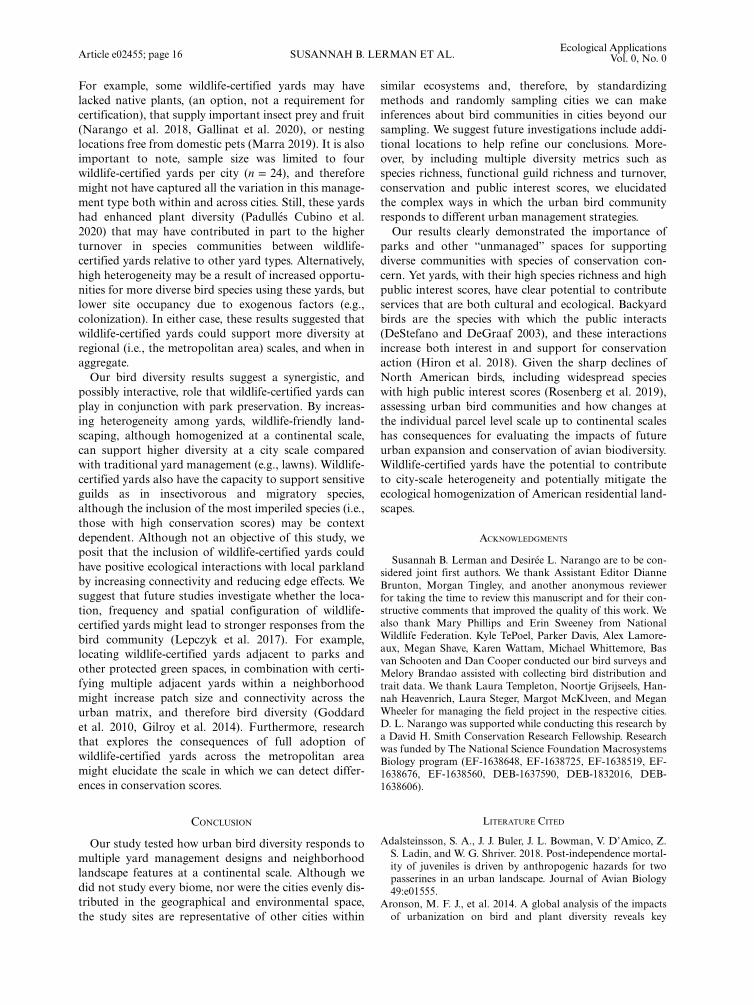
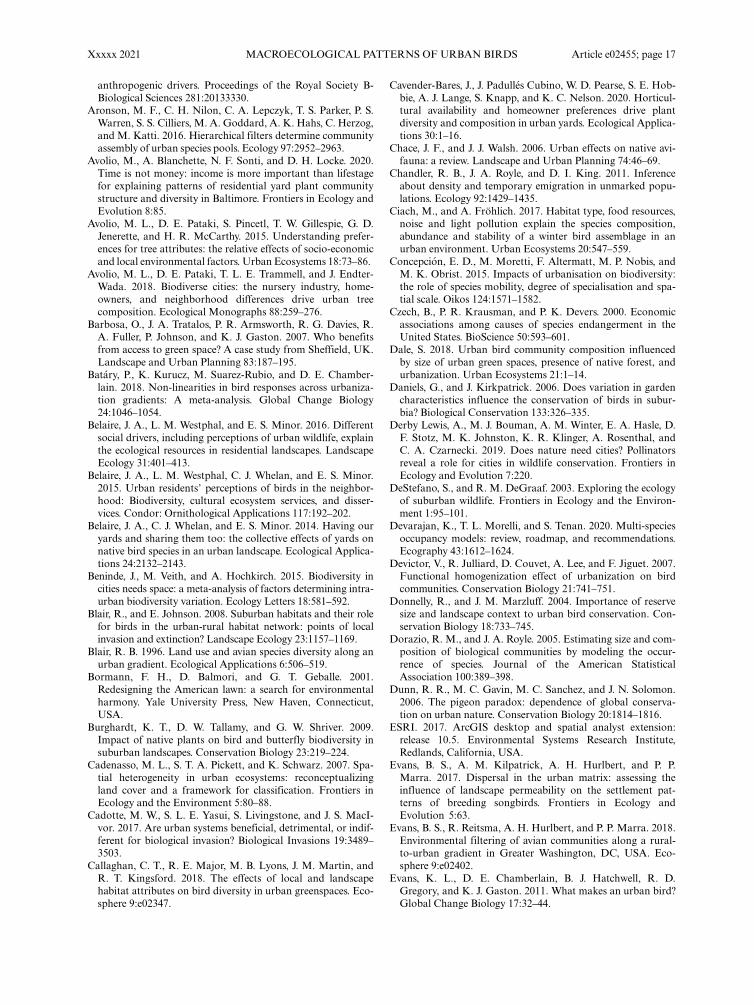
Species richness.—At a continental scale, species rich-ness was linearly and inversely related to impervious sur-face cover (Table 1, Fig. 1a) such that approximately 2.5species were lost for each 10% increase in impervioussurface. A negative relationship was apparent in five outof six cities with a positive relationship in PHX (Appen-dix S5: Fig. S1). There was no effect of tree canopycover on species richness (Table 1, Fig. 1b; AppendixS5: Fig. S2). After accounting for neighborhood-scale(1 km) impervious surface and tree canopy cover acrosscities, yards, particularly both lawn types, had more spe-cies than both park types across cities (Table 2, Fig. 2a).With few exceptions, these patterns held in all cities(Appendix S5: Fig. S3).
Functional guild richness.—Across cities, we found weaklinear negative relationships between impervious surfaceand both insectivore and migratory bird richness(Table 1; Appendix S5: Figs. S4, S5, S9, S10) and a weakpositive linear relationships for insectivorous birds withtree canopy (Table 1; Appendix S5: Figs. S6, S7, S11,S12). Approximately one insectivore and 1.5 migratorybirds were lost for every 20% increase in impervious sur-face and one insectivore gained for every 10% increase intree canopy. For insectivorous birds, negative relation-ships of impervious surface were most apparent in MSPand LA, and positive relationships between tree canopyobserved in MSP, BOS and BAL. For migratory birds,negative relationships of impervious surface were mostapparent in MSP, BOS and BAL. We found differencesin guild richness among the land management types forinsectivores but not for migratory birds after controllingfor neighborhood-scale variables (Table 2; Appendix S5:Figs. S8, S13). Both park types had more insectivores,
TABLE 1. Mean β estimate � SD across all cities for the entire bird community in relation to the two land cover variablesincluding both linear and quadratic terms.
Response Impervious surface Impervious surface2 Tree canopy Tree canopy2
SpeciesRichness
−2.03 � 1.10 (−3.32, −0.75) 0.51 � 0.78 (−0.41, 1.37) −0.11 � 1.10 (−1.40, 1.12) −0.44 � 0.83 (−1.37, 0.53)
InsectivoreRichness
−0.14 � 0.14 (−0.31, 0.03) 0.01 � 0.14 (−0.16, 0.17) 0.17 � 0.21 (−0.07, 0.41) −0.17 � 0.19 (−0.39, 0.05)
MigratoryBirdRichness
−0.16 � 0.14 (−0.33, 0.01) 0.00 � 0.13 (−0.15, 0.15) 0.13 � 0.18 (−0.08, 0.35) −0.10 � 0.19 (−0.32, 0.12)
Non-nativeRichness
−0.03 � 0.25 (−0.32, 0.26) −0.09 � 0.16 (−0.27, 0.10) −0.13 � 0.29 (−0.46, 0.20) 0.14 � 0.24 (−0.14, 0.43)
ConservationScore
−0.17 � 0.14 (−0.33, −0.01) 0.02 � 0.12 (−0.12, 0.16) 0.08 � 0.18 (−0.13, 0.29) −0.12 � 0.17 (−0.32, 0.08)
Public InterestScore
0.11 � 0.51 (−0.48, 0.71) −0.06 � 0.33 (−0.44, 0.34) 1.87 � 2.06 (−0.41, 4.19) 0.20 � 0.84 (−0.50, 0.92)
Note: Parameters in bold have 80% credible intervals that do not overlap 0.
Xxxxx 2021 MACROECOLOGICAL PATTERNS OF URBAN BIRDS Article e02455; page 9
but similar numbers of migratory species, compared withyards (Fig. 2b, c, respectively). For non-native species,there were no clear relationships with neighborhood-scale land cover variables (Table 1), however non-nativespecies increased with impervious surface in BAL(Appendix S5: Figs. S14–S18). Yards were estimated tohave higher richness of non-native species (Fig. 2d);however, numbers of non-native species were generallylow, and communities in all land management types werecomposed of primarily native bird species (Table 2;Appendix S6: Table S1).
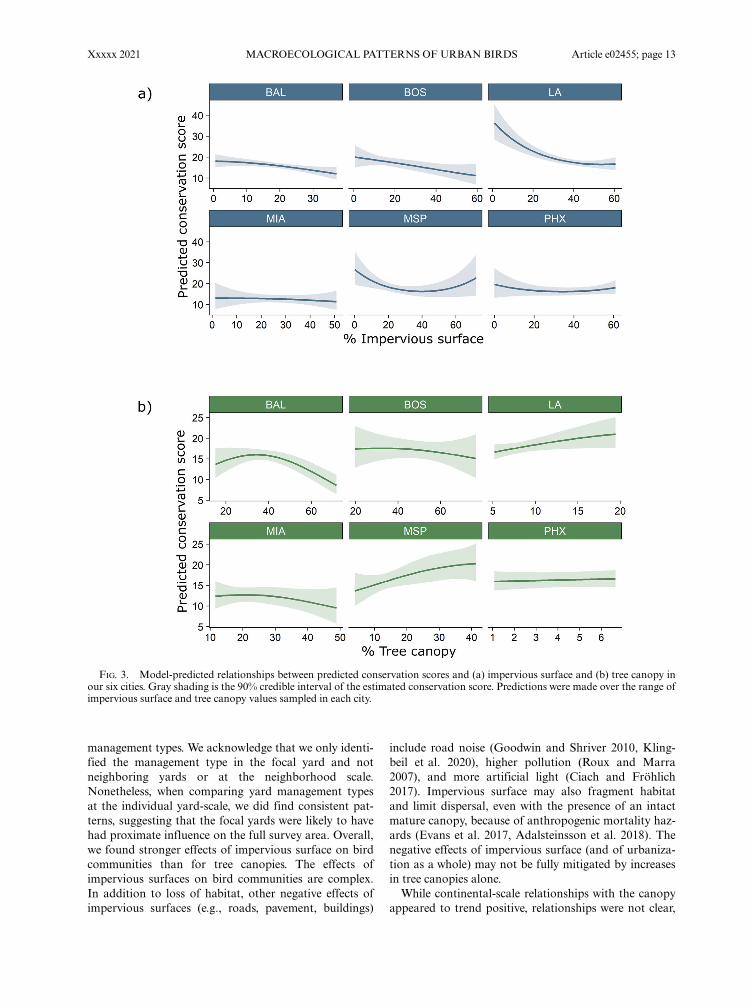
Community conservation score.—We found a negativelinear relationship between impervious surface and thebird community conservation scores, but no clear rela-tionship between tree canopy and conservation scorewhen accounting for impervious surface and land man-agement type surrounding a site (Table 1, Fig. 3). Rela-tionships with impervious surface resulted in a 6-pointloss in the score for every 30% increase in impervioussurface; the equivalent of losing six “species not at risk,”three “species of low concern,” two “species of moderateconcern,” or 1.5 “species of high concern” (Nuttle et al.
FIG. 1. Model-predicted relationships between species richness (α diversity) and (a) % impervious surface and (b) % tree canopycover in the six major metropolitan areas. Gray shading is the 90% credible interval of estimated species richness. Predictions weremade over the range of impervious surface and tree canopy values sampled in each city.
Article e02455; page 10 SUSANNAH B. LERMAN ET AL.Ecological Applications
Vol. 0, No. 0
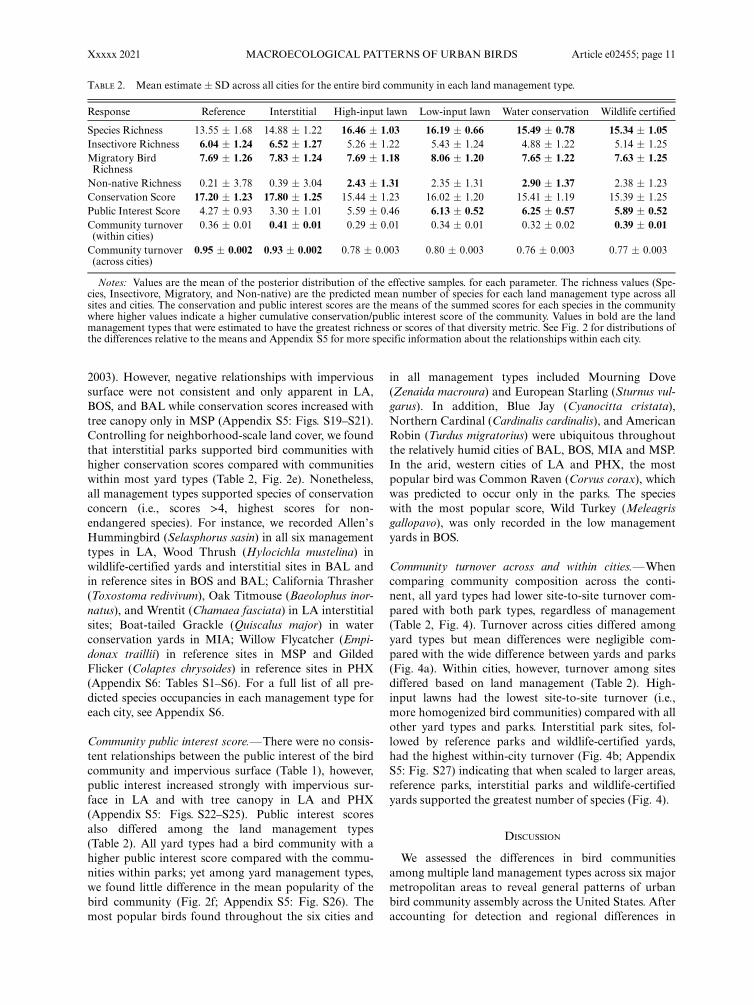
2003). However, negative relationships with impervioussurface were not consistent and only apparent in LA,BOS, and BAL while conservation scores increased withtree canopy only in MSP (Appendix S5: Figs. S19–S21).Controlling for neighborhood-scale land cover, we foundthat interstitial parks supported bird communities withhigher conservation scores compared with communitieswithin most yard types (Table 2, Fig. 2e). Nonetheless,all management types supported species of conservationconcern (i.e., scores >4, highest scores for non-endangered species). For instance, we recorded Allen’sHummingbird (Selasphorus sasin) in all six managementtypes in LA, Wood Thrush (Hylocichla mustelina) inwildlife-certified yards and interstitial sites in BAL andin reference sites in BOS and BAL; California Thrasher(Toxostoma redivivum), Oak Titmouse (Baeolophus inor-natus), and Wrentit (Chamaea fasciata) in LA interstitialsites; Boat-tailed Grackle (Quiscalus major) in waterconservation yards in MIA; Willow Flycatcher (Empi-donax traillii) in reference sites in MSP and GildedFlicker (Colaptes chrysoides) in reference sites in PHX(Appendix S6: Tables S1–S6). For a full list of all pre-dicted species occupancies in each management type foreach city, see Appendix S6.
Community public interest score.—There were no consis-tent relationships between the public interest of the birdcommunity and impervious surface (Table 1), however,public interest increased strongly with impervious sur-face in LA and with tree canopy in LA and PHX(Appendix S5: Figs. S22–S25). Public interest scoresalso differed among the land management types(Table 2). All yard types had a bird community with ahigher public interest score compared with the commu-nities within parks; yet among yard management types,we found little difference in the mean popularity of thebird community (Fig. 2f; Appendix S5: Fig. S26). Themost popular birds found throughout the six cities and
in all management types included Mourning Dove(Zenaida macroura) and European Starling (Sturnus vul-garus). In addition, Blue Jay (Cyanocitta cristata),Northern Cardinal (Cardinalis cardinalis), and AmericanRobin (Turdus migratorius) were ubiquitous throughoutthe relatively humid cities of BAL, BOS, MIA and MSP.In the arid, western cities of LA and PHX, the mostpopular bird was Common Raven (Corvus corax), whichwas predicted to occur only in the parks. The specieswith the most popular score, Wild Turkey (Meleagrisgallopavo), was only recorded in the low managementyards in BOS.
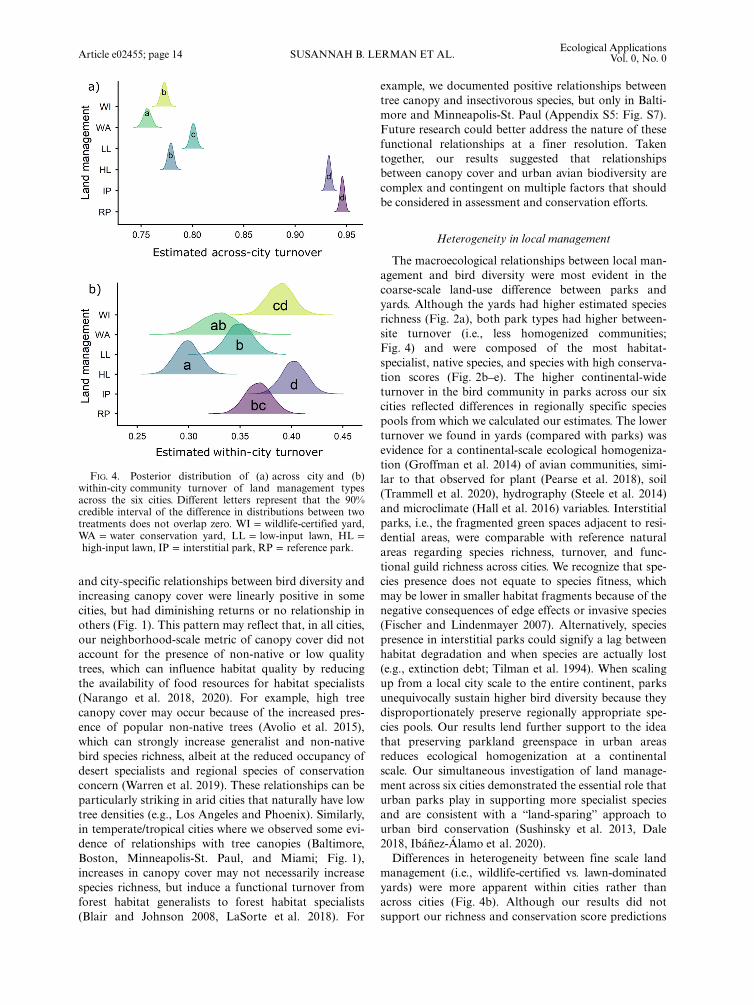
Community turnover across and within cities.—Whencomparing community composition across the conti-nent, all yard types had lower site-to-site turnover com-pared with both park types, regardless of management(Table 2, Fig. 4). Turnover across cities differed amongyard types but mean differences were negligible com-pared with the wide difference between yards and parks(Fig. 4a). Within cities, however, turnover among sitesdiffered based on land management (Table 2). High-input lawns had the lowest site-to-site turnover (i.e.,more homogenized bird communities) compared with allother yard types and parks. Interstitial park sites, fol-lowed by reference parks and wildlife-certified yards,had the highest within-city turnover (Fig. 4b; AppendixS5: Fig. S27) indicating that when scaled to larger areas,reference parks, interstitial parks and wildlife-certifiedyards supported the greatest number of species (Fig. 4).
DISCUSSION
We assessed the differences in bird communitiesamong multiple land management types across six majormetropolitan areas to reveal general patterns of urbanbird community assembly across the United States. Afteraccounting for detection and regional differences in
TABLE 2. Mean estimate � SD across all cities for the entire bird community in each land management type.
Response Reference Interstitial High-input lawn Low-input lawn Water conservation Wildlife certified
Species Richness 13.55 � 1.68 14.88 � 1.22 16.46 � 1.03 16.19 � 0.66 15.49 � 0.78 15.34 � 1.05Insectivore Richness 6.04 � 1.24 6.52 � 1.27 5.26 � 1.22 5.43 � 1.24 4.88 � 1.22 5.14 � 1.25Migratory BirdRichness
7.69 � 1.26 7.83 � 1.24 7.69 � 1.18 8.06 � 1.20 7.65 � 1.22 7.63 � 1.25
Non-native Richness 0.21 � 3.78 0.39 � 3.04 2.43 � 1.31 2.35 � 1.31 2.90 � 1.37 2.38 � 1.23Conservation Score 17.20 � 1.23 17.80 � 1.25 15.44 � 1.23 16.02 � 1.20 15.41 � 1.19 15.39 � 1.25Public Interest Score 4.27 � 0.93 3.30 � 1.01 5.59 � 0.46 6.13 � 0.52 6.25 � 0.57 5.89 � 0.52Community turnover(within cities)
0.36 � 0.01 0.41 � 0.01 0.29 � 0.01 0.34 � 0.01 0.32 � 0.02 0.39 � 0.01
Community turnover(across cities)
0.95 � 0.002 0.93 � 0.002 0.78 � 0.003 0.80 � 0.003 0.76 � 0.003 0.77 � 0.003
Notes: Values are the mean of the posterior distribution of the effective samples. for each parameter. The richness values (Spe-cies, Insectivore, Migratory, and Non-native) are the predicted mean number of species for each land management type across allsites and cities. The conservation and public interest scores are the means of the summed scores for each species in the communitywhere higher values indicate a higher cumulative conservation/public interest score of the community. Values in bold are the landmanagement types that were estimated to have the greatest richness or scores of that diversity metric. See Fig. 2 for distributions ofthe differences relative to the means and Appendix S5 for more specific information about the relationships within each city.
Xxxxx 2021 MACROECOLOGICAL PATTERNS OF URBAN BIRDS Article e02455; page 11
species pools, we found that, at a continental scale, spe-cies richness was strongly related to neighborhood-scalefeatures (i.e., impervious surface and canopy cover) andbroad land-use categories (e.g., parks vs. yards) but notstrongly related to specific yard management types.When controlling for neighborhood-scale features, spe-cies composition differed among the land managementtypes (i.e., parks vs. yards). Parks supported more nativespecies, more insectivores and communities with higherconservation value, while yards supported higher rich-ness overall and taxa with higher public interest scores.Parks and yards supported similar richness and migra-tory species. We found strong support for differences inbiological homogenization between scales; at a continen-tal scale, yards exhibited lower site-to-site turnover com-pared with parks. However, at a city scale, speciescompositional turnover was related to yard managementtypes such that the lowest turnover occurred in lawn-
dominated yards, while turnover among wildlife-certified yards was higher than other yard types andcomparable with parks. Therefore, although supportingrelatively fewer species at a single site, when scaled tolarger areas across the city, reference parks, interstitialparks and wildlife-certified yards supported the greatestnumber of bird species.
Neighborhood-scale features
Our finding that minimizing neighborhood-scaleimpervious surface can positively affect species diversityconcurred with recent studies that landscape-scale vari-ables serve as strong predictors of bird diversity (Lermanet al. 2014, Schutz and Schulze 2015, Batary et al. 2018,but see: Callaghan et al. 2018). Unique to our study, weshowed that these relationships can be generalized acrossecological biomes and, to a lesser degree, land
FIG. 2. Posterior distributions of change in richness relative to the mean for (a) Species Richness, (b) Insectivore Richness,(c) Migratory Bird Richness, (d) Non-native Richness, (e) Conservation Scores, and (f) Public Interest Scores for each land manage-ment type across all six cities for the entire bird community controlling for impervious surface and tree canopy. Different letters rep-resent that the 90% credible interval of the difference in distributions between two treatments does not overlap zero. Vertical dottedline at zero represents the mean. WI = wildlife-certified yard, WA = water conservation yard, LL = low-input lawn, HL = high-input lawn, IP = interstitial park, RP = reference park.
Article e02455; page 12 SUSANNAH B. LERMAN ET AL.Ecological Applications
Vol. 0, No. 0
management types. We acknowledge that we only identi-fied the management type in the focal yard and notneighboring yards or at the neighborhood scale.Nonetheless, when comparing yard management typesat the individual yard-scale, we did find consistent pat-terns, suggesting that the focal yards were likely to havehad proximate influence on the full survey area. Overall,we found stronger effects of impervious surface on birdcommunities than for tree canopies. The effects ofimpervious surfaces on bird communities are complex.In addition to loss of habitat, other negative effects ofimpervious surfaces (e.g., roads, pavement, buildings)
include road noise (Goodwin and Shriver 2010, Kling-beil et al. 2020), higher pollution (Roux and Marra2007), and more artificial light (Ciach and Frohlich2017). Impervious surface may also fragment habitatand limit dispersal, even with the presence of an intactmature canopy, because of anthropogenic mortality haz-ards (Evans et al. 2017, Adalsteinsson et al. 2018). Thenegative effects of impervious surface (and of urbaniza-tion as a whole) may not be fully mitigated by increasesin tree canopies alone.While continental-scale relationships with the canopy
appeared to trend positive, relationships were not clear,
FIG. 3. Model-predicted relationships between predicted conservation scores and (a) impervious surface and (b) tree canopy inour six cities. Gray shading is the 90% credible interval of the estimated conservation score. Predictions were made over the range ofimpervious surface and tree canopy values sampled in each city.
Xxxxx 2021 MACROECOLOGICAL PATTERNS OF URBAN BIRDS Article e02455; page 13
and city-specific relationships between bird diversity andincreasing canopy cover were linearly positive in somecities, but had diminishing returns or no relationship inothers (Fig. 1). This pattern may reflect that, in all cities,our neighborhood-scale metric of canopy cover did notaccount for the presence of non-native or low qualitytrees, which can influence habitat quality by reducingthe availability of food resources for habitat specialists(Narango et al. 2018, 2020). For example, high treecanopy cover may occur because of the increased pres-ence of popular non-native trees (Avolio et al. 2015),which can strongly increase generalist and non-nativebird species richness, albeit at the reduced occupancy ofdesert specialists and regional species of conservationconcern (Warren et al. 2019). These relationships can beparticularly striking in arid cities that naturally have lowtree densities (e.g., Los Angeles and Phoenix). Similarly,in temperate/tropical cities where we observed some evi-dence of relationships with tree canopies (Baltimore,Boston, Minneapolis-St. Paul, and Miami; Fig. 1),increases in canopy cover may not necessarily increasespecies richness, but induce a functional turnover fromforest habitat generalists to forest habitat specialists(Blair and Johnson 2008, LaSorte et al. 2018). For
example, we documented positive relationships betweentree canopy and insectivorous species, but only in Balti-more and Minneapolis-St. Paul (Appendix S5: Fig. S7).Future research could better address the nature of thesefunctional relationships at a finer resolution. Takentogether, our results suggested that relationshipsbetween canopy cover and urban avian biodiversity arecomplex and contingent on multiple factors that shouldbe considered in assessment and conservation efforts.
Heterogeneity in local management
The macroecological relationships between local man-agement and bird diversity were most evident in thecoarse-scale land-use difference between parks andyards. Although the yards had higher estimated speciesrichness (Fig. 2a), both park types had higher between-site turnover (i.e., less homogenized communities;Fig. 4) and were composed of the most habitat-specialist, native species, and species with high conserva-tion scores (Fig. 2b–e). The higher continental-wideturnover in the bird community in parks across our sixcities reflected differences in regionally specific speciespools from which we calculated our estimates. The lowerturnover we found in yards (compared with parks) wasevidence for a continental-scale ecological homogeniza-tion (Groffman et al. 2014) of avian communities, simi-lar to that observed for plant (Pearse et al. 2018), soil(Trammell et al. 2020), hydrography (Steele et al. 2014)and microclimate (Hall et al. 2016) variables. Interstitialparks, i.e., the fragmented green spaces adjacent to resi-dential areas, were comparable with reference naturalareas regarding species richness, turnover, and func-tional guild richness across cities. We recognize that spe-cies presence does not equate to species fitness, whichmay be lower in smaller habitat fragments because of thenegative consequences of edge effects or invasive species(Fischer and Lindenmayer 2007). Alternatively, speciespresence in interstitial parks could signify a lag betweenhabitat degradation and when species are actually lost(e.g., extinction debt; Tilman et al. 1994). When scalingup from a local city scale to the entire continent, parksunequivocally sustain higher bird diversity because theydisproportionately preserve regionally appropriate spe-cies pools. Our results lend further support to the ideathat preserving parkland greenspace in urban areasreduces ecological homogenization at a continentalscale. Our simultaneous investigation of land manage-ment across six cities demonstrated the essential role thaturban parks play in supporting more specialist speciesand are consistent with a “land-sparing” approach tourban bird conservation (Sushinsky et al. 2013, Dale2018, Ibanez-Alamo et al. 2020).Differences in heterogeneity between fine scale land
management (i.e., wildlife-certified vs. lawn-dominatedyards) were more apparent within cities rather thanacross cities (Fig. 4b). Although our results did notsupport our richness and conservation score predictions
FIG. 4. Posterior distribution of (a) across city and (b)within-city community turnover of land management typesacross the six cities. Different letters represent that the 90%credible interval of the difference in distributions between twotreatments does not overlap zero. WI = wildlife-certified yard,WA = water conservation yard, LL = low-input lawn, HL =high-input lawn, IP = interstitial park, RP = reference park.
Article e02455; page 14 SUSANNAH B. LERMAN ET AL.Ecological Applications
Vol. 0, No. 0
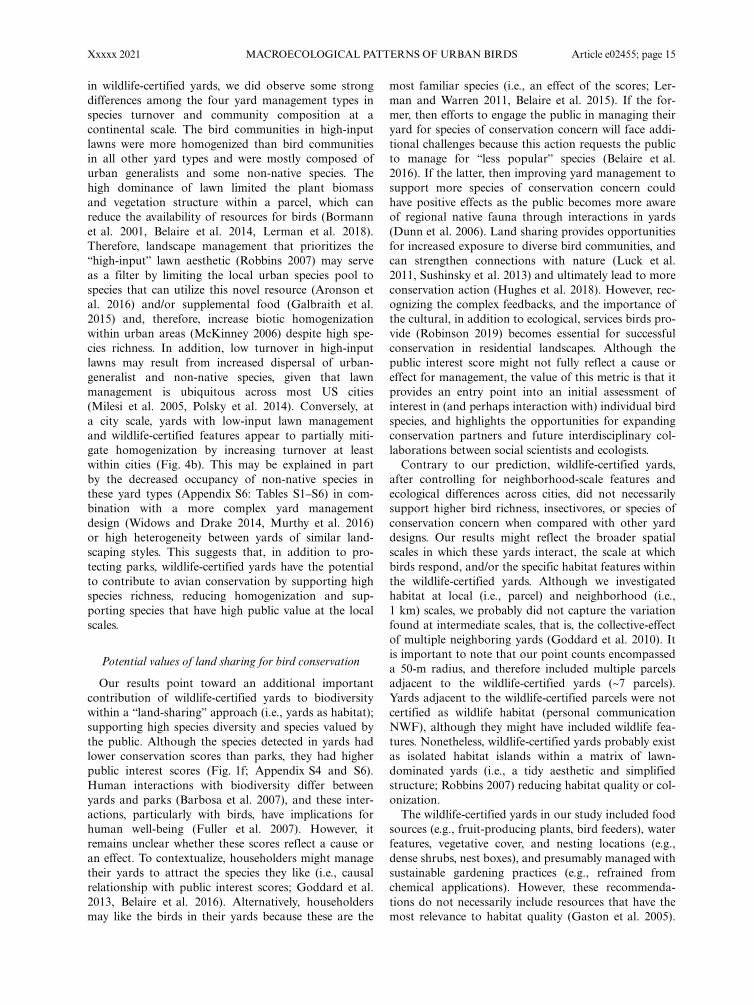
in wildlife-certified yards, we did observe some strongdifferences among the four yard management types inspecies turnover and community composition at acontinental scale. The bird communities in high-inputlawns were more homogenized than bird communitiesin all other yard types and were mostly composed ofurban generalists and some non-native species. Thehigh dominance of lawn limited the plant biomassand vegetation structure within a parcel, which canreduce the availability of resources for birds (Bormannet al. 2001, Belaire et al. 2014, Lerman et al. 2018).Therefore, landscape management that prioritizes the“high-input” lawn aesthetic (Robbins 2007) may serveas a filter by limiting the local urban species pool tospecies that can utilize this novel resource (Aronson etal. 2016) and/or supplemental food (Galbraith et al.2015) and, therefore, increase biotic homogenizationwithin urban areas (McKinney 2006) despite high spe-cies richness. In addition, low turnover in high-inputlawns may result from increased dispersal of urban-generalist and non-native species, given that lawnmanagement is ubiquitous across most US cities(Milesi et al. 2005, Polsky et al. 2014). Conversely, ata city scale, yards with low-input lawn managementand wildlife-certified features appear to partially miti-gate homogenization by increasing turnover at leastwithin cities (Fig. 4b). This may be explained in partby the decreased occupancy of non-native species inthese yard types (Appendix S6: Tables S1–S6) in com-bination with a more complex yard managementdesign (Widows and Drake 2014, Murthy et al. 2016)or high heterogeneity between yards of similar land-scaping styles. This suggests that, in addition to pro-tecting parks, wildlife-certified yards have the potentialto contribute to avian conservation by supporting highspecies richness, reducing homogenization and sup-porting species that have high public value at the localscales.
Potential values of land sharing for bird conservation
Our results point toward an additional importantcontribution of wildlife-certified yards to biodiversitywithin a “land-sharing” approach (i.e., yards as habitat);supporting high species diversity and species valued bythe public. Although the species detected in yards hadlower conservation scores than parks, they had higherpublic interest scores (Fig. 1f; Appendix S4 and S6).Human interactions with biodiversity differ betweenyards and parks (Barbosa et al. 2007), and these inter-actions, particularly with birds, have implications forhuman well-being (Fuller et al. 2007). However, itremains unclear whether these scores reflect a cause oran effect. To contextualize, householders might managetheir yards to attract the species they like (i.e., causalrelationship with public interest scores; Goddard et al.2013, Belaire et al. 2016). Alternatively, householdersmay like the birds in their yards because these are the
most familiar species (i.e., an effect of the scores; Ler-man and Warren 2011, Belaire et al. 2015). If the for-mer, then efforts to engage the public in managing theiryard for species of conservation concern will face addi-tional challenges because this action requests the publicto manage for “less popular” species (Belaire et al.2016). If the latter, then improving yard management tosupport more species of conservation concern couldhave positive effects as the public becomes more awareof regional native fauna through interactions in yards(Dunn et al. 2006). Land sharing provides opportunitiesfor increased exposure to diverse bird communities, andcan strengthen connections with nature (Luck et al.2011, Sushinsky et al. 2013) and ultimately lead to moreconservation action (Hughes et al. 2018). However, rec-ognizing the complex feedbacks, and the importance ofthe cultural, in addition to ecological, services birds pro-vide (Robinson 2019) becomes essential for successfulconservation in residential landscapes. Although thepublic interest score might not fully reflect a cause oreffect for management, the value of this metric is that itprovides an entry point into an initial assessment ofinterest in (and perhaps interaction with) individual birdspecies, and highlights the opportunities for expandingconservation partners and future interdisciplinary col-laborations between social scientists and ecologists.Contrary to our prediction, wildlife-certified yards,
after controlling for neighborhood-scale features andecological differences across cities, did not necessarilysupport higher bird richness, insectivores, or species ofconservation concern when compared with other yarddesigns. Our results might reflect the broader spatialscales in which these yards interact, the scale at whichbirds respond, and/or the specific habitat features withinthe wildlife-certified yards. Although we investigatedhabitat at local (i.e., parcel) and neighborhood (i.e.,1 km) scales, we probably did not capture the variationfound at intermediate scales, that is, the collective-effectof multiple neighboring yards (Goddard et al. 2010). Itis important to note that our point counts encompasseda 50-m radius, and therefore included multiple parcelsadjacent to the wildlife-certified yards (~7 parcels).Yards adjacent to the wildlife-certified parcels were notcertified as wildlife habitat (personal communicationNWF), although they might have included wildlife fea-tures. Nonetheless, wildlife-certified yards probably existas isolated habitat islands within a matrix of lawn-dominated yards (i.e., a tidy aesthetic and simplifiedstructure; Robbins 2007) reducing habitat quality or col-onization.The wildlife-certified yards in our study included food
sources (e.g., fruit-producing plants, bird feeders), waterfeatures, vegetative cover, and nesting locations (e.g.,dense shrubs, nest boxes), and presumably managed withsustainable gardening practices (e.g., refrained fromchemical applications). However, these recommenda-tions do not necessarily include resources that have themost relevance to habitat quality (Gaston et al. 2005).
Xxxxx 2021 MACROECOLOGICAL PATTERNS OF URBAN BIRDS Article e02455; page 15
For example, some wildlife-certified yards may havelacked native plants, (an option, not a requirement forcertification), that supply important insect prey and fruit(Narango et al. 2018, Gallinat et al. 2020), or nestinglocations free from domestic pets (Marra 2019). It is alsoimportant to note, sample size was limited to fourwildlife-certified yards per city (n = 24), and thereforemight not have captured all the variation in this manage-ment type both within and across cities. Still, these yardshad enhanced plant diversity (Padulles Cubino et al.2020) that may have contributed in part to the higherturnover in species communities between wildlife-certified yards relative to other yard types. Alternatively,high heterogeneity may be a result of increased opportu-nities for more diverse bird species using these yards, butlower site occupancy due to exogenous factors (e.g.,colonization). In either case, these results suggested thatwildlife-certified yards could support more diversity atregional (i.e., the metropolitan area) scales, and when inaggregate.Our bird diversity results suggest a synergistic, and
possibly interactive, role that wildlife-certified yards canplay in conjunction with park preservation. By increas-ing heterogeneity among yards, wildlife-friendly land-scaping, although homogenized at a continental scale,can support higher diversity at a city scale comparedwith traditional yard management (e.g., lawns). Wildlife-certified yards also have the capacity to support sensitiveguilds as in insectivorous and migratory species,although the inclusion of the most imperiled species (i.e.,those with high conservation scores) may be contextdependent. Although not an objective of this study, weposit that the inclusion of wildlife-certified yards couldhave positive ecological interactions with local parklandby increasing connectivity and reducing edge effects. Wesuggest that future studies investigate whether the loca-tion, frequency and spatial configuration of wildlife-certified yards might lead to stronger responses from thebird community (Lepczyk et al. 2017). For example,locating wildlife-certified yards adjacent to parks andother protected green spaces, in combination with certi-fying multiple adjacent yards within a neighborhoodmight increase patch size and connectivity across theurban matrix, and therefore bird diversity (Goddardet al. 2010, Gilroy et al. 2014). Furthermore, researchthat explores the consequences of full adoption ofwildlife-certified yards across the metropolitan areamight elucidate the scale in which we can detect differ-ences in conservation scores.
CONCLUSION
Our study tested how urban bird diversity responds tomultiple yard management designs and neighborhoodlandscape features at a continental scale. Although wedid not study every biome, nor were the cities evenly dis-tributed in the geographical and environmental space,the study sites are representative of other cities within
similar ecosystems and, therefore, by standardizingmethods and randomly sampling cities we can makeinferences about bird communities in cities beyond oursampling. We suggest future investigations include addi-tional locations to help refine our conclusions. More-over, by including multiple diversity metrics such asspecies richness, functional guild richness and turnover,conservation and public interest scores, we elucidatedthe complex ways in which the urban bird communityresponds to different urban management strategies.Our results clearly demonstrated the importance of
parks and other “unmanaged” spaces for supportingdiverse communities with species of conservation con-cern. Yet yards, with their high species richness and highpublic interest scores, have clear potential to contributeservices that are both cultural and ecological. Backyardbirds are the species with which the public interacts(DeStefano and DeGraaf 2003), and these interactionsincrease both interest in and support for conservationaction (Hiron et al. 2018). Given the sharp declines ofNorth American birds, including widespread specieswith high public interest scores (Rosenberg et al. 2019),assessing urban bird communities and how changes atthe individual parcel level scale up to continental scaleshas consequences for evaluating the impacts of futureurban expansion and conservation of avian biodiversity.Wildlife-certified yards have the potential to contributeto city-scale heterogeneity and potentially mitigate theecological homogenization of American residential land-scapes.
ACKNOWLEDGMENTS
Susannah B. Lerman and Desiree L. Narango are to be con-sidered joint first authors. We thank Assistant Editor DianneBrunton, Morgan Tingley, and another anonymous reviewerfor taking the time to review this manuscript and for their con-structive comments that improved the quality of this work. Wealso thank Mary Phillips and Erin Sweeney from NationalWildlife Federation. Kyle TePoel, Parker Davis, Alex Lamore-aux, Megan Shave, Karen Wattam, Michael Whittemore, Basvan Schooten and Dan Cooper conducted our bird surveys andMelory Brandao assisted with collecting bird distribution andtrait data. We thank Laura Templeton, Noortje Grijseels, Han-nah Heavenrich, Laura Steger, Margot McKlveen, and MeganWheeler for managing the field project in the respective cities.D. L. Narango was supported while conducting this research bya David H. Smith Conservation Research Fellowship. Researchwas funded by The National Science Foundation MacrosystemsBiology program (EF-1638648, EF-1638725, EF-1638519, EF-1638676, EF-1638560, DEB-1637590, DEB-1832016, DEB-1638606).
LITERATURE CITED
Adalsteinsson, S. A., J. J. Buler, J. L. Bowman, V. D’Amico, Z.S. Ladin, and W. G. Shriver. 2018. Post-independence mortal-ity of juveniles is driven by anthropogenic hazards for twopasserines in an urban landscape. Journal of Avian Biology49:e01555.
Aronson, M. F. J., et al. 2014. A global analysis of the impactsof urbanization on bird and plant diversity reveals key
Article e02455; page 16 SUSANNAH B. LERMAN ET AL.Ecological Applications
Vol. 0, No. 0
anthropogenic drivers. Proceedings of the Royal Society B-Biological Sciences 281:20133330.
Aronson, M. F., C. H. Nilon, C. A. Lepczyk, T. S. Parker, P. S.Warren, S. S. Cilliers, M. A. Goddard, A. K. Hahs, C. Herzog,and M. Katti. 2016. Hierarchical filters determine communityassembly of urban species pools. Ecology 97:2952–2963.
Avolio, M., A. Blanchette, N. F. Sonti, and D. H. Locke. 2020.Time is not money: income is more important than lifestagefor explaining patterns of residential yard plant communitystructure and diversity in Baltimore. Frontiers in Ecology andEvolution 8:85.
Avolio, M. L., D. E. Pataki, S. Pincetl, T. W. Gillespie, G. D.Jenerette, and H. R. McCarthy. 2015. Understanding prefer-ences for tree attributes: the relative effects of socio-economicand local environmental factors. Urban Ecosystems 18:73–86.
Avolio, M. L., D. E. Pataki, T. L. E. Trammell, and J. Endter-Wada. 2018. Biodiverse cities: the nursery industry, home-owners, and neighborhood differences drive urban treecomposition. Ecological Monographs 88:259–276.
Barbosa, O., J. A. Tratalos, P. R. Armsworth, R. G. Davies, R.A. Fuller, P. Johnson, and K. J. Gaston. 2007. Who benefitsfrom access to green space? A case study from Sheffield, UK.Landscape and Urban Planning 83:187–195.
Batary, P., K. Kurucz, M. Suarez-Rubio, and D. E. Chamber-lain. 2018. Non-linearities in bird responses across urbaniza-tion gradients: A meta-analysis. Global Change Biology24:1046–1054.
Belaire, J. A., L. M. Westphal, and E. S. Minor. 2016. Differentsocial drivers, including perceptions of urban wildlife, explainthe ecological resources in residential landscapes. LandscapeEcology 31:401–413.
Belaire, J. A., L. M. Westphal, C. J. Whelan, and E. S. Minor.2015. Urban residents’ perceptions of birds in the neighbor-hood: Biodiversity, cultural ecosystem services, and disser-vices. Condor: Ornithological Applications 117:192–202.
Belaire, J. A., C. J. Whelan, and E. S. Minor. 2014. Having ouryards and sharing them too: the collective effects of yards onnative bird species in an urban landscape. Ecological Applica-tions 24:2132–2143.
Beninde, J., M. Veith, and A. Hochkirch. 2015. Biodiversity incities needs space: a meta-analysis of factors determining intra-urban biodiversity variation. Ecology Letters 18:581–592.
Blair, R., and E. Johnson. 2008. Suburban habitats and their rolefor birds in the urban-rural habitat network: points of localinvasion and extinction? Landscape Ecology 23:1157–1169.
Blair, R. B. 1996. Land use and avian species diversity along anurban gradient. Ecological Applications 6:506–519.
Bormann, F. H., D. Balmori, and G. T. Geballe. 2001.Redesigning the American lawn: a search for environmentalharmony. Yale University Press, New Haven, Connecticut,USA.
Burghardt, K. T., D. W. Tallamy, and G. W. Shriver. 2009.Impact of native plants on bird and butterfly biodiversity insuburban landscapes. Conservation Biology 23:219–224.
Cadenasso, M. L., S. T. A. Pickett, and K. Schwarz. 2007. Spa-tial heterogeneity in urban ecosystems: reconceptualizingland cover and a framework for classification. Frontiers inEcology and the Environment 5:80–88.
Cadotte, M. W., S. L. E. Yasui, S. Livingstone, and J. S. MacI-vor. 2017. Are urban systems beneficial, detrimental, or indif-ferent for biological invasion? Biological Invasions 19:3489–3503.
Callaghan, C. T., R. E. Major, M. B. Lyons, J. M. Martin, andR. T. Kingsford. 2018. The effects of local and landscapehabitat attributes on bird diversity in urban greenspaces. Eco-sphere 9:e02347.
Cavender-Bares, J., J. Padulles Cubino, W. D. Pearse, S. E. Hob-bie, A. J. Lange, S. Knapp, and K. C. Nelson. 2020. Horticul-tural availability and homeowner preferences drive plantdiversity and composition in urban yards. Ecological Applica-tions 30:1–16.
Chace, J. F., and J. J. Walsh. 2006. Urban effects on native avi-fauna: a review. Landscape and Urban Planning 74:46–69.
Chandler, R. B., J. A. Royle, and D. I. King. 2011. Inferenceabout density and temporary emigration in unmarked popu-lations. Ecology 92:1429–1435.
Ciach, M., and A. Frohlich. 2017. Habitat type, food resources,noise and light pollution explain the species composition,abundance and stability of a winter bird assemblage in anurban environment. Urban Ecosystems 20:547–559.
Concepcion, E. D., M. Moretti, F. Altermatt, M. P. Nobis, andM. K. Obrist. 2015. Impacts of urbanisation on biodiversity:the role of species mobility, degree of specialisation and spa-tial scale. Oikos 124:1571–1582.
Czech, B., P. R. Krausman, and P. K. Devers. 2000. Economicassociations among causes of species endangerment in theUnited States. BioScience 50:593–601.
Dale, S. 2018. Urban bird community composition influencedby size of urban green spaces, presence of native forest, andurbanization. Urban Ecosystems 21:1–14.
Daniels, G., and J. Kirkpatrick. 2006. Does variation in gardencharacteristics influence the conservation of birds in subur-bia? Biological Conservation 133:326–335.
Derby Lewis, A., M. J. Bouman, A. M. Winter, E. A. Hasle, D.F. Stotz, M. K. Johnston, K. R. Klinger, A. Rosenthal, andC. A. Czarnecki. 2019. Does nature need cities? Pollinatorsreveal a role for cities in wildlife conservation. Frontiers inEcology and Evolution 7:220.
DeStefano, S., and R. M. DeGraaf. 2003. Exploring the ecologyof suburban wildlife. Frontiers in Ecology and the Environ-ment 1:95–101.
Devarajan, K., T. L. Morelli, and S. Tenan. 2020. Multi-speciesoccupancy models: review, roadmap, and recommendations.Ecography 43:1612–1624.
Devictor, V., R. Julliard, D. Couvet, A. Lee, and F. Jiguet. 2007.Functional homogenization effect of urbanization on birdcommunities. Conservation Biology 21:741–751.
Donnelly, R., and J. M. Marzluff. 2004. Importance of reservesize and landscape context to urban bird conservation. Con-servation Biology 18:733–745.
Dorazio, R. M., and J. A. Royle. 2005. Estimating size and com-position of biological communities by modeling the occur-rence of species. Journal of the American StatisticalAssociation 100:389–398.
Dunn, R. R., M. C. Gavin, M. C. Sanchez, and J. N. Solomon.2006. The pigeon paradox: dependence of global conserva-tion on urban nature. Conservation Biology 20:1814–1816.
ESRI. 2017. ArcGIS desktop and spatial analyst extension:release 10.5. Environmental Systems Research Institute,Redlands, California, USA.
Evans, B. S., A. M. Kilpatrick, A. H. Hurlbert, and P. P.Marra. 2017. Dispersal in the urban matrix: assessing theinfluence of landscape permeability on the settlement pat-terns of breeding songbirds. Frontiers in Ecology andEvolution 5:63.
Evans, B. S., R. Reitsma, A. H. Hurlbert, and P. P. Marra. 2018.Environmental filtering of avian communities along a rural-to-urban gradient in Greater Washington, DC, USA. Eco-sphere 9:e02402.
Evans, K. L., D. E. Chamberlain, B. J. Hatchwell, R. D.Gregory, and K. J. Gaston. 2011. What makes an urban bird?Global Change Biology 17:32–44.
Xxxxx 2021 MACROECOLOGICAL PATTERNS OF URBAN BIRDS Article e02455; page 17
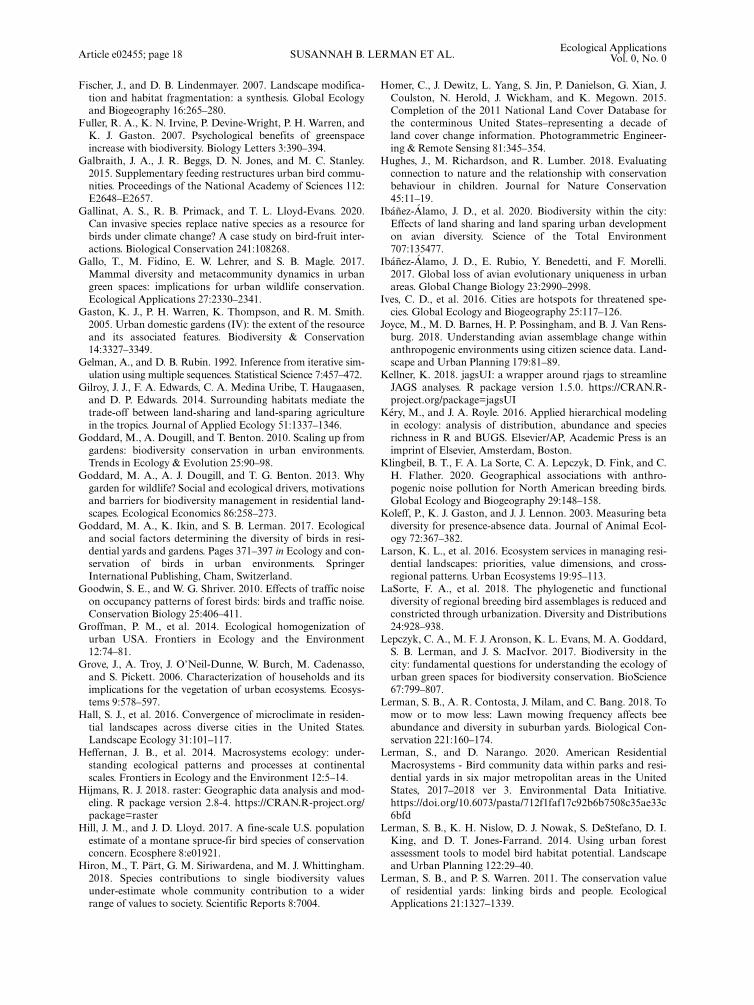
Fischer, J., and D. B. Lindenmayer. 2007. Landscape modifica-tion and habitat fragmentation: a synthesis. Global Ecologyand Biogeography 16:265–280.
Fuller, R. A., K. N. Irvine, P. Devine-Wright, P. H. Warren, andK. J. Gaston. 2007. Psychological benefits of greenspaceincrease with biodiversity. Biology Letters 3:390–394.
Galbraith, J. A., J. R. Beggs, D. N. Jones, and M. C. Stanley.2015. Supplementary feeding restructures urban bird commu-nities. Proceedings of the National Academy of Sciences 112:E2648–E2657.
Gallinat, A. S., R. B. Primack, and T. L. Lloyd-Evans. 2020.Can invasive species replace native species as a resource forbirds under climate change? A case study on bird-fruit inter-actions. Biological Conservation 241:108268.
Gallo, T., M. Fidino, E. W. Lehrer, and S. B. Magle. 2017.Mammal diversity and metacommunity dynamics in urbangreen spaces: implications for urban wildlife conservation.Ecological Applications 27:2330–2341.
Gaston, K. J., P. H. Warren, K. Thompson, and R. M. Smith.2005. Urban domestic gardens (IV): the extent of the resourceand its associated features. Biodiversity & Conservation14:3327–3349.
Gelman, A., and D. B. Rubin. 1992. Inference from iterative sim-ulation using multiple sequences. Statistical Science 7:457–472.
Gilroy, J. J., F. A. Edwards, C. A. Medina Uribe, T. Haugaasen,and D. P. Edwards. 2014. Surrounding habitats mediate thetrade-off between land-sharing and land-sparing agriculturein the tropics. Journal of Applied Ecology 51:1337–1346.
Goddard, M., A. Dougill, and T. Benton. 2010. Scaling up fromgardens: biodiversity conservation in urban environments.Trends in Ecology & Evolution 25:90–98.
Goddard, M. A., A. J. Dougill, and T. G. Benton. 2013. Whygarden for wildlife? Social and ecological drivers, motivationsand barriers for biodiversity management in residential land-scapes. Ecological Economics 86:258–273.
Goddard, M. A., K. Ikin, and S. B. Lerman. 2017. Ecologicaland social factors determining the diversity of birds in resi-dential yards and gardens. Pages 371–397 in Ecology and con-servation of birds in urban environments. SpringerInternational Publishing, Cham, Switzerland.
Goodwin, S. E., and W. G. Shriver. 2010. Effects of traffic noiseon occupancy patterns of forest birds: birds and traffic noise.Conservation Biology 25:406–411.
Groffman, P. M., et al. 2014. Ecological homogenization ofurban USA. Frontiers in Ecology and the Environment12:74–81.
Grove, J., A. Troy, J. O’Neil-Dunne, W. Burch, M. Cadenasso,and S. Pickett. 2006. Characterization of households and itsimplications for the vegetation of urban ecosystems. Ecosys-tems 9:578–597.
Hall, S. J., et al. 2016. Convergence of microclimate in residen-tial landscapes across diverse cities in the United States.Landscape Ecology 31:101–117.
Heffernan, J. B., et al. 2014. Macrosystems ecology: under-standing ecological patterns and processes at continentalscales. Frontiers in Ecology and the Environment 12:5–14.
Hijmans, R. J. 2018. raster: Geographic data analysis and mod-eling. R package version 2.8-4. https://CRAN.R-project.org/package=raster
Hill, J. M., and J. D. Lloyd. 2017. A fine-scale U.S. populationestimate of a montane spruce-fir bird species of conservationconcern. Ecosphere 8:e01921.
Hiron, M., T. Part, G. M. Siriwardena, and M. J. Whittingham.2018. Species contributions to single biodiversity valuesunder-estimate whole community contribution to a widerrange of values to society. Scientific Reports 8:7004.
Homer, C., J. Dewitz, L. Yang, S. Jin, P. Danielson, G. Xian, J.Coulston, N. Herold, J. Wickham, and K. Megown. 2015.Completion of the 2011 National Land Cover Database forthe conterminous United States–representing a decade ofland cover change information. Photogrammetric Engineer-ing & Remote Sensing 81:345–354.
Hughes, J., M. Richardson, and R. Lumber. 2018. Evaluatingconnection to nature and the relationship with conservationbehaviour in children. Journal for Nature Conservation45:11–19.
Ibanez-Alamo, J. D., et al. 2020. Biodiversity within the city:Effects of land sharing and land sparing urban developmenton avian diversity. Science of the Total Environment707:135477.
Ibanez-Alamo, J. D., E. Rubio, Y. Benedetti, and F. Morelli.2017. Global loss of avian evolutionary uniqueness in urbanareas. Global Change Biology 23:2990–2998.
Ives, C. D., et al. 2016. Cities are hotspots for threatened spe-cies. Global Ecology and Biogeography 25:117–126.
Joyce, M., M. D. Barnes, H. P. Possingham, and B. J. Van Rens-burg. 2018. Understanding avian assemblage change withinanthropogenic environments using citizen science data. Land-scape and Urban Planning 179:81–89.
Kellner, K. 2018. jagsUI: a wrapper around rjags to streamlineJAGS analyses. R package version 1.5.0. https://CRAN.R-project.org/package=jagsUI
Kery, M., and J. A. Royle. 2016. Applied hierarchical modelingin ecology: analysis of distribution, abundance and speciesrichness in R and BUGS. Elsevier/AP, Academic Press is animprint of Elsevier, Amsterdam, Boston.
Klingbeil, B. T., F. A. La Sorte, C. A. Lepczyk, D. Fink, and C.H. Flather. 2020. Geographical associations with anthro-pogenic noise pollution for North American breeding birds.Global Ecology and Biogeography 29:148–158.
Koleff, P., K. J. Gaston, and J. J. Lennon. 2003. Measuring betadiversity for presence-absence data. Journal of Animal Ecol-ogy 72:367–382.
Larson, K. L., et al. 2016. Ecosystem services in managing resi-dential landscapes: priorities, value dimensions, and cross-regional patterns. Urban Ecosystems 19:95–113.
LaSorte, F. A., et al. 2018. The phylogenetic and functionaldiversity of regional breeding bird assemblages is reduced andconstricted through urbanization. Diversity and Distributions24:928–938.
Lepczyk, C. A., M. F. J. Aronson, K. L. Evans, M. A. Goddard,S. B. Lerman, and J. S. MacIvor. 2017. Biodiversity in thecity: fundamental questions for understanding the ecology ofurban green spaces for biodiversity conservation. BioScience67:799–807.
Lerman, S. B., A. R. Contosta, J. Milam, and C. Bang. 2018. Tomow or to mow less: Lawn mowing frequency affects beeabundance and diversity in suburban yards. Biological Con-servation 221:160–174.
Lerman, S., and D. Narango. 2020. American ResidentialMacrosystems - Bird community data within parks and resi-dential yards in six major metropolitan areas in the UnitedStates, 2017–2018 ver 3. Environmental Data Initiative.https://doi.org/10.6073/pasta/712f1faf17c92b6b7508c35ae33c6bfd
Lerman, S. B., K. H. Nislow, D. J. Nowak, S. DeStefano, D. I.King, and D. T. Jones-Farrand. 2014. Using urban forestassessment tools to model bird habitat potential. Landscapeand Urban Planning 122:29–40.
Lerman, S. B., and P. S. Warren. 2011. The conservation valueof residential yards: linking birds and people. EcologicalApplications 21:1327–1339.
Article e02455; page 18 SUSANNAH B. LERMAN ET AL.Ecological Applications
Vol. 0, No. 0
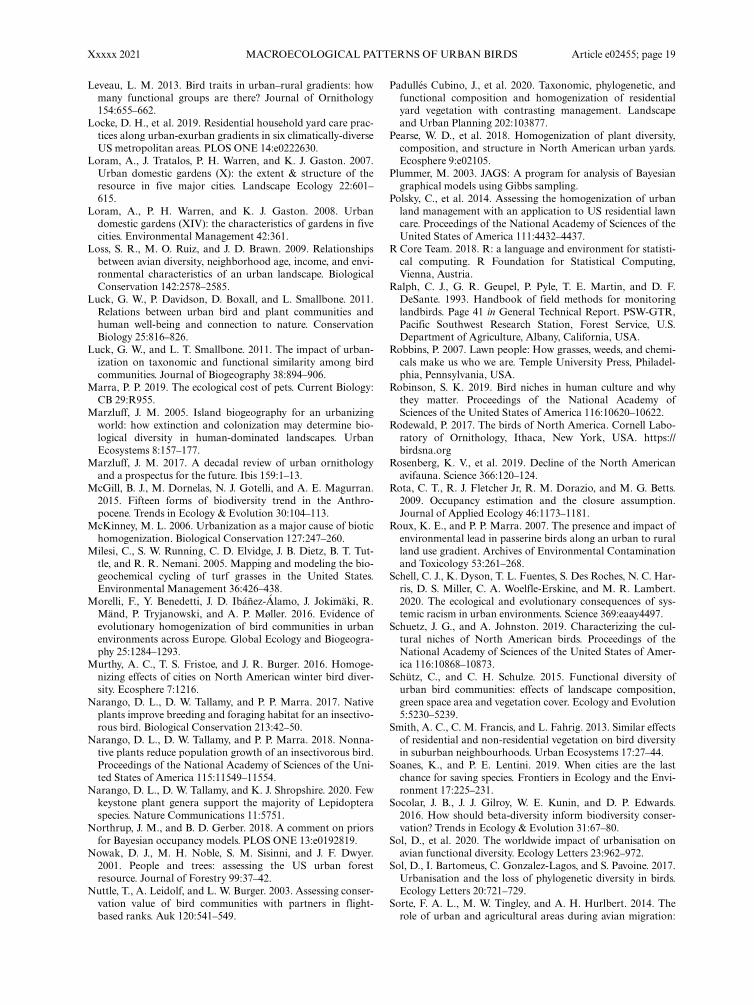
Leveau, L. M. 2013. Bird traits in urban–rural gradients: howmany functional groups are there? Journal of Ornithology154:655–662.
Locke, D. H., et al. 2019. Residential household yard care prac-tices along urban-exurban gradients in six climatically-diverseUS metropolitan areas. PLOS ONE 14:e0222630.
Loram, A., J. Tratalos, P. H. Warren, and K. J. Gaston. 2007.Urban domestic gardens (X): the extent & structure of theresource in five major cities. Landscape Ecology 22:601–615.
Loram, A., P. H. Warren, and K. J. Gaston. 2008. Urbandomestic gardens (XIV): the characteristics of gardens in fivecities. Environmental Management 42:361.
Loss, S. R., M. O. Ruiz, and J. D. Brawn. 2009. Relationshipsbetween avian diversity, neighborhood age, income, and envi-ronmental characteristics of an urban landscape. BiologicalConservation 142:2578–2585.
Luck, G. W., P. Davidson, D. Boxall, and L. Smallbone. 2011.Relations between urban bird and plant communities andhuman well-being and connection to nature. ConservationBiology 25:816–826.
Luck, G. W., and L. T. Smallbone. 2011. The impact of urban-ization on taxonomic and functional similarity among birdcommunities. Journal of Biogeography 38:894–906.
Marra, P. P. 2019. The ecological cost of pets. Current Biology:CB 29:R955.
Marzluff, J. M. 2005. Island biogeography for an urbanizingworld: how extinction and colonization may determine bio-logical diversity in human-dominated landscapes. UrbanEcosystems 8:157–177.
Marzluff, J. M. 2017. A decadal review of urban ornithologyand a prospectus for the future. Ibis 159:1–13.
McGill, B. J., M. Dornelas, N. J. Gotelli, and A. E. Magurran.2015. Fifteen forms of biodiversity trend in the Anthro-pocene. Trends in Ecology & Evolution 30:104–113.
McKinney, M. L. 2006. Urbanization as a major cause of biotichomogenization. Biological Conservation 127:247–260.
Milesi, C., S. W. Running, C. D. Elvidge, J. B. Dietz, B. T. Tut-tle, and R. R. Nemani. 2005. Mapping and modeling the bio-geochemical cycling of turf grasses in the United States.Environmental Management 36:426–438.
Morelli, F., Y. Benedetti, J. D. Ibanez-Alamo, J. Jokimaki, R.Mand, P. Tryjanowski, and A. P. Møller. 2016. Evidence ofevolutionary homogenization of bird communities in urbanenvironments across Europe. Global Ecology and Biogeogra-phy 25:1284–1293.
Murthy, A. C., T. S. Fristoe, and J. R. Burger. 2016. Homoge-nizing effects of cities on North American winter bird diver-sity. Ecosphere 7:1216.
Narango, D. L., D. W. Tallamy, and P. P. Marra. 2017. Nativeplants improve breeding and foraging habitat for an insectivo-rous bird. Biological Conservation 213:42–50.
Narango, D. L., D. W. Tallamy, and P. P. Marra. 2018. Nonna-tive plants reduce population growth of an insectivorous bird.Proceedings of the National Academy of Sciences of the Uni-ted States of America 115:11549–11554.
Narango, D. L., D. W. Tallamy, and K. J. Shropshire. 2020. Fewkeystone plant genera support the majority of Lepidopteraspecies. Nature Communications 11:5751.
Northrup, J. M., and B. D. Gerber. 2018. A comment on priorsfor Bayesian occupancy models. PLOS ONE 13:e0192819.
Nowak, D. J., M. H. Noble, S. M. Sisinni, and J. F. Dwyer.2001. People and trees: assessing the US urban forestresource. Journal of Forestry 99:37–42.
Nuttle, T., A. Leidolf, and L. W. Burger. 2003. Assessing conser-vation value of bird communities with partners in flight-based ranks. Auk 120:541–549.
Padulles Cubino, J., et al. 2020. Taxonomic, phylogenetic, andfunctional composition and homogenization of residentialyard vegetation with contrasting management. Landscapeand Urban Planning 202:103877.
Pearse, W. D., et al. 2018. Homogenization of plant diversity,composition, and structure in North American urban yards.Ecosphere 9:e02105.
Plummer, M. 2003. JAGS: A program for analysis of Bayesiangraphical models using Gibbs sampling.
Polsky, C., et al. 2014. Assessing the homogenization of urbanland management with an application to US residential lawncare. Proceedings of the National Academy of Sciences of theUnited States of America 111:4432–4437.
R Core Team. 2018. R: a language and environment for statisti-cal computing. R Foundation for Statistical Computing,Vienna, Austria.
Ralph, C. J., G. R. Geupel, P. Pyle, T. E. Martin, and D. F.DeSante. 1993. Handbook of field methods for monitoringlandbirds. Page 41 in General Technical Report. PSW-GTR,Pacific Southwest Research Station, Forest Service, U.S.Department of Agriculture, Albany, California, USA.
Robbins, P. 2007. Lawn people: How grasses, weeds, and chemi-cals make us who we are. Temple University Press, Philadel-phia, Pennsylvania, USA.
Robinson, S. K. 2019. Bird niches in human culture and whythey matter. Proceedings of the National Academy ofSciences of the United States of America 116:10620–10622.
Rodewald, P. 2017. The birds of North America. Cornell Labo-ratory of Ornithology, Ithaca, New York, USA. https://birdsna.org
Rosenberg, K. V., et al. 2019. Decline of the North Americanavifauna. Science 366:120–124.
Rota, C. T., R. J. Fletcher Jr, R. M. Dorazio, and M. G. Betts.2009. Occupancy estimation and the closure assumption.Journal of Applied Ecology 46:1173–1181.
Roux, K. E., and P. P. Marra. 2007. The presence and impact ofenvironmental lead in passerine birds along an urban to ruralland use gradient. Archives of Environmental Contaminationand Toxicology 53:261–268.
Schell, C. J., K. Dyson, T. L. Fuentes, S. Des Roches, N. C. Har-ris, D. S. Miller, C. A. Woelfle-Erskine, and M. R. Lambert.2020. The ecological and evolutionary consequences of sys-temic racism in urban environments. Science 369:eaay4497.
Schuetz, J. G., and A. Johnston. 2019. Characterizing the cul-tural niches of North American birds. Proceedings of theNational Academy of Sciences of the United States of Amer-ica 116:10868–10873.
Schutz, C., and C. H. Schulze. 2015. Functional diversity ofurban bird communities: effects of landscape composition,green space area and vegetation cover. Ecology and Evolution5:5230–5239.
Smith, A. C., C. M. Francis, and L. Fahrig. 2013. Similar effectsof residential and non-residential vegetation on bird diversityin suburban neighbourhoods. Urban Ecosystems 17:27–44.
Soanes, K., and P. E. Lentini. 2019. When cities are the lastchance for saving species. Frontiers in Ecology and the Envi-ronment 17:225–231.
Socolar, J. B., J. J. Gilroy, W. E. Kunin, and D. P. Edwards.2016. How should beta-diversity inform biodiversity conser-vation? Trends in Ecology & Evolution 31:67–80.
Sol, D., et al. 2020. The worldwide impact of urbanisation onavian functional diversity. Ecology Letters 23:962–972.
Sol, D., I. Bartomeus, C. Gonzalez-Lagos, and S. Pavoine. 2017.Urbanisation and the loss of phylogenetic diversity in birds.Ecology Letters 20:721–729.
Sorte, F. A. L., M. W. Tingley, and A. H. Hurlbert. 2014. Therole of urban and agricultural areas during avian migration:
Xxxxx 2021 MACROECOLOGICAL PATTERNS OF URBAN BIRDS Article e02455; page 19
an assessment of within-year temporal turnover. Global Ecol-ogy and Biogeography 23:1225–1234.
Steele, M. K., et al. 2014. Convergent surface water distribu-tions in U.S. cities. Ecosystems 17:685–697.
Strohbach, M. W., S. B. Lerman, and P. S. Warren. 2013. Aresmall greening areas enhancing bird diversity? Insights fromcommunity-driven greening projects in Boston. Landscapeand Urban Planning 114:69–79.
Sullivan, B. L., C. L. Wood, M. J. Iliff, R. E. Bonney, D. Fink,and S. Kelling. 2009. eBird: A citizen-based bird observationnetwork in the biological sciences. Biological Conservation142:2282–2292.
Sushinsky, J. R., J. R. Rhodes, H. P. Possingham, T. K. Gill, andR. A. Fuller. 2013. How should we grow cities to minimize theirbiodiversity impacts? Global Change Biology 19:401–410.
Sutherland, C., M. Brambilla, P. Pedrini, and S. Tenan. 2016. Amultiregion community model for inference about geographicvariation in species richness. Methods in Ecology and Evolu-tion 7:783–791.
Tilman, D., R. M. May, C. L. Lehman, and M. A. Nowak.1994. Habitat destruction and the extinction debt. Nature371:65–66.
Tingley, M. W., and S. R. Beissinger. 2013. Cryptic loss of mon-tane avian richness and high community turnover over 100years. Ecology 94:598–609.
Tingley, M. W., C. P. Nadeau, and M. E. Sandor. 2020. Multi-species occupancy models as robust estimators of communityrichness. Methods in Ecology and Evolution 11:633–642.
Trammell, T. L. E., et al. 2020. Urban soil carbon and nitrogenconverge at a continental scale. Ecological Monographs 90:e01401:1–13.
Trammell, T. L. E., D. E. Pataki, J. Cavender-Bares, P. M.Groffman, S. J. Hall, J. B. Heffernan, S. E. Hobbie, J. L.Morse, C. Neill, and K. C. Nelson. 2016. Plant nitrogen con-centration and isotopic composition in residential lawnsacross seven US cities. Oecologia 181:271–285.
Warren, P. S., S. B. Lerman, R. Andrade, K. L. Larson, and H.L. Bateman. 2019. The more things change: species lossesdetected in Phoenix despite stability in bird–socioeconomicrelationships. Ecosphere 10:e02624.
Wheeler, M. M., et al. 2017. Continental-scale homogenizationof residential lawn plant communities. Landscape and UrbanPlanning 165:54–63.
Widows, S. A., and D. Drake. 2014. Evaluating the NationalWildlife Federation’s certified Wildlife HabitatTM program.Landscape and Urban Planning 129:32–43.
Will, T., et al. 2019. Handbook to the partners in flight popula-tion estimates database, Version 3.0. Partners in flight andbird conservancy of the Rockies.
Wilman, H., J. Belmaker, J. Simpson, C. De La Rosa, M. M.Rivadeneira, and W. Jetz. 2014. EltonTraits 1.0: Species-levelforaging attributes of the world’s birds and mammals: Eco-logical Archives E095–178. Ecology 95:2027.
Zuur, A. F., E. N. Ieno, and C. S. Elphick. 2010. A protocol fordata exploration to avoid common statistical problems. Meth-ods in Ecology and Evolution 1:3–14.
SUPPORTING INFORMATION
Additional supporting information may be found online at: http://onlinelibrary.wiley.com/doi/10.1002/eap.2455/full
OPEN RESEARCH
Data (Lerman and Narango 2020) are available from the EDI Data Portal: https://doi.org/10.6073/pasta/712f1faf17c92b6b7508c35ae33c6bfd.
Article e02455; page 20 SUSANNAH B. LERMAN ET AL.Ecological Applications
Vol. 0, No. 0