Embed Size (px)
Citation preview
1
RESIDENTIAL SEGREGATION AND INFANT HEALTH, 1970-1990
Gregory T. Niemesh
Miami University
and
Katharine L. Shester
Washington and Lee University
Abstract: There is a large literature that links segregation to adverse black birth outcomes. However,
the majority of studies focus on the period 1990 and later, and, to the best of our knowledge, no
studies assess how this relationship changed over time. In this paper, we assess the effects of
segregation on black and non-black birth outcomes such as low birth weight and infant mortality for
the period 1970-1990. For blacks, we find a negative effect of segregation on birth outcomes that
only emerges after 1970, and increases in magnitude during the 1980s. We find no evidence that
segregation had adverse effects on infant health outcomes for non-blacks. We also explore the
pathways through which segregation influenced black birth outcomes and how these mechanisms
changed over time. A set of measures for maternal SES and behaviors accounts for only 30 percent
of the full segregation effect in 1990, and for almost none of the effect in 1970 and 1980. Single-
motherhood and mother's education play an important and increasing role.
2
I. Introduction
The vast improvement in infant health over the course of the 20th century is one of the
greatest success stories of the public health and medical fields in the United States. The infant
mortality rate fell from 29.2 deaths per 1,000 births to 6.9 over the second half of the 20th century.
However, racial disparities in birth outcomes remain large and persistent. While the infant mortality
rate for white births fell from 26.8 to 5.7 between 1950 and 2000, it fell from 43.9 to 14.1 for blacks
(United States 2005). Of the multitude of factors driving the racial difference in birth outcomes,
racial residential segregation receives much interest in the literature. Williams and Collins (2001)
argue that “racial and residential segregation is the cornerstone on which black-white disparities in
health status have been built in the U.S.”
A large literature links current levels of racial segregation to poor black infant health
outcomes, such as low birth weight and infant mortality (Polednak 1996, Bird 1995, Laveist 1993,
Polednak 1991, Osypuk 2008, Ellen 2000). However, the vast majority of these studies focus on the
1980s or later and few are able to identify causal effects. Most examine within city differences in
outcomes and segregation across neighborhoods, or report purely correlation results. Estimates
commonly suffer from bias as healthy and wealthy black parents might differentially choose to live
in less segregated areas than unhealthy and lower income black parents. The exception is Ellen
(2000), which uses an instrumental variable strategy to identify causal effects of segregation on low
birth weight in 1990 and finds evidence that segregation finds negative effects of segregation and
black infant health outcomes, although she finds no effects on nonblack births. We follow Ellen
(2000) in our concern for estimating a causal effect of segregation on birth outcomes.
In this paper, we plan to assess the effects of segregation on infant health outcomes between
1950 and 1990. Our goals are three-fold. First, we plan to document not only the link between
segregation and infant health in a given period, but how this link changed over time. Second, we
plan to assess whether this changing relationship represents changes in a causal effect of segregation,
or simply changes in correlations over time. Third, we plan to assess the mechanisms through which
segregation influences infant health, such as through influencing maternal characteristics, such as
marital status, age, birth order, and medical care. While future versions of the paper will extend our
analysis back to 1950, the current version focuses on the period from 1970 to 1990. The results are
consistent with a small or no effect of segregation in 1970. Only in the 1970s and after does a
meaningful and statistically significant negative relationship between segregation and infant
outcomes emerge from the data, which strengthens in the 1980s
3
Using a detailed set of parental characteristics and behaviors from individual birth
certificates, we estimate how much of the effect is mediated by these potentially endogenous factors,
and the changes over time. Finally, for theories for which we have measures to include as control
variables, they seem to explain most of the change in the relationship between 1980 and 1990, but
widen the gap from 1970-1980 and 1970-1990, leaving more to be explained than the raw gap. We
use the accounting method developed in Gelbach (2015) to find the individual contribution of each
parental characteristic. Marital status and mother's education play an important role for the negative
effect of segregation, increasingly so. However, marital status, in particular, increased the effect in
1970 as well as 1990. The contribution of prenatal care plays a countervailing role to marital status.
Large and negative in 1970, prenatal care and marital status seem to cancel each other out in 1970
and 1980. The declining importance of prenatal care leads to the eventual emergence of the negative
segregation effect the 1980s.
II. Background
A. The Importance of Birth Weight and Causes of Low Birth Weight
Low birth weight is defined as weighing 2500 grams or less at the time of birth and is the
primary indicator used of infant health. In economics, birth weight is viewed both as an output of the
maternal and infant health production function, and as an input into the later-life outcomes (e.g.,
health, educational attainment, income) as the measure of the initial health capital stock at birth. A
vast literature finds a large number of infant, child, and adult outcomes correlated with low birth
weight, with many studies finding evidence that the link is causal. For example, low birth weight
infants are at a higher risk of infant mortality (Conley and Bennett 2001; Oreopolous et al. 2008).
Children born with low birth weight are found to have lower schooling attainments (Black,
Devereaux, and Salvanes 2007; Royer 2005, Oreopolous et al 2008) and lower test scores (Figlio et
al. 2014). The effects of low birth weight can extend even to adulthood with lower earnings
(Behrman and Rosenzweig 2004), increased receipt of social assistance payments (Oreopolous et al.
2008), poorer health (Barker 1995; Curhan et al. 1996), and even to causing low birth weight in the
next generation (Currie and Moretti 2007).
The long reach of low birth weight into adulthood provides a potential avenue to address the
economic and health disparities between African-Americans and Whites in the United States today.
In 2000, the rate of low birth weight for black mothers was double that of white mothers --13 percent
vs. 6 percent (Martin et al. 2005). Interventions to reduce the disparity in birth weight have the

4
potential to reduce disparities in other socioeconomic indicators, (e.g. educational attainment,
earnings).
In general, the proximate causes of low birth weight are well known but seemingly
tautological; low intra-uterine growth during gestation or low gestational age. However, the
underlying and ultimate causes are less understood, as interventions developed to address the
problem have yet to be successful (Paneth 1995). However, major culprits can be divided into two
major categories: pre-pregnancy maternal factors, and maternal factors during pregnancy. The
mother brings an initial level of health capital to the infant health production function. Therefore,
factors like socioeconomic status, early life health, stressors and behaviors that affect a mother's
general health may lead to low birth weight. Many of those same factors impact birth weight during
the pregnancy, directly (health behaviors, stressors) and indirectly (SES through behaviors and
constraints). Use of tobacco, alcohol or drugs has been linked to low birth weight births (Jacobson, et
al. 1994). Income and education through available choices and information on best health practices
during pregnancy potentially affect birth weight.
B. Levels and Trends in Segregation, 1950 - 1990
There are a number of ways of measuring racial segregation, but one of the most common
measures is the dissimilarity index.1 The dissimilarity index measures the relative evenness of the
distribution of black (nonblack) residents across census tracts within a larger area such as a
metropolitan statistical area (MSA), and is defined as
𝐷𝑀𝑆𝐴 =1
2∑ |
𝐵𝐿𝐴𝐶𝐾𝑖
𝐵𝐿𝐴𝐶𝐾𝑡𝑜𝑡𝑎𝑙−
𝑁𝑂𝑁𝐵𝐿𝐴𝐶𝐾𝑖
𝑁𝑂𝑁𝐵𝐿𝐴𝐶𝐾𝑡𝑜𝑡𝑎𝑙|𝑁
𝑖=1 .
Here, BLACKi is the number of African Americans in an area (usually a census tract) i and
BLACKtotal is the number of total African Americans in the MSA. NONBLACKi and NONBLACKtotal
are defined in similarly. The index measures the share of the black (nonblack) population that would
need to move census tracts so that the racial composition (percent black) of each tract in the MSA is
the same. The index ranges from 0 to 1 with a value below 0.3 considered a low level of
dissimilarity, a value between 0.3 and 0.6 as a moderate level, and above 0.6 as a high level (Massey
1 Massey and Denton (1988) define five dimensions of segregation: evenness (dissimilarity), exposure (isolation),
concentration (the amount of physical space occupied by the minority group), clustering (the extent to which
minority neighborhoods abut one another), and centralization (proximity to the center of the city). We focus solely
on the dissimilarity index in this version of the paper. Data collection is underway to construct the centralization
index back to 1950.

5
and Denton 1993).
Cutler, Glaeser, and Vigdor (1999) find large changes in segregation over time using this
index, with the average value increasing from 0.49 to 0.68 between 1890 and 1940, increasing to
0.73 in 1970, and then falling to 0.56 in 1990.2 They find similar trends in segregation when
estimating the average racial composition of the neighborhood for black city-dwellers in each of
these years. The average black city-dweller lived in a neighborhood that was 27 percent black in
1890, but this increased to 43 percent in 1940 and 68 percent in 1970, before falling slightly to 56
percent in1990. Cutler, Glaeser, and Vigdor (1999) propose that the evolution of segregation can be
split into three distinct periods of development, which can be seen in figure 1. African-American
segregation in cities first developed between 1890 and 1940 during the first wave of the mass
movement of blacks from the South to the urban North. Cities experienced an expansion of
segregation during the second phase, 1940-1970, after which segregation levels declined in all
regions of the country as blacks moved to formerly all-white suburbs. Segregation levels are
correlated with faster black population growth between 1910 and 1970, which is consistent with the
increase in segregation being at least partially driven by the Great Migration of black residents into
Northern cities. Between 1970 and 1990, segregation is negatively correlated with nonblack
population growth, which is consistent with desegregation following the Fair Housing Act of 1968,
after which black residents moved into previously all white neighborhoods. Interestingly, Cutler,
Glaeser, and Vigdor find that the decline in segregation between 1970 and 1990 has little to do with a
rise in the black income or education. Rather, segregation levels declined for all education groups.
Cutler, Glaeser, and Vigdor (1999) provide three distinct theoretical reasons for observed
segregation in neighborhoods, which they describe as the "ports of entry", "collective action racism",
and "decentralized racism" theories. The ports of entry theory assumes that the preferences of black
residents are driving segregation, and that black residents, particularly recent migrants, have a
preference for living near other black residents. The collective action racism and decentralized
racism theories, however, assume that segregation is driven by the preferences of nonblacks.
According to the collective action theory, white residents may use policies such as racial zoning or
restrictive covenants to prevent black residents from living in white neighborhoods. This differs
from decentralized racism, under which white residents still have a preference for racial segregation,
2 We use Cutler, Glaeser, and Vigdor’s segregation data, but find slightly different averages for 1970 and 1990 (0.74
and 0.62) which is due to the differences in our samples. CGV’s averages include 60, 109, 211, and 313
cities/MSAs in 1890, 1940, 1970, and 1990, respectively, while we limit our sample to a consistent group of 168
MSAs.
6
but are simply willing to pay a premium to live in a white neighborhood, as opposed to taking action
to keep black residents out. Cutler, Glaeser, and Vigdor (1999) explore the likelihood of these
theories by assessing the relationship between segregation and black housing prices over time. The
authors find that segregation is correlated with relatively higher black rental rates (compared to
nonblacks) between 1940 and 1970, which is consistent with either the ports of entry or the collective
action racism theories. However, they posit that migrants would be willing to pay a higher premium
under the ports of entry theory, for which they find no evidence, which they interpret as support for
the collective action theory. Furthermore, the authors find that the relationship between segregation
and black rental rates becomes negative between 1970 and 1990, which is consistent with the
decentralized racism theory.
C. Residential Segregation and Low Birth Weight
Residential racial segregation may have adverse effects on birth weight by leading mothers to
have more or less of any of the factors discussed above. For example, segregation may affect infant
health through its effects on a variety of social and economic outcomes. Previous work by Cutler
and Glaeser (1997) and Ananat (2011) finds that segregation leads to lower educational attainment
and income among black residents, and higher rates of single motherhood (Cutler and Glaeser 1997).
Lower educational attainment may lead to worse infant health either if it makes women less able to
afford prenatal care, or if it causes women to have inferior information about pregnancy health (Ellen
2000). Marital status has also been found to be highly correlated with birth outcomes, which may be
due to its relationship with income (e.g., low income women are less likely to be married), or
unexpected pregnancies (Ellen 2000). It is important to note, however, that while segregation has
been found to be linked with lower socioeconomic status, this relationship is a relatively new
phenomenon. Collins and Margo (2000) find that the adverse relationship between segregation and
socioeconomic outcomes such as income and single motherhood developed in the 1970s and
strengthened in the 1980s. Therefore, to the extent that segregation’s effect on infant health works
through this socioeconomic channel, segregation may have had a less adverse effect on low birth
weight and infant mortality before 1990.
In addition to affecting socioeconomic status, segregation may also influence infant health
through its effects on women’s behavior during pregnancy. This could work through reduced access
to medical care or grocery stores, which may have reduced prenatal care and nutritional quality
during pregnancy. It is also possible that segregation reduces exercise during pregnancy, if
7
segregation is associated higher crime rates and/or lower access to public goods such as gyms or
parks. In this scenario, women in these cities may have fewer opportunities to exercise.
Segregation may have further effects on infant health through its effect on mothers’ stress
(Ellen 2000). This may work through higher crime rates and increased unemployment and could
have a direct effect on her pregnancy, by weakening her immune system (Hoffman and Hatch 1996)
or an indirect effect on her pregnancy, if she copes with stress by adopting negative behaviors such
as smoking or drinking. Finally, segregation may also influence birth outcomes and maternal health
through exposure to environmental hazards (Ellen 2000). Predominantly black neighborhoods may
be exposed to higher levels of pollution, through proximity to factories, or may have lower quality
housing, containing higher levels of mold, allergens, and/or vermin, all of which may have adverse
effects on infant health.
III. Data
To better understand the relationship between segregation and infant health, we use MSA-
level data on infant health outcomes, segregation, and economic characteristics. The MSA-level
health data comes from the National Vital Statistics System of the National Center for Health
Statistics (NCHS 1970-90). We use the individual-level natality files and aggregate birth
characteristics, such as gestational age and birth weight, by MSA of residence. This individual-level
data is available for the years 1968 and after. We are interested in birth outcomes in 1970, 1980, and
1990, and combine data from two years for each decade observation to minimize noise from year-to-
year variation. We therefore use data for 1970 and 1971 for 1970, data from 1980 and 1981 for 1980,
and data from 1990 and 1991 for 1990.3 The benefit of aggregating the data at the MSA-level is that
we can then compare our results to the pre-1968 period, for which individual-level data is not
available. We link the infant health data to MSA-level segregation data for 1970-1990 from Cutler,
Glaeser, and Vigdor (1999).
A. Descriptive Statistics and Comparisons
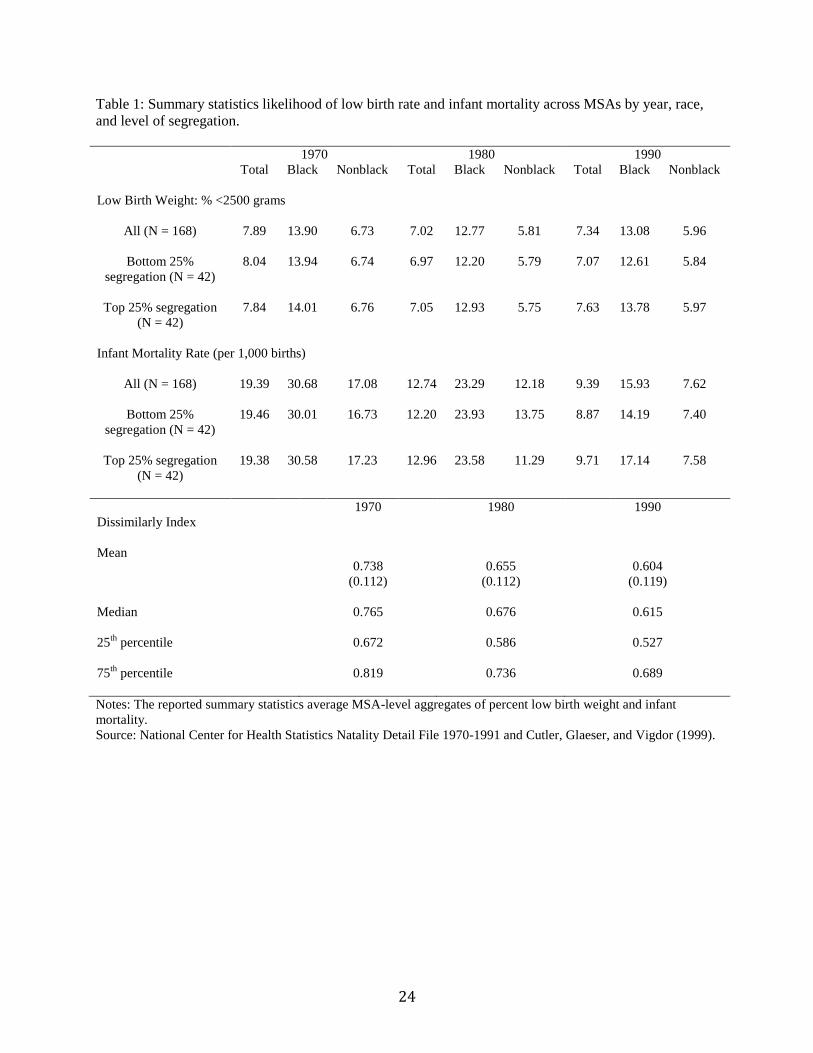
Summary statistics of low birth weight and infant mortality are reported in table 1. While
there is a noticeable decline in infant mortality rates, both for the black and nonblack populations
3 While we combine data from 1980 and 1981 for the 1980 low birth weight figures, we only use data from 1980 for
infant mortality. The individual-level data in the 1981 Natality Files are a reduced sample and do not add up
perfectly to total births in 1981, and so we cannot compare it to the total number of deaths. Future versions of this
paper will use the 1981 infant mortality and birth counts reported in the published volumes of Vital Statistics.
8
between 1970 and 1990, there is little change in the percentage of low birth weight. There was a
slight decline in low birth weight between 1970 and 1980, but it actually increased slightly for both
the black and nonblack populations in our sample between 1980 and 1990. The racial differences in
low birth weight and infant mortality are also very persistent over time. The likelihood of low birth
weight and infant mortality rates for the black population are approximately double those of the
nonblack population in all three years. Table 1 also reports average birth outcomes for MSAs in the
top and bottom quartile of segregation in each year. Comparing the differences in averages between
these two quartiles, one can see only trivial differences in birth outcomes for black and nonblack
populations in 1970 and 1980. By 1990, however, the propensity of black low birth weight is 9.2
percent (1.17 percentage points) higher in MSAs in the highest segregation quartile compared to
those in the lowest quartile. The difference in black infant mortality rates is 20.8 percent (2.95
percentage points). For the nonblack population, outcomes are slightly worse in the highest
segregation quartile in 1990, although the differences are much smaller (5.97 percent low birth
weight, compared to 5.84 percent, and 7.58 deaths per 1,000 births, compared to 7.40 deaths).
We use the individual-level birth certificate data to take a first look at the correlation of
segregation and low birth weight. In figure 2, we use kernel weighted local polynomial smoothing to
plot the empirical probabilities of having a low birth-weight pregnancy outcome in each bin of the
dissimilarity index. In these figures, we show only the relationship for black mothers. We find no
relationship, nor change, for the sample of nonblack mothers. We can clearly see a gradient emerge
over time. The figure captures, not only the secular decline in low-birth-weight outcomes, but also
the increasing negative impact of segregation on birth outcomes for black mothers. The gradient in
1970 is relatively flat with no discernible trend, whereas by 1990, the probability of low birth weight
is clearly increasing with the dissimilarity index.
B. Supplementary Data
We link these data to Census data for MSA population, black population, and median family
income for 1970, 1980, and 1990. The population and black population counts for 1970-1990 come
from Cutler, Glaeser, and Vigdor’s supplementary files (1999) and the median family income
measures for 1990 come from Cutler and Glaeser (1997). We entered the median family income data
for 1970 and 1980 directly from the Census (United States 1972 and 1984). We limit our analysis to
MSAs with data for 1970, 1980, and 1990 that also had black populations of at least 5,000 in all
years. This gives us a sample of 168 MSAs.
9
We also link our data to Ananat’s (2011) data on 19th century railroads, which we use as a
robustness check. The railroad data is only available for select MSAs in the non-South, and so we
are left with 60 MSAs that have segregation data for 1970-1990 and have a black population of at
least 5,000 in all years when we use these data.
IV. Empirical Strategy and Main Results
A. OLS Results
To assess the relationship between residential segregation and infant health, we begin by
running simple regressions of MSA-level infant health measures on segregation. We pool our data
from 1970-1990 so that our sample contains three observations for each of the 168 MSAs. The
variables of interest, y, are percent of births that are low birth weight and the infant mortality rate
(per 1,000 births). Figure 3 shows the emergence of a correlation of segregation and low birth weight
at the MSA-level after 1970. To more formally assess the correlation, we estimate the following
equation
(1) 𝑦𝑀𝑆𝐴,𝑡 = 𝛽90𝑆𝐸𝐺𝑡 + 𝛽80(𝑆𝐸𝐺𝑡 ∗ 𝑌80) + 𝛽70(𝑆𝐸𝐺𝑡 ∗ 𝑌70) + 𝜃𝑡𝑀𝑆𝐴𝑋𝑀𝑆𝐴,𝑡 + 𝛿𝑟,𝑡 + 𝛾𝑡 + 휀𝑀𝑆𝐴,𝑡
We interact the variable of interest, segregation, with year indicator variables to allow the
relationship between infant health and segregation to change over time, with 1990 as the base year.
The estimate for β90 can be interpreted as the relationship between segregation and infant health in
1990. The coefficients on the segregation by year interaction terms, β80 and β90, can be interpreted
as the differential impact of segregation in 1980 and 1970, relative to 1990. We run this regression
using birth outcomes for the total population, black population, and nonblack population separately,
and with a variety of controls. The first specification includes only year fixed effects, 𝛾𝑡. We then
add region by year fixed effects (𝛿𝑟,𝑡), and finally MSA-level controls for the log of population,
percent black population, and log median family income, all allowed to have a time-varying effect.4
4 Cutler and Glaeser (1997) and Ellen (2000) estimate the effects of segregation using individuals as observations
and interact segregation measures and controls with an indicator for whether the observation was black. The choice
to include non-blacks in the sample and interact with black depends on whether you believe non-blacks are a good
comparison group to capture omitted city-level characteristics, or if you want the full effect segregation, which
would require adding the black and non-black effects together. For the most part, the choice is irrelevant. We find
no effects for the white sample. Appendix table 1 contains a specification at the individual level comparable to that
in Cutler and Glaeser (1997) and Ellen (2000). We estimate each year separately as in Collins and Margo (2000).
10
Our coefficients of interest, 𝛽90, 𝛽80, and 𝛽70, can be interpreted as causal effects of
segregation if there are no omitted variables that are correlated with segregation and that directly
influence our infant health measures. This, of course, may be an unrealistic assumption. The biggest
threat to our causal interpretation of our segregation coefficients is likely selection. Individuals
choose whether they live and so if individuals with worse birth outcomes choose to live in MSAs
with higher rates of segregation, we may find a spurious relationship between segregation and infant
health. However, there are several reasons why we think that selection into more/less segregated
places will not bias our results. First, while there is likely a great deal of selection at the
neighborhood level (e.g., poor individuals with worse health outcomes living in poorer, more
segregated neighborhoods), there is probably less selection at the level of the MSA. Because we
identify the effects of segregation by making cross-MSA comparisons, our results will not be biased
by selection at the neighborhood level. Moreover, segregation might have an effect on all births
(black or nonblack), even those living in the less segregated parts of the MSA. Thus, a within-MSA
comparison of outcomes between mothers in low- and high-segregation neighborhoods would be
biased.
While we cannot rule out the possibility of selection of residence across MSAs, previous
work suggests that the importance of this type of selection is small and does not pose a significant
problem. First, Cutler and Glaeser (1997) use an IV strategy to instrument for MSA segregation in
1990 and find estimates similar to their OLS results for income, single-motherhood, and completion
of high school.5 Ellen (2000) follows the same strategy and finds IV estimates similar to OLS results
for segregation's impact on low birth weight in 1990. Thus, the amount of omitted variable bias
appears to be small, at least for the 1990 sample year. Second, to the extent that we are interested in
the change in the coefficient over time, and only a changing bias will cause problems for our
interpretation of the OLS results.
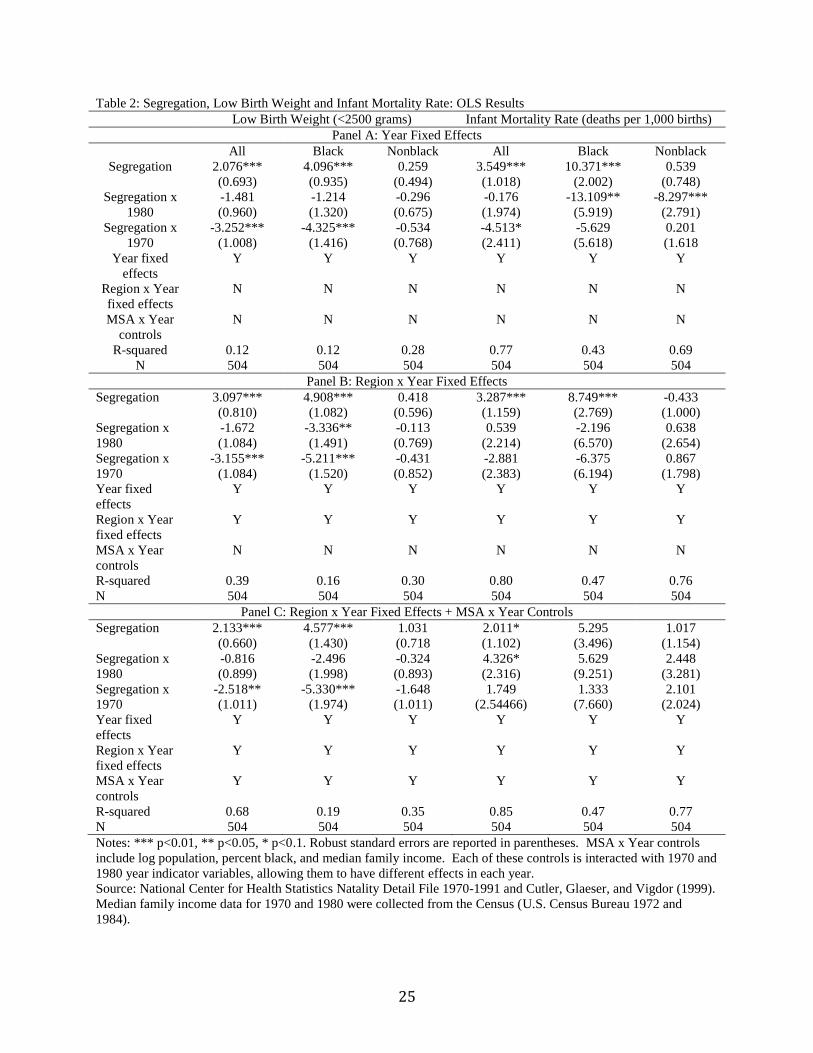
Panel A of table 2 reports results with only segregation and year controls. Here, we find a
strong and positive relationship between segregation and both birth outcomes in 1990. A one
standard deviation increase in segregation is correlated with a 0.25 percentage point increase in the
propensity of low birth weight (a 3.4 percent increase from the mean of 7.34 percent) and an increase
of 0.43 deaths per 1,000 births (a 4.6 percent increase from the mean of 9.39). However, it appears
The differences are minimal between our main specification at the MSA-level on the black sample only and the
interaction specification. 5 Cutler and Glaeser (1997) use two instruments: (1) the number of governments in an MSA and the
intergovernmental transfer share of revenue, (2) the number of intra-county and inter-county rivers.
11
that these results are being driven by the black population. While the coefficients on segregation for
the nonblack population are small and statistically insignificant, the relationship between segregation
and black outcomes is much stronger and larger. A one standard deviation increase in segregation is
correlated with a 0.49 percentage point increase in the propensity of low birth weight (a 3.7 percent
increase) and 1.24 additional deaths per 1,000 births (a 7.8 percent increase).
When looking at the segregation x year coefficients, it is clear that the relationship between
segregation and adverse birth outcomes was not always as strong as in 1990. While not statistically
significant, the coefficients for 1980 in the low birth weight regressions are consistent with the
effects of segregation being smaller in 1980 than 1990. The coefficient on the interaction term for
1970 is statistically significant for the entire population and black population measures, and suggest
that there was no positive relationship between low birth weight and segregation in 1970. The results
are also consistent with the effects of segregation on infant health increasing in the 1980s. When
looking at the entire population, it appears that segregation may have had a slightly less adverse
effect on the infant mortality rate in 1980 than 1990, and had no adverse effect on infant mortality in
1970. When we run the infant mortality regressions separately by race, we do not see evidence of the
same linear change in the relationship between segregation and mortality, although the results do
suggest that the segregation “effect” on black infant mortality rate was largest in 1990.
Results with region by year fixed effects are reported in Panel B of table 2 and results with
additional MSA controls are reported in Panel C. The low birth weight results are robust to the
inclusion of region and MSA controls, and suggest that segregation had large, adverse effects on
birth weight in 1990, but no adverse effects in 1970. For infant mortality, results are similar with
region fixed effects, but the majority of the segregation coefficients lose statistical significance when
additional MSA controls are included. The coefficient estimates for segregation in 1970 change sign,
however, although they are also imprecisely estimated.
B. Robustness Check: Railroad IV
As discussed above, the potential for bias in the OLS estimates remains from other omitted
city-level characteristics. However, IV strategies followed by Cutler and Glaeser (1997) and Ellen
(2000) in different contexts find small differences between the OLS and IV estimates. Moreover,
only a changing bias in the OLS estimates hinders our interpretation of the trend. In addition, it is
interesting that the segregation coefficients are not greatly diminished when control variables are
added. In fact, in many cases, the coefficients on segregation actually get stronger. To further test the
robustness of our results, we adopt Ananat’s (2011) strategy of instrumenting for segregation with a
12
railroad division index (RDI). Ananat argues that the way that railroads were laid down in Northern
cities in the 19th century were not influenced by cities’ segregation preferences. However, as African
Americans moved North during the Great Migration, even controlling for track length, cities that
were more greatly divided by railroads found it easier to segregate their new African American
populations. Ananat further shows that her measure of railroad division is not related to segregation
and economic outcomes in the early 20th century, before the Great Migration. Following Ananat
(2011), we run our regressions again including a control for length of track and instrumenting for
segregation with RDI. Also following Ananat (2011), we do not include region or additional MSA
controls. Because we only have one instrument (RDI) but have three segregation variables in our
previous specification, we estimate our IV regressions separately by year. It is important to note that
because our previous specification interacted all of our controls with year indicator variables, the
estimated effects of segregation that we found in our previous regressions are identical to estimates
from running the regressions separately by year. Because Ananat motivates the instrument by relying
on the flows of African Americans during the Great Migration, the IV results apply only to MSAs in
the North, Midwest, and West regions. Moreover, the instrument was painstakingly constructed from
detailed railroad maps, and thus not all MSAs for which we have segregation information on
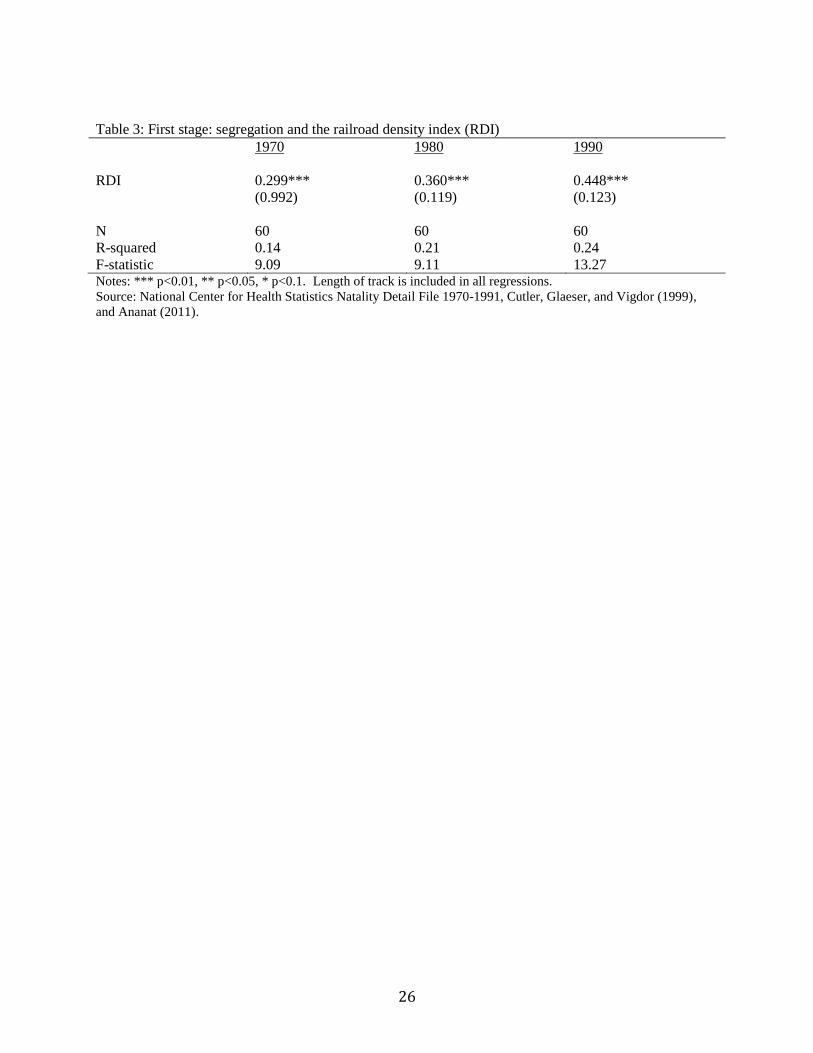
railroads. The restrictions reduce the consistent sample to 60 MSAs each year.
First stage results are reported in table 3 for convenience, and are roughly identical to those
in Ananat (2011). We find that RDI is positively and statistically significantly correlated with
segregation in 1970, 1980, and 1990. The coefficient increases over time (0.30 to 0.36 to 0.45), but is
statistically significant at the one percent level in all years. The F-statistic on the instrument is strong,
at 13.27, in 1990 and is smaller in 1970 and 1980, at 9.09 and 9.11.
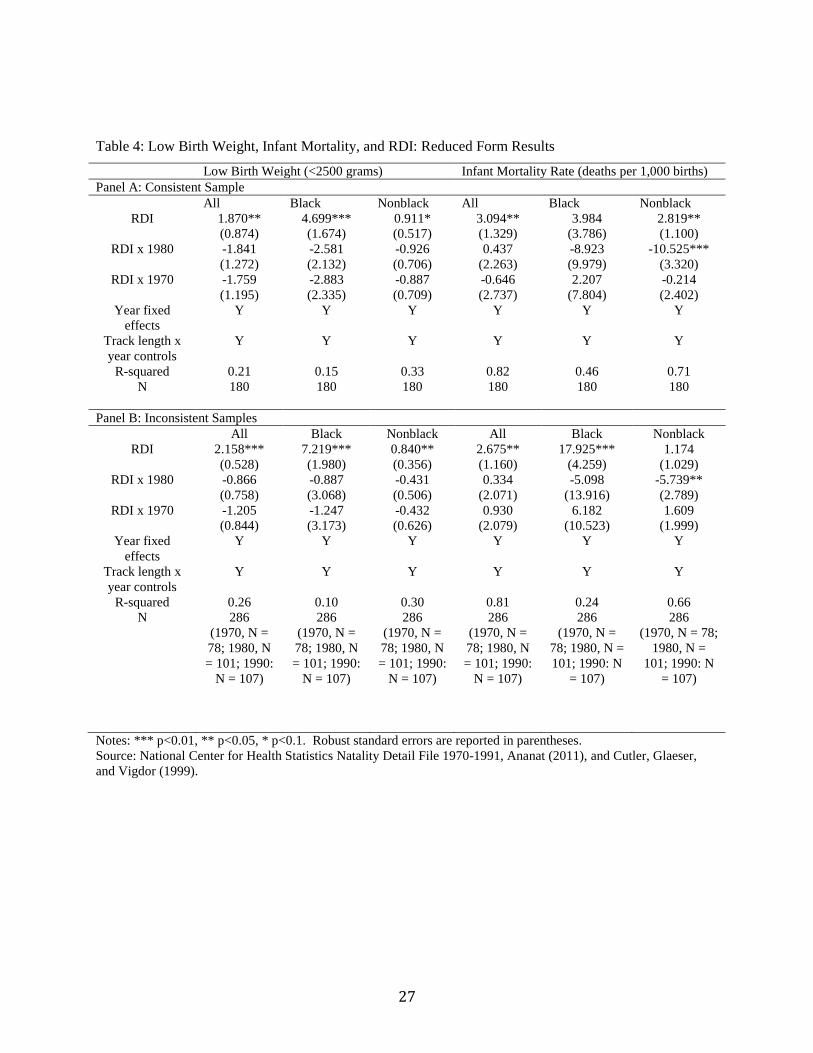
Reduced form regressions of low birth weight and infant mortality on the instrument, RDI,
and length of track are reported in table 4. In the reduced form regressions, RDI is positively
correlated with low birth weight and infant mortality in 1990 in all regressions. The relationship
between RDI and infant health is greatly diminished in 1980 and 1970 in almost all regressions. The
relationship between RDI and 1980 outcomes is somewhat surprising, however, in that the 1980
effects seem to be similar in magnitude to those in 1970 for low birth weight. However, when we run
the reduced form regressions with a larger, albeit inconsistent sample of MSAs, the relationship
between RDI and low birth weight appears to worsen consistently over time.
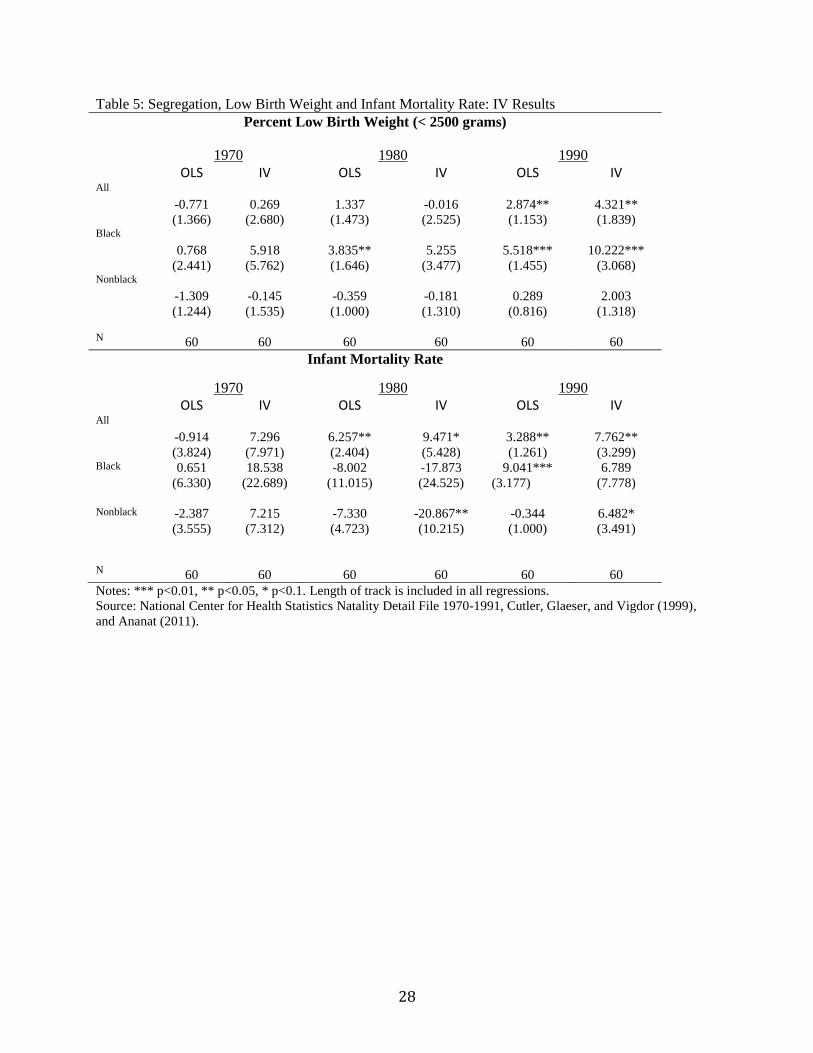
Second stage results are reported in table 5. We also report OLS results using a consistent
sample for comparison. The OLS results for low birth weight and infant mortality for the reduced
sample are qualitatively similar to those of the larger sample reported in table 2. The IV estimated
13
effects are also larger than the OLS estimates in most cases. The results for low birth weight are
consistent with a story in which an adverse relationship between segregation and low birth weight
develops over time and is worse for the black population. For 1990, the IV segregation coefficient is
4.32 (statistically at the five percent level) for the whole population and is 10.22 (statistically
significant at the one percent level) for black outcomes. For the non-black population, the coefficient
is 2.00 and not statistically significant. With infant mortality, the IV estimates are consistent with an
adverse effect of segregation developing in the 1970s for the population as a whole, although the
estimates for race-specific outcomes are not consistent with positive effects until 1990.
V. Why Does the Relationship Change Over Time?
In this section, we turn to explaining the evolution in the relationship between segregation
and infant health documented earlier. We move from the MSA-level to individual-level data pulled
from millions of birth certificates. Each certificate lists a number of useful variables for the parents
that correspond to particular pathways and mechanisms through which the segregation effect might
be working. We face a trade-off in that while the individual data hold this wealth of useful
information on parental characteristics, electronic versions of it only exist back to 1968 and varying
frequency with which states report the characteristics. Thus, in this section we are only testing
hypotheses on the post 1970 evolution of the treatment effect. In addition, we focus on the black
population to facilitate interpretation of the results. Running a pooled model with interactions with
race does not substantively change the interpretation.
A. Potential Correlates with Segregation
Evidence suggests that African Americans in high segregation MSAs have lower income,
lower education, and are more likely to be single-mothers (Cutler and Glaeser 1997). Ellen (2000)
hypothesizes that behavioral choices during pregnancy such as tobacco, alcohol, or drug use, receipt
of prenatal care, nutrition, and environmental factors such as pollution potentially drive the negative
impact of segregation on birth weight. Birth certificates back to 1970 record marital status, month of
first prenatal care, mother's detailed education, age of mother, if the birth was in a hospital, birth
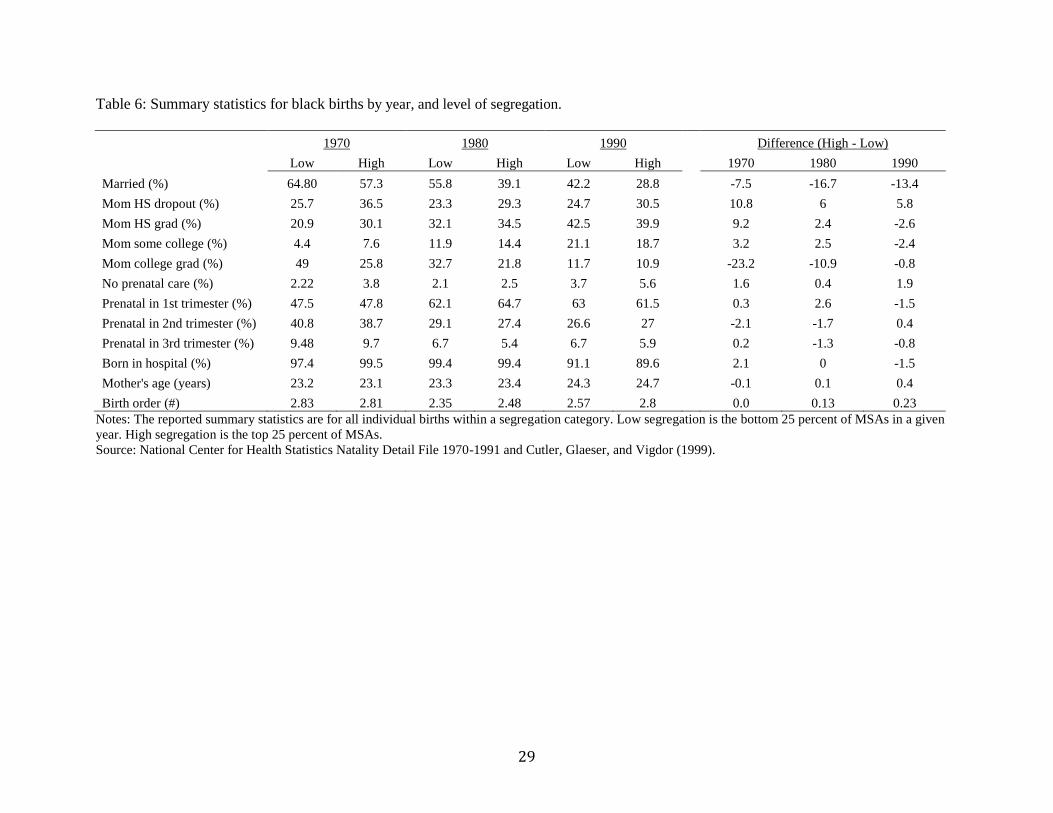
order, sex, father's detailed education, and father's age.6 Table 6 reports mean values for these
individual-level correlates that we wish to interpret as potential causal mechanisms by low- and high-
6 A number of questions were included on birth certificates prior to 1970, but electronic versions of this data are
unavailable.
14
segregation MSAs (lower and upper 25 percent of MSAs ranked by the dissimilarity index). Marital
status, receipt of prenatal care, and birth order seem to be deteriorating over time for high-
segregation MSAs relative to low-segregation MSAs.
Next, we run OLS regressions to see if we find those same relationships in our sample of
black mothers as those in the literature.7
(2) 𝑌𝑖,𝑡 = 𝛽𝑡𝑆𝐸𝐺𝑡 + 𝜃𝑡𝑋𝑡,𝑀𝑆𝐴 + 𝛿𝑟,𝑡 + 𝛾𝑡 + 휀𝑖,𝑡
and
(3) 𝑌𝑖,𝑡 = 𝛽90𝑆𝐸𝐺𝑡 + 𝛽80(𝑆𝐸𝐺𝑡 ∗ 𝑌80) + 𝛽70(𝑆𝐸𝐺𝑡 ∗ 𝑌70) + 𝜃𝑡𝑀𝑆𝐴𝑋𝑀𝑆𝐴,𝑡 + 𝛿𝑟,𝑡 + 𝛾𝑡 + 휀𝑖,𝑡
Each individual outcome is measured in period t (1970, 1980, or 1990). The percent black and the
natural log of population at the MSA-level are interacted with year, and year-specific regions
controls are included. We want to document two facts with this exercise: a positive relationship in
our data between segregation and a number of potential causal pathways to low-birth-weight using
equation 2, and determine if the relationship is changing between 1970 and 1990 in a way that can
potentially explain the increasing negative impact of segregation on black birth outcomes using
equation 3. Thus, both the level and change in the coefficient on the segregation measure are
meaningful.
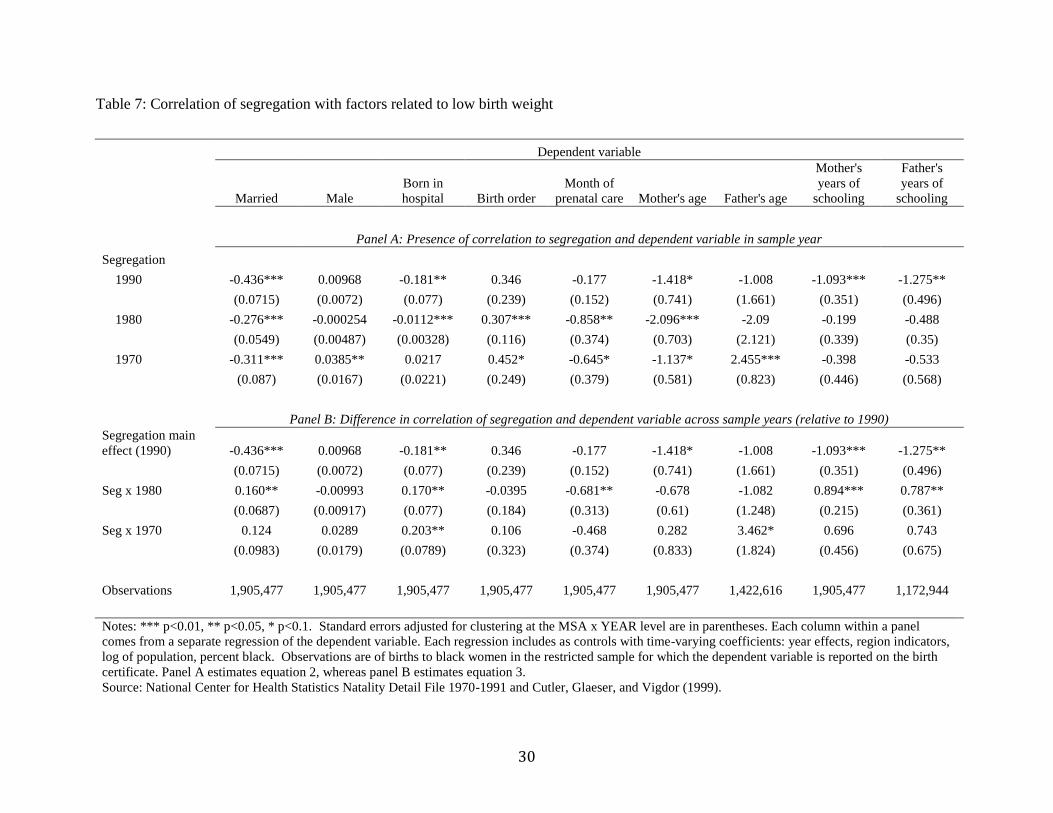
From table 7, we see that (in some years, but not others) segregation is correlated with
marital status, birth order, receipt of prenatal checkups, the age of mother, the age of father, years of
schooling for both mother and father, the probability male, and the probability of an in hospital
delivery. We do not want to take a strong stand on whether the correlations we find are indeed
causal, but they do shed light on the possible mechanisms through which segregation affects the
probability of low-birth weight. Thus, these variables are potentially endogenous controls when
included in an estimate of equation 1 of segregation’s impact on low birth weight.
Interestingly, the relationships for a number of the potential mechanisms change between
1970 and 1990. Marital status is clearly deteriorating. We find a statistically significant and
economically large increase in the correlation between segregation and single-motherhood, matching
the trend documented in Collins and Margo (2000). Hospital births, mother's years of schooling, and
father's years of schooling also are worsening in their relationship with segregation.
7 Probit regressions provide the same pattern over time.

15
B. Explanatory Power of Covariates for the Changing Relationship Between Segregation and Low
Birth Weight
Next, we recreate the earlier MSA-analysis using the individual data to document the
increasing effect of segregation on causing low-birth weight outcomes for black babies. After
showing the relationship holds on the sample of birth certificates for which measures of potential
causal mechanisms is recorded8, we explore how changes in the observable characteristics and
changes in the effect of those characteristics can explain the emergence of the negative impact of
segregation on birth outcomes post-1970. We estimate the following equation at the individual-level:
(4) 𝐿𝐵𝑊𝑖,𝑡 = 𝛽90𝑆𝑡 + 𝛽80(𝑆𝑡 ∗ 𝑌80) + 𝛽70(𝑆𝑡 ∗ 𝑌70) + 𝜃𝑡𝑀𝑆𝐴𝑋𝑀𝑆𝐴,𝑡 + 𝜃𝑡
𝑖𝑋𝑖,𝑡 + 𝛿𝑟,𝑡 + 𝛾𝑡 + 휀𝑖,𝑡
, which includes the main effect of segregation and segregation interacted with indicators equal to
when individual level one if the observation is from 1980 (Y80) and if the observation is from 1970
(Y70). Time-varying controls at the MSA-level are not included in 𝑋𝑀𝑆𝐴,𝑡 and individual-level
controls, when included, are in 𝑋𝑖,𝑡. All estimates include time-varying region fixed effects and year
effects.
The purpose of this estimate is to determine if there is a statistically significant change in the
segregation-low birth weight relationship over time. The three coefficients of interest are the three
betas: 𝛽90 for the full impact in the 1990 sample, and 𝛽80 and 𝛽70 for the sample year effects relative
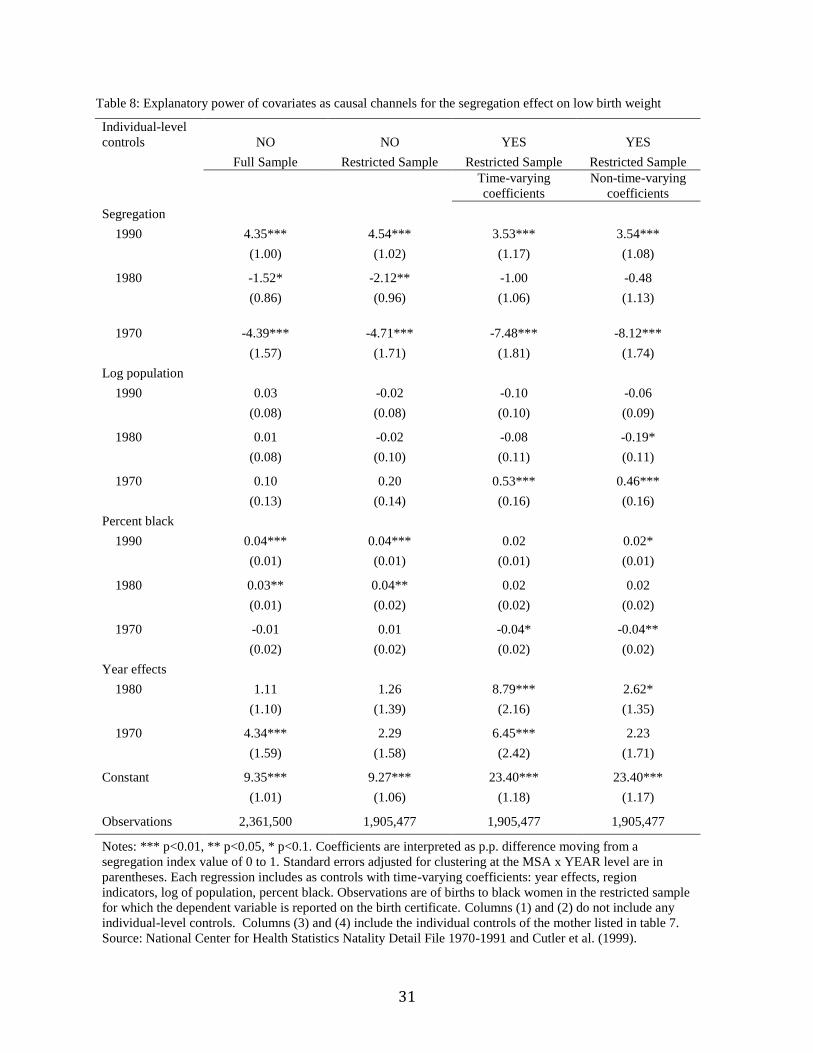
to that in 1990. Column (1) of table 8 estimates equation 4 for the full sample of data, and column
(2) reports results for the restricted sample for which covariate information is recorded. Neither
column includes any individual-level controls. We see that moving from the full sample to the
restricted sample does not substantively change the impact of segregation on the probability of low-
birth-weight, nor does it change the emergence of the negative impact after 1970. In fact, the change
in the relationship is more pronounced as it increases from a lower base in 1970. The differences
between sample years remain statistically significant (relative to 1990).
Second, we include individual-level controls for covariates that have a potential independent
effect on low birth weight through segregation causing a compositional change of mothers.9 Column
(3) allows the coefficients on these covariates to vary with the sample year, whereas column (4)
requires the coefficients to remain constant across years. The inclusion of the new controls changes
9 See appendix table 2 for the full estimation output for column 3.

16
the interpretation of the results, slightly. The estimate of the segregation effect is smaller in 1990,
larger in 1980, and smaller in 1970. The 1990 coefficient is slightly smaller (1.01 p.p. or 22 percent),
but remains statistically significant. Thus, the additional measures for potential causal pathways
explain a portion of the segregation effect, but not the majority. Segregation still causes a large
independent increase in the likelihood of low birth weight conditional on mother's education, marital
status, receipt of prenatal care, birth order, mother's age, and hospital birth. We have determined that
a number of the theorized pathways for segregation to cause low birth weight in African American
babies do not explain the full effect.
A novel result of our paper is that the change in the relationship over time is, again, only
partially explained by a number of the theories. In 1980, the additional controls raised the estimate
by 1.12 p.p. relative to 1990, and it is no longer significantly different from the 1990 estimate. We
interpret this as evidence that part of the increase in the effect from 1980 to 1990 can be explained by
segregation caused changes in either the composition of the characteristics mothers or the effect of
those characteristics on low birth weight. However, the estimate for 1970 decreases relative to 1990
once controls for causal pathways are included for an 7.48 p.p. increase in the relationship from 1970
to 1990 (1990 estimate decreases 1.12 p.p. and 1970 decreases by 2.77 p.p.). Column (4) imposes
constant coefficients across sample years by using 𝜃𝑖 𝑋𝑖,𝑡 instead of 𝜃𝑡𝑖𝑋𝑖,𝑡. Results are not
substantively different from those in column 3, and if anything slightly magnify the patterns. In sum,
the evidence suggests that changes in the composition of mother's characteristics explains a large
portion of the strengthening negative impact of segregation on low birth weight from 1980 to 1990.
However, compositional changes seem to have worked in the opposite direction over the 1970s,
leaving more as unexplained changes than the raw difference between 1970-1990.
Solely looking at how the coefficients on segregation change when adding controls obscures
the individual impacts of each covariate. To better explore how each of the covariates can explain
changes over time, we implement a method based on the omitted variable bias formula that allows
estimates of the individual impact of a covariate on the coefficient of interest conditional on all other
covariates. The typical method in economics is to take the base estimate of the impact of segregation
and then sequentially add variables believed to represent causal channels with the size of changes in
the coefficient estimate on segregation determining the relative importance of each (see Ellen
(2000)). The problem with this method is that the sequence in which the variables are added can
dramatically change the results and interpretation of the relative impacts of each. Gelbach (2015)

17
develops a method that accomplishes the task wherein the results do not depend on the order of
inclusion of the variables. We briefly explain the mechanics below.
Let the population linear relationship for a given sample year be
𝐿𝐵𝑊 = 𝛼 + 𝑋𝛽1 + 𝑍𝛽2 + 𝑢 ,
where X consists of the measure of segregation, the set of MSA-level controls, and region indicators.
Let Z be the set of individual-level covariates representing the potential causal mechanisms for
segregation's effect on low birth weight. From the full specification, we get the OLS estimators �̂�1𝑓𝑢𝑙𝑙
on X and �̂�2 on Z. From the base specification of LBW on X that does not include Z, we get the OLS
estimator �̂�1𝑏𝑎𝑠𝑒 with a probability limit of
plim �̂�1𝑏𝑎𝑠𝑒 = 𝛽1 + Γ𝛽2 = 𝛽1 + δ
which is the standard omitted variable bias formula with Γ as the matrix of coefficients from
projecting Z onto X. In our application, we interpret �̂�1𝑏𝑎𝑠𝑒 as the full segregation treatment effect,
where 𝛽1 is the probability limit of �̂�1𝑓𝑢𝑙𝑙
from the full specification that includes all of the potential
mechanism variables. The difference between the base specification and the full specification is
�̂� = �̂�1𝑏𝑎𝑠𝑒 − �̂�1
𝑓𝑢𝑙𝑙, which then can be decomposed into the components related to the different
mechanisms in Z. Suppose that Z consists of K variables. Then we can estimate the contribution of
each mechanism variable (k) to the full segregation treatment effect by
�̂�1𝑏𝑎𝑠𝑒 − �̂�1
𝑓𝑢𝑙𝑙= �̂� = Γ̂�̂�2 = ∑ Γ[k]̂ �̂�2𝑘
𝐾
𝑘=1
= ∑ �̂�𝑘
𝐾
𝑘=1
where Γ[k]̂ is the estimated coefficient from the projection of kth element of Z on all X variables, �̂�2𝑘
is the estimated coefficient on the kth element of Z from the full specification. We combine our 15
covariates into 7 groups (e.g. the four categories of mother's education are combined into the single
group "Mother's Education").
We apportion the change in the segregation coefficient from the base to the full specification,
for each sample year separately. Column (1) of table 9 lists the coefficient estimates from the base
specification, whereas column (2) reports the coefficient estimate from the full specification. First
off, we can see that including the extra individual information does provide some explanatory power
for 1990, but not for 1980 or 1970. The remaining columns place individual covariates into easily
understandable groups and report the contribution in percentage points to the difference between the
base and full specifications. Alternatively, the results can be interpreted as the amount in percentage
18
points that a given group of covariates moves the coefficient on segregation conditional on all other
covariates.
The evidence suggests marital status plays an important channel for the segregation effect in
every year. In 1990, 1.58 p.p. of the full segregation effect works through the marital status channel.
This makes up 156 percent of the difference between specifications or 35 percent of the full
segregation effect for 1990. Comparing results across years, we find that the contribution of marital
status increases in terms of percentage points. Single-motherhood increases the segregation effect by
0.6 p.p. in 1970, 0.9 p.p. in 1980, and 1.6 p.p. in 1990.
Prenatal care also plays a large role for the segregation effect, but no clear trend emerges.
Prenatal care increases the segregation effect by 1.2 p.p in 1970, but reverses signs to -1.49 p.p. in
1980. By 1990, prenatal care contributes no statistically significant impact on the segregation effect,
but remains negative. This shows an important contribution of examining each covariate
independently. By 1980, marital status and prenatal care are partially canceling each other out
concealing the underlying trends.
Mother's education seems to be increasing in its importance over time with small and
insignificant contributions in 1970 and 1980, but a large and significant effect of 0.46 p.p. in 1990.
This is roughly 10 percent of the full segregation effect, 46 percent of the difference between
specifications, and 30 percent of the contribution of marital status. The age of the mother and birth
order seem to be decreasing in importance. The importance of a hospital birth is small and
insignificant in 1970, but turns statistically significant by 1980 and remains small in size. By 1990,
hospital births were making a large and negative contribution to the segregation effect, reducing the
size of the coefficient by 0.79 percentage points.
In sum, the exercise to separate the independent impacts of each group of covariates suggests
a number of countervailing trends in the composition of mother's characteristics and effects of those
characteristics on low birth weight. First, a relatively large portion of the segregation effect works
through the marriage channel, with an increasing contribution over time. A slightly smaller portion
works through mother's education, again increasing in importance. The contribution of prenatal care
and hospital births is large, but varies in sign over time and counteracts the effect of marital status
and mother's education. Above all, the majority of the segregation effect remains unexplained.
VI. Discussion
We document, first, a causal relationship between residential racial segregation and increased
likelihood for low birth weight and infant death. The relationship is only present for births to black
19
mothers. Second, we document the fact the negative impact of segregation evolves over time,
emerging only after 1970 and increasing during the 1980s. The pattern of emergence after 1970
mimics that found for other non-health outcomes such as educational attainment, income, idleness,
and single-motherhood (Collins and Margo 2000; Vigdor 2002).
The more difficult aspect of the literature is determining the cause of segregation's negative
impact on birth outcomes. Using a detailed set of parental characteristics and behaviors from
individual birth certificates, we estimate how much of the effect is mediated by these potentially
endogenous factors, and the changes over time. First, the detailed measures explain only 30 percent
of the full effect in 1990, 0 percent in 1980, and widen the effect in 1970. The full segregation
treatment effect is not explained by our measures of a number of the theoretical reasons posed in the
literature. There remains an unexplained portion of the effect independent of the causal mechanisms
examined.
Finally, for theories for which we have measures to include as control variables, they seem to
explain most of the change in the relationship between 1980 and 1990, but widen the gap from 1970-
1980 and 1970-1990, leaving more to be explained than the raw gap. We use the accounting method
developed in Gelbach (2015) to find the individual contribution of each parental characteristic.
Marital status and mother's education play an important role for the negative effect of segregation,
increasingly so. However, marital status, in particular, increased the effect in 1970 as well as 1990.
The contribution of prenatal care plays a countervailing role to marital status. Large and negative in
1970, prenatal care and marital status seem to cancel each other out in 1970 and 1980. The declining
importance of prenatal care leads to the eventual emergence of the negative segregation effect the
1980s.
A number of theories remain untested because of data limitations. For example Ellen (2000)
is able to use indicators of alcohol, tobacco, and drug use during pregnancy in her analysis using the
1990 data. Unfortunately, those questions were not included on the older birth certificates. The next
step in this project is to develop a strategy to tackle the remaining theories, if at all possible.
We hope in a future version of the paper to include tests for selective migration and the
importance of centralization versus dissimilarity. Vigdor (2002) finds evidence consistent with the
parent generation of the 1970 outcome cohort not choosing a destination based on segregation levels.
At the least, migrants weren't positively or negatively selected across destination cities' dissimilarity
index. However, for the parent generation of the 1990 outcome cohort, high skilled black parents are
selectively moving to low segregation cities, leaving the lower part of the skill distribution as parents
in high segregation cities. Part of the emergence of the negative impact of segregation after the

20
1970s found by Collins and Margo (2000) might be explained by this phenomenon. Using our data
we can also explore whether selective migration of the parent generation is driving the low birth
weight correlation with segregation.
The index of centralization measures the extent to which a demographic group lives close to
the central city, whereas the dissimilarity index measures the evenness of the spread across the MSA.
A number of the theories for the segregation effect stem from the deterioration of central cities
during the 1970s and 1980s: spatial mismatch and the increased use of illicit drugs. Repeating the
analysis using the centralization index and looking for differences with the dissimilarity index may
shed light on the ways which racial residential segregation affects birth outcomes (Ellen 2000). We
are in the process of collecting data to recreate this index back to 1950.10
10
Cutler, Glaeser, and Vigdor (1999) only construct this index for 1990.
21
References
Ananat, Elizabeth Oltmans. 2011. “The Wrong Side(s) of the Tracks: The Causal Effects of Racial
Segregation on Urban Poverty and Inequality.” American Economic Journal: Applied
Economics, 3(2): 34-66.
Barker, D.J.P.. 1995. “Fetal Origins of Coronary Heart Disease.” British Journal of Medicine
311(6998): 171-174.
Behrman, Jere R., and Mark R. Rosenzweig, “The Returns to Birth Weight,” Review of Economics
and Statistics, LXXXVI (2004), 586–601.
Bird ST. 1995. “Separate black and white infant mortality models: differences in the importance of
structural variable,”. Social Science Medicine, 41(11):1507–1512.
Black, Sandra E., Paul J. Devereux, and Kjell G. Salvanes. 2007. “From the Cradle to the Labor
Market? The Effect of Birth Weight on Adult Outcomes.” The Quarterly Journal of
Economics.
Collins, William and Robert Margo, 2000. "Residential segregation and socioeconomic outcomes:
When did ghettos go bad," Economics Letters, Elsevier, vol. 69(2), pages 239-243,
November.
Conley, Dalton and Neil G. Bennett. 2001. “Birth Weight and Income: Interactions across
Generations.” Journal of Health and Social Behavior 42(4): 450-465.
Curhan, Gary C., Walter C. Willett, Eric B. Rimm, Donna Spiegelman, Alberto Ascherio, and Meir J.
Stampfer. 1995. “Birth Weight and Adult Hypertension, Diabetes Mellitus, and Obesity in
US Men.” Circulation 94: 3246-3250.
Currie, Janet and Enrico Moretti. 2007. “Biology as Destiny? Short and Long-Run Determinants of
Intergenerational Transmission of Birth Weight.” The Journal of Labor Economics 25(2):
231-264.
Cutler, David M. and Edward L. Glaeser. 1997. “Are Ghettos Good or Bad?” Quarterly Journal of
Economics 112: 827-872.
Cutler, David M., Edward L. Glaeser, and Jacob L. Vigdor. 1999. “The Rise and Decline of the
American Ghetto.” Journal of Political Economy 107: 455-506.
Ellen, Ingrid Gould. 2000. “Is Segregation Bad for Your Health? The Case of Low Birth Weight.”
Brookings-Wharton Papers on Urban Affairs: 203-238.
Figlio, David, Jonathan Guryan, Krzysztof Karbownik, and Jeffrey Roth. 2014. "The Effects of Poor
Neonatal Health on Children's Cognitive Development." American Economic Review,
104(12): 3921-55.
Gelbach, Jonah B., 2015, "When Do Covariates Matter? And Which Ones, and How Much?, Journal
of Labor Economics, Forthcoming.

22
Jacobson, Joseph L., Sandra W. Jacobson, Robert J. Sokol, Susan S. Martier, Joel W. Ager, and
Seetha Shankaran. 1994. “Effects of alcohol use, smoking, and illicit drug use on fetal
growth in black infants.” The Journal of Pediatrics 124(5): 757-764.
Laveist TA.. 1993. “ Segregation, poverty, and empowerment: health consequences for African
Americans,” Milbank Quarterly, 71(1):41–64.
Martin, Joyce A., Brady E. Hamilton, Stephanie J. Ventura, Fay Menacker, and Melissa M. Park.,
“Births: Final Data for 2000,” National Vital Statistics Reports 52, no. 10 (Hyattsville, Md.:
National Center for Health Statistics, February 12, 2002).
Massey, Douglas S. and Nancy A. Denton. 1988. “The Dimensions of Residential Segregation.”
Social Forces 67(2): 281-315.
National Center for Health Statistics (NCHS) Data File Documentations, Natality, 1970, 1971, 1980,
1981, 1990, 1991 (machine readable data file and documentation, CD-ROM Series), National
Center for Health Statistics, Hyattsville, Maryland.
Oreopoulos, Philip, Mark Stabile, Randy Walld, and Leslie Roos. 2008. “Short, Medium, and Long
Term Consequences of Poor Infant Health: An Analysis using Siblings and Twins.” Journal
of Human Resources 43(1): 88-138.
Osypuk TL, Acevedo-Garcia D.. 2008. “Are racial disparities in preterm birth larger in
hypersegregated areas?” American Journal of Epidemiology. 167(11):1295–1304.
Paneth, Nigel S. 1995. “The Problem of Low Birth Weight.” The Future of Children 5(1).
Polednak AP. 1991. “Black-white differences in infant mortality in 38 standard metropolitan
statistical areas,” American Journal of Public Health, 81(11):1480–1482.
Polednak AP. 1996. “Trends in US urban black infant mortality, by degree of residential
segregation,” American Journal of Public Health, 86(5):723–726.
Royer, Heather. 2009. "Separated at Girth: US Twin Estimates of the Effects of Birth Weight."
American Economic Journal: Applied Economics, 1(1): 49-85.
United States Bureau of the Census. 1972. “1970 Census of Population: General Social and
Economic Characteristics: United States Summary.” Washington: US GPO.
United States Bureau of the Census. 1984. “1980 Census of Population: General Social and
Economic Characteristics: United States Summary.” Washington: US GPO.
Vigdor, Jacob L.. 2002. "Locations, Outcomes, and Selective Migration." The Review of Economics
and Statistics, 84(4): 751-755.
Williams, DR and C. Collins. 2001. “Racial residential segregation: a fundamental cause of racial
disparities in health.” Public Health Reports 116(5): 404-16.

23
Yankauer, Alfred. 1950. “The Relationship of Fetal and Infant Mortality to Residential
Segregation.” American Sociological Review 15: 644-8.
24
Table 1: Summary statistics likelihood of low birth rate and infant mortality across MSAs by year, race,
and level of segregation.
1970 1980 1990
Total Black Nonblack Total Black Nonblack Total Black Nonblack
Low Birth Weight: % <2500 grams
All (N = 168) 7.89 13.90 6.73 7.02 12.77 5.81 7.34 13.08 5.96
Bottom 25%
segregation (N = 42)
8.04 13.94 6.74 6.97 12.20 5.79 7.07 12.61 5.84
Top 25% segregation
(N = 42)
7.84 14.01 6.76 7.05 12.93 5.75 7.63 13.78 5.97
Infant Mortality Rate (per 1,000 births)
All (N = 168) 19.39 30.68 17.08 12.74 23.29 12.18 9.39 15.93 7.62
Bottom 25%
segregation (N = 42)
19.46 30.01 16.73 12.20 23.93 13.75 8.87 14.19 7.40
Top 25% segregation
(N = 42)
19.38 30.58 17.23 12.96 23.58 11.29 9.71 17.14 7.58
1970 1980 1990
Dissimilarly Index
Mean 0.738
(0.112)
0.655
(0.112)
0.604
(0.119)
Median 0.765 0.676 0.615
25th
percentile 0.672 0.586 0.527
75th
percentile 0.819 0.736 0.689
Notes: The reported summary statistics average MSA-level aggregates of percent low birth weight and infant
mortality.
Source: National Center for Health Statistics Natality Detail File 1970-1991 and Cutler, Glaeser, and Vigdor (1999).
25
Table 2: Segregation, Low Birth Weight and Infant Mortality Rate: OLS Results
Low Birth Weight (<2500 grams) Infant Mortality Rate (deaths per 1,000 births)
Panel A: Year Fixed Effects
All Black Nonblack All Black Nonblack
Segregation 2.076***
(0.693)
4.096***
(0.935)
0.259
(0.494)
3.549***
(1.018)
10.371***
(2.002)
0.539
(0.748)
Segregation x
1980
-1.481
(0.960)
-1.214
(1.320)
-0.296
(0.675)
-0.176
(1.974)
-13.109**
(5.919)
-8.297***
(2.791)
Segregation x
1970
-3.252***
(1.008)
-4.325***
(1.416)
-0.534
(0.768)
-4.513*
(2.411)
-5.629
(5.618)
0.201
(1.618
Year fixed
effects
Y Y Y Y Y Y
Region x Year
fixed effects
N N N N N N
MSA x Year
controls
N N N N N N
R-squared 0.12 0.12 0.28 0.77 0.43 0.69
N 504 504 504 504 504 504
Panel B: Region x Year Fixed Effects
Segregation 3.097***
(0.810)
4.908***
(1.082)
0.418
(0.596)
3.287***
(1.159)
8.749***
(2.769)
-0.433
(1.000)
Segregation x
1980
-1.672
(1.084)
-3.336**
(1.491)
-0.113
(0.769)
0.539
(2.214)
-2.196
(6.570)
0.638
(2.654)
Segregation x
1970
-3.155***
(1.084)
-5.211***
(1.520)
-0.431
(0.852)
-2.881
(2.383)
-6.375
(6.194)
0.867
(1.798)
Year fixed
effects
Y Y Y Y Y Y
Region x Year
fixed effects
Y Y Y Y Y Y
MSA x Year
controls
N N N N N N
R-squared 0.39 0.16 0.30 0.80 0.47 0.76
N 504 504 504 504 504 504
Panel C: Region x Year Fixed Effects + MSA x Year Controls
Segregation 2.133***
(0.660)
4.577***
(1.430)
1.031
(0.718
2.011*
(1.102)
5.295
(3.496)
1.017
(1.154)
Segregation x
1980
-0.816
(0.899)
-2.496
(1.998)
-0.324
(0.893)
4.326*
(2.316)
5.629
(9.251)
2.448
(3.281)
Segregation x
1970
-2.518**
(1.011)
-5.330***
(1.974)
-1.648
(1.011)
1.749
(2.54466)
1.333
(7.660)
2.101
(2.024)
Year fixed
effects
Y Y Y Y Y Y
Region x Year
fixed effects
Y Y Y Y Y Y
MSA x Year
controls
Y Y Y Y Y Y
R-squared 0.68 0.19 0.35 0.85 0.47 0.77
N 504 504 504 504 504 504
Notes: *** p<0.01, ** p<0.05, * p<0.1. Robust standard errors are reported in parentheses. MSA x Year controls
include log population, percent black, and median family income. Each of these controls is interacted with 1970 and
1980 year indicator variables, allowing them to have different effects in each year.
Source: National Center for Health Statistics Natality Detail File 1970-1991 and Cutler, Glaeser, and Vigdor (1999).
Median family income data for 1970 and 1980 were collected from the Census (U.S. Census Bureau 1972 and
1984).
26
Table 3: First stage: segregation and the railroad density index (RDI)
1970
1980 1990
RDI 0.299***
(0.992)
0.360***
(0.119)
0.448***
(0.123)
N 60 60 60
R-squared 0.14 0.21 0.24
F-statistic 9.09 9.11 13.27 Notes: *** p<0.01, ** p<0.05, * p<0.1. Length of track is included in all regressions.
Source: National Center for Health Statistics Natality Detail File 1970-1991, Cutler, Glaeser, and Vigdor (1999),
and Ananat (2011).
27
Table 4: Low Birth Weight, Infant Mortality, and RDI: Reduced Form Results
Low Birth Weight (<2500 grams) Infant Mortality Rate (deaths per 1,000 births)
Panel A: Consistent Sample
All Black Nonblack All Black Nonblack
RDI 1.870**
(0.874)
4.699***
(1.674)
0.911*
(0.517)
3.094**
(1.329)
3.984
(3.786)
2.819**
(1.100)
RDI x 1980 -1.841
(1.272)
-2.581
(2.132)
-0.926
(0.706)
0.437
(2.263)
-8.923
(9.979)
-10.525***
(3.320)
RDI x 1970 -1.759
(1.195)
-2.883
(2.335)
-0.887
(0.709)
-0.646
(2.737)
2.207
(7.804)
-0.214
(2.402)
Year fixed
effects
Y Y Y Y Y Y
Track length x
year controls
Y Y Y Y Y Y
R-squared 0.21 0.15 0.33 0.82 0.46 0.71
N 180 180 180 180 180 180
Panel B: Inconsistent Samples
All Black Nonblack All Black Nonblack
RDI 2.158***
(0.528)
7.219***
(1.980)
0.840**
(0.356)
2.675**
(1.160)
17.925***
(4.259)
1.174
(1.029)
RDI x 1980 -0.866
(0.758)
-0.887
(3.068)
-0.431
(0.506)
0.334
(2.071)
-5.098
(13.916)
-5.739**
(2.789)
RDI x 1970 -1.205
(0.844)
-1.247
(3.173)
-0.432
(0.626)
0.930
(2.079)
6.182
(10.523)
1.609
(1.999)
Year fixed
effects
Y Y Y Y Y Y
Track length x
year controls
Y Y Y Y Y Y
R-squared 0.26 0.10 0.30 0.81 0.24 0.66
N 286
(1970, N =
78; 1980, N
= 101; 1990:
N = 107)
286
(1970, N =
78; 1980, N
= 101; 1990:
N = 107)
286
(1970, N =
78; 1980, N
= 101; 1990:
N = 107)
286
(1970, N =
78; 1980, N
= 101; 1990:
N = 107)
286
(1970, N =
78; 1980, N =
101; 1990: N
= 107)
286
(1970, N = 78;
1980, N =
101; 1990: N
= 107)
Notes: *** p<0.01, ** p<0.05, * p<0.1. Robust standard errors are reported in parentheses.
Source: National Center for Health Statistics Natality Detail File 1970-1991, Ananat (2011), and Cutler, Glaeser,
and Vigdor (1999).
28
Table 5: Segregation, Low Birth Weight and Infant Mortality Rate: IV Results
Percent Low Birth Weight (< 2500 grams)
1970 1980 1990 OLS IV OLS IV OLS IV All -0.771 0.269 1.337 -0.016 2.874** 4.321** (1.366) (2.680) (1.473) (2.525) (1.153) (1.839) Black 0.768 5.918 3.835** 5.255 5.518*** 10.222*** (2.441) (5.762) (1.646) (3.477) (1.455) (3.068) Nonblack -1.309 -0.145 -0.359 -0.181 0.289 2.003 (1.244) (1.535) (1.000) (1.310) (0.816) (1.318)
N
60
60
60
60
60
60
Infant Mortality Rate
1970 1980 1990 OLS IV OLS IV OLS IV All -0.914 7.296 6.257** 9.471* 3.288** 7.762** (3.824) (7.971) (2.404) (5.428) (1.261) (3.299) Black 0.651 18.538 -8.002 -17.873 9.041*** 6.789 (6.330) (22.689) (11.015) (24.525) (3.177) (7.778) Nonblack -2.387 7.215 -7.330 -20.867** -0.344 6.482* (3.555) (7.312) (4.723) (10.215) (1.000) (3.491) N
60
60
60
60
60
60
Notes: *** p<0.01, ** p<0.05, * p<0.1. Length of track is included in all regressions.
Source: National Center for Health Statistics Natality Detail File 1970-1991, Cutler, Glaeser, and Vigdor (1999),
and Ananat (2011).
29
Table 6: Summary statistics for black births by year, and level of segregation.
1970 1980 1990
Difference (High - Low)
Low High Low High Low High
1970 1980 1990
Married (%) 64.80 57.3 55.8 39.1 42.2 28.8
-7.5 -16.7 -13.4
Mom HS dropout (%) 25.7 36.5 23.3 29.3 24.7 30.5
10.8 6 5.8
Mom HS grad (%) 20.9 30.1 32.1 34.5 42.5 39.9
9.2 2.4 -2.6
Mom some college (%) 4.4 7.6 11.9 14.4 21.1 18.7
3.2 2.5 -2.4
Mom college grad (%) 49 25.8 32.7 21.8 11.7 10.9
-23.2 -10.9 -0.8
No prenatal care (%) 2.22 3.8 2.1 2.5 3.7 5.6
1.6 0.4 1.9
Prenatal in 1st trimester (%) 47.5 47.8 62.1 64.7 63 61.5
0.3 2.6 -1.5
Prenatal in 2nd trimester (%) 40.8 38.7 29.1 27.4 26.6 27
-2.1 -1.7 0.4
Prenatal in 3rd trimester (%) 9.48 9.7 6.7 5.4 6.7 5.9
0.2 -1.3 -0.8
Born in hospital (%) 97.4 99.5 99.4 99.4 91.1 89.6
2.1 0 -1.5
Mother's age (years) 23.2 23.1 23.3 23.4 24.3 24.7
-0.1 0.1 0.4
Birth order (#) 2.83 2.81 2.35 2.48 2.57 2.8
0.0 0.13 0.23
Notes: The reported summary statistics are for all individual births within a segregation category. Low segregation is the bottom 25 percent of MSAs in a given
year. High segregation is the top 25 percent of MSAs.
Source: National Center for Health Statistics Natality Detail File 1970-1991 and Cutler, Glaeser, and Vigdor (1999).
30
Table 7: Correlation of segregation with factors related to low birth weight
Dependent variable
Married Male
Born in
hospital Birth order
Month of
prenatal care Mother's age Father's age
Mother's
years of
schooling
Father's
years of
schooling
Panel A: Presence of correlation to segregation and dependent variable in sample year
Segregation
1990 -0.436*** 0.00968 -0.181** 0.346 -0.177 -1.418* -1.008 -1.093*** -1.275**
(0.0715) (0.0072) (0.077) (0.239) (0.152) (0.741) (1.661) (0.351) (0.496)
1980 -0.276*** -0.000254 -0.0112*** 0.307*** -0.858** -2.096*** -2.09 -0.199 -0.488
(0.0549) (0.00487) (0.00328) (0.116) (0.374) (0.703) (2.121) (0.339) (0.35)
1970 -0.311*** 0.0385** 0.0217 0.452* -0.645* -1.137* 2.455*** -0.398 -0.533
(0.087) (0.0167) (0.0221) (0.249) (0.379) (0.581) (0.823) (0.446) (0.568)
Panel B: Difference in correlation of segregation and dependent variable across sample years (relative to 1990)
Segregation main
effect (1990) -0.436*** 0.00968 -0.181** 0.346 -0.177 -1.418* -1.008 -1.093*** -1.275**
(0.0715) (0.0072) (0.077) (0.239) (0.152) (0.741) (1.661) (0.351) (0.496)
Seg x 1980 0.160** -0.00993 0.170** -0.0395 -0.681** -0.678 -1.082 0.894*** 0.787**
(0.0687) (0.00917) (0.077) (0.184) (0.313) (0.61) (1.248) (0.215) (0.361)
Seg x 1970 0.124 0.0289 0.203** 0.106 -0.468 0.282 3.462* 0.696 0.743
(0.0983) (0.0179) (0.0789) (0.323) (0.374) (0.833) (1.824) (0.456) (0.675)
Observations 1,905,477 1,905,477 1,905,477 1,905,477 1,905,477 1,905,477 1,422,616 1,905,477 1,172,944
Notes: *** p<0.01, ** p<0.05, * p<0.1. Standard errors adjusted for clustering at the MSA x YEAR level are in parentheses. Each column within a panel
comes from a separate regression of the dependent variable. Each regression includes as controls with time-varying coefficients: year effects, region indicators,
log of population, percent black. Observations are of births to black women in the restricted sample for which the dependent variable is reported on the birth
certificate. Panel A estimates equation 2, whereas panel B estimates equation 3.
Source: National Center for Health Statistics Natality Detail File 1970-1991 and Cutler, Glaeser, and Vigdor (1999).
31
Table 8: Explanatory power of covariates as causal channels for the segregation effect on low birth weight
Individual-level
controls NO NO YES YES
Full Sample Restricted Sample Restricted Sample Restricted Sample
Time-varying
coefficients
Non-time-varying
coefficients
Segregation
1990 4.35*** 4.54*** 3.53*** 3.54***
(1.00) (1.02) (1.17) (1.08)
1980 -1.52* -2.12** -1.00 -0.48
(0.86) (0.96) (1.06) (1.13)
1970 -4.39*** -4.71*** -7.48*** -8.12***
(1.57) (1.71) (1.81) (1.74)
Log population
1990 0.03 -0.02 -0.10 -0.06
(0.08) (0.08) (0.10) (0.09)
1980 0.01 -0.02 -0.08 -0.19*
(0.08) (0.10) (0.11) (0.11)
1970 0.10 0.20 0.53*** 0.46***
(0.13) (0.14) (0.16) (0.16)
Percent black
1990 0.04*** 0.04*** 0.02 0.02*
(0.01) (0.01) (0.01) (0.01)
1980 0.03** 0.04** 0.02 0.02
(0.01) (0.02) (0.02) (0.02)
1970 -0.01 0.01 -0.04* -0.04**
(0.02) (0.02) (0.02) (0.02)
Year effects
1980 1.11 1.26 8.79*** 2.62*
(1.10) (1.39) (2.16) (1.35)
1970 4.34*** 2.29 6.45*** 2.23
(1.59) (1.58) (2.42) (1.71)
Constant 9.35*** 9.27*** 23.40*** 23.40***
(1.01) (1.06) (1.18) (1.17)
Observations 2,361,500 1,905,477 1,905,477 1,905,477
Notes: *** p<0.01, ** p<0.05, * p<0.1. Coefficients are interpreted as p.p. difference moving from a
segregation index value of 0 to 1. Standard errors adjusted for clustering at the MSA x YEAR level are in
parentheses. Each regression includes as controls with time-varying coefficients: year effects, region
indicators, log of population, percent black. Observations are of births to black women in the restricted sample
for which the dependent variable is reported on the birth certificate. Columns (1) and (2) do not include any
individual-level controls. Columns (3) and (4) include the individual controls of the mother listed in table 7.
Source: National Center for Health Statistics Natality Detail File 1970-1991 and Cutler et al. (1999).
32
Table 9: Contribution of individual-level covariates as potential causal pathways of the segregation effect on low birth weight.
Coefficient on
segregation Contribution of covariate to difference of base and full specification
Base Full Difference
Marital
Status
Prenatal
Care
Mother's
Education
Age of
Mother In Hospital Birth Order Male
1970 -1.56 -3.95*** 2.39***
0.609*** 1.158** 0.234 0.303** 0.019 0.190*** -0.126***
(1.57) (1.50) (0.77)
(0.166) (0.482) (0.158) (0.137) (0.052) (0.065) (0.047)
1980 2.42*** 2.53** -0.112
0.935*** -1.49*** 0.093 0.089* 0.049*** 0.209*** 0.000
(0.74) (1.00) (0.63)
(0.184) (0.567) (0.115) (0.046) (0.014) (0.077) (0.012)
1990 4.54*** 3.53*** 1.01*
1.58*** -0.459 0.464*** -0.095 -0.787** 0.327 -0.022
(1.02) (1.17) (0.57)
(0.262) (0.295) (0.145) (0.122) (0.352) (0.226) (0.016)
Notes: *** p<0.01, ** p<0.05, * p<0.1. Observations are of births to black women in the restricted sample for which the dependent variable is reported
on the birth certificate. Coefficients in the first two columns are interpreted as p.p. difference moving from a segregation index value of 0 to 1. Standard
errors adjusted for clustering at the MSA x YEAR level are in parentheses. Each regression includes as controls with time-varying coefficients: year
effects, region indicators, log of population, percent black. Column (1) is the base specification from estimating equation (2) without any individual level
controls. Column (2) reports coefficients for the full specification, which includes all individual-level controls and estimating each year separately. The
remaining columns come from the accounting exercise from Gelbach (2015). Column (3) is the difference in terms of p.p. between the base and the full
specification, which we interpret as the explained portion of the segregation effect. The remaining columns represent the contribution of each group of
parental characteristics to the base estimated of the segregation effect on low birth weight. For example, marital status in 1990 contributes 1.58 p.p. of the
base 4.54 p.p. effect of segregation.
Source: National Center for Health Statistics Natality Detail File 1970-1991 and Cutler, Glaeser, and Vigdor (1999).
33
Figure 1: Segregation levels by decade for the black population (measured by the dissimilarity index)
Notes: This graph plots the average level of dissimilarity across MSAs in each year, weighted by black population. The blue line includes all cities and MSAs
available in Cutler, Glaeser, and Vigdor (1999) and the number of MSAs/cities in this data set changes over time. The red line includes only the 168 MSAs
which are included our analysis.
Sources: Cutler, Glaeser, and Vigdor (1999).
34
Figure 2: Low birth weight gradient with respect to the segregation dissimilarity index
Notes: Each panel represents the smoothed 4th degree local polynomial of low birth weight over levels of the dissimilarity index for 1970-71, 80-81, and 90-91.
Source: National Center for Health Statistics Natality Detail File 1970-1991 and Cutler, Glaeser, and Vigdor (1999).
.11
.12
.13
.14
.15
.11
.12
.13
.14
.15
.2 .4 .6 .8 1
.2 .4 .6 .8 1
1970 1980
1990
Pe
rcent
Lo
w B
irth
Weig
ht
Segregation Index
35
Figure 3: Fitted relationship between segregation (dissimilarity) and probability of low birth weight at the MSA-level
Notes: Each panel plots the percent of low birth weight births and dissimilarity index values for the 168 MSAs in our sample.
Source: National Center for Health Statistics Natality Detail File 1970-1991 and Cutler, Glaeser, and Vigdor (1999).
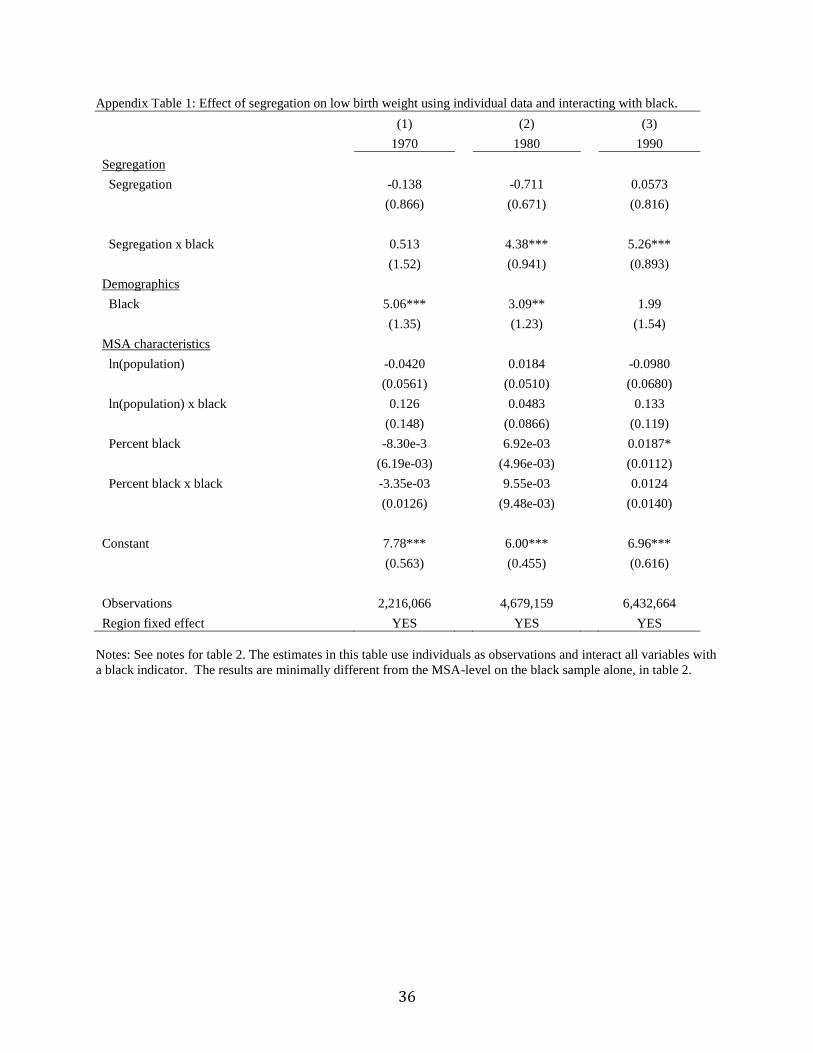
36
Appendix Table 1: Effect of segregation on low birth weight using individual data and interacting with black.
(1) (2) (3)
1970 1980 1990
Segregation
Segregation -0.138 -0.711 0.0573
(0.866) (0.671) (0.816)
Segregation x black 0.513 4.38*** 5.26***
(1.52) (0.941) (0.893)
Demographics
Black 5.06*** 3.09** 1.99
(1.35) (1.23) (1.54)
MSA characteristics
ln(population) -0.0420 0.0184 -0.0980
(0.0561) (0.0510) (0.0680)
ln(population) x black 0.126 0.0483 0.133
(0.148) (0.0866) (0.119)
Percent black -8.30e-3 6.92e-03 0.0187*
(6.19e-03) (4.96e-03) (0.0112)
Percent black x black -3.35e-03 9.55e-03 0.0124
(0.0126) (9.48e-03) (0.0140)
Constant 7.78*** 6.00*** 6.96***
(0.563) (0.455) (0.616)
Observations 2,216,066 4,679,159 6,432,664
Region fixed effect YES YES YES
Notes: See notes for table 2. The estimates in this table use individuals as observations and interact all variables with
a black indicator. The results are minimally different from the MSA-level on the black sample alone, in table 2.

37
Appendix Table 2: Full estimation output from equation 4 (corresponding to table 8 column 3)
1990 1980 1970
Segregation 0.0353*** -0.0100 -0.0748***
(0.0117) (0.0106) (0.0181)
Year effect
0.0879*** 0.0645***
(0.0216) (0.0242)
ln(population) -0.00101 -0.000826 0.00531***
(0.000970) (0.00107) (0.00156)
Percent black 0.000191 0.000214 -0.000373*
(0.000125) (0.000155) (0.000191)
Male -0.0223*** -0.00156* -0.00451**
(0.000769) (0.000928) (0.00190)
Married -0.0363*** 0.00242 0.0167***
(0.00144) (0.00192) (0.00271)
Mother HS grad -0.0130*** -0.00330** 0.00175
(0.00118) (0.00141) (0.00236)
Mother some college -0.0217*** -0.00226 0.00363
(0.00142) (0.00178) (0.00364)
Mother college -0.0287*** 0.000983 0.0117**
(0.00235) (0.00290) (0.00526)
Prenatal care in 1st trimester -0.165*** 0.0340* 0.0145
(0.00539) (0.0176) (0.0136)
Prenatal care in 2nd trimester -0.164*** 0.0304* 0.00770
(0.00455) (0.0173) (0.0140)
Prenatal care in 3rd trimester -0.182*** 0.0413** 0.00806
(0.00524) (0.0169) (0.0130)
In hospital 0.0435*** -0.0875*** -0.0348*
(0.00418) (0.0104) (0.0185)
Mother's age: 20-29 0.00192 -0.00484** -0.0217***
(0.00187) (0.00189) (0.00292)
Mother's age: 30-39 0.0265*** -0.0600*** -0.0348***
(0.00395) (0.00598) (0.00377)
Mother's age: 40 and above 0.0237*** -0.0348*** -0.0662***
(0.00626) (0.00756) (0.0108)
Birth order 0.00944*** -0.00263*** -0.00637***
(0.000441) (0.000531) (0.000717)
Constant
Observations
Region x Year
Fixed Effects
0.234*** 1,905,477 Yes
(0.0118)

38
Notes: *** p<0.01, ** p<0.05, * p<0.1. See notes to table 8. Full estimation output for equation 4, corresponding to
column 3 in table 8. Coefficients are relative to 1990.
Source: National Center for Health Statistics Natality Detail File 1970-1991 and Cutler et al. (1999).