Embed Size (px)
Citation preview

Residential Overview Residential Overview Residential Overview Residential Overview

Residential Overview
Alice Solar City
Final report
Residential Overview
Published by the Alice Springs Town Council, lead proponent of the Alice Solar City Consortium
July 2013
Date:
Author:

Residential Overview i
Table of Contents
1. Context .............................................................................................................................................................................. 1
1.1 Background........................................................................................................................................................................... 1
1.2 ASC Customer Registration, Data Collection and the EEM Process ...................................................................................... 3
1.3 Community Engagement for the ASC Residential Program .................................................................................................. 4
1.4 Reporting of Residential Results to the Australian Government .......................................................................................... 4
2. Management and Data Aspects of the Residential Program .............................................................................................. 6
2.1 Quarterly Electricity Consumption Data ............................................................................................................................... 6
2.2 Registrations and Terminations............................................................................................................................................ 6
2.3 Residential Properties ........................................................................................................................................................... 7
2.4 Tenure Type .......................................................................................................................................................................... 7 2.4.1 Landlords and tenants ................................................................................................................................................... 7
2.5 New Builds ............................................................................................................................................................................ 7
2.6 Control Groups and the CRT Trial ......................................................................................................................................... 8 2.6.1 The formal control group .............................................................................................................................................. 8 2.6.2 The informal control group ........................................................................................................................................... 8
2.7 ASC Operations Database ..................................................................................................................................................... 9
2.8 Customer Portal .................................................................................................................................................................. 10
2.9 Email Notifications to Customers – a Database Application .............................................................................................. 10
2.10 Follow-up Support (FUS) ................................................................................................................................................... 10
3. Foundational Information for Alice Springs ...................................................................................................................... 11
3.1 ABS Data for Population, Dwellings, Household Composition and Tenure......................................................................... 11 3.1.1 Population ................................................................................................................................................................... 11 3.1.2 Household dwellings ................................................................................................................................................... 11 3.1.3 Dwelling type ............................................................................................................................................................... 11 3.1.4 Household composition .............................................................................................................................................. 11 3.1.5 Number of bedrooms .................................................................................................................................................. 12 3.1.6 Tenure type ................................................................................................................................................................. 12
3.2 Numbers of Properties/Dwellings in Alice Springs – Various Sources ................................................................................ 12 3.2.1 ASTC rateable residential properties ........................................................................................................................... 12 3.2.2 ASC database ............................................................................................................................................................... 13 3.2.3 CAT Study .................................................................................................................................................................... 13
3.3 Estimates of Dwelling Numbers Eligible to Register with ASC ............................................................................................ 13 3.3.1 Working estimate for total dwellings .......................................................................................................................... 13 3.3.2 Distribution between owner-occupiers and tenants .................................................................................................. 13 3.3.3 Properties ineligible or unlikely to sign-up with ASC ................................................................................................... 13 3.3.4 Potential ASC customer dwellings ............................................................................................................................... 14
3.4 From ‘Your Home – technical manual’ (2010) .................................................................................................................... 14 3.4.1 Annual energy distribution and seasonal energy flows .............................................................................................. 14 3.4.2 The climatic zone for Alice Springs .............................................................................................................................. 15
3.5 Climate Data from the Bureau of Meteorology .................................................................................................................. 15

Residential Overview ii
3.6 Residential Electricity Tariffs and Consumption ................................................................................................................. 16 3.6.1 Household energy use and electricity ......................................................................................................................... 16 3.6.2 PWC electricity tariffs for Alice Springs ....................................................................................................................... 16 3.6.3 Average daily household electricity consumption ...................................................................................................... 17
3.7 The ASC ADC Calculator ...................................................................................................................................................... 17
3.8 Informal Control Group Electricity Consumption Data ....................................................................................................... 17
4. Estimates for Appliance Use and EEM Savings in Alice Springs ........................................................................................ 18
4.1 Electricity Consumption for Average and Energy Champion Households ........................................................................... 18
4.2 Space Heating and Cooling ................................................................................................................................................. 18
4.3 Household Energy Flows and Distribution .......................................................................................................................... 19
4.4 Hot Water: Electric Storage and Solar ................................................................................................................................ 20
4.5 ASC Incentivised PV Systems ............................................................................................................................................... 20
4.6 ASC Incentivised EEMs ........................................................................................................................................................ 21
5. Overview of ASC Residential Registration Numbers, Demographics, and Site Characteristics .......................................... 21
5.1 ASC Residential Participant Numbers ................................................................................................................................. 21 5.1.1 Total formal control group and residential registrations ............................................................................................ 22 5.1.2 Tenure type, registrations, audits, terminations and new builds ............................................................................... 22 5.1.3 Properties and persons ............................................................................................................................................... 23 5.1.4 Landlords and tenants ................................................................................................................................................. 23
5.2 ASC Residential Demographics ........................................................................................................................................... 23
5.3 Characteristics of ASC Registrants’ Houses ........................................................................................................................ 24
5.4 Appliance Characteristics ................................................................................................................................................... 26 5.4.1 Space cooling ............................................................................................................................................................... 26 5.4.2 Space heating .............................................................................................................................................................. 26 5.4.3 Lighting ........................................................................................................................................................................ 27 5.4.4 Cooking and kitchen appliances .................................................................................................................................. 27 5.4.5 Other appliances ......................................................................................................................................................... 27
6. ASC Home Energy Audits .................................................................................................................................................. 28
6.1 HEAs and Reporting ............................................................................................................................................................ 28
6.2 ASC Targets for HEAs .......................................................................................................................................................... 29
6.3 Number of HEAs Completed Compared to Registrations/Households ............................................................................... 30
6.4 Reasons Why Households Chose Not to Proceed with HEAs .............................................................................................. 31
6.5 Average Reductions in Electricity Consumption Achieved .................................................................................................. 31
7. Learnings from HEAs ........................................................................................................................................................ 32
7.1 Scheduling and Timing of Audit .......................................................................................................................................... 32
7.2 Audit Data Capture and Technology .................................................................................................................................. 33
7.3 Customer Engagement and Behaviour Change .................................................................................................................. 33
7.4 Energy Consumption Data .................................................................................................................................................. 33
8. Residential Overview Appendices .................................................................................................................................... 34
Residential Overview iii
Figures
Figure 1: Mayor Fran Kilgariff was the first residential participant to sign up on the day of the launch ....................................... 2 Figure 2: A common house style in Alice Springs ......................................................................................................................... 26 Figure 3: A Home Energy Audit in process ................................................................................................................................... 28
Tables
Table 1: Acronyms iv Table 2: ASC Customer registration and EEM implementation process 3 Table 3: Residential Key Results Reporting categories and indicators for DCCEE 5 Table 4: Features of the ASC database 9 Table 5: ABS population data for Alice Springs 11 Table 6: ABS household dwelling occupation data for Alice Springs 11 Table 7: ABS household dwelling types in Alice Springs 11 Table 8: ABS household composition data for Alice Springs 11 Table 9: ABS number of bedrooms in households in Alice Springs 12 Table 10: ABS tenure type of dwellings in Alice Springs 12 Table 11: Numbers or properties/dwellings in Alice Springs from various sources 12 Table 12: Numerical estimates of residential tenure types 13 Table 13: Rental dwelling types and numbers not involved in the ASC program 13 Table 14: Numbers of residential dwellings potentially available to register with ASC 14 Table 15: Distribution of annual energy use for an average Australian home 14 Table 16: Seasonal household energy flows in a temperate climate 15 Table 17: Zone 3 and 4 climatic zones 15 Table 18: Bureau of Meteorology climate data for Alice Springs 15 Table 19: Peak, off-peak and flat rate EC tariffs during the ASC program 16 Table 20: EC for average and ‘energy champion’ households in Alice Springs 18 Table 21: Estimates of electricity use for heating and cooling households in Alice Springs 19 Table 22: Heating and cooling energy flows 19 Table 23: Estimated distribution of energy to services in households in Alice Springs 19 Table 24: Estimated electricity use in a variety of hot water systems and their level of functionality 20 Table 25: BP-PV systems available through ASC 20 Table 26: Estimated annual electricity savings for ASC EEMs 21 Table 27: Numbers in the formal control group 22 Table 28: Number of residential registrations initially eligible for a HEA 22 Table 29: Distribution of HEA-eligible registrations among tenure types 22 Table 30: Estimated available tenure types that registered with ASC 23 Table 31: Landlord and tenant numbers in the ASC program 23 Table 32: Demographic characteristics of ASC households 24 Table 33: Physical characteristics of ASC houses 25 Table 34: Lighting count from HEAs 27 Table 35: HEA reporting structure 29 Table 36: HEA and EEV targets 29 Table 37: Targets and actual numbers for HEAs 29 Table 38: Completion of HEAs by tenure type 30 Table 39: Registrations by financial year, with and without a HEA 30 Table 40: Registrations per financial year by tenure type with a HEA 30 Table 41: Registrations per financial year by tenure type without a HEA 31 Table 42: Changes in annual ADC before and after the HEA 32

Residential Overview iv
Acronyms
The following acronyms are used throughout the Alice Solar City reports:
Acronym Meaning Acronym Meaning
ABS Australian Bureau of Statistics KRR key results reporting
ADC average daily consumption kW kilowatt
AS Alice Springs kWh kilowatt hour
ASC Alice Solar City kWh/yr kilowatt hour per year
ASTC Alice Springs Town Council LBEA Large business energy audit
BMS building management system LBEEP large business energy efficiency
program
BP BP Solar LEDs light emitting diodes
CAT Centre for Appropriate Technology LGA Local Government
CEA commercial energy audit MER monitoring, evaluation and reporting
CEC Clean Energy Council MWh megawatt hour
CES commercial energy survey NB new build
CFL compact fluorescent lamp NT Northern Territory
CG Control Group OSB one shot booster switch
CO2 carbon dioxide OTP over temperature protection
CRT cost reflective trial PTR pressure and temperature Relief
DB database PV photovoltaic
DCCEE Department of Climate Change and
Energy Efficiency PWC Power and Water Corporation
Deg C degrees celsius REC Renewable Energy Certificate
EC electricity consumption RET Renewable Energy Target
EEM energy efficiency measure SBEEP small business energy efficiency
program
EEV energy efficiency voucher SD Sunny Design
FUS follow up survey SHW solar hot water
GHG green house gases SHWS solar hot water system
GIS geographic information system SLA statistical local area
GSM global system mobile communication SLC Smart Living Centre
HEA home energy audit SMA SMA Pty LTD
HES home energy survey SME small to medium enterprise
HVAC heating, ventilation and air conditioning SRES Small Renewable Energy Scheme
HW hot water STC Small Scale Technology Certificate
HWS hot water system V volt
ID's Identities VFD variable frequency drive
IGUs insulated glass units W watt
IHD in house display WELS water efficiency labelling and standards
KAB knowledge attitude and behaviour
Table 1: Acronyms

Residential Overview 1
1. Context
1.1 Background
Initiated by the Australian Government in 2004, the Solar Cities program aimed to explore how technology, behavioural change
and time-of-use (ToU) electricity pricing can contribute to a sustainable energy future for Australia. Alice Springs was one of
seven locations around Australia that participated in the Solar Cities program, which was administered by the Commonwealth
Department of Climate Change and Energy Efficiency (DCCEE) in partnership with local and state governments, industry,
business and local communities.
The objectives of the Solar Cities Program were:
To demonstrate the economic and environmental impacts of integrating cost-reflective pricing with the
concentrated uptake of solar, energy efficiency (EE) and smart-metering technologies.
To identify and implement options for addressing barriers to distributed solar generation, EE, and electricity
demand management for grid connected urban areas.
Alice Springs receives on average, more than 9 hours of sunlight per day, making it an ideal location to utilise solar radiation.
The extreme year-round conditions (hot summers, cold winter nights, and in general a high diurnal range) also mean that energy
use is high, and an aim of the Alice Solar City (ASC) Project was to empower the community to make informed and intelligent
use of energy. The ASC project had three key elements: residential, commercial, and iconic.
Within the project elements there were three major energy related aspects:
1 Solar Technologies: photovoltaic (PV) electricity generation and solar hot water (SHW).
2 Energy Efficiency Measures (EEMs): a variety of means by which energy use can be reduced or optimised; there was
a range of physical/technical EEMs, some of which were incentivised e.g. ceiling and wall insulation, wall and
window shading, energy efficient lighting, double glazing of windows, painting roofs white. Other EEMs encouraged
modification of energy related behaviours.
3 Load Management Measures: this included the cost reflective pricing of electricity (or ToU tariffs – peak/off-peak),
the use of smart meters with complementary in-house displays (IHDs), and changes in habitual behaviours related to
peak/off-peak pricing that can reduce electricity use (e.g. moving electricity consuming actions to off-peak periods).
The ASC residential element included:
Free Home Energy Audits (HEA) with tailored advice and options for follow-up support;
Financial incentives for undertaking a wide range of EEMs and solar energy installations (PV panels and SHW);
Cost-reflective tariffs (CRT) , which provided different electricity prices for household electricity use during off-peak
and peak times;
Smart metering and IHDs; the latter provided interactive, visual displays of electricity consumption (EC)/generation
and costs;
An elevated buy-back tariff for homeowners who chose to install an ASC-subsidised PV system and sell electricity
back to the grid;
Rewards for program participants who made set percentage reductions in their EC compared to their previous
electricity accounts for the same billing period.
The Smart Living Centre in the main street of Alice Springs was the operational hub for the ASC Project. It provided both staff
offices and a public shopfront at which enquiries were answered, information provided, customer registrations taken, and

Residential Overview 2
technologies displayed. Eligible properties had to be within the Alice Springs municipality (local government area) and
connected to the NT Power and Water Corporation (PWC) electricity grid.
Households interacted with both ASC staff and registered suppliers to undertake EEMs through the use of ASC energy efficiency
vouchers (EEVs) which provided financial incentives for the EEMs. The processes by which this occurred are outlined below.
Household eligibility to receive and use EEVs was contingent upon formal customer registration with ASC and completion of a
free HEA (see section 6). Registration included the customer signing a release to enable their EC data to be made available to
ASC from PWC.
Figure 1: Mayor Fran Kilgariff was the first residential participant to sign up on the day of the launch

Residential Overview 3
1.2 ASC Customer Registration, Data Collection and the EEM Process
Register as a residential customer
with ASC
Computer-based registration at SLC included:
Program overview and responses to household
and attitudinal questions
Creation of customer/registration database
records
Initial expression of interest for incentives (EEMs)
Scheduling of HEA date/time
Signing a registration form* authorising PWC
release of EC data and agreeing to ASC
participation terms and conditions.
Undertake ASC HEA HEA at customer residence included:
Entering residential demographic data in the
database
Collection of HEA survey site data*
Assessment of and discussion about household
features, appliances and energy use
Creation and printing of customer‟s personalised
Home Energy Report*, including
recommendations for action
Creation of an Incentive Report* for vouchers -
signed by customer
PV and Smart Meter Checklist* where appropriate
ASC processes HEA and posts EEVs Recommendations for Incentive Vouchers
processed and EEVs* printed by ASC
EEVs posted to customers along with
registered supplier information.
Customer receives EEVs and decides to act
Customer obtains quotes for
implementation of EEMs
Customers plan jobs and organise contractors
(registered suppliers).
Customers obtain quotes as necessary, assess
obtained quotes and engage EEM installer.
EEMs implemented, registered
supplier provides ASC with invoice
and voucher
Contractors do EEMs as specified
Customer pays contractor –total cost less voucher
value
Contractor supplies customer invoice and voucher
to ASC
ASC pays supplier voucher value
EEM active at customer residence, financial acquittal by ASC
1.
Table 2: ASC Customer registration and EEM implementation process
Residential Overview 4
* In table 2 above the items marked with * are standard ASC forms or reports, examples of which are provided in the
appendices as follows:
Registration form ……………………………………. Appendix 1
Home Energy Report……………………………….. Appendix 2
Incentive Report……………………………………….Appendix 3
Smart Meter checklist……………………………… Appendix 4
Site audit data collection form………………….. Appendix 5
Energy Efficiency Voucher ……………………….. Appendix 6
1.3 Community Engagement for the ASC Residential Program
Engagement and interaction with the Alice Springs community was an important foundational and ongoing part of the program.
A media and communications company was retained on a part-time basis for the duration of the program. The staff associated
with this company consulted regularly with the ASC manager and collaboratively prepared appropriate documentation, media
releases, newsletters, advertising, graphics and relevant event material to support the aims of the program, and to engage with
the local residents and business people. For further details please refer to Community Engagement report, which is available on
the ASC website: www.alicesolarcity.com.au.
The regular program operations included a number of important community engagement functions, most of which are described
above, or in following sections, and examples are available in the appendices listed.
1.4 Reporting of Residential Results to the Australian Government
The table below shows the residential reporting categories and indicators that are part of the funding agreement between ASC
and the Department of Climate Change and Energy Efficiency (DCCEE). A separate report is available for each of the four major
components – Residential PV, SHW, EE, and the Cost-Reflective Tariff Trial.
ASC-DCCEE Key Results Reporting: Residential PV
1. PV performance
1.1 Number, capacity and costs of residential PV systems installed
1.2 kWhs generated per kW installed
1.3 Effects of orientation and other variables (i.e. weather)
1.4 Total greenhouse gas (GHG) savings from residential PV
2. Residential PV
buyback
2.1 The impact of the elevated buyback rate for rooftop PV systems in
the first two years of the ASC project (2008 –2010) in terms of
influencing the investment decision by the customer to install PV
2.2 Success of PV buyback – understanding by customers,
integration/administration issues
ASC-DCCEE Key Results Reporting: Residential SHW
3. SHW performance
3.1 Number, capacity and cost of SHW systems and heat pumps
installed 3.2 Number of houses installing SHW and/or heat pumps beyond
business-as-usual
3.3 kWh saved (per installation), split into previous HW type
3.4 Total GHG savings from SHW and heat pump systems

Residential Overview 5
ASC-DCCEE Key Results Reporting: Residential EE
4.
Home Energy audits
(HEAs) –in this
Report
4.1 Number of HEAs completed compared to number of houses
registered
4.2 Reasons why households chose not go ahead with HEAs
4.3 Average reductions in EC achieved
4.4 Lessons learnt in staffing, technology, community engagement and
data capture
5. Energy Efficiency
Vouchers (EEVs)
5.1 Number of households using EEV against number of vouchers
issued
5.2 Conversion rates for different types of EEV according to incentive
offered
5.3 Key reasons why households did not utilise vouchers
5.4 Number of households that claimed each of 10:10 and 20:20
credits
5.5 Number of households that undertook non-incentivised measures
5.6 Total GHG savings for EE vouchers utilised
ASC-DCCEE Key Results Reporting: CRT
6. ToU Trials
6.1 Number of households subscribed to CRT
6.2 Change in total EC across CRT households
6.3 Difference in EC at peak periods
6.4 Analysis of cost savings (or overruns) by households
6.5 Number households that claimed „no worse off‟ safety net
6.6 Costs and benefits to network provider
6.7 Barriers to wider uptake
7. Smart Meters
7.1 Costs and benefits of applying SMs at the domestic level
7.2 Rollout effectiveness
8. IHDs
8.1 Costs and effectiveness of IHDs as demand management tool
8.2 Customer feedback and behavioural change over time
Table 3: Residential Key Results Reporting categories and indicators for DCCEE
Residential Overview 6
2. Management and Data Aspects of the Residential
Program
The final ASC residential registration eligible to receive incentivised vouchers signed-up on August 31 2012, and the HEA for this
customer occurred in early November 2012. Voucher implementations for all eligible customers were completed by December
31 2012, and financial acquittals for all vouchers were finalised during February 2013. This report and the other specific
residential reports include all registrations up to, and including, the final incentive-eligible customer – i.e. the last sign-up on
August 31 2012. Brief descriptions of program processes relevant to residential registrations, numbers involved, monitoring
and assessment are provided below.
2.1 Quarterly Electricity Consumption Data
On completing the computer-based registration at the Smart Living Centre, each customer signed a printed registration form,
which granted permission for PWC to supply ASC with both historical (up to 15 months prior to registration) and future EC data,
for as long as the household was both a PWC consumer and an ASC customer, at the registered address. In the PWC data
management system there were two relevant descriptors:
1 in a custom field, each ASC customer was flagged as an ASC participant;
2 a PWC status field indicated if the consumer was on (i.e. current/active with PWC) or off (e.g. left the property).
For each month PWC supplied ASC with a file of a set of EC data fields for all ASC-flagged consumers with a PWC „on‟ status,
who had their meters read during that month. These files were drawn from the billing system operated by the retail division of
the PWC, approximately 6 weeks after the end of the month being reported. ASC staff processed these files and uploaded them
to the ASC database.
2.2 Registrations and Terminations
An ASC registration ID was a unique combination of two other identifiers: a customer ID (person or persons with their contact
details) and a residential property ID (defined by the site cadastral parameters). If a customer moved from a residence
registered with ASC to a new property, the customer ID (contact details -name, PO Box, email, mobile phone) remained the
same, but a new registration ID was created as that person was linked with a new property i.e. the same customer ID linked with
a new property ID. The registration associated with the previous property was terminated. Similarly a new person/customer
could sign-up with ASC for a property previously occupied by another ASC customer (who had sold/moved out); this generated a
new registration ID even though the property had previously been part of another ASC registration i.e. the relationship between
properties and customers was in most cases was one to one, but could be many to many. The termination date and reason
were simply fields in a registration record, and for terminated registrations all information remained in the database.
The ASC residential program was conducted over five years in a normal urban environment in which customers and households
moved into, out of, and around the town. Thus the program was dynamic in that it had to deal with and record such human flux.
Three key ASC dates were for registration (also termed sign-up), the HEA (audit date) and the termination of involvement in the
program (termination date). To record the first two dates was straightforward, but to establish a termination date for a
registration was more difficult. Although customers were requested to notify ASC if they were moving out of a property, this did
not commonly occur. If customers did not notify ASC of their termination, the only other way to establish such terminations was
through quarterly EC reports. This was possible if registrations stopped appearing in the PWC quarterly EC reports, and/or there
was a final or termination read recorded in them. It was not a straightforward process to determine terminations using quarterly
EC data, since initially an end-data gap had to be established (per registration) and then confirmed with PWC in relation to a
termination and „off‟ status. Thus the number of terminations recorded in the ASC database is not considered as accurate as

Residential Overview 7
the related numbers for registrations and HEAs, and although ASC made efforts to identify terminations, the number may be
slightly fewer than the actual number of terminations.
2.3 Residential Properties
The ASC program was restricted to properties that were connected to the PWC electricity grid and that were located within the
Alice Springs municipal (LGA) boundaries. A „properties‟ table was included as a necessary component of the ASC operations
database. At the commencement of the program and as part of the database development, relevant property data – street
number, street name, parcel ID, lot, suburb, postcode - were obtained from the Alice Springs Town Council (ASTC) as a one-off
electronic data provision in early 2008. GIS property coordinates were added to the property data at a later date. When
customers registered, their properties were identified through the properties table of the ASC database and linked to the
customer details. If, as the program progressed over years, any new registrant‟s property was not identifiable from the property
table, it usually meant that it had been created as part of a new subdivision since the beginning of the program. In these cases
new property data were added to the property table of the database.
2.4 Tenure Type
As part of the registration details, customers were asked to nominate their tenure status in relation to their registered property
or properties. The three mutually exclusive options were: owner-occupier, landlord or tenant. If the tenure for a property changed
(e.g. an owner occupier moved out and became the landlord for the property), then the first registration was terminated and a
new registration was created. When, for a property, both landlord and tenant registered with ASC, there were two customers
initially linked to the same property (and so two different registrations IDs). Future new tenants who registered with ASC would
also be linked to that property.
2.4.1 Landlords and tenants
All incentivised EEMs were available to landlords, but to undertake these EEMs and claim the ASC incentives, the
corresponding tenants had to register with ASC, since the PWC EC data (via billing) was in the tenants‟ names. Thus
there was no financial advantage for landlords to register without their tenants also registering.
For landlord-tenant registrations, the tenant (i.e. the current occupier) had to agree to the conduct of the HEA, and
normally be present when it was done.
Tenants could register without concurrent landlord registrations and there were a limited number of low cost,
operational EEMs with incentives available to tenants, (e.g. replace fridge seal, replace lighting, service evaporative
air conditioning). The tenant did not need the landlord‟s permission for an HEA, or to undertake tenant-relevant
EEMs.
The site audit data was entered into the ASC database as part of tenants‟ registrations. Landlords did not have site
audit data entered against their registrations.
A full HEA report was provided to the tenant and where there was an associated landlord, a separate report was
provided to the landlord (the landlord did not have access to the tenant‟s EC data or general recommendations).
EEMs funded by the landlord were recorded against the landlord‟s registration, although EC was in the tenant‟s
name. This proved a challenge for reporting and created the potential for reporting anomalies.
Relevant EEMs undertaken by the tenant only were recorded against the tenant‟s registration;
A tenant could terminate a registration, and the landlord remained unterminated if the next tenant registered with
ASC.
2.5 New Builds
People in the process of designing or building a new house could register with ASC, seek EE design advice, and make use of a
limited number of EEMs appropriate for new homes, and excluding those energy efficiency measures mandated by regulation.
These EEMS were those that could be incorporated in the design and/or construction stages. As it was not possible to conduct a

Residential Overview 8
HEA for an incomplete dwelling, assessment of plans and discussion with the owner(s) were required instead. Once the new
house had been occupied for a period, the residents were expected to organise a normal HEA, after which the range of EEMs
could be accessed. Such new residences in the planning or construction stages were flagged as „New Builds‟ (NB) in the ASC
database.
2.6 Control Groups and the CRT Trial
2.6.1 The formal control group
The initial planning for the ASC program included a provision to recruit a control group, the members of which would not be
active registrations in the program (i.e. not have an HEA or be eligible for EEMs), but would participate in relevant surveys and
make available their EC data. Ideally such a control group should be established at, or soon after, the commencement of a
program. The appointment of ASC monitoring and evaluation staff occurred 15 months after the program commenced and
despite a range of strategies and inducements, it proved difficult to recruit a formal control group, even from the large number
of Alice Springs households that had not registered with ASC.
An important strand of the residential program was the CRT trial in which ASC registrants were offered the opportunity to join a
trial, in which tariffs were set at peak/off-peak rates and household EC was measured at 30 minute intervals using a specially
installed smart meter that replaced the older accumulation meter. The smart meter was read remotely and enabled recording
and analysis of EC at 30 minutes intervals. The peak/off-tariffs were set to encourage off-peak appliance use. In conjunction
with the smart meter, an IHD was provided, and this device downloaded interval data from the smart meter and displayed a
range of useful data analyses for the householder. This feedback about current, ongoing and historical EC was designed to
inform householders in ways that would enable them to modify their EC behaviours. The main purpose of the trial was to
examine how ToU tariffs influenced daily EC profiles. The CRT trial is the subject of a separate report, and its relevance to the
control group is as follows. Prior to the ASC program, there had been no residential smart meter installations in Alice Springs
and so there was no data at the householder level about average EC daily profiles i.e. distribution across the designated
peak/off-peak periods for residential consumers. Thus there was no baseline or average data against which to compare the EC
profiles of CRT trial participants, and so assess one aspect of the effectiveness of the CRT trial.
To provide baseline data for the CRT trial, PWC offered to install smart meters at control group premises, which enabled total,
peak and off-peak consumption to be recorded for control group members. In this way the control group became oriented more
towards the CRT trial than to the overall residential program. The initial aim was to recruit 150-200 control group participants
who were willing not to become active ASC customers for a period of 2 years. However despite extensive advertising and
promotion only 60-70 residents expressed an interest. To raise numbers to the 150-200 level, existing ASC customers who
either had not had an HEA, or who had an HEA but had not implemented any EEMs, were approached to participate in the
control group and have a smart meter fitted. Approximately 100 such households were added to the control group in this way.
Thus the group was termed the formal control group and it consisted of 2 subgroups: original volunteers who had not previously
signed-up with ASC, and existing customers who had not been active in engaging with ASC options. It was hoped and
encouraged, but could not be mandated, that the formal control group members would not undertake ASC EEMs. However a
small number did so and ASC accepted these developments. As meter boxes allowed, members of the formal control group (i.e.
originals and existing customers) had smart meters fitted by the PWC.
2.6.2 The informal control group
To establish a referent for the general EC of ASC registrations, PWC supplied de-identified quarterly EC data, over the course of
the program, for Alice Springs residents who were not ASC customers. The formal control group was relatively small and its
primary focus had become the supply of referent data for peak/off-peak consumption. This larger informal control group of
quarterly EC data for non-ASC customers was available for examining overall changes in average residential energy use,
potentially over a range of periods (e.g. months, seasons, years), and in relation to changes in EC of ASC registrants. PWC

Residential Overview 9
provided this data to ASC with a location descriptor at the level of ABS statistical local areas, of which there are five across the
Alice Springs municipality. This group of PWC consumers was called the informal control group, and its data processing and use
are described in a later report.
2.7 ASC Operations Database
Once funding had been secured (2007) and work commenced in 2008, a comprehensive online relational database was
designed and built as an integral part of the ASC program development. It was a custom application that provided customer
management and interaction, tracking of incentives and measures undertaken, and storage of data to meet reporting
requirements. It provided a range of standard reports and the capacity to create further custom reports, had live links with both
local spreadsheets and the customer portal that provided a range of specific reports for customers, through a secure www link.
It was regularly upgraded, included a number of innovative features, and generated considerable stakeholder interest.
In particular, the application was designed to:
hold contact details of participants in the various trials and services, and track interactions
represent properties and the results of energy audits (appliances and building structure)
hold demographic information about participants
track EE and solar power recommendations
hold participant EC and solar power generation data
produce an engaging home energy survey report for householders
track incentives and produce vouchers
provide tools for ongoing customer engagement including a self-service customer portal
The main database tables and their contents and/or function are described briefly below.
Database table
descriptive name Contents
Customer Customer ID, name, contact details, link to PWC customer ID
Customer registration For a property: registration ID, property ID (ASTC), tenure, sign-up & audit dates, PWC meter ID,
termination date & notes, customer ID (customer may have >1 property)
Customer contact notes Time/SLC staff stamped ongoing contact notes (phone, visit etc)
Property and GIS ASTC property data to identify each individual property, including GIS coordinates
Uploaded documents Stored all documents uploaded against each registration
Customer demographics Education, employment, income, indigenous, home language, age distribution of occupants,
property ID, audit ID, registration ID
Energy audit Detailed description of premise parameters – completed as paper checklist on site and entered
to DATABASE later
EEM records Each EEM incentive recommended/agreed at energy audit, or later, linked to registration ID, and
incorporated in the incentives report to customer
Voucher EEM data to print incentive vouchers from incentive report, to be prepared and posted to
customer after audit
Meter history Meter ID and any change of meters linked to registration ID
Quarterly power Quarterly power records for customers, obtained from PWC
Smart meter power Smart meter quarterly power records (30 min interval) for customers obtained from PWC
Supplier ID, contact details, work field and EEM capability for supplier
Table 4: Features of the ASC database

Residential Overview 10
The financial records of the ASC program were managed through the ASTC „Authority‟ database, from which property details
were initially extracted.
2.8 Customer Portal
A secure online customer portal was developed and became available in the latter years of the program. It drew on both the
quarterly and interval EC data held in the database, and ASC had to be confident that this data was complete and accurate
before making the portal available. Obtaining EC data from the PWC, checking and cleaning it, uploading it to the database and
checking it again in customer records proved a problematic and time consuming process, and was the main reason why the
customer portal was not available in the early stages of the program. Customers were sent the portal www address, their user
name and a password to access the portal for their property (or properties).
The portal had an entrance page and a number of reports that could be accessed from this page. There were two standard
reports available to all customers and three optional reports depending on whether the customers were in the CRT trial or had
installed a BP-PV system through ASC. Examples from the portal are available in the appendices as follows:
Portal entrance page ...........................Appendix 7
Customer status report...................... Appendix 8
EC report ............................................. Appendix 9
Smart meter data report .....................Appendix 10
PV system data report ........................ Appendix 11
Download interval data ......................Appendix 12
2.9 Email Notifications to Customers – a Database Application
Two customer notification emails were established as part of the database. These had a number of set-up options and were
sent at appropriate times in the program cycles. The first was a voucher reminder email to customers whose vouchers had not
been used, and it was sent about 2 months prior to the voucher expiry date. The second was an EC update email which used a
chart from the portal EC report, and was sent to customers approximately every six months to provide them with their EC history
to their most recent billing period. Examples of these emails are available in the appendices.
Voucher reminder email …………………….Appendix 13
EC update email…………………………………Appendix 14
2.10 Follow-up Support (FUS)
In the second half of the program a Follow up Support (FUS) option was offered to customers. This was an engagement with the
HEA or that could take various forms depending on expressed customer need. It ranged from a high level home visit that was
similar to the initial HEA to something simpler like a phone conversation with the auditor about a specific issue or request for
advice. There was an option to prepare an FUS report for the higher level engagements, and the database was modified to
record FUS activities. Details are available in the appendices.
FUS engagement/report .............................Appendix 15
Residential Overview 11
3. Foundational Information for Alice Springs
This section provides background information and foundational data that is relevant to the ASC program and that may be used
in later sections or reports.
3.1 ABS Data for Population, Dwellings, Household Composition and
Tenure
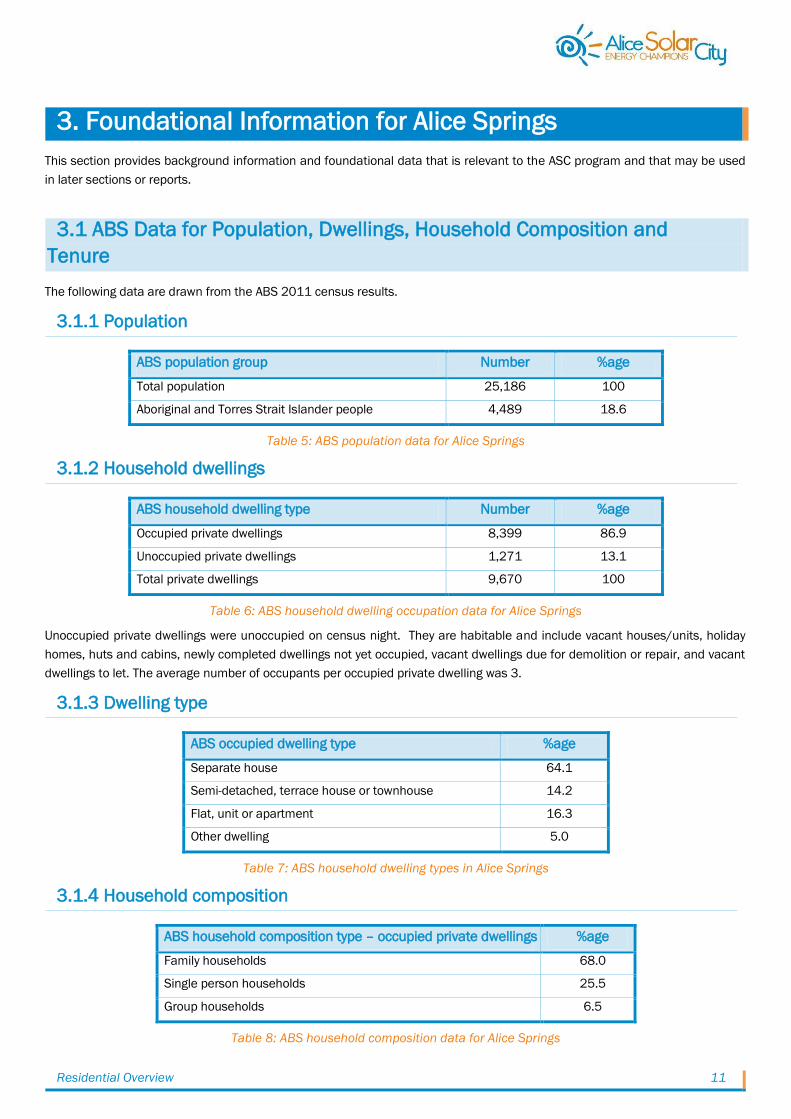
The following data are drawn from the ABS 2011 census results.
3.1.1 Population
ABS population group Number %age
Total population 25,186 100
Aboriginal and Torres Strait Islander people 4,489 18.6
Table 5: ABS population data for Alice Springs
3.1.2 Household dwellings
ABS household dwelling type Number %age
Occupied private dwellings 8,399 86.9
Unoccupied private dwellings 1,271 13.1
Total private dwellings 9,670 100
Table 6: ABS household dwelling occupation data for Alice Springs
Unoccupied private dwellings were unoccupied on census night. They are habitable and include vacant houses/units, holiday
homes, huts and cabins, newly completed dwellings not yet occupied, vacant dwellings due for demolition or repair, and vacant
dwellings to let. The average number of occupants per occupied private dwelling was 3.
3.1.3 Dwelling type
ABS occupied dwelling type %age
Separate house 64.1
Semi-detached, terrace house or townhouse 14.2
Flat, unit or apartment 16.3
Other dwelling 5.0
Table 7: ABS household dwelling types in Alice Springs
3.1.4 Household composition
ABS household composition type – occupied private dwellings %age
Family households 68.0
Single person households 25.5
Group households 6.5
Table 8: ABS household composition data for Alice Springs

Residential Overview 12
3.1.5 Number of bedrooms
ABS number of bedrooms - occupied private dwellings %age
None (e.g. bedsitter) 1.8
1 bedroom 9.1
2 bedrooms 20.8
3 bedrooms 43.4
4 or more bedrooms 21.0
No data 3.9
Table 9: ABS number of bedrooms in households in Alice Springs
3.1.6 Tenure type
ABS tenure type – occupied private dwellings %age
Owned outright or with a mortgage (owner-occupier) 52.9
Rented 41.9
Other and not stated 5.2
Table 10: ABS tenure type of dwellings in Alice Springs
3.2 Numbers of Properties/Dwellings in Alice Springs – Various Sources
In early 2012 the ASTC provided data on rateable properties in the Alice Springs municipality, and the Centre for Appropriate
Technology (CAT) undertook a desktop survey of rooftops in Alice Springs to establish a set of parameters for a solar
investigation, using aerial imagery from mid-2011. The CAT study used cadastral lot (parcel) data from the NT land information
system as a basis for identifying unique property parcels (lots). Data from all these sources and the ABS is below.
Data source Count
Residential Commercial Total
ASTC - rateable properties 8453 958 9411
CAT Study – cadastral lots 6097 729 6826
CAT Study – structures per property 9784 1771 11555
ASC - properties in database 9885
ABS – occupied private dwellings 8399
Table 11: Numbers or properties/dwellings in Alice Springs from various sources
The data from each of these sources is described in more detail below.
3.2.1 ASTC rateable residential properties
These include flats/units/townhouses of which there is normally more than one on a cadastral lot.
The proportion of commercial rateable properties is 10% of the total
Residential rateable properties include the following approximate numbers:
o NT Government Housing – rental properties 1100
o Rental Properties under a rental manager 1240
o Joint Defence Force properties – tenanted 280
o Indigenous Community housing areas 20
Residential Overview 13
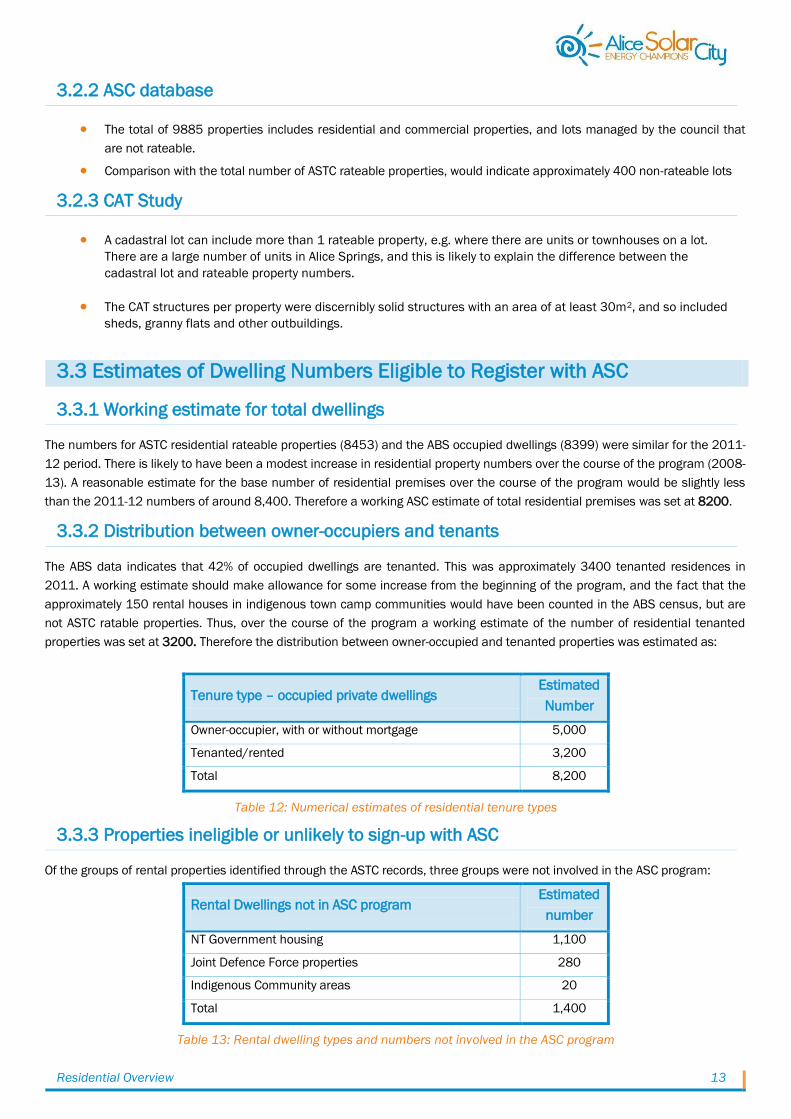
3.2.2 ASC database
The total of 9885 properties includes residential and commercial properties, and lots managed by the council that
are not rateable.
Comparison with the total number of ASTC rateable properties, would indicate approximately 400 non-rateable lots
3.2.3 CAT Study
A cadastral lot can include more than 1 rateable property, e.g. where there are units or townhouses on a lot.
There are a large number of units in Alice Springs, and this is likely to explain the difference between the
cadastral lot and rateable property numbers.
The CAT structures per property were discernibly solid structures with an area of at least 30m2, and so included
sheds, granny flats and other outbuildings.
3.3 Estimates of Dwelling Numbers Eligible to Register with ASC
3.3.1 Working estimate for total dwellings
The numbers for ASTC residential rateable properties (8453) and the ABS occupied dwellings (8399) were similar for the 2011-
12 period. There is likely to have been a modest increase in residential property numbers over the course of the program (2008-
13). A reasonable estimate for the base number of residential premises over the course of the program would be slightly less
than the 2011-12 numbers of around 8,400. Therefore a working ASC estimate of total residential premises was set at 8200.
3.3.2 Distribution between owner-occupiers and tenants
The ABS data indicates that 42% of occupied dwellings are tenanted. This was approximately 3400 tenanted residences in
2011. A working estimate should make allowance for some increase from the beginning of the program, and the fact that the
approximately 150 rental houses in indigenous town camp communities would have been counted in the ABS census, but are
not ASTC ratable properties. Thus, over the course of the program a working estimate of the number of residential tenanted
properties was set at 3200. Therefore the distribution between owner-occupied and tenanted properties was estimated as:
Tenure type – occupied private dwellings Estimated
Number
Owner-occupier, with or without mortgage 5,000
Tenanted/rented 3,200
Total 8,200
Table 12: Numerical estimates of residential tenure types
3.3.3 Properties ineligible or unlikely to sign-up with ASC
Of the groups of rental properties identified through the ASTC records, three groups were not involved in the ASC program:
Rental Dwellings not in ASC program Estimated
number
NT Government housing 1,100
Joint Defence Force properties 280
Indigenous Community areas 20
Total 1,400
Table 13: Rental dwelling types and numbers not involved in the ASC program
Residential Overview 14
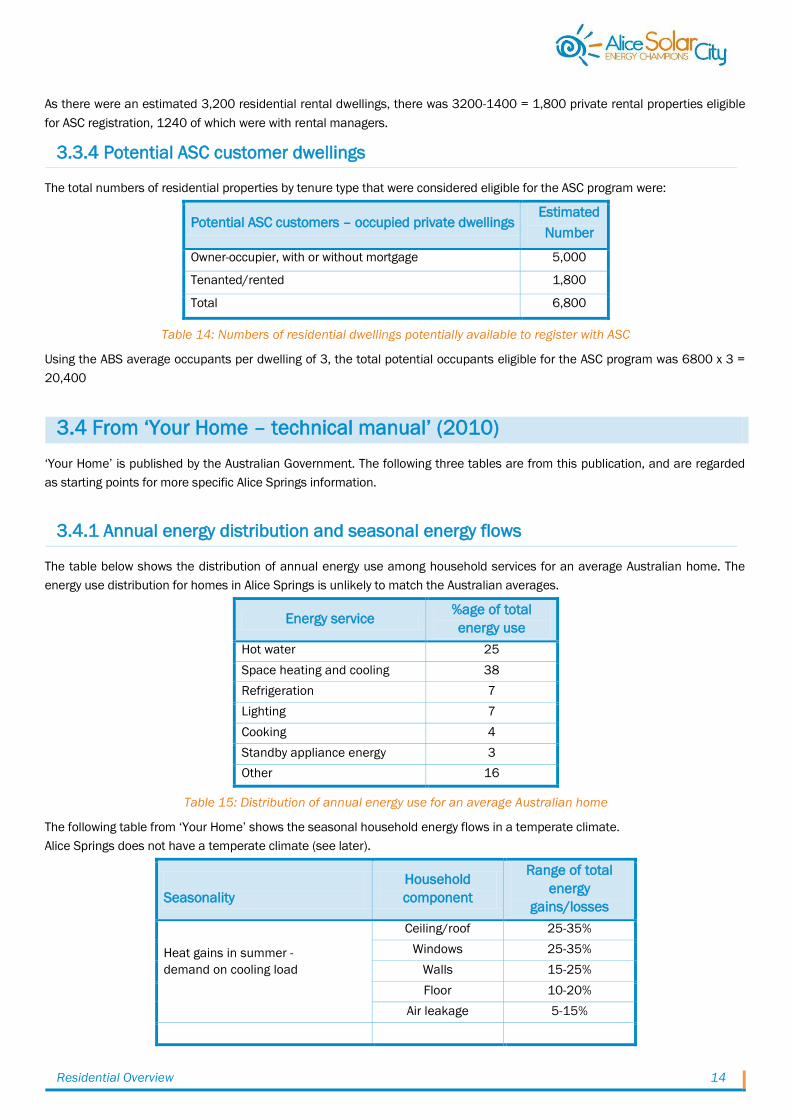
As there were an estimated 3,200 residential rental dwellings, there was 3200-1400 = 1,800 private rental properties eligible
for ASC registration, 1240 of which were with rental managers.
3.3.4 Potential ASC customer dwellings
The total numbers of residential properties by tenure type that were considered eligible for the ASC program were:
Potential ASC customers – occupied private dwellings Estimated
Number
Owner-occupier, with or without mortgage 5,000
Tenanted/rented 1,800
Total 6,800
Table 14: Numbers of residential dwellings potentially available to register with ASC
Using the ABS average occupants per dwelling of 3, the total potential occupants eligible for the ASC program was 6800 x 3 =
20,400
3.4 From „Your Home – technical manual‟ (2010)
„Your Home‟ is published by the Australian Government. The following three tables are from this publication, and are regarded
as starting points for more specific Alice Springs information.
3.4.1 Annual energy distribution and seasonal energy flows
The table below shows the distribution of annual energy use among household services for an average Australian home. The
energy use distribution for homes in Alice Springs is unlikely to match the Australian averages.
Energy service %age of total
energy use
Hot water 25
Space heating and cooling 38
Refrigeration 7
Lighting 7
Cooking 4
Standby appliance energy 3
Other 16
Table 15: Distribution of annual energy use for an average Australian home
The following table from „Your Home‟ shows the seasonal household energy flows in a temperate climate.
Alice Springs does not have a temperate climate (see later).
Seasonality
Household
component
Range of total
energy
gains/losses
Heat gains in summer -
demand on cooling load
Ceiling/roof 25-35%
Windows 25-35%
Walls 15-25%
Floor 10-20%
Air leakage 5-15%

Residential Overview 15
Heat losses in winter -
demand on eating load
Ceiling/roof 25-35%
Windows 11-20%
Walls 10-20%
Floor 10-20%
Air leakage 15-25%
Table 16: Seasonal household energy flows in a temperate climate
3.4.2 The climatic zone for Alice Springs
In „Your Home‟ Alice Springs is located in Zone 3 – hot dry summer and warm winter. However the winter frequently has periods
of 2-3 months with cold nights (often at minus 2-5 degrees C, with frosts) and temperate days. Thus there is a real need for
intermittent winter heating which is a significant energy user. The characteristics of Zones 3 and 4 are defined in „Your Home‟
as:
Zone 3 Zone 4
Distinct wet and dry seasons
Low rainfall and low humidity
No extreme cold, but can be cool in winter
Hot to very hot summers are common
Significant diurnal (day/night) temperature
range
Distinct seasons with low humidity all year
High diurnal (day/night) temperature range
Low rainfall
Very hot summers common with hot dry
winds
Cool winters with cold dry winds
Table 17: Zone 3 and 4 climatic zones
For climatic zones 3 and 4 „Your Home‟ indicates that generally 70% or more of the total space conditioning energy is used for
cooling.
3.5 Climate Data from the Bureau of Meteorology
To illustrate both the extremes and the variability of the local climate, the following table provides the Bureau of Meteorology
daily averages per month for relevant parameters, recorded at the Alice Springs airport over a period of 70 years (for the
majority of elements).
Climatic element Month Jan Feb Mar Apr May Jun Jul Aug Sep Oct Nov Dec Annual
Mean max temperature (°C) 36.4 35 32.6 28.2 23 19.8 20 22.6 27.2 30.9 33.6 35.4 28.7
Highest temperature (°C) 45.2 44.7 42.2 39.9 35 31.6 32 35.2 38.8 41.7 43 44.2 45.2
Mean number of days ≥ 35°C 21.5 16.2 9.4 1.5 0 0 0 0 1.4 7.5 12.9 18.2 88.6
Mean min temperature (°C) 21.5 20.7 17.5 12.6 8.2 5 4 6 10.3 14.8 17.8 20.2 13.2
Lowest temperature (°C) 10 8.5 6.1 1.4 -2.7 -6 -7.5 -4.1 -1 1.3 3.5 9.3 -7.5
Mean number of days ≤ 2°C 0 0 0 0.1 2.2 9.1 12 6.7 0.7 0 0 0 30.5
Mean rainfall (mm) 38.8 44.3 32.4 16.5 18.5 13.8 15 9.2 8.5 21.4 29.1 36.9 284.5
Mean daily sunshine (hours) 10.3 9.8 9.6 9.5 8.5 8.4 9.1 9.8 10 10 10.1 10 9.6
Mean daily solar exposure
(MJ/m2)) 27.4 25.4 23.8 20.3 16.3 14.6 16 18.9 22.3 25.3 27.1 27.3 22
Mean number of clear days 13.1 12.1 16.6 16.7 15.8 17 21 22.5 20.6 17.8 13.5 12.9 199.6
Mean number of cloudy days 6.5 6.5 5.3 5 7.4 5.6 4.3 3.3 3 4.3 5.4 6.9 63.5
Table 18: Bureau of Meteorology climate data for Alice Springs

Residential Overview 16
Mean hours of daily sunshine, mean daily solar exposure, and mean number of clear days, clearly show the suitability of the
Alice Springs climate for solar technologies. The temperature data shows the seasonal extremes that influence residential
space conditioning needs.
3.6 Residential Electricity Tariffs and Consumption
3.6.1 Household energy use and electricity
Although the generic information from „Your Home‟ is for all sources of energy used by households (e.g. electricity, gas, wood,
fuel oil, solar) the assumptions, calculations and estimates in the following sections are oriented to electricity use because:
1 The major source of utility-provided household energy in Alice Springs is electricity. Gas is available, mainly as bottled LP
gas, although a small area of the town has a reticulated gas supply. The two sources of information about levels of gas
use were:
a commissioned telephone survey of 422 residents undertaken at the beginning of the ASC program in March 2008;
the site audit data for ASC residential customers. Both the telephone survey and site audit data indicated that
approximately 80% of residences have a gas supply, but that about 16% of hot water systems are solely gas fuelled.
ASC site audit data indicated that 75% of cooktops and 35% of ovens were gas operated, and that approximately
20% of residences used gas for space heating, (compared to 35% of the 2008 telephone survey cohort); however,
comparatively, cooking is a minor energy user. As hot water and space heating services are the major energy
consumers, gas makes a much smaller contribution to household energy use than electricity for the majority of
households.
2 The primary focus of the ASC project was to promote and facilitate reductions in household electricity consumption, with
the dual aims of reducing GHG emissions and deferring or avoiding investments to meet growing peak demands on the
local electricity supply.
3.6.2 PWC electricity tariffs for Alice Springs
During the course of the ASC project, domestic electricity tariffs increased each year on July 1, with the new tariffs announced
typically in May of the same year. The exception was the announcement in October 2012 of an increase from the 1st January
2013. They are shown in the table below.
Residential peak and off-peak rates were relevant for households who elected to move onto a CRT, or who installed an ASC
incentivized PV system. The periods were:
o Peak: 9am – 6pm weekdays;
o Off-peak: all other times (i.e. 6pm – 9am weekdays, and all weekends).
Tariff structure
Cents per kWh
FY
2007-
08
FY
2008-
09
FY
2009-
10
FY
2010-
11
FY
2011-
12
July-Dec
2012
Jan-June
2013
Flat rate 15.1 15.52 18.31 19.23 19.77 21.77 25.83
Peak rate
9am – 6pm weekdays 22.35 23.11 27.27 28.63 29.43 31.07 37.75
Off-peak rate
6pm – 9am weekdays
All day Saturday and
Sunday
12.58 13.01 15.35 16.12 16.57 18.48 21.89
Daily fixed charge 29.59 30.6 36.11 38.98
38.98
40.07 48.08
Table 19: Peak, off-peak and flat rate EC tariffs during the ASC program
Residential Overview 17
3.6.3 Average daily household electricity consumption
Using data for the years prior to the commencement of the ASC project (in January 2008), PWC calculated that the average
annual residential electricity consumption (EC) for Alice Springs was 8500 kWh/year, with an average daily consumption (ADC)
of 23 kWh/day. These averages were used in ASC fact sheets and a range of other ASC information material.
As part of the ASC project, PWC provided EC data for new customer household registrations up to 12-15 months prior to the
date of registration, dependent on the period the customers had occupied premises prior to registration with ASC. To assist with
the HEA, and using available data, the ASC auditors estimated historical average annual consumption and logged this in the
database. For customers who had occupied their houses for less than 12 months prior to ASC sign-up, the auditors estimated
average annual consumption based on the available data (which may have only been for 3-6 months). If no PWC data was
available the auditors used the Alice Springs average of 8500 kWh/year and adjusted it according to relevant household
parameters. This pre-HEA estimated annual consumption data in the ASC database gives an average annual residential EC of
8650 kWh/year for approximately 2400 ASC customers.
Another ASC data function calculates an ADC before and after the HEA using the available PWC quarterly EC data. This
calculated ADC value prior to HEA also shows the number of days for which data is available. For registrations that have at least
200 days of EC data prior to the HEA (approximately 2100), the average annual household consumption is 8900 kWh/year.
Taking into account the three figures of 8500, 8650, and 8900, and bearing in mind that the latter is likely to be the most
accurate, it is reasonable to select a figure of 8800 kWh/year as an average annual EC for ASC customers, over the course of
the program. Thus 8800 kWh/year was used as the average annual household EC (for ASC customers) for ongoing calculations
and estimates. This gives an ADC of 24 kWh/day for 365 days, or 25.3 kWh/day for the average annual occupancy of 347 days.
3.7 The ASC ADC Calculator
ADC is a very useful analytical and comparative metric. Ideally it is calculated over an annual period to take account of average
seasonal climatic change. ASC wished to establish a method of readily calculating ADC per household on either side of given
dates e.g. the dates of the HEA or the installation of a SHW system. This was done by creating a database table that stored an
ADC record for each day for each active household. The daily record was calculated from the quarterly consumption/billing
records stored in the database. Per household/meter the total consumption per billing period (usually about 90 days) was
divided by the number of days in the billing period and the resulting ADC stored against each date/day of the billing period. A
reporting algorithm was designed in which a specific date could be selected (an actual date, or the varied dates of an EEM
implementation), together with the number of either 6 or 12 month periods before and after the specified date. The output was
a file including all relevant customers with the range of ADC data for the selected periods before and after the date. The
individual customer data could then be aggregated and manipulated to provide useful metrics.
3.8 Informal Control Group Electricity Consumption Data
To establish a referent for the changes in EC of ASC households, PWC supplied de-identified quarterly EC data, for standard
annual quarters (January-March etc), over the course of the program, for Alice Springs residents. ASC customers were flagged
in the PWC database, and so could be identified by their ASC flags in the de-identified quarterly data. However, in the data
supplied, PWC could not separate residential from commercial customers, so residential customers could not readily be
identified.
The criteria for data inclusion/exclusion in the data manipulation were as follows:
1 Exclude ASC participants: initially include billing periods which did not have an ASC registration ID assigned in PWC data
file i.e. ASC identifier field was blank;

Residential Overview 18
2 Exclude billing periods with very high and very low consumption: ADC was calculated from the billing data, and for
inclusion the ADC had to be greater than 3 kWh/day and less than 120 kWh per day;
3 Exclude problem billing periods: number of days in any billing period had to be less than 110;
4 After joining four or more consecutive quarters of data, exclude encrypted IDs without „full year‟ of data: sum of days for
encrypted ID billing periods meeting criteria (1-3) had to be between 300 and 380;
5 After joining four or more consecutive quarters of data, exclude encrypted IDs which are likely to be commercial (based
on monthly reads): the count of encrypted ID billing periods meeting the criteria (1-3) per encrypted ID had to be less
than 6 per year.
As the PWC data was supplied in calendar year quarters there was significant overlap in the billing periods between for the first
and third months of quarters. Use of an ADC function enabled aggregation of data into monthly groups (using data from
consecutive billing periods) with a total monthly consumption (kWh) and a total number of household days. From these two
aggregated measures an ADC per month was calculated from a year prior to the start of the ASC program to December 2012,
although the last three months of 2012 are not considered accurate as they require data from billing in January-March 2013,
which was not available at the time of processing. The resulting monthly data for the informal control group is provided in the
appendices.
Informal control group monthly ADC…………………………Appendix 16
4. Estimates for Appliance Use and EEM Savings in Alice
Springs
This section provides a summary of the estimates used as a basis for calculations on EC and savings. The assumptions and
rationales are generally not included in this section but are associated with the more detailed steps available in specific reports
for PV, SHW and EEMs.
4.1 Electricity Consumption for Average and Energy Champion Households
During 2003, the Arid Lands Environment Centre in Alice Springs conducted a project entitled the “Cool Living House”
(http://alec.org.au/resources/past-projects/cool-living-house.html). The project arranged for a typical Alice Springs ex-housing
commission house to be retro-fitted with energy and water efficient technologies, and the family of four (2 adults, 2 children)
continued to live normally but conservatively. Energy use fell to under half that of an average home. This case study was used to
typify an „Energy Champion‟ household for Alice Springs, with an annual average EC of 3800 kWh/year.
A more useful measure for regular reference than annual consumption is ADC. Average annual consumption and ADC figures for
average and „energy champion‟ households in Alice Springs are given below:
Average annual
electricity consumption ADC (365 days)
Average ASC household 8800 kWh 24 kWh
Energy champion household 3800 kWh 10.4 kWh
Table 20: EC for average and ‘energy champion’ households in Alice Springs
4.2 Space Heating and Cooling
Energy consumption for space heating and cooling is significant in Alice Springs, and estimated averages are a foundation for
further calculations involving energy distributions and savings. The assumptions for heating and cooling an average AS house
are described in the estimate column of the following table.
Residential Overview 19
Function Estimate Parameter used
Winter space heating (3
months) 90 days at 16 kWh/day = 1450 kWh 1450 kWh/year 40%
Summer space cooling (5
months) 150 days at 13 kWh/day = 1950 kWh 1950 kWh/year 60%
Other times of year Assume no cooling/heating energy use for other
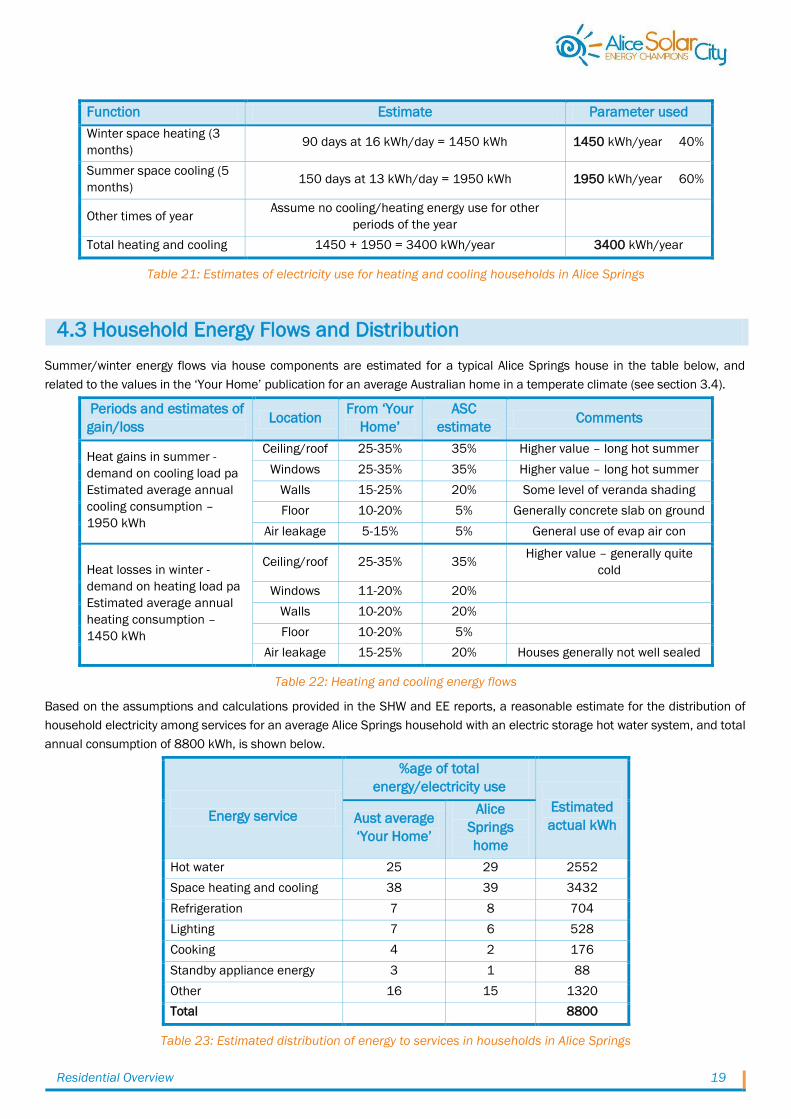
periods of the year
Total heating and cooling 1450 + 1950 = 3400 kWh/year 3400 kWh/year
Table 21: Estimates of electricity use for heating and cooling households in Alice Springs
4.3 Household Energy Flows and Distribution
Summer/winter energy flows via house components are estimated for a typical Alice Springs house in the table below, and
related to the values in the „Your Home‟ publication for an average Australian home in a temperate climate (see section 3.4).
Periods and estimates of
gain/loss Location
From „Your
Home‟
ASC
estimate Comments
Heat gains in summer -
demand on cooling load pa
Estimated average annual
cooling consumption –
1950 kWh
Ceiling/roof 25-35% 35% Higher value – long hot summer
Windows 25-35% 35% Higher value – long hot summer
Walls 15-25% 20% Some level of veranda shading
Floor 10-20% 5% Generally concrete slab on ground
Air leakage 5-15% 5% General use of evap air con
Heat losses in winter -
demand on heating load pa
Estimated average annual
heating consumption –
1450 kWh
Ceiling/roof 25-35% 35% Higher value – generally quite
cold
Windows 11-20% 20%
Walls 10-20% 20%
Floor 10-20% 5%
Air leakage 15-25% 20% Houses generally not well sealed
Table 22: Heating and cooling energy flows
Based on the assumptions and calculations provided in the SHW and EE reports, a reasonable estimate for the distribution of
household electricity among services for an average Alice Springs household with an electric storage hot water system, and total
annual consumption of 8800 kWh, is shown below.
Energy service
%age of total
energy/electricity use
Estimated
actual kWh Aust average
„Your Home‟
Alice
Springs
home
Hot water 25 29 2552
Space heating and cooling 38 39 3432
Refrigeration 7 8 704
Lighting 7 6 528
Cooking 4 2 176
Standby appliance energy 3 1 88
Other 16 15 1320
Total 8800
Table 23: Estimated distribution of energy to services in households in Alice Springs
Residential Overview 20
4.4 Hot Water: Electric Storage and Solar
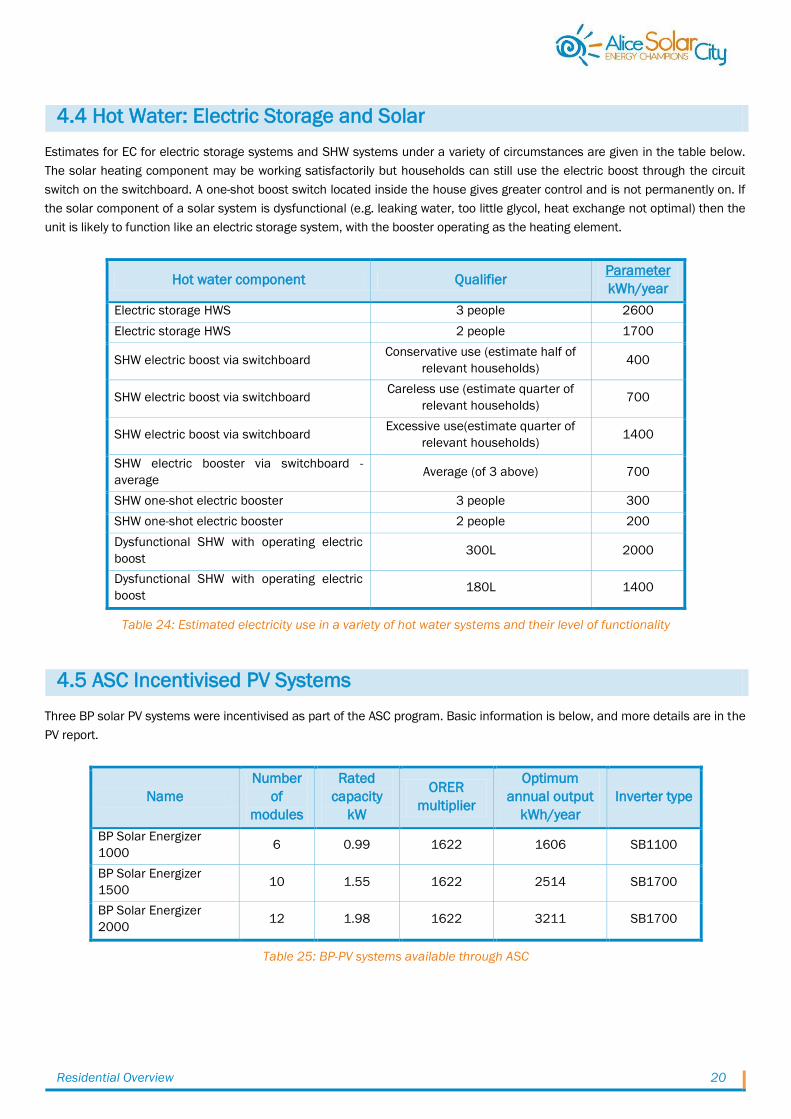
Estimates for EC for electric storage systems and SHW systems under a variety of circumstances are given in the table below.
The solar heating component may be working satisfactorily but households can still use the electric boost through the circuit
switch on the switchboard. A one-shot boost switch located inside the house gives greater control and is not permanently on. If
the solar component of a solar system is dysfunctional (e.g. leaking water, too little glycol, heat exchange not optimal) then the
unit is likely to function like an electric storage system, with the booster operating as the heating element.
Hot water component Qualifier Parameter
kWh/year
Electric storage HWS 3 people 2600
Electric storage HWS 2 people 1700
SHW electric boost via switchboard Conservative use (estimate half of
relevant households) 400
SHW electric boost via switchboard Careless use (estimate quarter of
relevant households) 700
SHW electric boost via switchboard Excessive use(estimate quarter of
relevant households) 1400
SHW electric booster via switchboard -
average Average (of 3 above) 700
SHW one-shot electric booster 3 people 300
SHW one-shot electric booster 2 people 200
Dysfunctional SHW with operating electric
boost 300L 2000
Dysfunctional SHW with operating electric
boost 180L 1400
Table 24: Estimated electricity use in a variety of hot water systems and their level of functionality
4.5 ASC Incentivised PV Systems
Three BP solar PV systems were incentivised as part of the ASC program. Basic information is below, and more details are in the
PV report.
Name
Number
of
modules
Rated
capacity
kW
ORER
multiplier
Optimum
annual output
kWh/year
Inverter type
BP Solar Energizer
1000 6 0.99 1622 1606 SB1100
BP Solar Energizer
1500 10 1.55 1622 2514 SB1700
BP Solar Energizer
2000 12 1.98 1622 3211 SB1700
Table 25: BP-PV systems available through ASC

Residential Overview 21
4.6 ASC Incentivised EEMs
Estimated annual savings per incentivised EEM were calculated using a range of appropriate assumptions described in the
EEMs report.
EEM
Estimated
annual savings
kWh
EEM
Estimated
annual savings
kWh
Paint roof white 200 Install thermal skin over
external wall 350
Replace old roof with new white
roof sheeting 200
Replace 12v halogen
downlights with low energy
option
400
Install roof ventilation device 20
Replace high energy use
lighting with energy efficient
lighting
400
Install ceiling insulation – batts 350 Install motion sensors on
external lighting 25
Install ceiling insulation – loose
fibre 350 Service SHW system 900
Replace ceiling insulation –
batts 230
Install one-shot relay on
existing SHW system
400
Replace ceiling insulation –
loose fibre 230
Install heat pump hot water
system 1500
Install bulk floor insulation 150 Service evaporative air
conditioning unit
150
Retrofit insulation into wall
cavities 200
Replace perished
refrigerator/freezer seals 100
Install double glazed windows 200
Replace old style
refrigerator/freezer with new
energy efficient model
300
Tint windows 140
Purchase swimming pool
cover/pool cover roller 600
Install external shading on
windows/wall 300
Replace pool pump with
variable speed model 1200
Table 26: Estimated annual electricity savings for ASC EEMs
5. Overview of ASC Residential Registration Numbers,
Demographics, and Site Characteristics
5.1 ASC Residential Participant Numbers
The numbers in the tables below are for the ASC program from commencement (March 2008) until the final incentive-eligible
registration on August 31 2012. The numbers in this section are for broad categories, and in later reports finer details are
provided in which relevant numbers are based on the availability of useful data to meet specific analyses for reporting
requirements.

Residential Overview 22
5.1.1 Total formal control group and residential registrations
The numbers in the two sub-groups of the formal control group, and their change over time associated with an HEA and/or
EEMs are shown in the table below.
Formal control group component Numbers in control group
Initially With later HEA/EEM Without HEA or used EEV
Original formal control group 63 5 58
Existing customers in formal control group 106 13 93
Totals 169 18 151
Table 27: Numbers in the formal control group
The original control group members did not have an HEA and were not involved in the routines of the program, yet were
registered in the database. As a first step, the numbers for this group were deducted from the total residential registrations;
after a period in the formal control group 1, five of the original formal control group signed up as regular customers, had an HEA,
and undertook one or more EEMs. This data is shown in the table below.
Registration group Numbers
Total residential registrations to August 31 2012 2856
Total original control group 63
Number of original control group with HEA/EEMs 5
Number of original control group without HEA 58
Total residential registrations with potential for a HEA 2798
Table 28: Number of residential registrations initially eligible for a HEA
Thus there were 2798 registrations that were eligible for an HEA and subsequent EEMs. This number excluded the original
control group of 58 who did not sign up for an HEA, but it included the then current customers who joined the control group and
who had previously participated in an HEA. It also included both landlords and tenants, pairs of which were generally linked with
a common property.
The ASC residential demographics indicated that across the program, the total number of persons (in contrast to registrations)
in owner occupied and tenanted dwellings at the time of their HEAs was 7500.
5.1.2 Tenure type, registrations, audits, terminations and new builds
The distribution of the 2798 eligible HEA registrations between the three tenure types is shown in the table below. The numbers
and percentages of HEAs, terminations and new builds within each tenure type are also provided.
Tenure type
Registrant numbers and percentages
Total
number
% of
total
HEAs completed Terminations New builds
Number %age Number %age Number %age
Owner-occupier 2446 87.5 2332 95.3 529 21.6 45 1.8
Tenant 194 6.9 169 87.0 117 60.6
Landlord 158 5.6 129 81.5 26 16.6 4 2.5
Total 2798 100 2630 94.0 672 24.0 49 1.8
Table 29: Distribution of HEA-eligible registrations among tenure types

Residential Overview 23
Owner-occupiers constituted 87.5% of registrations, and, of this group, 95% had an HEA, approximately 22% terminated, and
1.8% moved into newly built homes. As may be expected among the mobile population of Alice Springs, tenants had the highest
termination rate of 61%.
5.1.3 Properties and persons
The 2798 residential registrants eligible for an HEA over the course of the program occupied 2561 different dwellings; 2344
(91.5%) of these dwellings housed only one registered household during the program, and 8.5% had changes of occupants who
registered with ASC. The distribution between ASC registered owner-occupied and tenanted dwellings in relation to the
estimated potential number of such tenured dwellings available for ASC registration, is shown below:
Private dwelling type Estimated number
available for ASC
Number registered
with ASC
%age
registered
Owner-occupier, with or without mortgage 5,000 2,342 46.8
Rental 1,800 219 12.2
Total 6,800 2,561 37.7
Table 30: Estimated available tenure types that registered with ASC
Based on the estimates of dwellings available for ASC registration, 47% of owner-occupier dwellings in Alice Springs registered
with the ASC program, and only 12% of rental dwellings, giving an overall registration rate of 38% for relevant ASC dwellings.
Using the ABS average occupancy of 3, the number of persons in dwellings potentially available to resister with the ASC was
6800 x 3 = 20,400. Over the course of the ASC program, the population of registered households was 7,500, or 37% of the
total potential population.
5.1.4 Landlords and tenants
If landlords are excluded (since they are generally linked to a tenanted property), the total registrations is 2641 (2447+194), of
which 194, or 7.3% are tenants. The ABS data indicates that 42% of residences in Alice Springs are tenanted and 53% owner-
occupied. Therefore among the ASC registrations, tenants are significantly under-represented and owner-occupiers
correspondingly over-represented compared to the Alice Springs population.
The numerical relationship between ASC landlords and tenants is shown in the table below.
Landlords Landlords with Tenants Landlords without Tenants
158
126
32 Landlords with 2 successive
tenants
7
Tenants Tenants with Landlords Tenants without Landlords
194 133 61
Table 31: Landlord and tenant numbers in the ASC program
Of the 158 landlords, 32 had joined ASC without their tenants also signing up. Of the remaining 126 landlords whose tenants
signed-up, 7 had two tenants sign-up over time. Thus there were 133 tenants with an ASC registered landlord, and 61 tenants
who joined ASC without their landlord.
5.2 ASC Residential Demographics
At the time of each HEA, the auditor requested the householder to provide listed demographic data which was entered directly
into the online database. Data was not collected from landlords, and customers could decline to provide some or all of the
demographic data. The information below is based on the data for which there are valid responses, i.e. it excludes unknown and
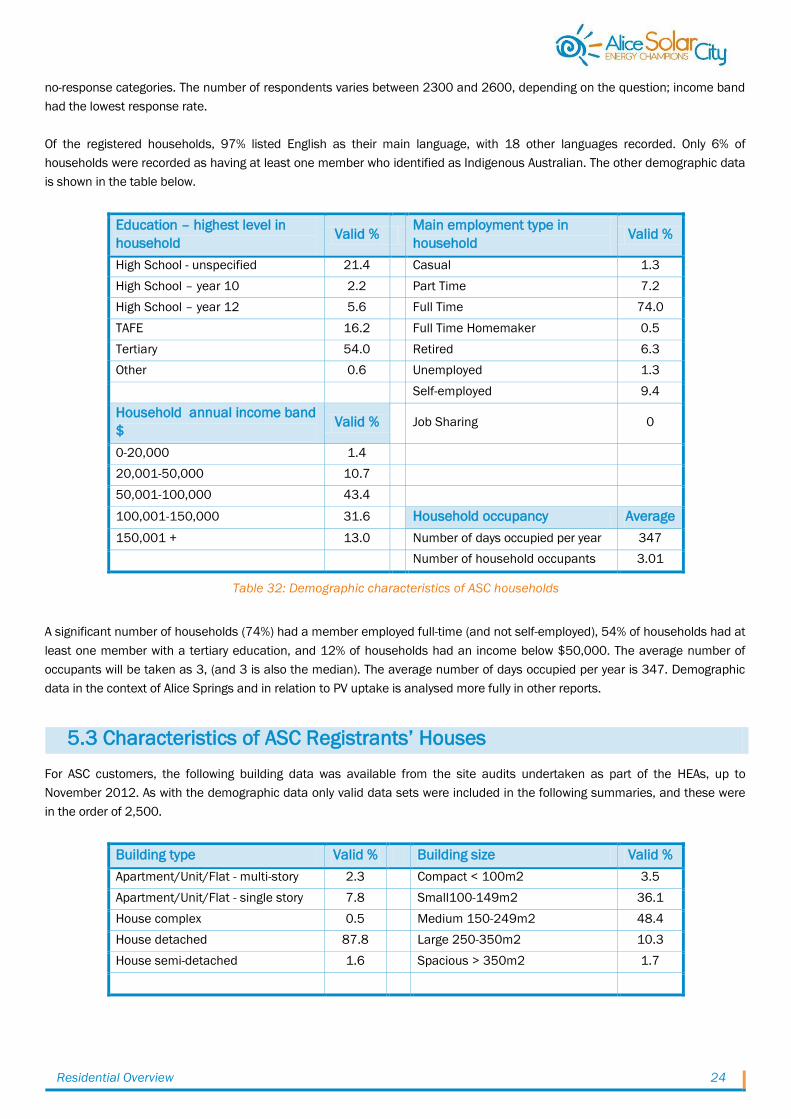
Residential Overview 24
no-response categories. The number of respondents varies between 2300 and 2600, depending on the question; income band
had the lowest response rate.
Of the registered households, 97% listed English as their main language, with 18 other languages recorded. Only 6% of
households were recorded as having at least one member who identified as Indigenous Australian. The other demographic data
is shown in the table below.
Education – highest level in
household Valid %
Main employment type in
household Valid %
High School - unspecified 21.4 Casual 1.3
High School – year 10 2.2 Part Time 7.2
High School – year 12 5.6 Full Time 74.0
TAFE 16.2 Full Time Homemaker 0.5
Tertiary 54.0 Retired 6.3
Other 0.6 Unemployed 1.3
Self-employed 9.4
Household annual income band
$ Valid % Job Sharing 0
0-20,000 1.4
20,001-50,000 10.7
50,001-100,000 43.4
100,001-150,000 31.6 Household occupancy Average
150,001 + 13.0 Number of days occupied per year 347
Number of household occupants 3.01
Table 32: Demographic characteristics of ASC households
A significant number of households (74%) had a member employed full-time (and not self-employed), 54% of households had at
least one member with a tertiary education, and 12% of households had an income below $50,000. The average number of
occupants will be taken as 3, (and 3 is also the median). The average number of days occupied per year is 347. Demographic
data in the context of Alice Springs and in relation to PV uptake is analysed more fully in other reports.
5.3 Characteristics of ASC Registrants‟ Houses
For ASC customers, the following building data was available from the site audits undertaken as part of the HEAs, up to
November 2012. As with the demographic data only valid data sets were included in the following summaries, and these were
in the order of 2,500.
Building type Valid % Building size Valid %
Apartment/Unit/Flat - multi-story 2.3 Compact < 100m2 3.5
Apartment/Unit/Flat - single story 7.8 Small100-149m2 36.1
House complex 0.5 Medium 150-249m2 48.4
House detached 87.8 Large 250-350m2 10.3
House semi-detached 1.6 Spacious > 350m2 1.7

Residential Overview 25
Building age Valid % Floor type Valid %
Pre 1950 1.0 Concrete slab 94.8
1950s 4.3 Mixed 2.3
1960s 8.6 Suspended timber 1.7
1970s 30.0 Other 1.2
1980s 29.3
1990s 18.0
Post 2000 8.7
Roof colour Valid % Ceiling insulation Valid %
Solar reflective white gloss 0.3 Bulk batts 66.7
White 25.9 Loose fill 4.8
Unpainted metal 38.7 Multi-cellular sheet 1.1
Light colour 16.2 Other 11.6
Medium colour 12.8 None 15.9
Dark colour 6.0
Roof material Valid % Wall material Valid %
Metal 97.6 Brick Veneer 15.7
Tiles 1.2 Double Brick 20.6
Mixed 0.2 Concrete Block 43.0
Other 1.0 Stone 0.5
Fibro 2.0
Number of bedrooms Valid % Timber Cladding 1.3
1 1.8 Rammed Earth 0.6
2 11.3 Mixture 3.9
3 57.0 Other 12.3
4 26.4 Concrete Slab 0.2
5 2.8
6 0.7
Table 33: Physical characteristics of ASC houses
The characteristics of a „typical‟ ASC customer house, based on data collected at HEAs, are considered to be:
Small -medium size, 3 bedrooms, single story, detached
Built in the 70s-80s
Concrete slab floor
Masonry walls
Metal roof – unpainted or painted in light/white colour
80% probability of ceiling insulation

Residential Overview 26
Figure 2: A common house style in Alice Springs
The ABS statistics for the Alice Springs LGA indicate that 64% of occupied dwellings are detached houses, which are thus over-
represented in the ASC registrants (88%) and semi-detached houses are under-represented. The ABS statistics also indicate
that 43% of occupied dwellings have 3 bedrooms, compared to 57% of ASC households. This difference would be linked with
the higher proportion of detached houses and owner–occupiers in the ASC registrants, compared to flats/units and tenants.
5.4 Appliance Characteristics
Part of the data collected by ASC was comprehensive appliance data in the home. Of the 2856 registrations 91% (2525)
registrations had appliance data recorded. A total of 91,288 appliances were recorded with a range of 1-109 appliances
and a mean of 36. Key appliance findings are recorded below.
5.4.1 Space cooling
Space cooling appliances are common amongst Alice Springs households. 20% (17,900) of the household appliances
recorded were associated with space cooling, and most houses had at least one air conditioning unit.
96% (2484) of all registered households had at least one air conditioner
78% (2022) of all registered households had a ducted evaporative cooler, while less than 6% (143) had ducted
reverse cycle air conditioning
48% (1252) of houses had at least one split system reverse cycle air conditioner. Of those households with a split
system, the average number was 2.4 units per household. 74% (924) of these houses also had ducted
evaporative cooling
79% of households had between 1 and 11 ceiling fans, with an average of 4 per each of these households.
5.4.2 Space heating
Space heating appliances were less frequently encountered in registered households than were cooling devices. Reverse
cycle split systems and ducted systems provide both heating and cooling and these are the most common form of
heating appliance among ASC registered households. Households with reverse cycle air conditioning were less likely to
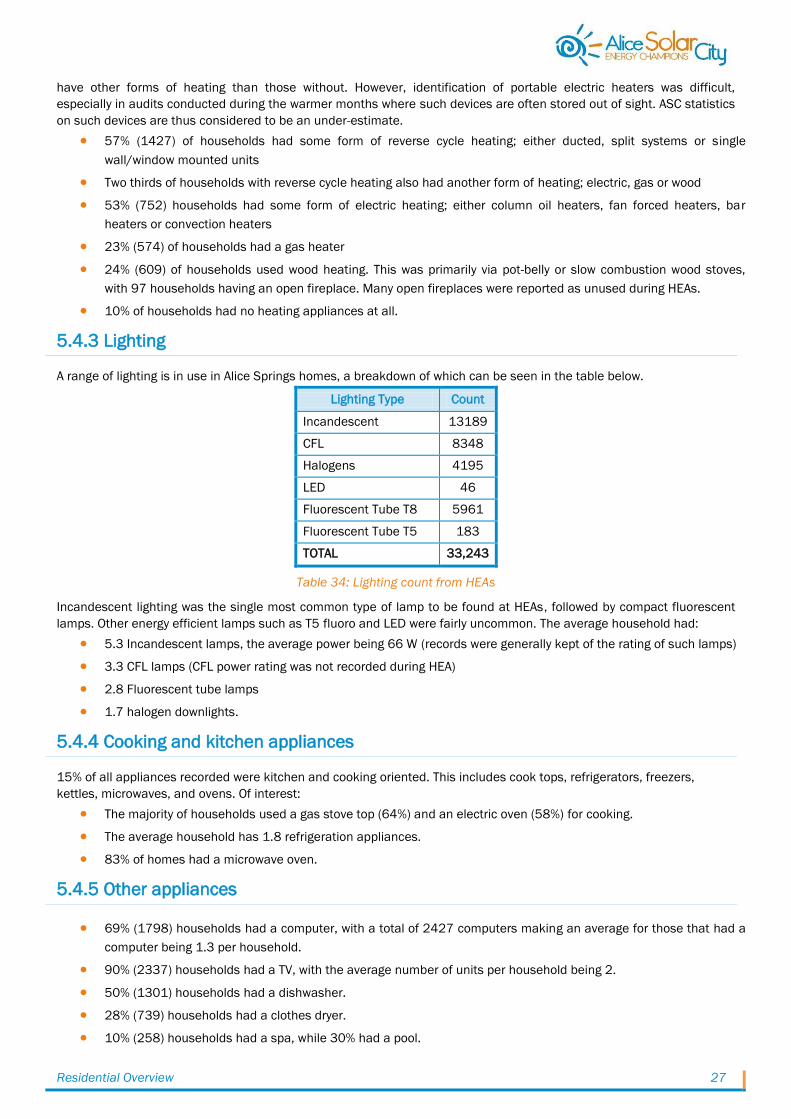
Residential Overview 27
have other forms of heating than those without. However, identification of portable electric heaters was difficult,
especially in audits conducted during the warmer months where such devices are often stored out of sight. ASC statistics
on such devices are thus considered to be an under-estimate.
57% (1427) of households had some form of reverse cycle heating; either ducted, split systems or single
wall/window mounted units
Two thirds of households with reverse cycle heating also had another form of heating; electric, gas or wood
53% (752) households had some form of electric heating; either column oil heaters, fan forced heaters, bar
heaters or convection heaters
23% (574) of households had a gas heater
24% (609) of households used wood heating. This was primarily via pot-belly or slow combustion wood stoves,
with 97 households having an open fireplace. Many open fireplaces were reported as unused during HEAs.
10% of households had no heating appliances at all.
5.4.3 Lighting
A range of lighting is in use in Alice Springs homes, a breakdown of which can be seen in the table below.
Lighting Type Count
Incandescent 13189
CFL 8348
Halogens 4195
LED 46
Fluorescent Tube T8 5961
Fluorescent Tube T5 183
TOTAL 33,243
Table 34: Lighting count from HEAs
Incandescent lighting was the single most common type of lamp to be found at HEAs, followed by compact fluorescent
lamps. Other energy efficient lamps such as T5 fluoro and LED were fairly uncommon. The average household had:
5.3 Incandescent lamps, the average power being 66 W (records were generally kept of the rating of such lamps)
3.3 CFL lamps (CFL power rating was not recorded during HEA)
2.8 Fluorescent tube lamps
1.7 halogen downlights.
5.4.4 Cooking and kitchen appliances
15% of all appliances recorded were kitchen and cooking oriented. This includes cook tops, refrigerators, freezers,
kettles, microwaves, and ovens. Of interest:
The majority of households used a gas stove top (64%) and an electric oven (58%) for cooking.
The average household has 1.8 refrigeration appliances.
83% of homes had a microwave oven.
5.4.5 Other appliances
69% (1798) households had a computer, with a total of 2427 computers making an average for those that had a
computer being 1.3 per household.
90% (2337) households had a TV, with the average number of units per household being 2.
50% (1301) households had a dishwasher.
28% (739) households had a clothes dryer.
10% (258) households had a spa, while 30% had a pool.

Residential Overview 28
6. ASC Home Energy Audits
6.1 HEAs and Reporting
An overview of the registration, HEA, and ASC processes, together with relevant forms and reports (in appendices) is provided in
section 1.2. ASC used the phrase Home Energy Survey for what is termed a HEA in this and other reports. HEA was the
description used in the overall Australian Government Solar Cities program. Discussion with the resident(s) was a key aspect of
the HEA which took approximately 90 minutes and was scheduled during working hours (9am-5pm). Using prior EC data (if
available), site audit, observation, and dialogue, the auditor reviewed household EC and self-reported electricity-use behaviour,
and provided the householder with customised electricity-use advice, and a personalised HEA report. The report included
recommendations for the implementation of EEMs (which may have been incentivised, non-incentivised, or behavioural). Site
audit and household demographic data were collected at the time of the HEA. HEAs did not always follow strict procedural
guidelines – the process was often a negotiation between the auditor and the householder, and the approach used very much
depended on the householders‟ attitudes and expected outcomes from the audit. However some key elements were consistent.
An HEA began with a summary overview of the customers‟ household EC: the annual variation, comparison to regional averages
and discussion around the variety and level of electricity services in the household. Following this, a walk-through of the property
was conducted, during which the auditor engaged the customer in conversation around larger systems and appliances such as
water heating, space cooling and heating, as well as the building envelope and how the customer perceives their home to
„behave‟ over the seasons. The auditor drew attention to areas of energy wastage based on the appliance use and property
features witnessed during the walk-through. Sensory demonstrations were conducted if appropriate, such as encouraging the
customer to feel walls getting hot during summer or draughts coming through gaps in a door frame during winter.
Measurements were taken such as the operational temperature of the refrigerator using a laser thermometer or the power
consumption of selected appliances using a PowerMate electricity monitor in order to calculate the annual running cost. After
the walk-through, the auditor and customer generally sat down together while the auditor entered basic audit and residential
demographic data and a list of recommended EEMs (EEMs) into the customer database, and subsequently printed a report for
the customer. During this time, the customer and auditor were able to discuss the recommendations based on their suitability
for the household and the customer‟s budget, and any other questions or concerns the customer had about energy use. Along
with the report, the customer was given relevant information sheets, details on how to proceed with using incentive vouchers
(where applicable), and a feedback survey for them to complete and return to ASC. Good rapport and a respectful relationship
between the auditor and customer was an essential part of the HEA.
Figure 3: A Home Energy Audit in process

Residential Overview 29
The HEA reporting structure is shown below:
4. HEAs
(HEAs) HEA Sub-Category:
1. Number of HEAs completed compared to number of
households registered
2. Reasons why households chose not to go ahead with HEAs
3. Average reductions in EC achieved
4. Lessons learnt in staffing, technology, community engagement
and data capture
Table 35: HEA reporting structure
In addition to the information in section 2 of this report there is other relevant background information that is important in the
preparation and interpretation of data:
In any given short-medium term reporting period (up to 6 months) there was not a direct 1:1 relationship between
the number of registrations and the number of HEAs, since (a) there were some HEA cancellations and rescheduling,
and (b) there was a time lag of at least two weeks (and possibly up to 8 weeks) from registration to HEA. There were
two reasons for this lag:
o Prior to the HEA, ASC required each customer‟s previous year‟s EC data (obtained from PWC if available) to
be loaded into the database – this could take at least 7-10 days from registration;
o as an HEA took about 90 minutes, the usual work load for an auditor was 12-16 audits per week.
Registrations/bookings often exceeded this rate (i.e. HEA bookings accumulated faster than they could be
carried out by available auditors) so HEAs were often scheduled several weeks after sign up. This occurred
during very busy periods.
The foundation data, used to establish the number of HEAs completed, are from those records in the ASC database
that have a date in the audit date field for a HEA. However there are some necessary adjustments to this data as
explained below.
Only one audit was conducted for landlord owned properties that were occupied by a tenant, although there were two
registrations for such a property, with the audit date recorded against each. There was a small number of landlord
properties for which no tenant had signed with ASC, and for which a HEA was conducted. Tenants could register and
have a HEA without their landlord signing up with ASC. These factors influence the number of actual properties (in
contrast to registrations) eligible for a HEA.
6.2 ASC Targets for HEAs
The initial project targets for residential HEAs and households that used EEV(s) were revised in mid- 2009 based on project
progress at that time. These are shown below, overall and by financial year, together with actual numbers.
Initial Target Revised Target Actual
Number of residential HEAs 1500 2250 2515
Number of households using EEVs 850 1750 1253
Table 36: HEA and EEV targets
2007-08 2008-09 2009-10 2010-11 2011-12 2012-13 Total
Target - Residential HEAs 150 450 800 400 300 150 2250
Actual 207 560 888 383 315 162 2515
Table 37: Targets and actual numbers for HEAs
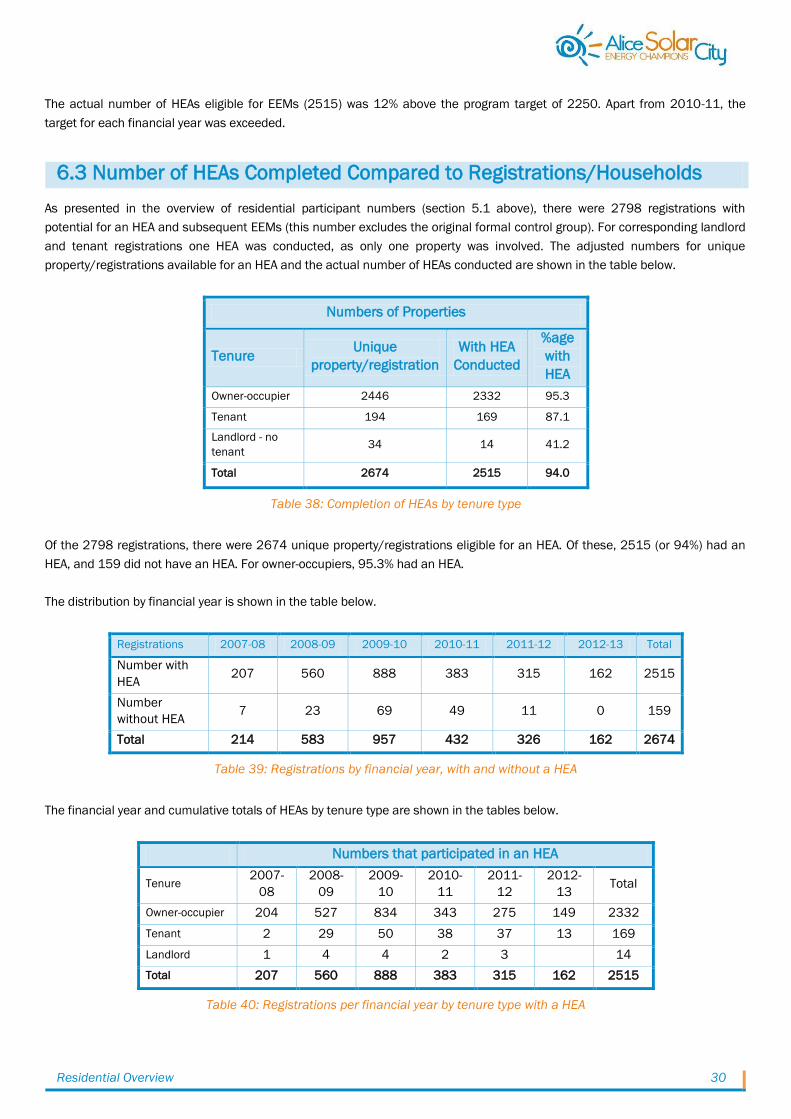
Residential Overview 30
The actual number of HEAs eligible for EEMs (2515) was 12% above the program target of 2250. Apart from 2010-11, the
target for each financial year was exceeded.
6.3 Number of HEAs Completed Compared to Registrations/Households
As presented in the overview of residential participant numbers (section 5.1 above), there were 2798 registrations with
potential for an HEA and subsequent EEMs (this number excludes the original formal control group). For corresponding landlord
and tenant registrations one HEA was conducted, as only one property was involved. The adjusted numbers for unique
property/registrations available for an HEA and the actual number of HEAs conducted are shown in the table below.
Numbers of Properties
Tenure Unique
property/registration
With HEA
Conducted
%age
with
HEA
Owner-occupier 2446 2332 95.3
Tenant 194 169 87.1
Landlord - no
tenant 34 14 41.2
Total 2674 2515 94.0
Table 38: Completion of HEAs by tenure type
Of the 2798 registrations, there were 2674 unique property/registrations eligible for an HEA. Of these, 2515 (or 94%) had an
HEA, and 159 did not have an HEA. For owner-occupiers, 95.3% had an HEA.
The distribution by financial year is shown in the table below.
Registrations 2007-08 2008-09 2009-10 2010-11 2011-12 2012-13 Total
Number with
HEA 207 560 888 383 315 162 2515
Number
without HEA 7 23 69 49 11 0 159
Total 214 583 957 432 326 162 2674
Table 39: Registrations by financial year, with and without a HEA
The financial year and cumulative totals of HEAs by tenure type are shown in the tables below.
Numbers that participated in an HEA
Tenure 2007-
08
2008-
09
2009-
10
2010-
11
2011-
12
2012-
13 Total
Owner-occupier 204 527 834 343 275 149 2332
Tenant 2 29 50 38 37 13 169
Landlord 1 4 4 2 3 14
Total 207 560 888 383 315 162 2515
Table 40: Registrations per financial year by tenure type with a HEA

Residential Overview 31
Tenure
Numbers that did not have an HEA
2007-
08
2008-
09
2009-
10
2010-
11
2011-
12
2012-
13 Total
Owner-
occupier 5 16 59 27 7 114
Tenant 2 6 8 8 1 25
Landlord 1 2 14 3 20
Total 7 23 69 49 11 159
Table 41: Registrations per financial year by tenure type without a HEA
6.4 Reasons Why Households Chose Not to Proceed with HEAs
An HEA was a prerequisite for customers to claim any of the financial incentives available through ASC. As part of the sign-up
process, a day/time was scheduled for the HEA between 9am-3.30pm weekdays, and customers were generally phoned to
confirm availability either the day before the audit, or in the early part of the morning of the audit day. If the customer was not at
home when the auditor arrived as planned (a no-show), the customer was contacted again and attempts made to reschedule
the audit. In a small number of cases, the audit was not conducted. As 95% of owner-occupiers had an HEA, there was not a
strong need to establish why households did not have an HEA. Nevertheless phone follow-up was undertaken, and where
contact could be made and reasons ascertained, such reasons were usually of a practical nature and not related any perceived
issues with the ASC program. The main reasons were as follows:
Householders moved house:
o moved house in Alice Springs - may or may not have sold house
o sold house and moved interstate
Householders left Alice Springs for an extended time period (but still owned house):
o work regularly took them away from Alice Springs
o transferred to another work location in the NT
o taken extended holiday
Weekday times turned out not to suit householder:
o very busy at work and have not made time for the audit
o no scope to take 1-2 hours away from work
Said they would contact ASC to reschedule, but didn‟t:
o didn‟t get around to it
o financial limitations to do any recommended actions
Hurdles discovered after sign-up :
o issues with body corporate would make it difficult to implement some EEMs
o read the detail of the terms and conditions and was wary of them
For landlords with tenants, the major problem was organizing a time with the tenant - and with the landlord, who did not have to
be present, but it was encouraged. In many cases the sign-ups were initiated by the landlord and there may not have been any
incentive for the tenant to make time for the HEA. In some cases an interested tenant moved out before a scheduled HEA and
the premise was not re-let immediately, or the next tenant was not interested in an HEA and not prepared to give access or time.
Similarly, where registrations were tenant only, moving out or limited sustained levels of motivation were the main reasons for
not completing an HEA.
6.5 Average Reductions in Electricity Consumption Achieved
The ADC calculator was run for 12 month periods before and after the HEA dates. The resulting data was filtered initially on the
number of days in the period before the HEA; all cases with 365 or 366 days were included. For the three annual after-HEA
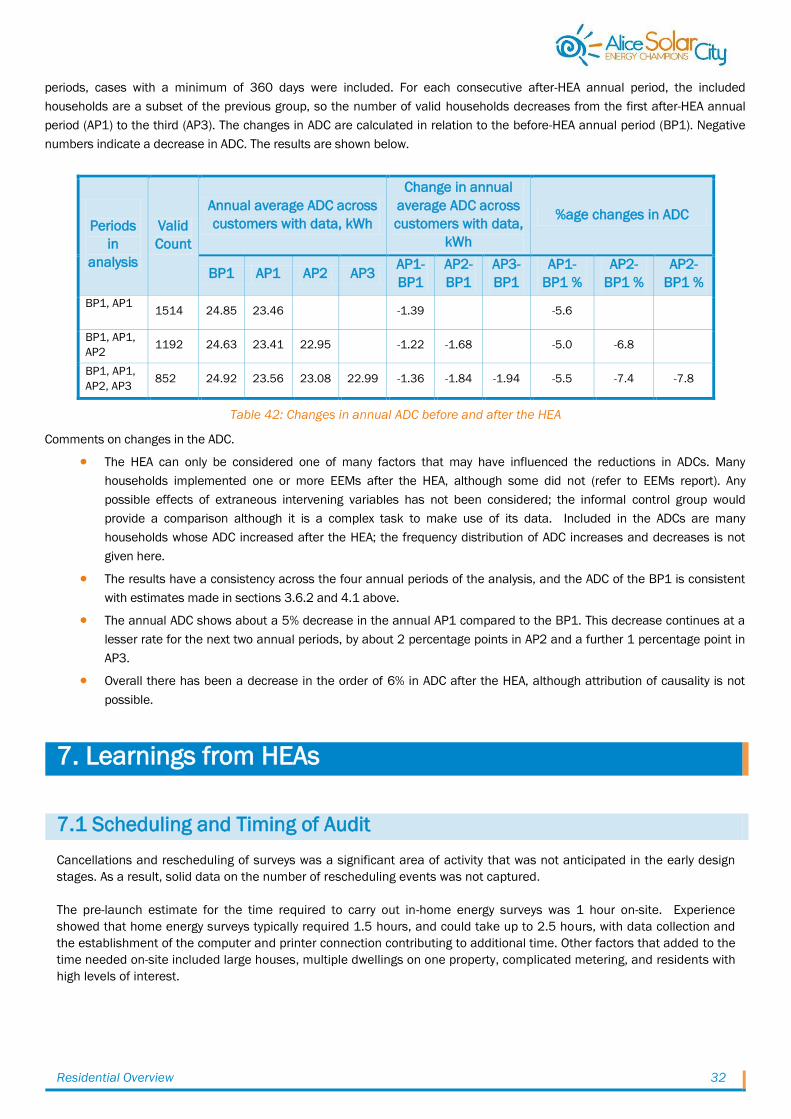
Residential Overview 32
periods, cases with a minimum of 360 days were included. For each consecutive after-HEA annual period, the included
households are a subset of the previous group, so the number of valid households decreases from the first after-HEA annual
period (AP1) to the third (AP3). The changes in ADC are calculated in relation to the before-HEA annual period (BP1). Negative
numbers indicate a decrease in ADC. The results are shown below.
Periods
in
analysis
Valid
Count
Annual average ADC across
customers with data, kWh
Change in annual
average ADC across
customers with data,
kWh
%age changes in ADC
BP1 AP1 AP2 AP3 AP1-
BP1
AP2-
BP1
AP3-
BP1
AP1-
BP1 %
AP2-
BP1 %
AP2-
BP1 %
BP1, AP1
1514 24.85 23.46 -1.39 -5.6
BP1, AP1,
AP2 1192 24.63 23.41 22.95 -1.22 -1.68 -5.0 -6.8
BP1, AP1,
AP2, AP3 852 24.92 23.56 23.08 22.99 -1.36 -1.84 -1.94 -5.5 -7.4 -7.8
Table 42: Changes in annual ADC before and after the HEA
Comments on changes in the ADC.
The HEA can only be considered one of many factors that may have influenced the reductions in ADCs. Many
households implemented one or more EEMs after the HEA, although some did not (refer to EEMs report). Any
possible effects of extraneous intervening variables has not been considered; the informal control group would
provide a comparison although it is a complex task to make use of its data. Included in the ADCs are many
households whose ADC increased after the HEA; the frequency distribution of ADC increases and decreases is not
given here.
The results have a consistency across the four annual periods of the analysis, and the ADC of the BP1 is consistent
with estimates made in sections 3.6.2 and 4.1 above.
The annual ADC shows about a 5% decrease in the annual AP1 compared to the BP1. This decrease continues at a
lesser rate for the next two annual periods, by about 2 percentage points in AP2 and a further 1 percentage point in
AP3.
Overall there has been a decrease in the order of 6% in ADC after the HEA, although attribution of causality is not
possible.
7. Learnings from HEAs
7.1 Scheduling and Timing of Audit
Cancellations and rescheduling of surveys was a significant area of activity that was not anticipated in the early design
stages. As a result, solid data on the number of rescheduling events was not captured.
The pre-launch estimate for the time required to carry out in-home energy surveys was 1 hour on-site. Experience
showed that home energy surveys typically required 1.5 hours, and could take up to 2.5 hours, with data collection and
the establishment of the computer and printer connection contributing to additional time. Other factors that added to the
time needed on-site included large houses, multiple dwellings on one property, complicated metering, and residents with
high levels of interest.

Residential Overview 33
7.2 Audit Data Capture and Technology
Alice Solar City chose to use a paper-based method of collecting audit data, which was sensible in the context of the level
of detail required by the program funder, the technology available at the time and the costs of developing an electronic
method that linked with the database. With a streamlined data capture process and modern tablet computers this
equation could be quite different.
Alice Solar City‟s home energy audit report was generated from its online database during the audit and good mobile
internet access was required. Surveys conducted during times of network congestion and in homes in mobile coverage
„dead spots‟ meant that at times internet access was not available or unresponsive, adding time and frustration to the
survey process. An offline approach would have reduced time with the customer, though potentially added back-office
complexity.
7.3 Customer Engagement and Behaviour Change
Customer expectations and commitment to the HEA varied widely. The majority of customers displayed an interest in the
process and interacted with the auditor. However there were customers seeking only one incentive who were reluctant
and unresponsive participants in the HEA. In some cases the resident at home for the survey was not the person that
had registered, and could not present a complete picture of the home‟s energy behaviours and priorities.
Electricity consumption changes are a reflection of a range of events and changes in households, some positive
(installation of efficient appliances), some benign (teenagers leaving home, or additional occupants) and others
traumatic (family breakup or a death in the household). Contacting a customer to discuss the possible causes of
decreases or increases in electricity consumption needs to be handled with tact i.e. “have there been any major changes
in the household over the past year that may have caused a drop in your consumption?”
The design of the Alice Solar City energy audit was focused on information flow and advice, with no retrofits offered as
part of the process. Some customers, particularly seniors, identified a lack of service providers for small jobs identified
during the audit such as weatherizing for winter, covering evaporative air conditioners, and changing light globes. These
services could have been performed on the spot during the audit and provided additional value.
7.4 Energy Consumption Data
Historical consumption data for customers was obtained directly from Power and Water as part of the registration
process. Ensuring that this data was available at the audit required a minimum of seven days between registration and
booking the audit. While the audit process was streamlined by having the historical data already uploaded and
processed, this had its limitations, for example sometimes only partial data would be supplied for customers with
multiple or complex metering, meaning that the survey started with an underestimate of annual consumption. There was
no or limited historical data for customers who registered soon after moving into a new home.
Very limited processes were put in place by Alice Solar City to capture information in regards to other energy sources,
including natural gas, LPG and firewood. While not central to the electricity orientation of Solar Cities, this information
was an important piece of the energy costs puzzle for many households.

Residential Overview 34
8. Residential Overview Appendices
The appendices, with a title page for each, are in the following un-numbered pages

Residential Overview
Appendices

Residential Overview Appendices 1
Table of ContentsTable of ContentsTable of ContentsTable of Contents
Appendix 1 ................................................................................................Registration Form
Appendix 2 ........................................................................................... Home Energy Report
Appendix 3 .................................................................................................. Incentive Report
Appendix 4 ........................................................................................ Smart Meter Checklist
Appendix 5 .....................................................................................................Site Audit Data
Appendix 6 ...................................................................................Energy Efficiency Voucher
Appendix 7 ...........................................................................................Portal Entrance Page
Appendix 8 ..................................................................................... Customer Status Report
Appendix 9 .......................................................................... Electricity Consumption Report
Appendix 10 ................................................................................. Smart Meter Data Report
Appendix 11 .....................................................................................PV System Data Report
Appendix 12 .....................................................................................Download Interval Data
Appendix 13 .................................................................................. Voucher Reminder Email
Appendix 14 ................................................................................................EC Update Email
Appendix 15 ..................................................................................FUS/Engagement Report
Appendix 16 .................................................................. Informal Control Group data sheet
Residential Incentive Program Overview
Appendix 1
Registration Form

Tuesday, September 09, 2008 9:00 AM
Customer Details
Name: Jo Blo
Postal Address:
Email:
15 Clarke Street, Alice Springs, NT , 0870
Registration ID:
- 10:10/20:20
- Initiate Cost Reflective Tariffs package
- Install Solahart 302JOTP Electric Boost Solar Hot Water System
- Install ceiling insulation - Batts
- Replace 12V Halogen downlight system with low energy option
- Install BP Energiser 2000 PV system
ASC Customer ID: 1458
Phone:Mobile:
8952 0749
Date signed up:581 08 August 2008PWC Customer ID: 272213 Tenure:Property: Lot 2534,
Selected Incentives (Subject to Home Energy Survey)
Residential Owner-Occupier
Date of Home Energy Survey:
15 Clarke Street, Araluen , NT, 0870
Registration Details
At this property: 01 June 2007
PersonCustomer Type:
PV Installer: BP
PV inspection date booking: Wednesday, September 17, 2008 12:00 AM
Residential Incentive Program - Registration Form
Customer
SLC
Signed ___________________________
Date_____________________________Name_____________________________
Signed ___________________________ Position___________________________
Date_____________________________Name____________________________
I authorise Power and Water Corporation to release billing data to Alice Solar City from 15 months prior (to signed date) and ongoing for length of the project. I understand that I may be contacted for research purposes by Alice Solar City (or an agent of).I have read and understood the Alice Solar City Customer Terms and accept them as applicable to all transactions between myself and Alice Solar City.

Residential Incentive Program Overview
Appendix 2 Home Energy Report
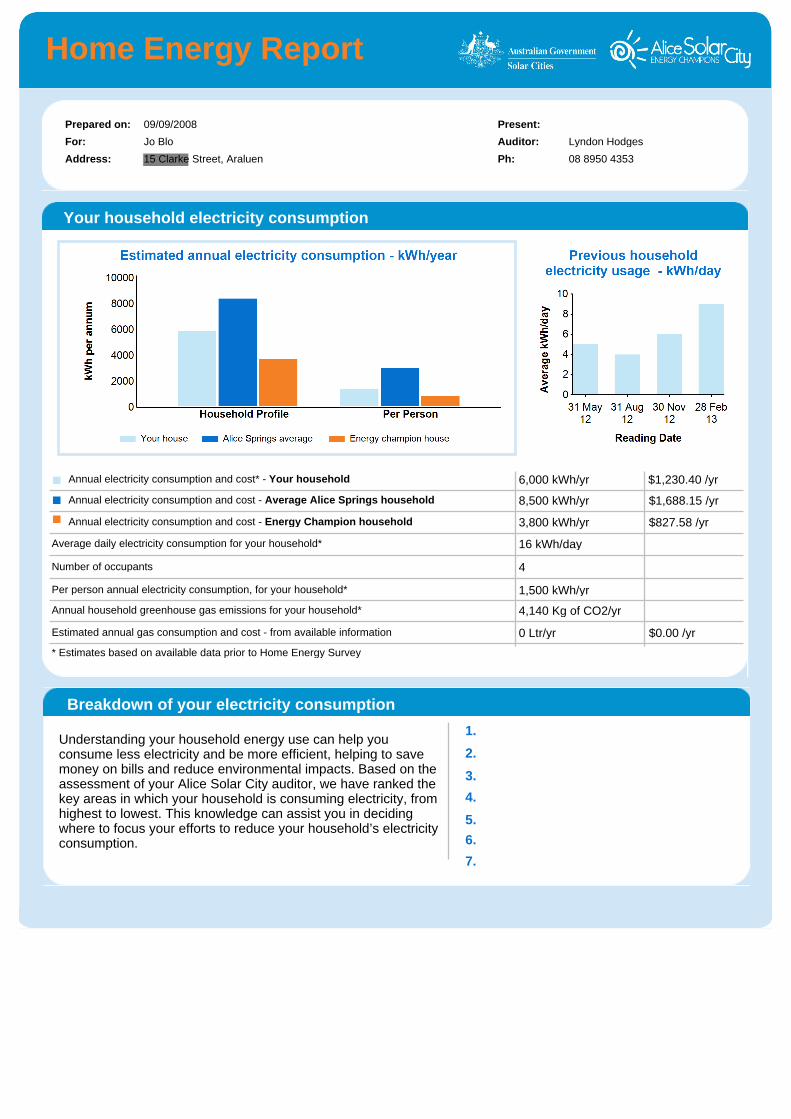
Your household electricity consumption
Average daily electricity consumption for your household*
Annual household greenhouse gas emissions for your household*
Number of occupants
Estimated annual gas consumption and cost - from available information
Annual electricity consumption and cost* - Your household
16 kWh/day
4,140 Kg of CO2/yr
4
1,500 kWh/yr
6,000 kWh/yr $1,230.40 /yr
$0.00 /yr
Per person annual electricity consumption, for your household*
0 Ltr/yr
Annual electricity consumption and cost - Average Alice Springs household 8,500 kWh/yr
Annual electricity consumption and cost - Energy Champion household 3,800 kWh/yr
$1,688.15 /yr
$827.58 /yr
* Estimates based on available data prior to Home Energy Survey
Breakdown of your electricity consumption
1.
2.
6.
5.
4.
3.
7.
Understanding your household energy use can help you consume less electricity and be more efficient, helping to save money on bills and reduce environmental impacts. Based on the assessment of your Alice Solar City auditor, we have ranked the key areas in which your household is consuming electricity, from highest to lowest. This knowledge can assist you in deciding where to focus your efforts to reduce your household’s electricity consumption.
09/09/2008
15 Clarke Street, Araluen
Prepared on:
Jo BloFor:
Address:
Present:
Auditor: Lyndon Hodges
Ph: 08 8950 4353
Home Energy Report

Install ceiling insulation - Batts Space Heating/Cooling
Insulation acts as a heat barrier all year round. In summer it keeps the heat out and winter it keeps the heat in, which can make a huge difference to your heating/cooling power bills.
Initiate Cost Reflective Tariffs package Powering your home/business
Cost Reflective Tariffs encourage you to shift loads to off-peak periods when the cost of generating electricity is lower. NOTE: This tariff should only be considered if electric water heater is replaced with solar water heater, or timer is fitted to limit operation of water to 'off peak' times. Use of air conditioning would need to be limited in 'peak' times.
Install 302JOTP Electric Boost Solar Hot water system Water Heating
Solar Hot Water systems make free hot water from the sun and reduce your energy costs to a fraction of other options. NOTE: If installing solar water heater on north facing roof space to install solar power system will be limited.
Install Energiser 2000 PV system Powering your home/business
A solar photovoltaic (PV) system converts sunlight into electricity. The BP Solar Energiser 2000 will generate up to 3200kWh of electricity per year which is fed directly into the local power grid. Householders will be paid a premium for the power produced by their system - for current rates see our website. A PV system is a sound long term investment for your home - helping you save money now and in the future. Net cost to the householder after Alice Solar City financial incentive is approx. $8,600.
Replace light bulbs with low-energy bulbs Lighting
You can reduce your lighting power load by up to 80% by using low-energy bulbs. Replace the bulbs in your high use areas first.
10:10/20:20 Powering your home/business
Reduce your electricity use by 10% or more compared to the same period of the previous year and you could receive a further 10% discount. Reduce it by 20% or more and receive a 20% discount. Bring in your bill to the SLC to apply.
After your energy survey, and discussions with the auditor, the recommended actions are listed below in priority order.
For further information or discussion please contact Alice Solar City - phone: 08 89504350; email: [email protected]; www: http://www.alicesolarcity.com.au
You can access your customer portal and view data at: https://www.prowessdevelopment.com.au/ASC_Portal
Proposed Actions

Residential Incentive Program Overview
Appendix 3 Incentive Report

Name: Jo Blo
Postal Address:
Email:
15 Clarke Street, Alice Springs, NT , 0870
Registration ID:
ASC Customer ID: 1458
Phone:Mobile:
8952 0749
Date signed up:
581
08 August 2008
PWC Customer ID: 272213Property: Lot 2534,
Residential Owner-Occupier
15 Clarke Street, Araluen , NT 0870
Tenure:
- Initiate Cost Reflective Tariffs package
Customer Details
Incentive Actions
Registration Details
B/H: A/H:8951 6470
Residential Incentive Program - Incentive Report
I have read and understood the Alice Solar City Customer Terms and accept them as applicable to all transactions between myself and Alice Solar City.
Customer
SLC
Signed __________________ Name____________________ Position_______________
Signed __________________ Name____________________ Date________________

Residential Incentive Program Overview
Appendix 4 Smart Meter Checklist
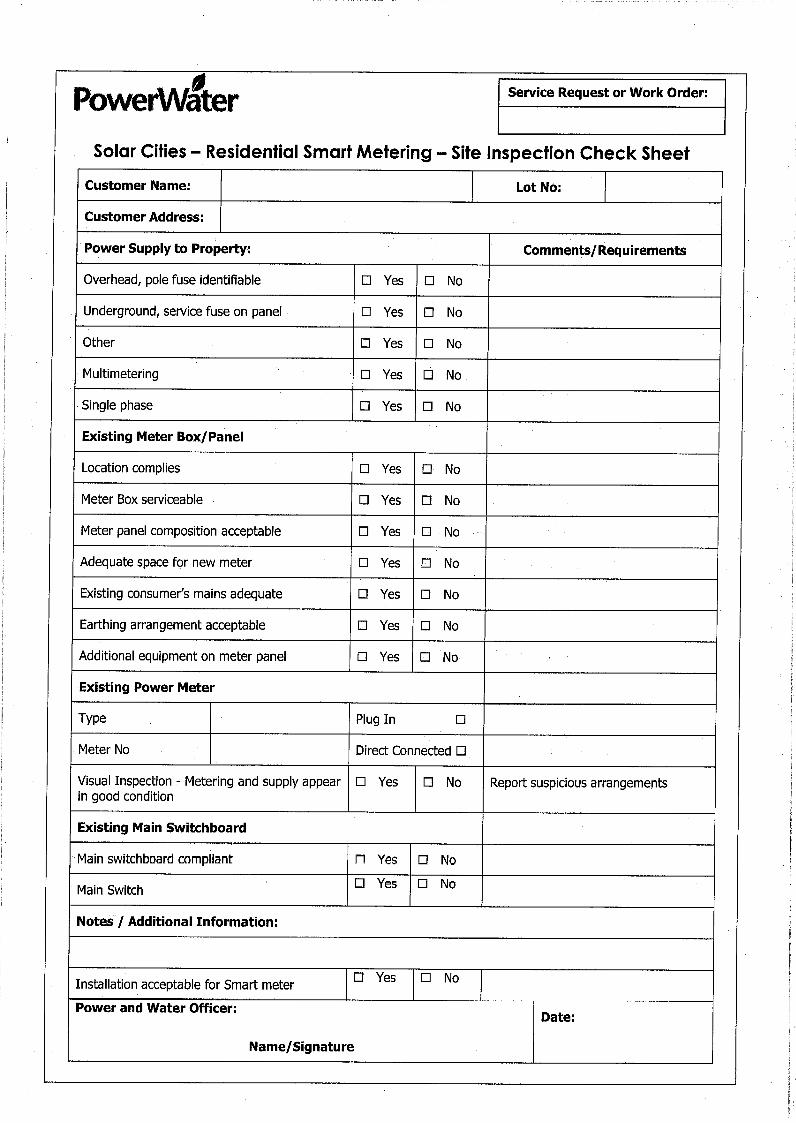


Residential Incentive Program Overview
Appendix 5 Site Audit Data

EEM's at Registration ______________ Extra EEM's on site ______ _________________ Last meter reading ___________ date: ________
______________ _________________ _________________
______________ _________________ _________________ Date Days Usage
HOME ENERGY SURVEY DATA COLLECTION FORM PWC Data: ______ ____ ________________
Residents: Name: ____________________________________________________ Date : _____________ ______
Address: __________________________________________________ Time: ______________ ______
Phone: ___________________________________________________ ______
At property since: ____________ Annual:
General: House type: House detatched House semi-detatched Aprt/Unit/Flat - single story Aprt/Unit/Flat - multi-story
House size: Compact - <100m2 Small - 100-149m2 Medium - 149-249m2 Large - 250-350m2 Spacious - >350m2
Profile: � 1 Storey � 2 Storey Age of house (if known) Ex-government housing: � Yes � No
Walls: � Brick Veneer � Double Brick � Concrete Brick � Concrete Block � Fibro/Masonite � Timber � Composite � Other:
Roofing:
Insulation: � Bulk Batts � Loose Fill � RFL � Other: � none � Unknown/ Not Accessible
Floor type: � Slab � Susp slab � Timber � Other: Notes:
Shading: East face: P � Yes � No North face: P � Yes � No West face: P � Yes � No South face: P � Yes � No
Rooms: Bedrooms _____ Bathrooms_____ Living Rooms _____ Gas: � Reticulated gas � Bottled gas � No connection
Ext. lights: ___ Par 38 ____watts ___ CFLs ____watts ___ T8 Flouro ____watts ___ Incandescent ____watts � Other:
Hot water: � Electric _____ litres � Gas - Instant ________litres/min. � Gas - storage ________ litres � Other:
� Solar/Electric boost __________ litres
Solar PV: kW Supplier Inverter Install date
Ducted A/C � Evaporative � Refrigerative � Refrigerative - 3Phase Notes:
Comments:
� Metal � Tile � Other: � Unpainted Colour: Notes:
____ ________________
____ ________________
____ ________________
____________________
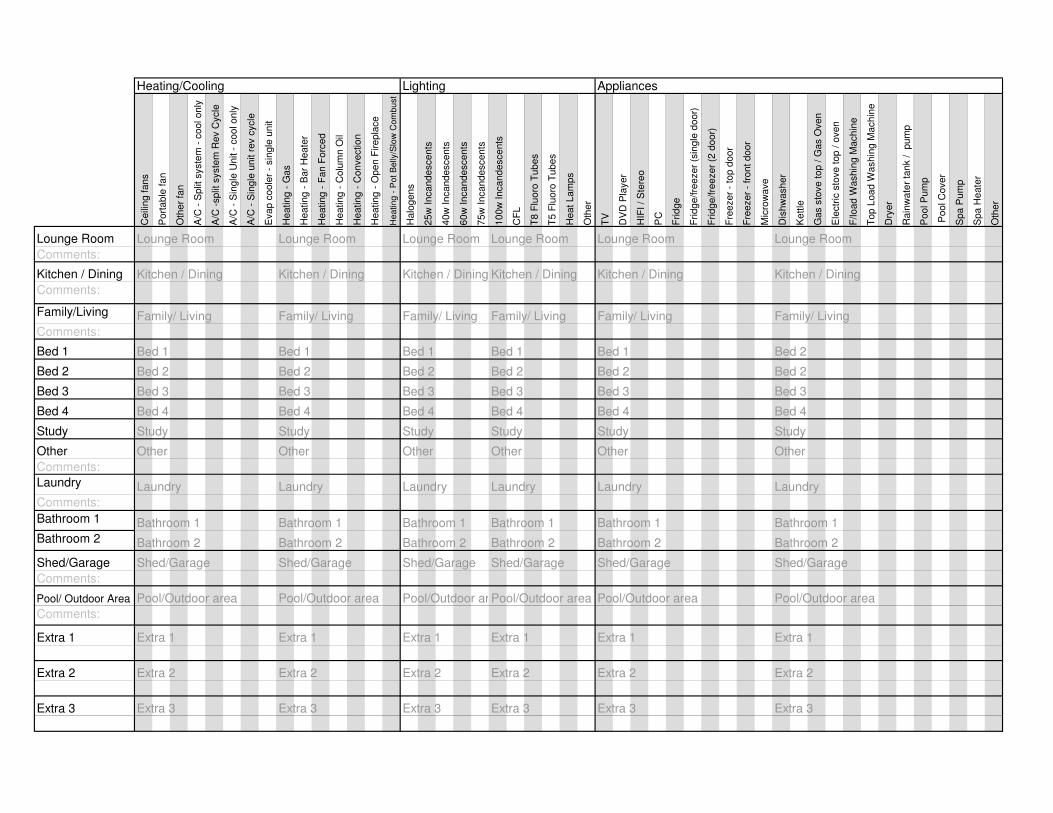
Ce
ilin
g f
an
s
Po
rta
ble
fa
n
Oth
er
fan
A/C
- S
plit
syste
m -
co
ol o
nly
A/C
-sp
lit s
yste
m R
ev C
ycle
A/C
- S
ing
le U
nit -
co
ol o
nly
A/C
- S
ing
le u
nit r
ev c
ycle
Eva
p c
oo
ler
- sin
gle
un
it
He
atin
g -
Ga
s
He
atin
g -
Ba
r H
ea
ter
He
atin
g -
Fa
n F
orc
ed
He
atin
g -
Co
lum
n O
il
He
atin
g -
Co
nve
ctio
n
He
atin
g -
Op
en
Fir
ep
lace
Heating -
Pot B
elly
/Slo
w C
om
bust
Ha
log
en
s
25
w I
nca
nd
esce
nts
40
w I
nca
nd
esce
nts
60
w I
nca
nd
esce
nts
75
w I
nca
nd
esce
nts
10
0w
In
ca
nd
esce
nts
CF
L
T8
Flu
oro
Tu
be
s
T5
Flu
oro
Tu
be
s
He
at
La
mp
s
Oth
er
TV
DV
D P
laye
r
HIF
I /
Ste
reo
PC
Fri
dg
e
Fri
dg
e/f
ree
ze
r (s
ing
le d
oo
r)
Fri
dg
e/f
ree
ze
r (2
do
or)
Fre
eze
r -
top
do
or
Fre
eze
r -
fro
nt
do
or
Mic
row
ave
Dis
hw
ash
er
Ke
ttle
Ga
s s
tove
to
p /
Ga
s O
ve
n
Ele
ctr
ic s
tove
to
p /
ove
n
F/lo
ad
Wa
sh
ing
Ma
ch
ine
To
p L
oa
d W
ash
ing
Ma
ch
ine
Dry
er
Ra
inw
ate
r ta
nk /
p
um
p
Po
ol P
um
p
Po
ol C
ove
r
Sp
a P
um
p
Sp
a H
ea
ter
Oth
er
Lounge Room Lounge Room Lounge Room Lounge Room Lounge Room Lounge Room Lounge Room
Comments:
Kitchen / Dining Kitchen / Dining Kitchen / Dining Kitchen / Dining Kitchen / Dining Kitchen / Dining Kitchen / Dining
Comments:
Family/Living Family/ Living Family/ Living Family/ Living Family/ Living Family/ Living Family/ Living
Comments:
Bed 1 Bed 1 Bed 1 Bed 1 Bed 1 Bed 1 Bed 2
Bed 2 Bed 2 Bed 2 Bed 2 Bed 2 Bed 2 Bed 2
Bed 3 Bed 3 Bed 3 Bed 3 Bed 3 Bed 3 Bed 3
Bed 4 Bed 4 Bed 4 Bed 4 Bed 4 Bed 4 Bed 4
Study Study Study Study Study Study Study
Other Other Other Other Other Other Other
Comments:
Laundry Laundry Laundry Laundry Laundry Laundry Laundry
Comments:
Bathroom 1 Bathroom 1 Bathroom 1 Bathroom 1 Bathroom 1 Bathroom 1 Bathroom 1
Bathroom 2 Bathroom 2 Bathroom 2 Bathroom 2 Bathroom 2 Bathroom 2 Bathroom 2
Shed/Garage Shed/Garage Shed/Garage Shed/Garage Shed/Garage Shed/Garage Shed/Garage
Comments:
Pool/ Outdoor Area Pool/Outdoor area Pool/Outdoor area Pool/Outdoor areaPool/Outdoor area Pool/Outdoor area Pool/Outdoor area
Comments:
Extra 1 Extra 1 Extra 1 Extra 1 Extra 1 Extra 1 Extra 1
Extra 2 Extra 2 Extra 2 Extra 2 Extra 2 Extra 2 Extra 2
Extra 3 Extra 3 Extra 3 Extra 3 Extra 3 Extra 3 Extra 3
AppliancesHeating/Cooling Lighting

Residential Incentive Program Overview
Appendix 6 Energy Efficiency Voucher

ASC Cost Code: 9095.25.270
Jo BloCustomer Name:
Property: Lot 2534, 15 Clarke Street, Araluen , NT 0870
Measure: Install Edson Evacuated Tube Solar Hot Water system 315 GLES (30 tubes)
1458Cust ID:
Reg ID: 581
Voucher Conditions: Solar hot water system must include “one-shot” booster switch (installed internally) for voucher to be valid. All work must be carried out by a Registered Supplier who is a Licensed Plumber & Drainer.
35% of invoiced costs for specified Measure (GST Inclusive) up to a maximum incentive value of $2000Voucher Value:
Date Issued:
Authorised by:
11 June 2013 Date expires: 11 August 2013
Position:
99879Voucher ID:

Residential Incentive Program Overview
Appendix 7 Portal Entrance Page


Residential Incentive Program Overview
Appendix 8 Customer Status Report

Cancelled VouchersThe following vouchers have expired and have now been cancelled within our database:
Incentive Name Date Issued Date Cancelled
Install ceiling insulation - Batts 29/09/2008 25/06/2009
Replace light bulbs with low-energy bulbs 29/09/2008 25/06/2009
These cancelled measures, if implemented, may contribute to reducing your household electricity consumption.
If you wish to update your contact details, please follow this link and do so via the 'contact us' page
Customer & Property Details
Customer Details
Name:
Home Phone:
Mobile Phone:
Business Phone:
ASC Customer ID:
Organisation:
Email:
Blo Jo
8952 0749
8951 6470 Postal Address:
1458
25 Clarke Street, Alice Springs, NT 0870
Property Details
Tenure:
Lot Number:
Street Address:
Registration ID: 581 At Property since:
Date Registered:25 Clarke Street
2529 Date of HES:
Date Terminated:Residential Owner-Occupier
08/08/2008
01/06/2007
09/09/2008
Incentive Vouchers
If your current power bill shows you have used 10-20% less electricity compared with the same period of the previous year, you can receive a further 10% discount on the cost of the current bill. If you reduce your electricity consumption by 20% or more, you can receive a discount of 20%. See the Alice Solar City website for more information.
Alice Solar City has not recorded any 10:10/20:20 claims to date
10:10/20:20 Claims
Here are our records of the Alice Solar City vouchers you have used and/or remain open. Vouchers highlighted in blue are currently active. Alice Solar City has not yet received an invoice.
Used and Active Vouchers
Incentive Name Date Issued Date Invoiced Eligible Invoice Total Incentive Amount
Install 302JOTP Electric Boost Solar Hot water system 29/09/2008 18/09/2009 $5995.00 $2000.00
Install Energiser 2000 PV system 18/08/2009 15/01/2010 $22642.95 $7126.97
Total $28637.95 $9126.97
Print Date: 21/06/2013 03:36PM
Customer Status Report

Note: If you have implemented any of the actions above, please contact us to let us know.
Future ActionsHere are the other actions identified during or after your home energy survey (HES) that could improve your energy champion status by lowering your household electricity consumption. To find out how your electricity use is progressing, refer to your electricity consumption report (in your ASC portal).
No future actions to display
Print Date: 21/06/2013 03:36PM
Customer Status Report

Residential Incentive Program Overview
Appendix 9 Electricity Consumption Report

NOTE: The last period in the above table will be less than 12 months, depending on date of HES (month/year) and the date on which this report is generated.
Your Average Daily Electricity Consumption For: kWh per Day % Change relative to 12 months before HES
% Change relative to previous year
The 12 month period (or part thereof) prior to your Home Energy Survey (HES) (73 days) 13.4
The first 12 month period after your HES (365 days) 13.7 2.2 2.2
The second 12 month period after your HES (365 days) 10.3 -23.1 -24.8
The third 12 month period after your HES (365 days) 9.3 -30.6 -9.7
The fourth 12 month period after your HES (366 days) 6.8 -49.3 -26.9
The fifth 12 month period after your HES ( 173 days) 8.3 -38.1 22.1
The results have been graphed on the following page and are represented by the columns, which display your average daily electricity consumption for each billing period of available data.
The average daily maximum temperature for each month has also been graphed with your consumption records. This allows you to compare your electricity consumption with changing climatic conditions – a peak during the hottest periods typically indicates increased use of air-conditioning and/or refrigeration.
Note: If you have had a Smart Meter installed, please see the other reports for more detailed information.
Notes on the Electricity Consumption Graph (following page):
Contact/Resident Name:
Property Address:
Jo Blo
15 Clarke Street Araluen 0870 Home Energy Survey Date: 09/09/2008
If your electricity use has increased or if you would like to discuss setting an electricity consumption target, please contact Alice Solar City for more information on our follow-up support options
Your electricity is billed as the number of kWh (kilowatt hours) consumed during a billing cycle, which is typically three months for a residential customer, though the exact number of days in the period can vary. To enable you to compare your consumption between different periods, we have calculated your average consumption per day by dividing the number of kWh for the billing period by the number of days in the period.
e.g. 542 kWh consumed over 92 days = an average of 5.89 kWh consumed per day
Power and Water Corporation measure your electricity consumption as kilowatt-hours (kWh) and this is the energy that is supplied to your household during the billing period. Using 1000 watts for 1 hour equals one kilowatt-hour.
Electricity Consumption ReportPrint Date: 11/06/2013 04:00PM

Your electricity consumption, Alice Solar City actions, and temperature
1. 09/09/08 Your Home Energy Survey
2. 16/09/09 Install 302JOTP Electric Boost Solar Hot water system
3. 27/10/09 Install Energiser 2000 PV system
Energy Actions
Electricity Consumption ReportPrint Date: 11/06/2013 04:00PM
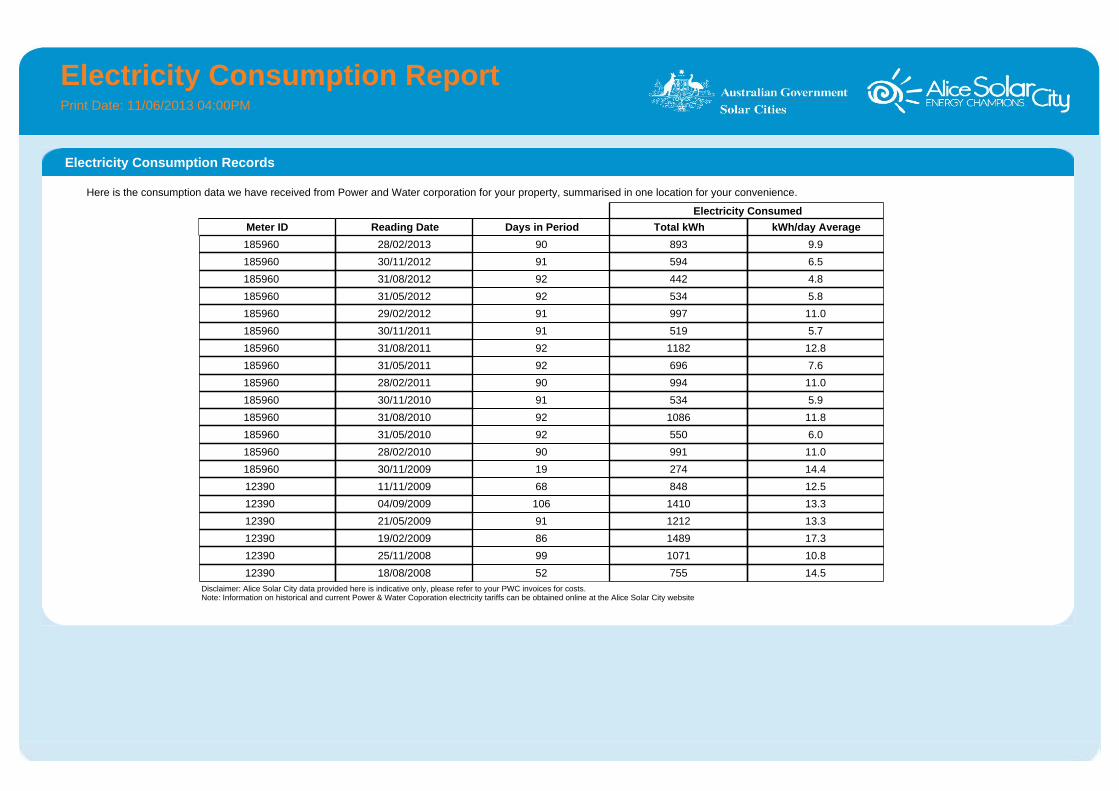
Here is the consumption data we have received from Power and Water corporation for your property, summarised in one location for your convenience.
Electricity Consumed
Meter ID Reading Date Days in Period Total kWh kWh/day Average
185960 28/02/2013 90 893 9.9
185960 30/11/2012 91 594 6.5
185960 31/08/2012 92 442 4.8
185960 31/05/2012 92 534 5.8
185960 29/02/2012 91 997 11.0
185960 30/11/2011 91 519 5.7
185960 31/08/2011 92 1182 12.8
185960 31/05/2011 92 696 7.6
185960 28/02/2011 90 994 11.0
185960 30/11/2010 91 534 5.9
185960 31/08/2010 92 1086 11.8
185960 31/05/2010 92 550 6.0
185960 28/02/2010 90 991 11.0
185960 30/11/2009 19 274 14.4
12390 11/11/2009 68 848 12.5
12390 04/09/2009 106 1410 13.3
12390 21/05/2009 91 1212 13.3
12390 19/02/2009 86 1489 17.3
12390 25/11/2008 99 1071 10.8
12390 18/08/2008 52 755 14.5Disclaimer: Alice Solar City data provided here is indicative only, please refer to your PWC invoices for costs. Note: Information on historical and current Power & Water Coporation electricity tariffs can be obtained online at the Alice Solar City website
Electricity Consumption Records
Electricity Consumption ReportPrint Date: 11/06/2013 04:00PM

Residential Incentive Program Overview
Appendix 10 Smart Meter Data Report

Smart Meter Details
Organisation Name:
Customer Name: Jo Blo
Meter Type:
Installation Address: 15 Clarke Street
Smart Meter 1ph + PV
Date Installed: 11/11/2009
How is your peak & off-peak use going?
kWh consumed
Total Peak Off-Peak
Month Days in use Total kWh kWh/Day Total Peak kWh kWh/Day Total
Off-Peak kWh kWh/Day % Off-Peak
May 2013 31 346 11.2 80 2.6 266 8.6 76.9
Apr 2013 30 136 4.5 41 1.4 95 3.2 70.0
Mar 2013 31 153 5.0 42 1.4 111 3.6 72.3
Feb 2013 28 165 5.9 45 1.6 120 4.3 72.6
Jan 2013 31 465 15.0 170 5.5 295 9.5 63.5
Dec 2012 31 264 8.5 75 2.4 188 6.1 71.4
Nov 2012 30 238 7.9 68 2.3 170 5.7 71.4
Oct 2012 31 189 6.1 61 2.0 128 4.1 67.5
Sep 2012 30 167 5.6 51 1.7 116 3.9 69.3
Aug 2012 31 151 4.9 52 1.7 98 3.2 65.3
Jul 2012 31 151 4.9 50 1.6 101 3.3 66.9
Jun 2012 30 140 4.7 45 1.5 96 3.2 68.2
May 2012 31 157 5.1 48 1.6 108 3.5 69.2
Apr 2012 30 179 6.0 54 1.8 125 4.2 69.9
Mar 2012 31 198 6.4 60 1.9 138 4.5 69.9
Feb 2012 29 261 9.0 82 2.8 178 6.2 68.4
Jan 2012 31 409 13.2 142 4.6 267 8.6 65.2
Dec 2011 31 327 10.6 86 2.8 241 7.8 73.7
Nov 2011 30 208 6.9 62 2.1 145 4.9 70.1
Oct 2011 31 163 5.3 49 1.6 114 3.7 69.8
Sep 2011 30 149 5.0 44 1.5 105 3.5 70.5
Aug 2011 31 167 5.4 45 1.4 122 4.0 73.2
Jul 2011 31 501 16.2 74 2.4 426 13.8 85.2
Jun 2011 30 514 17.1 59 2.0 456 15.2 88.6
May 2011 31 297 9.6 45 1.5 252 8.1 84.8
TOTAL 762 6092 8.0 1632 2.1 4461 5.9 73.2
Smart Meter ReportPrint Date: 11/06/2013 04:01PM
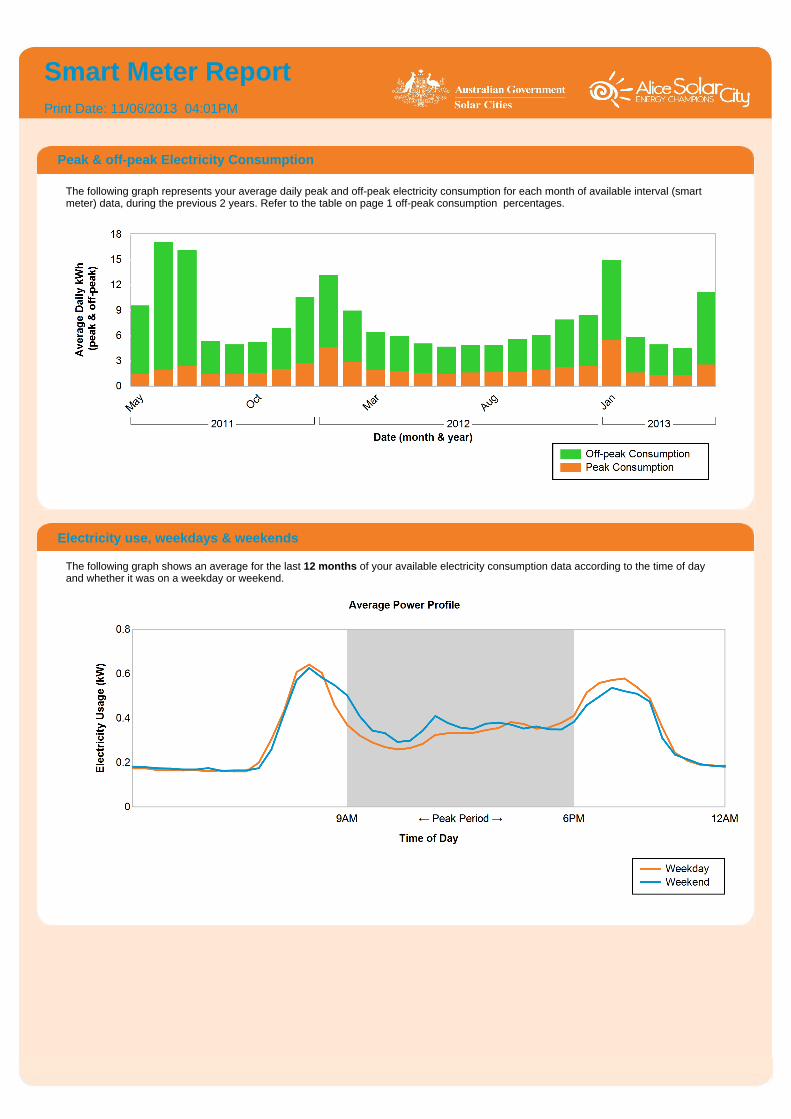
Peak & off-peak Electricity Consumption
The following graph represents your average daily peak and off-peak electricity consumption for each month of available interval (smart meter) data, during the previous 2 years. Refer to the table on page 1 off-peak consumption percentages.
Electricity use, weekdays & weekends
The following graph shows an average for the last 12 months of your available electricity consumption data according to the time of day and whether it was on a weekday or weekend.
Smart Meter ReportPrint Date: 11/06/2013 04:01PM

Eectricity use by time of day & season
This graph below shows your electrical power use for each half hour period of the day, averaged for each seasonal quarter using what data is available from the previous year. It shows how your time of use consumption varies over the hotter and cooler months.
Smart Meter ReportPrint Date: 11/06/2013 04:01PM

Residential Incentive Program Overview
Appendix 11 PV System Data Report
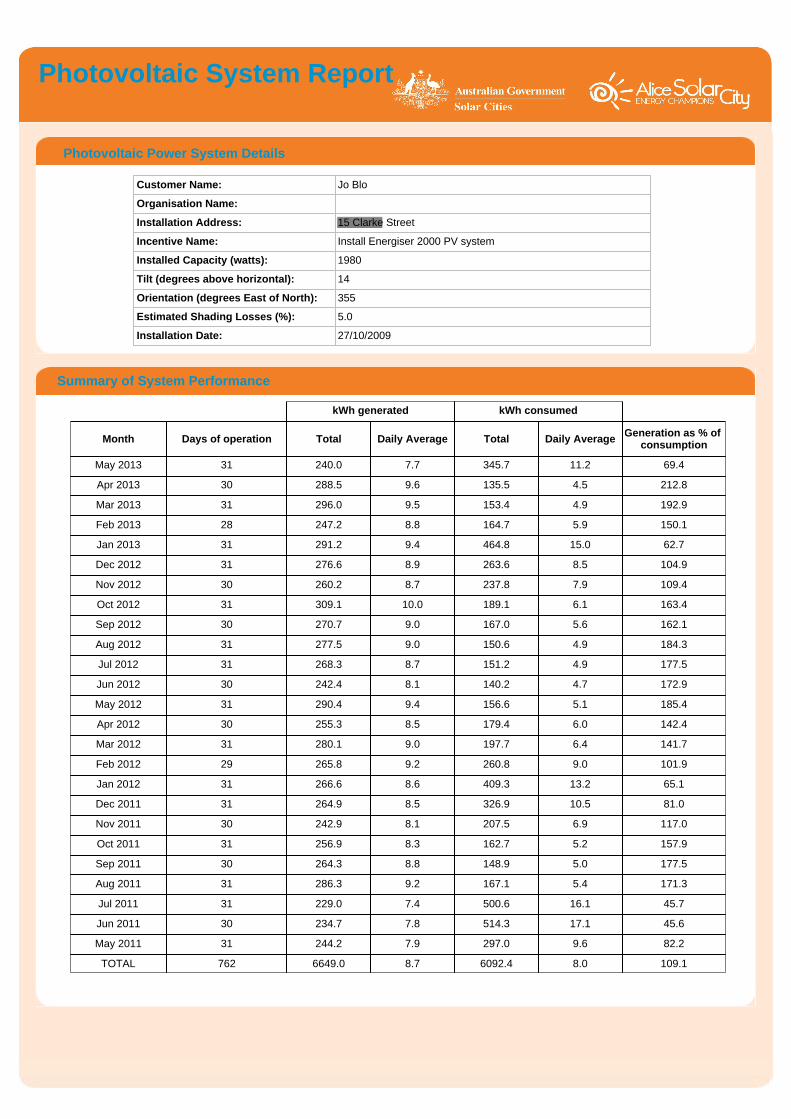
Photovoltaic Power System Details
Organisation Name:
Customer Name: Jo Blo
Incentive Name:
Installation Address: 15 Clarke Street
Install Energiser 2000 PV system
Tilt (degrees above horizontal):
Installed Capacity (watts): 1980
14
Orientation (degrees East of North): 355
Estimated Shading Losses (%): 5.0
Installation Date: 27/10/2009
Summary of System Performance
kWh generated kWh consumed
Month Days of operation Total Daily Average Total Daily Average Generation as % of consumption
May 2013 31 240.0 7.7 345.7 11.2 69.4
Apr 2013 30 288.5 9.6 135.5 4.5 212.8
Mar 2013 31 296.0 9.5 153.4 4.9 192.9
Feb 2013 28 247.2 8.8 164.7 5.9 150.1
Jan 2013 31 291.2 9.4 464.8 15.0 62.7
Dec 2012 31 276.6 8.9 263.6 8.5 104.9
Nov 2012 30 260.2 8.7 237.8 7.9 109.4
Oct 2012 31 309.1 10.0 189.1 6.1 163.4
Sep 2012 30 270.7 9.0 167.0 5.6 162.1
Aug 2012 31 277.5 9.0 150.6 4.9 184.3
Jul 2012 31 268.3 8.7 151.2 4.9 177.5
Jun 2012 30 242.4 8.1 140.2 4.7 172.9
May 2012 31 290.4 9.4 156.6 5.1 185.4
Apr 2012 30 255.3 8.5 179.4 6.0 142.4
Mar 2012 31 280.1 9.0 197.7 6.4 141.7
Feb 2012 29 265.8 9.2 260.8 9.0 101.9
Jan 2012 31 266.6 8.6 409.3 13.2 65.1
Dec 2011 31 264.9 8.5 326.9 10.5 81.0
Nov 2011 30 242.9 8.1 207.5 6.9 117.0
Oct 2011 31 256.9 8.3 162.7 5.2 157.9
Sep 2011 30 264.3 8.8 148.9 5.0 177.5
Aug 2011 31 286.3 9.2 167.1 5.4 171.3
Jul 2011 31 229.0 7.4 500.6 16.1 45.7
Jun 2011 30 234.7 7.8 514.3 17.1 45.6
May 2011 31 244.2 7.9 297.0 9.6 82.2
TOTAL 762 6649.0 8.7 6092.4 8.0 109.1
Photovoltaic System Report

The following graph compares your PV generation to your consumption as measured by smart meters only. Please note that it does not include any additional consumption metered by other non-smart meters - refer to your electricity consumption report for full consumption information.
Electricity Consumption and Photovoltaic System Generation
Average Daily Electricity Generation
Average Daily Electricity Consumption (Summer)
Average Daily Electricity Consumption (Autumn)
Average Daily Electricity Consumption (Spring)
Average Daily Electricity Consumption (Winter)
The following graph shows how the power output of your system varies during the day. The output is measured at half hourly intervals and is calculated as the average for 3 months blocks (December to February, March to May, June to August, and September to November), using what data is available for the previous 12 months.
PV Generation Daily Profile - 30 minute intervals
Photovoltaic System Report

Residential Incentive Program Overview
Appendix 12 Download Interval Data

meter_id reading_date_time kWh_consumed kWh_generated185960 31/05/2013 23:59 0.045 0185960 31/05/2013 23:30 0.081 0185960 31/05/2013 23:00 0.076 0185960 31/05/2013 22:30 0.064 0185960 31/05/2013 22:00 0.1 0185960 31/05/2013 21:30 0.056 0185960 31/05/2013 21:00 0.07 0185960 31/05/2013 20:30 0.112 0185960 31/05/2013 20:00 0.157 0185960 31/05/2013 19:30 0.369 0185960 31/05/2013 19:00 0.204 0185960 31/05/2013 18:30 0.399 0185960 31/05/2013 18:00 0.148 0.002185960 31/05/2013 17:30 0.35 0.054185960 31/05/2013 17:00 0.133 0.206185960 31/05/2013 16:30 0.167 0.329185960 31/05/2013 16:00 0.156 0.417185960 31/05/2013 15:30 0.191 0.466185960 31/05/2013 15:00 0.097 0.552185960 31/05/2013 14:30 0.056 0.605185960 31/05/2013 14:00 0.116 0.626185960 31/05/2013 13:30 0.137 0.658185960 31/05/2013 13:00 0.038 0.691185960 31/05/2013 12:30 0.064 0.569185960 31/05/2013 12:00 0.084 0.436185960 31/05/2013 11:30 0.095 0.352185960 31/05/2013 11:00 0.071 0.519185960 31/05/2013 10:30 0.061 0.537185960 31/05/2013 10:00 0.228 0.442185960 31/05/2013 9:30 0.154 0.135185960 31/05/2013 9:00 0.195 0.083185960 31/05/2013 8:30 0.571 0.041185960 31/05/2013 8:00 1.579 0.008185960 31/05/2013 7:30 1.538 0185960 31/05/2013 7:00 0.956 0185960 31/05/2013 6:30 0.191 0185960 31/05/2013 6:00 0.07 0185960 31/05/2013 5:30 0.069 0185960 31/05/2013 5:00 0.053 0185960 31/05/2013 4:30 0.087 0185960 31/05/2013 4:00 0.042 0185960 31/05/2013 3:30 0.084 0185960 31/05/2013 3:00 0.058 0185960 31/05/2013 2:30 0.066 0185960 31/05/2013 2:00 0.088 0185960 31/05/2013 1:30 0.046 0185960 31/05/2013 1:00 0.09 0185960 31/05/2013 0:30 0.07 0185960 30/05/2013 23:59 0.078 0185960 30/05/2013 23:30 0.074 0185960 30/05/2013 23:00 0.055 0185960 30/05/2013 22:30 0.106 0185960 30/05/2013 22:00 0.08 0185960 30/05/2013 21:30 0.148 0

Residential Incentive Program Overview
Appendix 13 Voucher Reminder Email

Thank you for your participation in the project. Following your homeenergy survey at the property listed above, we issued you with a set of incentivevouchers to assist you in implementing the energy saving measures recommended. At the present time our records indicate that you have not yet utilised the following incentive vouchers:
You may have actioned some of these recently, and/or know you will complete the incentives before the expiry date. But please read the following important information:
1.
2.
3.
4.
The Alice Solar City program finishes in June 2013 and payments for incentives will cease on 31 December 2012, or earlier if available funds are used. As a result, we can not guarantee funding for an expired voucher, and will instruct our registered suppliers to not accept expired vouchers.You therefore need to ensure that the work is completed and you have given your voucher to the supplier by the voucher expiry date.If you wish to proceed with the work but require more time for completion past the current voucher expiry date, you will need to provide us with a copy of the quote from the registered supplier that you intend to engage for the work before we will issue you with an extended voucher.You may wish to permanently cancel some or all of the vouchers.
11 Jun 2013
Jo Blo15 Clarke StreetAlice Springs NT 0870
Dear Jo,Re: 15 Clarke Street
Incentive Name Date Issued
Expiry Date
Incentive Value
Install Edson Evacuated Tube Solar Hot Water system 315 GLES (30 tubes)
11/06/2013 11/08/2013 35% up to $2,000
Please contact us about these options, for any other questions, or in regard to any particular difficulties you have encountered in undertaking your incentive measures. Phone us on (08) 8950 4350 or pop into the Smart Living Centre at 82 Todd Street. Remember, the sooner you carry out these measures, the sooner you will start saving energy and money.
Regards,
Sam LatzGeneral Manager

Residential Incentive Program Overview
Appendix 14 Electricity Consumption Update Email

Energy Consumption Update For:Jo Blo, Lot 2534, 15 Clarke Street, Araluen, NT, 0870
How to interpret this graph: The chart shows how your household's daily electricity consumption has varied over the period of involvement with Alice Solar City. The dates under the graph are the dates your meter was read by PWC.
The red line on the graph shows the average daily maximum temperature per month in . Does temperature have an impact on your household's electricity consumption?
The graph includes markers that show when your Home Energy Survey was undertaken and when you actioned energy efficiency measures that have an Alice Solar City rebate - has your consumption gone down since you joined Alice Solar City?
The average daily consumption of Alice Springs households is 23 kWh/day and an Alice Springs Energy Champion home consumes around 10 kWh/day. How does your household compare?
At what level would you like to see your electricity consumption in the future?
For advice and assistance to make further reductions, contact Alice Solar City by either dropping into the Smart Living Centre at 82 Todd St, calling us on 8950 4350, or emailing us at [email protected]
Have you considered setting a household daily electricity consumption target? Contact Alice Solar City for advice.
1. 09/09/08 Your Home Energy Survey
2. 16/09/09 Install 302JOTP Electric Boost Solar Hot water system
3. 27/10/09 Install Energiser 2000 PV system
Energy Actions
Your electricity consumption and activities to date
Your Average Daily Electricity Consumption For: kWh per Day
The 12 month period (or part thereof) prior to your Home Energy Survey (HES) (73 days) 13.4
The first 12 month period after your HES (365 days) 13.7
The second 12 month period after your HES (365 days) 10.3
The third 12 month period after your HES (365 days) 9.3
The fourth 12 month period after your HES (366 days) 6.8
The fifth 12 month period after your HES ( 173 days) 8.3

Residential Incentive Program Overview
Appendix 15 FUS/Engagement Report

04/06/2013
15 Clarke Street, Araluen
Prepared on:
Jo BloFor:
Address:
JOPresent:
Auditor: Neil Rilatt
Ph: 08 8950 4353
Energy saving measures that we recommended you to undertake at or after your initial home energy survey
ASC incentive applicable?
Have you carried out this
measure?
Install ceiling insulation - Batts Yes No
Initiate Cost Reflective Tariffs package Yes
Install 302JOTP Electric Boost Solar Hot water system Yes Yes
Install Energiser 2000 PV system Yes Yes
Replace light bulbs with low-energy bulbs Yes No
Alice Solar City EEMs
Record of energy efficiency measures (EEMs)
Other Alice Solar City EEMs done (Priority 3 or not recommended at HES)EEMs incentivised by Alice Solar City
Tint windows
EEMs not incentivised by Alice Solar City
DIY: Reduce air gaps with door seals or draft stoppers
Inspection and advice for a key action/EEM
Reason for the follow up consultation
1.
Breakdown of your electricity consumption
1.
2.
7.
6.
5.
4.
3.
Understanding your household energy use can help you consume less electricity and be more efficient, helping to save money on bills and reduce environmental impacts. Based on the assessment of your Alice Solar City auditor, we have ranked the key areas in which your household is consuming electricity, from highest to lowest. This knowledge can assist you in deciding where to focus your efforts to reduce your household’s electricity consumption.
Follow Up Survey Report
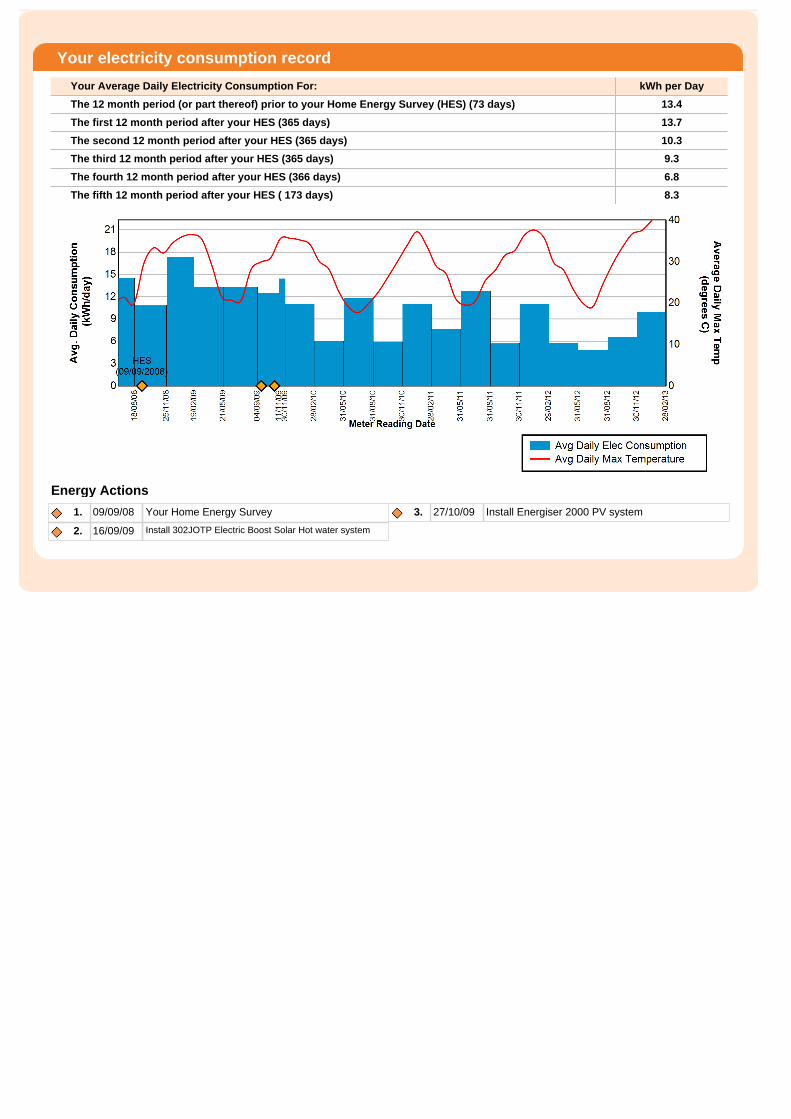
Your electricity consumption record
Your Average Daily Electricity Consumption For: kWh per Day
The 12 month period (or part thereof) prior to your Home Energy Survey (HES) (73 days) 13.4
The first 12 month period after your HES (365 days) 13.7
The second 12 month period after your HES (365 days) 10.3
The third 12 month period after your HES (365 days) 9.3
The fourth 12 month period after your HES (366 days) 6.8
The fifth 12 month period after your HES ( 173 days) 8.3
1. 09/09/08 Your Home Energy Survey
2. 16/09/09 Install 302JOTP Electric Boost Solar Hot water system
3. 27/10/09 Install Energiser 2000 PV system
Energy Actions

After your energy survey, and discussions with the auditor, the recommended actions are listed below in priority order.
Proposed Actions
ASC: ph 89504350; email: [email protected]; web www.alicesolarcity.com.au; portal https://www.prowessdevelopment.com.au/ASC_Portal
Residential Incentive Program Overview
Appendix 16 Informal Control Group data sheet

Code Month Month # Days kWh ADC/Mth ADC/YR kWh %72006 Jul‐06 Jul 5,919 142,288 3,541,548 24.89 24.7182006 Aug‐06 Aug 6,466 142,552 3,321,578 23.30 24.5592006 Sep‐06 Sep 5,924 137,936 3,006,657 21.80 24.37102006 Oct‐06 Oct 5,828 142,490 3,169,617 22.24 24.31112006 Nov‐06 Nov 6,732 137,910 3,429,930 24.87 24.48122006 Dec‐06 Dec 5,549 142,510 3,932,375 27.59 24.6612007 Jan‐07 Jan 5,929 142,447 3,965,306 27.84 24.6622007 Feb‐07 Feb 6,292 128,426 3,440,641 26.79 24.4832007 Mar‐07 Mar 5,800 141,261 3,515,747 24.89 24.2342007 Apr‐07 Apr 5,732 133,188 3,223,093 24.20 24.0252007 May‐07 May 6,027 133,160 3,123,817 23.46 23.8262007 Jun‐07 Jun 5,400 126,611 3,115,337 24.61 23.82 24.71 23.85 -0.8572007 Jul‐07 Jul 5,523 131,029 3,234,917 24.69 23.77 ‐0.94 ‐3.80% 24.69 23.76 -0.9382007 Aug‐07 Aug 6,051 131,290 3,002,725 22.87 23.68 ‐0.88 ‐3.57% 24.65 23.69 -0.9692007 Sep‐07 Sep 5,173 127,050 2,624,829 20.66 23.61 ‐0.76 ‐3.13% 24.56 23.75 -0.81102007 Oct‐07 Oct 5,602 131,231 2,732,172 20.82 23.72 ‐0.60 ‐2.45% 24.44 23.87 -0.57112007 Nov‐07 Nov 5,860 126,992 3,083,172 24.28 23.99 ‐0.49 ‐1.99% 24.39 23.99 -0.40122007 Dec‐07 Dec 5,220 131,206 3,581,618 27.30 24.24 ‐0.42 ‐1.71% 24.37 24.00 -0.3712008 Jan‐08 Jan 5,777 131,295 3,646,333 27.77 24.31 ‐0.35 ‐1.40% 24.36 24.00 -0.3622008 Feb‐08 Feb 5,813 122,682 3,186,192 25.97 24.22 ‐0.26 ‐1.06% 24.29 24.01 -0.2832008 Mar‐08 Mar 5,271 130,247 3,046,998 23.39 24.10 ‐0.12 ‐0.51% 24.17 24.07 -0.1042008 Apr‐08 Apr 5,413 125,689 2,786,944 22.17 24.07 0.06 0.23% 24.00 24.14 0.1452008 May‐08 May 6,307 133,024 2,889,352 21.72 24.04 0.22 0.93% 23.85 24.21 0.3662008 Jun‐08 Jun 5,584 133,857 3,140,313 23.46 24.05 0.23 0.97% 23.76 24.24 0.4872008 Jul‐08 Jul 5,885 142,358 3,398,502 23.87 23.91 0.14 0.59% 23.69 24.13 0.4482008 Aug‐08 Aug 6,587 142,764 3,360,883 23.54 23.65 ‐0.03 ‐0.11% 23.75 23.98 0.2392008 Sep‐08 Sep 5,983 138,240 3,055,448 22.10 23.35 ‐0.26 ‐1.12% 23.87 23.77 -0.10102008 Oct‐08 Oct 5,863 142,813 3,177,573 22.25 23.19 ‐0.53 ‐2.23% 23.99 23.59 -0.39112008 Nov‐08 Nov 6,494 138,176 3,376,099 24.43 23.27 ‐0.72 ‐2.99% 24.00 23.44 -0.55122008 Dec‐08 Dec 5,983 142,759 3,895,998 27.29 23.40 ‐0.84 ‐3.45% 24.00 23.36 -0.6412009 Jan‐09 Jan 5,865 142,730 3,986,793 27.93 23.35 ‐0.96 ‐3.93% 24.01 23.23 -0.7822009 Feb‐09 Feb 6,590 128,629 3,428,068 26.65 23.14 ‐1.09 ‐4.48% 24.07 23.08 -0.9932009 Mar‐09 Mar 5,958 141,913 3,436,582 24.22 22.87 ‐1.23 ‐5.09% 24.14 22.92 -1.22
These numbers
used as the ICG
adjustment factors in
ADC calculations before and after EEMs
done
Average 12 month
before
Average 12 month
after
ICG ChangeAP1-BP1
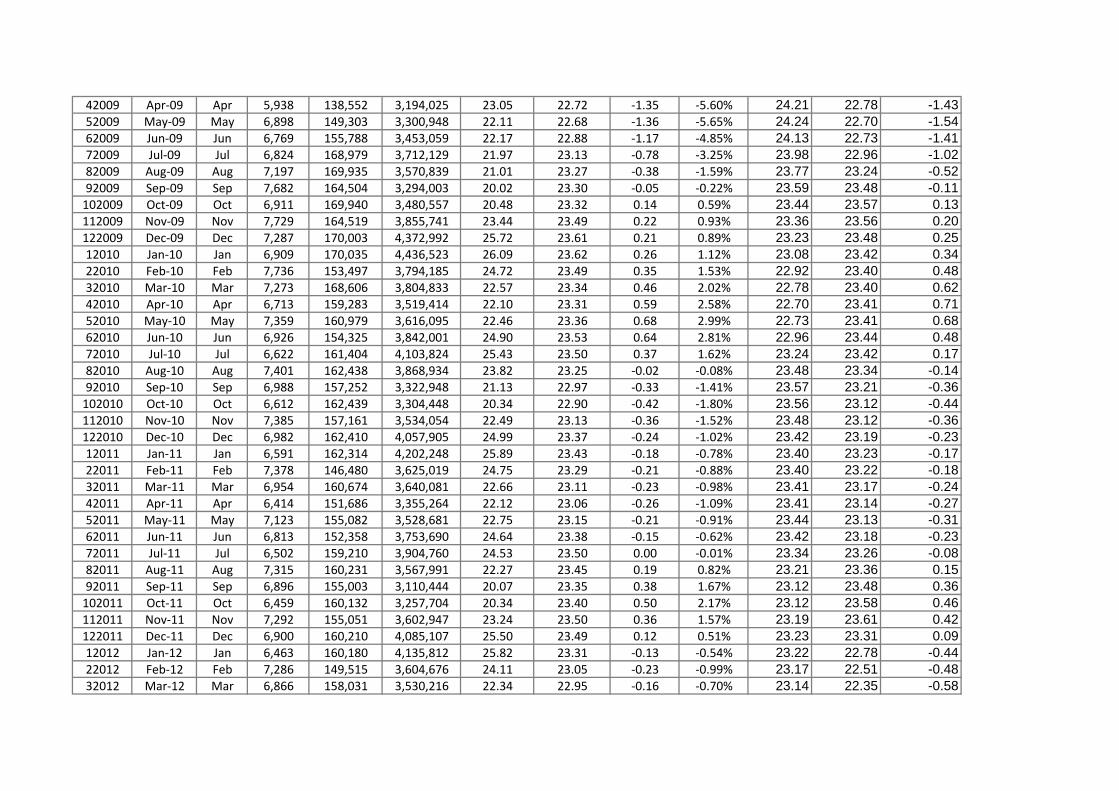
42009 Apr‐09 Apr 5,938 138,552 3,194,025 23.05 22.72 ‐1.35 ‐5.60% 24.21 22.78 -1.4352009 May‐09 May 6,898 149,303 3,300,948 22.11 22.68 ‐1.36 ‐5.65% 24.24 22.70 -1.5462009 Jun‐09 Jun 6,769 155,788 3,453,059 22.17 22.88 ‐1.17 ‐4.85% 24.13 22.73 -1.4172009 Jul‐09 Jul 6,824 168,979 3,712,129 21.97 23.13 ‐0.78 ‐3.25% 23.98 22.96 -1.0282009 Aug‐09 Aug 7,197 169,935 3,570,839 21.01 23.27 ‐0.38 ‐1.59% 23.77 23.24 -0.5292009 Sep‐09 Sep 7,682 164,504 3,294,003 20.02 23.30 ‐0.05 ‐0.22% 23.59 23.48 -0.11102009 Oct‐09 Oct 6,911 169,940 3,480,557 20.48 23.32 0.14 0.59% 23.44 23.57 0.13112009 Nov‐09 Nov 7,729 164,519 3,855,741 23.44 23.49 0.22 0.93% 23.36 23.56 0.20122009 Dec‐09 Dec 7,287 170,003 4,372,992 25.72 23.61 0.21 0.89% 23.23 23.48 0.2512010 Jan‐10 Jan 6,909 170,035 4,436,523 26.09 23.62 0.26 1.12% 23.08 23.42 0.3422010 Feb‐10 Feb 7,736 153,497 3,794,185 24.72 23.49 0.35 1.53% 22.92 23.40 0.4832010 Mar‐10 Mar 7,273 168,606 3,804,833 22.57 23.34 0.46 2.02% 22.78 23.40 0.6242010 Apr‐10 Apr 6,713 159,283 3,519,414 22.10 23.31 0.59 2.58% 22.70 23.41 0.7152010 May‐10 May 7,359 160,979 3,616,095 22.46 23.36 0.68 2.99% 22.73 23.41 0.6862010 Jun‐10 Jun 6,926 154,325 3,842,001 24.90 23.53 0.64 2.81% 22.96 23.44 0.4872010 Jul‐10 Jul 6,622 161,404 4,103,824 25.43 23.50 0.37 1.62% 23.24 23.42 0.1782010 Aug‐10 Aug 7,401 162,438 3,868,934 23.82 23.25 ‐0.02 ‐0.08% 23.48 23.34 -0.1492010 Sep‐10 Sep 6,988 157,252 3,322,948 21.13 22.97 ‐0.33 ‐1.41% 23.57 23.21 -0.36102010 Oct‐10 Oct 6,612 162,439 3,304,448 20.34 22.90 ‐0.42 ‐1.80% 23.56 23.12 -0.44112010 Nov‐10 Nov 7,385 157,161 3,534,054 22.49 23.13 ‐0.36 ‐1.52% 23.48 23.12 -0.36122010 Dec‐10 Dec 6,982 162,410 4,057,905 24.99 23.37 ‐0.24 ‐1.02% 23.42 23.19 -0.2312011 Jan‐11 Jan 6,591 162,314 4,202,248 25.89 23.43 ‐0.18 ‐0.78% 23.40 23.23 -0.1722011 Feb‐11 Feb 7,378 146,480 3,625,019 24.75 23.29 ‐0.21 ‐0.88% 23.40 23.22 -0.1832011 Mar‐11 Mar 6,954 160,674 3,640,081 22.66 23.11 ‐0.23 ‐0.98% 23.41 23.17 -0.2442011 Apr‐11 Apr 6,414 151,686 3,355,264 22.12 23.06 ‐0.26 ‐1.09% 23.41 23.14 -0.2752011 May‐11 May 7,123 155,082 3,528,681 22.75 23.15 ‐0.21 ‐0.91% 23.44 23.13 -0.3162011 Jun‐11 Jun 6,813 152,358 3,753,690 24.64 23.38 ‐0.15 ‐0.62% 23.42 23.18 -0.2372011 Jul‐11 Jul 6,502 159,210 3,904,760 24.53 23.50 0.00 ‐0.01% 23.34 23.26 -0.0882011 Aug‐11 Aug 7,315 160,231 3,567,991 22.27 23.45 0.19 0.82% 23.21 23.36 0.1592011 Sep‐11 Sep 6,896 155,003 3,110,444 20.07 23.35 0.38 1.67% 23.12 23.48 0.36102011 Oct‐11 Oct 6,459 160,132 3,257,704 20.34 23.40 0.50 2.17% 23.12 23.58 0.46112011 Nov‐11 Nov 7,292 155,051 3,602,947 23.24 23.50 0.36 1.57% 23.19 23.61 0.42122011 Dec‐11 Dec 6,900 160,210 4,085,107 25.50 23.49 0.12 0.51% 23.23 23.31 0.0912012 Jan‐12 Jan 6,463 160,180 4,135,812 25.82 23.31 ‐0.13 ‐0.54% 23.22 22.78 -0.4422012 Feb‐12 Feb 7,286 149,515 3,604,676 24.11 23.05 ‐0.23 ‐0.99% 23.17 22.51 -0.4832012 Mar‐12 Mar 6,866 158,031 3,530,216 22.34 22.95 ‐0.16 ‐0.70% 23.14 22.35 -0.58
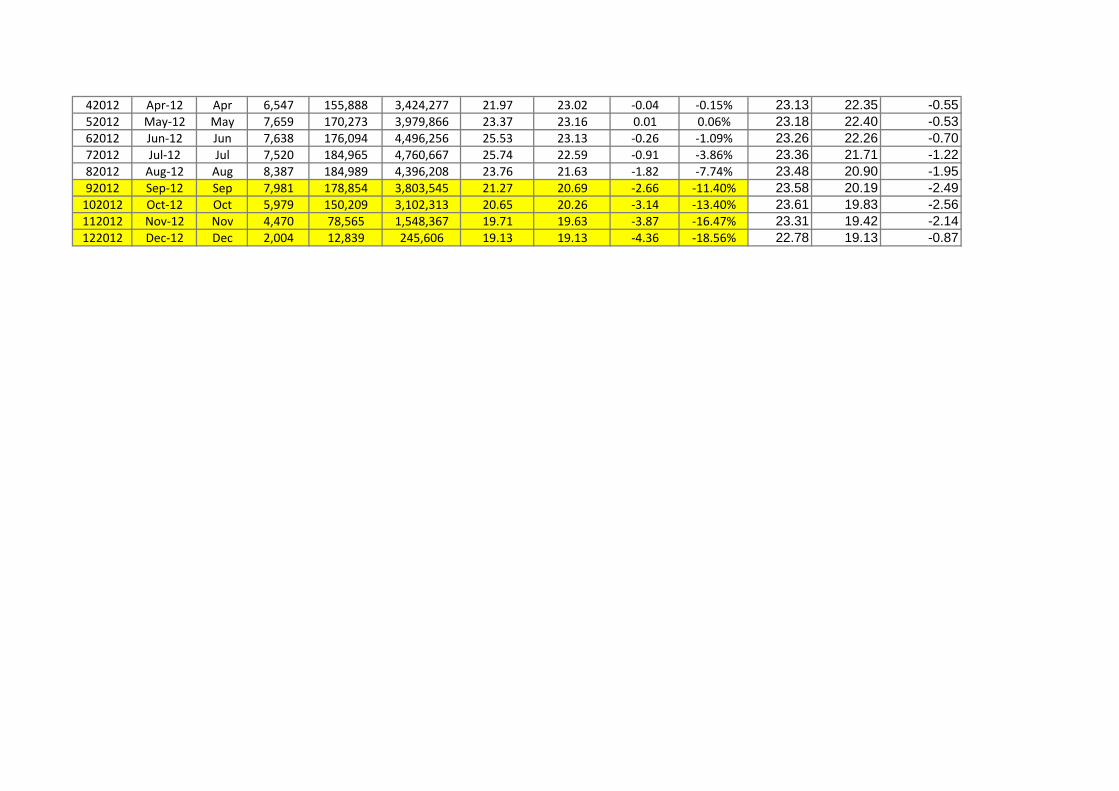
42012 Apr‐12 Apr 6,547 155,888 3,424,277 21.97 23.02 ‐0.04 ‐0.15% 23.13 22.35 -0.5552012 May‐12 May 7,659 170,273 3,979,866 23.37 23.16 0.01 0.06% 23.18 22.40 -0.5362012 Jun‐12 Jun 7,638 176,094 4,496,256 25.53 23.13 ‐0.26 ‐1.09% 23.26 22.26 -0.7072012 Jul‐12 Jul 7,520 184,965 4,760,667 25.74 22.59 ‐0.91 ‐3.86% 23.36 21.71 -1.2282012 Aug‐12 Aug 8,387 184,989 4,396,208 23.76 21.63 ‐1.82 ‐7.74% 23.48 20.90 -1.9592012 Sep‐12 Sep 7,981 178,854 3,803,545 21.27 20.69 ‐2.66 ‐11.40% 23.58 20.19 -2.49102012 Oct‐12 Oct 5,979 150,209 3,102,313 20.65 20.26 ‐3.14 ‐13.40% 23.61 19.83 -2.56112012 Nov‐12 Nov 4,470 78,565 1,548,367 19.71 19.63 ‐3.87 ‐16.47% 23.31 19.42 -2.14122012 Dec‐12 Dec 2,004 12,839 245,606 19.13 19.13 ‐4.36 ‐18.56% 22.78 19.13 -0.87