Embed Size (px)
Citation preview
Residential Growth Management Strategy - FINAL - 2016-05-30 (A1358911).docx
Residential Growth Management Strategy 2016 Wyndham City Council
Residential Growth Management Strategy - FINAL - 2016-05-30 (A1358911).docx
This report has been prepared for Wyndham City Council. SGS Economics and Planning has taken all due care in the preparation of this report. However, SGS and its associated consultants are not liable to any person or entity for any damage or loss that has occurred, or may occur, in relation to that person or entity taking or not taking action in respect of any representation, statement, opinion or advice referred to herein. SGS Economics and Planning Pty Ltd ACN 007 437 729 www.sgsep.com.au Offices in Canberra, Hobart, Melbourne and Sydney
3
TABLE OF CONTENTS
EXECUTIVE SUMMARY 5 Residential Growth Management Strategy 5
Strategy Background and Content 5
A dynamic, growing community 5
Characterising the growth management challenge 6
The preferred strategy for managing growth 7
The benefits of managing growth 8
1 WYNDHAM’S GROWTH CHALLENGE 9 1.1 Introduction 9
1.2 Population growth 9
1.3 Current challenges 10
2 PLANNING AND INFRASTRUCTURE RESPONSIBILITIES 13 2.1 Introduction 13
2.2 Sound metropolitan strategy 13
2.3 Adequate funding of city-shaping infrastructure 15
2.4 Effective growth area precinct planning and funding 18
2.5 Effective local planning and development sequencing 20 Development Sequencing 20
Density 21
3 THE ROLE OF DENSITY IN MANAGING GROWTH 22 3.1 Introduction 22
3.2 Current land supply in Wyndham 24
3.3 Density and land consumption in Wyndham 27 Limited Change 29
Incremental Change 29
Substantial Change 31
4 THE ROLE OF SEQUENCING IN MANAGING GROWTH 33 4.1 Introduction 33
4.2 Identifying a benchmark sequence of development 34
4.3 Measuring the costs associated with out-of-sequence development 41
4.4 Micro-staging 42
5 AN APPROACH TO GROWTH MANAGEMENT 44 5.1 Possible options for growth management 44
Gearing development to infrastructure capacity 44
The affordable housing challenge 46
Containing infrastructure costs per household by lifting densities 47
Containing infrastructure costs through better sequencing of development 45
4
5.2 Preferred strategy 46
5.3 The strategy dividend 46
5.4 Recommendations for Wyndham City Council 46
5.5 Recommendations for State Government 47
LIST OF FIGURES
FIGURE 1. FORECAST POPULATION GROWTH IN WYNDHAM 10 FIGURE 2. NUMBER O F DWELL ING PERMITS I N WYNDHAM 10 FIGURE 3. ACCESS TO SCHOOL INFRASTRUCTUR E (AS POPULATION TO SCHOOL
EMPLOYMENT RATIO) 12 FIGURE 4. ACCESS TO HOSPITAL INFRASTRUCT URE (AS POPULATION TO HOSPITAL
EMPLOYMENT RATIO) 12 FIGURE 5 INFRASTRUCTURE CATEG ORIES 15 FIGURE 6. RESIDENTIAL INFRASTR UCTURE CHARGES BY STATE 17 FIGURE 7. RESIDENTIAL DENSITY FRAMEWORK, WYNDHAM H OUSING STRATEGY 23 FIGURE 8. THE PRECINCT STRUCTU RE PLANS FOR URBAN W YNDHAM 25 FIGURE 9 LAND REQUIR ED FOR 2040 POPULATI ON TARGETS BASED ON PSP PROJECTIONS
(15 DWELL ING UNITS P ER HECTARE) 36 FIGURE 10 LAND REQUI RED FOR 2040 POPULAT ION TARGET AT 25 DWE LLING UNITS PER
HECTARE (PREFERRED M ACRO -STAGING PLAN) 37 FIGURE 11. WYNDHAM’S CURRENT (P LANNED) ROAD UPGRADI NG SEQUENCE 38 FIGURE 12. PROPOSED WYNDHAM NOR TH DCP PIP 43 FIGURE 13. RENTAL HOUSING STRES S, METROPOLITAN MELB OURNE 46 FIGURE 14. WYNDHAM S HOWING 3KM CATCHMENT S FROM CURRENT T RAIN STATIONS 48 FIGURE 15. MULTIPLE RESIDENTIAL GROWTH F RONTS ACROSS WYNDHAM , APRIL 2016 49
LIST OF TABLES
TABLE 1. PRECINCT STRUCTURE PLANS FOR DE VELOPMENT AREAS, GRO UPED BY COUNCIL PLANNING REGION 26
TABLE 2 LAND SUPPLY (STANDARD RESIDENTIA L ALLOTMENTS) SITUAT ION BY SUBURB, 2015 26
TABLE 3 RELATIONSHIP BETWEEN ROAD PROGRAM , AREA RELEASES AND POPULATION CAPACITY 28
TABLE 4. SEQUENCE PE RIODS 38 TABLE 5. ROAD SEGMEN T COSTINGS 40 TABLE 6. SPECIFIC ROAD SEGMENT COSTINGS 41 TABLE 7. BENCHMARKS FOR PROVIDING COMMUN ITY INFRASTRUCTURE 45
5
EXECUTIVE SUMMARY
Residential Growth Management Strategy
Strategy Background and Content
SGS Economics and Planning (SGS) was contracted by Wyndham City Council (‘Council’) to revise the 2012 Residential Growth Management Strategy (RGMS). The 2016 RGMS responds to recent growth dynamics in Wyndham City as well as policy evolution in planning and new infrastructure priorities. It provides direction for managing growth in Wyndham in a way that aims to overcome barriers to the timely delivery of infrastructure and to promote more opportunities for local residents and businesses in Wyndham. Additionally, the revised RGMS responds to new directions proposed for the Victorian Government’s Plan Melbourne (2014, and 2015 refresh considerations) as well as changes in local policy, especially the Wyndham Housing and Neighbourhood Character Strategy adopted in 2015 (Housing Strategy). In this regard, the Plan Melbourne Refresh process sets an agenda for managing growth in Melbourne’s outer suburbs focused on increased State Government investment in infrastructure, better planning for growth and improved coordination between different levels of government through the “development of local infrastructure delivery plans” (DEWLP, 2015). A pilot local infrastructure delivery plan is being developed in partnership with the City of Melton. This RGMS (2016) aims to provide a viable approach to growth management in Wyndham in line with State Government policy directions that may be complementary to other approaches being trialled in growth areas. Furthermore, the RGMS provides a framework to support implementation of Council’s new Housing Strategy, in particular the aspiration to intensify development around areas with good access to public transport. The RGMS lays out the:
1. nature of the growth management challenge in Wyndham; 2. policy and governance framework that influences growth management possibilities in Wyndham; 3. solutions to promote mutually beneficial alignment between residential development and
infrastructure provision; and 4. outcomes to be expected from managing growth for different stakeholders, including the community,
government and land developers. It is structured to include chapters on:
Wyndham’s growth challenge;
Planning and infrastructure responsibilities: the governance framework;
The role of density in managing growth;
The role of sequencing in managing growth; and
An approach to growth management. It includes recommendations for both Council and the State Government.
A dynamic, growing community
Wyndham is a rapidly growing city on the urban fringe of Melbourne. Some development will continue to occur at the core of Wyndham across two main established suburbs (Werribee and Hoppers Crossing). But beyond this, a dynamic growth scenario is unfolding. Another five new suburbs are being established around new major activity centres (Tarneit, Truganina, Williams Landing, Point Cook and Wyndham Vale). There is potential for at least another 56,000 new dwellings in these suburbs by the time they are fully developed and extended northwards. A further three new suburbs around Werribee West, Black Forest and Riverdale (Sayers Road) are also planned. Wyndham Vale is being expanded through the addition of developments in Manor
6
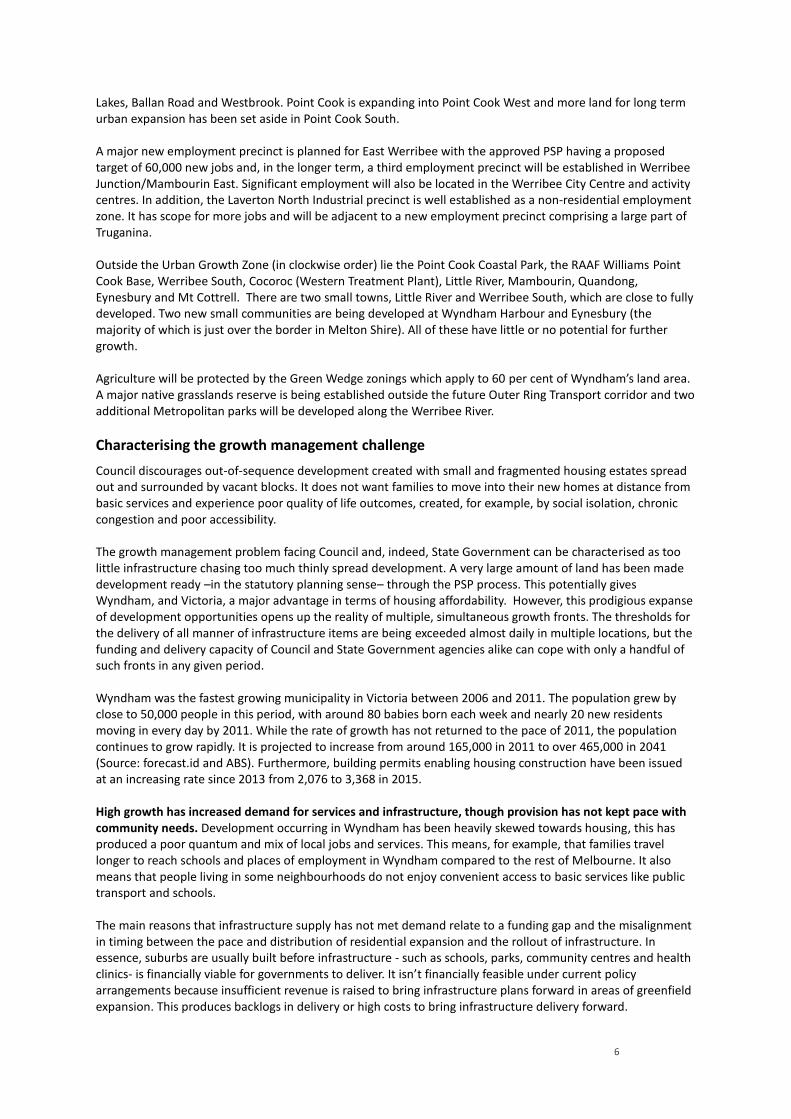
Lakes, Ballan Road and Westbrook. Point Cook is expanding into Point Cook West and more land for long term urban expansion has been set aside in Point Cook South. A major new employment precinct is planned for East Werribee with the approved PSP having a proposed target of 60,000 new jobs and, in the longer term, a third employment precinct will be established in Werribee Junction/Mambourin East. Significant employment will also be located in the Werribee City Centre and activity centres. In addition, the Laverton North Industrial precinct is well established as a non-residential employment zone. It has scope for more jobs and will be adjacent to a new employment precinct comprising a large part of Truganina. Outside the Urban Growth Zone (in clockwise order) lie the Point Cook Coastal Park, the RAAF Williams Point Cook Base, Werribee South, Cocoroc (Western Treatment Plant), Little River, Mambourin, Quandong, Eynesbury and Mt Cottrell. There are two small towns, Little River and Werribee South, which are close to fully developed. Two new small communities are being developed at Wyndham Harbour and Eynesbury (the majority of which is just over the border in Melton Shire). All of these have little or no potential for further growth. Agriculture will be protected by the Green Wedge zonings which apply to 60 per cent of Wyndham’s land area. A major native grasslands reserve is being established outside the future Outer Ring Transport corridor and two additional Metropolitan parks will be developed along the Werribee River.
Characterising the growth management challenge
Council discourages out-of-sequence development created with small and fragmented housing estates spread out and surrounded by vacant blocks. It does not want families to move into their new homes at distance from basic services and experience poor quality of life outcomes, created, for example, by social isolation, chronic congestion and poor accessibility. The growth management problem facing Council and, indeed, State Government can be characterised as too little infrastructure chasing too much thinly spread development. A very large amount of land has been made development ready –in the statutory planning sense– through the PSP process. This potentially gives Wyndham, and Victoria, a major advantage in terms of housing affordability. However, this prodigious expanse of development opportunities opens up the reality of multiple, simultaneous growth fronts. The thresholds for the delivery of all manner of infrastructure items are being exceeded almost daily in multiple locations, but the funding and delivery capacity of Council and State Government agencies alike can cope with only a handful of such fronts in any given period. Wyndham was the fastest growing municipality in Victoria between 2006 and 2011. The population grew by close to 50,000 people in this period, with around 80 babies born each week and nearly 20 new residents moving in every day by 2011. While the rate of growth has not returned to the pace of 2011, the population continues to grow rapidly. It is projected to increase from around 165,000 in 2011 to over 465,000 in 2041 (Source: forecast.id and ABS). Furthermore, building permits enabling housing construction have been issued at an increasing rate since 2013 from 2,076 to 3,368 in 2015. High growth has increased demand for services and infrastructure, though provision has not kept pace with community needs. Development occurring in Wyndham has been heavily skewed towards housing, this has produced a poor quantum and mix of local jobs and services. This means, for example, that families travel longer to reach schools and places of employment in Wyndham compared to the rest of Melbourne. It also means that people living in some neighbourhoods do not enjoy convenient access to basic services like public transport and schools. The main reasons that infrastructure supply has not met demand relate to a funding gap and the misalignment in timing between the pace and distribution of residential expansion and the rollout of infrastructure. In essence, suburbs are usually built before infrastructure - such as schools, parks, community centres and health clinics- is financially viable for governments to deliver. It isn’t financially feasible under current policy arrangements because insufficient revenue is raised to bring infrastructure plans forward in areas of greenfield expansion. This produces backlogs in delivery or high costs to bring infrastructure delivery forward.
7
The financial viability of infrastructure provision is undermined not only by the misalignment in pace of urban expansion and infrastructure planning, but also because of the geographic spread of new development fronts. Current Precinct Structure Plans (PSPs) enable residential development to occur out-of-sequence with the planned delivery of infrastructure. In this regard, there are multiple greenfield development fronts across the municipality, which presents challenges to distributing limited resources across many new communities. In addressing the mismatch between residential development and infrastructure provision, few initiatives have succeeded in raising sufficient revenue to bring forward essential infrastructure, like roads, rail and schools. The scale of population growth and residential development characteristics are influenced by a range of factors in Wyndham. Fast-paced growth has been driven in part by desirable location and affordability factors. In particular, however, strategic planning and capital investment frameworks set at higher levels of government, drive the pattern of residential development and encourage faster growth in some places compared to others across Melbourne. For example, Plan Melbourne (2014), highlights a key role for Wyndham in accommodating part of the future metropolitan population. Similarly, the West Growth Corridor Plan prepared by the State Government in 2012, proposed 10 new suburbs and 3 employment precincts in Wyndham over 30 years. Infrastructure investment, for example in roads and rail, also drives development. Strategic policy and infrastructure investment have set in motion a trajectory of growth that will see Wyndham accommodate around twice its 2011 population and more than twice the current number of local jobs by 2040.
The current pattern of residential growth is largely a product of deliberate government policy yet is seriously under-funded in terms of infrastructure. Outcomes for residents can be improved, pressures on government spending alleviated and market competition enhanced by a transparent residential growth management strategy that better links infrastructure delivery with new development.
The preferred strategy for managing growth
For the benefit of future and current residents of Wyndham, as well as to contribute to an orderly and efficient development of the entire metropolitan area, it is important to have an effective residential growth management strategy in place. All three levels of government -Local, State and Federal- and non-government actors have a critical part to play in managing residential growth in Wyndham: Council needs to ensure that each suburb is appropriately planned and provided with access to local infrastructure and services; State and Federal Governments have an essential role in delivering city-shaping infrastructure and setting strategic policy frameworks that enable high-quality development outcomes; and developers play an important role in delivering urban development in optimum timeframes with high quality design and good access to services. Based on the evidence and analysis in this report, and the opportunities for Council to effect change within current governance settings, the preferred residential growth management strategy for Wyndham comprises three key elements:
1. Actively manage the number of areas under development at any one time to optimise the capacity to provide infrastructure in a timely manner. The primary vehicle for achieving this will be the ‘benchmark sequence of development’ preferably agreed between Council and State Government agencies. The sequence developed in this RGMS is based only on Council’s roads, community infrastructure and parks staging plans. This should be refined over time to incorporate Council’s infrastructure planning updates (planned for mid-2016) as well as State Government policy and infrastructure plans, for example, through the proposed “local infrastructure delivery plans” (DEWLP, 2015). This will ensure that the sequence reflects infrastructure planning at both the local and state level. Furthermore, Council should pursue greater regulatory tools to manage this and financial incentives to develop “in sequence” and disincentives to develop “out-of-sequence” (Refer to 3).
2. Within this benchmark sequence, incrementally transition development to higher densities in areas with good public transport access. Over time, this is expected to deliver an average of 20-25 dwelling units (net) per hectare across the municipality’s urban area, which is in line with the Victorian Government’s proposed density target (Plan Melbourne Refresh, DEWLP, 2015). This average density target should be reflected in Council policy and reviewed over time in line with land development trends (currently at 18du/ha in Wyndham, though much higher in some areas), new policy directions
8
(e.g. Victorian Government’s planning strategy) and research into optimal minimum densities for achieving community benefits and economies of scale in delivering infrastructure, in particular public transport. For example, research by the Heart Foundation (Corti et al., 2015) recommends “a net density threshold of 20 dwellings per hectare” to encourage walkability and “densities of between 35-43 net and 32-40 gross dwellings per hectare (based on occupancies of 2.6 persons/dwelling)…to make amenities and public transport viable” (p. 7).
3. Manage out-of-sequence development by requiring proponents to build viable communities and compensate for additional costs associated with bringing forward infrastructure. In this regard, the benchmark sequence established between Council and the State government will set the standard for the most cost efficient and coordinated approach to delivering infrastructure. When a proposed variation from the agreed sequence is anticipated to cause extra costs, proponents would be required to prepare cost impact assessments for any agencies which see a prima facie need for such an assessment. Then, the method of compensation for any additional costs would be a matter of negotiation between the proponent and the affected agencies. It would be effected through a Section 173 agreement (Planning and Environment Act 1987).
The benefits of managing growth
There are wide-ranging benefits associated with this strategy for residential growth. In particular, managing growth through guiding development sequencing and densities enables governments to efficiently deliver on their commitments to ensure that new communities are serviced with adequate infrastructure in a timely manner. In this regard, it provides a mechanism to bring into alignment the funding of infrastructure with the development of new communities.
Furthermore, it provides transparency, consistency and assurances concerning the planned alignment between infrastructure provision and residential development, as well as enhancing efficiency in the assessment of residential subdivisions to the benefit of the development community. By making the approval process of out-of-sequence development clear and transparent, the strategy can be expected to inject greater competition into the land market.
The implementation of this strategy will encourage orderly development, maximise the cost effectiveness of investment in infrastructure, particularly road infrastructure, and will reduce the occurrence of poorly serviced and geographically fragmented developments. Importantly, the RGMS provides a framework to deliver better quality outcomes for current and future Wyndham residents in terms of timely access to planned basic infrastructure and services.
Overall, this 2016 RGMS attempts to combine a range of considerations to sketch out what future development might look like in Wyndham. It contemplates both policy settings and residents’ views. It has been prepared as a ‘living’ document: there will be opportunities to refine and change it, for example based on the future ‘local infrastructure delivery plan’ prepared in collaboration with the Victorian Government. It has been prepared as a tool to support planned residential development and improved infrastructure delivery.
9
1 WYNDHAM’S GROWTH CHALLENGE
1.1 Introduction
The growth management challenge in Wyndham relates to a misalignment between the pace of residential development and infrastructure provision. Essentially, infrastructure and services have not been provided in line with Wyndham’s high population growth. Current funding models do not generate sufficient investment, leaving infrastructure backlogs to be addressed alongside the new infrastructure needs of establishing communities. Additionally, suburbs have been created in a piecemeal fashion, at times in locations that are disconnected from existing communities and basic services. Combined, these two factors present challenges for promoting orderly urban expansion in line with adequate infrastructure and services. The following section outlines some key aspects of the growth challenge facing Wyndham. Addressing the challenges to delivering infrastructure in Wyndham (and other growth areas) has been the focus of successive governments at different levels. Wyndham City Council was the first Victorian local government to develop a Residential Growth Management Strategy in 2012 and more recently has adopted a Housing Strategy (2015) that sets a vision and objectives for housing diversity, types and affordability. The Victorian Government seeks to manage growth through its planning strategy and by investing in infrastructure. Most recently, the Plan Melbourne (2014) Refresh paper proposes to lock down the existing Urban Growth Boundary and introduce “a mechanism to manage the sequence and density of the remaining Precinct Structure Plans based on land supply needs” to support growth management (DELWP, 2015, p.46). Furthermore, the State Government plays an important role in funding infrastructure in outer suburbs (e.g. 2015-16 Victorian Budget committed $1 billion to transport, health, education and community facilities to outer Melbourne). The Federal Government also provides some funding for local road backlogs and upgrades, libraries and, in some instances, sports and other community facilities. The next chapter of this Strategy covers the different responsibilities of governments in managing growth in Wyndham.
1.2 Population growth
Council’s objective is to plan for projected growth and ensure there is an adequate supply of well-serviced land ready for development. The population of Wyndham increased from 115,000 in 2006 to around 167,000 residents in 2011. This strong growth has continued; the population of Wyndham increased to 200,000 in 2014 (ABS cat 3218.0). The average annual growth rate between 2006 and 2014 in Wyndham was 7.1%, compared to 2.1% in Greater Melbourne. Between 2006 and 2014, around 47,000 new residents moved to Wyndham, while natural population growth was at around 38,000 people. Wyndham experienced the highest growth rate and absolute increase in population in Melbourne between the last census periods. While the total number of people will continue to increase in Wyndham, the rate of growth (%) is projected to decline over time. Projected growth is the product of natural growth of the existing population and the inflow of new residents from other areas. According to DEWLP: Victoria in Future analysis of ABS data, the population is projected to increase to 275,000 in 2021 and 367,000 in 2031. DELWP also indicate the population is likely to increase to approximately 465,000 by 2041. The average household size will decrease from 2.9 in 2011 to 2.8 in 2041.
10
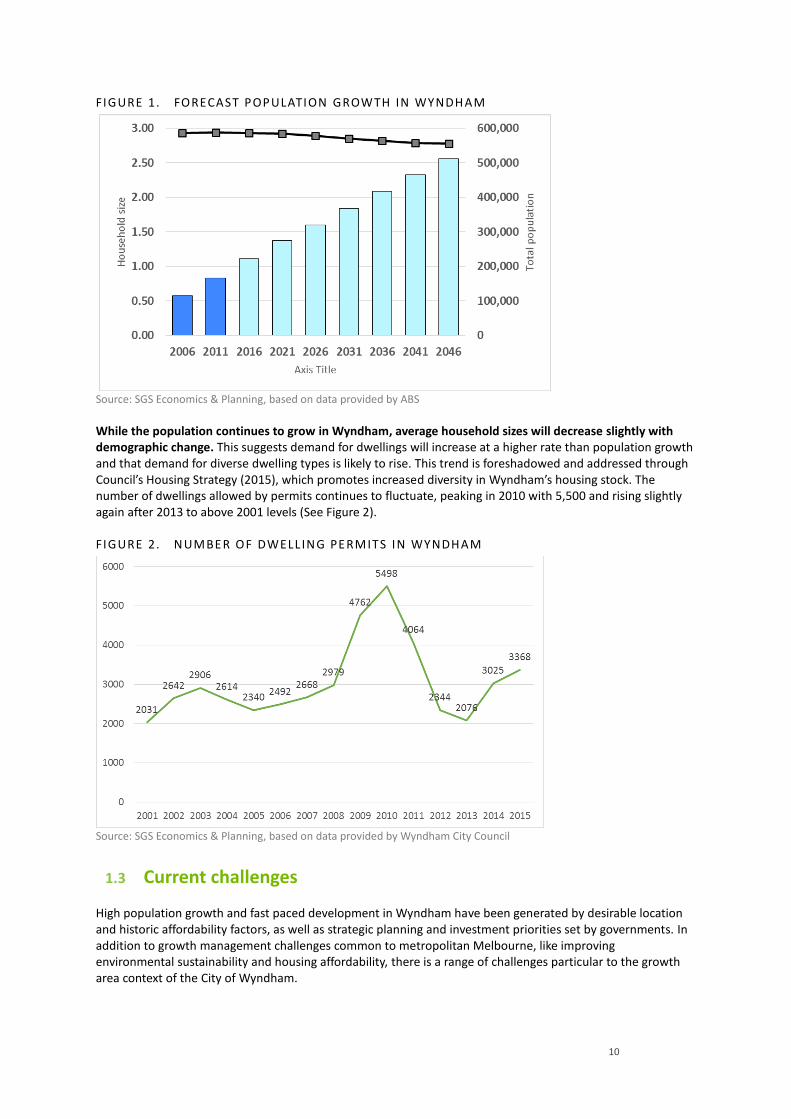
FIGURE 1. FORECAST POPULATION GROWTH IN WYNDHAM
Source: SGS Economics & Planning, based on data provided by ABS
While the population continues to grow in Wyndham, average household sizes will decrease slightly with demographic change. This suggests demand for dwellings will increase at a higher rate than population growth and that demand for diverse dwelling types is likely to rise. This trend is foreshadowed and addressed through Council’s Housing Strategy (2015), which promotes increased diversity in Wyndham’s housing stock. The number of dwellings allowed by permits continues to fluctuate, peaking in 2010 with 5,500 and rising slightly again after 2013 to above 2001 levels (See Figure 2).
FIGURE 2. NUMBER OF DWELL ING PERMITS IN WYNDHAM
Source: SGS Economics & Planning, based on data provided by Wyndham City Council
1.3 Current challenges
High population growth and fast paced development in Wyndham have been generated by desirable location and historic affordability factors, as well as strategic planning and investment priorities set by governments. In addition to growth management challenges common to metropolitan Melbourne, like improving environmental sustainability and housing affordability, there is a range of challenges particular to the growth area context of the City of Wyndham.
11
First, there has been considerable though insufficient funding for infrastructure and services by different levels of government to support the scale of recent growth in Wyndham. For example, the Victorian Government continually invests in growth area infrastructure, including, as noted, $1 billion for outer suburbs in road, rail and community infrastructure announced as part of the 2015-16 Victorian Budget. Nevertheless, deficits remain in areas like rail and road infrastructure. Research conducted by SGS for the National Growth Areas Alliance indicates that Federal and State Governments would need to invest over $50 billion over the next 16 years to address investment needs in Australian growth areas across education, health and transport infrastructure (2015). Services –provided for example by GPs, mental health practitioners and police- also have not kept pace with growth. There are backlogs facing infrastructure in Wyndham, like arterial roads and schools. In this regard, the gap between development contributions (DCPs, open space and GAIC) and the costs of local infrastructure in a rate capped environment threatens to widen and create additional backlogs. In sum, traditional approaches to funding and financing have not delivered infrastructure to keep pace with demand for development in Wyndham over the last decade in particular. Second, the urban footprint often expands before the delivery of infrastructure, producing underserviced communities on the fringe of the city. This detracts from quality of life outcomes and produces an uneven model of development. In some cases, development has occurred in locations that are disconnected from the edge of existing suburbs, creating a spread of dispersed suburbs in still largely rural landscapes that are poorly connected to urban infrastructure and services. The greater the number of development fronts spread across the local government area, the more complex and expensive infrastructure delivery becomes. Consequently, residential development often occurs before the provision of some types of infrastructure and services, like public schools (See Figure 3), hospitals (See Figure 4) and community centres. New residents then face difficulties in accessing infrastructure and services. Furthermore, residents in Wyndham have poorer access, compared to the metropolitan average, to jobs and services. Average travel time to work is also higher for Wyndham residents (40.6 minutes) when compared to the metropolitan average (34.9 minutes) (VISTA, 2010). Council is subsequently pressured to address the needs of underserviced communities, but is met with an unrealistic local capital works program and has limited influence on larger infrastructure investment decision-making, like public transport and arterial roads. In addition to the historic funding gap and challenge of sequencing development with infrastructure, a further growth management challenge relates to encouraging a balance of land uses to provide sufficient services and opportunities locally (i.e. self-containment). Wyndham has fewer local jobs for local residents than other parts of Melbourne. In 2001, 67% of Wyndham residents travelled to work outside Wyndham and that figure rose to 72% of residents working outside the local area by 2011 (ABS). While there are four major new employment precincts planned (East Werribee, Truganina Employment Precinct, Boundary Road, and Werribee Junction/ Mambourin East) to promote local economic development, attracting job creating industries and businesses is a key challenge for local and state governments. While Precinct Structure Plans (PSPs) encourage development to follow a logical structure and adequate land use composition, translating this into reality continues to be a major challenge. There are a range of drivers behind the lack of land use mix and local opportunities for employment, including infrastructure deficits (e.g. arterial road upgrades), which lower productivity and undermine competitiveness in the area. Furthermore, there aren’t explicit incentives or mechanisms in the planning system to diversify land uses, intensify development in areas with high accessibility or to ensure that a viable mix of land uses is created over time. Figures 3 and 4 show the relationship between the total population and the number of jobs in school education, and the number of jobs in hospitals. Figure 3 is based on the ratio between the number of children aged between 5 and 19 (school aged population) and the number of jobs in school education. Figure 4 is based on the ratio between the number of local residents (total population) and the number of jobs in hospitals.

12
FIGURE 3. ACCESS TO SCHOOL I NFRASTRUCTURE (AS PO PULATION TO SCHOOL EMPLOYMENT RATIO)
Source: SGS Economics and Planning
FIGURE 4. ACCESS TO HOSPITAL INFRASTRUCTURE (AS P OPULATION TO HOSPITAL EMPLOYMENT RATIO)
Source: SGS Economics and Planning
13
2 PLANNING AND INFRASTRUCTURE RESPONSIBILITIES
2.1 Introduction
Urban development and infrastructure delivery possibilities in Wyndham’s growth areas are directly influenced by broader governance and financing arrangements. In particular, city-shaping infrastructure, like road and rail, relies on funding from both Federal and State levels of government. Additionally, planning in growth areas is framed by metropolitan planning priorities. The impact of State and Federal Government involvement in planning and infrastructure delivery at the metropolitan scale is significant for the shape and pace of development in Wyndham. Overall, the following elements need to be in place and positively interconnected for effective growth management to occur in Wyndham:
1. Sound metropolitan strategy;
2. Adequate funding for city-shaping infrastructure;
3. Supportive precinct structure planning; and
4. Effective local planning and funding of development.
2.2 Sound metropolitan strategy
Local governments are impacted by the changing landscape of metropolitan planning. The Victorian Government, through executive powers vested with the Planning Minister, has overall responsibility for metropolitan planning. The previous planning Minister delegated planning power for the Wyndham growth area to the Metropolitan Planning Authority (MPA). Under this arrangement, Council is closely consulted but has no final powers in the strategic planning undertaken for new communities. The MPA plays a key role in planning for Melbourne’s overall growth. The MPA works with the seven growth area councils and other stakeholders to undertake Precinct Structure Planning activities. The previous Growth Areas Authority (now the MPA) prepared the West Growth Corridor Plan, which sets out strategic guidelines for a range of land use planning matters, including relating to residential districts and employment nodes. Plan Melbourne, released in 2014, included significant projects to address major transport issues in Wyndham. These included rail access to Avalon airport, the Metro 1 rail tunnel project and the western part of the East West Link (replaced in the short term with the Western Distributor project of the Andrews State Government). The Plan included an Employment Cluster at East Werribee for 50,000 jobs in health, education and high-tech research. These strategic determinations influence the character and scope of local development in Wyndham. Some of these infrastructure priorities have changed since the release of Plan Melbourne. The variable nature of infrastructure planning for the metropolitan area impacts local planning and development processes. A revision process has commenced since the release of Plan Melbourne in 2014. The Plan Melbourne Refresh recommendations indicate a renewed focus on ‘structured sequencing’ and ‘integrated infrastructure delivery’. Many of the proposed revisions promote a more compact metropolitan development pattern, for example with a 30/70 split of accommodating growth in greenfield/infill locations. Furthermore, the Plan Melbourne Refresh recommendations, currently being considered by the State Government, promote development staging and increased densities in growth areas, including to:
14
• investigate a mechanism to manage the sequence and density of the remaining PSPs based on land supply needs (36B);
• sequence and stage development …(and)…require that PSPs include a sequencing plan for new suburbs that link the timing of delivery of essential community infrastructure identified in a DCP to the anticipated staging of development….apply an appropriate mechanism that does not allow any subsequent stages to proceed until such time as these facilities and services are operational (recommendation 22, initiative 2.2.5);
• use a combination of a sequencing plan linked to capping or limiting subdivision and development approvals, DCP expenditure, council funded works, and works-in-kind delivery of infrastructure funded by DCPs (initiative 2.2.5-3); and
• amend the PSP Guidelines and SPP Framework mandating greater housing diversity and minimum dwelling density in the urban growth areas of 25 dwellings per net hectare for residential areas to meet the needs of all household types (initiative 2.2.5-4).
Finalisation of the refresh process is due in mid to late 2016. While the exact details of the revised Plan Melbourne are currently unknown, the refresh process underway indicates that there is commitment to address the misalignment between infrastructure delivery and new residential development in a way that improves quality of life outcomes for households and enhances coordination between different delivery agencies. This RGMS has been framed by this sentiment and offers a clear approach to operationalise Plan Melbourne’s objectives in terms of coordinating infrastructure delivery. As part of the Plan Melbourne refresh process, Background Paper 1 ‘Managing Growth: Infrastructure for Melbourne’s Outer Suburbs’ has also been released. The Background Paper sets out a threefold approach to addressing growth pressures in outer areas, including:
1. improved coordination of future funding for infrastructure between different levels of government; 2. better planning for growth; and 3. increased State Government investment.
One key mechanism put forward to improve growth management is to develop ‘local infrastructure delivery plans’, which are envisaged as collaborative plans between State and Local governments. The approach to managing growth established in this RGMS responds to the directions of the Plan Melbourne Refresh, by laying out a strategy to increase densities and sequence development in line with both Local and State infrastructure plans. It also proposes combining the sequence plan with development approval processes to promote the creation of viable communities. The approach is explained in detail in the following chapters. Overall, metropolitan planning processes significantly frame local development possibilities. For example, major infrastructure commitments –such as the Regional Rail Link , the Outer Metropolitan Ring transport corridor, Western Distributor and Interstate Freight Terminal at Truganina- as well as planning determinations -such as the creation of employment clusters- impact growth patterns at the local level. Of particular relevance to growth area planning is the amount of land unlocked for development that Councils are required to plan for and the position adopted on development sequencing and densities. The scale of change expected through population growth and employment creation are also important considerations for local growth management. In addition to the framework established by Plan Melbourne, Infrastructure Victoria has canvassed options relating to development sequencing and density. In particular, the recent options paper ‘All Things Considered’ suggests that the concept of “greenfield development sequencing” requires further development. This would encompass improvements to “the coordination, sequencing and delivery of infrastructure through the controlled release of land to ensure investment in infrastructure can keep pace with development” (p. 41). It also suggests that subregional infrastructure planning should be improved through joint planning efforts by all three levels of government. The options paper also proposes to increase residential density around centre areas for improved employment outcomes. Both suggestions are adopted and reflected in this RGMS with practicable methods for application.
15
2.3 Adequate funding of city-shaping infrastructure
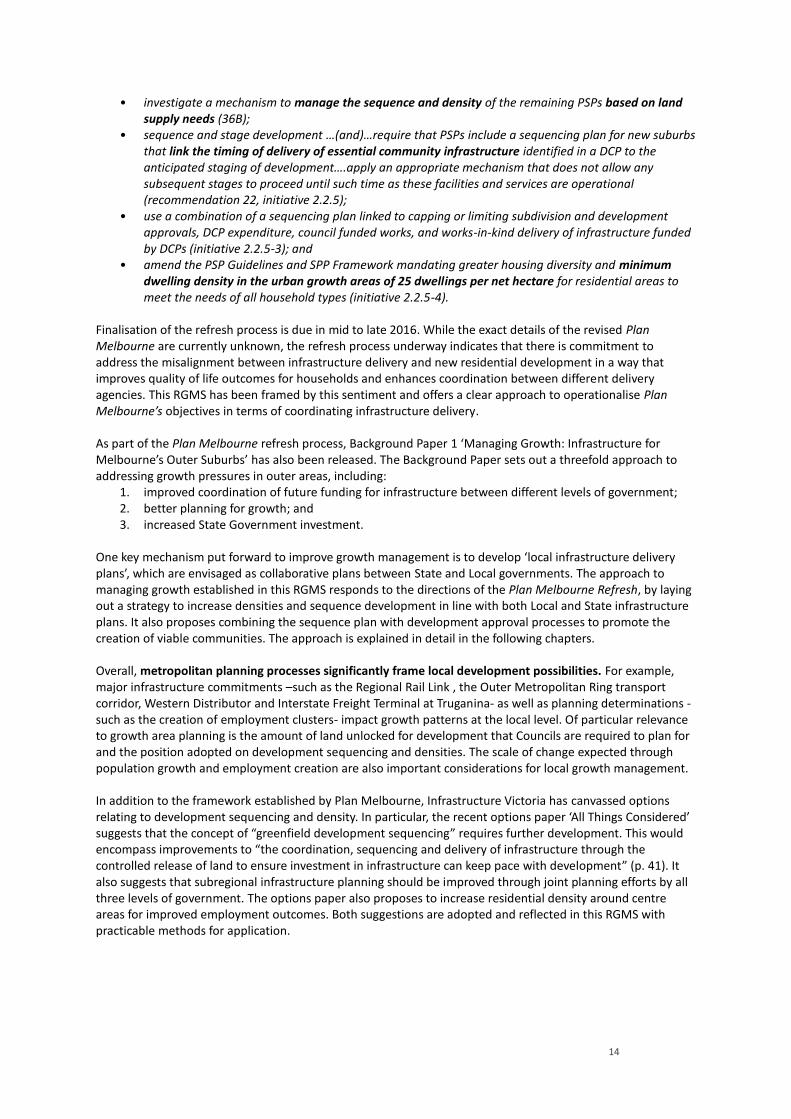
Responding to the infrastructure needs of Wyndham’s population relies in part on adequate funding and financing of large-scale, city-shaping infrastructure. This is a two-fold issue. Firstly, higher level infrastructure including arterial roads is vital to the quality of life of households moving into growth areas. Secondly, some strategic infrastructure investments can have a profound effect on the shape and density of development, which, in turn, impact the cost of providing other, ‘follower’ infrastructure, such as sub-arterial roads, parks and schools (See Figure 5). For example, the RRL project is already having this city shaping effect in Wyndham.
FIGURE 5 INFRASTRUCTURE CATEG ORIES
City-shaping or ‘strategic’ infrastructure This shifts relative accessibility across the metropolis and therefore influences the location decisions of households and businesses, effectively shaping the pattern of settlement.
Structural infrastructure These are the high level network elements and nodes which form the skeletal structure of the Region
Follower infrastructure These are the local and district services that flesh out the skeletal structure of the Region
Source: SGS Economics & Planning
Historically, Federal and State Governments have primarily led investment in large-scale city-shaping infrastructure. Private investment in infrastructure has increased over recent decades through various forms of public-private partnership. However, the combination of both public and private finance does not meet present infrastructure needs across the country. Some challenges for delivering infrastructure include a lack of defined infrastructure projects, constrained government budgets, confused roles across governments and the private sector, under-developed markets for facilitating increased investment and reluctance to increase public debt.

16
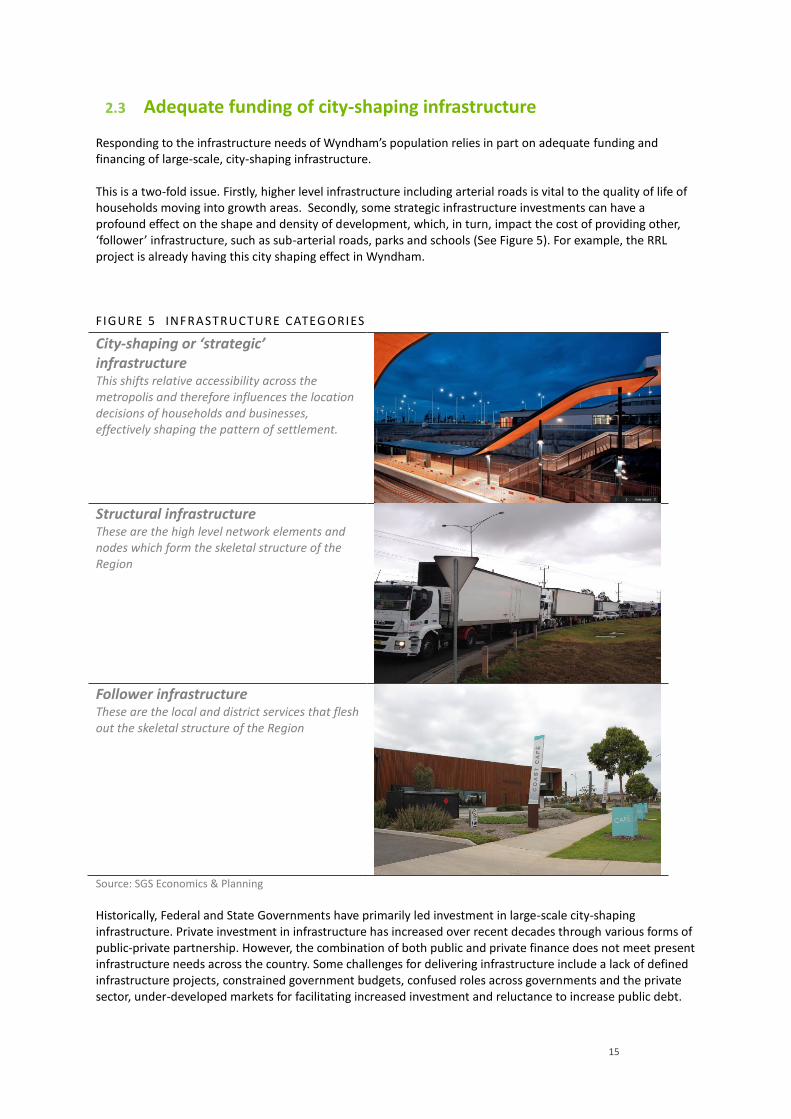
In addition to improving existing funding mechanisms (i.e. increased financing through development contribution plans), greater innovation is needed to adequately finance urban infrastructure. This is occurring, for example, through exploring increasing superannuation investment in infrastructure, and there are a range of possible alternative funding mechanisms for public and mass transit, such as value capture approaches, benefit assessment districts or ticket surcharges (Hale, 2014). Despite some innovation, the current approach does not deliver adequate infrastructure investment: in 2013 there was an estimated infrastructure backlog of $700 billion nationally (Infrastructure Partnerships Australia, 2013). According to the Productivity Commission (2011), residential infrastructure charges for greenfield development in Melbourne are the second lowest of the mainland capital cities, and substantially lower than Perth, Brisbane or Sydney.
17
FIGURE 6. RESIDENTIAL INFRASTR UCTURE CHARGES BY STATE
Source: Productivity Commission comparison of Development Contributions Source: Productivity Commission Research Report Volume 1, page 212, in Plan Melbourne Refresh Background Paper 1
Unsatisfactory financing for large-scale infrastructure projects impacts growth patterns at the local level. For example, congested roads and limited public transport inhibit efficient development and limit opportunities for residents, for example to access employment opportunities across the city. The 2013 Victorian Auditor General’s report Developing Transport Infrastructure and Services for Population Growth Areas concluded that the cost to State and Local governments to respond to infrastructure needs in greenfield areas is approximately $36 billion over 30 years. It identifies a major investment backlog of $10 billion. Research undertaken by SGS for the National Growth Area Alliance indicates that an investment of $25.9 billion for infrastructure (health, transport and education) in growth areas across Australia is required to deliver a level of service equivalent to outer established areas in Australian cities (2015). In Victoria, approximately $1 billion is required to address existing health and education deficits in growth area infrastructure and $4.6 billion to service future growth (SGS, 2015). Meeting this requires both State and Commonwealth Government contributions. Higher levels of government have control over many of the most important infrastructure funding decisions. Bigger items of infrastructure, in particular arterial roads (VicRoads declared), public transport, hospitals and schools are the responsibility of the State Government. The establishment of major parks and protection of nature conservation areas are also State Government responsibilities. Based on the current amount of land unlocked for development, there is a high risk of scattered and piecemeal development placing further demands on the government’s already limited capacity to meet demands for roads, schools and other community facilities. Nevertheless, as a result of state-led strategic planning and infrastructure investment, there has been substantial progress. For example, introducing the RRL line to serve the north of the municipality, a new station at Williams Landing and additional peak hour trains provides some relief in the south. The State Government has also funded a new freeway interchange at Sneydes Road and has contributed funding for the Hoppers Lane-Princes Highway intersection realignment. There have been some improvements to bus services, for example in some parts of Point Cook by increasing to a 20 minute frequency and with more direct routes to stations, or in the case of Saltwater Coast where services have been introduced in sequence with residents moving in. The State Government announced $85 million in 2015 to improve bus networks predominantly in Melbourne’s growth areas. The Melbourne Metro Rail Project is envisaged to support commuting from Wyndham to the central city. Investment in public transport is vital to support growth in Wyndham; improved public transport services create more opportunities for residents and businesses alike, as well as alleviating pressure on
18
freeways. In 2015 the State Government also announced funding allocations to support the upgrade of intersections at Derrimut Road / Leakes Road (Tarneit), Palmers Road /Dunnings Road (Point Cook) and Princes Highway/Forsyth Road (Hoppers Crossing). There has also been investment in education and health that has benefited Wyndham residents. The 2015/16 State Government budget included $567.6 million for school capital programs to upgrade and rebuild school facilities in Victoria. In particular, new schools for Wyndham include the Point Cook South Prep-Year 9 and Tarneit Prep-Year 9. The State Government has also committed to purchasing land for a new primary school in Davis Creek, a site for a Secondary College in Point Cook and to modernise Werribee Secondary College. Planning works have commenced to establish tech schools in some municipalities, including Wyndham. Investment in health by the State Government has most recently included the announcement in 2015/16 of $85 million for the Werribee Mercy Hospital acute health services expansion. The State Government is also exploring ways to develop Crown land for future businesses and jobs in Wyndham, including East Werribee. Council fully supports the State Government hypothecating proceeds from government land sales to address infrastructure backlogs and upgrades. For example, crown land in Point Cook West was successfully sold for over $100 million. An important financing mechanism in Victoria is the Growth Areas Infrastructure Charge (GAIC). The GAIC is a levy on land to capture part of the increased value when it is rezoned for development. For recently rezoned land sold in 2015/16 this delivered $90,470 per hectare in established areas or $107,440 in urban growth areas (State Revenue Office, 2016) to help fund public transport, and community facilities (like schools, commuter parking, cycling infrastructure). Over $400 million is expected to be accrued by 2019 in Victoria from GAIC contributions. It is estimated that over the full cycle of development, around $280 million in GAIC will be collected by the State government in the Wyndham West area as land is subdivided, and a similar amount will be collected in Wyndham North. Notwithstanding this important financing mechanism, the GAIC is estimated to recoup only 15% of the total infrastructure costs incurred by the State Government. The State Government is currently (early 2016) considering a new framework for the most efficient allocation of GAIC funds. The outer suburban arterial roads fund and level crossing removal program are expected to deliver improvements in Wyndham. GAIC funds are available to pay for some State infrastructure and the legislation requires that half of the funds are spent on public transport and half on other community facilities. The allocation of GAIC funds is controlled by the State Government and developers are able to deliver some of this infrastructure ‘in kind’. The State Government also provides smaller grants for kindergartens, sports facilities and swimming centres with the Council. Federal grants such as the National Stronger Regions Fund and the Roads to Recovery program often provide top up funding to help build community infrastructure. Notwithstanding State and Federal Government investment (e.g. budget allocations, Interface Growth Fund), as well as the contributions made by developers (discussed below in Section 2.4) and Council, demand for basic infrastructure and services has greatly outstripped delivery due to considerable funding shortfalls. Arterial road duplication needs, overcrowded trains, lack of bus services to keep pace with growth, the lack of bridges over railway lines, poor access to the freeway, inadequate and overcrowded schools, lack of health and hospital facilities, justice and emergency services, and social housing, all continue to impact quality of life in Wyndham and are all responsibilities of higher levels of government. Yet these infrastructure needs compete to get funding between many other priorities faced by the State and Federal Governments across the state and country. To date, neither the Federal nor State Governments have resolved to comprehensively address historical infrastructure shortfalls impacting growth areas.
2.4 Effective growth area precinct planning and funding
The undeveloped urban zoned land designated in the Growth Corridor Plan has been broken into ‘precincts’ and master plans have been prepared or are in preparation, with identified infrastructure needs and Developer Contribution Plans (DCP) for each of these. The MPA consults with Council staff in preparing these Precinct Structure Plans (PSPs). With the incorporation of new areas in the Urban Growth Boundary in 2010 and 2012,
19
the MPA set out boundaries for the PSP program. The MPA intends to progress the completion of all PSPs contained in its program in accordance with available resources over a 20 year period. According to the MPA, PSPs are “the ‘blueprint’ for development and investment that will occur over many years.” They define the layout of different land uses, such as employment areas, roads and housing, as well as address infrastructure provision and the DCPs set out council/local infrastructure levies. The PSPs and DCPs also provide a framework for development contributions for infrastructure and community facilities. In this regard, much basic infrastructure is paid for by developers through direct works and development contributions. Development contributions are “designed to recover from developers the cost of infrastructure provided by government for new developments” (Productivity Commission, 2011, p.198). The DCPs seek to equitably share the costs of providing main roads, recreation and community infrastructure across new developments. Development contributions are paid by the developers of the land either as cash or ‘in-kind,’ meaning the works are built by the developer to Council’s specifications and standards. Government charges for infrastructure should provide market signals to encourage appropriately located and scaled residential development. In this regard, infrastructure costs should be considerably higher when development is proposed out-of-sequence or at a great distance from existing infrastructure in order to ensure new residential communities are appropriately serviced by basic infrastructure. On the other hand, infrastructure charges should be lower where existing infrastructure supports growth or where modest upgrades are required, as well as where the density of development encourages economies of scale in infrastructure provision. Currently, however, development contributions are applied equally on a land area basis rather than on the availability of infrastructure or residential density. Levying charges for infrastructure has not recovered associated costs in growth areas. Council’s ability to pursue ‘full cost recovery’ on these items has not been supported by MPA, Planning Panels or State Governments in recent years, for example with the un-indexed cap on a number of items of ‘community infrastructure’. Currently, there is a cap on some community and recreation infrastructure and Council is required to cover the funding shortfall. This has meant that Council is increasingly unable to provide the necessary funds to build items such as pavilions and libraries through the DCP Scheme alone. The Community Infrastructure Levy cap has been frozen since 2003 and if it had been indexed at CPI it would be $1200 This means that the existing ratepayers of Wyndham must increasingly meet the costs of this necessary infrastructure in newly developing areas. Wyndham ratepayers, consistent with other growth area Councils, pay approximately 30 per cent more than the State average in terms of rates as a percentage of property values. Furthermore, Council’s ability to fund local improvements through rates is restricted by a recently introduced cap on rates. In sum, Local government does not have full autonomy over the level of contributions for local infrastructure. The Productivity Commission’s report into Performance Benchmarking of Australian Business Regulation: Planning, Zoning and Development Assessments (2011) suggested that best practice in levying development contributions would involve:
• the use of upfront charging to finance major shared infrastructure, such as trunk infrastructure, for new developments where the incremental costs associated with each development can be well established and where such increments are likely to vary across developments. This would also accommodate out-of-sequence development
• infill development where system-wide components need upgrading or augmentation that provide comparable benefits to incumbents should be funded out of borrowings and recovered through rates or taxes (or the fixed element in periodic utility charges)
• for local roads, paving and drainage, it is efficient for developers to construct them, dedicate them to local government and pass the full costs on to residents (through higher land purchase prices) on the principle of beneficiary pays
• for social infrastructure which satisfies an identifiable demand related to a particular development (such as a neighbourhood park) the costs should be allocated to that development with upfront developer charges an appropriate financing mechanism; and
20
• for social infrastructure where the services are dispersed more broadly, accurate cost allocation is difficult if not impossible and should be funded with general revenue unless direct user charges (such as for an excludable service like a community swimming pool) are possible.
Furthermore, the PC report (2011, p.217) explained that “it is not possible for governments or businesses to deliver infrastructure instantaneously to every potential development across a city. Priorities must be set.” The recommendations laid out in the next chapters for managing residential growth in Wyndham respond to the best practice framework laid out in the PC’s report. In particular, this RGMS proposes upfront charging to finance infrastructure in line with identifiable demand, as well as a preferred sequence and priorities for both local and state-led infrastructure. The proposed approach to sequencing only accounts for Council roads, open space and community facilities planning at present. Further refinements to the RGMS should be made in coordination with the State Government’s infrastructure planning and delivery process. Coordination is fundamental to ensure infrastructure is provided in line with residential development and to provide transparency and certainty for developers. At present, the PSP process is the primary tool for coordination of infrastructure delivery between State government departments, agencies and Local government. Infrastructure Victoria is likely to play a key role in future infrastructure planning and the State Government’s background paper on managing growth foregrounds coordination as a key priority for growth area planning and infrastructure delivery. The approach proposed in this RGMS aims to align with and support existing coordination mechanisms: it rests on coordination for its full benefit to be realised.
2.5 Effective local planning and development sequencing
Sections 2.2 to 2.4 highlight that infrastructure delivery is an area of shared responsibility between all levels of government as well as the private sector. It also highlights that the State Government has the greatest influence in planning growth areas in Victoria, though the mechanisms currently in place to levy investment in basic infrastructure for these communities are inadequate. This significantly limits the capacity of local governments to manage growth and enable viable local communities within their jurisdictions: Their role is supported to a greater or lesser extent depending on the framework for metropolitan planning, the extent of funding allocated to city-shaping infrastructure and the efficacy of State Government-led precinct planning in growth areas. Despite the constrained scope for intervention by local governments, there are some critical spheres of influence in planning and infrastructure. Firstly, local governments can influence development outcomes through their capacity as collection agencies in determining priorities for the rollout of local infrastructure. Furthermore, growth management and the prioritisation of infrastructure can be supported at the local level by effective development sequencing within the frameworks set by the urban growth boundary (UGB) and the PSPs. The management of density is another relevant consideration. In the next two sections of the report, the respective roles of density and sequencing in managing residential growth and infrastructure pressures in Wyndham are examined. A brief overview is provided below.
Development Sequencing
While residential development currently follows a form of sequence, the current situation presents challenges in ensuring viable communities due to a lack of transparency in infrastructure delivery. By introducing greater transparency to infrastructure planning and delivery, healthy market competition is enhanced. The implementation of a development sequencing framework maximises the cost effectiveness of investment in infrastructure and works to reduce the occurrence of poorly serviced dispersed developments. A development sequencing framework must be delivered in a way that supports market competition by providing certainty and transparency, as well as permitting out-of-sequence development that is appropriately serviced.
21
The approach to development sequencing proposed in this RGMS is to actively manage the number of areas under development at any one time to optimise the capacity to provide infrastructure in a timely manner through the use of a ‘benchmark sequence.’ The macro-sequence is elaborated in the next chapter based on Council’s roads, community infrastructure and parks, though it should be refined to incorporate Council’s updated infrastructure plans (mid-2016) and State Government infrastructure plans, for example through the proposed “local infrastructure delivery plans” (DEWLP, 2015). This will ensure that the sequence reflects infrastructure planning at both the local and state level. The proposed sequence also requires proponents to build viable communities and compensate for additional infrastructure costs. In this regard, the benchmark sequence established between Council and the State Government will set the standard for the most cost efficient and coordinated approach to delivering infrastructure. When a proposed variation from the agreed sequence causes extra costs, proponents would be required to prepare cost impact assessments for any agencies which see a prima facie need for such an assessment. Then, the method of compensation for any additional costs would be a matter of negotiation between the proponent and the affected agencies. It would be effected through a Section 173 agreement. Sequencing of development can have a significant impact on the cost of infrastructure delivery. A key benefit of an efficient sequencing system is that the risks and costs of fragmented patterns of urban growth are assigned to the parties that can manage them best, namely private sector proponents of out of sequence projects. This will improve productivity from the scarce resources available for investment in urban infrastructure to support greenfield growth.
Density
The second pillar of this RGMS relates to density. In this regard, the benchmark sequence proposes a transition of development to higher densities in areas with good public transport access as per Council’s Housing Strategy. Over time this is expected to move towards delivering, overall an average of 20 to 25 dwelling units (net) per hectare
1 across the municipality’s urban areas, which is in line with the
recommendations put forward in the Plan Melbourne Refresh for consideration by the Victorian Government. A commitment to increasing population densities in select areas with high access to public transport services will help reduce the rate of expansion of the urban footprint and therefore contain the area of need for infrastructure provision. This, in turn, will reduce expenditure on some infrastructure through economies of scale (e.g. less footpaths required to service equal population sizes in less physical space) and optimise the use and efficiency of infrastructure and services provided, such as public transport services. Infrastructure provision, such as community centres, should also be planned to respond to the location and density of new dwellings, for example potentially increasing the number of facilities in a geographic area.
1 The average density target should be reviewed over time in line with land development trends (currently up to approximately 18du/ha in
Wyndham), new policy directions (e.g. Victorian Government’s planning strategy) and research into optimal minimum densities for achieving community benefits and economies of scale in delivering infrastructure, in particular public transport.
22
3 THE ROLE OF DENSITY IN MANAGING GROWTH
3.1 Introduction
The pace at which urban expansion occurs is partly dependent on development density. In this regard, the rate at which the total amount of developable land will be consumed will change over time based on changing densities. The State Government has previously set a minimum rate of 15 dwellings per hectare for growth areas. Current rates are at approximately 18 dwellings per hectare in Wyndham. The Plan Melbourne Refresh recommends an increase in density, putting forward a proposed average density of 25 dwellings per hectare.
Research shows a range of different benefits from increasing density. For example, recent research conducted for the Heart Foundation (Corti et al., 2015) recommends: “a net density threshold of 20 dwellings per hectare” as the minimum required to encourage walkability and “densities of between 35-43 net and 32-40 gross dwellings per hectare (based on dwelling occupancies of 2.6 persons/dwelling)…to make amenities and public transport viable” (p. 7). Local shops, centres and facilities become viable with an average of 25-30 dwellings per hectare, as there is sufficient population to support their operation. Bus networks require approximately 35-40 people per hectare in order for there to be sufficient patronage (Stanley and Hensher 2011). Higher density housing in walkable urban areas supports public transport usage, and as a result reduces the amount of space required for high capacity roads and parking areas (Buxton and Scheurer, 2007). The 20-minute city principle also emphasises the link between higher levels of density, public transport viability and public transport patronage (Stanley and Stanley, 2014).
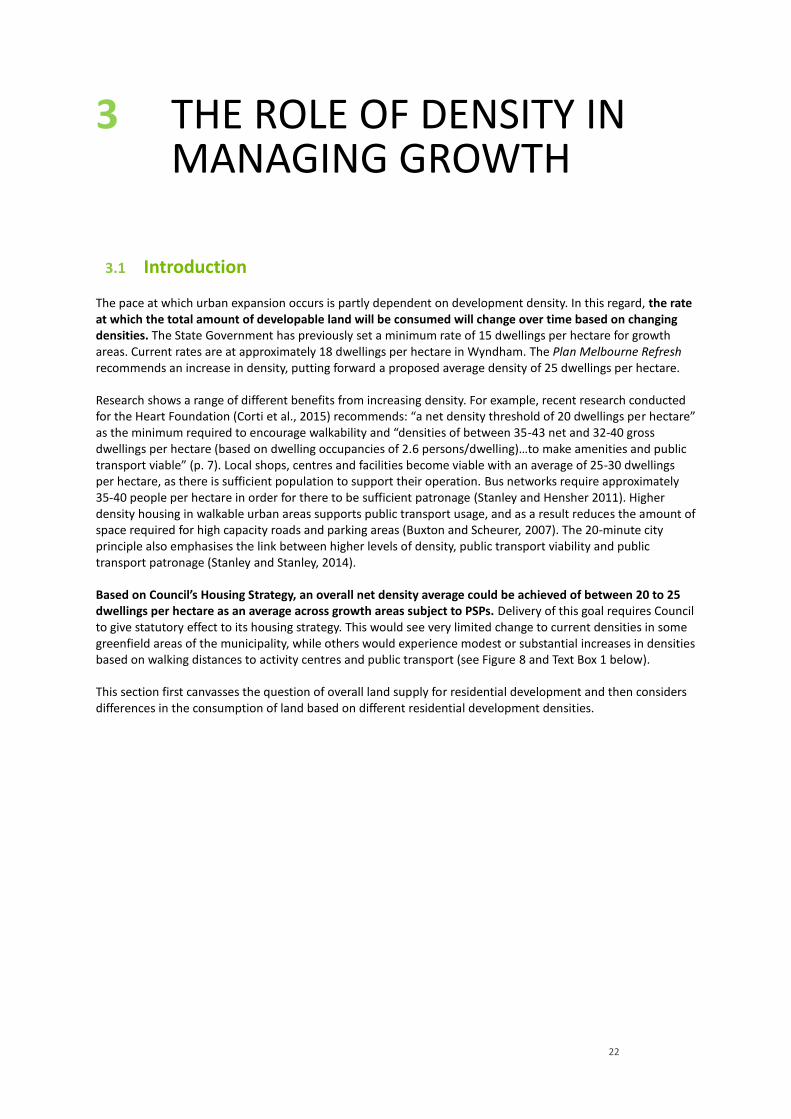
Based on Council’s Housing Strategy, an overall net density average could be achieved of between 20 to 25 dwellings per hectare as an average across growth areas subject to PSPs. Delivery of this goal requires Council to give statutory effect to its housing strategy. This would see very limited change to current densities in some greenfield areas of the municipality, while others would experience modest or substantial increases in densities based on walking distances to activity centres and public transport (see Figure 8 and Text Box 1 below).
This section first canvasses the question of overall land supply for residential development and then considers differences in the consumption of land based on different residential development densities.
23
FIGURE 7. RESIDENTIAL DENSITY FRAMEWORK, WYNDHAM H OUSING STRATEGY
Source: Wyndham City Council, 2015
24
3.2 Current land supply in Wyndham
Council supports the State Government’s objective of having sufficient competition in the market and land supply to avoid detrimental impacts on housing affordability. Currently this takes the form of a target to have a 15 year supply of “development ready” land with planning for another 20 years of future development. The Growth Corridor Plan allocated enough land for over 30 years land supply.
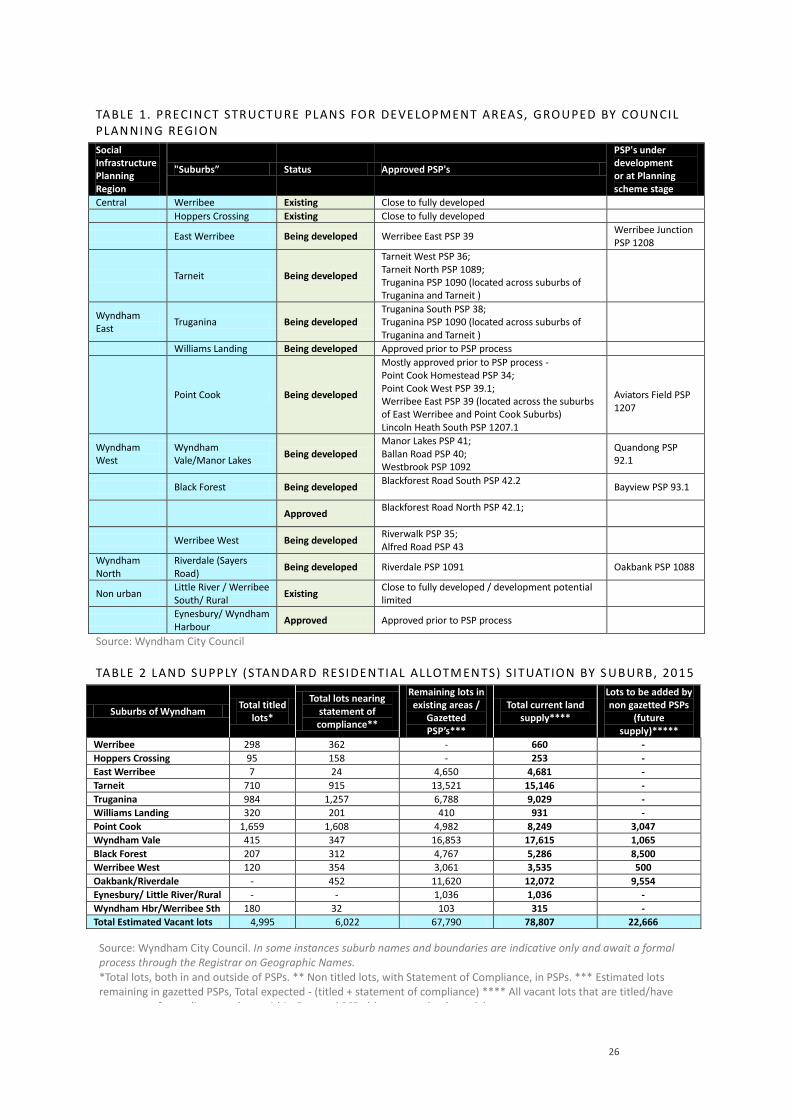
The current lot supply situation (see Table 2) is generous with 78,807 home sites currently vacant, already approved or planned for in Wyndham. This includes lots within existing PSPs and outside of PSPs. It does not include lots that are anticipated to be added by non-gazetted PSPs. These home sites are mainly located in the suburbs of Point Cook, Tarneit, Truganina, Wyndham Vale/Manor Lakes, Hoppers Crossing and Werribee.
There are almost 5,000 existing vacant titled residential lots of less than 1000m² yet to be developed i.e. about 7% of existing house blocks in built up areas of Wyndham are vacant. There is a further 485ha land supply that has been unlocked for development within PSPs but not yet subdivided, providing a further capacity of 8,309 dwellings (Refer to Table 2). In addition, there are another 67,790 lots in existing or gazetted (approved) PSP areas.
These new areas provide approximately another 23 years housing supply based on the average growth rate. Furthermore, 22,666 lots are anticipated to be added by non-gazetted PSPs which will provide a further 7 years supply. The current strong lot supply of already approved PSPs means these new development areas will not start for some years OR there is the prospect of disjointed, piecemeal development across the municipality, accompanied by extra costs.
Smaller communities are emerging in the township of Werribee South (Wyndham Harbour). There is minimal residential growth capacity in the non-urban areas of Wyndham. The only future growth areas not seeing any development as yet are Bayview, Quandong, Oakbank and Aviators Field, which await PSP development and approval. The growing community of Eynesbury in Melton is not impacting on Wyndham’s urban growth due to a current lack of road links.
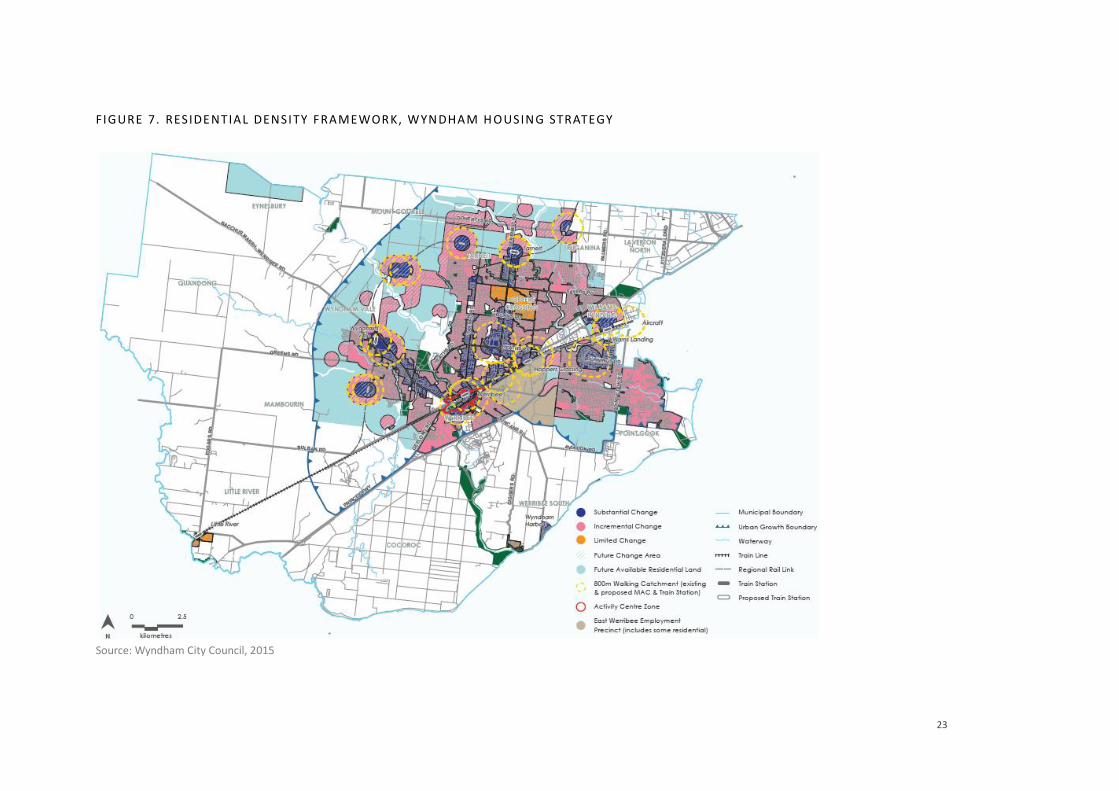
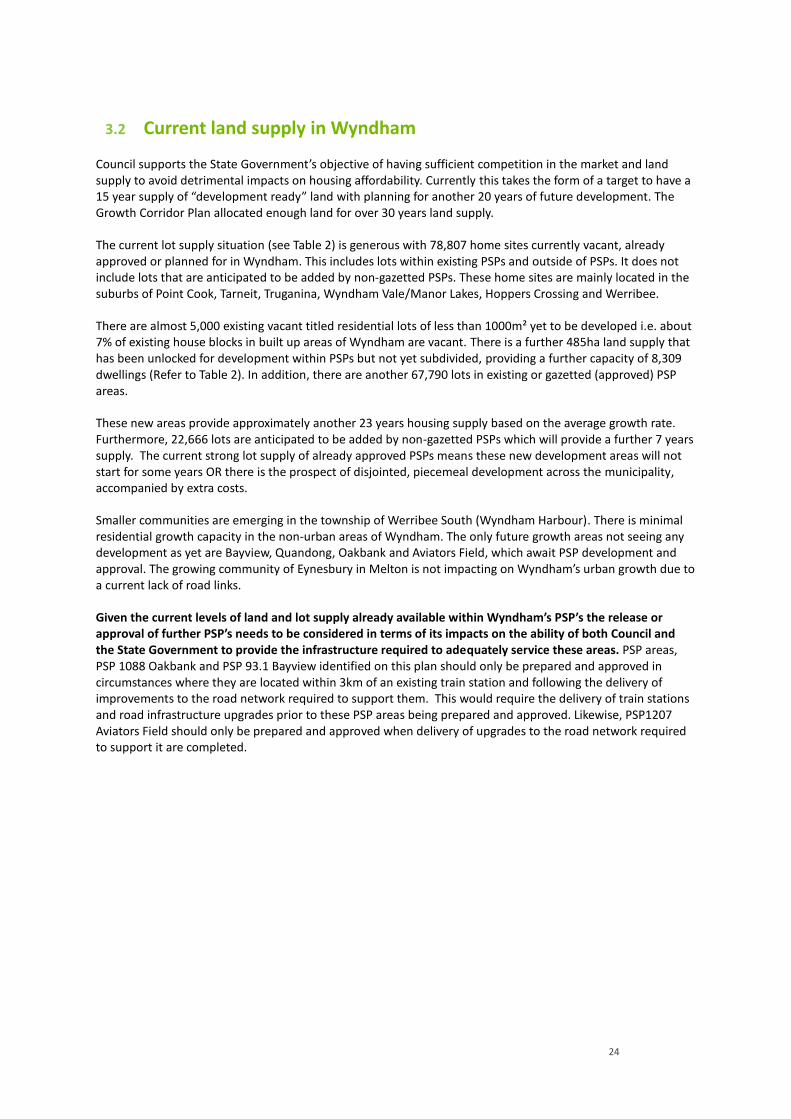
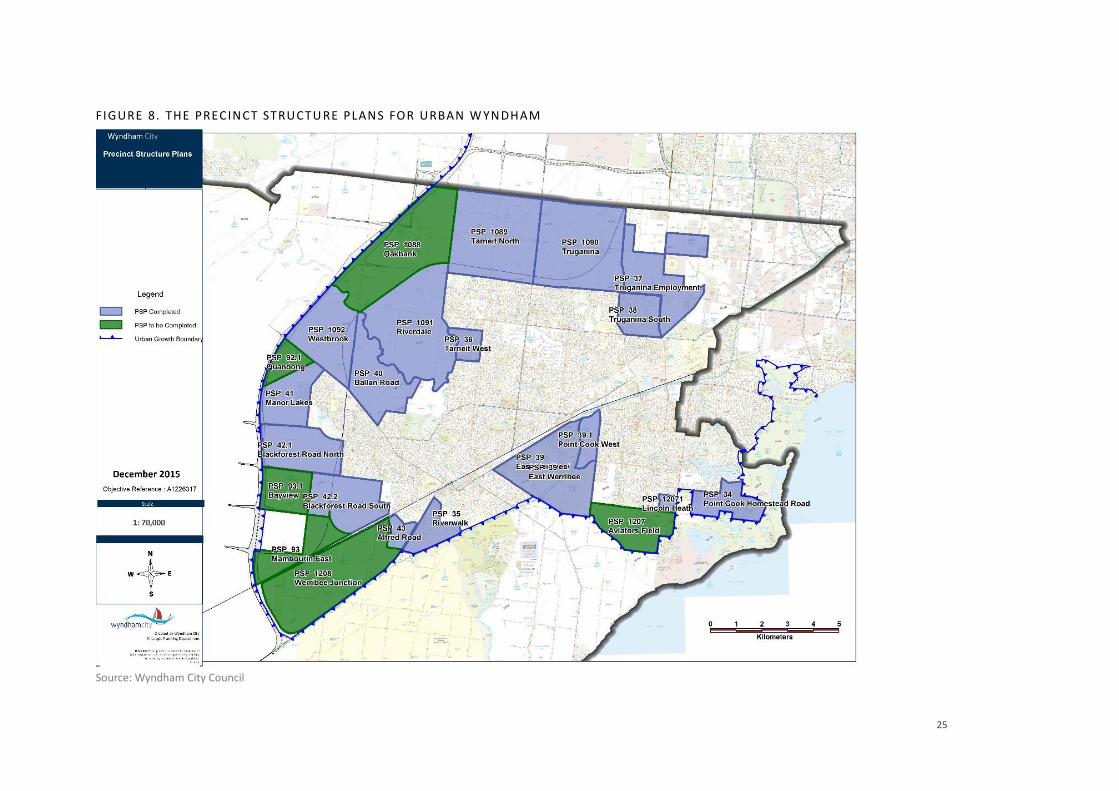
Given the current levels of land and lot supply already available within Wyndham’s PSP’s the release or approval of further PSP’s needs to be considered in terms of its impacts on the ability of both Council and the State Government to provide the infrastructure required to adequately service these areas. PSP areas, PSP 1088 Oakbank and PSP 93.1 Bayview identified on this plan should only be prepared and approved in circumstances where they are located within 3km of an existing train station and following the delivery of improvements to the road network required to support them. This would require the delivery of train stations and road infrastructure upgrades prior to these PSP areas being prepared and approved. Likewise, PSP1207 Aviators Field should only be prepared and approved when delivery of upgrades to the road network required to support it are completed.
25
FIGURE 8. THE PRECINCT STRUCTU RE PLANS FOR URBAN W YNDHAM
Source: Wyndham City Council
26
TABLE 1. PRECINCT STRUCTURE PLANS FOR DEVELOPMENT AREAS, GROUPED BY COUNCIL PLANNING REGION Social Infrastructure Planning Region
"Suburbs” Status Approved PSP's
PSP's under development or at Planning scheme stage
Central Werribee Existing Close to fully developed
Hoppers Crossing Existing Close to fully developed
East Werribee Being developed Werribee East PSP 39 Werribee Junction PSP 1208
Tarneit Being developed
Tarneit West PSP 36; Tarneit North PSP 1089; Truganina PSP 1090 (located across suburbs of Truganina and Tarneit )
Wyndham East
Truganina Being developed Truganina South PSP 38; Truganina PSP 1090 (located across suburbs of Truganina and Tarneit )
Williams Landing Being developed Approved prior to PSP process
Point Cook Being developed
Mostly approved prior to PSP process - Point Cook Homestead PSP 34; Point Cook West PSP 39.1; Werribee East PSP 39 (located across the suburbs of East Werribee and Point Cook Suburbs) Lincoln Heath South PSP 1207.1
Aviators Field PSP 1207
Wyndham West
Wyndham Vale/Manor Lakes
Being developed Manor Lakes PSP 41; Ballan Road PSP 40; Westbrook PSP 1092
Quandong PSP 92.1
Black Forest Being developed Blackforest Road South PSP 42.2
Bayview PSP 93.1
Approved Blackforest Road North PSP 42.1;
Werribee West Being developed Riverwalk PSP 35; Alfred Road PSP 43
Wyndham North
Riverdale (Sayers Road)
Being developed Riverdale PSP 1091 Oakbank PSP 1088
Non urban Little River / Werribee South/ Rural
Existing Close to fully developed / development potential limited
Eynesbury/ Wyndham Harbour
Approved Approved prior to PSP process
Source: Wyndham City Council
TABLE 2 LAND SUPPLY (STANDAR D RESIDENTIAL ALLOTM ENTS) SITUATION BY S UBURB, 2015
Suburbs of Wyndham Total titled
lots*
Total lots nearing statement of compliance**
Remaining lots in existing areas /
Gazetted PSP’s***
Total current land supply****
Lots to be added by non gazetted PSPs
(future supply)*****
Werribee 298 362 - 660 -
Hoppers Crossing 95 158 - 253 -
East Werribee 7 24 4,650 4,681 -
Tarneit 710 915 13,521 15,146 -
Truganina 984 1,257 6,788 9,029 -
Williams Landing 320 201 410 931 -
Point Cook 1,659 1,608 4,982 8,249 3,047
Wyndham Vale 415 347 16,853 17,615 1,065
Black Forest 207 312 4,767 5,286 8,500
Werribee West 120 354 3,061 3,535 500
Oakbank/Riverdale - 452 11,620 12,072 9,554
Eynesbury/ Little River/Rural - - 1,036 1,036 -
Wyndham Hbr/Werribee Sth 180 32 103 315 -
Total Estimated Vacant lots 4,995 6,022 67,790 78,807 22,666
Source: Wyndham City Council. In some instances suburb names and boundaries are indicative only and await a formal process through the Registrar on Geographic Names. *Total lots, both in and outside of PSPs. ** Non titled lots, with Statement of Compliance, in PSPs. *** Estimated lots remaining in gazetted PSPs, Total expected - (titled + statement of compliance) **** All vacant lots that are titled/have statement of compliance and are within Gazetted PSPs (the current land supply)
27
3.3 Density and land consumption in Wyndham
Density is one factor that contributes to the number of net developable hectares required to accommodate an equivalent population. At present, development densities in greenfield areas in Wyndham average 18 dwelling units per hectare. This is higher than the planned net density of 15 dwellings per hectare in the PSPs; 15 dwellings per hectare is conservative and with infrastructure and non-residential services estimated as occupying 35% of total land area, this equates to an average lot size of approximately 433 metres. Current average lot sizes are 417 metres. This indicates that the density forecast within PSPs is low and does not reflect market trends. At present, Plan Melbourne is under review and one possibility under consideration is an increase to overall average densities from 15 to 25 dwellings per hectare (Plan Melbourne Refresh, 2015). Council’s Housing Strategy promotes an overall density of over 20 dwellings per hectare (See Text Box 1. Housing Strategy Overview below), achieved by targeting an increase in infill in designated areas and substantially increasing densities around major transport and employment nodes (see below).
At higher densities, less land is required to be developed over a comparable timeframe to accommodate the same population and more land is opened up for future residential development in the long term. In public policy terms, the fact this land is approved for development from an urban planning perspective but will not be taken up as quickly, is a positive situation. In line with Government policy intentions, a lift in targeted densities effectively expands the reserve stock of developable land, creating still greater competitive tension in the land market and supporting housing affordability objectives.
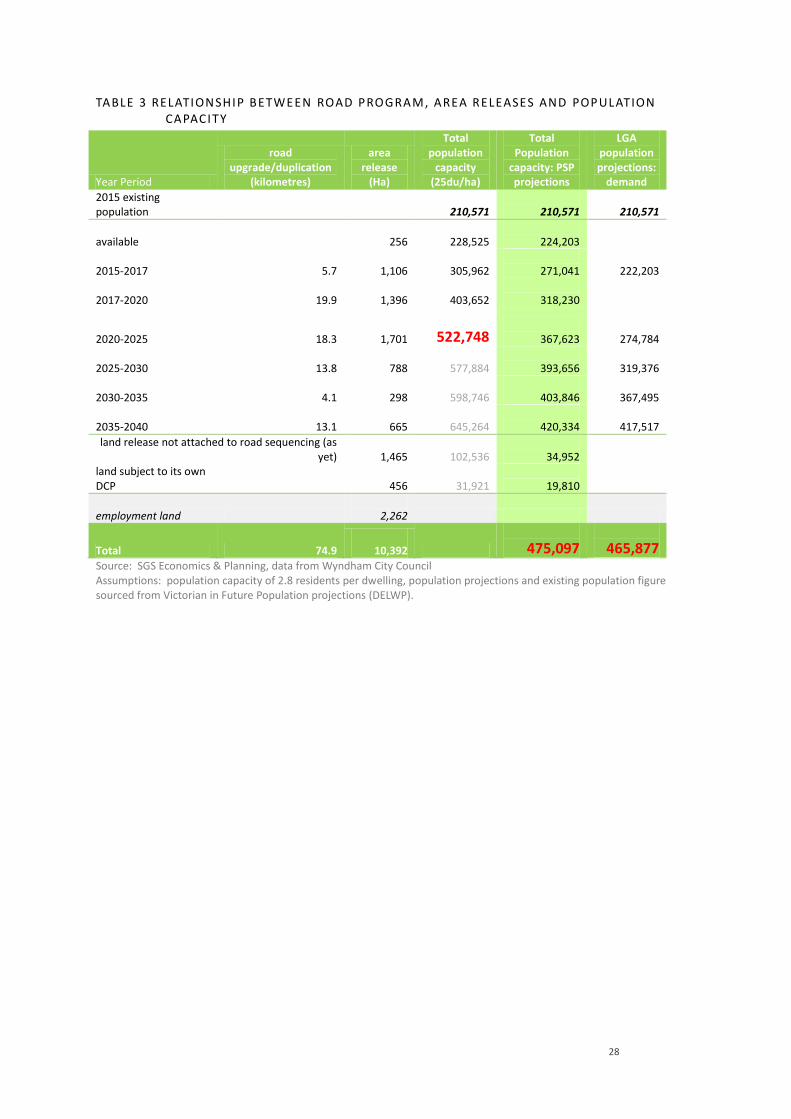
By marginally increasing density, savings in infrastructure costs in terms of production and operation will be realised. However, it should be noted that while higher densities enhance service provision synergies, the capacity of governments to service growth from their budgets is directly linked to their capacity to raise funds for infrastructure. Currently, development contributions are collected on an area basis as opposed to dwelling basis (with the exception of the CIL which is collected on a per dwelling basis), which limits Councils’ capacity to recover costs. An average of 20-25 dwelling units per hectare has been used in this RGMS, though this should be reviewed in future in line with market trends, government policy and research findings on delivering efficient and health-promoting neighbourhoods. Table 3 displays the relationship between road releases (as currently anticipated by Council), land releases and population capacity. Road releases are highlighted because the construction or upgrade of major roads is, more often than not, the key to the development of land in PSPs. The table analyses two different densities of housing provision, (25 dwelling units per hectare and the estimates included in PSPs) and compares these with Wyndham population projections. Highlighted within this table are the road and land releases required to meet population targets.
28
TABLE 3 RELATIONSHIP BETWEEN ROAD PROGRAM, AREA RELEASES AND POPULATION CAPACITY
Year Period
road upgrade/duplication
(kilometres)
area release
(Ha)
Total population
capacity (25du/ha)
Total Population
capacity: PSP projections
LGA population projections:
demand
2015 existing population
210,571
210,571
210,571
available
256
228,525
224,203
2015-2017 5.7
1,106
305,962
271,041
222,203
2017-2020 19.9
1,396
403,652
318,230
2020-2025 18.3
1,701
522,748
367,623
274,784
2025-2030 13.8
788
577,884
393,656
319,376
2030-2035 4.1
298
598,746
403,846
367,495
2035-2040 13.1
665
645,264
420,334
417,517
land release not attached to road sequencing (as yet)
1,465
102,536
34,952
land subject to its own DCP
456
31,921
19,810
employment land
2,262
Total 74.9
10,392
475,097
465,877 Source: SGS Economics & Planning, data from Wyndham City Council Assumptions: population capacity of 2.8 residents per dwelling, population projections and existing population figure sourced from Victorian in Future Population projections (DELWP).
29
Text Box 1. Housing Strategy Overview
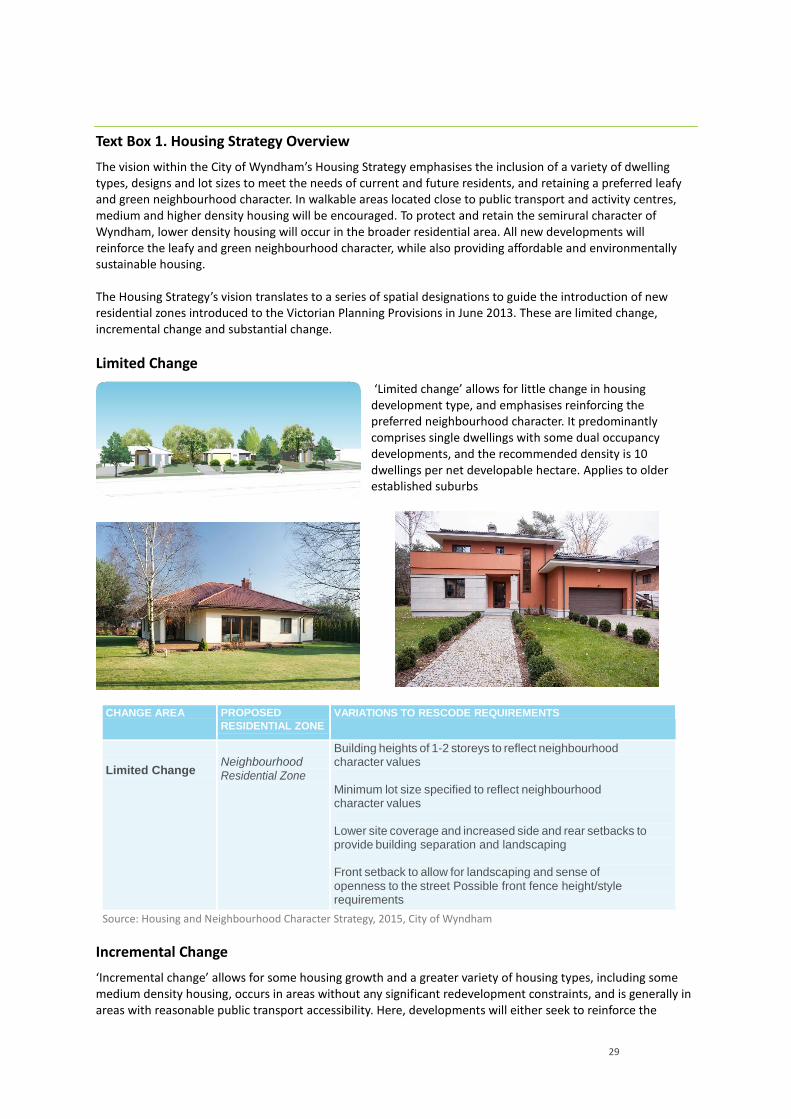
The vision within the City of Wyndham’s Housing Strategy emphasises the inclusion of a variety of dwelling types, designs and lot sizes to meet the needs of current and future residents, and retaining a preferred leafy and green neighbourhood character. In walkable areas located close to public transport and activity centres, medium and higher density housing will be encouraged. To protect and retain the semirural character of Wyndham, lower density housing will occur in the broader residential area. All new developments will reinforce the leafy and green neighbourhood character, while also providing affordable and environmentally sustainable housing. The Housing Strategy’s vision translates to a series of spatial designations to guide the introduction of new residential zones introduced to the Victorian Planning Provisions in June 2013. These are limited change, incremental change and substantial change.
Limited Change
‘Limited change’ allows for little change in housing development type, and emphasises reinforcing the preferred neighbourhood character. It predominantly comprises single dwellings with some dual occupancy developments, and the recommended density is 10 dwellings per net developable hectare. Applies to older established suburbs
CHANGE AREA PROPOSED
RESIDENTIAL ZONE VARIATIONS TO RESCODE REQUIREMENTS
Limited Change
Neighbourhood Residential Zone
Building heights of 1-2 storeys to reflect neighbourhood character values Minimum lot size specified to reflect neighbourhood character values Lower site coverage and increased side and rear setbacks to provide building separation and landscaping Front setback to allow for landscaping and sense of openness to the street Possible front fence height/style requirements
Source: Housing and Neighbourhood Character Strategy, 2015, City of Wyndham
Incremental Change
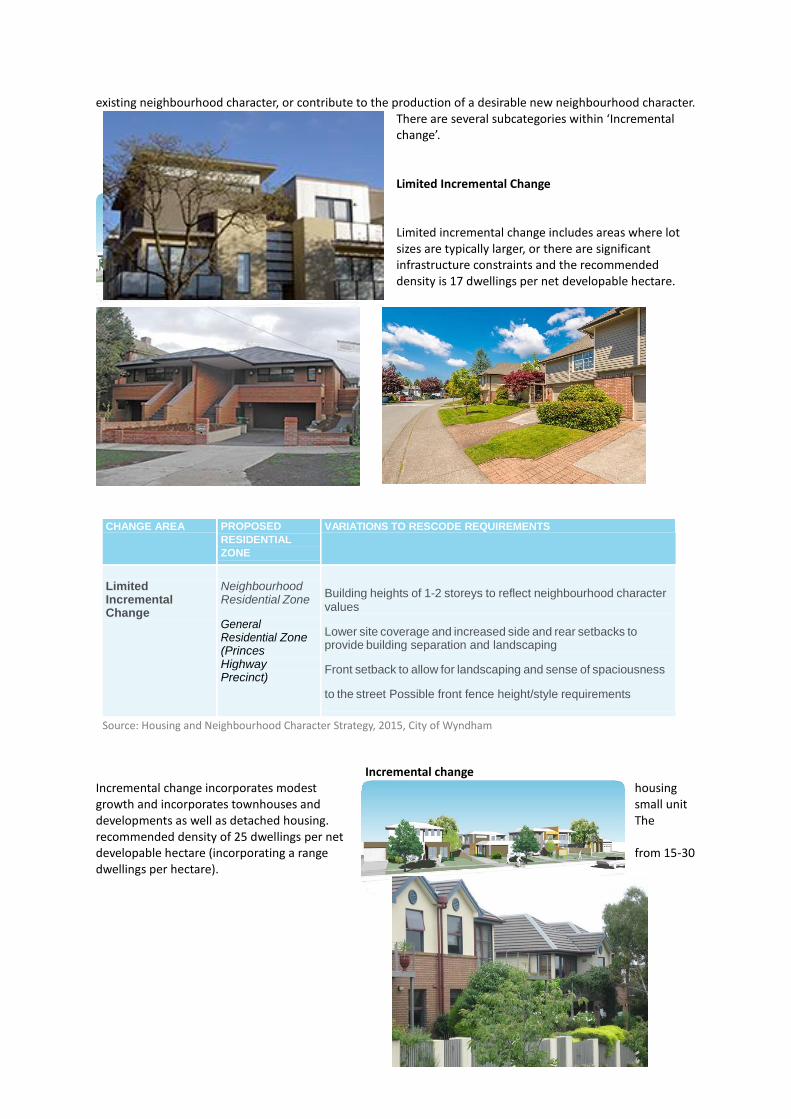
‘Incremental change’ allows for some housing growth and a greater variety of housing types, including some medium density housing, occurs in areas without any significant redevelopment constraints, and is generally in areas with reasonable public transport accessibility. Here, developments will either seek to reinforce the
30
existing neighbourhood character, or contribute to the production of a desirable new neighbourhood character. There are several subcategories within ‘Incremental change’. Limited Incremental Change Limited incremental change includes areas where lot sizes are typically larger, or there are significant infrastructure constraints and the recommended density is 17 dwellings per net developable hectare.
CHANGE AREA PROPOSED
RESIDENTIAL
ZONE
VARIATIONS TO RESCODE REQUIREMENTS
Limited Incremental Change
Neighbourhood Residential Zone
General Residential Zone (Princes Highway Precinct)
Building heights of 1-2 storeys to reflect neighbourhood character values
Lower site coverage and increased side and rear setbacks to provide building separation and landscaping
Front setback to allow for landscaping and sense of spaciousness
to the street Possible front fence height/style requirements
Source: Housing and Neighbourhood Character Strategy, 2015, City of Wyndham
Incremental change
Incremental change incorporates modest housing growth and incorporates townhouses and small unit developments as well as detached housing. The recommended density of 25 dwellings per net developable hectare (incorporating a range from 15-30 dwellings per hectare).
31
CHANGE AREA PROPOSED
RESIDENTIAL
ZONE
VARIATIONS TO RESCODE REQUIREMENTS
Incremental Change
General Residential Zone
Building heights of 1-2 storeys to reflect the existing scale of residential development
Increased side and rear setbacks to provide building separation and landscaping
Possible front fence height/style requirements
Source: Housing and Neighbourhood Character Strategy, 2015, City of Wyndham
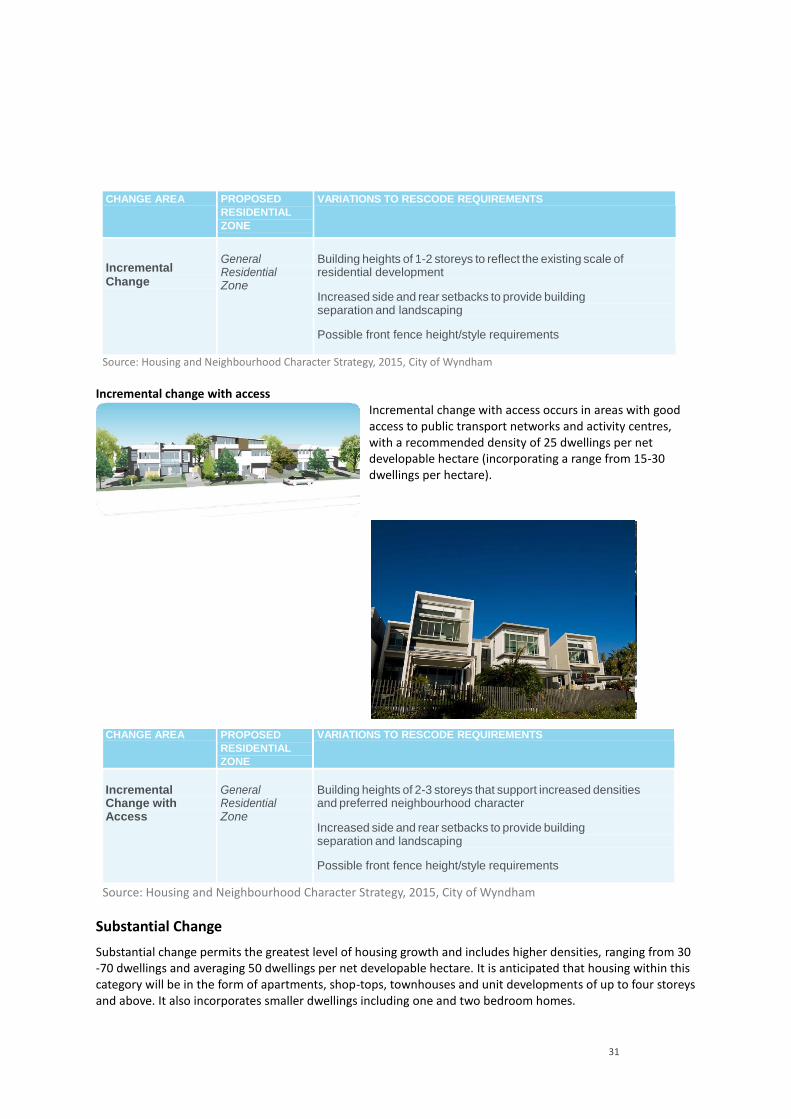
Incremental change with access
Incremental change with access occurs in areas with good access to public transport networks and activity centres, with a recommended density of 25 dwellings per net developable hectare (incorporating a range from 15-30 dwellings per hectare).
CHANGE AREA PROPOSED
RESIDENTIAL
ZONE
VARIATIONS TO RESCODE REQUIREMENTS
Incremental Change with Access
General Residential Zone
Building heights of 2-3 storeys that support increased densities and preferred neighbourhood character
Increased side and rear setbacks to provide building separation and landscaping
Possible front fence height/style requirements
Source: Housing and Neighbourhood Character Strategy, 2015, City of Wyndham
Substantial Change
Substantial change permits the greatest level of housing growth and includes higher densities, ranging from 30 -70 dwellings and averaging 50 dwellings per net developable hectare. It is anticipated that housing within this category will be in the form of apartments, shop-tops, townhouses and unit developments of up to four storeys and above. It also incorporates smaller dwellings including one and two bedroom homes.
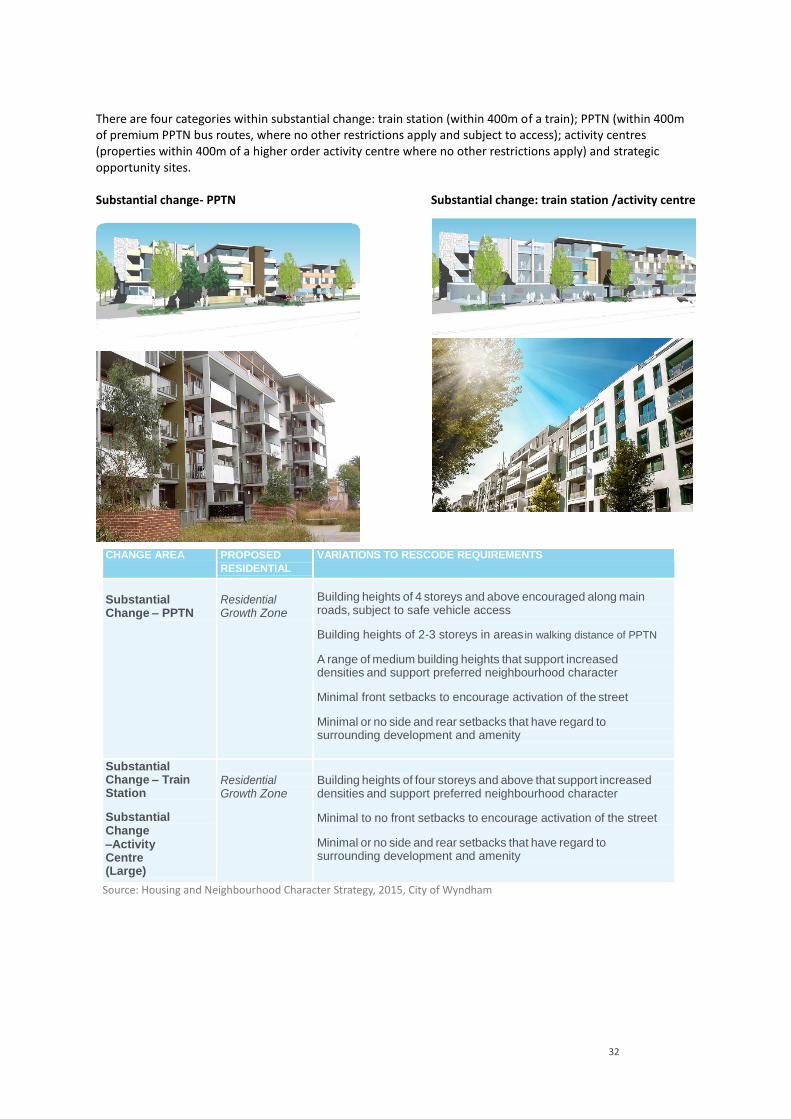
32
There are four categories within substantial change: train station (within 400m of a train); PPTN (within 400m of premium PPTN bus routes, where no other restrictions apply and subject to access); activity centres (properties within 400m of a higher order activity centre where no other restrictions apply) and strategic opportunity sites. Substantial change- PPTN Substantial change: train station /activity centre
CHANGE AREA PROPOSED
RESIDENTIAL
ZONE
VARIATIONS TO RESCODE REQUIREMENTS
Substantial Change – PPTN
Residential Growth Zone
Building heights of 4 storeys and above encouraged along main roads, subject to safe vehicle access
Building heights of 2-3 storeys in areas in walking distance of PPTN
A range of medium building heights that support increased densities and support preferred neighbourhood character
Minimal front setbacks to encourage activation of the street
Minimal or no side and rear setbacks that have regard to surrounding development and amenity
Substantial Change – Train Station
Substantial Change –Activity Centre (Large)
Residential Growth Zone
Building heights of four storeys and above that support increased densities and support preferred neighbourhood character
Minimal to no front setbacks to encourage activation of the street
Minimal or no side and rear setbacks that have regard to surrounding development and amenity
Source: Housing and Neighbourhood Character Strategy, 2015, City of Wyndham
33
4 THE ROLE OF SEQUENCING IN MANAGING GROWTH
4.1 Introduction
The role of sequencing development in managing growth has received increasing attention in Victoria. Background Paper 1 ‘Managing Growth’ for the Plan Melbourne Refresh (2015) outlines a clear policy direction towards coordinating infrastructure across levels of government and for ensuring timely delivery of infrastructure. The paper states “Coordinated and integrated sequencing of funds and infrastructure from the different levels of government, partner agencies and the private sector is a priority” (Victorian Government, 2015, p.5). As mentioned above, the Plan Melbourne Refresh contains a series of options to promote increased densities as well as development staging in growth areas. In addition to recent support for development sequencing, the State Planning Policy Framework (SPPF) also provides a framework for delivering viable communities with adequate staging of development in line with infrastructure provision. In particular, one of the strategies relating to the supply of urban land is to “ensure the ongoing provision of land and supporting infrastructure to support sustainable urban development” (Clause 11, p.3). Furthermore, the SPPF stipulates the following strategy in growth areas:
Deliver timely and adequate provision of public transport and local and regional infrastructure, in line with a preferred sequence of land release (Clause 11, p.4).
While these provisions exist within the SPPF, they have not yet been given effect by the State Government. Furthermore, there is no preferred sequence of land release in the PSP’s which have already been approved within Wyndham. The issue of sequential development was debated at some length during the 2014 Planning Panel hearing on Wyndham Planning Scheme Amendments C175, C176, C177. Conclusions reached by the Planning Panel were as follows:
Where and when development occurs should be broadly market driven;
Orderly planning is facilitated by the ability of Council (and the MPA) to appropriately assess development applications within a PSP, including applications for out of sequence development;
The Council’s Strategy for managing growth in Wyndham is not appropriate to use in its current form;
Criteria to allow managing the sequencing of development are needed and are most appropriately based on the criteria used to assess the s96A applications exhibited with the current Amendments; and
A mechanism needs to be established to give agreed criteria appropriate statutory weight. Based on the above, it was recommended by the Planning Panel that:
E1. The MPA engage with Council to develop criteria that can be used to assess future applications for subdivision, and that these be based on the criteria used by the MPA in assessing the applications made under section 96A of the Planning and Environment Act 1987 and considered as part of the current process.
E2. The Council or the MPA, as relevant, develop and implement an appropriate mechanism to give the agreed assessment criteria statutory weight.

34
There has thus far been little progress on the development of assessment criteria for managing the sequencing of development since the Panel handed down its recommendations. Council is now receiving applications that are arguably more out-of-sequence than those considered by the Panel. In these circumstances, in addition to pursuing the recommendations of the Panel, it is important for Council to consider all options for encouraging the most orderly development sequence possible, under existing arrangements, to ensure the roll out of development aligns with the delivery of infrastructure to the greatest extent possible. This RGMS seeks to provide a framework for sequencing that would support the development of criteria with statutory weight.. AT the local level, Council’s Municipal Strategic Statement (MSS) has a policy basis “to achieve cost-effective and orderly management of urban growth.” A number of strategies to achieve this objective are set out in the Statement to achieve cost effective and orderly management of urban growth, including:
Ensure that residential growth aligns with the delivery of key infrastructure items and the delivery of economic and employment growth;
Provide for growth on a scale and form consistent with maintaining the containment, compactness, accessibility and affordability of key growth areas;
Provide for new development to occur in areas that are not isolated from the core urban area and which integrate well with existing communities and infrastructure; and
Support new development in areas where sufficient infrastructure can be provided.
Given that most PSPs are now in place, a key issue is to stage planned development to achieve the most orderly outcome and to ensure the objective of completing infrastructure early in the development cycle is being achieved in each case. This section contains a description of the principles and methodology of a preferred approach to development sequencing at the macro level across all PSPs in the City of Wyndham.
4.2 Identifying a benchmark sequence of development
The benchmark sequence of development across the PSPs in Wyndham should be closely linked to the upgrade of key road segments. This is not because road infrastructure is more important than other essential community needs, but rather that roads tend to be amongst the most expensive items in the suite of assets required to set up new communities and, moreover, they are required to physically render land developable at urban densities. The benchmark sequence of development has been developed into a macro-staging plan. The macro-staging plan in this RGMS (See Figure 10) incorporates roads as well as local community infrastructure and open space. It has also been adjusted to reflect current residential development patterns and subdivision approvals. This staging plan should be updated over time in consultation with State Government departments and agencies to determine the preferred sequence based on the combination of local and state infrastructure, like sanitation and school infrastructure. While Figure 10 presents the macro-staging plan at 25 dwelling units per hectare, Figure 9 represents a macro-staging plan at PSP densities (15 dwelling units per hectare) as a past point of reference. This reiterates the function of density in managing growth and is an important consideration in sequencing development and infrastructure.

35
Figure 9 shows the area planned for development to meet population targets based on the PSP projections and density assumptions, as well as the road works required to enable this outcome. Figure 10 shows that, at a net density of 25 dwellings per hectare and the Council’s current road program, the forecast population projection for 2040 (around 470,000) could be comfortably reached with the release of just 50% of land currently scheduled for release in that timeframe (Table 3 above also highlights this difference).

36
FIGURE 9 LAND REQUIRED FOR 20 40 POPULATION TARGET S BASED ON P SP PROJECTIONS (15 DWELL ING UNITS P ER HECTARE)
Source: SGS Economics & Planning
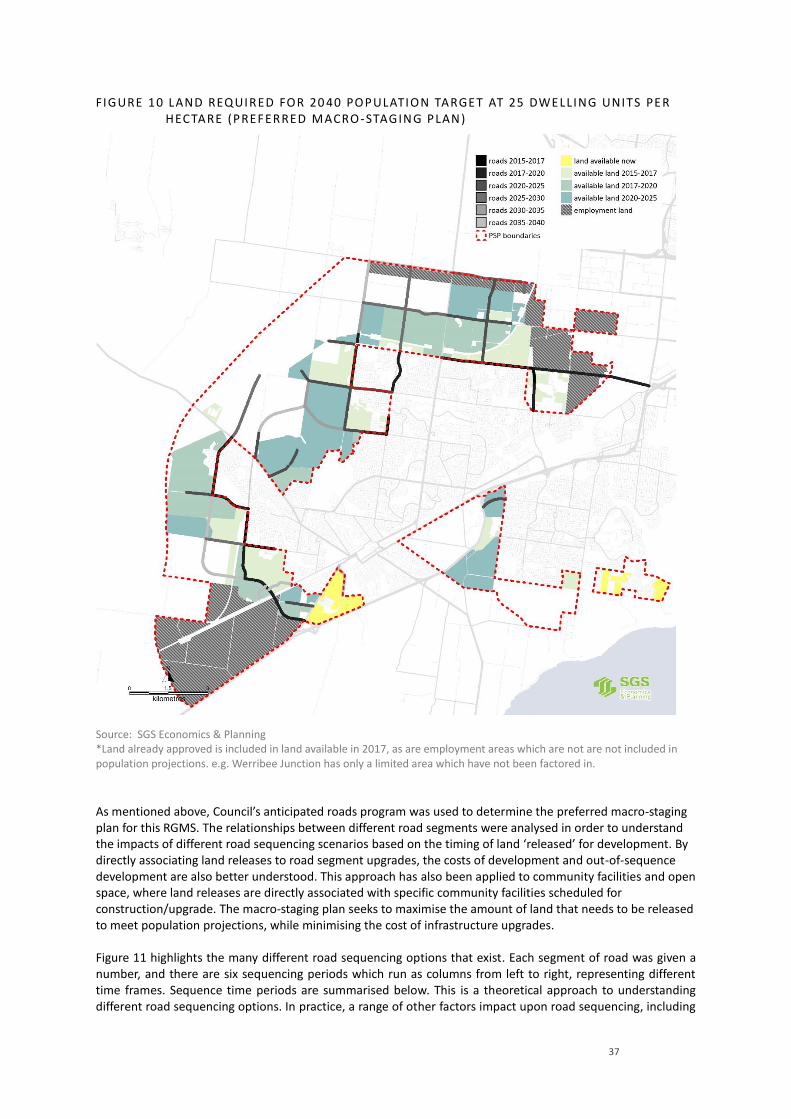
37
FIGURE 10 LAND REQUIRED FOR 20 40 POPULATION TARGET AT 25 DWELLING UNITS PER HECTARE (PREFERRED MACRO -STAGING PLAN)
Source: SGS Economics & Planning *Land already approved is included in land available in 2017, as are employment areas which are not are not included in population projections. e.g. Werribee Junction has only a limited area which have not been factored in.
As mentioned above, Council’s anticipated roads program was used to determine the preferred macro-staging plan for this RGMS. The relationships between different road segments were analysed in order to understand the impacts of different road sequencing scenarios based on the timing of land ‘released’ for development. By directly associating land releases to road segment upgrades, the costs of development and out-of-sequence development are also better understood. This approach has also been applied to community facilities and open space, where land releases are directly associated with specific community facilities scheduled for construction/upgrade. The macro-staging plan seeks to maximise the amount of land that needs to be released to meet population projections, while minimising the cost of infrastructure upgrades. Figure 11 highlights the many different road sequencing options that exist. Each segment of road was given a number, and there are six sequencing periods which run as columns from left to right, representing different time frames. Sequence time periods are summarised below. This is a theoretical approach to understanding different road sequencing options. In practice, a range of other factors impact upon road sequencing, including
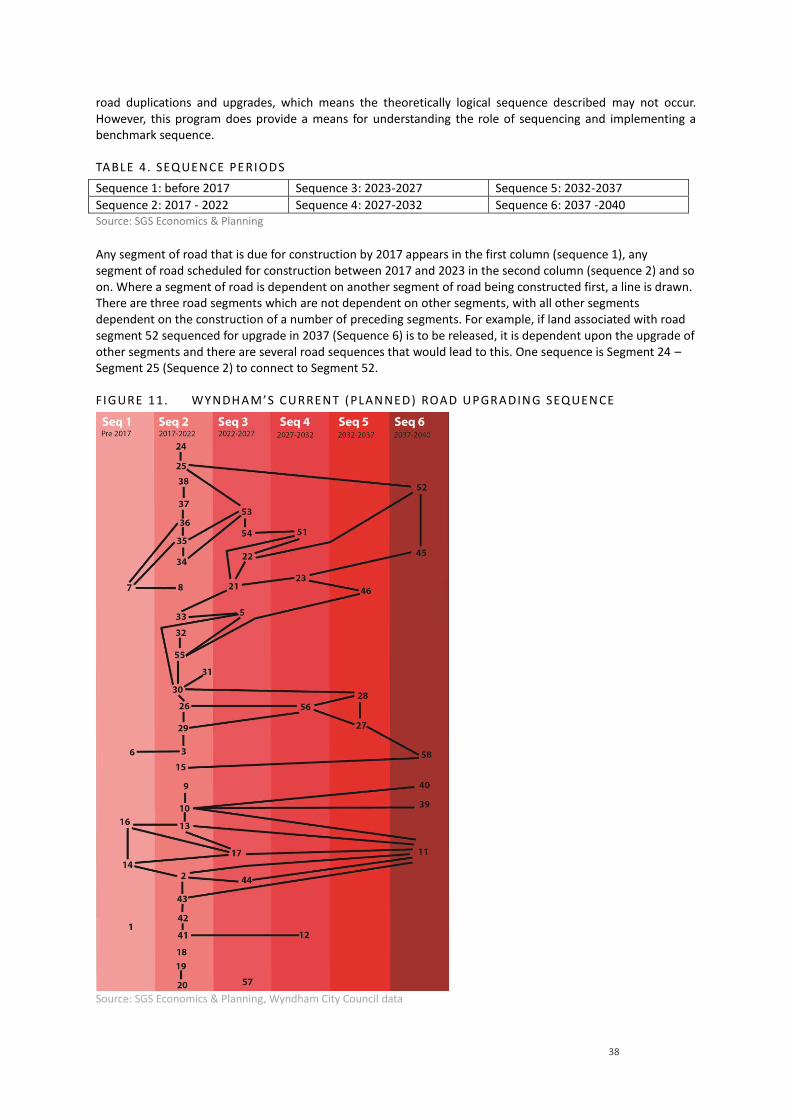
38
road duplications and upgrades, which means the theoretically logical sequence described may not occur. However, this program does provide a means for understanding the role of sequencing and implementing a benchmark sequence.
TABLE 4. SEQUENCE PERIODS
Sequence 1: before 2017 Sequence 3: 2023-2027 Sequence 5: 2032-2037
Sequence 2: 2017 - 2022 Sequence 4: 2027-2032 Sequence 6: 2037 -2040 Source: SGS Economics & Planning Any segment of road that is due for construction by 2017 appears in the first column (sequence 1), any segment of road scheduled for construction between 2017 and 2023 in the second column (sequence 2) and so on. Where a segment of road is dependent on another segment of road being constructed first, a line is drawn. There are three road segments which are not dependent on other segments, with all other segments dependent on the construction of a number of preceding segments. For example, if land associated with road segment 52 sequenced for upgrade in 2037 (Sequence 6) is to be released, it is dependent upon the upgrade of other segments and there are several road sequences that would lead to this. One sequence is Segment 24 – Segment 25 (Sequence 2) to connect to Segment 52.
FIGURE 11. WYNDHAM’S CURRENT (PLANNED) ROAD UPGRADING SEQUENCE
Source: SGS Economics & Planning, Wyndham City Council data

39
This approach allows for the evaluation of the cost of releasing particular land areas out-of-sequence, based on the road sequencing plan. Each segment of road is associated with a particular set of land releases and cost of upgrades, and analysis provides an insight into the cost effectiveness of different scenarios of road release sequencing. It also serves as an objective decision making framework to inform the response to out of sequence development. The costings of road segments is summarised in Table 5 below. The numbers reflect the costs of not only the roads, but also of open space and community infrastructure associated with the concomitant land development. For each segment, there are two costings. Initially, there is the ‘Nominal Cost’, which reflects the outlay required to deliver the project in the present day (2015/16 financial year). This only applies to a small number of road segments – those which are actually expected to be delivered within the next year or so. For such projects, the Nominal Cost is equivalent to the present value cost – see discussion below. The remainder of projects are expected to be rolled out in sequence over the next 30 years. These projects, whilst expensive, are expected to be paid for in the future (over that period). Any costs which Council incur in the future should be discounted back to the present day because one dollar in 10 years’ time is worth less than one dollar today. This explains the other cost column – the ‘PV Cost’, or Present Value Cost. The Present Value is the value of the expected cost stream determined as of the date of valuation (in 2015/16). This column is important for the purposes of sequencing in the growth areas because it reflects the fact that any infrastructure which must be delivered earlier effectively becomes more expensive for Council and its ratepayers. In this table a 5% real discount rate (net of inflation) has been applied. It is reflective of a number of relevant factors including (principally) the cost of obtaining such large volumes of finance and the forgone opportunity to use that capital for other purposes such as service delivery. This method has been applied to road segment upgrades given the high cost of this infrastructure. It can be applied to all classes of infrastructure, both State and Local, where necessary to change the lead infrastructure used for determining the sequence.
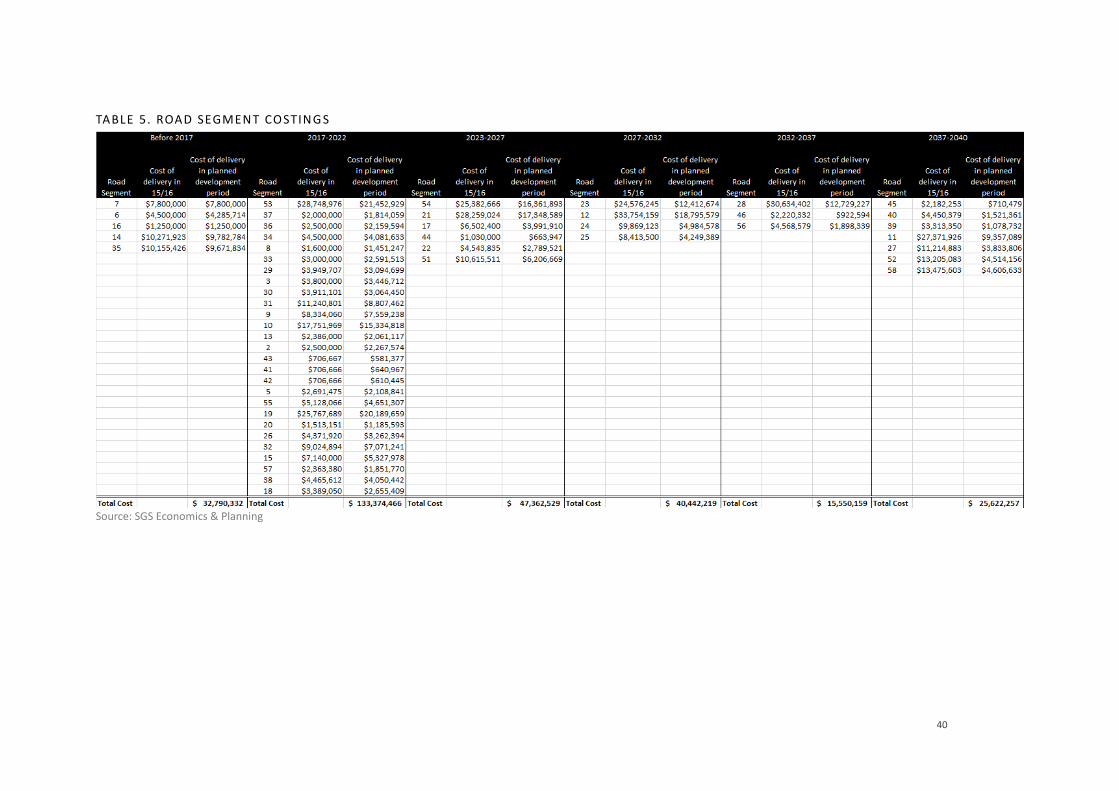
40
TABLE 5. ROAD SEGMENT COSTING S
Source: SGS Economics & Planning
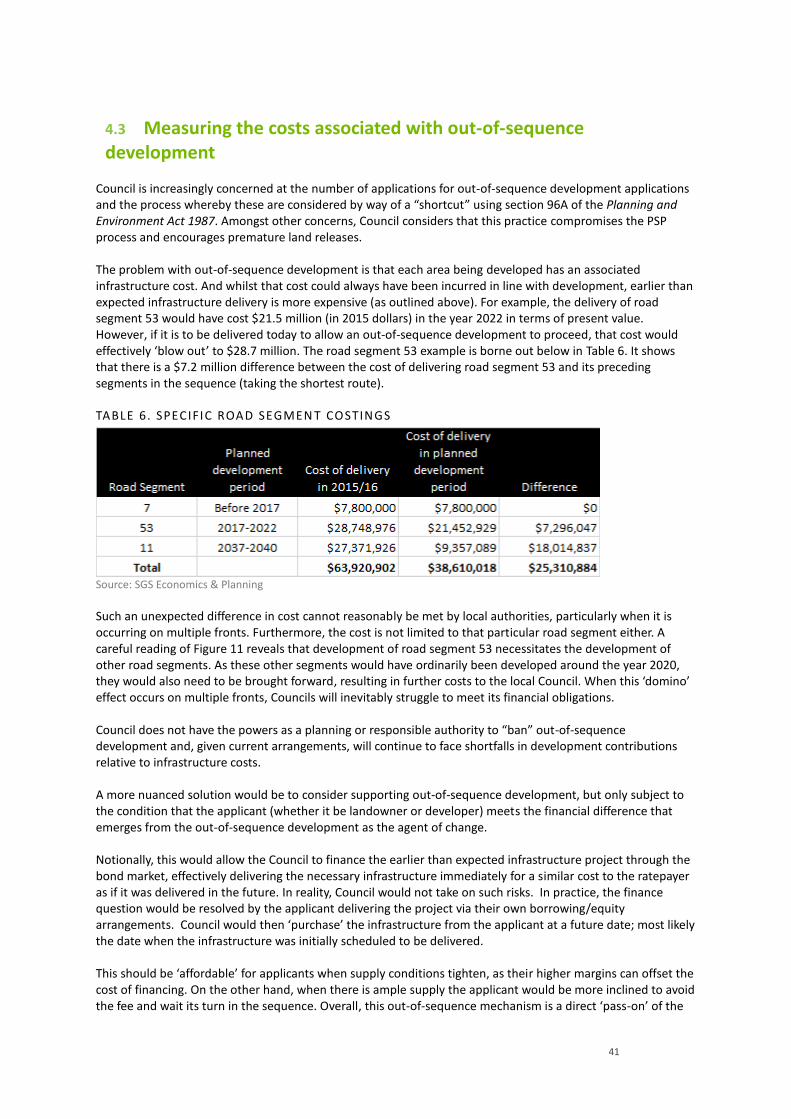
41
4.3 Measuring the costs associated with out-of-sequence development
Council is increasingly concerned at the number of applications for out-of-sequence development applications and the process whereby these are considered by way of a “shortcut” using section 96A of the Planning and Environment Act 1987. Amongst other concerns, Council considers that this practice compromises the PSP process and encourages premature land releases. The problem with out-of-sequence development is that each area being developed has an associated infrastructure cost. And whilst that cost could always have been incurred in line with development, earlier than expected infrastructure delivery is more expensive (as outlined above). For example, the delivery of road segment 53 would have cost $21.5 million (in 2015 dollars) in the year 2022 in terms of present value. However, if it is to be delivered today to allow an out-of-sequence development to proceed, that cost would effectively ‘blow out’ to $28.7 million. The road segment 53 example is borne out below in Table 6. It shows that there is a $7.2 million difference between the cost of delivering road segment 53 and its preceding segments in the sequence (taking the shortest route).
TABLE 6. SPECIFIC ROAD SEGMEN T COSTINGS
Source: SGS Economics & Planning
Such an unexpected difference in cost cannot reasonably be met by local authorities, particularly when it is occurring on multiple fronts. Furthermore, the cost is not limited to that particular road segment either. A careful reading of Figure 11 reveals that development of road segment 53 necessitates the development of other road segments. As these other segments would have ordinarily been developed around the year 2020, they would also need to be brought forward, resulting in further costs to the local Council. When this ‘domino’ effect occurs on multiple fronts, Councils will inevitably struggle to meet its financial obligations. Council does not have the powers as a planning or responsible authority to “ban” out-of-sequence development and, given current arrangements, will continue to face shortfalls in development contributions relative to infrastructure costs. A more nuanced solution would be to consider supporting out-of-sequence development, but only subject to the condition that the applicant (whether it be landowner or developer) meets the financial difference that emerges from the out-of-sequence development as the agent of change. Notionally, this would allow the Council to finance the earlier than expected infrastructure project through the bond market, effectively delivering the necessary infrastructure immediately for a similar cost to the ratepayer as if it was delivered in the future. In reality, Council would not take on such risks. In practice, the finance question would be resolved by the applicant delivering the project via their own borrowing/equity arrangements. Council would then ‘purchase’ the infrastructure from the applicant at a future date; most likely the date when the infrastructure was initially scheduled to be delivered. This should be ‘affordable’ for applicants when supply conditions tighten, as their higher margins can offset the cost of financing. On the other hand, when there is ample supply the applicant would be more inclined to avoid the fee and wait its turn in the sequence. Overall, this out-of-sequence mechanism is a direct ‘pass-on’ of the
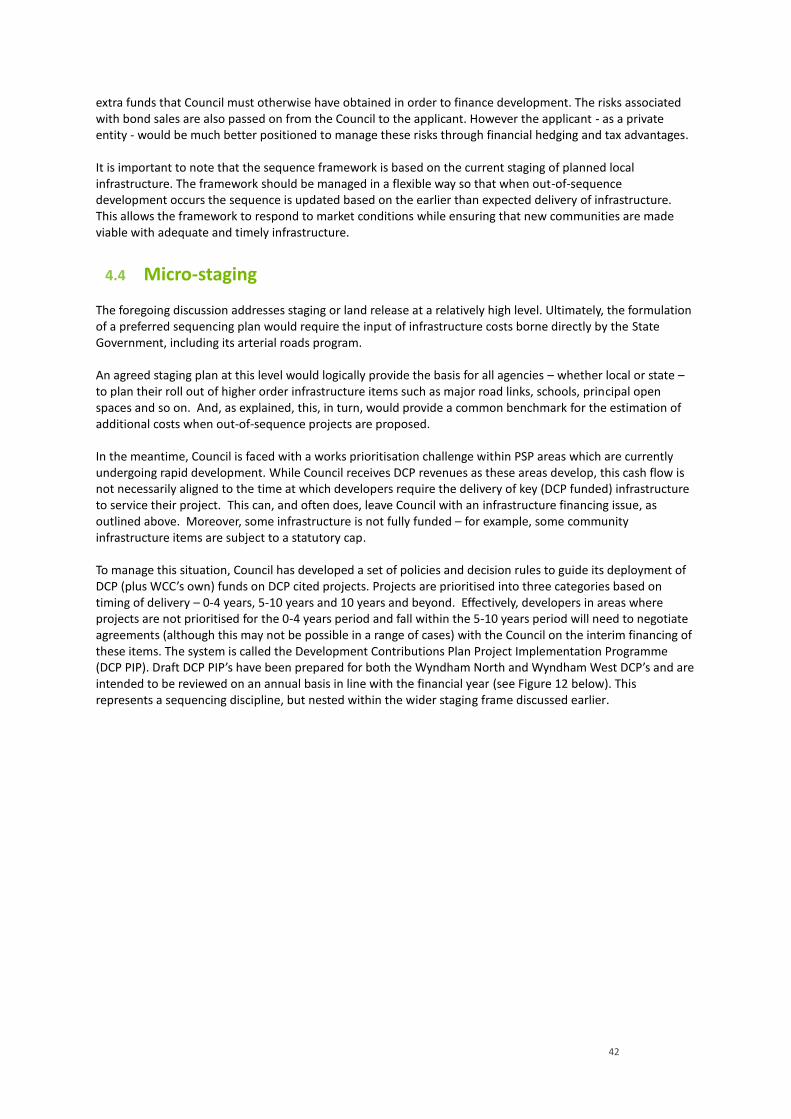
42
extra funds that Council must otherwise have obtained in order to finance development. The risks associated with bond sales are also passed on from the Council to the applicant. However the applicant - as a private entity - would be much better positioned to manage these risks through financial hedging and tax advantages. It is important to note that the sequence framework is based on the current staging of planned local infrastructure. The framework should be managed in a flexible way so that when out-of-sequence development occurs the sequence is updated based on the earlier than expected delivery of infrastructure. This allows the framework to respond to market conditions while ensuring that new communities are made viable with adequate and timely infrastructure.
4.4 Micro-staging
The foregoing discussion addresses staging or land release at a relatively high level. Ultimately, the formulation of a preferred sequencing plan would require the input of infrastructure costs borne directly by the State Government, including its arterial roads program. An agreed staging plan at this level would logically provide the basis for all agencies – whether local or state – to plan their roll out of higher order infrastructure items such as major road links, schools, principal open spaces and so on. And, as explained, this, in turn, would provide a common benchmark for the estimation of additional costs when out-of-sequence projects are proposed. In the meantime, Council is faced with a works prioritisation challenge within PSP areas which are currently undergoing rapid development. While Council receives DCP revenues as these areas develop, this cash flow is not necessarily aligned to the time at which developers require the delivery of key (DCP funded) infrastructure to service their project. This can, and often does, leave Council with an infrastructure financing issue, as outlined above. Moreover, some infrastructure is not fully funded – for example, some community infrastructure items are subject to a statutory cap. To manage this situation, Council has developed a set of policies and decision rules to guide its deployment of DCP (plus WCC’s own) funds on DCP cited projects. Projects are prioritised into three categories based on timing of delivery – 0-4 years, 5-10 years and 10 years and beyond. Effectively, developers in areas where projects are not prioritised for the 0-4 years period and fall within the 5-10 years period will need to negotiate agreements (although this may not be possible in a range of cases) with the Council on the interim financing of these items. The system is called the Development Contributions Plan Project Implementation Programme (DCP PIP). Draft DCP PIP’s have been prepared for both the Wyndham North and Wyndham West DCP’s and are intended to be reviewed on an annual basis in line with the financial year (see Figure 12 below). This represents a sequencing discipline, but nested within the wider staging frame discussed earlier.
43
FIGURE 12. PROPOSED WYNDHAM NORTH DCP PIP
Source: Wyndham City Council, 2016
44
5 AN APPROACH TO GROWTH MANAGEMENT
5.1 Possible options for growth management
Putting a brake on development might suggest itself as an option. However, the forces that are driving population growth in the City are well beyond the capacity of Council to control. Moreover, the stage has already been set for continuing rapid growth. This is evident in the preparation of PSPs, which map out in very broad terms where urban expansion is to occur. Unfortunately, the PSP’s already approved in Wyndham do this without guidance on a preferred sequence of land release, as identified in the SPPF, that would assist with the delivery of timely and adequate provision of public transport and local and regional infrastructure. Rolling back the clock is unlikely. Another obvious option is to secure additional Commonwealth and State Government capital funding for infrastructure. This is being actively pursued by Council in its own right and through various peak groups, like the Interface Group of Councils and the National Growth Areas Alliance. There have been successes from time to time on this front, depending on the political cycle, but a shift to more structural reforms – as distinct from specific project funding – seems illusive. The work needs to continue in this area, but it cannot be relied upon to fix the problem. Turning to options which are more in the bailiwick of Council (though by no means exclusively so), four possible, non-mutually exclusive strategies are to:
1. Gear development to infrastructure capacity; 2. Contain infrastructure costs per household by lifting densities; 3. Contain infrastructure costs through better sequencing of development; and 4. Drive down the costs of infrastructure.
This report deals with the first 3, driving down the costs of infrastructure without compromising quality or supply is a separate piece of work.
Gearing development to infrastructure capacity
This strategy is premised on the reasonable principle that infrastructure needs to be delivered as each area is developed. This principle implies a requirement that milestones must be met before the next stage of development can be triggered. Table 7 sets out generally agreed benchmarks for infrastructure provision across a wide range of services, extracted from the Wyndham Social Infrastructure Planning Framework (WSIPF) and other sources. The right hand column gives a “rule of thumb” for the average numbers of such facilities that would be required in future, without accounting for any existing deficits. It is based on an average of 3,000 new dwellings per annum, which is Council’s preferred rate of expansion. The WSIPF is currently under review, with an updated table anticipated to be available in 2016. Using such data, “triggers” would be set for some developments to enable initial works to commence but only proceed to full development once certain criteria have been met, for example provision of a school, railway station or new road. This will require some degree of action and decision-making by State Government.
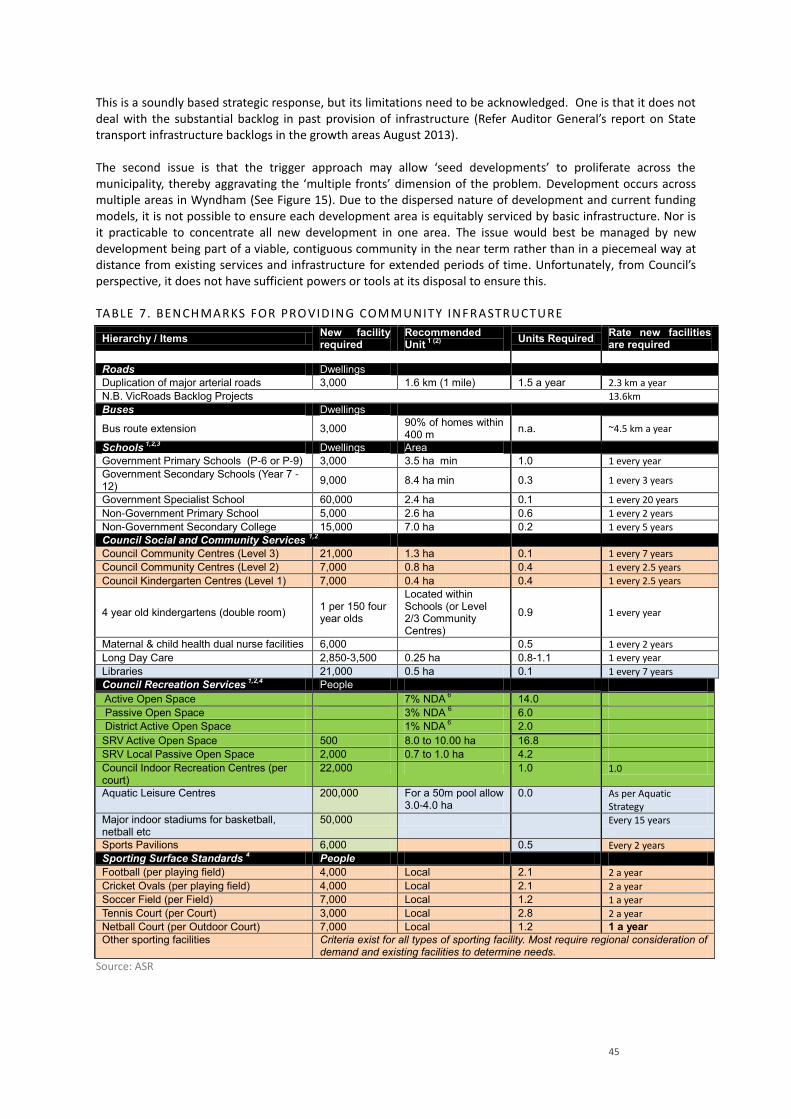
45
This is a soundly based strategic response, but its limitations need to be acknowledged. One is that it does not deal with the substantial backlog in past provision of infrastructure (Refer Auditor General’s report on State transport infrastructure backlogs in the growth areas August 2013). The second issue is that the trigger approach may allow ‘seed developments’ to proliferate across the municipality, thereby aggravating the ‘multiple fronts’ dimension of the problem. Development occurs across multiple areas in Wyndham (See Figure 15). Due to the dispersed nature of development and current funding models, it is not possible to ensure each development area is equitably serviced by basic infrastructure. Nor is it practicable to concentrate all new development in one area. The issue would best be managed by new development being part of a viable, contiguous community in the near term rather than in a piecemeal way at distance from existing services and infrastructure for extended periods of time. Unfortunately, from Council’s perspective, it does not have sufficient powers or tools at its disposal to ensure this.
TABLE 7. BENCHMARKS FOR PRO VIDING COMMUNITY INF RASTRUCTURE
Hierarchy / Items New facility required
Recommended Unit
1 (2)
Units Required Rate new facilities are required
Roads Dwellings
Duplication of major arterial roads 3,000 1.6 km (1 mile) 1.5 a year 2.3 km a year
N.B. VicRoads Backlog Projects
13.6km
Buses Dwellings
Bus route extension 3,000 90% of homes within 400 m
n.a. ~4.5 km a year
Schools 1,2,3
Dwellings Area
Government Primary Schools (P-6 or P-9) 3,000 3.5 ha min 1.0 1 every year Government Secondary Schools (Year 7 - 12)
9,000 8.4 ha min 0.3 1 every 3 years
Government Specialist School 60,000 2.4 ha 0.1 1 every 20 years
Non-Government Primary School 5,000 2.6 ha 0.6 1 every 2 years
Non-Government Secondary College 15,000 7.0 ha 0.2 1 every 5 years Council Social and Community Services
1,2
Council Community Centres (Level 3) 21,000 1.3 ha 0.1 1 every 7 years
Council Community Centres (Level 2) 7,000 0.8 ha 0.4 1 every 2.5 years
Council Kindergarten Centres (Level 1) 7,000 0.4 ha 0.4 1 every 2.5 years
4 year old kindergartens (double room) 1 per 150 four year olds
Located within Schools (or Level 2/3 Community Centres)
0.9 1 every year
Maternal & child health dual nurse facilities 6,000
0.5 1 every 2 years
Long Day Care 2,850-3,500 0.25 ha 0.8-1.1 1 every year
Libraries 21,000 0.5 ha 0.1 1 every 7 years Council Recreation Services
1,2,4 People
Active Open Space 7% NDA 6 14.0
Passive Open Space 3% NDA 6 6.0
District Active Open Space 1% NDA 6 2.0
SRV Active Open Space 500 8.0 to 10.00 ha 16.8 SRV Local Passive Open Space 2,000 0.7 to 1.0 ha 4.2
Council Indoor Recreation Centres (per court)
22,000 1.0 1.0
Aquatic Leisure Centres 200,000 For a 50m pool allow 3.0-4.0 ha
0.0 As per Aquatic Strategy
Major indoor stadiums for basketball, netball etc
50,000 Every 15 years
Sports Pavilions 6,000 0.5 Every 2 years Sporting Surface Standards
4 People
Football (per playing field) 4,000 Local 2.1 2 a year
Cricket Ovals (per playing field) 4,000 Local 2.1 2 a year Soccer Field (per Field) 7,000 Local 1.2 1 a year
Tennis Court (per Court) 3,000 Local 2.8 2 a year Netball Court (per Outdoor Court) 7,000 Local 1.2 1 a year
Other sporting facilities Criteria exist for all types of sporting facility. Most require regional consideration of demand and existing facilities to determine needs.
Source: ASR
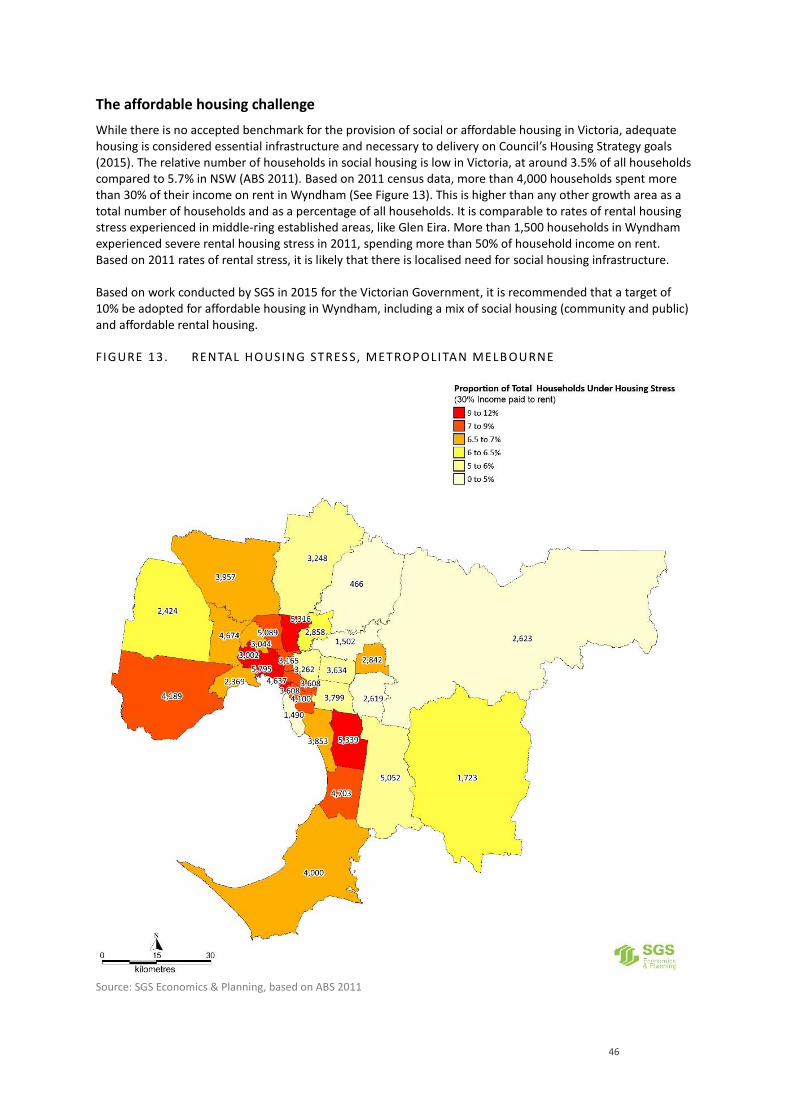
46
The affordable housing challenge
While there is no accepted benchmark for the provision of social or affordable housing in Victoria, adequate housing is considered essential infrastructure and necessary to delivery on Council’s Housing Strategy goals (2015). The relative number of households in social housing is low in Victoria, at around 3.5% of all households compared to 5.7% in NSW (ABS 2011). Based on 2011 census data, more than 4,000 households spent more than 30% of their income on rent in Wyndham (See Figure 13). This is higher than any other growth area as a total number of households and as a percentage of all households. It is comparable to rates of rental housing stress experienced in middle-ring established areas, like Glen Eira. More than 1,500 households in Wyndham experienced severe rental housing stress in 2011, spending more than 50% of household income on rent. Based on 2011 rates of rental stress, it is likely that there is localised need for social housing infrastructure. Based on work conducted by SGS in 2015 for the Victorian Government, it is recommended that a target of 10% be adopted for affordable housing in Wyndham, including a mix of social housing (community and public) and affordable rental housing.
FIGURE 13. RENTAL HOUSING STRES S, METROPOLITAN MELB OURNE
Source: SGS Economics & Planning, based on ABS 2011
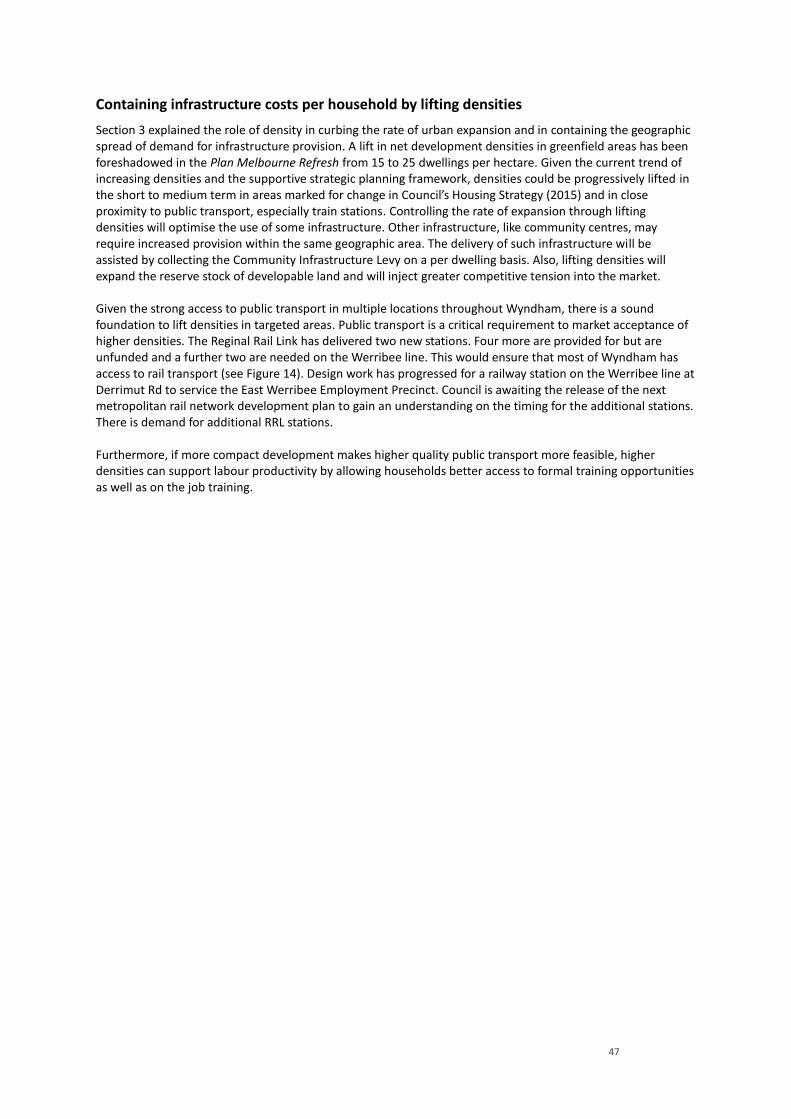
47
Containing infrastructure costs per household by lifting densities
Section 3 explained the role of density in curbing the rate of urban expansion and in containing the geographic spread of demand for infrastructure provision. A lift in net development densities in greenfield areas has been foreshadowed in the Plan Melbourne Refresh from 15 to 25 dwellings per hectare. Given the current trend of increasing densities and the supportive strategic planning framework, densities could be progressively lifted in the short to medium term in areas marked for change in Council’s Housing Strategy (2015) and in close proximity to public transport, especially train stations. Controlling the rate of expansion through lifting densities will optimise the use of some infrastructure. Other infrastructure, like community centres, may require increased provision within the same geographic area. The delivery of such infrastructure will be assisted by collecting the Community Infrastructure Levy on a per dwelling basis. Also, lifting densities will expand the reserve stock of developable land and will inject greater competitive tension into the market. Given the strong access to public transport in multiple locations throughout Wyndham, there is a sound foundation to lift densities in targeted areas. Public transport is a critical requirement to market acceptance of higher densities. The Reginal Rail Link has delivered two new stations. Four more are provided for but are unfunded and a further two are needed on the Werribee line. This would ensure that most of Wyndham has access to rail transport (see Figure 14). Design work has progressed for a railway station on the Werribee line at Derrimut Rd to service the East Werribee Employment Precinct. Council is awaiting the release of the next metropolitan rail network development plan to gain an understanding on the timing for the additional stations. There is demand for additional RRL stations. Furthermore, if more compact development makes higher quality public transport more feasible, higher densities can support labour productivity by allowing households better access to formal training opportunities as well as on the job training.
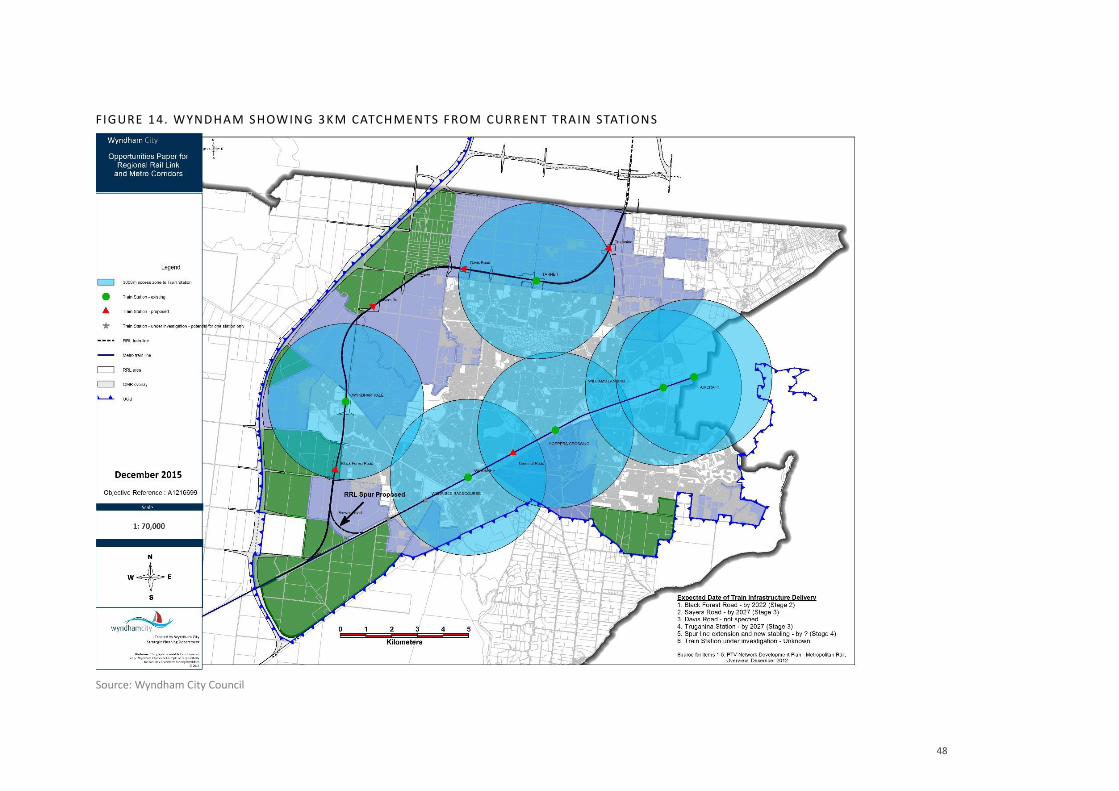
48
FIGURE 14. WYNDHAM SHOWING 3KM CATCHMENTS FROM CURR ENT TRAIN STATIONS
Source: Wyndham City Council
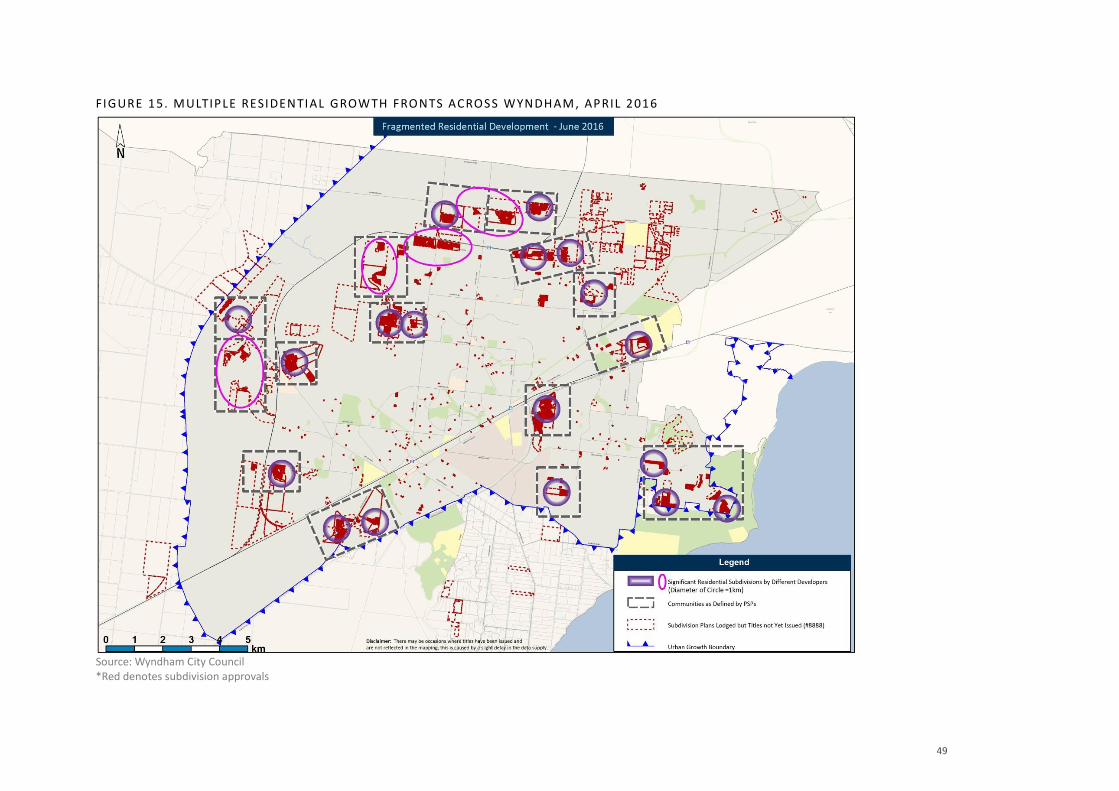
49
FIGURE 15. MULTIPLE RESIDENTIAL GROWTH FRONTS ACROSS WYNDHAM , APRIL 2016
Source: Wyndham City Council *Red denotes subdivision approvals
Residential Growth Management Strategy 45
Containing infrastructure costs through better sequencing of development
This report has demonstrated that it is not just the quantum of infrastructure needed, but the timing of delivery, that affects cost of provision. In turn, timing of provision is a function of the number of development fronts and the staging of land release in each front (see Section 4). While it is possible to stage the roll-out of PSPs and contain the number of developable areas to some extent through planning controls, strict land release staging can be counterproductive in terms of other policy objectives, namely the retention of competition in land supply and maintenance of affordable housing. A preferred approach is to develop a ‘nominal’ preferred staging of development across all PSPs, but making it clear to the market that out-of-sequence projects would be accommodated provided two conditions are met:
1. The proponent’s project will, as already noted, form a viable and cohesive community in the short term, and
2. The proponents enter into an agreement to compensate all infrastructure agencies (local and state) for the additional infrastructure costs caused as a result of the project being out-of-sequence.
In this model, a benchmark sequencing of new suburb development would be agreed between Wyndham and State Government as being the most cost efficient from the perspective of all major infrastructure costs including roads, schools and water cycle management. A benchmark sequencing framework would take the form of a living plan, initially representing the ideal sequence of development based on a consolidated and prioritised view of all government agencies’ infrastructure roll-out plans and updated over time to reflect approved development outside the initial sequence. This macro-sequencing plan would also reflect a transition towards more efficient development densities, from current rates averaging 18 dwellings per hectare to 20-25 dwellings per hectare in growth areas, focussed with greater densities in particular around transport and employment/commercial precincts. Both Wyndham and State Government agencies would base their forward infrastructure investment strategies on the agreed macro-sequencing plan. Furthermore, developers wishing to pursue projects which are not in line with the benchmark sequence agreed between Wyndham and State Government would be required to compensate the relevant infrastructure agencies, if this variation from the agreed sequence causes extra costs, in present value terms, for these agencies. In this regard, proponents of out-of-sequence projects would be required to prepare (or fund the preparation of) cost impact assessments for any agencies which see a prima facie need for such an assessment. The cost impact assessment would compare the present value cost of infrastructure delivery for the agency in question, had development proceeded in line with the a staging plan agreed between Council and relevant State agencies, with the present value cost of infrastructure delivery given the proposed variation to the sequencing plan. Cost impact assessments would be prepared according to a standard, pro-forma, methodology. The method of compensation for any additional costs would be a matter of negotiation between the proponent and the affected agencies. It would be effected through a Section 173 agreement. Once an out-of-sequence project has been approved and infrastructure roll out plans adjusted accordingly, the macro-sequencing plan would be revised and re-issued as necessary. This revised macro-sequencing plan would constitute the benchmark for any subsequent out-of-sequence proposals. In this way, the implementation of a development sequencing framework will maximise the cost effectiveness
Residential Growth Management Strategy 46
of investment in infrastructure and will work to reduce the occurrence of poorly serviced piecemeal developments. In those land areas identified for development within the next ten years in the macro-sequencing plan, Council as the collection and development agency, will continue to establish a works prioritisation program for the deployment of DCP and other capital works funds (as per example in proposed Wyndham North DCP PIP). This prioritisation program would nominate when specific projects would be built within the ten year time frame. This would take into account current and anticipated development activity and efficiencies in the extension of existing infrastructure. Proponents requiring earlier construction of projects than what is allowed for in the works prioritisation program would be required to finance these projects with Council entering into an agreement for DCP revenues received from intervening developments.
5.2 Preferred strategy
Based on the evidence and analysis in this report, the preferred growth management strategy for Wyndham comprises three key themes:
1. Actively manage the number of areas under development at any one time (’growth fronts’) to optimise the capacity to provide infrastructure in a timely manner. The primary vehicle for achieving this will be the ‘benchmark sequence of development’ agreed between Council and State Government infrastructure agencies.
2. Strengthen statutory controls to require increased densities consistent with Councils Housing Strategy, and investigate other opportunities/incentives to encourage densification consistent with the Strategy. This should be reflected across Council’s policies and strategies. Further increases in density may be appropriate based on development trends, future research findings or changes in government policy.
3. Manage out-of-sequence development by requiring proponents to build viable communities and incorporate additional costs associated with bringing forward infrastructure.
5.3 The strategy dividend
Successful implementation of this three point strategy would ensure more timely delivery of infrastructure for new communities by both Council and State Government agencies. This would occur without compromising competition in the land market and affordable housing objectives. In fact, by making the rules for the approval of out-of-sequence development clear and transparent, the strategy can be expected to inject still greater competition into the land market. The market power of incumbents holding properties which are proximate to existing services will be significantly diluted. Over time, a more compact, liveable and sustainable footprint for urban growth would be established in Wyndham.
5.4 Recommendations for Wyndham City Council
Based on the proposed residential growth management strategy, it is recommended that Council adopt the three-point strategy and:
1. make giving statutory effect to the Housing strategy a high priority; 2. develop protocols and pro-forma methodologies for the implementation of cost impact
assessments in the management of out of sequence proposals;
Residential Growth Management Strategy 47
3. Finalise and implement DCP PIPs to ensure prioritisation of infrastructure commitments at the micro level of neighbourhoods, in line with the macro sequencing framework;
4. work collaboratively with growth area councils to test the methods of this residential growth management strategy for wider application;
5. work with growth area councils to engage the State government agencies and coordinated infrastructure planning and delivery;
6. sustain pressure on State and Federal Governments in collaboration with the development industry to address major infrastructure backlogs, in particular the need for schools, better public transport and improved roads; and
7. monitor development trends to determine if system incentives for increased density function adequately. Where appropriate, seek amendments to planning and financing tools to ensure costs are fairly shared.
5.5 Recommendations for State Government
Based on the proposed residential growth management strategy, it is recommended that:
1. the principles of sequencing and cost impact assessment, as set out in this RGMS, be progressed in Plan Melbourne (2016) and the work of Infrastructure Victoria;
2. the terms of reference for the State Government’s ‘local infrastructure delivery plans’, currently being piloted in conjunction with the City of Melton consider provision for sequencing and cost impact assessment as outlined in this RGMS;
3. in parallel with the pilot local infrastructure delivery plan in Melton, the MPA work alongside Wyndham City Council to further develop the sequencing principles set out in this RGMS, with particular attention to implementation of the transition to higher densities in suitable greenfield areas around transport nodes and activity centres;
4. The 2014 planning panel recommendations for the MPA, specifically regarding further work to be undertaken, in determining what constitutes out of sequence development and to engage with Council to develop criteria that can be used to assess future applications to subdivision;
5. the State Government support appropriate local financing mechanisms, including the indexation of the current $900 Community Infrastructure Levy cap which has remained unchanged since May 2003; and
6. no further PSPs be released or approved unless they are located within 3km of an existing train station and are supported by an appropriate road network.
Residential Growth Management Strategy 48
Contact us CANBERRA
Level 6, 39 London Circuit Canberra ACT 2601
+61 2 6263 5940 [email protected]
HOBART
PO Box 123 Franklin TAS 7113
+61 421 372 940 [email protected]
MELBOURNE
Level 14, 222 Exhibition Street Melbourne VIC 3000
+61 3 8616 0331 [email protected]
SYDNEY
209/50 Holt Street Surry Hills NSW 2010
+61 2 8307 0121 [email protected]