Embed Size (px)
Citation preview
Winter 2014
Residential Foreclosures in Minnesota Spring 2014
Planning, Research & Evaluation

Residential Foreclosures in Minnesota
Introduction In 2013, Minnesota’s foreclosure crisis subsided to near pre-recessionary levels. However, the crisis has destabilized the housing market in many parts of the state, and community recovery has not been level across all parts of the state. As part of its mission to finance affordable housing for low- and moderate- income households while fostering strong communities, Minnesota Housing established foreclosure prevention and community recovery as one of its strategic priorities. To monitor the evolving crisis, Minnesota Housing purchases data on the delinquency and foreclosure status of residential mortgages from CoreLogic. These data help Minnesota Housing and its partners target their prevention and recovery efforts and effectively use resources in the hardest hit areas. The following report provides key findings about the current state of the foreclosure crisis in Minnesota. The first section provides information about statewide trends and the second section identifies foreclosure and delinquency hotspots around the state. Several maps accompany the discussion. Finally, the appendix includes a table that provides data for each residential zip code in the state.
Report Structure Current Statewide Trends ......................................................................................................................... 2
High Need Areas – Foreclosure Hotspots ................................................................................................. 3
Zip Code Maps .......................................................................................................................................... 6
Map 1a – Real Estate Owned Loans (State) .......................................................................................... 7
Map 1b - Real Estate Owned Loans (Metro) ......................................................................................... 8
Map 2a - Loans in Foreclosure (State) .................................................................................................. 9
Map 2b - Loans in Foreclosure (Metro) .............................................................................................. 10
Map 3a - Loans in Delinquency (State) ............................................................................................... 11
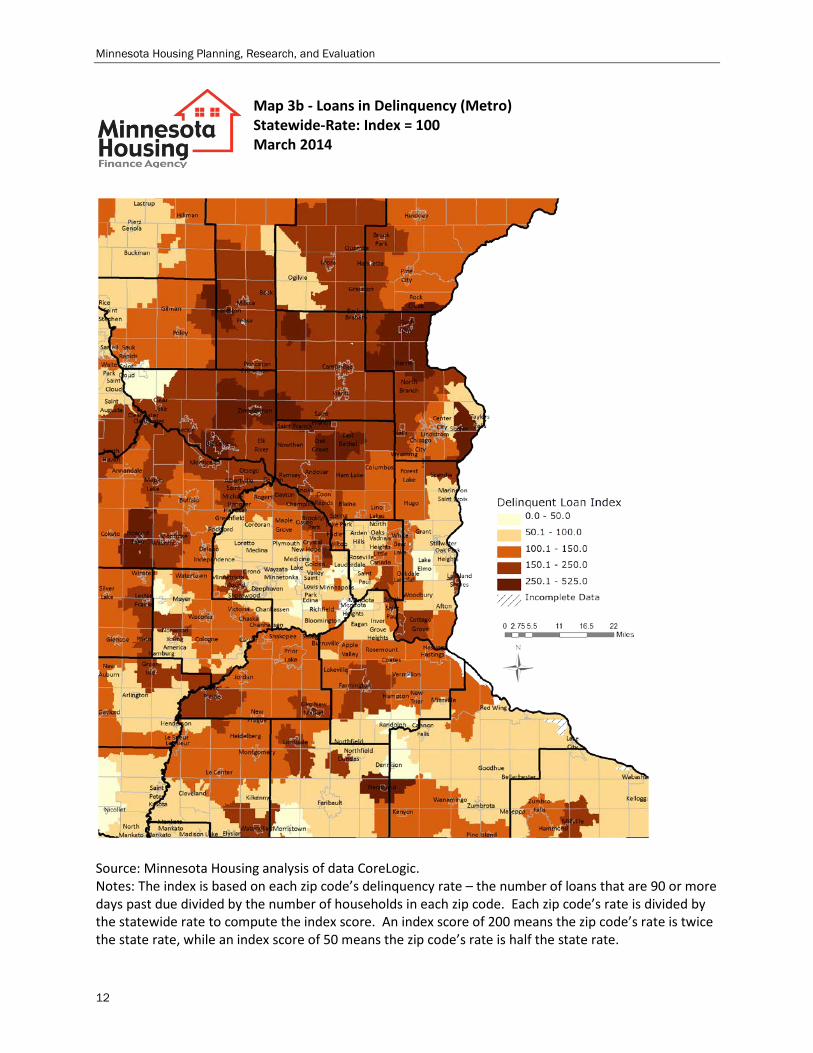
Map 3b - Loans in Delinquency (Metro) ............................................................................................. 12
Map 4a – Annual Change in Composite Index (State) ........................................................................ 13
Map 4b – Annual Change in Composite Index (Metro) ...................................................................... 14
Appendix A - Zip Code Tables - Index Scores .......................................................................................... 15
1
Minnesota Housing Planning, Research, and Evaluation
Current Statewide Trends • Statewide (and nationwide) foreclosures are declining.
o The total number of U.S. properties completing foreclosures and being repossessed by Lenders (Real Estate Owned, or REO), dropped by 27% between May 2013 and May 2014, to the lowest levels since July 2007.1
o Minnesota ranks 5th, lowest among states in the percentage of homes in foreclosure.2 Nationwide, the share of mortgages in foreclosure is over three times the rate in Minnesota.
o In Minnesota, sheriff sales are decreasing each year, but remain above the levels experienced before the foreclosure crisis. In 2013 there were nearly 12,000 sheriff sales, while in 2005 there were fewer than 7,000 sheriff sales. In the past year, sheriff sales dropped by 34%. As reported by HousingLink, this is the third consecutive year of double digit percentage declines.3
• The magnitude of delinquencies continues to decline but remain above historical standards. o The state’s delinquency rate for residential mortgages increased significantly during the late
2000s. Between the fourth quarter of 2005 and the fourth quarter of 2009, the percentage of mortgages that were at least 60 days past due quadrupled from 1.10% to 4.71%.4 However, the delinquency rate has declined at a moderate rate since 2010, with a current rate (1st Quarter 2014) of 2.09%, the lowest rate since March 2008.
• The impact of unemployment on foreclosures is lessening as the state continues to recover from the Great Recession.
o Minnesota’s unemployment rate jumped from a pre-recession low of 3.9% in May of 2006 to a high of 8.3% in May of 2009. Since May 2009, the unemployment rate has trended downward to 4.6% in May of 2014.5
o Many economists predict that unemployment will continue to trend lower over the next three years.6
1 US Department of Housing and Urban Development, US Department of Treasury, National Housing Scorecard, May 2014; see: http://portal.hud.gov/hudportal/documents/huddoc?id=HUDMayNatSC2014.pdf 2 CoreLogic National Foreclosure Report, May 2014. 3 HousingLink, 2013 Annual Foreclosures in Minnesota, February 2013. 4 Mortgage Bankers Association, National Delinquency Survey. The delinquency rate applies to loans that are at least 60 days past due but have not started the foreclosure process. 5 Minnesota Department of Employment and Economic Development, Local Area Unemployment Statistics, figures are seasonally adjusted. 6 The Federal Reserve Bank of Philadelphia surveyed 45 economic forecasters in the 1st quarter of 2014 and summarized their projections; see http://www.phil.frb.org/research-and-data/real-time-center/survey-of-professional-forecasters/2014/survq114.cfm . Nationally, the unemployment rate is expected to be 6.5% in 2014, 6.1% in 2015, 5.7% in 2016, and 5.5 in 2017.
2
Residential Foreclosures in Minnesota
High Need Areas – Foreclosure Hotspots The foreclosure crisis has had a significant impact on some neighborhoods in Minnesota, while the impact has been much less extensive in others. Initially, the impact was the largest in the core neighborhoods of North Minneapolis and St. Paul’s East Side, along with some communities north of the Twin Cities seven-county metropolitan area, particularly in Wright, Sherburne, and Isanti counties. As the foreclosure crisis has evolved over time and declined statewide, it became less concentrated in the center cities. While neighborhoods in Minneapolis and St. Paul still have a large number of foreclosed and REO (Real Estate Owned) properties relative to the state, the concentration of troubled loans in the two central cities is lower than it has been. To show this information, the attached maps display data on each zip code’s:
• REO rate (reflecting foreclosures that have happened), • In foreclosure rate (reflecting foreclosures that are happening), • Delinquency rate (reflecting foreclosures that may happen in the near future), 7 and • Change in the number of foreclosures from previous year (for zip codes that currently have a
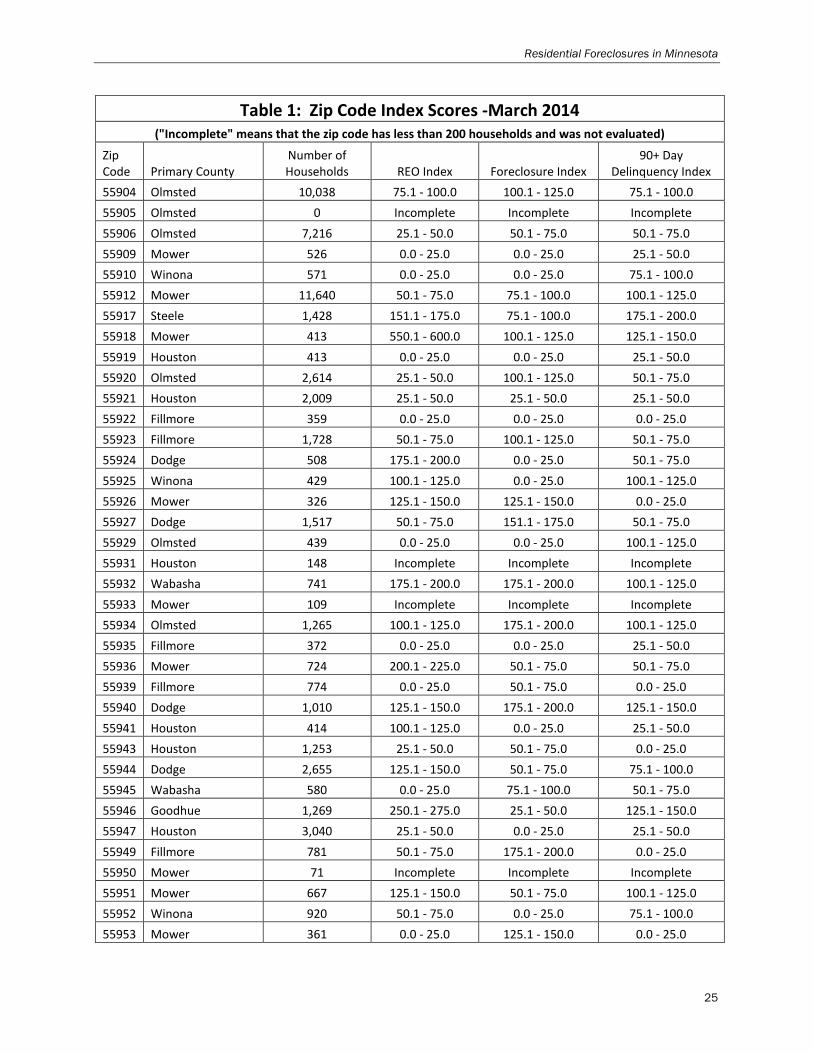
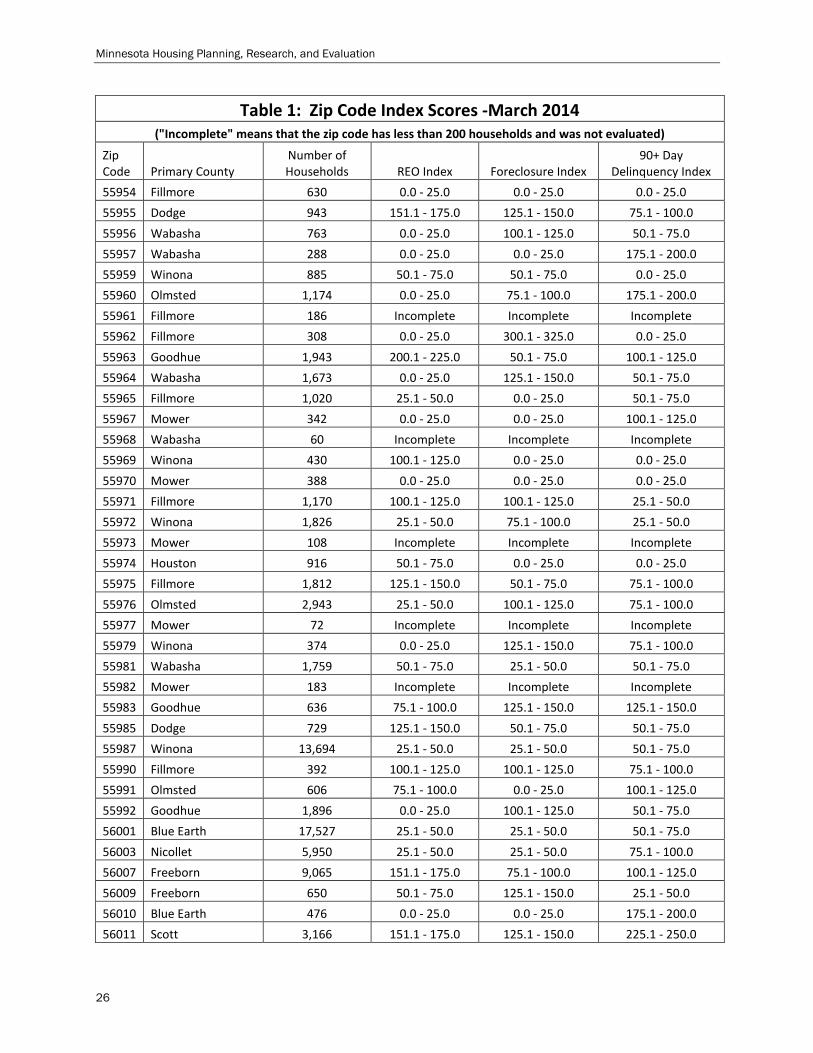
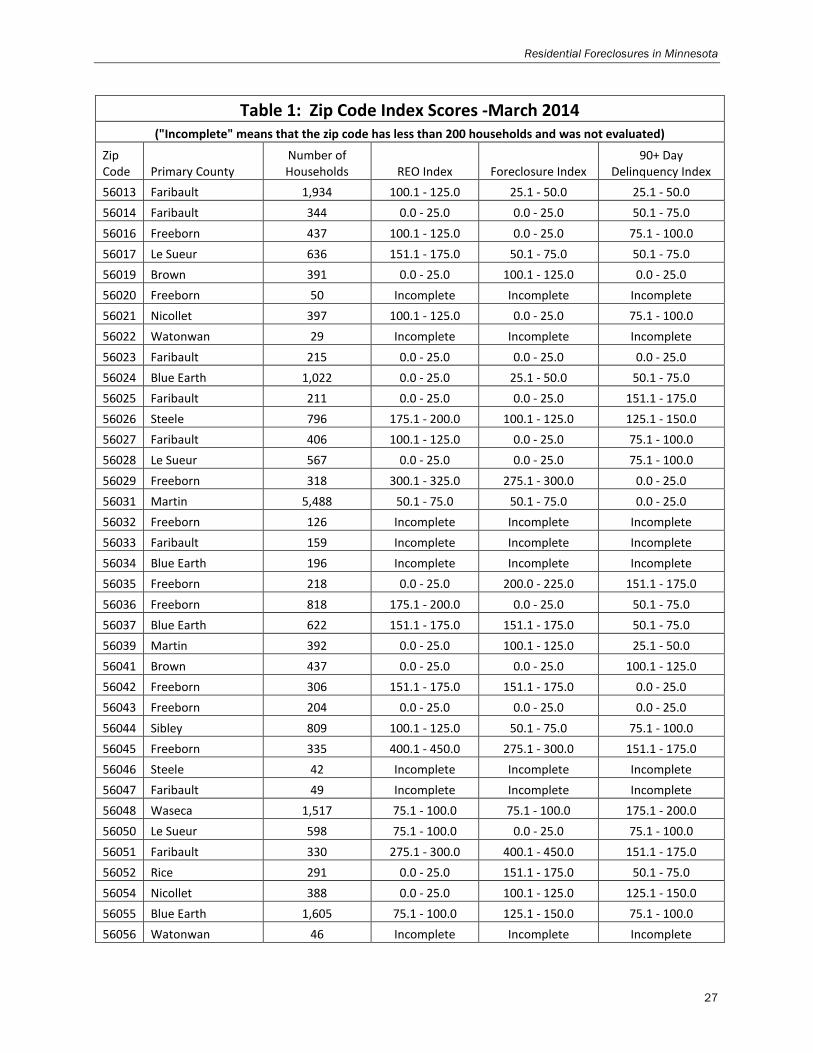
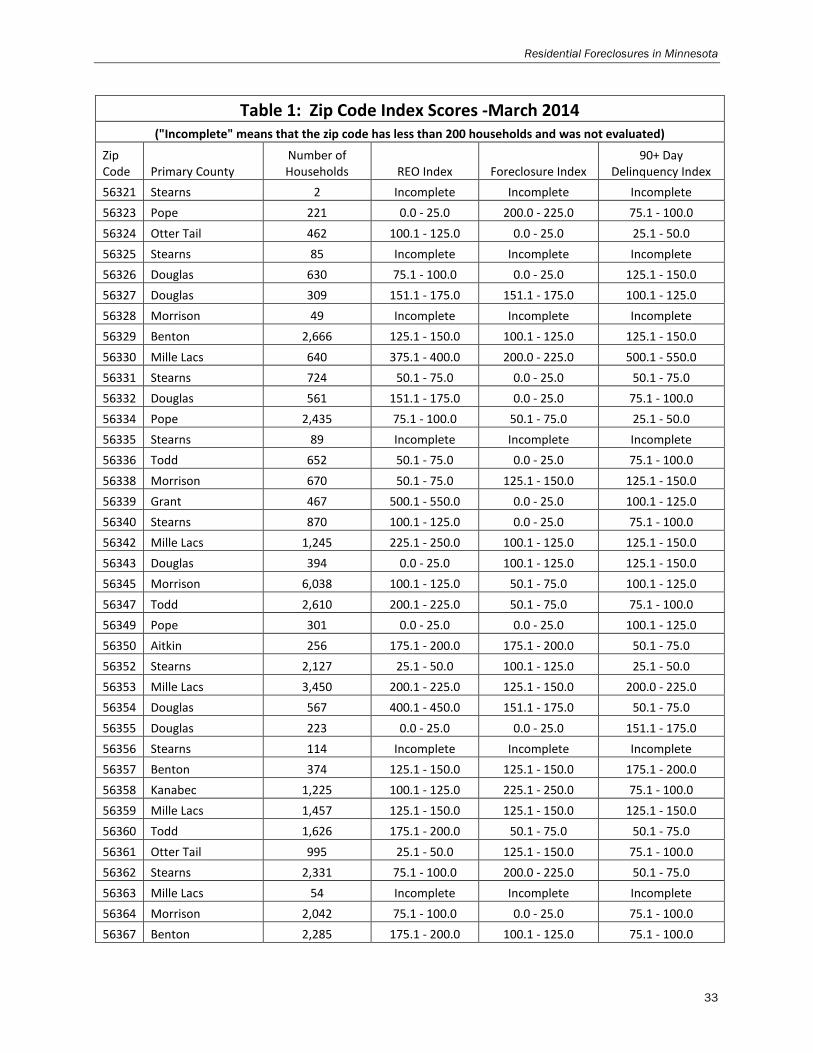
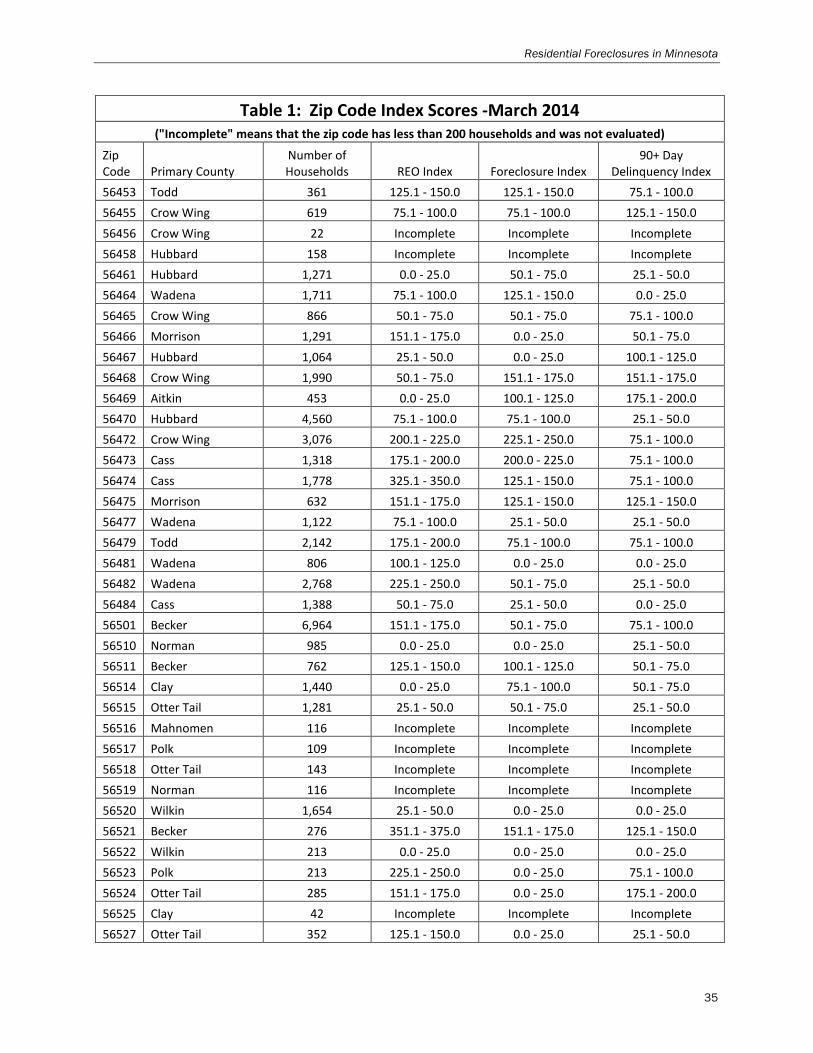
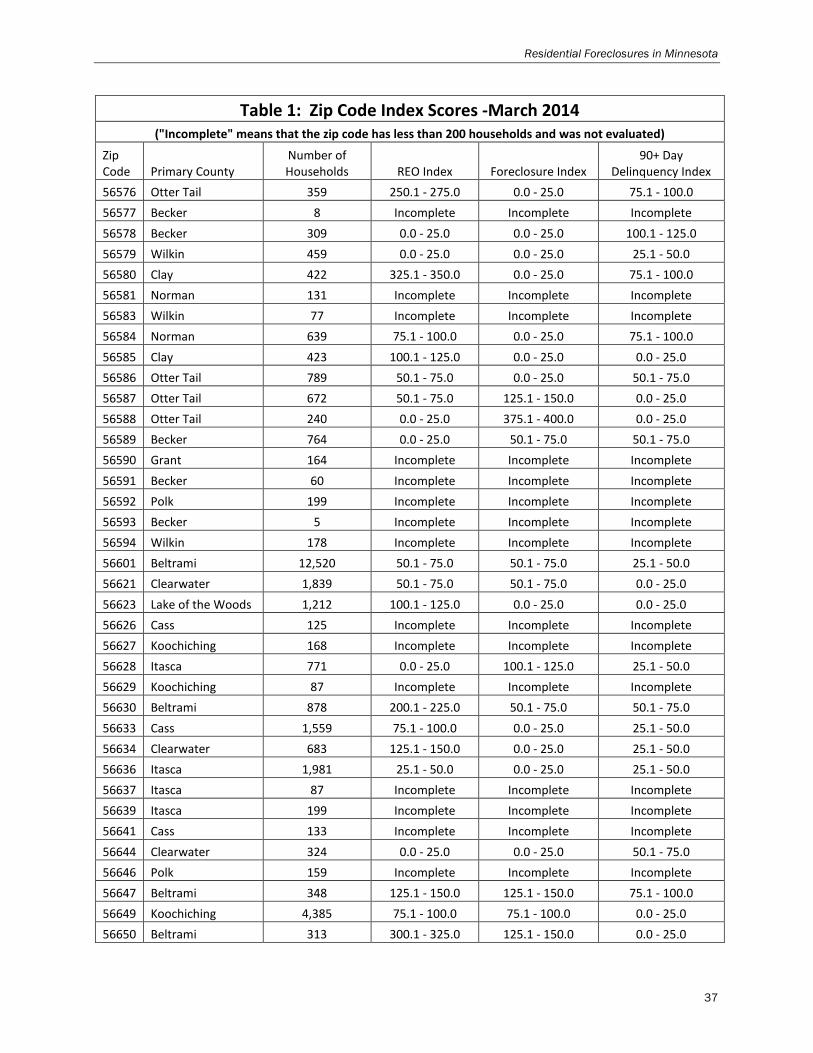
foreclosure rate above the statewide rate). For each rate, there is a statewide map and a map of the Twin Cities metropolitan area. The rates are based on the number of residential first-lien loans in each category divided by the number of households in each zip code.8 For example, the delinquency rate is the number of loans in a zip code that are 90 or more days past due but not yet in foreclosure divided by the number of households in the zip code. Because the data that Minnesota Housing purchases from CoreLogic is proprietary, Minnesota Housing cannot publish specific rates or numbers, but it can publish an index score. To compute the index score, each zip code’s rate is divided by the statewide rate. Thus, the statewide rate is 100. If a zip code’s rate is twice as high as the statewide rate, it has an index score of 200. If a zip code’s rate is half the statewide rate, it has an index score of 50. The index scores show “hot spots” for problem loans.
7 A loan is in foreclosure when legal documents have been filed to start the foreclosure process but a sheriff sale has not occurred. Seriously delinquent loans are mortgages delinquent by 90 days or more. An REO property is owned by the lender after the sheriff sale. 8 Ideally, the rates should be calculated as the number of loans in each category divided by the number of residential parcels in each zip code. Typically, there is one first-lien loan on each residential parcel, and one foreclosure affects one parcel. However, parcel data by zip code is not available. As a proxy for residential parcels, Minnesota Housing used the number of households in each zip code. Zip codes with a higher proportion of multifamily housing (often in urban areas) have proportionally more households per residential parcel than other zip codes. Thus, the rates used in this report (based on problem loans per household) understate the delinquency and foreclosure problem in zip codes with a higher proportion of multifamily housing. (The denominator of the calculation is disproportionately high.) The number of 2010 households in each zip code comes from the 2010 decennial US Census. To account for the uncertainty in the resulting rates and index scores, Table 1 in the appendix provides rate index scores in 25 point increments, rather than specific figures. Specific numbers would reflect an inappropriate level of precision and accuracy.
3
Minnesota Housing Planning, Research, and Evaluation
As shown in the maps:
• Areas with high REO rates can be found across the state. Very high REO rates (2.5 times the statewide rate) are found in small pockets of the Twin Cities seven-county metropolitan area including Minneapolis, East Bethel, and Mayer. Counties north of the Twin Cities and into central Minnesota form the largest concentrations of REO properties statewide, including Chisago, Isanti, Pine, and Sherburne Counties. In other regions of Greater Minnesota, smaller pockets of very high rates of REOs are found scattered throughout the state. (See Maps 1a and 1b.)
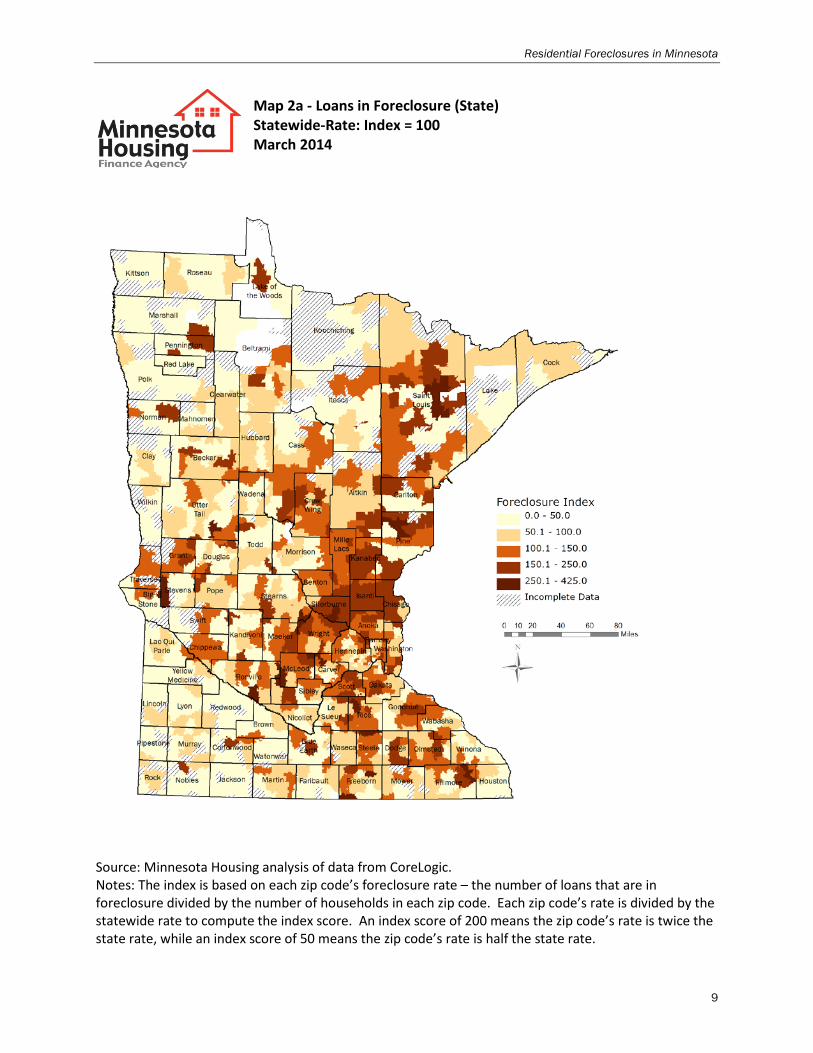
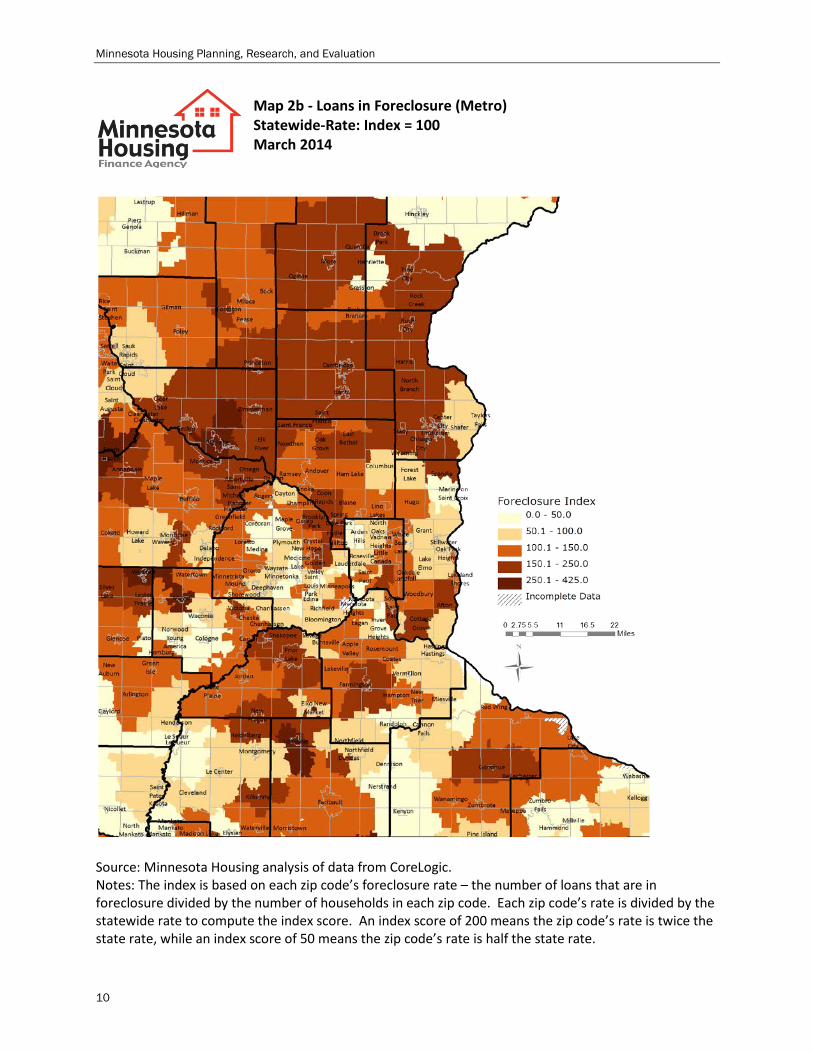
• The geographic distributions of the highest rates of loans in foreclosure are clustered in
communities developed during the peak of the housing boom, but also continue to be prevalent in the core cities in the metro. The geographic distribution of loans in foreclosure follows a similar pattern to the REO rate, but pockets of very high foreclosure rates (2.5 times greater than the statewide rate) are not as widely dispersed. The western and northern parts of the state have very few pockets of higher rates. Concentrations of loans in foreclosure are found most predominantly in Chisago, Isanti, Pine, and Sherburne Counties in Minnesota. There are other smaller pockets around the state. (See Maps 2a and 2b.)
• The geographic distribution of the highest delinquency rates is even more concentrated than
the distribution of loans in foreclosure. The highest rates are concentrated in Sherburne and Isanti counties in Greater Minnesota and in Brooklyn Park and Minneapolis in the Twin Cities Metro. (See maps 3a and 3b.)
• For some areas with high rates of troubled loans, foreclosures are still on the rise, relative to an overall decline in foreclosures statewide. For areas that have currently high rates of troubled loans (1.5 times greater than the state), some experienced declines in the rate of troubled loans since December 2012, while other areas have experienced increases. Areas with an increasing foreclosure problem relative to the state in the last year include: Suburban Twin Cities Metropolitan communities of Brooklyn Park, Brooklyn Center,
Bethel, East Bethel, Elko New Market, and Lakeland Shores, Several communities in counties surrounding the Twin Cities seven-county metropolitan
area including Sherbune, Wright, Isanti , Mille Lacs, Rice and Sibley, and Individual zip codes within St Louis, Crow Wing, Steele, and Olmsted Counties.
4
Residential Foreclosures in Minnesota
When assessing the maps and data, four key points need to be kept in mind:
• While some communities with a large proportion of foreclosures early in the crisis may have passed the peak of their crisis, the problems continue in these areas. These communities still need to recover from the destabilizing effects of all the foreclosures that have already occurred. The data in this report apply to the status of loans being serviced in December 2013. Previously foreclosed properties that are in the hands of a new homeowner or investor are no longer classified as foreclosed. Thus, the data does not completely capture the magnitude of the foreclosure crisis for communities that have already had a concentration of loans go completely through the foreclosure process.
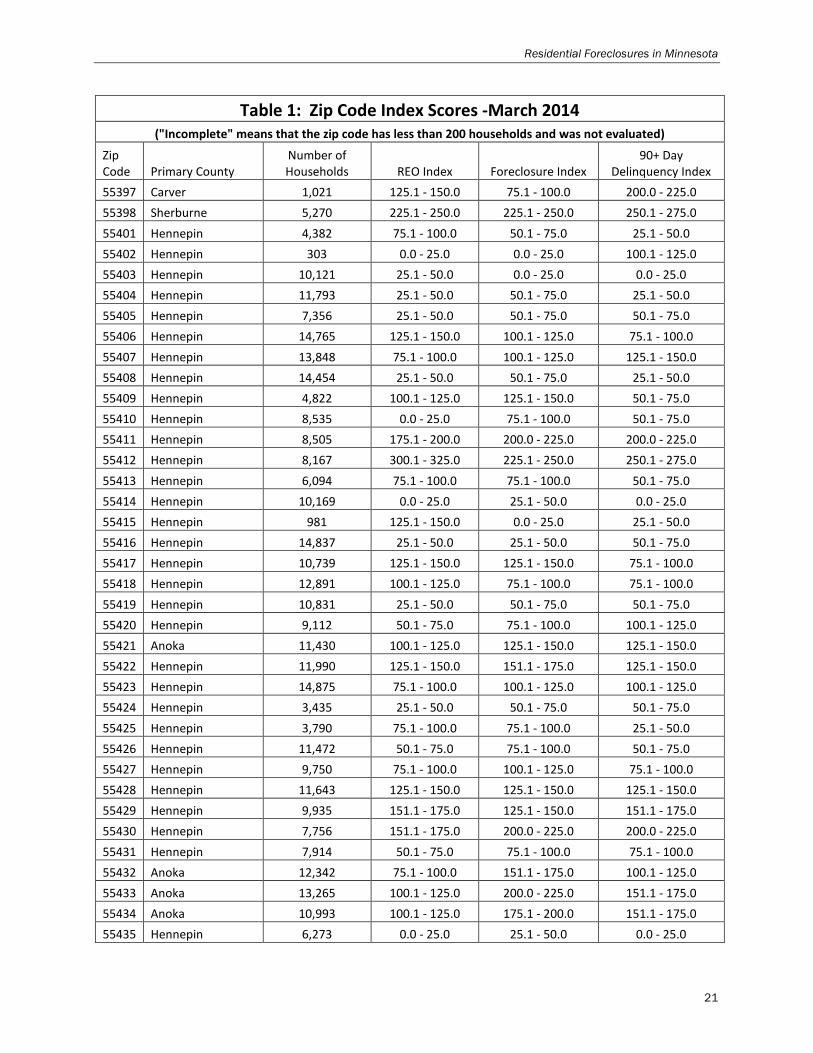
• When assessing need, the foreclosure, delinquency, and REO rates are important, but the
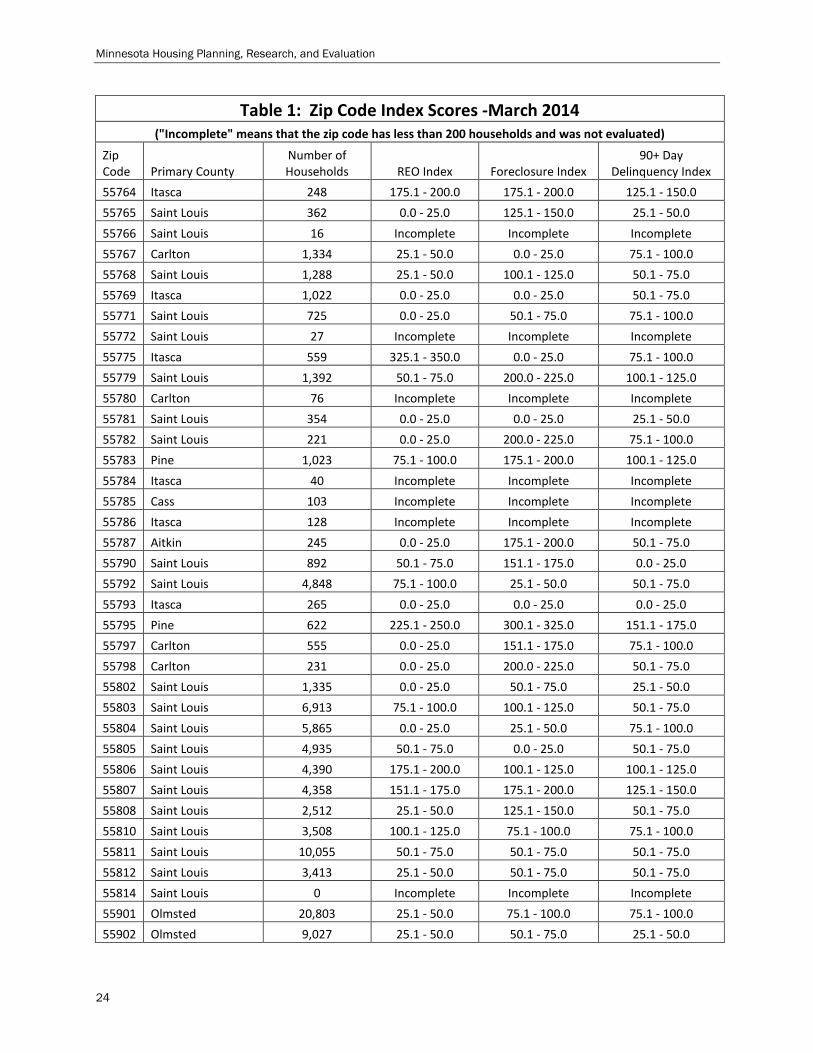
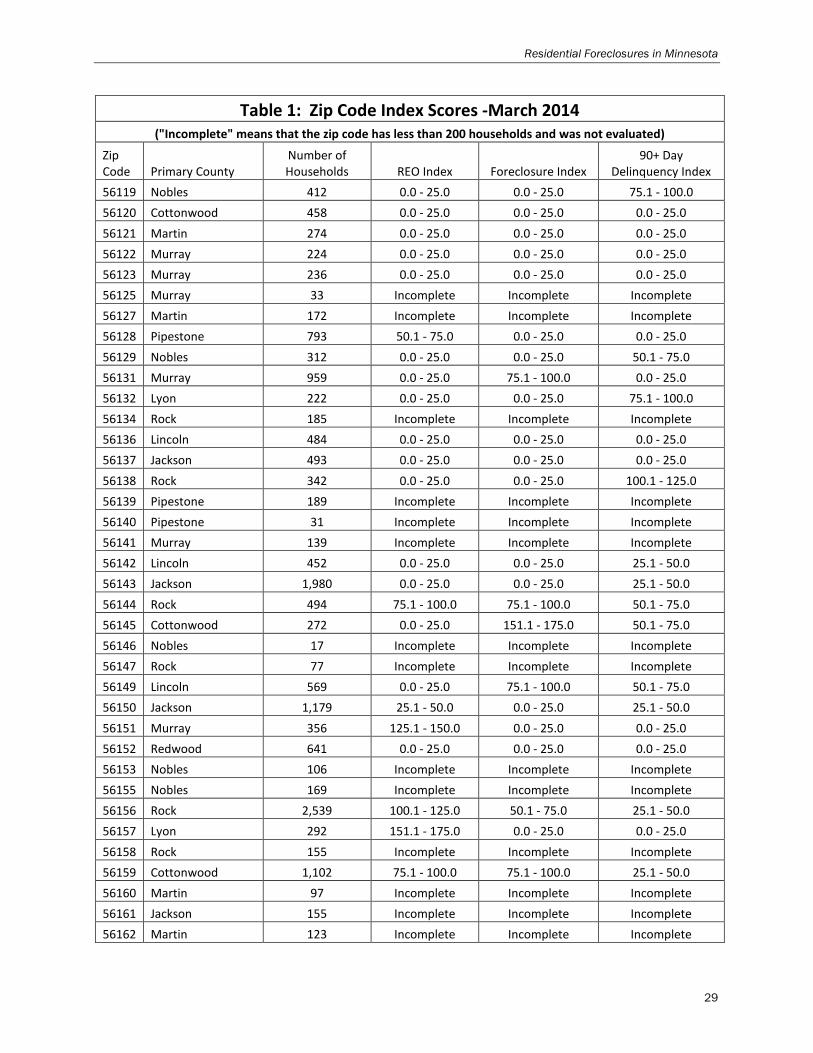
number of households that the high rate affects is also important. For example, foreclosure and REO index scores for zipcode 55412 (in North Minneapolis) are over 250. In addition, this zip code has over 8,000 households. In contrast, some of the other high score zip codes have less than 1,000 households. Table 1 in the appendix provides not only the index scores for each zip code but also the number of households.
• Some zip codes may show up as having a high delinquency or foreclosure rate because they
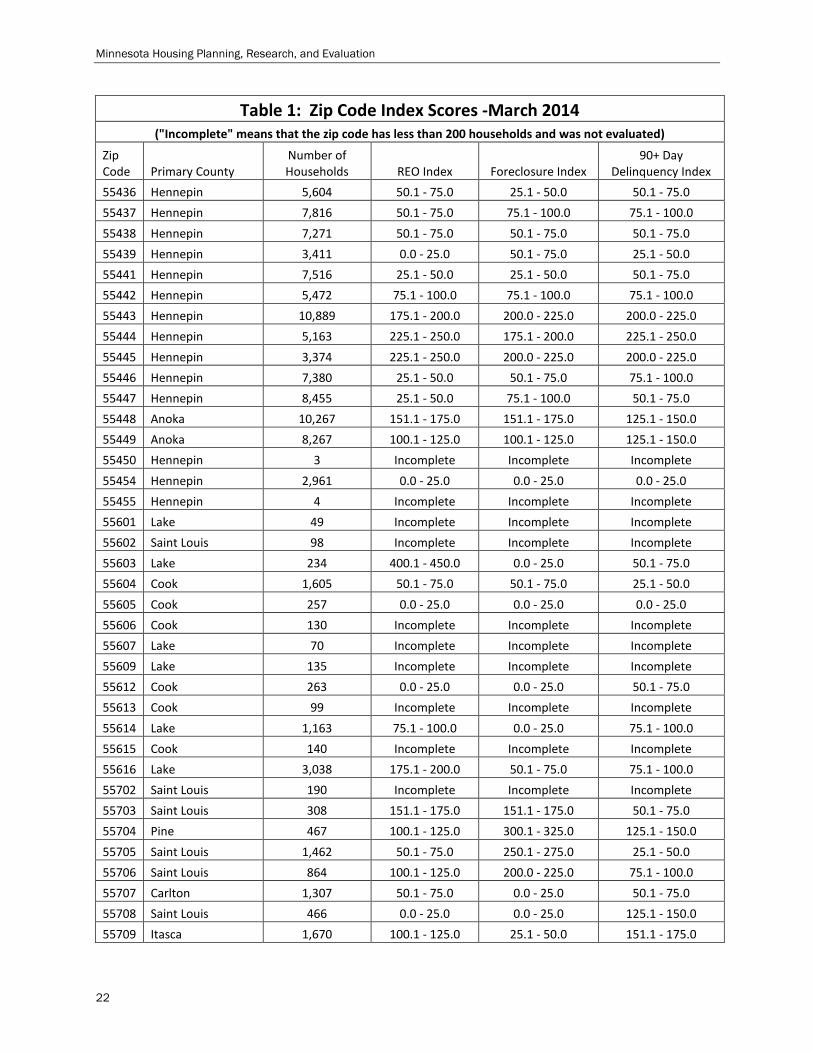
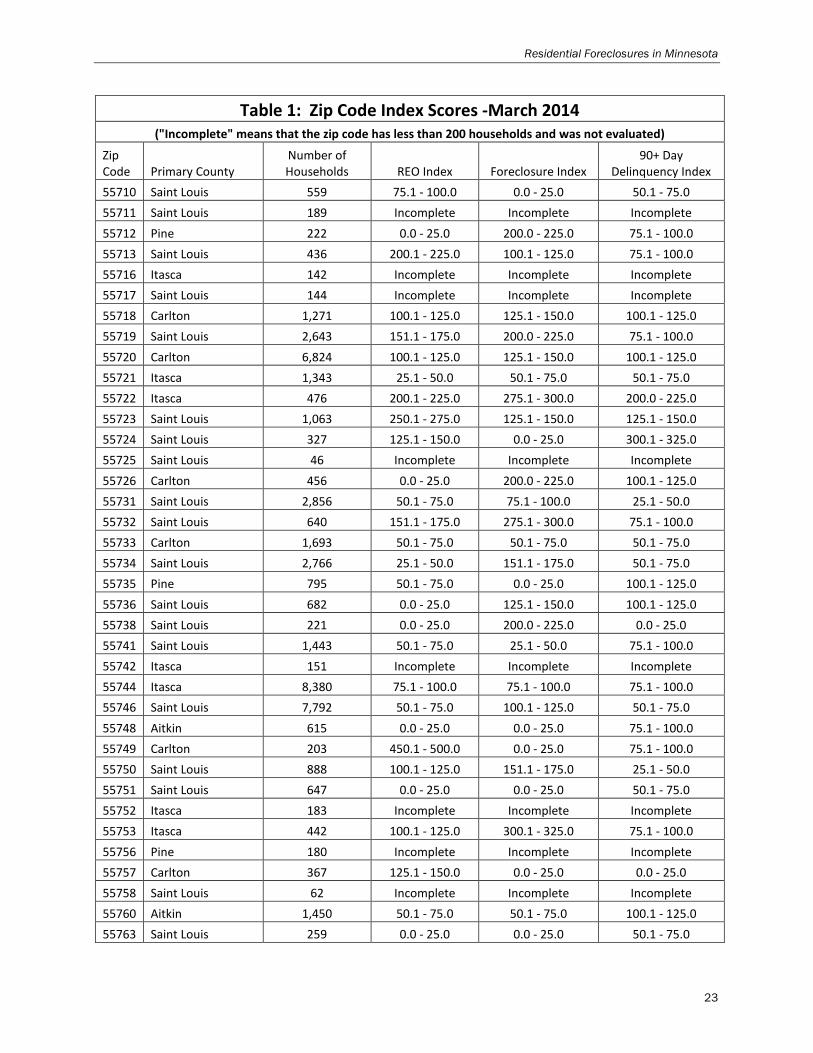
have a small number of households. If a zip code has only a few hundred households, the addition of a foreclosure or two can have a dramatic effect on the foreclosure rate. To minimize this small zip code effect, the analysis excludes zip codes with fewer than 200 households. In the maps and tables, these zip codes are coded as having “incomplete data.”
• Specific neighborhoods within a zip code may have a very high rate of delinquencies and
foreclosures even when the zip code has a lower index score. Parts of the zip code may have a very high rate, while other parts of the same zip code may have a very low rate, giving the zip code a lower index score overall. Thus, the zip-code index scores and maps do not identify all the high need areas around the state.
Minnesota Housing will continue to monitor the evolving foreclosure crisis in Minnesota. If you have questions about this report, contact Jessica Deegan at (651) 297-3120 or [email protected].
5
Minnesota Housing Planning, Research, and Evaluation
Zip Code Maps
6

Residential Foreclosures in Minnesota
Map 1a – Real Estate Owned Loans (State) Statewide-Rate: Index = 100 March 2014
Source: Minnesota Housing analysis of data from CoreLogic. Notes: The index is based on each zip code’s REO rate – the number of loans that are in REO divided by the number of households in each zip code. Each zip code’s rate is divided by the statewide rate to compute the index score. An index score of 200 means the zip code’s rate is twice the state rate, while an index score of 50 means the zip code’s rate is half the state rate.
7

Minnesota Housing Planning, Research, and Evaluation
Map 1b - Real Estate Owned Loans (Metro) Statewide-Rate: Index = 100 March 2014
Source: Minnesota Housing analysis of data from CoreLogic. Notes: The index is based on each zip code’s REO rate – the number of loans that are in REO divided by the number of households in each zip code. Each zip code’s rate is divided by the statewide rate to compute the index score. An index score of 200 means the zip code’s rate is twice the state rate, while an index score of 50 means the zip code’s rate is half the state rate.
8
Residential Foreclosures in Minnesota
Map 2a - Loans in Foreclosure (State) Statewide-Rate: Index = 100 March 2014
Source: Minnesota Housing analysis of data from CoreLogic. Notes: The index is based on each zip code’s foreclosure rate – the number of loans that are in foreclosure divided by the number of households in each zip code. Each zip code’s rate is divided by the statewide rate to compute the index score. An index score of 200 means the zip code’s rate is twice the state rate, while an index score of 50 means the zip code’s rate is half the state rate.
9
Minnesota Housing Planning, Research, and Evaluation
Map 2b - Loans in Foreclosure (Metro) Statewide-Rate: Index = 100 March 2014
Source: Minnesota Housing analysis of data from CoreLogic. Notes: The index is based on each zip code’s foreclosure rate – the number of loans that are in foreclosure divided by the number of households in each zip code. Each zip code’s rate is divided by the statewide rate to compute the index score. An index score of 200 means the zip code’s rate is twice the state rate, while an index score of 50 means the zip code’s rate is half the state rate.
10

Residential Foreclosures in Minnesota
Map 3a - Loans in Delinquency (State) Statewide-Rate: Index = 100 March 2014
Source: Minnesota Housing analysis of data from CoreLogic. Notes: The index is based on each zip code’s delinquency rate – the number of loans that are 90 or more days past due divided by the number of households in each zip code. Each zip code’s rate is divided by the statewide rate to compute the index score. An index score of 200 means the zip code’s rate is twice the state rate, while an index score of 50 means the zip code’s rate is half the state rate.
11
Minnesota Housing Planning, Research, and Evaluation
Map 3b - Loans in Delinquency (Metro) Statewide-Rate: Index = 100 March 2014
Source: Minnesota Housing analysis of data CoreLogic. Notes: The index is based on each zip code’s delinquency rate – the number of loans that are 90 or more days past due divided by the number of households in each zip code. Each zip code’s rate is divided by the statewide rate to compute the index score. An index score of 200 means the zip code’s rate is twice the state rate, while an index score of 50 means the zip code’s rate is half the state rate.
12
Residential Foreclosures in Minnesota
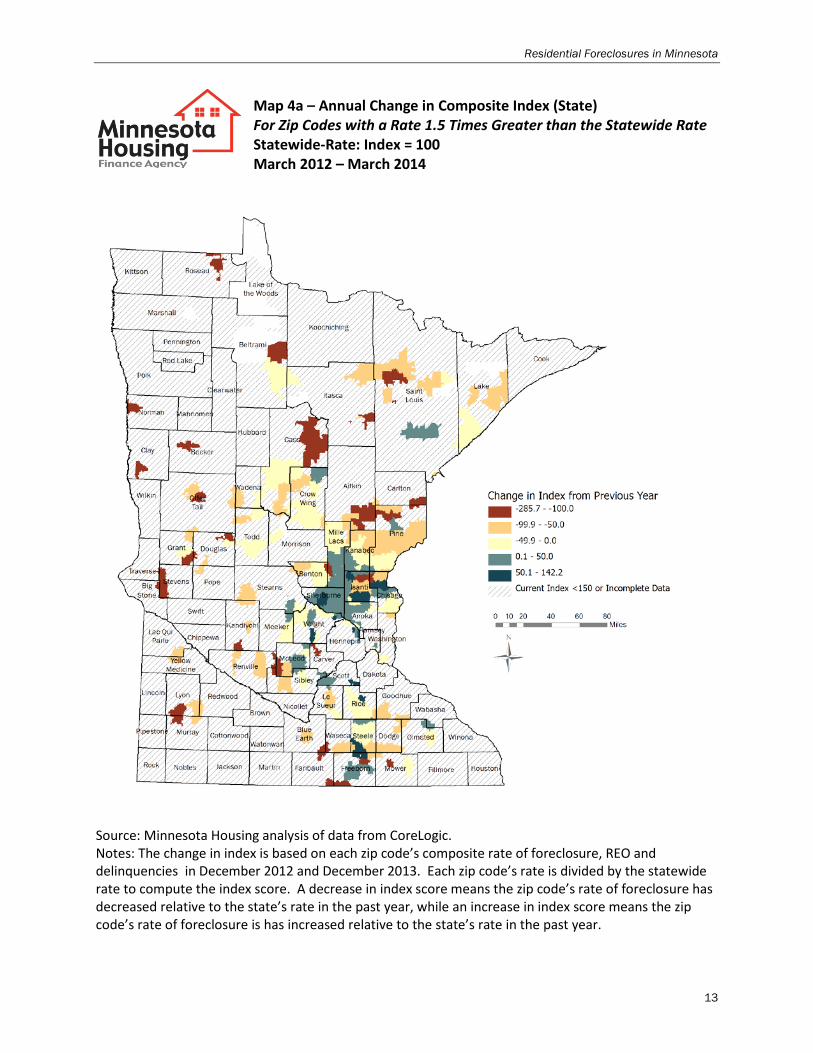
Map 4a – Annual Change in Composite Index (State) For Zip Codes with a Rate 1.5 Times Greater than the Statewide Rate Statewide-Rate: Index = 100 March 2012 – March 2014
Source: Minnesota Housing analysis of data from CoreLogic. Notes: The change in index is based on each zip code’s composite rate of foreclosure, REO and delinquencies in December 2012 and December 2013. Each zip code’s rate is divided by the statewide rate to compute the index score. A decrease in index score means the zip code’s rate of foreclosure has decreased relative to the state’s rate in the past year, while an increase in index score means the zip code’s rate of foreclosure is has increased relative to the state’s rate in the past year.
13
Minnesota Housing Planning, Research, and Evaluation
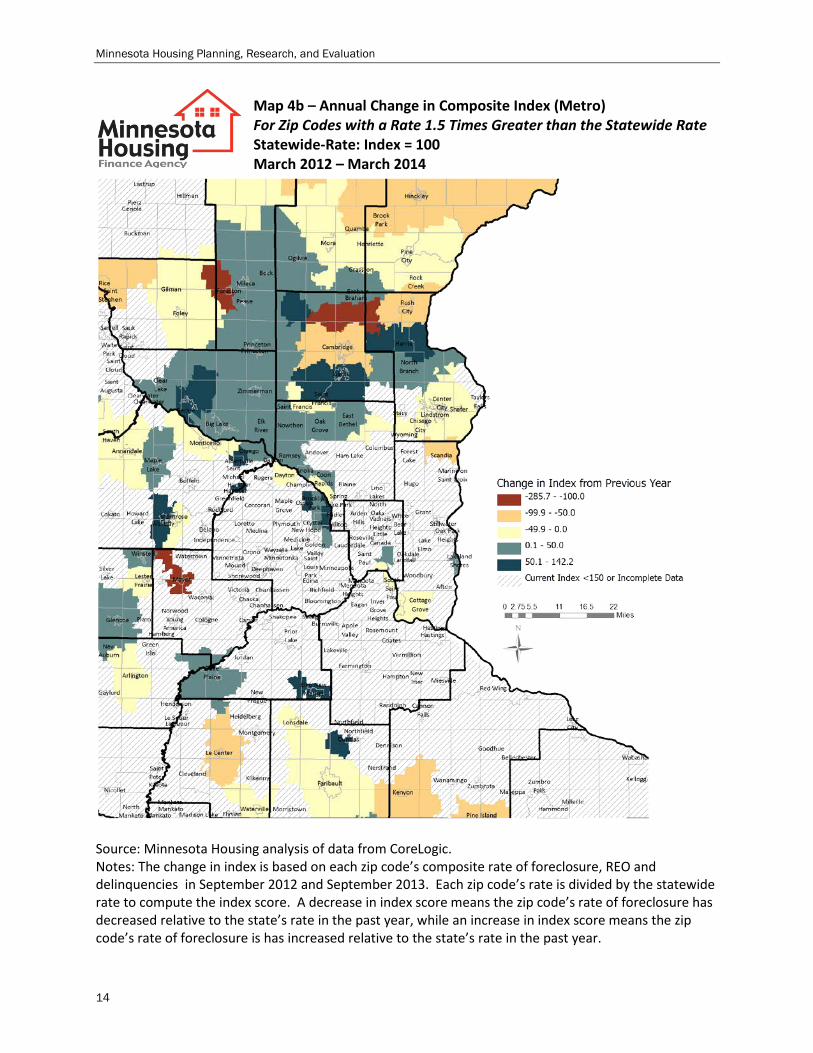
Map 4b – Annual Change in Composite Index (Metro) For Zip Codes with a Rate 1.5 Times Greater than the Statewide Rate Statewide-Rate: Index = 100 March 2012 – March 2014
Source: Minnesota Housing analysis of data from CoreLogic. Notes: The change in index is based on each zip code’s composite rate of foreclosure, REO and delinquencies in September 2012 and September 2013. Each zip code’s rate is divided by the statewide rate to compute the index score. A decrease in index score means the zip code’s rate of foreclosure has decreased relative to the state’s rate in the past year, while an increase in index score means the zip code’s rate of foreclosure is has increased relative to the state’s rate in the past year.
14
Residential Foreclosures in Minnesota
Appendix A - Zip Code Tables - Index Scores
15

Minnesota Housing Planning, Research, and Evaluation
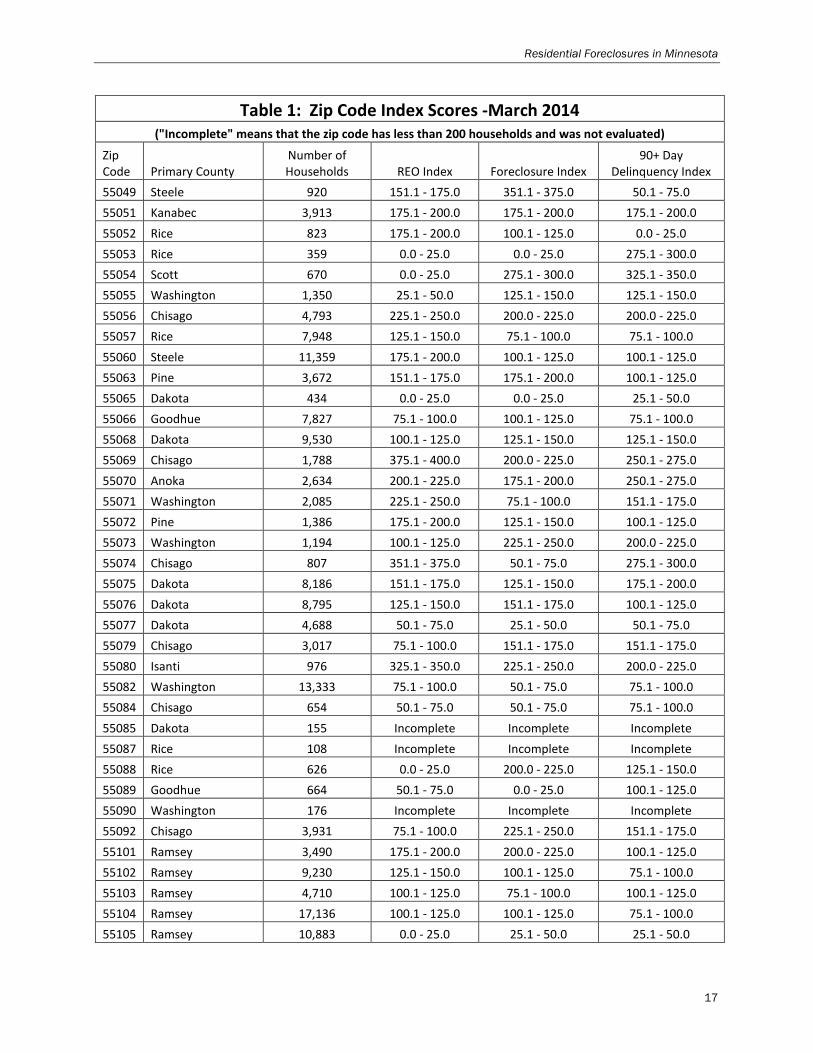
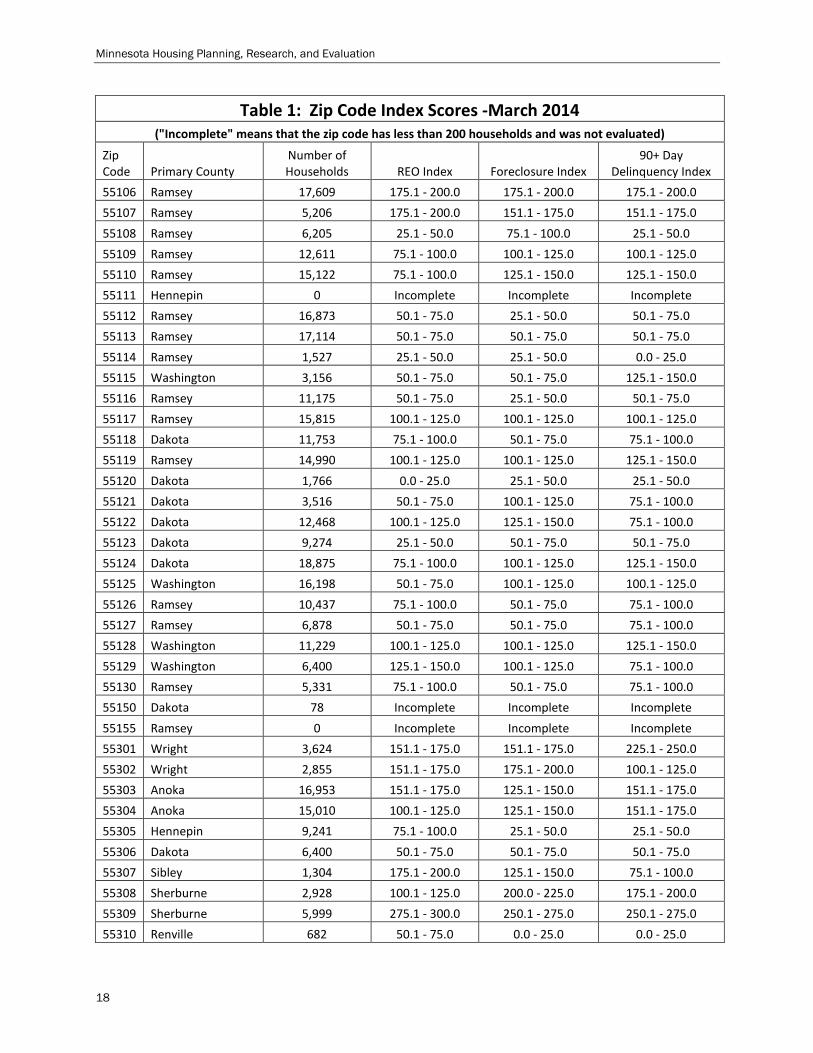
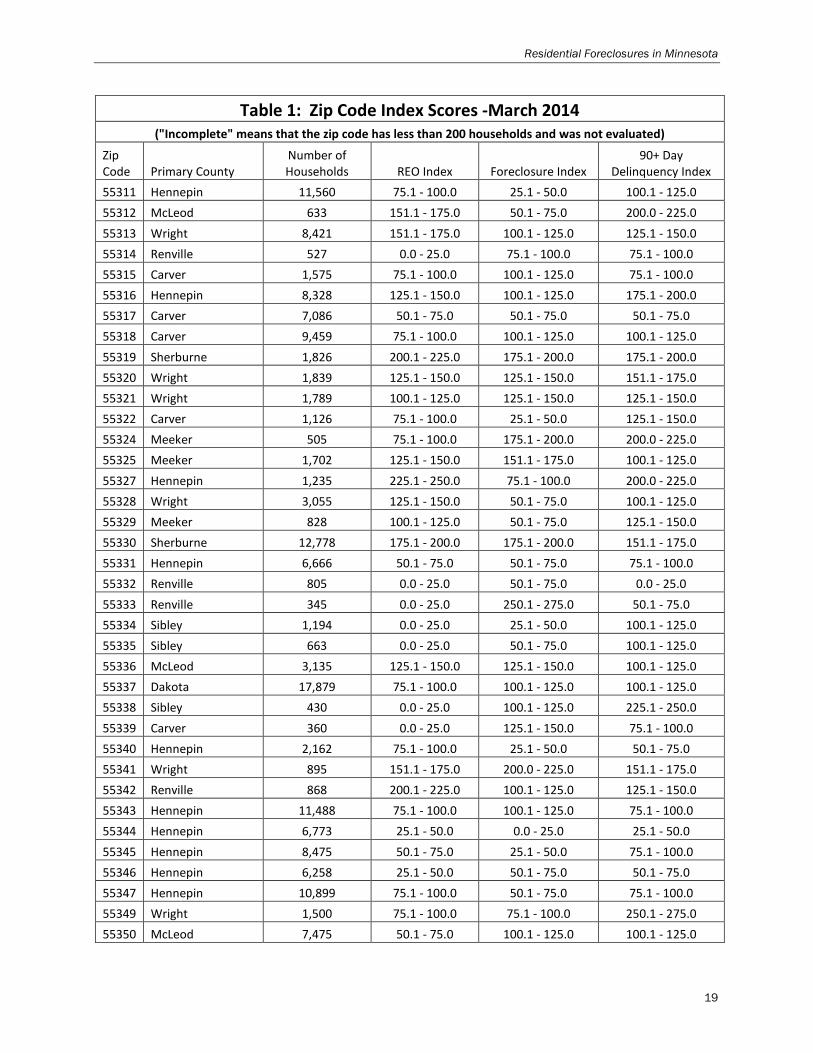
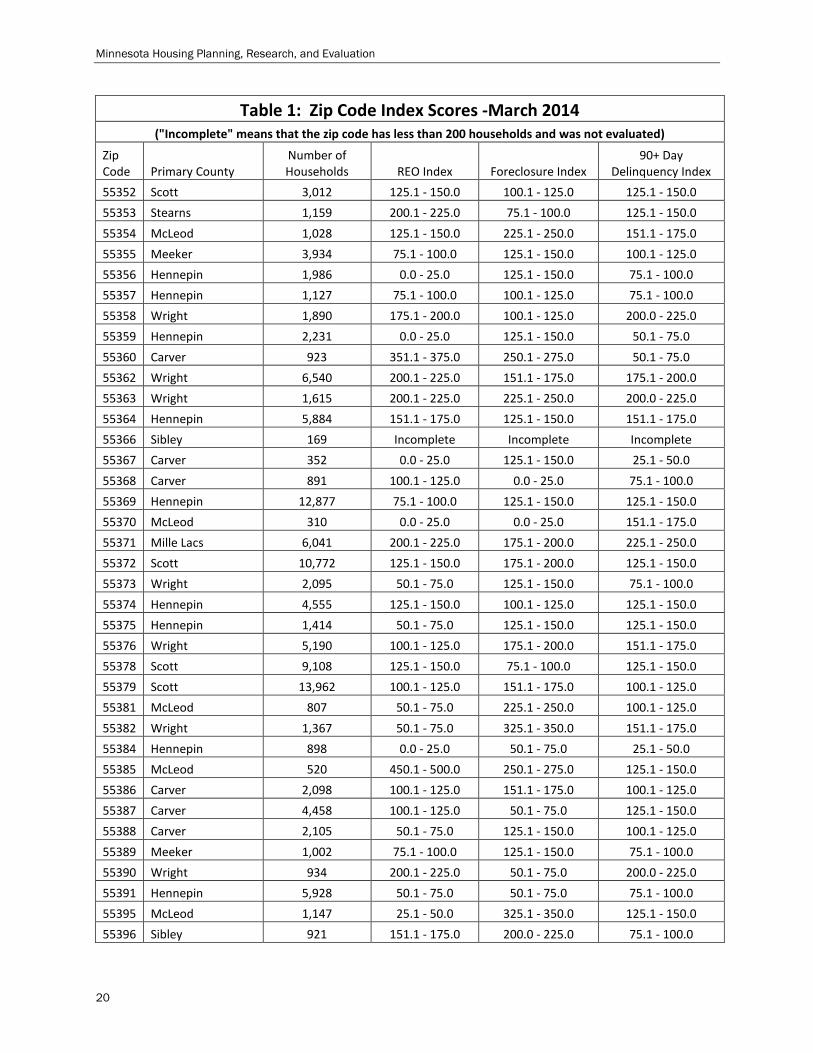
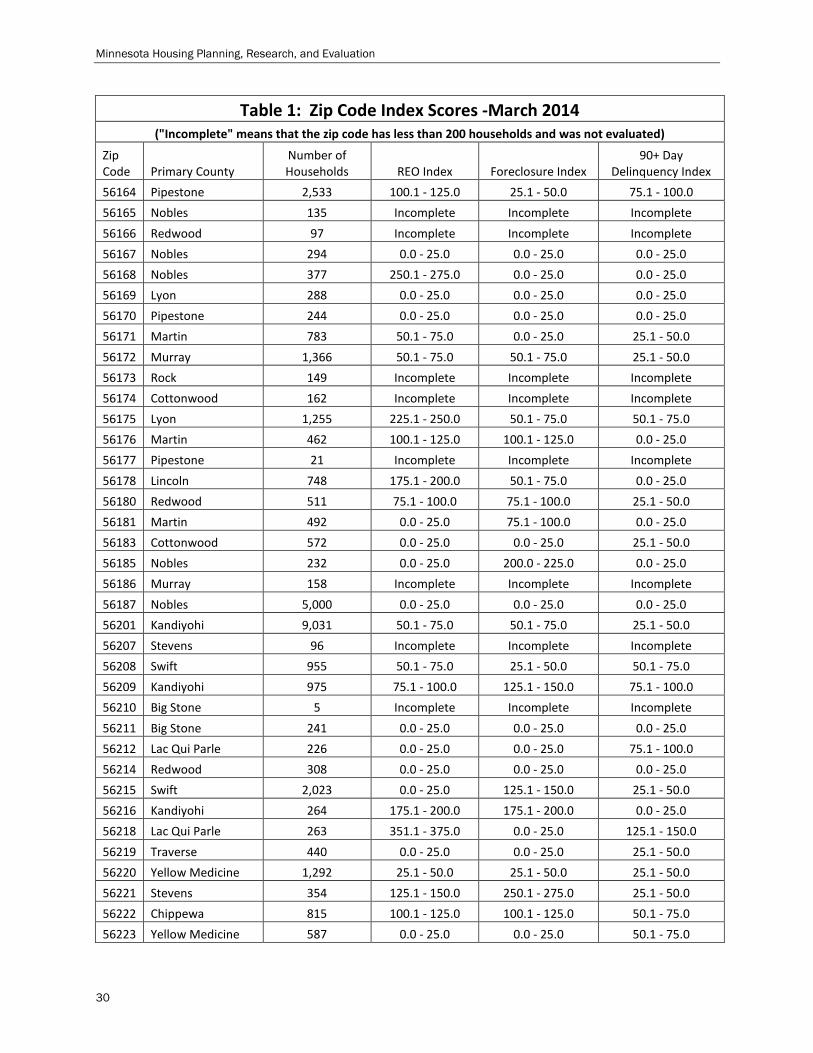
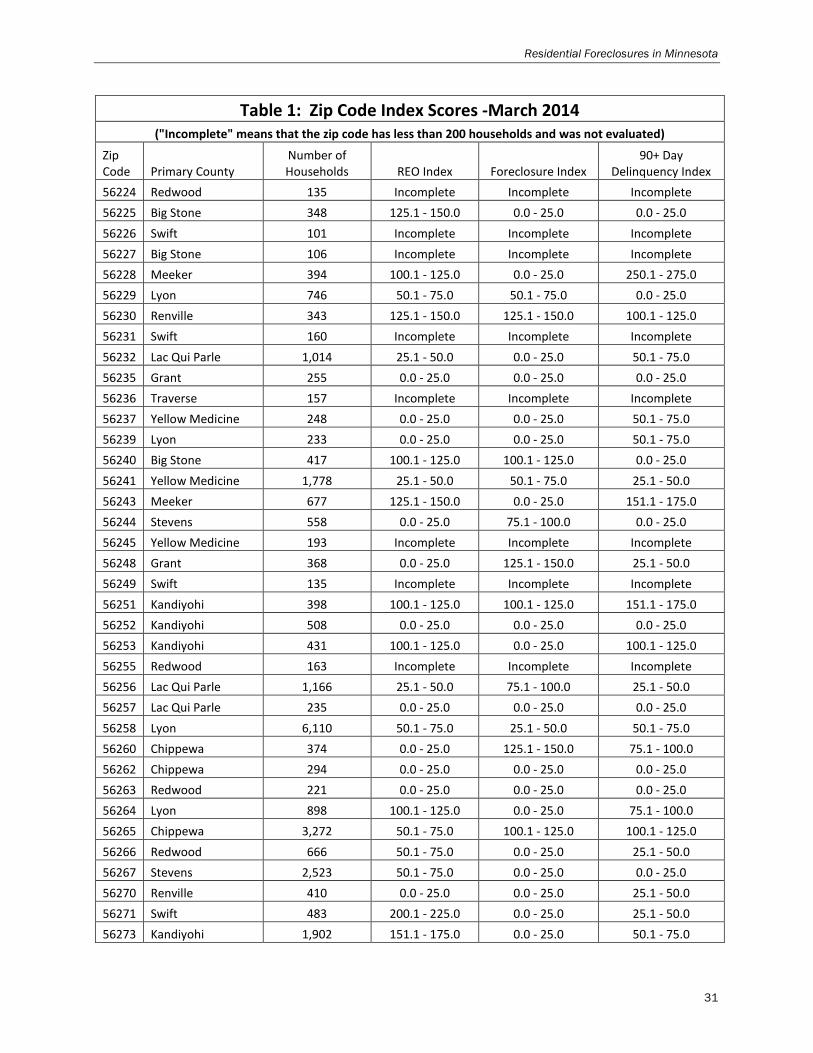
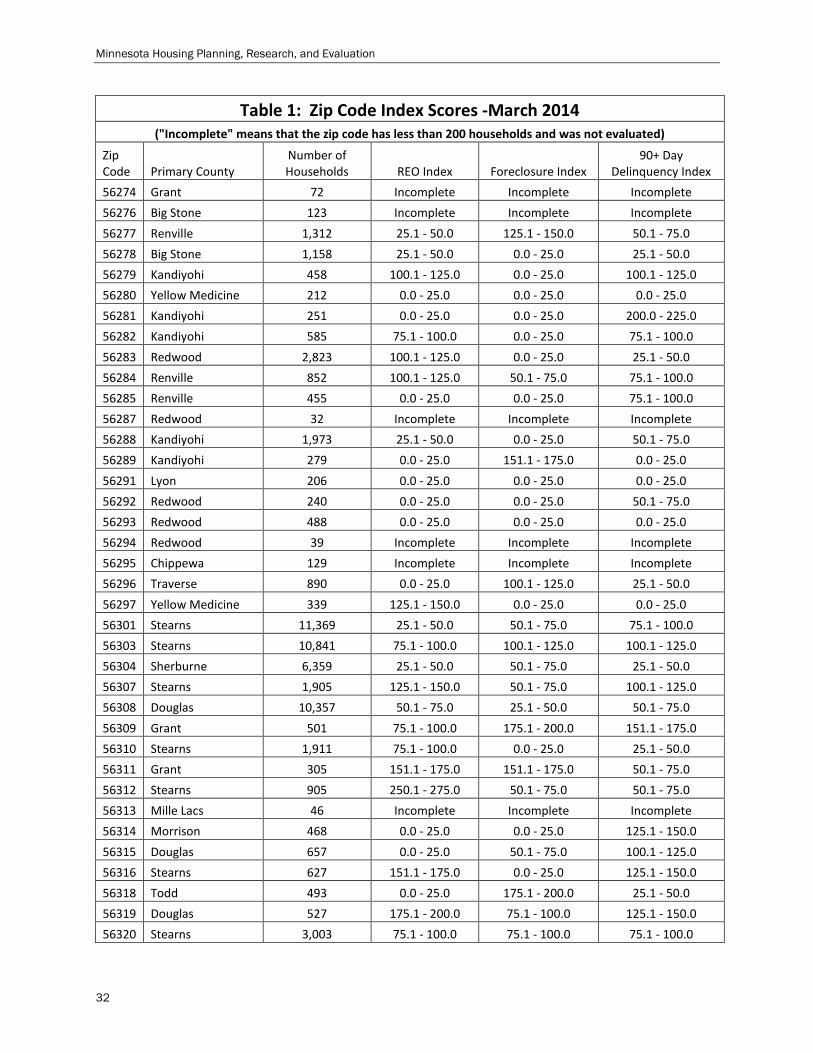
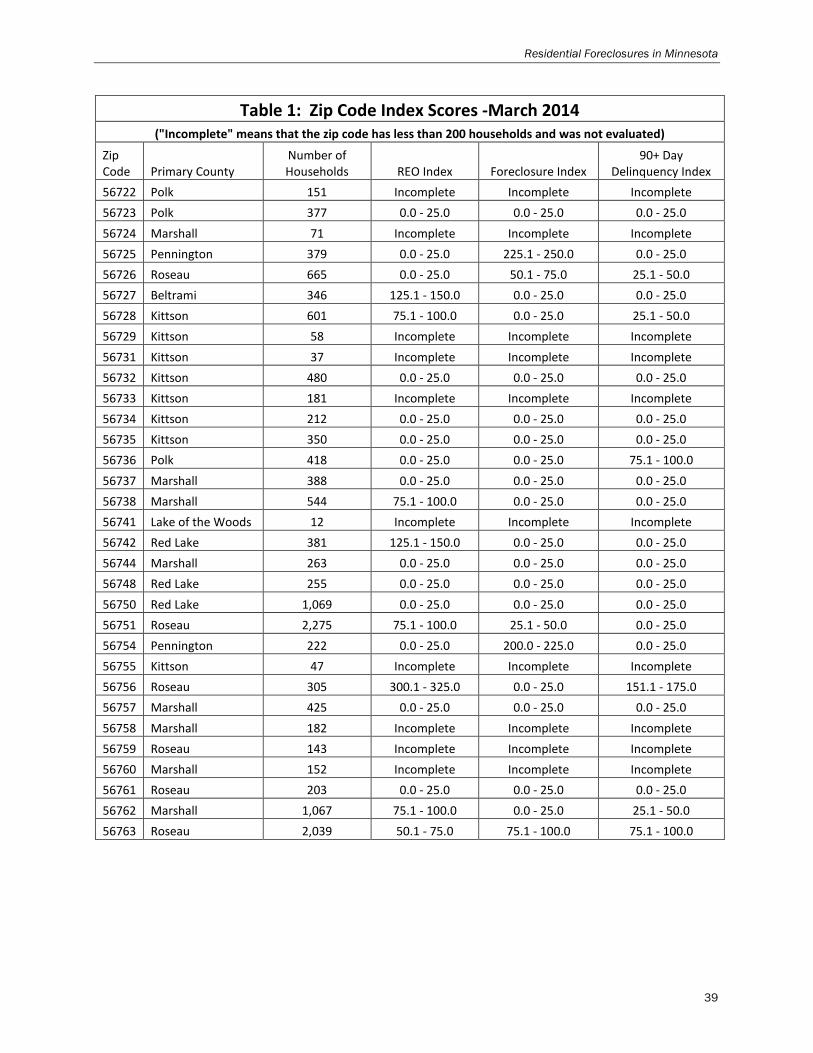
Table 1: Zip Code Index Scores -March 2014 ("Incomplete" means that the zip code has less than 200 households and was not evaluated)
Zip Code Primary County
Number of Households REO Index Foreclosure Index
90+ Day Delinquency Index
55001 Washington 1,090 25.1 - 50.0 151.1 - 175.0 50.1 - 75.0 55003 Washington 855 100.1 - 125.0 100.1 - 125.0 50.1 - 75.0 55005 Anoka 1,509 275.1 - 300.0 100.1 - 125.0 175.1 - 200.0 55006 Isanti 1,548 200.1 - 225.0 100.1 - 125.0 200.0 - 225.0 55007 Kanabec 955 250.1 - 275.0 225.1 - 250.0 175.1 - 200.0 55008 Isanti 5,545 275.1 - 300.0 200.0 - 225.0 175.1 - 200.0 55009 Goodhue 3,174 75.1 - 100.0 50.1 - 75.0 75.1 - 100.0 55011 Anoka 3,473 175.1 - 200.0 175.1 - 200.0 250.1 - 275.0 55012 Chisago 700 325.1 - 350.0 50.1 - 75.0 75.1 - 100.0 55013 Chisago 2,571 125.1 - 150.0 200.0 - 225.0 125.1 - 150.0 55014 Anoka 9,299 125.1 - 150.0 100.1 - 125.0 125.1 - 150.0 55016 Washington 11,565 151.1 - 175.0 175.1 - 200.0 151.1 - 175.0 55017 Isanti 266 175.1 - 200.0 175.1 - 200.0 450.1 - 500.0 55018 Goodhue 383 125.1 - 150.0 0.0 - 25.0 25.1 - 50.0 55019 Rice 683 200.1 - 225.0 200.0 - 225.0 175.1 - 200.0 55020 Scott 1,181 225.1 - 250.0 75.1 - 100.0 225.1 - 250.0 55021 Rice 10,748 200.1 - 225.0 125.1 - 150.0 75.1 - 100.0 55024 Dakota 10,878 100.1 - 125.0 175.1 - 200.0 151.1 - 175.0 55025 Washington 8,764 125.1 - 150.0 75.1 - 100.0 125.1 - 150.0 55026 Goodhue 187 Incomplete Incomplete Incomplete 55027 Goodhue 1,079 25.1 - 50.0 151.1 - 175.0 50.1 - 75.0 55029 Isanti 15 Incomplete Incomplete Incomplete 55030 Pine 505 375.1 - 400.0 0.0 - 25.0 200.0 - 225.0 55031 Dakota 727 50.1 - 75.0 125.1 - 150.0 100.1 - 125.0 55032 Chisago 1,311 125.1 - 150.0 175.1 - 200.0 250.1 - 275.0 55033 Dakota 11,373 100.1 - 125.0 75.1 - 100.0 100.1 - 125.0 55036 Pine 32 Incomplete Incomplete Incomplete 55037 Pine 1,994 325.1 - 350.0 0.0 - 25.0 100.1 - 125.0 55038 Washington 7,352 151.1 - 175.0 100.1 - 125.0 125.1 - 150.0 55040 Isanti 4,482 175.1 - 200.0 225.1 - 250.0 200.0 - 225.0 55041 Wabasha 3,209 50.1 - 75.0 100.1 - 125.0 50.1 - 75.0 55042 Washington 3,021 25.1 - 50.0 50.1 - 75.0 25.1 - 50.0 55043 Washington 1,411 151.1 - 175.0 125.1 - 150.0 151.1 - 175.0 55044 Dakota 15,700 100.1 - 125.0 100.1 - 125.0 100.1 - 125.0 55045 Chisago 2,897 200.1 - 225.0 175.1 - 200.0 125.1 - 150.0 55046 Rice 1,812 225.1 - 250.0 250.1 - 275.0 225.1 - 250.0 55047 Washington 1,037 175.1 - 200.0 25.1 - 50.0 75.1 - 100.0
16
Residential Foreclosures in Minnesota
Table 1: Zip Code Index Scores -March 2014 ("Incomplete" means that the zip code has less than 200 households and was not evaluated)
Zip Code Primary County
Number of Households REO Index Foreclosure Index
90+ Day Delinquency Index
55049 Steele 920 151.1 - 175.0 351.1 - 375.0 50.1 - 75.0 55051 Kanabec 3,913 175.1 - 200.0 175.1 - 200.0 175.1 - 200.0 55052 Rice 823 175.1 - 200.0 100.1 - 125.0 0.0 - 25.0 55053 Rice 359 0.0 - 25.0 0.0 - 25.0 275.1 - 300.0 55054 Scott 670 0.0 - 25.0 275.1 - 300.0 325.1 - 350.0 55055 Washington 1,350 25.1 - 50.0 125.1 - 150.0 125.1 - 150.0 55056 Chisago 4,793 225.1 - 250.0 200.0 - 225.0 200.0 - 225.0 55057 Rice 7,948 125.1 - 150.0 75.1 - 100.0 75.1 - 100.0 55060 Steele 11,359 175.1 - 200.0 100.1 - 125.0 100.1 - 125.0 55063 Pine 3,672 151.1 - 175.0 175.1 - 200.0 100.1 - 125.0 55065 Dakota 434 0.0 - 25.0 0.0 - 25.0 25.1 - 50.0 55066 Goodhue 7,827 75.1 - 100.0 100.1 - 125.0 75.1 - 100.0 55068 Dakota 9,530 100.1 - 125.0 125.1 - 150.0 125.1 - 150.0 55069 Chisago 1,788 375.1 - 400.0 200.0 - 225.0 250.1 - 275.0 55070 Anoka 2,634 200.1 - 225.0 175.1 - 200.0 250.1 - 275.0 55071 Washington 2,085 225.1 - 250.0 75.1 - 100.0 151.1 - 175.0 55072 Pine 1,386 175.1 - 200.0 125.1 - 150.0 100.1 - 125.0 55073 Washington 1,194 100.1 - 125.0 225.1 - 250.0 200.0 - 225.0 55074 Chisago 807 351.1 - 375.0 50.1 - 75.0 275.1 - 300.0 55075 Dakota 8,186 151.1 - 175.0 125.1 - 150.0 175.1 - 200.0 55076 Dakota 8,795 125.1 - 150.0 151.1 - 175.0 100.1 - 125.0 55077 Dakota 4,688 50.1 - 75.0 25.1 - 50.0 50.1 - 75.0 55079 Chisago 3,017 75.1 - 100.0 151.1 - 175.0 151.1 - 175.0 55080 Isanti 976 325.1 - 350.0 225.1 - 250.0 200.0 - 225.0 55082 Washington 13,333 75.1 - 100.0 50.1 - 75.0 75.1 - 100.0 55084 Chisago 654 50.1 - 75.0 50.1 - 75.0 75.1 - 100.0 55085 Dakota 155 Incomplete Incomplete Incomplete 55087 Rice 108 Incomplete Incomplete Incomplete 55088 Rice 626 0.0 - 25.0 200.0 - 225.0 125.1 - 150.0 55089 Goodhue 664 50.1 - 75.0 0.0 - 25.0 100.1 - 125.0 55090 Washington 176 Incomplete Incomplete Incomplete 55092 Chisago 3,931 75.1 - 100.0 225.1 - 250.0 151.1 - 175.0 55101 Ramsey 3,490 175.1 - 200.0 200.0 - 225.0 100.1 - 125.0 55102 Ramsey 9,230 125.1 - 150.0 100.1 - 125.0 75.1 - 100.0 55103 Ramsey 4,710 100.1 - 125.0 75.1 - 100.0 100.1 - 125.0 55104 Ramsey 17,136 100.1 - 125.0 100.1 - 125.0 75.1 - 100.0 55105 Ramsey 10,883 0.0 - 25.0 25.1 - 50.0 25.1 - 50.0
17
Minnesota Housing Planning, Research, and Evaluation
Table 1: Zip Code Index Scores -March 2014 ("Incomplete" means that the zip code has less than 200 households and was not evaluated)
Zip Code Primary County
Number of Households REO Index Foreclosure Index
90+ Day Delinquency Index
55106 Ramsey 17,609 175.1 - 200.0 175.1 - 200.0 175.1 - 200.0 55107 Ramsey 5,206 175.1 - 200.0 151.1 - 175.0 151.1 - 175.0 55108 Ramsey 6,205 25.1 - 50.0 75.1 - 100.0 25.1 - 50.0 55109 Ramsey 12,611 75.1 - 100.0 100.1 - 125.0 100.1 - 125.0 55110 Ramsey 15,122 75.1 - 100.0 125.1 - 150.0 125.1 - 150.0 55111 Hennepin 0 Incomplete Incomplete Incomplete 55112 Ramsey 16,873 50.1 - 75.0 25.1 - 50.0 50.1 - 75.0 55113 Ramsey 17,114 50.1 - 75.0 50.1 - 75.0 50.1 - 75.0 55114 Ramsey 1,527 25.1 - 50.0 25.1 - 50.0 0.0 - 25.0 55115 Washington 3,156 50.1 - 75.0 50.1 - 75.0 125.1 - 150.0 55116 Ramsey 11,175 50.1 - 75.0 25.1 - 50.0 50.1 - 75.0 55117 Ramsey 15,815 100.1 - 125.0 100.1 - 125.0 100.1 - 125.0 55118 Dakota 11,753 75.1 - 100.0 50.1 - 75.0 75.1 - 100.0 55119 Ramsey 14,990 100.1 - 125.0 100.1 - 125.0 125.1 - 150.0 55120 Dakota 1,766 0.0 - 25.0 25.1 - 50.0 25.1 - 50.0 55121 Dakota 3,516 50.1 - 75.0 100.1 - 125.0 75.1 - 100.0 55122 Dakota 12,468 100.1 - 125.0 125.1 - 150.0 75.1 - 100.0 55123 Dakota 9,274 25.1 - 50.0 50.1 - 75.0 50.1 - 75.0 55124 Dakota 18,875 75.1 - 100.0 100.1 - 125.0 125.1 - 150.0 55125 Washington 16,198 50.1 - 75.0 100.1 - 125.0 100.1 - 125.0 55126 Ramsey 10,437 75.1 - 100.0 50.1 - 75.0 75.1 - 100.0 55127 Ramsey 6,878 50.1 - 75.0 50.1 - 75.0 75.1 - 100.0 55128 Washington 11,229 100.1 - 125.0 100.1 - 125.0 125.1 - 150.0 55129 Washington 6,400 125.1 - 150.0 100.1 - 125.0 75.1 - 100.0 55130 Ramsey 5,331 75.1 - 100.0 50.1 - 75.0 75.1 - 100.0 55150 Dakota 78 Incomplete Incomplete Incomplete 55155 Ramsey 0 Incomplete Incomplete Incomplete 55301 Wright 3,624 151.1 - 175.0 151.1 - 175.0 225.1 - 250.0 55302 Wright 2,855 151.1 - 175.0 175.1 - 200.0 100.1 - 125.0 55303 Anoka 16,953 151.1 - 175.0 125.1 - 150.0 151.1 - 175.0 55304 Anoka 15,010 100.1 - 125.0 125.1 - 150.0 151.1 - 175.0 55305 Hennepin 9,241 75.1 - 100.0 25.1 - 50.0 25.1 - 50.0 55306 Dakota 6,400 50.1 - 75.0 50.1 - 75.0 50.1 - 75.0 55307 Sibley 1,304 175.1 - 200.0 125.1 - 150.0 75.1 - 100.0 55308 Sherburne 2,928 100.1 - 125.0 200.0 - 225.0 175.1 - 200.0 55309 Sherburne 5,999 275.1 - 300.0 250.1 - 275.0 250.1 - 275.0 55310 Renville 682 50.1 - 75.0 0.0 - 25.0 0.0 - 25.0
18
Residential Foreclosures in Minnesota
Table 1: Zip Code Index Scores -March 2014 ("Incomplete" means that the zip code has less than 200 households and was not evaluated)
Zip Code Primary County
Number of Households REO Index Foreclosure Index
90+ Day Delinquency Index
55311 Hennepin 11,560 75.1 - 100.0 25.1 - 50.0 100.1 - 125.0 55312 McLeod 633 151.1 - 175.0 50.1 - 75.0 200.0 - 225.0 55313 Wright 8,421 151.1 - 175.0 100.1 - 125.0 125.1 - 150.0 55314 Renville 527 0.0 - 25.0 75.1 - 100.0 75.1 - 100.0 55315 Carver 1,575 75.1 - 100.0 100.1 - 125.0 75.1 - 100.0 55316 Hennepin 8,328 125.1 - 150.0 100.1 - 125.0 175.1 - 200.0 55317 Carver 7,086 50.1 - 75.0 50.1 - 75.0 50.1 - 75.0 55318 Carver 9,459 75.1 - 100.0 100.1 - 125.0 100.1 - 125.0 55319 Sherburne 1,826 200.1 - 225.0 175.1 - 200.0 175.1 - 200.0 55320 Wright 1,839 125.1 - 150.0 125.1 - 150.0 151.1 - 175.0 55321 Wright 1,789 100.1 - 125.0 125.1 - 150.0 125.1 - 150.0 55322 Carver 1,126 75.1 - 100.0 25.1 - 50.0 125.1 - 150.0 55324 Meeker 505 75.1 - 100.0 175.1 - 200.0 200.0 - 225.0 55325 Meeker 1,702 125.1 - 150.0 151.1 - 175.0 100.1 - 125.0 55327 Hennepin 1,235 225.1 - 250.0 75.1 - 100.0 200.0 - 225.0 55328 Wright 3,055 125.1 - 150.0 50.1 - 75.0 100.1 - 125.0 55329 Meeker 828 100.1 - 125.0 50.1 - 75.0 125.1 - 150.0 55330 Sherburne 12,778 175.1 - 200.0 175.1 - 200.0 151.1 - 175.0 55331 Hennepin 6,666 50.1 - 75.0 50.1 - 75.0 75.1 - 100.0 55332 Renville 805 0.0 - 25.0 50.1 - 75.0 0.0 - 25.0 55333 Renville 345 0.0 - 25.0 250.1 - 275.0 50.1 - 75.0 55334 Sibley 1,194 0.0 - 25.0 25.1 - 50.0 100.1 - 125.0 55335 Sibley 663 0.0 - 25.0 50.1 - 75.0 100.1 - 125.0 55336 McLeod 3,135 125.1 - 150.0 125.1 - 150.0 100.1 - 125.0 55337 Dakota 17,879 75.1 - 100.0 100.1 - 125.0 100.1 - 125.0 55338 Sibley 430 0.0 - 25.0 100.1 - 125.0 225.1 - 250.0 55339 Carver 360 0.0 - 25.0 125.1 - 150.0 75.1 - 100.0 55340 Hennepin 2,162 75.1 - 100.0 25.1 - 50.0 50.1 - 75.0 55341 Wright 895 151.1 - 175.0 200.0 - 225.0 151.1 - 175.0 55342 Renville 868 200.1 - 225.0 100.1 - 125.0 125.1 - 150.0 55343 Hennepin 11,488 75.1 - 100.0 100.1 - 125.0 75.1 - 100.0 55344 Hennepin 6,773 25.1 - 50.0 0.0 - 25.0 25.1 - 50.0 55345 Hennepin 8,475 50.1 - 75.0 25.1 - 50.0 75.1 - 100.0 55346 Hennepin 6,258 25.1 - 50.0 50.1 - 75.0 50.1 - 75.0 55347 Hennepin 10,899 75.1 - 100.0 50.1 - 75.0 75.1 - 100.0 55349 Wright 1,500 75.1 - 100.0 75.1 - 100.0 250.1 - 275.0 55350 McLeod 7,475 50.1 - 75.0 100.1 - 125.0 100.1 - 125.0
19
Minnesota Housing Planning, Research, and Evaluation
Table 1: Zip Code Index Scores -March 2014 ("Incomplete" means that the zip code has less than 200 households and was not evaluated)
Zip Code Primary County
Number of Households REO Index Foreclosure Index
90+ Day Delinquency Index
55352 Scott 3,012 125.1 - 150.0 100.1 - 125.0 125.1 - 150.0 55353 Stearns 1,159 200.1 - 225.0 75.1 - 100.0 125.1 - 150.0 55354 McLeod 1,028 125.1 - 150.0 225.1 - 250.0 151.1 - 175.0 55355 Meeker 3,934 75.1 - 100.0 125.1 - 150.0 100.1 - 125.0 55356 Hennepin 1,986 0.0 - 25.0 125.1 - 150.0 75.1 - 100.0 55357 Hennepin 1,127 75.1 - 100.0 100.1 - 125.0 75.1 - 100.0 55358 Wright 1,890 175.1 - 200.0 100.1 - 125.0 200.0 - 225.0 55359 Hennepin 2,231 0.0 - 25.0 125.1 - 150.0 50.1 - 75.0 55360 Carver 923 351.1 - 375.0 250.1 - 275.0 50.1 - 75.0 55362 Wright 6,540 200.1 - 225.0 151.1 - 175.0 175.1 - 200.0 55363 Wright 1,615 200.1 - 225.0 225.1 - 250.0 200.0 - 225.0 55364 Hennepin 5,884 151.1 - 175.0 125.1 - 150.0 151.1 - 175.0 55366 Sibley 169 Incomplete Incomplete Incomplete 55367 Carver 352 0.0 - 25.0 125.1 - 150.0 25.1 - 50.0 55368 Carver 891 100.1 - 125.0 0.0 - 25.0 75.1 - 100.0 55369 Hennepin 12,877 75.1 - 100.0 125.1 - 150.0 125.1 - 150.0 55370 McLeod 310 0.0 - 25.0 0.0 - 25.0 151.1 - 175.0 55371 Mille Lacs 6,041 200.1 - 225.0 175.1 - 200.0 225.1 - 250.0 55372 Scott 10,772 125.1 - 150.0 175.1 - 200.0 125.1 - 150.0 55373 Wright 2,095 50.1 - 75.0 125.1 - 150.0 75.1 - 100.0 55374 Hennepin 4,555 125.1 - 150.0 100.1 - 125.0 125.1 - 150.0 55375 Hennepin 1,414 50.1 - 75.0 125.1 - 150.0 125.1 - 150.0 55376 Wright 5,190 100.1 - 125.0 175.1 - 200.0 151.1 - 175.0 55378 Scott 9,108 125.1 - 150.0 75.1 - 100.0 125.1 - 150.0 55379 Scott 13,962 100.1 - 125.0 151.1 - 175.0 100.1 - 125.0 55381 McLeod 807 50.1 - 75.0 225.1 - 250.0 100.1 - 125.0 55382 Wright 1,367 50.1 - 75.0 325.1 - 350.0 151.1 - 175.0 55384 Hennepin 898 0.0 - 25.0 50.1 - 75.0 25.1 - 50.0 55385 McLeod 520 450.1 - 500.0 250.1 - 275.0 125.1 - 150.0 55386 Carver 2,098 100.1 - 125.0 151.1 - 175.0 100.1 - 125.0 55387 Carver 4,458 100.1 - 125.0 50.1 - 75.0 125.1 - 150.0 55388 Carver 2,105 50.1 - 75.0 125.1 - 150.0 100.1 - 125.0 55389 Meeker 1,002 75.1 - 100.0 125.1 - 150.0 75.1 - 100.0 55390 Wright 934 200.1 - 225.0 50.1 - 75.0 200.0 - 225.0 55391 Hennepin 5,928 50.1 - 75.0 50.1 - 75.0 75.1 - 100.0 55395 McLeod 1,147 25.1 - 50.0 325.1 - 350.0 125.1 - 150.0 55396 Sibley 921 151.1 - 175.0 200.0 - 225.0 75.1 - 100.0
20
Residential Foreclosures in Minnesota
Table 1: Zip Code Index Scores -March 2014 ("Incomplete" means that the zip code has less than 200 households and was not evaluated)
Zip Code Primary County
Number of Households REO Index Foreclosure Index
90+ Day Delinquency Index
55397 Carver 1,021 125.1 - 150.0 75.1 - 100.0 200.0 - 225.0 55398 Sherburne 5,270 225.1 - 250.0 225.1 - 250.0 250.1 - 275.0 55401 Hennepin 4,382 75.1 - 100.0 50.1 - 75.0 25.1 - 50.0 55402 Hennepin 303 0.0 - 25.0 0.0 - 25.0 100.1 - 125.0 55403 Hennepin 10,121 25.1 - 50.0 0.0 - 25.0 0.0 - 25.0 55404 Hennepin 11,793 25.1 - 50.0 50.1 - 75.0 25.1 - 50.0 55405 Hennepin 7,356 25.1 - 50.0 50.1 - 75.0 50.1 - 75.0 55406 Hennepin 14,765 125.1 - 150.0 100.1 - 125.0 75.1 - 100.0 55407 Hennepin 13,848 75.1 - 100.0 100.1 - 125.0 125.1 - 150.0 55408 Hennepin 14,454 25.1 - 50.0 50.1 - 75.0 25.1 - 50.0 55409 Hennepin 4,822 100.1 - 125.0 125.1 - 150.0 50.1 - 75.0 55410 Hennepin 8,535 0.0 - 25.0 75.1 - 100.0 50.1 - 75.0 55411 Hennepin 8,505 175.1 - 200.0 200.0 - 225.0 200.0 - 225.0 55412 Hennepin 8,167 300.1 - 325.0 225.1 - 250.0 250.1 - 275.0 55413 Hennepin 6,094 75.1 - 100.0 75.1 - 100.0 50.1 - 75.0 55414 Hennepin 10,169 0.0 - 25.0 25.1 - 50.0 0.0 - 25.0 55415 Hennepin 981 125.1 - 150.0 0.0 - 25.0 25.1 - 50.0 55416 Hennepin 14,837 25.1 - 50.0 25.1 - 50.0 50.1 - 75.0 55417 Hennepin 10,739 125.1 - 150.0 125.1 - 150.0 75.1 - 100.0 55418 Hennepin 12,891 100.1 - 125.0 75.1 - 100.0 75.1 - 100.0 55419 Hennepin 10,831 25.1 - 50.0 50.1 - 75.0 50.1 - 75.0 55420 Hennepin 9,112 50.1 - 75.0 75.1 - 100.0 100.1 - 125.0 55421 Anoka 11,430 100.1 - 125.0 125.1 - 150.0 125.1 - 150.0 55422 Hennepin 11,990 125.1 - 150.0 151.1 - 175.0 125.1 - 150.0 55423 Hennepin 14,875 75.1 - 100.0 100.1 - 125.0 100.1 - 125.0 55424 Hennepin 3,435 25.1 - 50.0 50.1 - 75.0 50.1 - 75.0 55425 Hennepin 3,790 75.1 - 100.0 75.1 - 100.0 25.1 - 50.0 55426 Hennepin 11,472 50.1 - 75.0 75.1 - 100.0 50.1 - 75.0 55427 Hennepin 9,750 75.1 - 100.0 100.1 - 125.0 75.1 - 100.0 55428 Hennepin 11,643 125.1 - 150.0 125.1 - 150.0 125.1 - 150.0 55429 Hennepin 9,935 151.1 - 175.0 125.1 - 150.0 151.1 - 175.0 55430 Hennepin 7,756 151.1 - 175.0 200.0 - 225.0 200.0 - 225.0 55431 Hennepin 7,914 50.1 - 75.0 75.1 - 100.0 75.1 - 100.0 55432 Anoka 12,342 75.1 - 100.0 151.1 - 175.0 100.1 - 125.0 55433 Anoka 13,265 100.1 - 125.0 200.0 - 225.0 151.1 - 175.0 55434 Anoka 10,993 100.1 - 125.0 175.1 - 200.0 151.1 - 175.0 55435 Hennepin 6,273 0.0 - 25.0 25.1 - 50.0 0.0 - 25.0
21
Minnesota Housing Planning, Research, and Evaluation
Table 1: Zip Code Index Scores -March 2014 ("Incomplete" means that the zip code has less than 200 households and was not evaluated)
Zip Code Primary County
Number of Households REO Index Foreclosure Index
90+ Day Delinquency Index
55436 Hennepin 5,604 50.1 - 75.0 25.1 - 50.0 50.1 - 75.0 55437 Hennepin 7,816 50.1 - 75.0 75.1 - 100.0 75.1 - 100.0 55438 Hennepin 7,271 50.1 - 75.0 50.1 - 75.0 50.1 - 75.0 55439 Hennepin 3,411 0.0 - 25.0 50.1 - 75.0 25.1 - 50.0 55441 Hennepin 7,516 25.1 - 50.0 25.1 - 50.0 50.1 - 75.0 55442 Hennepin 5,472 75.1 - 100.0 75.1 - 100.0 75.1 - 100.0 55443 Hennepin 10,889 175.1 - 200.0 200.0 - 225.0 200.0 - 225.0 55444 Hennepin 5,163 225.1 - 250.0 175.1 - 200.0 225.1 - 250.0 55445 Hennepin 3,374 225.1 - 250.0 200.0 - 225.0 200.0 - 225.0 55446 Hennepin 7,380 25.1 - 50.0 50.1 - 75.0 75.1 - 100.0 55447 Hennepin 8,455 25.1 - 50.0 75.1 - 100.0 50.1 - 75.0 55448 Anoka 10,267 151.1 - 175.0 151.1 - 175.0 125.1 - 150.0 55449 Anoka 8,267 100.1 - 125.0 100.1 - 125.0 125.1 - 150.0 55450 Hennepin 3 Incomplete Incomplete Incomplete 55454 Hennepin 2,961 0.0 - 25.0 0.0 - 25.0 0.0 - 25.0 55455 Hennepin 4 Incomplete Incomplete Incomplete 55601 Lake 49 Incomplete Incomplete Incomplete 55602 Saint Louis 98 Incomplete Incomplete Incomplete 55603 Lake 234 400.1 - 450.0 0.0 - 25.0 50.1 - 75.0 55604 Cook 1,605 50.1 - 75.0 50.1 - 75.0 25.1 - 50.0 55605 Cook 257 0.0 - 25.0 0.0 - 25.0 0.0 - 25.0 55606 Cook 130 Incomplete Incomplete Incomplete 55607 Lake 70 Incomplete Incomplete Incomplete 55609 Lake 135 Incomplete Incomplete Incomplete 55612 Cook 263 0.0 - 25.0 0.0 - 25.0 50.1 - 75.0 55613 Cook 99 Incomplete Incomplete Incomplete 55614 Lake 1,163 75.1 - 100.0 0.0 - 25.0 75.1 - 100.0 55615 Cook 140 Incomplete Incomplete Incomplete 55616 Lake 3,038 175.1 - 200.0 50.1 - 75.0 75.1 - 100.0 55702 Saint Louis 190 Incomplete Incomplete Incomplete 55703 Saint Louis 308 151.1 - 175.0 151.1 - 175.0 50.1 - 75.0 55704 Pine 467 100.1 - 125.0 300.1 - 325.0 125.1 - 150.0 55705 Saint Louis 1,462 50.1 - 75.0 250.1 - 275.0 25.1 - 50.0 55706 Saint Louis 864 100.1 - 125.0 200.0 - 225.0 75.1 - 100.0 55707 Carlton 1,307 50.1 - 75.0 0.0 - 25.0 50.1 - 75.0 55708 Saint Louis 466 0.0 - 25.0 0.0 - 25.0 125.1 - 150.0 55709 Itasca 1,670 100.1 - 125.0 25.1 - 50.0 151.1 - 175.0
22
Residential Foreclosures in Minnesota
Table 1: Zip Code Index Scores -March 2014 ("Incomplete" means that the zip code has less than 200 households and was not evaluated)
Zip Code Primary County
Number of Households REO Index Foreclosure Index
90+ Day Delinquency Index
55710 Saint Louis 559 75.1 - 100.0 0.0 - 25.0 50.1 - 75.0 55711 Saint Louis 189 Incomplete Incomplete Incomplete 55712 Pine 222 0.0 - 25.0 200.0 - 225.0 75.1 - 100.0 55713 Saint Louis 436 200.1 - 225.0 100.1 - 125.0 75.1 - 100.0 55716 Itasca 142 Incomplete Incomplete Incomplete 55717 Saint Louis 144 Incomplete Incomplete Incomplete 55718 Carlton 1,271 100.1 - 125.0 125.1 - 150.0 100.1 - 125.0 55719 Saint Louis 2,643 151.1 - 175.0 200.0 - 225.0 75.1 - 100.0 55720 Carlton 6,824 100.1 - 125.0 125.1 - 150.0 100.1 - 125.0 55721 Itasca 1,343 25.1 - 50.0 50.1 - 75.0 50.1 - 75.0 55722 Itasca 476 200.1 - 225.0 275.1 - 300.0 200.0 - 225.0 55723 Saint Louis 1,063 250.1 - 275.0 125.1 - 150.0 125.1 - 150.0 55724 Saint Louis 327 125.1 - 150.0 0.0 - 25.0 300.1 - 325.0 55725 Saint Louis 46 Incomplete Incomplete Incomplete 55726 Carlton 456 0.0 - 25.0 200.0 - 225.0 100.1 - 125.0 55731 Saint Louis 2,856 50.1 - 75.0 75.1 - 100.0 25.1 - 50.0 55732 Saint Louis 640 151.1 - 175.0 275.1 - 300.0 75.1 - 100.0 55733 Carlton 1,693 50.1 - 75.0 50.1 - 75.0 50.1 - 75.0 55734 Saint Louis 2,766 25.1 - 50.0 151.1 - 175.0 50.1 - 75.0 55735 Pine 795 50.1 - 75.0 0.0 - 25.0 100.1 - 125.0 55736 Saint Louis 682 0.0 - 25.0 125.1 - 150.0 100.1 - 125.0 55738 Saint Louis 221 0.0 - 25.0 200.0 - 225.0 0.0 - 25.0 55741 Saint Louis 1,443 50.1 - 75.0 25.1 - 50.0 75.1 - 100.0 55742 Itasca 151 Incomplete Incomplete Incomplete 55744 Itasca 8,380 75.1 - 100.0 75.1 - 100.0 75.1 - 100.0 55746 Saint Louis 7,792 50.1 - 75.0 100.1 - 125.0 50.1 - 75.0 55748 Aitkin 615 0.0 - 25.0 0.0 - 25.0 75.1 - 100.0 55749 Carlton 203 450.1 - 500.0 0.0 - 25.0 75.1 - 100.0 55750 Saint Louis 888 100.1 - 125.0 151.1 - 175.0 25.1 - 50.0 55751 Saint Louis 647 0.0 - 25.0 0.0 - 25.0 50.1 - 75.0 55752 Itasca 183 Incomplete Incomplete Incomplete 55753 Itasca 442 100.1 - 125.0 300.1 - 325.0 75.1 - 100.0 55756 Pine 180 Incomplete Incomplete Incomplete 55757 Carlton 367 125.1 - 150.0 0.0 - 25.0 0.0 - 25.0 55758 Saint Louis 62 Incomplete Incomplete Incomplete 55760 Aitkin 1,450 50.1 - 75.0 50.1 - 75.0 100.1 - 125.0 55763 Saint Louis 259 0.0 - 25.0 0.0 - 25.0 50.1 - 75.0
23
Minnesota Housing Planning, Research, and Evaluation
Table 1: Zip Code Index Scores -March 2014 ("Incomplete" means that the zip code has less than 200 households and was not evaluated)
Zip Code Primary County
Number of Households REO Index Foreclosure Index
90+ Day Delinquency Index
55764 Itasca 248 175.1 - 200.0 175.1 - 200.0 125.1 - 150.0 55765 Saint Louis 362 0.0 - 25.0 125.1 - 150.0 25.1 - 50.0 55766 Saint Louis 16 Incomplete Incomplete Incomplete 55767 Carlton 1,334 25.1 - 50.0 0.0 - 25.0 75.1 - 100.0 55768 Saint Louis 1,288 25.1 - 50.0 100.1 - 125.0 50.1 - 75.0 55769 Itasca 1,022 0.0 - 25.0 0.0 - 25.0 50.1 - 75.0 55771 Saint Louis 725 0.0 - 25.0 50.1 - 75.0 75.1 - 100.0 55772 Saint Louis 27 Incomplete Incomplete Incomplete 55775 Itasca 559 325.1 - 350.0 0.0 - 25.0 75.1 - 100.0 55779 Saint Louis 1,392 50.1 - 75.0 200.0 - 225.0 100.1 - 125.0 55780 Carlton 76 Incomplete Incomplete Incomplete 55781 Saint Louis 354 0.0 - 25.0 0.0 - 25.0 25.1 - 50.0 55782 Saint Louis 221 0.0 - 25.0 200.0 - 225.0 75.1 - 100.0 55783 Pine 1,023 75.1 - 100.0 175.1 - 200.0 100.1 - 125.0 55784 Itasca 40 Incomplete Incomplete Incomplete 55785 Cass 103 Incomplete Incomplete Incomplete 55786 Itasca 128 Incomplete Incomplete Incomplete 55787 Aitkin 245 0.0 - 25.0 175.1 - 200.0 50.1 - 75.0 55790 Saint Louis 892 50.1 - 75.0 151.1 - 175.0 0.0 - 25.0 55792 Saint Louis 4,848 75.1 - 100.0 25.1 - 50.0 50.1 - 75.0 55793 Itasca 265 0.0 - 25.0 0.0 - 25.0 0.0 - 25.0 55795 Pine 622 225.1 - 250.0 300.1 - 325.0 151.1 - 175.0 55797 Carlton 555 0.0 - 25.0 151.1 - 175.0 75.1 - 100.0 55798 Carlton 231 0.0 - 25.0 200.0 - 225.0 50.1 - 75.0 55802 Saint Louis 1,335 0.0 - 25.0 50.1 - 75.0 25.1 - 50.0 55803 Saint Louis 6,913 75.1 - 100.0 100.1 - 125.0 50.1 - 75.0 55804 Saint Louis 5,865 0.0 - 25.0 25.1 - 50.0 75.1 - 100.0 55805 Saint Louis 4,935 50.1 - 75.0 0.0 - 25.0 50.1 - 75.0 55806 Saint Louis 4,390 175.1 - 200.0 100.1 - 125.0 100.1 - 125.0 55807 Saint Louis 4,358 151.1 - 175.0 175.1 - 200.0 125.1 - 150.0 55808 Saint Louis 2,512 25.1 - 50.0 125.1 - 150.0 50.1 - 75.0 55810 Saint Louis 3,508 100.1 - 125.0 75.1 - 100.0 75.1 - 100.0 55811 Saint Louis 10,055 50.1 - 75.0 50.1 - 75.0 50.1 - 75.0 55812 Saint Louis 3,413 25.1 - 50.0 50.1 - 75.0 50.1 - 75.0 55814 Saint Louis 0 Incomplete Incomplete Incomplete 55901 Olmsted 20,803 25.1 - 50.0 75.1 - 100.0 75.1 - 100.0 55902 Olmsted 9,027 25.1 - 50.0 50.1 - 75.0 25.1 - 50.0
24
Residential Foreclosures in Minnesota
Table 1: Zip Code Index Scores -March 2014 ("Incomplete" means that the zip code has less than 200 households and was not evaluated)
Zip Code Primary County
Number of Households REO Index Foreclosure Index
90+ Day Delinquency Index
55904 Olmsted 10,038 75.1 - 100.0 100.1 - 125.0 75.1 - 100.0 55905 Olmsted 0 Incomplete Incomplete Incomplete 55906 Olmsted 7,216 25.1 - 50.0 50.1 - 75.0 50.1 - 75.0 55909 Mower 526 0.0 - 25.0 0.0 - 25.0 25.1 - 50.0 55910 Winona 571 0.0 - 25.0 0.0 - 25.0 75.1 - 100.0 55912 Mower 11,640 50.1 - 75.0 75.1 - 100.0 100.1 - 125.0 55917 Steele 1,428 151.1 - 175.0 75.1 - 100.0 175.1 - 200.0 55918 Mower 413 550.1 - 600.0 100.1 - 125.0 125.1 - 150.0 55919 Houston 413 0.0 - 25.0 0.0 - 25.0 25.1 - 50.0 55920 Olmsted 2,614 25.1 - 50.0 100.1 - 125.0 50.1 - 75.0 55921 Houston 2,009 25.1 - 50.0 25.1 - 50.0 25.1 - 50.0 55922 Fillmore 359 0.0 - 25.0 0.0 - 25.0 0.0 - 25.0 55923 Fillmore 1,728 50.1 - 75.0 100.1 - 125.0 50.1 - 75.0 55924 Dodge 508 175.1 - 200.0 0.0 - 25.0 50.1 - 75.0 55925 Winona 429 100.1 - 125.0 0.0 - 25.0 100.1 - 125.0 55926 Mower 326 125.1 - 150.0 125.1 - 150.0 0.0 - 25.0 55927 Dodge 1,517 50.1 - 75.0 151.1 - 175.0 50.1 - 75.0 55929 Olmsted 439 0.0 - 25.0 0.0 - 25.0 100.1 - 125.0 55931 Houston 148 Incomplete Incomplete Incomplete 55932 Wabasha 741 175.1 - 200.0 175.1 - 200.0 100.1 - 125.0 55933 Mower 109 Incomplete Incomplete Incomplete 55934 Olmsted 1,265 100.1 - 125.0 175.1 - 200.0 100.1 - 125.0 55935 Fillmore 372 0.0 - 25.0 0.0 - 25.0 25.1 - 50.0 55936 Mower 724 200.1 - 225.0 50.1 - 75.0 50.1 - 75.0 55939 Fillmore 774 0.0 - 25.0 50.1 - 75.0 0.0 - 25.0 55940 Dodge 1,010 125.1 - 150.0 175.1 - 200.0 125.1 - 150.0 55941 Houston 414 100.1 - 125.0 0.0 - 25.0 25.1 - 50.0 55943 Houston 1,253 25.1 - 50.0 50.1 - 75.0 0.0 - 25.0 55944 Dodge 2,655 125.1 - 150.0 50.1 - 75.0 75.1 - 100.0 55945 Wabasha 580 0.0 - 25.0 75.1 - 100.0 50.1 - 75.0 55946 Goodhue 1,269 250.1 - 275.0 25.1 - 50.0 125.1 - 150.0 55947 Houston 3,040 25.1 - 50.0 0.0 - 25.0 25.1 - 50.0 55949 Fillmore 781 50.1 - 75.0 175.1 - 200.0 0.0 - 25.0 55950 Mower 71 Incomplete Incomplete Incomplete 55951 Mower 667 125.1 - 150.0 50.1 - 75.0 100.1 - 125.0 55952 Winona 920 50.1 - 75.0 0.0 - 25.0 75.1 - 100.0 55953 Mower 361 0.0 - 25.0 125.1 - 150.0 0.0 - 25.0
25
Minnesota Housing Planning, Research, and Evaluation
Table 1: Zip Code Index Scores -March 2014 ("Incomplete" means that the zip code has less than 200 households and was not evaluated)
Zip Code Primary County
Number of Households REO Index Foreclosure Index
90+ Day Delinquency Index
55954 Fillmore 630 0.0 - 25.0 0.0 - 25.0 0.0 - 25.0 55955 Dodge 943 151.1 - 175.0 125.1 - 150.0 75.1 - 100.0 55956 Wabasha 763 0.0 - 25.0 100.1 - 125.0 50.1 - 75.0 55957 Wabasha 288 0.0 - 25.0 0.0 - 25.0 175.1 - 200.0 55959 Winona 885 50.1 - 75.0 50.1 - 75.0 0.0 - 25.0 55960 Olmsted 1,174 0.0 - 25.0 75.1 - 100.0 175.1 - 200.0 55961 Fillmore 186 Incomplete Incomplete Incomplete 55962 Fillmore 308 0.0 - 25.0 300.1 - 325.0 0.0 - 25.0 55963 Goodhue 1,943 200.1 - 225.0 50.1 - 75.0 100.1 - 125.0 55964 Wabasha 1,673 0.0 - 25.0 125.1 - 150.0 50.1 - 75.0 55965 Fillmore 1,020 25.1 - 50.0 0.0 - 25.0 50.1 - 75.0 55967 Mower 342 0.0 - 25.0 0.0 - 25.0 100.1 - 125.0 55968 Wabasha 60 Incomplete Incomplete Incomplete 55969 Winona 430 100.1 - 125.0 0.0 - 25.0 0.0 - 25.0 55970 Mower 388 0.0 - 25.0 0.0 - 25.0 0.0 - 25.0 55971 Fillmore 1,170 100.1 - 125.0 100.1 - 125.0 25.1 - 50.0 55972 Winona 1,826 25.1 - 50.0 75.1 - 100.0 25.1 - 50.0 55973 Mower 108 Incomplete Incomplete Incomplete 55974 Houston 916 50.1 - 75.0 0.0 - 25.0 0.0 - 25.0 55975 Fillmore 1,812 125.1 - 150.0 50.1 - 75.0 75.1 - 100.0 55976 Olmsted 2,943 25.1 - 50.0 100.1 - 125.0 75.1 - 100.0 55977 Mower 72 Incomplete Incomplete Incomplete 55979 Winona 374 0.0 - 25.0 125.1 - 150.0 75.1 - 100.0 55981 Wabasha 1,759 50.1 - 75.0 25.1 - 50.0 50.1 - 75.0 55982 Mower 183 Incomplete Incomplete Incomplete 55983 Goodhue 636 75.1 - 100.0 125.1 - 150.0 125.1 - 150.0 55985 Dodge 729 125.1 - 150.0 50.1 - 75.0 50.1 - 75.0 55987 Winona 13,694 25.1 - 50.0 25.1 - 50.0 50.1 - 75.0 55990 Fillmore 392 100.1 - 125.0 100.1 - 125.0 75.1 - 100.0 55991 Olmsted 606 75.1 - 100.0 0.0 - 25.0 100.1 - 125.0 55992 Goodhue 1,896 0.0 - 25.0 100.1 - 125.0 50.1 - 75.0 56001 Blue Earth 17,527 25.1 - 50.0 25.1 - 50.0 50.1 - 75.0 56003 Nicollet 5,950 25.1 - 50.0 25.1 - 50.0 75.1 - 100.0 56007 Freeborn 9,065 151.1 - 175.0 75.1 - 100.0 100.1 - 125.0 56009 Freeborn 650 50.1 - 75.0 125.1 - 150.0 25.1 - 50.0 56010 Blue Earth 476 0.0 - 25.0 0.0 - 25.0 175.1 - 200.0 56011 Scott 3,166 151.1 - 175.0 125.1 - 150.0 225.1 - 250.0
26
Residential Foreclosures in Minnesota
Table 1: Zip Code Index Scores -March 2014 ("Incomplete" means that the zip code has less than 200 households and was not evaluated)
Zip Code Primary County
Number of Households REO Index Foreclosure Index
90+ Day Delinquency Index
56013 Faribault 1,934 100.1 - 125.0 25.1 - 50.0 25.1 - 50.0 56014 Faribault 344 0.0 - 25.0 0.0 - 25.0 50.1 - 75.0 56016 Freeborn 437 100.1 - 125.0 0.0 - 25.0 75.1 - 100.0 56017 Le Sueur 636 151.1 - 175.0 50.1 - 75.0 50.1 - 75.0 56019 Brown 391 0.0 - 25.0 100.1 - 125.0 0.0 - 25.0 56020 Freeborn 50 Incomplete Incomplete Incomplete 56021 Nicollet 397 100.1 - 125.0 0.0 - 25.0 75.1 - 100.0 56022 Watonwan 29 Incomplete Incomplete Incomplete 56023 Faribault 215 0.0 - 25.0 0.0 - 25.0 0.0 - 25.0 56024 Blue Earth 1,022 0.0 - 25.0 25.1 - 50.0 50.1 - 75.0 56025 Faribault 211 0.0 - 25.0 0.0 - 25.0 151.1 - 175.0 56026 Steele 796 175.1 - 200.0 100.1 - 125.0 125.1 - 150.0 56027 Faribault 406 100.1 - 125.0 0.0 - 25.0 75.1 - 100.0 56028 Le Sueur 567 0.0 - 25.0 0.0 - 25.0 75.1 - 100.0 56029 Freeborn 318 300.1 - 325.0 275.1 - 300.0 0.0 - 25.0 56031 Martin 5,488 50.1 - 75.0 50.1 - 75.0 0.0 - 25.0 56032 Freeborn 126 Incomplete Incomplete Incomplete 56033 Faribault 159 Incomplete Incomplete Incomplete 56034 Blue Earth 196 Incomplete Incomplete Incomplete 56035 Freeborn 218 0.0 - 25.0 200.0 - 225.0 151.1 - 175.0 56036 Freeborn 818 175.1 - 200.0 0.0 - 25.0 50.1 - 75.0 56037 Blue Earth 622 151.1 - 175.0 151.1 - 175.0 50.1 - 75.0 56039 Martin 392 0.0 - 25.0 100.1 - 125.0 25.1 - 50.0 56041 Brown 437 0.0 - 25.0 0.0 - 25.0 100.1 - 125.0 56042 Freeborn 306 151.1 - 175.0 151.1 - 175.0 0.0 - 25.0 56043 Freeborn 204 0.0 - 25.0 0.0 - 25.0 0.0 - 25.0 56044 Sibley 809 100.1 - 125.0 50.1 - 75.0 75.1 - 100.0 56045 Freeborn 335 400.1 - 450.0 275.1 - 300.0 151.1 - 175.0 56046 Steele 42 Incomplete Incomplete Incomplete 56047 Faribault 49 Incomplete Incomplete Incomplete 56048 Waseca 1,517 75.1 - 100.0 75.1 - 100.0 175.1 - 200.0 56050 Le Sueur 598 75.1 - 100.0 0.0 - 25.0 75.1 - 100.0 56051 Faribault 330 275.1 - 300.0 400.1 - 450.0 151.1 - 175.0 56052 Rice 291 0.0 - 25.0 151.1 - 175.0 50.1 - 75.0 56054 Nicollet 388 0.0 - 25.0 100.1 - 125.0 125.1 - 150.0 56055 Blue Earth 1,605 75.1 - 100.0 125.1 - 150.0 75.1 - 100.0 56056 Watonwan 46 Incomplete Incomplete Incomplete
27
Minnesota Housing Planning, Research, and Evaluation
Table 1: Zip Code Index Scores -March 2014 ("Incomplete" means that the zip code has less than 200 households and was not evaluated)
Zip Code Primary County
Number of Households REO Index Foreclosure Index
90+ Day Delinquency Index
56057 Le Sueur 1,451 300.1 - 325.0 75.1 - 100.0 125.1 - 150.0 56058 Le Sueur 2,392 100.1 - 125.0 25.1 - 50.0 100.1 - 125.0 56060 Watonwan 186 Incomplete Incomplete Incomplete 56062 Watonwan 1,264 25.1 - 50.0 0.0 - 25.0 75.1 - 100.0 56063 Blue Earth 1,101 0.0 - 25.0 125.1 - 150.0 75.1 - 100.0 56065 Blue Earth 1,101 75.1 - 100.0 25.1 - 50.0 25.1 - 50.0 56068 Faribault 451 300.1 - 325.0 100.1 - 125.0 225.1 - 250.0 56069 Le Sueur 1,749 125.1 - 150.0 50.1 - 75.0 125.1 - 150.0 56071 Scott 4,251 100.1 - 125.0 151.1 - 175.0 125.1 - 150.0 56072 Waseca 937 200.1 - 225.0 75.1 - 100.0 125.1 - 150.0 56073 Brown 7,031 0.0 - 25.0 50.1 - 75.0 75.1 - 100.0 56074 Nicollet 766 175.1 - 200.0 0.0 - 25.0 0.0 - 25.0 56075 Martin 77 Incomplete Incomplete Incomplete 56078 Waseca 179 Incomplete Incomplete Incomplete 56080 Blue Earth 267 351.1 - 375.0 175.1 - 200.0 125.1 - 150.0 56081 Watonwan 2,444 0.0 - 25.0 0.0 - 25.0 25.1 - 50.0 56082 Nicollet 4,375 50.1 - 75.0 75.1 - 100.0 50.1 - 75.0 56083 Redwood 375 0.0 - 25.0 0.0 - 25.0 0.0 - 25.0 56085 Brown 2,217 0.0 - 25.0 25.1 - 50.0 0.0 - 25.0 56087 Brown 1,308 50.1 - 75.0 0.0 - 25.0 25.1 - 50.0 56088 Martin 814 50.1 - 75.0 50.1 - 75.0 75.1 - 100.0 56089 Freeborn 77 Incomplete Incomplete Incomplete 56090 Blue Earth 277 0.0 - 25.0 0.0 - 25.0 50.1 - 75.0 56091 Waseca 156 Incomplete Incomplete Incomplete 56093 Waseca 4,784 100.1 - 125.0 75.1 - 100.0 125.1 - 150.0 56096 Le Sueur 1,226 225.1 - 250.0 100.1 - 125.0 151.1 - 175.0 56097 Faribault 1,570 25.1 - 50.0 50.1 - 75.0 25.1 - 50.0 56098 Faribault 902 100.1 - 125.0 50.1 - 75.0 0.0 - 25.0 56101 Cottonwood 2,512 125.1 - 150.0 25.1 - 50.0 0.0 - 25.0 56110 Nobles 719 50.1 - 75.0 0.0 - 25.0 0.0 - 25.0 56111 Martin 167 Incomplete Incomplete Incomplete 56113 Lincoln 95 Incomplete Incomplete Incomplete 56114 Murray 151 Incomplete Incomplete Incomplete 56115 Lyon 551 250.1 - 275.0 75.1 - 100.0 25.1 - 50.0 56116 Rock 241 200.1 - 225.0 0.0 - 25.0 0.0 - 25.0 56117 Nobles 147 Incomplete Incomplete Incomplete 56118 Cottonwood 163 Incomplete Incomplete Incomplete
28
Residential Foreclosures in Minnesota
Table 1: Zip Code Index Scores -March 2014 ("Incomplete" means that the zip code has less than 200 households and was not evaluated)
Zip Code Primary County
Number of Households REO Index Foreclosure Index
90+ Day Delinquency Index
56119 Nobles 412 0.0 - 25.0 0.0 - 25.0 75.1 - 100.0 56120 Cottonwood 458 0.0 - 25.0 0.0 - 25.0 0.0 - 25.0 56121 Martin 274 0.0 - 25.0 0.0 - 25.0 0.0 - 25.0 56122 Murray 224 0.0 - 25.0 0.0 - 25.0 0.0 - 25.0 56123 Murray 236 0.0 - 25.0 0.0 - 25.0 0.0 - 25.0 56125 Murray 33 Incomplete Incomplete Incomplete 56127 Martin 172 Incomplete Incomplete Incomplete 56128 Pipestone 793 50.1 - 75.0 0.0 - 25.0 0.0 - 25.0 56129 Nobles 312 0.0 - 25.0 0.0 - 25.0 50.1 - 75.0 56131 Murray 959 0.0 - 25.0 75.1 - 100.0 0.0 - 25.0 56132 Lyon 222 0.0 - 25.0 0.0 - 25.0 75.1 - 100.0 56134 Rock 185 Incomplete Incomplete Incomplete 56136 Lincoln 484 0.0 - 25.0 0.0 - 25.0 0.0 - 25.0 56137 Jackson 493 0.0 - 25.0 0.0 - 25.0 0.0 - 25.0 56138 Rock 342 0.0 - 25.0 0.0 - 25.0 100.1 - 125.0 56139 Pipestone 189 Incomplete Incomplete Incomplete 56140 Pipestone 31 Incomplete Incomplete Incomplete 56141 Murray 139 Incomplete Incomplete Incomplete 56142 Lincoln 452 0.0 - 25.0 0.0 - 25.0 25.1 - 50.0 56143 Jackson 1,980 0.0 - 25.0 0.0 - 25.0 25.1 - 50.0 56144 Rock 494 75.1 - 100.0 75.1 - 100.0 50.1 - 75.0 56145 Cottonwood 272 0.0 - 25.0 151.1 - 175.0 50.1 - 75.0 56146 Nobles 17 Incomplete Incomplete Incomplete 56147 Rock 77 Incomplete Incomplete Incomplete 56149 Lincoln 569 0.0 - 25.0 75.1 - 100.0 50.1 - 75.0 56150 Jackson 1,179 25.1 - 50.0 0.0 - 25.0 25.1 - 50.0 56151 Murray 356 125.1 - 150.0 0.0 - 25.0 0.0 - 25.0 56152 Redwood 641 0.0 - 25.0 0.0 - 25.0 0.0 - 25.0 56153 Nobles 106 Incomplete Incomplete Incomplete 56155 Nobles 169 Incomplete Incomplete Incomplete 56156 Rock 2,539 100.1 - 125.0 50.1 - 75.0 25.1 - 50.0 56157 Lyon 292 151.1 - 175.0 0.0 - 25.0 0.0 - 25.0 56158 Rock 155 Incomplete Incomplete Incomplete 56159 Cottonwood 1,102 75.1 - 100.0 75.1 - 100.0 25.1 - 50.0 56160 Martin 97 Incomplete Incomplete Incomplete 56161 Jackson 155 Incomplete Incomplete Incomplete 56162 Martin 123 Incomplete Incomplete Incomplete
29
Minnesota Housing Planning, Research, and Evaluation
Table 1: Zip Code Index Scores -March 2014 ("Incomplete" means that the zip code has less than 200 households and was not evaluated)
Zip Code Primary County
Number of Households REO Index Foreclosure Index
90+ Day Delinquency Index
56164 Pipestone 2,533 100.1 - 125.0 25.1 - 50.0 75.1 - 100.0 56165 Nobles 135 Incomplete Incomplete Incomplete 56166 Redwood 97 Incomplete Incomplete Incomplete 56167 Nobles 294 0.0 - 25.0 0.0 - 25.0 0.0 - 25.0 56168 Nobles 377 250.1 - 275.0 0.0 - 25.0 0.0 - 25.0 56169 Lyon 288 0.0 - 25.0 0.0 - 25.0 0.0 - 25.0 56170 Pipestone 244 0.0 - 25.0 0.0 - 25.0 0.0 - 25.0 56171 Martin 783 50.1 - 75.0 0.0 - 25.0 25.1 - 50.0 56172 Murray 1,366 50.1 - 75.0 50.1 - 75.0 25.1 - 50.0 56173 Rock 149 Incomplete Incomplete Incomplete 56174 Cottonwood 162 Incomplete Incomplete Incomplete 56175 Lyon 1,255 225.1 - 250.0 50.1 - 75.0 50.1 - 75.0 56176 Martin 462 100.1 - 125.0 100.1 - 125.0 0.0 - 25.0 56177 Pipestone 21 Incomplete Incomplete Incomplete 56178 Lincoln 748 175.1 - 200.0 50.1 - 75.0 0.0 - 25.0 56180 Redwood 511 75.1 - 100.0 75.1 - 100.0 25.1 - 50.0 56181 Martin 492 0.0 - 25.0 75.1 - 100.0 0.0 - 25.0 56183 Cottonwood 572 0.0 - 25.0 0.0 - 25.0 25.1 - 50.0 56185 Nobles 232 0.0 - 25.0 200.0 - 225.0 0.0 - 25.0 56186 Murray 158 Incomplete Incomplete Incomplete 56187 Nobles 5,000 0.0 - 25.0 0.0 - 25.0 0.0 - 25.0 56201 Kandiyohi 9,031 50.1 - 75.0 50.1 - 75.0 25.1 - 50.0 56207 Stevens 96 Incomplete Incomplete Incomplete 56208 Swift 955 50.1 - 75.0 25.1 - 50.0 50.1 - 75.0 56209 Kandiyohi 975 75.1 - 100.0 125.1 - 150.0 75.1 - 100.0 56210 Big Stone 5 Incomplete Incomplete Incomplete 56211 Big Stone 241 0.0 - 25.0 0.0 - 25.0 0.0 - 25.0 56212 Lac Qui Parle 226 0.0 - 25.0 0.0 - 25.0 75.1 - 100.0 56214 Redwood 308 0.0 - 25.0 0.0 - 25.0 0.0 - 25.0 56215 Swift 2,023 0.0 - 25.0 125.1 - 150.0 25.1 - 50.0 56216 Kandiyohi 264 175.1 - 200.0 175.1 - 200.0 0.0 - 25.0 56218 Lac Qui Parle 263 351.1 - 375.0 0.0 - 25.0 125.1 - 150.0 56219 Traverse 440 0.0 - 25.0 0.0 - 25.0 25.1 - 50.0 56220 Yellow Medicine 1,292 25.1 - 50.0 25.1 - 50.0 25.1 - 50.0 56221 Stevens 354 125.1 - 150.0 250.1 - 275.0 25.1 - 50.0 56222 Chippewa 815 100.1 - 125.0 100.1 - 125.0 50.1 - 75.0 56223 Yellow Medicine 587 0.0 - 25.0 0.0 - 25.0 50.1 - 75.0
30
Residential Foreclosures in Minnesota
Table 1: Zip Code Index Scores -March 2014 ("Incomplete" means that the zip code has less than 200 households and was not evaluated)
Zip Code Primary County
Number of Households REO Index Foreclosure Index
90+ Day Delinquency Index
56224 Redwood 135 Incomplete Incomplete Incomplete 56225 Big Stone 348 125.1 - 150.0 0.0 - 25.0 0.0 - 25.0 56226 Swift 101 Incomplete Incomplete Incomplete 56227 Big Stone 106 Incomplete Incomplete Incomplete 56228 Meeker 394 100.1 - 125.0 0.0 - 25.0 250.1 - 275.0 56229 Lyon 746 50.1 - 75.0 50.1 - 75.0 0.0 - 25.0 56230 Renville 343 125.1 - 150.0 125.1 - 150.0 100.1 - 125.0 56231 Swift 160 Incomplete Incomplete Incomplete 56232 Lac Qui Parle 1,014 25.1 - 50.0 0.0 - 25.0 50.1 - 75.0 56235 Grant 255 0.0 - 25.0 0.0 - 25.0 0.0 - 25.0 56236 Traverse 157 Incomplete Incomplete Incomplete 56237 Yellow Medicine 248 0.0 - 25.0 0.0 - 25.0 50.1 - 75.0 56239 Lyon 233 0.0 - 25.0 0.0 - 25.0 50.1 - 75.0 56240 Big Stone 417 100.1 - 125.0 100.1 - 125.0 0.0 - 25.0 56241 Yellow Medicine 1,778 25.1 - 50.0 50.1 - 75.0 25.1 - 50.0 56243 Meeker 677 125.1 - 150.0 0.0 - 25.0 151.1 - 175.0 56244 Stevens 558 0.0 - 25.0 75.1 - 100.0 0.0 - 25.0 56245 Yellow Medicine 193 Incomplete Incomplete Incomplete 56248 Grant 368 0.0 - 25.0 125.1 - 150.0 25.1 - 50.0 56249 Swift 135 Incomplete Incomplete Incomplete 56251 Kandiyohi 398 100.1 - 125.0 100.1 - 125.0 151.1 - 175.0 56252 Kandiyohi 508 0.0 - 25.0 0.0 - 25.0 0.0 - 25.0 56253 Kandiyohi 431 100.1 - 125.0 0.0 - 25.0 100.1 - 125.0 56255 Redwood 163 Incomplete Incomplete Incomplete 56256 Lac Qui Parle 1,166 25.1 - 50.0 75.1 - 100.0 25.1 - 50.0 56257 Lac Qui Parle 235 0.0 - 25.0 0.0 - 25.0 0.0 - 25.0 56258 Lyon 6,110 50.1 - 75.0 25.1 - 50.0 50.1 - 75.0 56260 Chippewa 374 0.0 - 25.0 125.1 - 150.0 75.1 - 100.0 56262 Chippewa 294 0.0 - 25.0 0.0 - 25.0 0.0 - 25.0 56263 Redwood 221 0.0 - 25.0 0.0 - 25.0 0.0 - 25.0 56264 Lyon 898 100.1 - 125.0 0.0 - 25.0 75.1 - 100.0 56265 Chippewa 3,272 50.1 - 75.0 100.1 - 125.0 100.1 - 125.0 56266 Redwood 666 50.1 - 75.0 0.0 - 25.0 25.1 - 50.0 56267 Stevens 2,523 50.1 - 75.0 0.0 - 25.0 0.0 - 25.0 56270 Renville 410 0.0 - 25.0 0.0 - 25.0 25.1 - 50.0 56271 Swift 483 200.1 - 225.0 0.0 - 25.0 25.1 - 50.0 56273 Kandiyohi 1,902 151.1 - 175.0 0.0 - 25.0 50.1 - 75.0
31
Minnesota Housing Planning, Research, and Evaluation
Table 1: Zip Code Index Scores -March 2014 ("Incomplete" means that the zip code has less than 200 households and was not evaluated)
Zip Code Primary County
Number of Households REO Index Foreclosure Index
90+ Day Delinquency Index
56274 Grant 72 Incomplete Incomplete Incomplete 56276 Big Stone 123 Incomplete Incomplete Incomplete 56277 Renville 1,312 25.1 - 50.0 125.1 - 150.0 50.1 - 75.0 56278 Big Stone 1,158 25.1 - 50.0 0.0 - 25.0 25.1 - 50.0 56279 Kandiyohi 458 100.1 - 125.0 0.0 - 25.0 100.1 - 125.0 56280 Yellow Medicine 212 0.0 - 25.0 0.0 - 25.0 0.0 - 25.0 56281 Kandiyohi 251 0.0 - 25.0 0.0 - 25.0 200.0 - 225.0 56282 Kandiyohi 585 75.1 - 100.0 0.0 - 25.0 75.1 - 100.0 56283 Redwood 2,823 100.1 - 125.0 0.0 - 25.0 25.1 - 50.0 56284 Renville 852 100.1 - 125.0 50.1 - 75.0 75.1 - 100.0 56285 Renville 455 0.0 - 25.0 0.0 - 25.0 75.1 - 100.0 56287 Redwood 32 Incomplete Incomplete Incomplete 56288 Kandiyohi 1,973 25.1 - 50.0 0.0 - 25.0 50.1 - 75.0 56289 Kandiyohi 279 0.0 - 25.0 151.1 - 175.0 0.0 - 25.0 56291 Lyon 206 0.0 - 25.0 0.0 - 25.0 0.0 - 25.0 56292 Redwood 240 0.0 - 25.0 0.0 - 25.0 50.1 - 75.0 56293 Redwood 488 0.0 - 25.0 0.0 - 25.0 0.0 - 25.0 56294 Redwood 39 Incomplete Incomplete Incomplete 56295 Chippewa 129 Incomplete Incomplete Incomplete 56296 Traverse 890 0.0 - 25.0 100.1 - 125.0 25.1 - 50.0 56297 Yellow Medicine 339 125.1 - 150.0 0.0 - 25.0 0.0 - 25.0 56301 Stearns 11,369 25.1 - 50.0 50.1 - 75.0 75.1 - 100.0 56303 Stearns 10,841 75.1 - 100.0 100.1 - 125.0 100.1 - 125.0 56304 Sherburne 6,359 25.1 - 50.0 50.1 - 75.0 25.1 - 50.0 56307 Stearns 1,905 125.1 - 150.0 50.1 - 75.0 100.1 - 125.0 56308 Douglas 10,357 50.1 - 75.0 25.1 - 50.0 50.1 - 75.0 56309 Grant 501 75.1 - 100.0 175.1 - 200.0 151.1 - 175.0 56310 Stearns 1,911 75.1 - 100.0 0.0 - 25.0 25.1 - 50.0 56311 Grant 305 151.1 - 175.0 151.1 - 175.0 50.1 - 75.0 56312 Stearns 905 250.1 - 275.0 50.1 - 75.0 50.1 - 75.0 56313 Mille Lacs 46 Incomplete Incomplete Incomplete 56314 Morrison 468 0.0 - 25.0 0.0 - 25.0 125.1 - 150.0 56315 Douglas 657 0.0 - 25.0 50.1 - 75.0 100.1 - 125.0 56316 Stearns 627 151.1 - 175.0 0.0 - 25.0 125.1 - 150.0 56318 Todd 493 0.0 - 25.0 175.1 - 200.0 25.1 - 50.0 56319 Douglas 527 175.1 - 200.0 75.1 - 100.0 125.1 - 150.0 56320 Stearns 3,003 75.1 - 100.0 75.1 - 100.0 75.1 - 100.0
32
Residential Foreclosures in Minnesota
Table 1: Zip Code Index Scores -March 2014 ("Incomplete" means that the zip code has less than 200 households and was not evaluated)
Zip Code Primary County
Number of Households REO Index Foreclosure Index
90+ Day Delinquency Index
56321 Stearns 2 Incomplete Incomplete Incomplete 56323 Pope 221 0.0 - 25.0 200.0 - 225.0 75.1 - 100.0 56324 Otter Tail 462 100.1 - 125.0 0.0 - 25.0 25.1 - 50.0 56325 Stearns 85 Incomplete Incomplete Incomplete 56326 Douglas 630 75.1 - 100.0 0.0 - 25.0 125.1 - 150.0 56327 Douglas 309 151.1 - 175.0 151.1 - 175.0 100.1 - 125.0 56328 Morrison 49 Incomplete Incomplete Incomplete 56329 Benton 2,666 125.1 - 150.0 100.1 - 125.0 125.1 - 150.0 56330 Mille Lacs 640 375.1 - 400.0 200.0 - 225.0 500.1 - 550.0 56331 Stearns 724 50.1 - 75.0 0.0 - 25.0 50.1 - 75.0 56332 Douglas 561 151.1 - 175.0 0.0 - 25.0 75.1 - 100.0 56334 Pope 2,435 75.1 - 100.0 50.1 - 75.0 25.1 - 50.0 56335 Stearns 89 Incomplete Incomplete Incomplete 56336 Todd 652 50.1 - 75.0 0.0 - 25.0 75.1 - 100.0 56338 Morrison 670 50.1 - 75.0 125.1 - 150.0 125.1 - 150.0 56339 Grant 467 500.1 - 550.0 0.0 - 25.0 100.1 - 125.0 56340 Stearns 870 100.1 - 125.0 0.0 - 25.0 75.1 - 100.0 56342 Mille Lacs 1,245 225.1 - 250.0 100.1 - 125.0 125.1 - 150.0 56343 Douglas 394 0.0 - 25.0 100.1 - 125.0 125.1 - 150.0 56345 Morrison 6,038 100.1 - 125.0 50.1 - 75.0 100.1 - 125.0 56347 Todd 2,610 200.1 - 225.0 50.1 - 75.0 75.1 - 100.0 56349 Pope 301 0.0 - 25.0 0.0 - 25.0 100.1 - 125.0 56350 Aitkin 256 175.1 - 200.0 175.1 - 200.0 50.1 - 75.0 56352 Stearns 2,127 25.1 - 50.0 100.1 - 125.0 25.1 - 50.0 56353 Mille Lacs 3,450 200.1 - 225.0 125.1 - 150.0 200.0 - 225.0 56354 Douglas 567 400.1 - 450.0 151.1 - 175.0 50.1 - 75.0 56355 Douglas 223 0.0 - 25.0 0.0 - 25.0 151.1 - 175.0 56356 Stearns 114 Incomplete Incomplete Incomplete 56357 Benton 374 125.1 - 150.0 125.1 - 150.0 175.1 - 200.0 56358 Kanabec 1,225 100.1 - 125.0 225.1 - 250.0 75.1 - 100.0 56359 Mille Lacs 1,457 125.1 - 150.0 125.1 - 150.0 125.1 - 150.0 56360 Todd 1,626 175.1 - 200.0 50.1 - 75.0 50.1 - 75.0 56361 Otter Tail 995 25.1 - 50.0 125.1 - 150.0 75.1 - 100.0 56362 Stearns 2,331 75.1 - 100.0 200.0 - 225.0 50.1 - 75.0 56363 Mille Lacs 54 Incomplete Incomplete Incomplete 56364 Morrison 2,042 75.1 - 100.0 0.0 - 25.0 75.1 - 100.0 56367 Benton 2,285 175.1 - 200.0 100.1 - 125.0 75.1 - 100.0
33

Minnesota Housing Planning, Research, and Evaluation
Table 1: Zip Code Index Scores -March 2014 ("Incomplete" means that the zip code has less than 200 households and was not evaluated)
Zip Code Primary County
Number of Households REO Index Foreclosure Index
90+ Day Delinquency Index
56368 Stearns 1,641 25.1 - 50.0 50.1 - 75.0 50.1 - 75.0 56369 Stearns 203 225.1 - 250.0 225.1 - 250.0 75.1 - 100.0 56371 Stearns 46 Incomplete Incomplete Incomplete 56373 Morrison 1,107 25.1 - 50.0 25.1 - 50.0 75.1 - 100.0 56374 Stearns 3,041 50.1 - 75.0 25.1 - 50.0 100.1 - 125.0 56375 Stearns 306 0.0 - 25.0 0.0 - 25.0 0.0 - 25.0 56376 Stearns 131 Incomplete Incomplete Incomplete 56377 Stearns 6,486 75.1 - 100.0 100.1 - 125.0 75.1 - 100.0 56378 Stearns 3,118 50.1 - 75.0 25.1 - 50.0 75.1 - 100.0 56379 Benton 6,248 50.1 - 75.0 75.1 - 100.0 100.1 - 125.0 56381 Pope 1,054 25.1 - 50.0 75.1 - 100.0 100.1 - 125.0 56382 Morrison 560 151.1 - 175.0 0.0 - 25.0 50.1 - 75.0 56384 Morrison 144 Incomplete Incomplete Incomplete 56385 Pope 378 125.1 - 150.0 100.1 - 125.0 75.1 - 100.0 56386 Mille Lacs 282 0.0 - 25.0 151.1 - 175.0 50.1 - 75.0 56387 Stearns 3,132 75.1 - 100.0 125.1 - 150.0 50.1 - 75.0 56389 Todd 41 Incomplete Incomplete Incomplete 56401 Crow Wing 12,005 125.1 - 150.0 125.1 - 150.0 125.1 - 150.0 56425 Crow Wing 2,973 50.1 - 75.0 75.1 - 100.0 75.1 - 100.0 56431 Aitkin 3,980 100.1 - 125.0 50.1 - 75.0 75.1 - 100.0 56433 Hubbard 788 50.1 - 75.0 50.1 - 75.0 151.1 - 175.0 56434 Todd 82 Incomplete Incomplete Incomplete 56435 Cass 1,044 125.1 - 150.0 125.1 - 150.0 75.1 - 100.0 56436 Hubbard 26 Incomplete Incomplete Incomplete 56437 Todd 480 300.1 - 325.0 175.1 - 200.0 175.1 - 200.0 56438 Todd 1,147 75.1 - 100.0 25.1 - 50.0 100.1 - 125.0 56440 Todd 532 175.1 - 200.0 0.0 - 25.0 25.1 - 50.0 56441 Crow Wing 1,558 151.1 - 175.0 151.1 - 175.0 75.1 - 100.0 56442 Crow Wing 1,129 200.1 - 225.0 100.1 - 125.0 151.1 - 175.0 56443 Morrison 618 151.1 - 175.0 0.0 - 25.0 25.1 - 50.0 56444 Crow Wing 1,356 100.1 - 125.0 100.1 - 125.0 100.1 - 125.0 56446 Todd 655 125.1 - 150.0 0.0 - 25.0 50.1 - 75.0 56447 Crow Wing 517 275.1 - 300.0 75.1 - 100.0 125.1 - 150.0 56448 Crow Wing 156 Incomplete Incomplete Incomplete 56449 Crow Wing 674 125.1 - 150.0 50.1 - 75.0 75.1 - 100.0 56450 Crow Wing 484 200.1 - 225.0 175.1 - 200.0 200.0 - 225.0 56452 Cass 835 0.0 - 25.0 50.1 - 75.0 75.1 - 100.0
34
Residential Foreclosures in Minnesota
Table 1: Zip Code Index Scores -March 2014 ("Incomplete" means that the zip code has less than 200 households and was not evaluated)
Zip Code Primary County
Number of Households REO Index Foreclosure Index
90+ Day Delinquency Index
56453 Todd 361 125.1 - 150.0 125.1 - 150.0 75.1 - 100.0 56455 Crow Wing 619 75.1 - 100.0 75.1 - 100.0 125.1 - 150.0 56456 Crow Wing 22 Incomplete Incomplete Incomplete 56458 Hubbard 158 Incomplete Incomplete Incomplete 56461 Hubbard 1,271 0.0 - 25.0 50.1 - 75.0 25.1 - 50.0 56464 Wadena 1,711 75.1 - 100.0 125.1 - 150.0 0.0 - 25.0 56465 Crow Wing 866 50.1 - 75.0 50.1 - 75.0 75.1 - 100.0 56466 Morrison 1,291 151.1 - 175.0 0.0 - 25.0 50.1 - 75.0 56467 Hubbard 1,064 25.1 - 50.0 0.0 - 25.0 100.1 - 125.0 56468 Crow Wing 1,990 50.1 - 75.0 151.1 - 175.0 151.1 - 175.0 56469 Aitkin 453 0.0 - 25.0 100.1 - 125.0 175.1 - 200.0 56470 Hubbard 4,560 75.1 - 100.0 75.1 - 100.0 25.1 - 50.0 56472 Crow Wing 3,076 200.1 - 225.0 225.1 - 250.0 75.1 - 100.0 56473 Cass 1,318 175.1 - 200.0 200.0 - 225.0 75.1 - 100.0 56474 Cass 1,778 325.1 - 350.0 125.1 - 150.0 75.1 - 100.0 56475 Morrison 632 151.1 - 175.0 125.1 - 150.0 125.1 - 150.0 56477 Wadena 1,122 75.1 - 100.0 25.1 - 50.0 25.1 - 50.0 56479 Todd 2,142 175.1 - 200.0 75.1 - 100.0 75.1 - 100.0 56481 Wadena 806 100.1 - 125.0 0.0 - 25.0 0.0 - 25.0 56482 Wadena 2,768 225.1 - 250.0 50.1 - 75.0 25.1 - 50.0 56484 Cass 1,388 50.1 - 75.0 25.1 - 50.0 0.0 - 25.0 56501 Becker 6,964 151.1 - 175.0 50.1 - 75.0 75.1 - 100.0 56510 Norman 985 0.0 - 25.0 0.0 - 25.0 25.1 - 50.0 56511 Becker 762 125.1 - 150.0 100.1 - 125.0 50.1 - 75.0 56514 Clay 1,440 0.0 - 25.0 75.1 - 100.0 50.1 - 75.0 56515 Otter Tail 1,281 25.1 - 50.0 50.1 - 75.0 25.1 - 50.0 56516 Mahnomen 116 Incomplete Incomplete Incomplete 56517 Polk 109 Incomplete Incomplete Incomplete 56518 Otter Tail 143 Incomplete Incomplete Incomplete 56519 Norman 116 Incomplete Incomplete Incomplete 56520 Wilkin 1,654 25.1 - 50.0 0.0 - 25.0 0.0 - 25.0 56521 Becker 276 351.1 - 375.0 151.1 - 175.0 125.1 - 150.0 56522 Wilkin 213 0.0 - 25.0 0.0 - 25.0 0.0 - 25.0 56523 Polk 213 225.1 - 250.0 0.0 - 25.0 75.1 - 100.0 56524 Otter Tail 285 151.1 - 175.0 0.0 - 25.0 175.1 - 200.0 56525 Clay 42 Incomplete Incomplete Incomplete 56527 Otter Tail 352 125.1 - 150.0 0.0 - 25.0 25.1 - 50.0
35

Minnesota Housing Planning, Research, and Evaluation
Table 1: Zip Code Index Scores -March 2014 ("Incomplete" means that the zip code has less than 200 households and was not evaluated)
Zip Code Primary County
Number of Households REO Index Foreclosure Index
90+ Day Delinquency Index
56528 Otter Tail 721 200.1 - 225.0 125.1 - 150.0 75.1 - 100.0 56529 Clay 1,596 100.1 - 125.0 50.1 - 75.0 25.1 - 50.0 56531 Grant 877 100.1 - 125.0 100.1 - 125.0 75.1 - 100.0 56533 Otter Tail 115 Incomplete Incomplete Incomplete 56534 Otter Tail 484 0.0 - 25.0 0.0 - 25.0 50.1 - 75.0 56535 Polk 564 0.0 - 25.0 0.0 - 25.0 0.0 - 25.0 56536 Clay 198 Incomplete Incomplete Incomplete 56537 Otter Tail 7,883 50.1 - 75.0 50.1 - 75.0 50.1 - 75.0 56540 Polk 801 50.1 - 75.0 0.0 - 25.0 0.0 - 25.0 56541 Norman 10 Incomplete Incomplete Incomplete 56542 Polk 1,169 75.1 - 100.0 75.1 - 100.0 50.1 - 75.0 56543 Wilkin 110 Incomplete Incomplete Incomplete 56544 Becker 2,004 0.0 - 25.0 50.1 - 75.0 50.1 - 75.0 56545 Norman 280 0.0 - 25.0 151.1 - 175.0 0.0 - 25.0 56546 Clay 129 Incomplete Incomplete Incomplete 56547 Clay 954 0.0 - 25.0 75.1 - 100.0 25.1 - 50.0 56548 Norman 323 300.1 - 325.0 125.1 - 150.0 100.1 - 125.0 56549 Clay 1,739 25.1 - 50.0 25.1 - 50.0 75.1 - 100.0 56550 Norman 174 Incomplete Incomplete Incomplete 56551 Otter Tail 946 200.1 - 225.0 0.0 - 25.0 50.1 - 75.0 56552 Clay 177 Incomplete Incomplete Incomplete 56553 Wilkin 122 Incomplete Incomplete Incomplete 56554 Becker 1,109 75.1 - 100.0 0.0 - 25.0 50.1 - 75.0 56556 Polk 486 200.1 - 225.0 0.0 - 25.0 0.0 - 25.0 56557 Mahnomen 1,076 25.1 - 50.0 0.0 - 25.0 50.1 - 75.0 56560 Clay 15,269 50.1 - 75.0 25.1 - 50.0 25.1 - 50.0 56565 Wilkin 42 Incomplete Incomplete Incomplete 56566 Mahnomen 195 Incomplete Incomplete Incomplete 56567 Otter Tail 1,316 175.1 - 200.0 25.1 - 50.0 125.1 - 150.0 56568 Polk 69 Incomplete Incomplete Incomplete 56569 Becker 521 75.1 - 100.0 0.0 - 25.0 75.1 - 100.0 56570 Becker 527 75.1 - 100.0 175.1 - 200.0 75.1 - 100.0 56571 Otter Tail 774 175.1 - 200.0 50.1 - 75.0 75.1 - 100.0 56572 Otter Tail 2,203 75.1 - 100.0 0.0 - 25.0 50.1 - 75.0 56573 Otter Tail 2,482 50.1 - 75.0 50.1 - 75.0 25.1 - 50.0 56574 Norman 117 Incomplete Incomplete Incomplete 56575 Becker 267 0.0 - 25.0 0.0 - 25.0 0.0 - 25.0
36
Residential Foreclosures in Minnesota
Table 1: Zip Code Index Scores -March 2014 ("Incomplete" means that the zip code has less than 200 households and was not evaluated)
Zip Code Primary County
Number of Households REO Index Foreclosure Index
90+ Day Delinquency Index
56576 Otter Tail 359 250.1 - 275.0 0.0 - 25.0 75.1 - 100.0 56577 Becker 8 Incomplete Incomplete Incomplete 56578 Becker 309 0.0 - 25.0 0.0 - 25.0 100.1 - 125.0 56579 Wilkin 459 0.0 - 25.0 0.0 - 25.0 25.1 - 50.0 56580 Clay 422 325.1 - 350.0 0.0 - 25.0 75.1 - 100.0 56581 Norman 131 Incomplete Incomplete Incomplete 56583 Wilkin 77 Incomplete Incomplete Incomplete 56584 Norman 639 75.1 - 100.0 0.0 - 25.0 75.1 - 100.0 56585 Clay 423 100.1 - 125.0 0.0 - 25.0 0.0 - 25.0 56586 Otter Tail 789 50.1 - 75.0 0.0 - 25.0 50.1 - 75.0 56587 Otter Tail 672 50.1 - 75.0 125.1 - 150.0 0.0 - 25.0 56588 Otter Tail 240 0.0 - 25.0 375.1 - 400.0 0.0 - 25.0 56589 Becker 764 0.0 - 25.0 50.1 - 75.0 50.1 - 75.0 56590 Grant 164 Incomplete Incomplete Incomplete 56591 Becker 60 Incomplete Incomplete Incomplete 56592 Polk 199 Incomplete Incomplete Incomplete 56593 Becker 5 Incomplete Incomplete Incomplete 56594 Wilkin 178 Incomplete Incomplete Incomplete 56601 Beltrami 12,520 50.1 - 75.0 50.1 - 75.0 25.1 - 50.0 56621 Clearwater 1,839 50.1 - 75.0 50.1 - 75.0 0.0 - 25.0 56623 Lake of the Woods 1,212 100.1 - 125.0 0.0 - 25.0 0.0 - 25.0 56626 Cass 125 Incomplete Incomplete Incomplete 56627 Koochiching 168 Incomplete Incomplete Incomplete 56628 Itasca 771 0.0 - 25.0 100.1 - 125.0 25.1 - 50.0 56629 Koochiching 87 Incomplete Incomplete Incomplete 56630 Beltrami 878 200.1 - 225.0 50.1 - 75.0 50.1 - 75.0 56633 Cass 1,559 75.1 - 100.0 0.0 - 25.0 25.1 - 50.0 56634 Clearwater 683 125.1 - 150.0 0.0 - 25.0 25.1 - 50.0 56636 Itasca 1,981 25.1 - 50.0 0.0 - 25.0 25.1 - 50.0 56637 Itasca 87 Incomplete Incomplete Incomplete 56639 Itasca 199 Incomplete Incomplete Incomplete 56641 Cass 133 Incomplete Incomplete Incomplete 56644 Clearwater 324 0.0 - 25.0 0.0 - 25.0 50.1 - 75.0 56646 Polk 159 Incomplete Incomplete Incomplete 56647 Beltrami 348 125.1 - 150.0 125.1 - 150.0 75.1 - 100.0 56649 Koochiching 4,385 75.1 - 100.0 75.1 - 100.0 0.0 - 25.0 56650 Beltrami 313 300.1 - 325.0 125.1 - 150.0 0.0 - 25.0
37
Minnesota Housing Planning, Research, and Evaluation
Table 1: Zip Code Index Scores -March 2014 ("Incomplete" means that the zip code has less than 200 households and was not evaluated)
Zip Code Primary County
Number of Households REO Index Foreclosure Index
90+ Day Delinquency Index
56651 Mahnomen 227 0.0 - 25.0 0.0 - 25.0 151.1 - 175.0 56652 Clearwater 221 0.0 - 25.0 0.0 - 25.0 75.1 - 100.0 56653 Koochiching 549 75.1 - 100.0 0.0 - 25.0 0.0 - 25.0 56654 Koochiching 66 Incomplete Incomplete Incomplete 56655 Cass 632 151.1 - 175.0 50.1 - 75.0 125.1 - 150.0 56657 Itasca 149 Incomplete Incomplete Incomplete 56658 Koochiching 4 Incomplete Incomplete Incomplete 56659 Itasca 25 Incomplete Incomplete Incomplete 56660 Koochiching 110 Incomplete Incomplete Incomplete 56661 Itasca 408 225.1 - 250.0 0.0 - 25.0 25.1 - 50.0 56662 Cass 267 0.0 - 25.0 0.0 - 25.0 125.1 - 150.0 56663 Beltrami 87 Incomplete Incomplete Incomplete 56667 Beltrami 264 0.0 - 25.0 175.1 - 200.0 125.1 - 150.0 56668 Koochiching 66 Incomplete Incomplete Incomplete 56669 Koochiching 183 Incomplete Incomplete Incomplete 56670 Beltrami 413 0.0 - 25.0 100.1 - 125.0 0.0 - 25.0 56672 Cass 954 151.1 - 175.0 125.1 - 150.0 100.1 - 125.0 56673 Roseau 324 0.0 - 25.0 0.0 - 25.0 0.0 - 25.0 56676 Clearwater 711 125.1 - 150.0 50.1 - 75.0 25.1 - 50.0 56678 Hubbard 515 0.0 - 25.0 0.0 - 25.0 25.1 - 50.0 56680 Itasca 60 Incomplete Incomplete Incomplete 56681 Itasca 137 Incomplete Incomplete Incomplete 56683 Beltrami 316 151.1 - 175.0 0.0 - 25.0 50.1 - 75.0 56684 Pennington 125 Incomplete Incomplete Incomplete 56685 Beltrami 59 Incomplete Incomplete Incomplete 56686 Lake of the Woods 434 0.0 - 25.0 200.0 - 225.0 75.1 - 100.0 56687 Beltrami 31 Incomplete Incomplete Incomplete 56688 Itasca 73 Incomplete Incomplete Incomplete 56701 Pennington 5,332 50.1 - 75.0 25.1 - 50.0 25.1 - 50.0 56710 Marshall 190 Incomplete Incomplete Incomplete 56711 Lake of the Woods 54 Incomplete Incomplete Incomplete 56713 Marshall 417 0.0 - 25.0 0.0 - 25.0 0.0 - 25.0 56714 Roseau 495 0.0 - 25.0 0.0 - 25.0 25.1 - 50.0 56715 Red Lake 148 Incomplete Incomplete Incomplete 56716 Polk 3,645 50.1 - 75.0 0.0 - 25.0 25.1 - 50.0 56720 Kittson 23 Incomplete Incomplete Incomplete 56721 Polk 4,047 0.0 - 25.0 50.1 - 75.0 0.0 - 25.0
38
Residential Foreclosures in Minnesota
Table 1: Zip Code Index Scores -March 2014 ("Incomplete" means that the zip code has less than 200 households and was not evaluated)
Zip Code Primary County
Number of Households REO Index Foreclosure Index
90+ Day Delinquency Index
56722 Polk 151 Incomplete Incomplete Incomplete 56723 Polk 377 0.0 - 25.0 0.0 - 25.0 0.0 - 25.0 56724 Marshall 71 Incomplete Incomplete Incomplete 56725 Pennington 379 0.0 - 25.0 225.1 - 250.0 0.0 - 25.0 56726 Roseau 665 0.0 - 25.0 50.1 - 75.0 25.1 - 50.0 56727 Beltrami 346 125.1 - 150.0 0.0 - 25.0 0.0 - 25.0 56728 Kittson 601 75.1 - 100.0 0.0 - 25.0 25.1 - 50.0 56729 Kittson 58 Incomplete Incomplete Incomplete 56731 Kittson 37 Incomplete Incomplete Incomplete 56732 Kittson 480 0.0 - 25.0 0.0 - 25.0 0.0 - 25.0 56733 Kittson 181 Incomplete Incomplete Incomplete 56734 Kittson 212 0.0 - 25.0 0.0 - 25.0 0.0 - 25.0 56735 Kittson 350 0.0 - 25.0 0.0 - 25.0 0.0 - 25.0 56736 Polk 418 0.0 - 25.0 0.0 - 25.0 75.1 - 100.0 56737 Marshall 388 0.0 - 25.0 0.0 - 25.0 0.0 - 25.0 56738 Marshall 544 75.1 - 100.0 0.0 - 25.0 0.0 - 25.0 56741 Lake of the Woods 12 Incomplete Incomplete Incomplete 56742 Red Lake 381 125.1 - 150.0 0.0 - 25.0 0.0 - 25.0 56744 Marshall 263 0.0 - 25.0 0.0 - 25.0 0.0 - 25.0 56748 Red Lake 255 0.0 - 25.0 0.0 - 25.0 0.0 - 25.0 56750 Red Lake 1,069 0.0 - 25.0 0.0 - 25.0 0.0 - 25.0 56751 Roseau 2,275 75.1 - 100.0 25.1 - 50.0 0.0 - 25.0 56754 Pennington 222 0.0 - 25.0 200.0 - 225.0 0.0 - 25.0 56755 Kittson 47 Incomplete Incomplete Incomplete 56756 Roseau 305 300.1 - 325.0 0.0 - 25.0 151.1 - 175.0 56757 Marshall 425 0.0 - 25.0 0.0 - 25.0 0.0 - 25.0 56758 Marshall 182 Incomplete Incomplete Incomplete 56759 Roseau 143 Incomplete Incomplete Incomplete 56760 Marshall 152 Incomplete Incomplete Incomplete 56761 Roseau 203 0.0 - 25.0 0.0 - 25.0 0.0 - 25.0 56762 Marshall 1,067 75.1 - 100.0 0.0 - 25.0 25.1 - 50.0 56763 Roseau 2,039 50.1 - 75.0 75.1 - 100.0 75.1 - 100.0
39


![[Bank of America] Residential Mortgages - Prepayments and Prepayment Modeling](https://img.pdfslide.us/doc/110x75/545f4a7faf795937758b4d65/bank-of-america-residential-mortgages-prepayments-and-prepayment-modeling.jpg)