Embed Size (px)
Citation preview

Energy Policy 39 (2011) 544–550
Contents lists available at ScienceDirect
Energy Policy
0301-42
doi:10.1
n Corr
E-m
journal homepage: www.elsevier.com/locate/enpol
Residential consumers in the Cape Peninsula’s willingness to payfor premium priced green electricity
Henry Oliver n, Jako Volschenk, Eon Smit
University of Stellenbosch Business School, Carl Cronje Drive, Bellville, Western Cape 7535, South Africa
a r t i c l e i n f o
Article history:
Received 4 March 2010
Accepted 7 October 2010Available online 18 November 2010
Keywords:
Willingness to pay
Green electricity
Households
15/$ - see front matter & 2010 Elsevier Ltd. A
016/j.enpol.2010.10.012
esponding author. Tel.: +27 846575208; fax:
ail addresses: [email protected], oliver
a b s t r a c t
A number of studies have explored the willingness (i.e. stated willingness as opposed to actual
willingness) of consumers to pay a premium for green electricity in developed countries. However,
little is known about how this translates into an emerging economy context. This study investigates the
level of willingness of residential households in South Africa’s Cape Peninsula to pay a premium for
electricity from renewable energy. It methodologically drew on recent contributions in the literature on
norm-motivated behaviour used to identify testable factors that could influence residential consumers’
willingness to pay (WTP).
Interestingly, the study found a significant positive link between household income and WTP for green
electricity, contrary to the findings of some previous studies. Not only are higher income households more
likely to pay a premium, but typically they are also willing to pay a bigger premium. It was also further
established that the view that green electricity is reliable, involvement in the recycling of waste and the
belief that everyone should contribute to green electricity generation drive the WTP.
& 2010 Elsevier Ltd. All rights reserved.
1. Introduction
Very little research has been done in South Africa to understandand anticipate the behaviour of consumers towards electricitygenerated from renewable energy sources (i.e. green electricity).Doing so may be interesting for a number of reasons.
South Africa is an emerging economy, but it has one of the mosthighly skewed income distributions in the world (Institute forFutures Research, 2009). Furthermore, renewable energy sourcesdeliver less than 1% of the total electrical energy used in SouthAfrica (Republic of South Africa, 2003), mainly because South Africahas over time developed an efficient, large-scale, coal-based powergeneration system that provides some of the cheapest electricity inthe world (Turner, 2007). Renewable energy therefore faces steepbarriers because of its potentially higher cost and because a largeportion of the population cannot afford to carry the higher price tag.Yet South Africa set itself the target to generate 10 000 GWhrenewable energy, or approximately 4% of supply, by 2013(Republic of South Africa, 2003).
The City of Cape Town Municipality was the first to explicitlyshow its support for this target by vowing to source 10% of itsenergy from renewable sources by 2020 (City of Cape TownMunicipality, 2008). This study explores the determinants of thewillingness of households in the Cape Peninsula to pay a premium
ll rights reserved.
+27 219184443
[email protected] (H. Oliver).
for green electricity, in the hope of gaining insight into this issue inan emerging economy context. This region was selected due to thefact that it is the country’s first region to offer green electricity.
The purpose of this paper is threefold. First, to provide adescriptive overview of the willingness to pay (WTP) of CapePeninsula households and the selected explanatory variables.Second, to investigate the relationships between WTP and theexplanatory variables selected on the basis of the theoreticalmodel. Third, to develop a prediction model to explain WTP basedon the best set of predictor variables.
The paper proceeds as follows. Section 2 provides a theoreticalframework, Section 3 sets out the research method and reports onthe results. The study concludes in Section 4.
2. Literature review
2.1. Psychological and psychographic indicators of WTP
Green marketing activities have shown rapid growth since itsearly stages in the United States, Europe, and Australia (Wiser et al.,2001; Arkesteijn and Oerlemans, 2005). But, while niche marketsfor green energy clearly exist, few programmes exceed 5%penetration in the residential market (Wiser et al., 20011;
1 USA research.
H. Oliver et al. / Energy Policy 39 (2011) 544–550 545
Arkesteijn and Oerlemans, 20052; Ek, 20053; Bird et al., 20024 ;Salmela and Varho, 20065).
WTP can be described as a pro-environmental behaviour intention
(Stern et al., 1993). Although many surveys have aspired to identifytypical demographic qualities of consumers that show such pro-environmental behaviour, many contradictory views of the probableconsumer segment are put forward by different researchers (Rex andBaumann, 2007; Rundle-Thiele et al., 2008). One important group ofmodels comprises the so-called intention models which state thatconsumers’ commitment to a specific behaviour is jointly dependenton their attitudes and subjective norms (Arkesteijn and Oerlemans,2005). Psychographic characteristics tend to be more reliable thandemographic characteristics (Rex and Baumann, 2007; Rundle-Thieleet al., 2008; Hansla et al., 20086). Psychographic characteristicsinclude aspects such as
�
knowledge/awareness; � values; � attitudes; � concern for the environment; and � perceptions of the effectiveness of particular interventions(Salmela and Varho, 2006; Rex and Baumann, 2007).
When confronted with a relatively unknown product or service,potential adopters collect and process the information that theyobtain through a variety of communication channels (Arkesteijn andOerlemans, 2005). If knowledge or awareness is not sufficient, potentialconsumers may genuinely be uncertain about whether they shouldtake on the responsibility of buying ‘green’ (Ek, 2005). Consumers’emphasis is therefore mostly on the environmental issues andenvironmental product information received during the decision-making process (Ek, 2005; Nyborg et al., 20067; Bhate and Lawler,19978; Salmela and Varho, 2006). From the research of Hansla et al.(2008) it emerges that knowledge together with values can be capturedby a variable for attitude. Hansla et al. (2008) tested a model thathypothesized that WTP was influenced by attitude towards green
electricity, income levels, and electricity costs. In turn, they hypothesizedthat attitude towards green electricity, is influenced by environmental
concern attitudes, which in turn were influenced by awareness-of-consequences beliefs. Lastly, they maintained that awareness-of-consequences would be positively influenced by self-transcendentvalues. Their findings indicate that both attitude towards green
electricity and WTP were related to awareness-of-consequencesbeliefs, environmental concern attitudes, and self-transcendentvalues. They further found sufficient evidence to say that the effectof values and awareness beliefs on WTP could be described throughattitude towards green electricity, but not for environmental concern.Consequently, in order to model WTP, one would need to include avariable for both attitude and concern, where the implied relationshipis positive. Values are more difficult to measure, but manifest itself inbehaviour (Stern et al., 1995) such as recycling of waste or reducinghousehold energy consumption (Hansla et al., 2008).
2.2. Consumers’ perception of effectiveness
Consumers’ perception of the positive effect that their purchaseof green electricity would have on the environment has a stronginfluence on their willingness to voluntarily do so (Ek, 2005; Bhate
2 Dutch research.3 Swedish research.4 Global research.5 Finnish research.6 Swedish research.7 Norwegian research.8 British research.
and Lawler, 1997; Rex and Baumann, 2007; Rundle-Thiele et al.,2008). This includes the belief that renewable energy is better forthe environment than other sources and that their payment wouldincrease investment in renewable energy capacity (Ek, 2005; Bhateand Lawler, 1997). Hansla et al. (2008) conclude that thiseffectiveness is all the more important because consumerspossibly cannot foresee the outcomes of their choice to pay forgreen electricity. Since the benefits of reducing carbon emissions arenot experienced directly, consumers might perceive environmentalactions which hold immediate tangible benefits, for example thecleaning up of waste, as more effective. In the literature surroundingenvironmentally friendly consumer behaviour, this concept isknown as perceived consumer effectiveness and it ishypothesized to be positively correlated with WTP (Ek, 2005;Rundle-Thiele et al., 2008; Rex and Baumann, 2007).
2.3. Income and price
It is often logically assumed that there is a positive relationshipbetween a consumer’s level of income and the likelihood of theiradoption of green electricity (Bird et al., 2002; Arkesteijn andOerlemans, 2005; Rundle-Thiele et al., 2008). Yet, empiricalevidence of the relationship between income level andenvironmentally friendly behaviour is not conclusive (Bird et al.,2002; Arkesteijn and Oerlemans, 2005; Rundle-Thiele et al., 2008;Hansla et al., 2008). Price perception and WTP are stronger economicpredictors of adoption behaviour than level of income (Arkesteijn andOerlemans, 2005; Kalkman and Peters, 20029 ), while Hansla et al.(2008) found that cost of electricity is negatively correlated to WTP.Most households perceive the price of green electricity to be higherthan the amount of money they are willing to pay for it, indicatingthat consumers’ support is therefore dependent on their perceptionof high price (Arkesteijn and Oerlemans, 2005). Yet, although lower-priced products have generally attracted more customers, price is notthe only important driver of demand (Bird et al., 2002; Kalkman andPeters, 2002). Although most green power products in the world havebeen offered at modest price premiums, in some cases green powerhas also been offered at prices below that of the standard electricityservice, such as in Germany, Finland, and the Netherlands (Bird et al.,2002; Kalkman and Peters, 2002). Not even discounted prices forgreen electricity are therefore necessarily enough motivation forconsumers to purchase green electricity (Bird et al., 2002).
2.4. Free rider behaviour
Environmental benefits associated with renewable energysources (such as less air pollution) are characterised by non-rivalryand non-excludability (Ek, 2005). Thus, consumers are oftenreluctant to contribute to public goods because the non-excludability characteristics lead to free-rider behaviour (Ek,2005). As the purchasing consumers can thus not capture thebenefits of the public good solely for themselves, they have strongincentives to become the ‘free recipient’ of the benefits instead ofbecoming the ‘sponsor’ of the benefits for others (Ek, 2005; Wiser,1998). One would expect WTP to decrease as the perception of freerider behaviour increases.
2.5. Feedback about consumer behaviour
But in what can be described as a reversal of the free riderproblem, what other consumers do may encourage similar action,even if it is only a perception. Nyborg et al. (2006) state thatbehaviour motivated by internal sanctioning such as guilt or a bad
9 European research.
H. Oliver et al. / Energy Policy 39 (2011) 544–550546
conscience, is often stimulated by the belief about others’behaviour, rather than their actual behaviour. Consumerstherefore also need to believe that other consumers aresupporting an applicable environmental campaign before theyfollow in the same direction (Nyborg et al., 2006). While this is animportant aspect, this study did not test for this aspect as greenelectricity has never been available in South Africa.
2.6. Mandatory quotas and its effect on WTP for additional green
electricity
Over the last decade many developed countries implementedpolicies that require electricity suppliers to obtain some portion ofthe generation in their resource portfolio from renewables (Birdet al., 2002). This can potentially be passed on to consumers as amandatory quota (often very small) or tax (Kwant, 2003) for eachconsumer. But if everyone already pays for green electricity, it isunclear how it would impact on the willingness of consumers topay for additional green electricity. It is proposed that thisrelationship may be negative, meaning that a mandatorypayment for green electricity will discourage a further premium.
2.7. Source of green electricity
Studies indicate that there is a relative preference for certainsources of renewable energy. Bergmann et al. (2006) show that thepreference may be connected to such aspects as the impact of thetechnology on the landscape, the number of jobs it will create, andthe reduction in air pollution that one would experience. Hence,Borchers et al. (2007) found a clear preference for electricity fromsolar, with wind power in second place. Yet to arrive at this findingwould require a fair amount of knowledge from respondentsregarding the different technologies. Given that this study wasdone before any renewable energy was marketed in South Africa, itwas safe to assume that most respondents in this study would notbe able to answer technology specific questions. Despite thisassumption, the relative preference for any technology wastested for in the empirical part of this paper.
2.8. Model
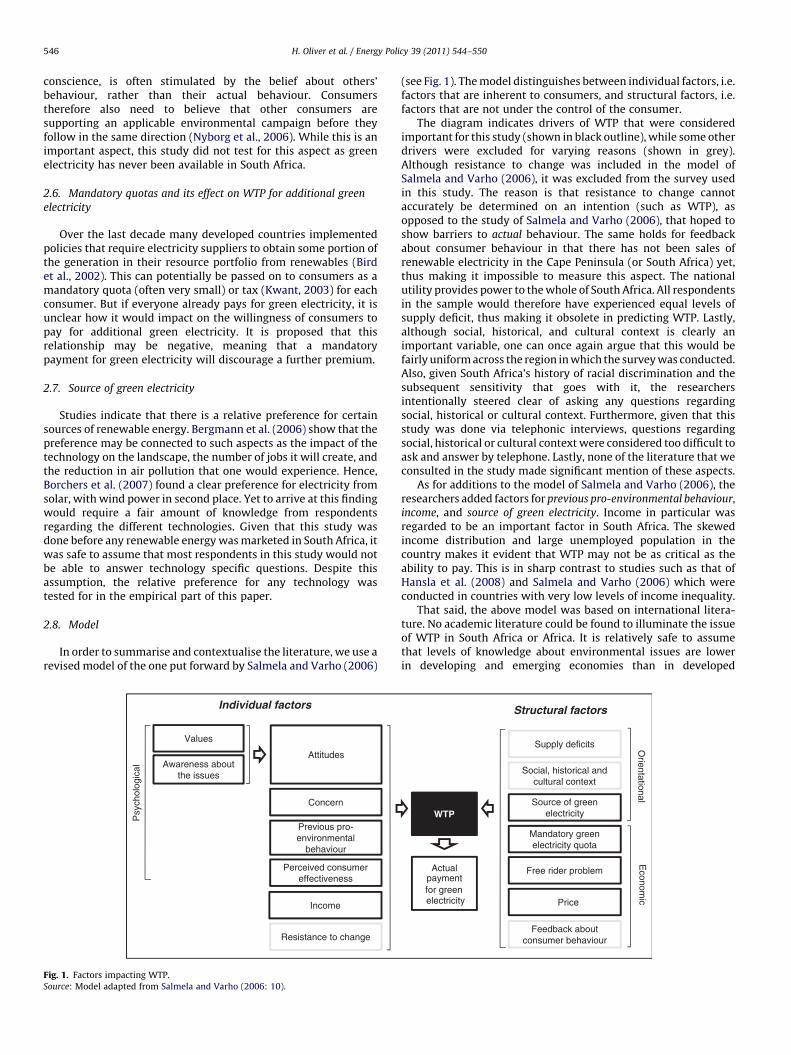
In order to summarise and contextualise the literature, we use arevised model of the one put forward by Salmela and Varho (2006)
AttitudesAwareness about
the issues
Perceived consumer effectiveness
Psy
chol
ogic
al
Resistance to change
Individual factors
Concern
Values
Income
Previous pro-environmental
behaviour
Fig. 1. Factors impacting WTP.
Source: Model adapted from Salmela and Varho (2006: 10).
(see Fig. 1). The model distinguishes between individual factors, i.e.factors that are inherent to consumers, and structural factors, i.e.factors that are not under the control of the consumer.
The diagram indicates drivers of WTP that were consideredimportant for this study (shown in black outline), while some otherdrivers were excluded for varying reasons (shown in grey).Although resistance to change was included in the model ofSalmela and Varho (2006), it was excluded from the survey usedin this study. The reason is that resistance to change cannotaccurately be determined on an intention (such as WTP), asopposed to the study of Salmela and Varho (2006), that hoped toshow barriers to actual behaviour. The same holds for feedbackabout consumer behaviour in that there has not been sales ofrenewable electricity in the Cape Peninsula (or South Africa) yet,thus making it impossible to measure this aspect. The nationalutility provides power to the whole of South Africa. All respondentsin the sample would therefore have experienced equal levels ofsupply deficit, thus making it obsolete in predicting WTP. Lastly,although social, historical, and cultural context is clearly animportant variable, one can once again argue that this would befairly uniform across the region in which the survey was conducted.Also, given South Africa’s history of racial discrimination and thesubsequent sensitivity that goes with it, the researchersintentionally steered clear of asking any questions regardingsocial, historical or cultural context. Furthermore, given that thisstudy was done via telephonic interviews, questions regardingsocial, historical or cultural context were considered too difficult toask and answer by telephone. Lastly, none of the literature that weconsulted in the study made significant mention of these aspects.
As for additions to the model of Salmela and Varho (2006), theresearchers added factors for previous pro-environmental behaviour,income, and source of green electricity. Income in particular wasregarded to be an important factor in South Africa. The skewedincome distribution and large unemployed population in thecountry makes it evident that WTP may not be as critical as theability to pay. This is in sharp contrast to studies such as that ofHansla et al. (2008) and Salmela and Varho (2006) which wereconducted in countries with very low levels of income inequality.
That said, the above model was based on international litera-ture. No academic literature could be found to illuminate the issueof WTP in South Africa or Africa. It is relatively safe to assumethat levels of knowledge about environmental issues are lowerin developing and emerging economies than in developed
Actual payment for greenelectricity
WTP
Social, historical and cultural context
Supply deficits
Price
Free rider problem
Feedback about consumer behaviour
Structural factors
Orientational
Econom
ic
Source of green electricity
Mandatory green electricity quota
H. Oliver et al. / Energy Policy 39 (2011) 544–550 547
counterparts such as Europe and the USA. Furthermore, in manyother respects, one needs to explore how many of the internationaldeterminants apply to South Africa, and the Cape Peninsulaspecifically.
In testing for the existence of significant relationships betweenWTP and the factors in Fig. 1, the propositions shown in Table 1were tested. The expected direction of causality under thealternative hypotheses are indicated.
3. Survey method and results
According to a general household survey analysis conducted in2006, there were approximately 905 000 households residing inthe Cape Peninsula (Small, 2008) of which 94.5% were connected tothe national electricity grid (Small, 2008). The population for thepurposes of this study (i.e. grid-connected households in the CapePeninsula) therefore consisted of the approximately 856 000households. The unit of analysis was the decision maker of thehousehold. Using the telephone directory as a sampling frame,potential respondents were randomly selected from this list.The selection of a telephone questionnaire was motivated by thefact that 88.15% of the population have access to a telephone intheir dwelling (Small, 2008). According to Saunders et al. (2007) theappropriate respondent size for such a large population(ffi856 000) with a precision of 5% and at the 95% confidencelevel is 382.
Table 1Propositions tested.
The stated willingness of households to pay a premium for green electlevel of consumers’ (proposition tested)
1 Belief that they are very well informed on issues concerning climate chang
2 Belief that green electricity is as reliable as conventional electricity (aware
3 Belief that human activities are major contributors to climate change (atti
4 Concern for the future of the environment (concern)
5 Concern about climate change (concern)
6 Belief that the generation of electricity from coal contributes to climate ch
effectiveness of green electricity)
7 Household income (income)
8 Commitment to recycle what they can (previous pro-environmental behav
9 Opinion that the source of green electricity would influence their support
10 Belief that they would still be willing to pay extra for green electricity on
electricity contained a small percentage of green electricity (mandatory gr
11 Belief that only users that make excessive use of electricity should pay ext
12 Belief that everyone should pay extra to contribute towards the generation
Table 2Comparison of sample and population.
Sources: Small (2008) and IHS Global Insight (2008).
Sample n Sample (%
Gender
Male 200 49
Female 205 51
Total 405 100
Income
oR10 000 pm 153 40
R10 001–R20 000 pm 96 25
R20 001–R30 000 pm 61 16
R30 001–R40 000 pm 35 9
R40 001–R50 000 pm 16 4
4R50 000 pm 19 5
Total 380 100
For the sourcing of the primary data, a telephone questionnairewas developed and used after thorough pretesting. The question-naire was informed by the set propositions found in the literature,but also included some specific issues that were raised by the Cityof Cape Town. The telephonic research interviews were conductedbetween December 2007 and February 2008. Where uncertaintyabout the decision maker prevailed, or some other complicationarose, the interview was terminated.
The final number of successfully completed questionnaires was405. In the process 543 randomly selected households werecontacted by telephone. All but 25 households were willing toprovide information about household income. To determinewhether the respondents were representative of this study’spopulation, a comparison of the respondents’ gender and incomedistribution was undertaken using data from both the generalhousehold survey analysis conducted in the Cape Peninsula (Small,2008) as well as from a regional income distribution report by IHSGlobal Insight (2008). The results from this comparison are listed inTable 2. It is important to note that the sample population excludedapproximately 11.7% of households that did not have access to atelephone in their dwelling. As adjustments to the results weremade to correct this disparity and thereby enable meaningfulcomparison, the population data for the income variable only addsup to 88.15%
In the case of gender, a chi-square goodness-of-fit test indicatesthat the sample is representative of the population at the 5% level ofsignificance. Unfortunately the delimitation of the class boundariesof the population data do not perfectly correspond with those
ricity is influenced by the Expected directionof association
e (awareness about the issues) Positive
ness about the issues) Positive
tudes) Positive
Positive
Positive
ange (perceived Positive
Positive
iour) Positive
(source of green electricity) Unknown
a voluntary basis even if everyone’s ordinary
een electricity quota)
Positive
ra to purchase green electricity (free rider problem) Negative
of green electricity (free rider problem) Positive
) Population (%)
49.9
50.1
100.0
46 oR11 000 pm
11 R11 001–R16 000 pm
17 R16 001–R30 000 pm
9 R30 001–R50 000 pm
7 4R50 000 pm

H. Oliver et al. / Energy Policy 39 (2011) 544–550548
selected for the analysis of the sample. This excluded the applica-tion of an exact goodness-of-fit test. In descriptive terms, however,the household income distribution in the sample seems toapproximately mirror that of the population.
As indicated earlier, each of the stated propositions was testedfor significance in order to determine their relationship (if any)with willingness to pay a premium for green electricity. The resultsfrom the Spearman rank correlation coefficient test indicated thatthere was sufficient evidence to confirm a statistically significantrelationship, in the expected direction, for each of the statedpropositions as it related to the suggested model. Table 3provides a summary of the results.
As shown earlier, much of the literature surrounding themarketing of green electricity (Bird et al., 2002; Arkesteijn andOerlemans, 2005; Rundle-Thiele et al., 2008; Ek, 2005) shows thatthe relationship between household income level andenvironmentally friendly behaviour is inconclusive. Yet, theresults of this study indicate that household income is indeedsignificantly related to WTP, contrary to the findings of manystudies in developed countries. Table 4 illustrates the agreementthat respondents showed to a statement reading ‘‘I would bewilling to pay a premium for green electricity’’. What is pertinent ishow agreement changes as household income increase. However,as stated in the literature review, WTP is usually far higher thanactual behaviour, and how actual behaviour may change withhousehold income was impossible to determine in this survey.
A very interesting finding of this study related to the pledgedsize of premiums that respondents provided. Table 4 provides
Table 3Summary of findings.
The stated willingness of households to pay a premium for green electri(proposition tested)
1 Belief that they are very well informed on issues concerning climate change
2 Belief that green electricity is as reliable as conventional electricity (awaren
3 Belief that human activities are major contributors to climate change (attitu
4 Concern for the future of the environment (concern)
5 Concern about climate change (concern)
6 Belief that the generation of electricity from coal contributes to climate cha
7 Household income (income)
8 Commitment to recycle what they can (previous pro-environmental behavio
9 Opinion that the source of green electricity would influence their support (s
10 Belief that they would still be willing to pay extra for green electricity on a
ordinary electricity contained a small percentage of green electricity (mand
11 Belief that only users that make excessive use of electricity should pay extr
12 Belief that everyone should pay extra to contribute towards the generation
Table 4Distribution of WTP by income group.
WTP oR10 000 R11 000–R20 000 R21 000–R30Respondents revealing income (n¼153) (n¼96) (n¼61)
Fully agree 11.1% 18.8% 16.7%
Agree 13.7% 22.9% 35.0%
Not sure 13.1% 31.3% 35.0%
Disagree 39.2% 17.7% 6.67%
Strongly disagree 22.9% 9.4% 6.67%
Total 100% 100% 100%
Number of respondents revealing
income and value of premium
(n¼58) (n¼69) (n¼51)
Average amount that income group
is willing to pay in premium
R44.72 R80.82 R74.75
As a percentage of total monthly
expenditure on electricity
16% 24% 20%
evidence that higher income households would be willing to pay ahigher premium for green electricity.
Of the 42% of the sample that agreed to the statement that theywould pay a premium, 92% indicated that they would only beprepared to do so if they are convinced of its positive impact on theenvironment. This is in line with much of the findings in paststudies (Bergmann et al., 2006; Ek, 2005; Bhate and Lawler, 1997).However, what makes this interesting is that consumers in theCape Peninsula show low awareness levels about the relative
advantages and disadvantages of different sources of greenelectricity. Borchers et al. (2007) found that consumers weresignificantly influenced to support green energy if that energycame from the sun or wind, but there was no indication of such atrend in this study. On the contrary, this study found a fairly neutralif not negative relationship between WTP and a preference insource.
As stated earlier, a third aim of the study was to evaluate thejoint effects of the independent variables on the WTP variable bymeans of a multiple logistic regression model, run in a stepwisefashion. The dependent variable was WTP (as shown in Table 3, butrecoded as a binary variable). This was partly done to addressconcerns of co-variance, and to identify the key drivers of WTP. Theresults of the model are presented in Table 5.
The significant variables in explaining WTP are fourfoldnamely income, the view that green electricity is reliable, beinginvolved in active recycling of waste and the belief that everybodyshould contribute to the cost of green electricity generation. Theselected model is highly significant (p¼0.00000), demonstrating
city is influenced by the level of consumers’ Spearman correlationcoefficient (p-value)
(awareness about the issues) 0.33 (0.00)
ess about the issues) 0.36 (0.00)
des) 0.35 (0.00)
0.29 (0.00)
0.34 (0.00)
nge (perceived effectiveness of green electricity) 0.31 (0.00)
0.42 (0.00)
ur) 0.34 (0.00)
ource of green electricity) �0.25 (0.00)
voluntary basis even if everyone’s
atory green electricity quota)
0.62 (0.00)
a to purchase green electricity (free rider problem) �0.27 (0.00)
of green electricity (free rider problem) 0.35 (0.00)
000 R31 000–R40 000 R41 000–R50 000 4R50 000 % of total sample(n¼35) (n¼16) (n¼19) (n¼380)
31.4% 50.0% 42.1% 19%
31.4% 37.5% 42.1% 23%
17.1% 12.5% 5.3% 21%
11.4% – 5.3% 24%
8.6% – 5.3% 14%
100% 100% 100% 100%
(n¼28) (n¼16) (n¼17) (n¼239)
R199.44 R144.84 R201.18 117.67
35% 27% 26% 26%

Table 5Final iteration of multiple logistic regression model.
Explanatory variables Coefficient p-value
Constant �5.3450 0.0000
Recycling 0.4189 0.0001
Reliability 0.4957 0.0023
Belief that everyone should
contribute
0.3536 0.0001
Income 0.6992 0.0000
H. Oliver et al. / Energy Policy 39 (2011) 544–550 549
an odds ratio of 14.040. The model correctly classified 78.88% of theobservations.
The twelve explanatory variables selected all significantly con-tribute to the explanation of the willingness of households to pay apremium for green electricity. In addition, all the signs of theseSpearman correlation coefficients affirm the direction implied by thealternative hypotheses. Hence, looking at the overall picture, the priorexpectations have been vindicated. In any study of this nature, acertain degree of multicollinearity exists amongst the explanatoryvariables. One of the effects of multicollinearity, within the frame-work of multiple regression, is to bias included variables in thedirection of non-significance. Hence, in the interpretation of theresults of the stepwise logistical model, one should remember that allof the explanatory variables were significant when starting off, butthat the stepwise process was aimed at selecting the best model andnot necessarily the only model. Against this background, the statisticalmodel therefore emphasizes some elements of the model shown inFig. 1, while other elements are not considered significant inpredicting WTP within the simultaneous context.
Of significance is the variable expressing the view that green
electricity is reliable, which is clearly an indication of awarenessabout the issues. The findings therefore resonate with those of Ek(2005), Salmela and Varho (2006), Hansla et al. (2008), and othersbefore them. Also significant is the variable describing the belief
that everyone should contribute, which is a manifestation of the freerider problem. Instead of becoming the ‘sponsor’ of the benefits forothers (Ek, 2005; Wiser, 1998), respondents feel it will be fairer foreveryone to share in the burden of higher costs. Yet, from Table 4,higher income households seem to voluntarily impose a higherlevel of responsibility on themselves, possibly driven by anawareness that the poorest of the poor may find it hard to affordthe additional cost.
Also significant is recycling, evidently an example of past pro-environmental behaviour as described by Stern et al. (1995). It is,however, surprising how few studies refer to such past behaviouras a predictor of future behaviour. After all, there is no such personas an ex-environmentalist.
Household income figures as a highly significant explanatoryvariable. This is in contrast to many other studies, making it worthyof mention. With high levels of income inequality, it is entirelyplausible that poor households may not be able to afford apremium. This should be a consideration in the design of futurestudies in emerging economies or in highly skewed incomeenvironments.
As far as the validity of the selected model (Fig. 1) is concerned,all of the variables hypothesized to play a causal role inunderstanding WTP have been shown to be statisticallysignificant. The four variables discussed in the previousparagraph play a significant role in our overall logistic model.This, however, does not negate the bivariate significance of thevariables contained in the theoretical model, but excluded from theestimation of the multiple regression model. These shouldtherefore not be disregarded by policy makers or academicresearchers in this domain.
4. Conclusion
The results of this study imply that future policy should addressawareness and the free rider problem. Interestingly, the results doindicate that higher income households in the Cape Peninsula arewilling to carry the heavier burden of the possible higher generationcosts of green electricity. This resonates strongly with the principleof common but differentiated responsibilities as described in climatechange policy discussions. This may need further investigation.
The results unsurprisingly indicate that a history of pro-environ-mental behaviour, such as participation in recycling, is a significantindicator of future behaviour, probably through being rooted in a pro-environmental value system as described in the literature review. Aspeople become more aware of and more involved in environmentalissues, their willingness to pay will be positively affected.
In this study, respondents were asked about the quantum of themonthly premium they would be willing to pay. This contrasts withother studies which tested WTP at specific premium categories.This was done because of the lack of any reference point to workfrom as no green electricity had been sold in South Africa at thetime of the survey. Recently, however, a price for green electricityhad been introduced and in future the focus may shift in thedirection of the conventional approach of determining WTP.
The current research can be easily extended to cover differentgeographic areas in South Africa, as well as the country in itstotality, to provide inputs for a national energy policy. Since thecompletion of this study, electricity prices in South Africa haveincreased substantially, meaning that it is possible that the WTP ofconsumers in the Western Cape have changed. This puts a limita-tion on the usefulness of the current findings in the policy designprocess. A thorough investigation of the price elasticity of thedemand for green electricity remains outstanding.
For the first time in the history of South Africa, electricity usersin the Cape Peninsula will in future be able to exercise the option tobuy electricity that has been generated in an environmentalfriendly manner. As yet, it is uncertain how they will react tothis offer. The results of this study hold out hope in this regard.While the poorest amongst the poor may still prioritize properhousing and any cheap accompanying electricity, all other incomegroups indicate a willingness to pay a premium for green elec-tricity. As can be expected, the willingness to pay and the size of thepremium increase with higher incomes. It is further moderated bythe belief that everybody should contribute to the excess cost, thebelief that green electricity is dependable and past involvement inpro-environmental activities like the recycling of waste.
Whether these anticipations and expressed ex ante willingnessto pay will manifest as market behaviour, will remain to be seenand will become the focus of future research projects.
Acknowledgements
We wish to thank the office of green energy at the City of CapeTown for its support of this survey, and IHS Global Insight for theprovision of the household income data.
This material is based upon work supported financially by theNational Research Foundation.
We wish to thank an unknown reviewer for his valuablesuggestions in improving this paper. The authors accept respon-sibility for all remaining errors.
References
Arkesteijn, K., Oerlemans, L., 2005. The early adoption of green power by Dutchhouseholds: an empirical exploration of factors influencing the early adoption ofgreen electricity for domestic purposes. Energy Policy 33, 183–196.
H. Oliver et al. / Energy Policy 39 (2011) 544–550550
Bergmann, A., Hanley, N., Wright, R., 2006. Valuing the attributes of renewableenergy investments. Energy Policy 34, 1004–1014.
Bhate, S., Lawler, K., 1997. Environmentally friendly products: factors that influencetheir adoption. Technovation 17 (8), 457–465.
Bird, L., Wustenhagen, R., Aabakken, J., 2002. A review of international green powermarkets: recent experience, trends, and market drivers. Renewable andSustainable Energy Reviews 6, 513–536.
Borchers, A., Duke, J., Parsons, G., 2007. Does willingness to pay for green energydiffer by source? Energy Policy 35, 3327–3334.
City of Cape Town Municipality, 2008. [Online]. Available: /http://www.capetown.gov.za/en/electricity/Pages/GreenElectricity.aspxS (accessed: 6 September2008).
Ek, K., 2005. The Economics of Renewable Energy Support. Lulea University ofTechnology–Department of Business Administration and Social Sciences–Division of Economics 40.
Hansla, A., Gamble, A., Juliusson, A, Garling, T., 2008. Psychological determinants ofattitude towards and willingness to pay for green electricity. Energy Policy 36,768–774.
IHS Global Insight, 2008. Regional eXplorer 493, (2.3d).Institute for Futures Research, 2009. Business Futures 2009. University of
Stellenbosch.Kwant, K., 2003. Renewable energy in The Netherlands: policy and instruments.
Biomass and Bioenergy 24, 265–267.Kalkman, J.B., Peters, M., 2002. Branding Electrons. McKinsey Quarterly [Online].
Available: /http://www.mckinseyquarterly.com/Branding_electrons_1150S(accessed: 25 June 2009).
Nyborg, K., Howarth, R.B., Brekke, K.A., 2006. Green consumers and public policy: onsocially contingent moral motivation. Memorandum No. 31, Department ofEconomics, University of Oslo, Norway.
Rex, E., Baumann, H., 2007. Beyond ecolabels: what green marketing can learn fromconventional marketing. Journal of Cleaner Production. 15 (6), 567–576.
Rundle-Thiele, S., Paldino, A., Apostol, S.A.G., 2008. Lessons learned from renewableelectricity marketing attempts. Business Horizons 51, 181–190.
Republic of South Africa, 2003. White Paper on Renewable Energy. Department ofMinerals and Industry.
Saunders, M., Lewis, P., Thornhill, A., 2007. Research Methods for. Business Students4th edition Pearson Education Limited, England.
Salmela, S., Varho, V., 2006. Consumers in the green electricity market in Finland.Energy Policy 34, 3 669–3 683.
Small, K., 2008. 2006 General Household Survey Analysis for Cape Town—Summary.Strategic Development Information and GIS Department Strategic InformationBranch.
Stern, P.C., Dietz, T., Kalof, L., 1993. Value orientations, gender, and environmentalconcern. Environment and Behavior 25, 322–348.
Stern, P.C., Dietz, T., Kalof, L., Guagnano, G.A., 1995. Values, beliefs, and pro-environmental action: attitude formation toward emergent attitude objects.Journal of Applied Social Psychology 25, 1611–1636.
Turner, B., 2007. The Statesman’s Yearbook. Palgrave Macmillan, New York.Wiser, R., 1998. Green Power Marketing: Increasing Customer Demand for Renew-
able Energy. Utilities Policy. Elsevier Academic Press, London, 107–119 pp.Wiser, R., Fowlie, M., Holt, E., 2001. Public goods and private interests: understanding
non-residential demand for green power. Energy Policy 29, 1085–1097.