Embed Size (px)
Citation preview

COMMERCIAL / INDUSTRIAL
DEFENSE
ENERGY
Reshaping for the Future
Investor Day – December 11, 2013

2
Please note that the information provided in this presentation is accurate as of the date of the
original presentation. The presentation will remain posted on this web site from one to twelve
months following the initial presentation, but content will not be updated to reflect new
information that may become available after the original presentation posting. The
presentation contains forward-looking statements including, among other things,
management's estimates of future performance, revenue and earnings, our management's
growth objectives and our management's ability to produce consistent operating
improvements. These forward-looking statements are based on expectations as of the time
the statements were made only, and are subject to a number of risks and uncertainties which
could cause us to fail to achieve our then-current financial projections and other expectations.
We undertake no duty to update this information. More information about potential factors that
could affect our business and financial results is included in our filings with the Securities and
Exchange Commission, including our Annual Reports on Form 10-K and Quarterly Reports on
Form 10-Q, including, among other sections, under the captions, "Risk Factors" and
"Management's Discussion and Analysis of Financial Condition and Results of Operations,"
which is on file with the SEC and available at the SEC's website at www.sec.gov.
Safe Harbor Statement

COMMERCIAL / INDUSTRIAL
DEFENSE
ENERGY
Strategic Overview and Future VisionDave AdamsPresident and CEO
Investor Day – December 11, 2013

Agenda
OVERVIEW AND VISION Dave Adams
CREATING SHAREHOLDER VALUEFinancial Update and 2014 Guidance Glenn TynanOperating Margin Improvement Tom Quinly
BUSINESS OVERVIEWCommercial Aerospace Graham MacdonaldIndustrial Kevin RaymentSurface Technologies Larry PeachDefense Lynn BamfordOil & Gas Ron StockwellPower Generation Greg Hempfling
Jim Leachman
4

An Inflection Point…
5

Moving Forward – Creating Value
FOCUS: Improving Shareholder Value
Organic Growth
Margin Improvement
Capital Deployment
Working Capital / CF
Market Strategies (VP / GMs)
Operational Initiatives (COO)
Financial Discipline (CFO)
Efficient Execution
New Alignment Will Accelerate Value Creation6

Our Vision is One Curtiss-Wright
INTEGRATED
Leaders
Markets
Comms.
Strategies
Functions
Processes
MARKET-FACING
5 or fewer major segments with critical mass
Top quartile performer
GLOBAL & DIVERSIFIED
A Unified Global Diversified Industrial Company 7

Recent OrganizationThree Segments Organized by Technology, Serving Diverse Markets
CEO
COO
ControlsHQ
Flow ControlHQ
Surface Technologies
HQ
Power Generation
Oil & Gas
Naval Defense
Commercial Aerospace
Aerospace Defense
Ground Defense
General Industrial
Commercial Aerospace
Aerospace Defense
General Industrial
8

Today’s OrganizationThree Segments Aligned by Market
CEO
COO
DefenseCommercial / Industrial Energy
Commercial Aerospace
General Industrial
Surface Technologies
Aerospace Defense
Ground Defense
Naval Defense
Power Generation
Oil & Gas
9

Experienced Executive Team
CEODave Adams
COOTom Quinly
Business Leader Years in Industry Years at CW FocusKevin Rayment 15 10 IndustrialGraham Macdonald 20 8 Comm. Aero.Larry Peach 21 21 Surface Tech.Greg Hempfling 31 9 Defense / NuclearLynn Bamford 25 15 DefenseRon Stockwell 30 3 Oil & GasJim Leachman 31 21 Nuclear
CFOGlenn Tynan
24+ Years industry exp. 14 Years at CW Former President:
CW Controls, Flow Control, Surface Technologies
20+ Years industry exp. 9 Years at CW Former President:
CW Controls
20+ Years industry exp. 14 Years at CW
10

ENERGY
DEFENSE
COMMERCIAL / INDUSTRIAL
Three Powerful Segments
Component / Subsystems offering provides strong margins without high overhead requirements
Providing unique value through vehicle control systems; leveraging trends in emissions and efficiency
High value IP content in Electronics and Nuclear –leverages pockets of growth in an overall declining market
Opportunities in Upstream market for specialty products and applications
Uniquely positioned as a qualified component supplier to ensure life extension and regulatory compliance
11

Our Alignment
One Curtiss-Wright
PRIORITIZES THE CUSTOMER
EMPHASIZES MARKET LEADERSHIP
LEVERAGES OPERATIONAL EXPERTISE / SYNERGIES
STREAMLINES P&Ls and REDUCES DUPLICATION
12
Choosing Where We Compete
custom design
very low volume
systems integration
high volatility
little IP content high volume low tier parts supplier
FOCUS FOCUS
13

Achieving Profitable Growth
custom design
very low volume
systems integration
high volatility
little IP content high volume low tier parts supplier
FOCUS FOCUS
UNIQUE IP
PLATFORM INDEPENDENT
SCALE
14

Clear Financial Objectives
5-6%Double
Digit
TopQuartile
>12.5%
>12%
~100%
Organic SalesGrowth
EPSGrowth
ROIC Free Cash FlowConversion
Operating Margins
15

COMMERCIAL / INDUSTRIAL
DEFENSE
ENERGY
Financial HighlightsGlenn E. TynanVP & CFO
Investor Day – December 11, 2013
Finance Transformation
UNIVERSAL AND TRANSPARENT METRICS
COMPREHENSIVE CAPITAL ALLOCATION STRATEGY
RIGOROUS WORKING CAPITAL MANAGEMENT
ONE CURTISS-WRIGHT THREE MARKET-FACING SEGMENTS
17
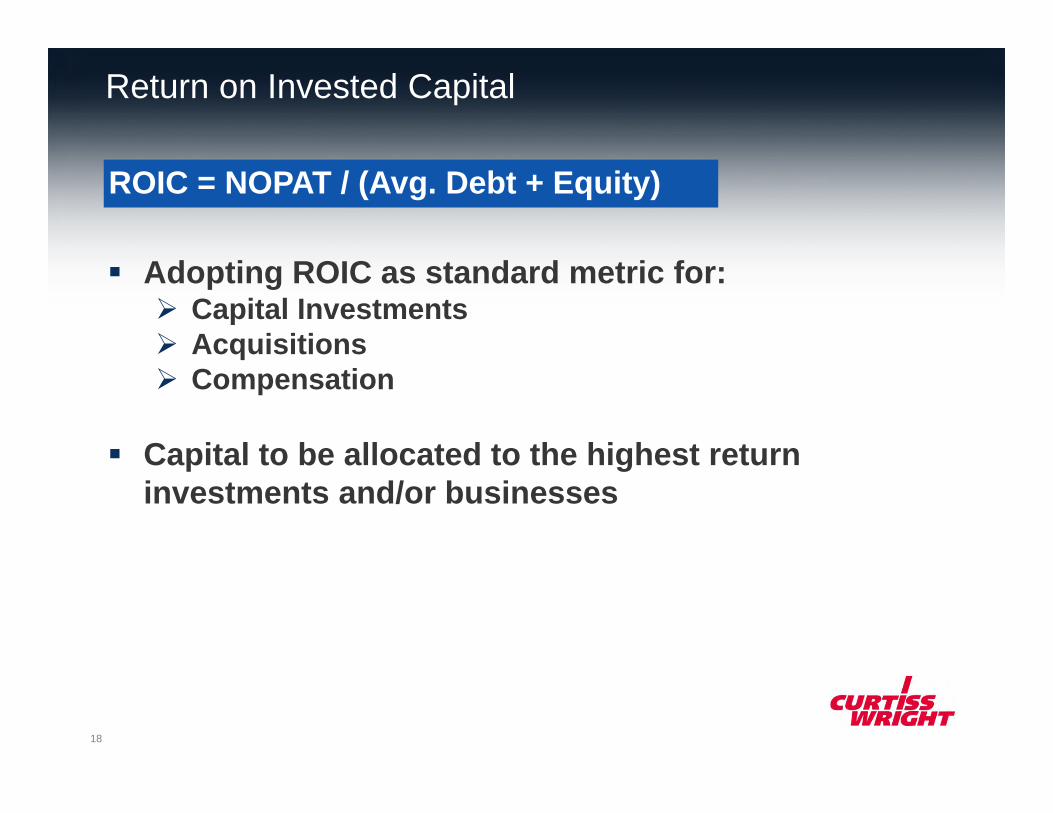
Adopting ROIC as standard metric for: Capital Investments Acquisitions Compensation
Capital to be allocated to the highest return investments and/or businesses
Return on Invested Capital
ROIC = NOPAT / (Avg. Debt + Equity)
18

Return on Invested Capital
Target: 12% ROIC Currently below median
versus peer group(2)
Goal: Top Quartile
OBJECTIVE
0.0%
2.0%
4.0%
6.0%
8.0%
10.0%
12.0%
14.0%
Curtiss-Wright Peer 50thPercentile
Peer 75thPercentile
ROIC(1)
(1) ROIC = NOPAT / (Avg. Debt + Equity)(2) Peer group per CW proxy – CW 2013F; Peers latest SEC filing19

Capital Allocation Strategy
The same metric (ROIC) and criteria are applied to all investment opportunities
Leverage Metrics: Debt / Cap 35% – 50% Debt / EBITDA 2x – 4x
Capital Expenditures Acquisitions
Dividends Share Repurchase
20

Cash Flow
0%
5%
10%
15%
20%
25%
30%
35%
Curtiss-Wright Peer 50thPercentile
Peer 75thPercentile
Working Capital(1) as a % of Sales
OBJECTIVE
Cash flow key element of S/T compensation plan
Focus: Reduce Working Capital % at the BU level
Currently below median versus peer group(2)
Goal: Top Quartile
(1) Working Capital = Inventory + A/R - A/P(2) Peer group per CW proxy – CW 2013F; Peers latest SEC filing21

Capital Expenditures
OBJECTIVE
Currently below median versus peer group(1)
Goal: Top Quartile
0.0%
0.5%
1.0%
1.5%
2.0%
2.5%
3.0%
3.5%
4.0%
Curtiss-Wright Peer 50thPercentile
Peer 75thPercentile
CapEx as a % of Sales
(1) Peer group per CW proxy – CW 2013F; Peers latest SEC filing
Invest in high return projects and/or businesses
Accountability
22

A New Approach to M&A
Corporate-led process drives consistency
New ROIC-based valuation analysis
Capital Allocation decisions temper current spend
Ample quality opportunities
More Selective Approach23

Dividends and Share Repurchase
Dividends Steady, periodic increases
Share Buybacks Shift of balance enables share buybacks to
become a more strategic element of our capital allocation strategy
Consistently Working to Maximize Value24

COMMERCIAL / INDUSTRIAL
DEFENSE
ENERGY
Financial Guidance

2014 Guidance – Current Segment Structure
FY2013E(as of Oct. 30)
FY2014E(as of Dec. 11) % Growth
Total Sales $2,480 - 2,520M $2,650 - 2,700M 6 - 8%
Flow Control $1,300 - 1,320M $1,370 - 1,390M 5 - 6%
Controls $865 - 875M $950 - 970M 9 - 11%
Surface Technologies $315 - 325M $330 - 340M 3 - 6%
Total Operating IncomeCW Margin
$232 - 240M9.3% - 9.5%
$267 - 278M10.1% - 10.3%
13 - 18%~80 bps
Flow ControlMargin
$116 - 119M8.9% - 9.0%
$130 - 135M9.5% - 9.7%
11 - 15%~60 bps
ControlsMargin
$103 - 106M11.9% - 12.1%
$120 - 123M12.6% - 12.7%
15 - 18%~70 bps
Surface TechnologiesMargin
$53 - 55M 16.8% - 16.9%
$58 - 60M 17.4% - 17.5%
7 - 10%~70 bps
Corporate and Other ~$40M $40 - 41M Flat
Guidance as of December 11, 2013. Full year amounts may not add due to rounding.
26

Operating Margin Expansion 2014
9.3 - 9.5%
10.1 - 10.3%(30 bps)
(10 bps)
+120 bps
8.0%
8.5%
9.0%
9.5%
10.0%
10.5%
11.0%
2013E Operationalimprovements in
base business
Acquisitionscompleted
4Q'12 - 1Q'13
Acquisitionscompleted
2H'13
2014E
Guidance as of December 11, 2013.
27

2014 Guidance – Transition to New Segment Structure
Flow: Oil & Gas + Power Gen
(Aftermarket)
Flow: Defense + Power Gen (AP1000) +
GIControls: All Defense
Controls: All Comm Aero + Gen. Ind.
All CWST
Flow: CommAero
Oil & Gas
Comm Aero
GenIndus
Defense
Power Gen
Power Gen
Defense
CommAero
Gen Indus
CommAero
Gen Indus
Defense
Oil & Gas
Power Gen
Flow Control
Controls
Surface Tech
Commercial / Industrial
Defense
Energy
28

2014 Guidance – New Segment Structure
Guidance as of December 11, 2013. Full year amounts may not add due to rounding.
FY2014E(as of Dec. 11) % Growth
Total Sales $2,650 - 2,700M 6 - 8%
Commercial / Industrial $1,040 - 1,060M
Defense $890 - 910M
Energy $720 - 730M
Total Operating IncomeCW Margin
$267 - 278M10.1% - 10.3% 13 - 18%
Commercial / IndustrialMargin
$138 - 142M13.3% - 13.4%
DefenseMargin
$118 - 122M13.3% - 13.4%
EnergyMargin
$52 - 54M 7.2% - 7.4%
Corporate and Other $40 - 41MDiluted EPS $3.20 - 3.35 14 - 20%
29

2014 Guidance – Sales Growth by End Market
FY2014E(as of Dec. 11)
% of Total Sales
Aero Defense 8 - 12% 11%
Ground Defense (7 - 11%) 3%
Naval Defense (2) - 2% 14%
Total DefenseIncluding Other Defense
1 - 5% 29%
Commercial Aero 6 - 10% 16%
Oil & Gas 11 - 15% 19%
Power Generation 2 - 6% 18%
General Industrial 8 - 12% 18%
Total Commercial 7 - 11% 71%
Total Curtiss-Wright 6 - 8%
Guidance as of December 11, 2013.
30

2014 Guidance – All Other
FY2013E(as of Oct. 30)
FY2014E(as of Dec. 11)
Post-Retirement Expense $33 - 34M $36 - 37M
Interest Expense $39 - 40M $39 - 40M
Diluted EPS $2.75 - 2.85 $3.20 - 3.35
Diluted Shares Outstanding 47.6M 48.4M(1)
Effective Tax Rate 32.0% 32.0%
Free Cash Flow $110 - 120M $140 - 150M
Free Cash Flow Conversion 84 - 89% 90 - 93%
Depreciation & Amortization $125 - 130M $130 - 140M
Capital Expenditures $80 - 85M $80 - 90M
(1) Assumes no share repurchases in 2014
Guidance as of December 11, 2013.31

Sound Financial Strategies
Improving Shareholder
Returns
Balanced Capital
Allocation
Operating Margin
Expansion
Financial Transparency
Cash Flow Maximization
32

COMMERCIAL / INDUSTRIAL
DEFENSE
ENERGY
Operating Margin ImprovementTom QuinlyChief Operating Officer
Investor Day – December 11, 2013

OBJECTIVE
0.0%
2.0%
4.0%
6.0%
8.0%
10.0%
12.0%
14.0%
16.0%
CW 2013 50th 75th Target
9.3% - 9.5%
12.5%
14%
9.2%
(1) Based upon peer group per CW proxy - 3 year avg. 2010-2012
Current State – Operating Margin Benchmarking (1)
Peer Group Percentile
34

Margin Improvement
“BIG 10”IMPERATIVES
35

CapitalDeployment
OTD
Acquisitions
Employee Engagement
InventoryTurns
ROIC
OrganicGrowth
New Product
IWRR
FCF
RONA
Operating Margin
1
GrowthInitiatives
ProductStrategies
Clarity of Purpose
GeographicExpansion
Inventory
36

Total Alignment
Total Commitment
No Excuses
Compensation Alignment
Accountability
2
37

Continue Lean Journey
Drive Engineering Excellence
Continuous Improvement Culture
All disciplines
Targeted Savings by Site/Team
Continuing the Journey
Operational Excellence
3
Tota
l 201
3 O
ppor
tuni
ty
Admin$354M
Selling$155M
R&D$70M
OtherCOS
$825M
DirectMaterial$880M
$2.3B
38

Leverage Spend Council
LCE Supplier Development
Indirect Spend Target
Focused Commodity Teams
Clear Accountability
Tota
l Opp
ortu
nity
$85MCAPEX
$330MINDIRECT
$880mDIRECT
$1.3B
Supply Chain Initiatives
4
39

“Addition by Subtraction”
Portfolio Rationalization
5
40

Market facing – delayering
Numerous Opportunities
Improving transparency
Leverage Centers of Excellence
Continuous Process: Strategy Evolution Acquisition Integration
$750M
$1.4M
<$40M >$40M
Opp
ortu
nity > 40
Sites*20
Sites*
*Excludes Surface Technologies sales and sites
Consolidation Programs
6
41

Benchmarking complete
Finance – well down the path: Contributing
IT - well down the path: Fy14 contributions
HR – early days Phase II launch next year Additional plans being developed
Driving top quartile performance
Shared Services
7 5.1%
3.1%
42

Suzhou, China + Nogales, MX Significant Contributions
Pune, India + Querétaro, MX Still Maturing
Supply Chain Localization Key Driver
Teams/Processes in place
Aggressive Fy14 plan
Low Cost Economy COE Development
8
43

Segment Focus Area
Defense – Consolidation Programs– Underperforming Product Areas– Program Investments– Portfolio Expansion Investments
CommercialIndustrial
– Greenfield Operations– LCE Capability Development– Portfolio Expansion Investments– Acquisition Improvements
Energy – Downstream O&G– Acquisition Improvements– Plant Improvement & Expansions– Services Business
Energy
Defense
Fy13
Opp
ortu
nity
$30-40M
Com/Ind
Segment Focus Opportunities
9
44

Dimension Focus Area
Technology – Protect the Core– Technology Leadership– Attack Discontinuities– Portfolio Expansion
Market – Leverage core capabilities– Attack niche new segments– Select Bolt-On Acquisitions
Geographic Expansion
– Management Training– Operations Best Practices– Acquisition Talent Parachute
Strategic Growth Initiatives
10
Making the Right Investments
Technology
GeographicExpansion
New Market
45

Strategic Margin Drivers
Today 2018
CompetitivenessPrograms
Shared Services
Portfolio Review
Segment Focus
9.3 - 9.5%
14%
Achieving 14% Over the Planning Period
Strategic Initiatives
Volume
46

Key Takeaways
Significant opportunities
Plan in place
Management alignment and commitment
Talented team to execute
No excuses
47


COMMERCIAL / INDUSTRIAL
DEFENSE
ENERGY
Commercial AerospaceGraham MacdonaldSVP/GM, Sensors & Controls
Investor Day – December 11, 2013

110 Years of History – Foundation for the Future
Innovation
Reliability
Precision.
50

Nose to Tail – Covering the Airplane
Commercial Aerospace – Our Capability
51

8 Years – 10 Platforms – 21 Derivatives
Commercial Aerospace – Our Market
2017 2018 2019 2020 20212014 2015 2016
CS100/300
MRJ90
E175/190/195
A319/320/321 NEO
B737-7/8/9 Max
MS-21
C919
A350-800/900/1000
787-9/10
777-8/9
52

CW Key Platform Wins - >$2.2B in LTV
Commercial Aerospace – Our Market
2017 2018 2019 2020 20212014 2015 2016
CS100/300
MRJ90
E175/190/195
A319/320/321 NEO
B737-7/8/9 Max
MS-21
C919
A350-800/900/1000
787-9/10
777-8/9
53

CW Key Platform Pursuits - >$300M in LTV
Commercial Aerospace – Our Market
2017 2018 2019 2020 20212014 2015 2016
CS100/300
MRJ90
E175/190/195
A319/320/321 NEO
B737-7/8/9 Max
MS-21
C919
A350-800/900/1000
787-9/10
777-8/9
54

Evolving Market Channels: Tier 1 Consolidation Customers Seeking Risk Sharing
Partners
Commercial Aerospace – Our Strategy
Trend
55

Commercial Aerospace – Our Strategy
Key Account Strategy
56
Commercial Aerospace – Our Strategy
Key Account Strategy
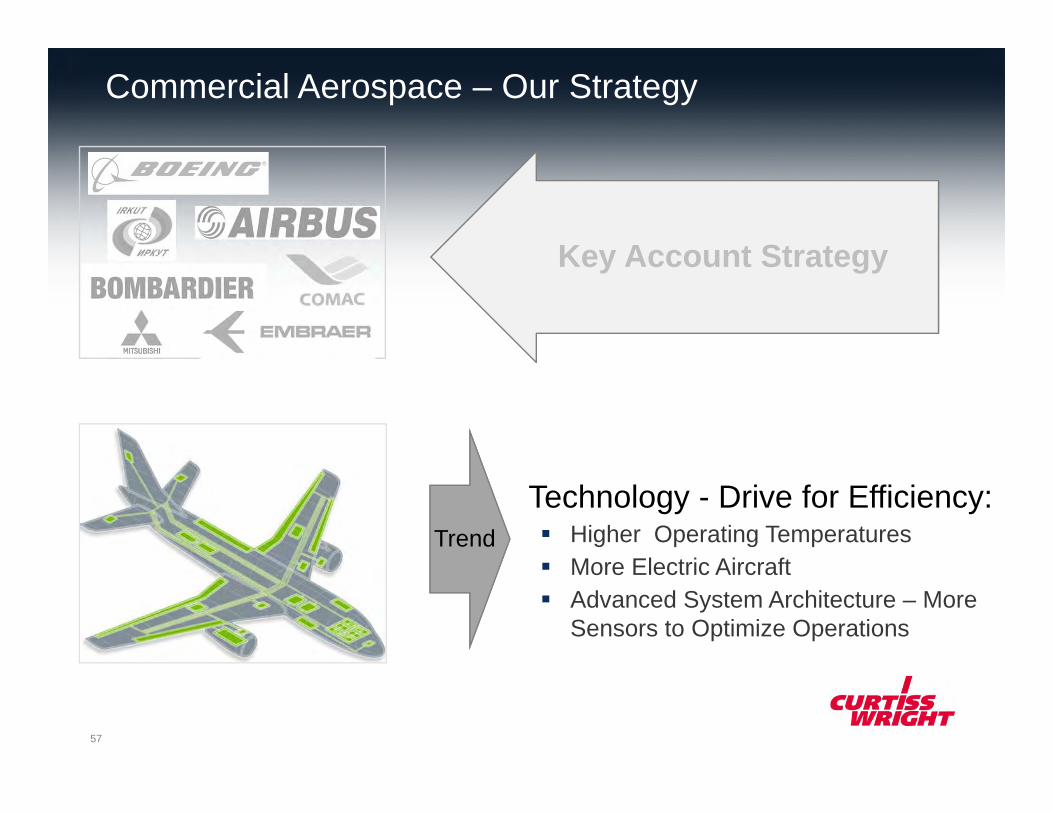
Technology - Drive for Efficiency: Higher Operating Temperatures More Electric Aircraft Advanced System Architecture – More
Sensors to Optimize Operations
Trend
57

Commercial Aerospace – Our Strategy
Technology Roadmaps&
Expanded Product Offering
Key Account Strategy
58

Commercial Aerospace – Our Strategy
Key Account Strategy
Technology Roadmaps&
Expanded Product Offering
Creating Competitive Differentiation59

Summary
Market Experience – Capability and Technologies to Fill
Customer Gaps
Technical Solutions That Differentiate
Market Opportunities – Rate Increase on Legacy &
Development Platforms Pipeline of New and Derivative
Platforms and Engine
Market Position – Relationships to Fuel Growth
Key Account Strategy That Drives Greater Than Market Win Rate
Customer Relationships
Commercial Aero
On Course For Growth & Margin Expansion60

COMMERCIAL / INDUSTRIAL
DEFENSE
ENERGY
IndustrialKevin RaymentSVP/GM, Industrial
Investor Day – December 11, 2013

Markets We Serve
On Highway Off Highway
Electric Vehicles 62

Products
63
Controllers Power Management Electronic Throttle
Sensors Shifters Joysticks

Applications
64

Opportunity In This Space
P & G Industrial
$300M
$900M$3B
Base Industrial
+PG Drives
+Williams Controls
Market Access Double Digit Growth
Vehicle Build Rate
Growth
Electronic Adoption Growth
CWFocus
5-6%
+Arens
Controls
65

Positive Trends Impacting Our Growth
Increased demand for electronic control systems and sensors Driven by Operational efficiency Safety Driver Fatigue Repeatability Making “use of the data” / intelligent systems Reduced emissions and greater fuel efficiencies
OEMs reducing supplier base
66

Competitive Strengths
Critical Application
Integrated Channel
Rugged Designs
Global Capability
Superior Customer Satisfaction
Technology Leadership
Gro
wth
67

Market Leadership
#1Electronic
Throttle Controls
#1Shifters
#1Hybrid Bus
#1Mobility
68

Key Strategy #1- Covering the Vehicle
CW System Solution69

New Technology
Step Change - Technology
Next Generation
Key Strategy #2 – New Product Generation
70

Margin Expansion Opportunities
China Manufacturing ExpansionChina Localization “Phase II” Complex Integration
Margin Expansion Core To Our Business71

Tremendous Opportunity For Growth
Summary
Market opportunity Established critical mass Double digit growth Market leadership System strategy Margin expansion
72

COMMERCIAL / INDUSTRIAL
DEFENSE
ENERGY
Surface Technologies
Investor Day – December 11, 2013
Larry PeachPresident, Surface Technologies

Ensuring design integrity & fatigue/corrosion protection of utmost importance
Providing Advanced Surface TechnologiesFor Premium Commercial/Industrial Markets
74

Customers moving to new geographies & demanding more advanced service delivery
Providing Advanced Surface TechnologiesFor Premium Commercial/Industrial Markets
75

Technology leadership required to support advanced design criteria
Providing Advanced Surface TechnologiesFor Premium Commercial/Industrial Markets
76

Enabling Critical Component Performance
Shot & Laser
Peening Extend Life
Engineered Coatings Provide
Protection
Analytical Services Ensure Integrity
77

Market Positioning & Differentiation
#1 Worldwide in Shot & Laser Peening
Technical leadership in Engineered Coatings & Analytical Services
Specialized engineering capabilities
Bundling new technologies throughout 70+ facility network
Shop-in-Shop global expansion focus
78

Advancing Technology & ReachTe
chno
logy
2009
LegacyTechnology
AdvancedTechnology
Distribution
Laser Peening
Laser Peening
Shot Peening
Shot Peening
79

Advancing Technology & ReachTe
chno
logy
2013
2009
LegacyTechnology
AdvancedTechnology
LegacyTechnology
AdvancedTechnology
Distribution
2009 – 2013F CAGR: 16%
AnalyticalServices
AnalyticalServices
Laser Peening
Laser Peening
Shot Peening
Shot Peening
EngineeredCoatings
EngineeredCoatings
80

Market Directions
Market TrendsCommercial Aerospace
Airbus deliveries steady
Boeing deliveries still increasing
Biz/Regional jets slight growth
General Industrial US GDP growth strengthens
EU emerging from recession
Industrial Gas Turbines New technologies increasing oil/gas drilling activity
Industrial gas turbine market seeing solid growth due to low natural gas pricing and retirement of coal fired power plants
81

Focused Technology Investment
Scale UP: Grow by expanding use of existing proprietary predictive models for new applications
Scale OUT: Grow by rapid insertion of new tools & technologies
82

Margin Improvement
Cost Control Automation Technology Critical Mass
Cum
ulat
ive
Valu
e
Productivity enhancements from increased automation & robotics
Further exploitation of offline programming
Asset redeployments among facilities and facility consolidations
83

Summary
Extending Life Cycle
Advancing Up Technology Chain Focused Technology
Development Top Quartile Op
Margin performance
84

COMMERCIAL / INDUSTRIAL
DEFENSE
ENERGY
DefenseLynn BamfordSVP/GM, Defense Solutions
Investor Day – December 11, 2013

Our Defense Markets
Providing mission-critical avionics
C4ISR
Providing reliable electro-mechanical and
vehicle electronics
Providing shipboard electro-mechanical and
electronic solutions
Enabling Network-Centric Warfare
86

Curtiss-Wright Ranked #1 in the Industry
THE LEADING SUPPLIER OF OPEN ARCHITECTURE RUGGED EMBEDDED COMPUTING TECHNOLOGY
The COTS Success Story87

Defense Market Trends
Trends Predictions
Fewer Large Programs
Modernization Of Existing Platforms
Emphasis On Affordability
Emphasis On Technical Maturity
US Defense cuts will continue
R&D cut at ~ 20%
Defense Industry hit hard in 2014
Primes focusing on International Sales
International Growth Opportunities Worldwide C4ISR growth driven by Asia-Pacific region
Key Strategies Developed to Address Market Trends88

Strategy: “COTS +”Become a New Class of COTS Supplier
We Took A Core COTS Product Strategy
CORECOTS
PRODUCTS
89

Strategy: “COTS +”Become a New Class of COTS Supplier
Added Capabilities to Provide a Stronger COTS Offering
CORECOTS
PRODUCTS
Unmatched Life Cycle Support
Customization
C4ISR Application Knowledge
Affordable Price Ranges
Acquisition Reform Knowledge
90

Strategy: “COTS +”Become a New Class of COTS Supplier
Plus Capabilities to Increase Value and Content
CORECOTS
PRODUCTS
Unmatched Life Cycle Support
Customization
C4ISR Application Knowledge
Affordable Price Ranges
Acquisition Reform Knowledge
System of Systems Integration
System Ready Applications
Advanced Technology Partnerships
91
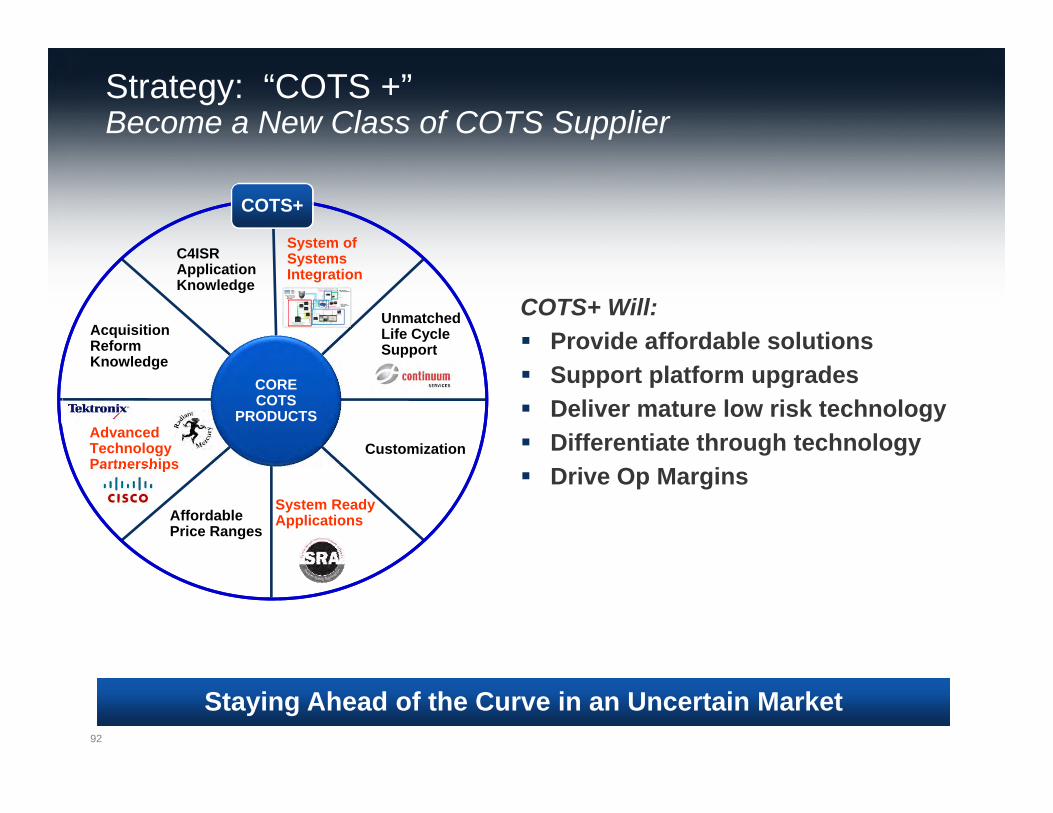
Strategy: “COTS +”Become a New Class of COTS Supplier
COTS+ Will: Provide affordable solutions Support platform upgrades Deliver mature low risk technology Differentiate through technology Drive Op Margins
CORECOTS
PRODUCTS
Unmatched Life Cycle Support
Customization
C4ISR Application Knowledge
Affordable Price Ranges
Acquisition Reform Knowledge
System of Systems Integration
System Ready Applications
Advanced Technology Partnerships
COTS+
Staying Ahead of the Curve in an Uncertain Market92

Strategy: Growth in C4ISR
Enabling Network-Centric Warfare
G/ATORG/ATOR
JSTARSGlobal Hawk/Triton
UCAS-D
WIN-T JLTV
KiowaSentinel
Doubling Available Market93

Strategy: Targeting Key Market Opportunities
Examples
Electronic Warfare Increased demand for wideband and
multichannel needs of EW, SIGINT & ISR systems
Foreign Military Sales Need to protect U.S. technology
through trusted people, products and processes
CHAMP-DRFMExtreme high performance
wide-band Digital RF Memory Module
Trusted COTS from Curtiss-Wright
Technology Aligned to Market Growth94

Strategy: International Growth
UK Scout UK Warrior
South Africa HoefysterSingapore Bionics I
Well-Positioned in Europe, Middle East and Asia95

Summary
Track record of technology leadership
Trusted supplier for over 3 decades and thousands of programs
Continued growth in a constrained market
Marquee brand
Top quartile financial performance
Ranked Number One In The Industry96

COMMERCIAL / INDUSTRIAL
DEFENSE
ENERGY
Oil & GasRon StockwellVP/GM, Oil & Gas Systems
Investor Day – December 11th, 2013
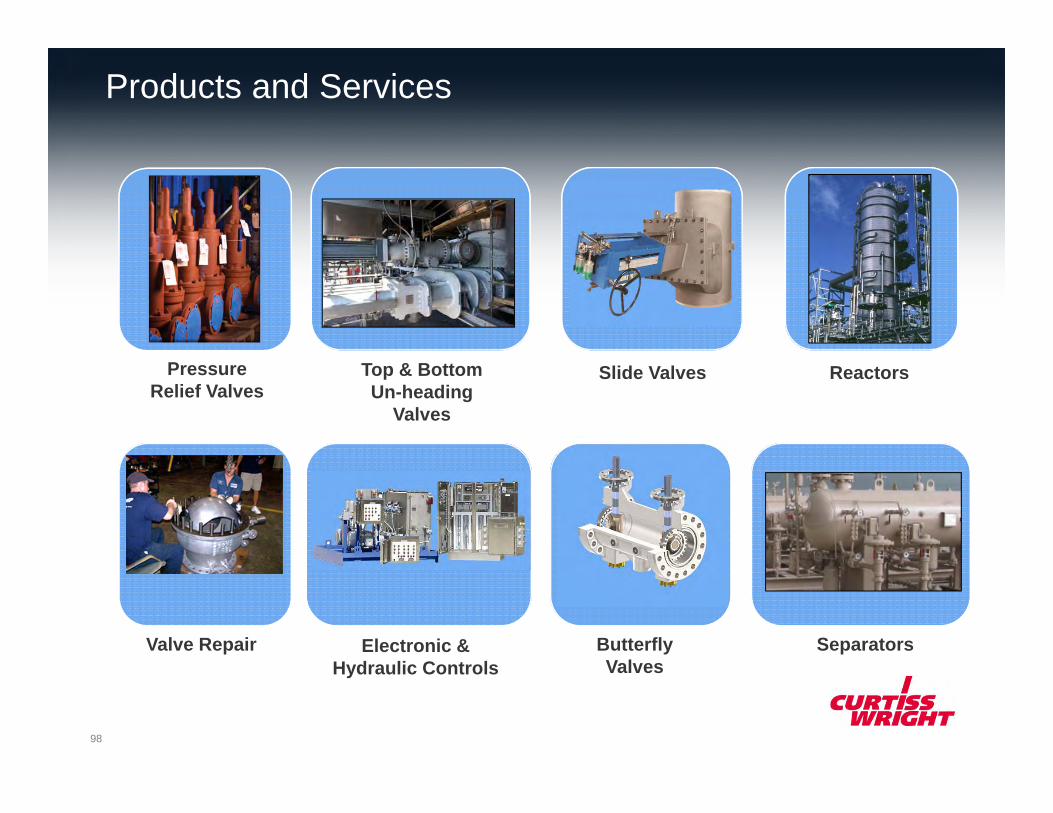
Products and Services
Separators
Pressure Relief Valves
Slide Valves ReactorsTop & Bottom Un-heading
Valves
Electronic & Hydraulic Controls
Valve Repair Butterfly Valves
98

Market Updates
Capital investment slowed significantly in recent years
US production is level, but there are fewer refineries
Global expansion has been slower than expected due to economic uncertainty
Worldwide refinery counts are stable, and capacity is increasing
Shift to more complex refineries
Running equipment longer
Worldwide demand is increasing, driving upstream activity
North America has highest capital expenditure for 7 consecutive years
High crude oil prices and a global demand have resulted in a huge level of upstream activity
Refining UpstreamAftermarket
99

Industry Drivers Fuel Future Growth
Upstream Market Drivers
Emergence of Unconventional
Resources
• Shale oil will be 35% of oil production by 2035• Shale gas will be 45% of gas production by 2035
US is an Oil-Driven Market • New drilling technologies changing the profit equation
Rising Demand for Oil and Gas
• Global oil consumption is expected to increase by 25 million barrels per day
Increasing Environmental
Regulation • Substantial investments in Environmental compliance will
be required by producers
100

Oil & Gas Strategy Overview
Aftermarket Growth
Product Innovation
Operational Excellence
Upstream Diversification
Global Reach
Upstream expansion Technology insertion Short cycle business focus Cost reduction & lead time Aftermarket growth Selective global growth
101

Upstream DiversificationExploration to Transportation Components
102

Upstream DiversificationKey Opportunity Areas
Separation and Processing
Emissions Control
Wireless Connectivity
Strategy - Providing high IP products for critical wellhead applications ensuring safe, efficient and
environmentally friendly operations103

Upstream DiversificationKey Opportunity Areas
Over 40,000 New Wells in North America Every Year!104

Cimarron Core Products
Production, Processing and Emissions Control Equipment
Oil Treating Equipment
Combination Units
Flowback Equipment
Separators
Well Positioned in a Growing Market
Emission Control Devices
Burner Management
Systems
Vapor Recovery Towers
105

Margin Improvement
Product Mix Upstream product focus New technology introduction
Capacity Utilization Insourced $12M from
Cimarron $40M planned for 2014 Accelerates Cimarron growth
Lean Implementation Throughput up 25% Targeting 20% improvement
in productivity in 2014
Excellent Progress Being Made and Will Continue
2014 Future
7.2% - 7.4%
14%
Energy Op Margins
106

Summary
Solid growth led by Upstream and Aftermarket
Intercompany capacitysupports Upstream growth
Continued focus on Lean implementation drives margin improvement
Capitalizing on Upstream & Operational Excellence107

COMMERCIAL / INDUSTRIAL
DEFENSE
ENERGY
Commercial PowerGreg HempflingSVP/GM, Electro-Mechanical SystemsJim LeachmanSVP/GM, Nuclear
Investor Day – December 11, 2013

An Enduring Legacy60 years of service to the Nuclear Power Market
109

“New Build” Market is Strong60 Operating reactors under construction in 13 countries 150 to 300 planned/proposed in 43 countries by 2030
Source: WNA110
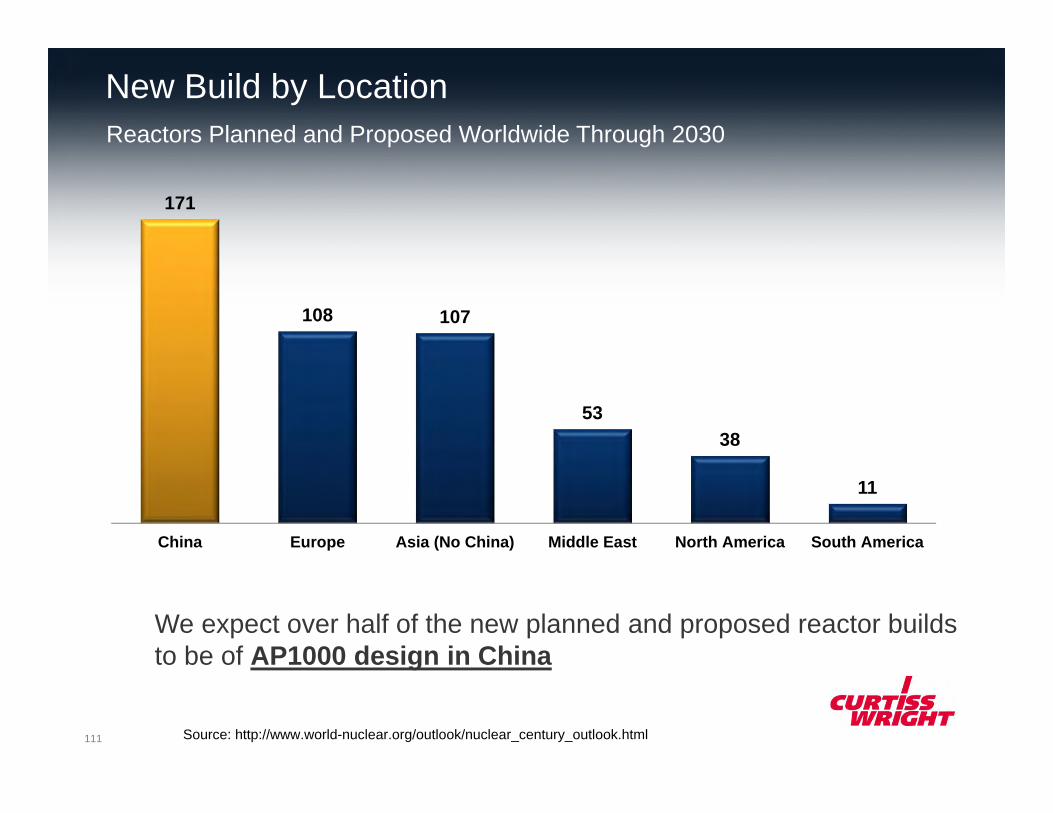
New Build by LocationReactors Planned and Proposed Worldwide Through 2030
171
108 107
5338
11
China Europe Asia (No China) Middle East North America South America
Source: http://www.world-nuclear.org/outlook/nuclear_century_outlook.html
We expect over half of the new planned and proposed reactor builds to be of AP1000 design in China
111
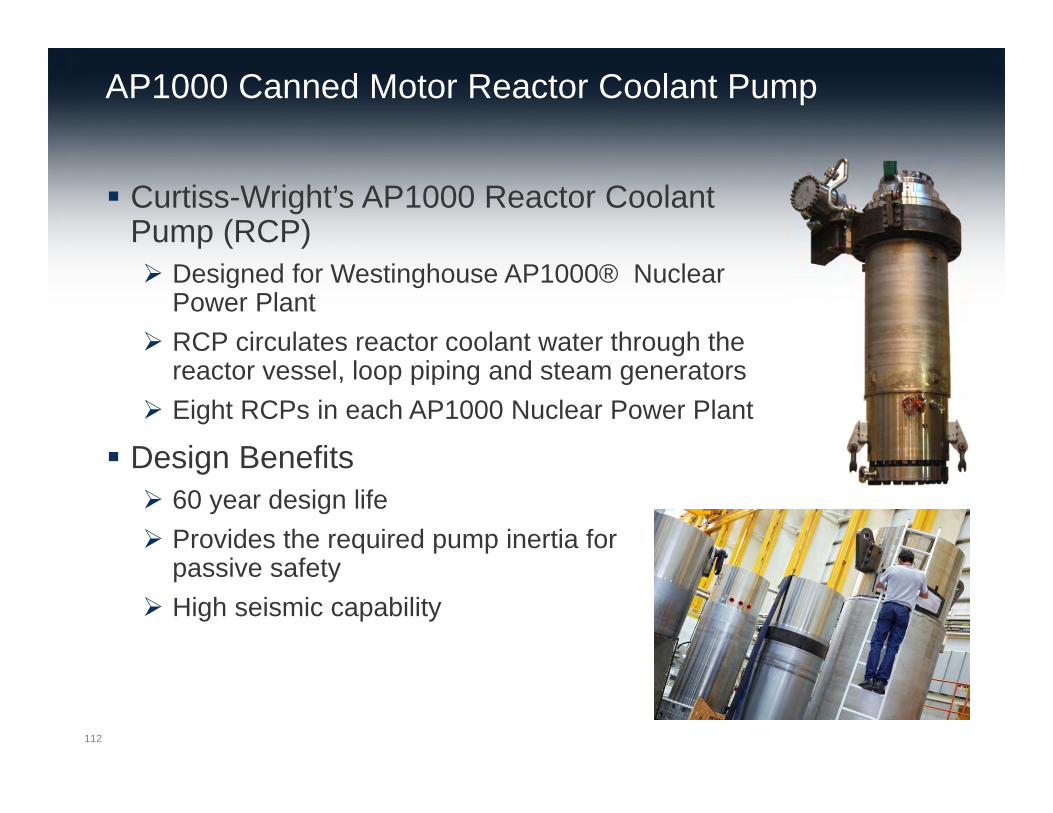
AP1000 Canned Motor Reactor Coolant Pump
Curtiss-Wright’s AP1000 Reactor Coolant Pump (RCP) Designed for Westinghouse AP1000® Nuclear
Power Plant RCP circulates reactor coolant water through the
reactor vessel, loop piping and steam generators Eight RCPs in each AP1000 Nuclear Power Plant
Design Benefits 60 year design life Provides the required pump inertia for
passive safety High seismic capability
112

AP1000 RCP Strategic Actions
Focus on China Negotiate RCP orders directly with the Chinese plant owners Explore opportunities through Westinghouse
Keep pursuing all opportunities Czech Republic High Seismic RCP
Innovations/Improvement Make Current Model RCP obsolete
113

World Operating Reactors432 Operating reactors in 31 countries provide 11% of the world’s power
Source: WNA114

Market Volatility Creates Opportunity
OpportunitiesIncreased Teaming/Client Partnerships
Executed Key AcquisitionsGrown Stable of Subject Matter Experts (SMEs)
Invested in QA Infrastructures / “N” StampsAdvanced Obsolescence PlatformProduct/Technology Development
1979-2000 2000-2010 2010-2013
Three Mile Island / Chernobyl Poor operating performance Cost overruns “N” Stamp/OEM abandonment
Nuclear Renaissance 91%+ capacity factors PLEX, EPU’s Positive public opinion
Fukushima Plant closures Natural gas prices Economy- Reduced Demand
115

Operating Reactors
OperatingReactors88%
OperatingReactors86%
OperatingReactors76%
2000 200814% CAGR
201310% CAGR
Aftermarket Sales Growth
Continued Strong Sales Growth into Operating Reactors
New Build24%New Build
14%
New Build12%
116
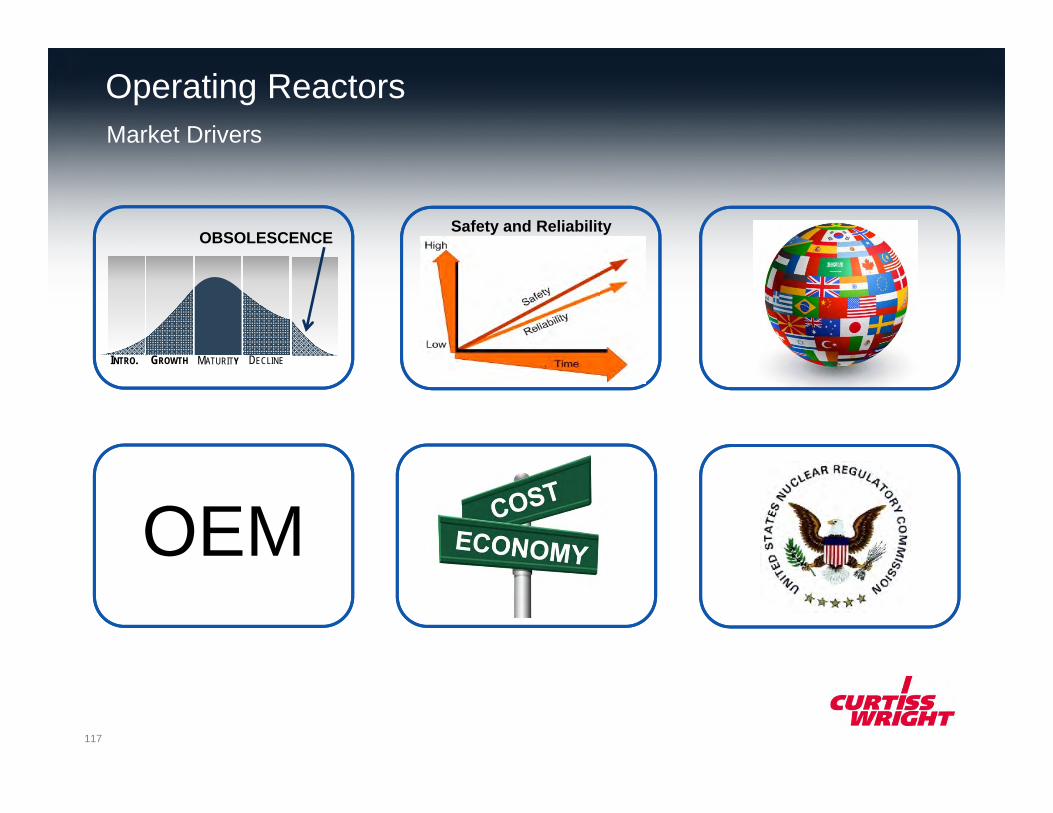
Operating ReactorsMarket Drivers
OEM
INTRO. GROWTH MATURITY DECLINE
OBSOLESCENCESafety and Reliability
117

Operating Reactors Regulatory: Fukushima
Completed Backlog Addressable Market $0M $14M $70M
118

Operating Reactors
Completed Backlog Addressable Market $178M $42M $600M
Plant Process Computers Analog Control Modules
Critical plant performance monitoring with state of the art technology
Platform for larger non-safety control systems
Addresses NRC cyber security concerns and regulations
Solves OEM market abandonment
Generates thousands of new CW installed proprietary modules
No design change - meets original Form, Fit and Function
Safety, Reliability, OEM Abandonment, Obsolescence
119
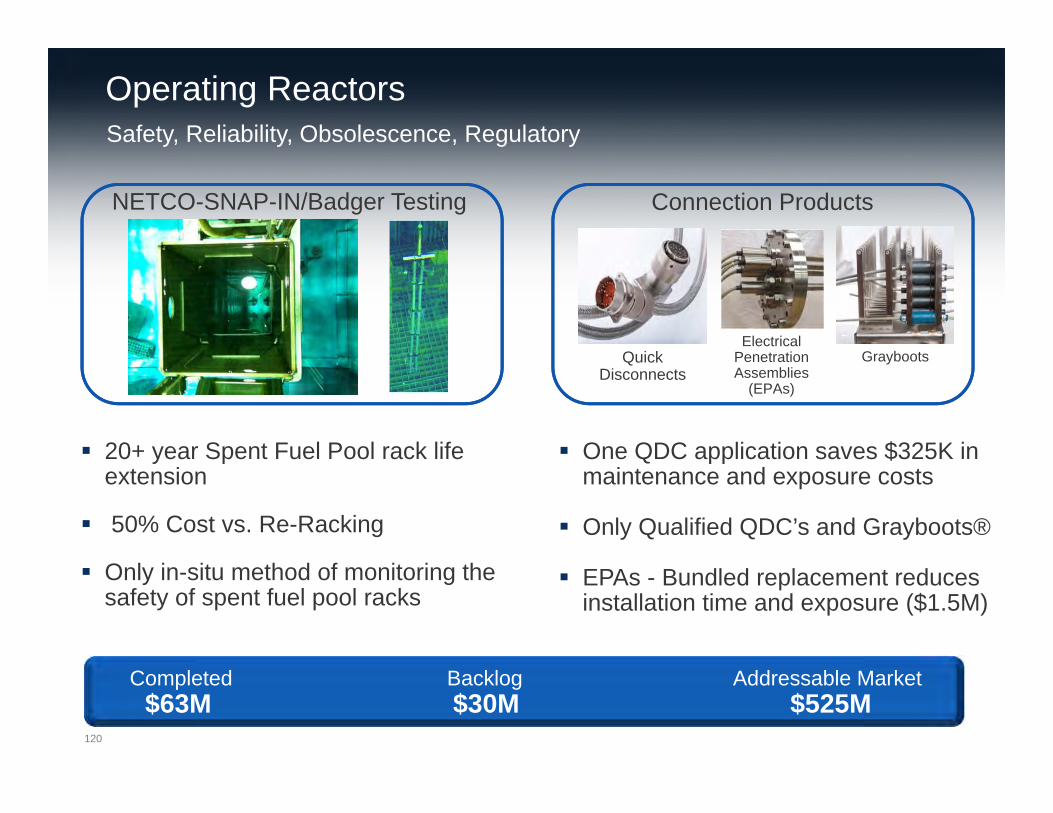
Operating Reactors
Completed Backlog Addressable Market $63M $30M $525M
NETCO-SNAP-IN/Badger Testing Connection Products
Quick Disconnects
Electrical Penetration Assemblies
(EPAs)
Grayboots
20+ year Spent Fuel Pool rack life extension
50% Cost vs. Re-Racking
Only in-situ method of monitoring the safety of spent fuel pool racks
One QDC application saves $325K in maintenance and exposure costs
Only Qualified QDC’s and Grayboots®
EPAs - Bundled replacement reduces installation time and exposure ($1.5M)
Safety, Reliability, Obsolescence, Regulatory
120

Operating Reactors
Zero Entry Nozzle Dam Position Indication Probe (PIP)
Fuel Rod Inserts
50% reduction in man-REM exposure
Market Opportunity-$40M
40% Cost Savings
Refurbishment Kit versus wholesale replacement
Safe storage of PWR spent fuel
Fuel Bundle insertion reduces risk of improper handling
Technology Advancements and Developments
121

Operating Reactors
OperatingReactors76%
OperatingReactors76%
OEM12%
New Build14%
OperatingReactors74%
2014 201810% CAGR
Sustainable Growth Platform
Bright Future for Continued Growth in Operating Reactors
New Build24%
New Build26%
122
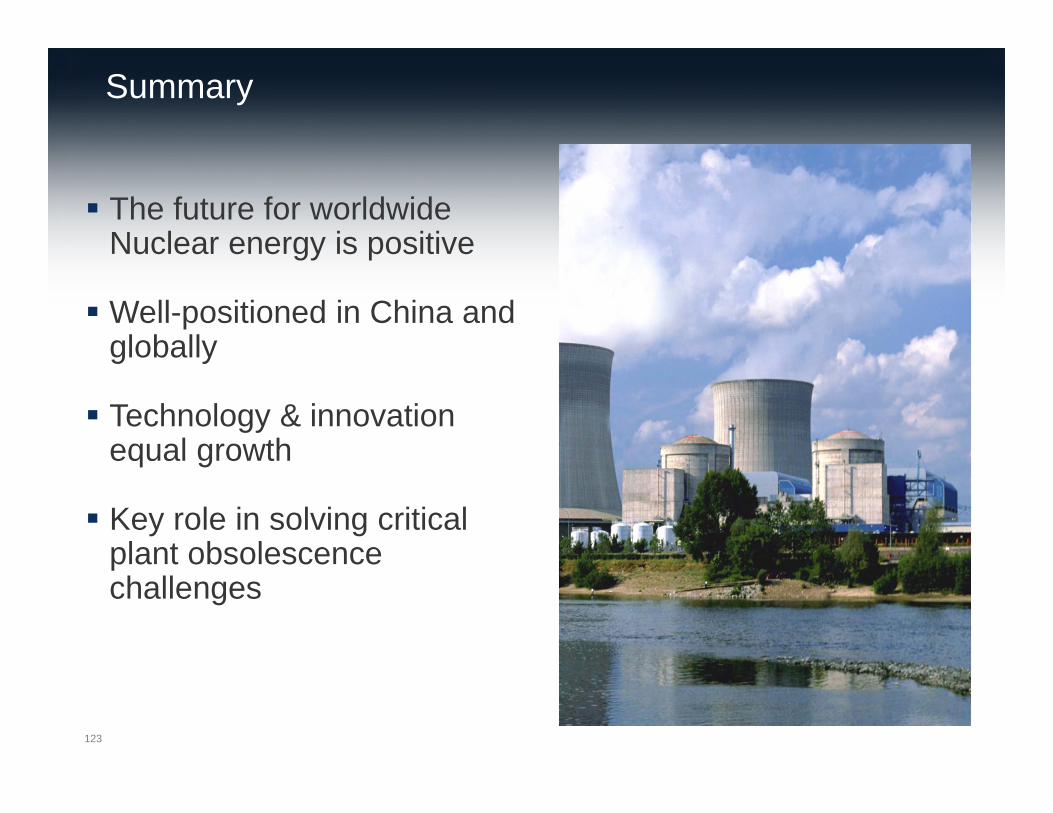
Summary
The future for worldwide Nuclear energy is positive
Well-positioned in China and globally
Technology & innovation equal growth
Key role in solving critical plant obsolescence challenges
123


COMMERCIAL / INDUSTRIAL
DEFENSE
ENERGY
SummaryDave AdamsPresident and CEO
Investor Day – December 11, 2013

The Future of Curtiss-Wright
We’re at an inflection point in our company Leading positions in key markets Talented and experienced leadership team Targeting top quartile performance
One Curtiss-Wright - A Unique Opportunity for Value 126