Embed Size (px)
Citation preview

The Upper Thames Major
Resource Development
Reservoir Site Selection Study Report
14 September 2006

The Upper Thames Major
Resource Development
Prepared by Arup
Working in Partnership
Upper Thames Major Resource Development Reservoir Site Selection Study
CONTENTS Page
GLOSSARY
LIST OF ABBREVIATIONS
Executive Summary ......................................................................................................................................i Introduction ....................................................................................................................................................i Methodology ....................................................................................................................................................i Stage 1 – Identification of potential reservoir sites..........................................................................................i Stage 2 – Identification of a long list of sites ...................................................................................................i Stage 3 – Assessment of Long List of Sites.................................................................................................. iv Stage 4 – Verification of Assessment Process and Findings, and Reporting ................................................v Findings .................................................................................................................................................. vi Stage 1 Findings............................................................................................................................................ vi Stage 2 Findings............................................................................................................................................ vi Stage 3 - Findings......................................................................................................................................... vii
1. INTRODUCTION........................................................................................................................1
2. METHODOLOGY.......................................................................................................................4 2.1 Introduction ................................................................................................................................4 2.2 Methodology Consultation .........................................................................................................5 2.3 Stage 1 – Refining the Area of Search and Identifying Potential Sites......................................5 2.4 Stage 2 – Screening of Sites Against Sustainability Measures ...............................................10 2.5 Stage 3 – Reviewing the Longlist.............................................................................................15 2.6 Stage 4 – Verification and Reporting .......................................................................................19
3. STAGE 1 FINDINGS ...............................................................................................................20 3.1 Introduction ..............................................................................................................................20 3.2 Negative Screening..................................................................................................................20 3.3 Potential Site Area Identification..............................................................................................25 3.4 Summary..................................................................................................................................26
4. STAGE 2 FINDINGS ...............................................................................................................27 4.1 Introduction ..............................................................................................................................27 4.2 Absolute Constraints................................................................................................................27 4.3 Findings from the Appraisal Against the Sustainability Measures...........................................32 4.4 Sites Performing Consistently Poorly.......................................................................................38 4.5 Sensitivity Analysis ..................................................................................................................38 4.6 Summary..................................................................................................................................44
5. STAGE 3 FINDINGS ...............................................................................................................45 5.1 Technical Feasibility Appraisal.................................................................................................45 5.2 Reservoir Size Scenarios.........................................................................................................48 5.3 Planning Appraisal ...................................................................................................................48 5.4 Sustainability Measure Appraisal.............................................................................................51 5.5 Sensitivity Analysis ..................................................................................................................74 5.6 Cost Check...............................................................................................................................75 5.7 Conclusions and Recommendations .......................................................................................75
6. NEXT STAGE OF WORK - SUMMARY..................................................................................76
Upper Thames Major Resource Development Reservoir Site Selection Study
APPENDICES METHODOLOGY
Appendix A Methodology Consultees
Appendix B Methodology Consultation Respondent Matrix
Appendix C Selecting the Sustainability Measures
Appendix D Sustainability Measure Policy Review
Appendix E Stage 2 Sustainability Measures
Appendix F Stage 2 Sustainability Measures Record Sheet
Appendix G Stage 3 Revised and Additional Sustainability Measures
STAGE 1
Appendix H River Thames Catchment
Appendix I Main Permeable and Impermeable Areas
Appendix J Gauging Station Details
Appendix K Gauging Station Locations
Appendix L Environment Agency Letter
Appendix M River Flow Summary Table
Appendix N Rivers with Sufficient Flow
Appendix O Areas of Built Development
Appendix P Water Transfer Zones
Appendix Q Combined Negative Screening Criteria
Appendix R Potential Site Areas and List of Sites
STAGE 2
Appendix S Stage 2 Site Record Sheets
Appendix T Stage 2 Site Maps
Appendix U Stage 2 Revised Site Boundaries
Appendix V Location of Panoramic View Points
Appendix W Location of Sites to be Taken Forward to Stage 3
STAGE 3
Appendix X Technical Feasibility Assessment
Appendix Y Pipeline Routes
Appendix Z Initial Aquatic Ecology Assessment
Appendix AA Planning and Development Appraisal - Planning Histories
Appendix BB 30,000 Ml Reservoir Size Scenario Conceptual Designs
Appendix CC 50,000 Ml (Direct Supply and Regulation) Reservoir Size Scenario Conceptual Designs
Appendix DD 75,000 Ml Reservoir Size Scenario Conceptual Designs

Upper Thames Major Resource Development Reservoir Site Selection Study
Appendix EE 100,000 Ml Reservoir Size Scenario Conceptual Designs
Appendix FF 125,000 Ml Reservoir Size Scenario Conceptual Design
Appendix GG 150,000 Reservoir Size Scenario Conceptual Design
Appendix HH Detailed Aquatic Ecoolgy Assessment
Appendix II Preferred Intake/Outfall Points
Appendix JJ 30,000 Ml Reservoir Size Scenarios - Sustainability Measures Findings
Appendix KK 50,000 Ml (Direct Supply & Regulating) Reservoir Size Scenarios - Sustainability Measures Findings
Appendix LL 75,000 Ml Reservoir Size Scenarios - Sustainability Measures Findings
Appendix MM 100,000 Ml Reservoir Size Scenarios - Sustainability Measures Findings
Appendix NN 125,000 Ml Reservoir Size Scenario - Sustainability Measures Findings
Appendix OO 150,000 Ml Reservoir Size Scenario - Sustainability Measures Findings
Appendix PP 30,000 Ml Pair Wise Comparison Findings & Summary Table
Appendix QQ 50,000 Ml (Direct Supply) Pair Wise Comparison Findings & Summary Table
Appendix RR 50,000 Ml (Regulating) Pair Wise Comparison Findings & Summary Table
Appendix SS 75,000 Ml Pair Wise Comparison Findings & Summary Table
Appendix TT 100,000 Ml Pair Wise Comparison Findings & Summary Table
Appendix UU 30,000 Ml Pair Wise Comparison Sensitivity Findings & Summary Table
Appendix VV 50,000 Ml Pair Wise Comparison Sensitivity Findings & Summary Table
Appendix WW 50,000 Ml Pair Wise Comparison Sensitivity Findings & Summary Table
Appendix XX 75,000 Ml Pair Wise Comparison Sensitivity Findings & Summary Table
Appendix YY 100,000 Ml Pair Wise Comparison Sensitivity Findings & Summary Table
Appendix ZZ Costs and Summary Table
Upper Thames Major Resource Development Reservoir Site Selection Study
GLOSSARY
ArcView Desktop GIS software package.
Capex Capital expenditure (cost)
Centroid Central point.
Dual Function Reservoir A reservoir that would function as both a direct supply and regulating reservoir.
Direct Supply Reservoir A reservoir that would store abstracted water which would be treated and put directly into the distribution network.
EA S105 Mapping Mapping prepared by the Environment Agency under S105 of the Water Resources Act 1991 to identify inland areas affected by fluvial flooding.
GBPro200 GIS map product for Great Britain at 1:200,000.
Hands off Flow (HOF) The flow below which abstraction is unlikely to be permitted under any licence issued by the Environment Agency.
Opex Operating expenditure (cost)
Output Area (OA) In England and Wales 2001 Census OAs are based on postcodes as at Census Day and fit within the boundaries of 2003 statistical wards (and parishes). The minimum OA size is 40 resident households and 100 resident persons but the recommended size was rather larger at 125 households. In total there are 175,434 OAs in England (165,665) and Wales (9,769).
PV Yield Unit Cost The cost of one million litres of water delivered, taking into account capital and operating costs.
Q50 The flow that is expected to be exceeded for 50% of the time.
Q10 The flow that is expected to be exceeded for 10% of the time.
Regulating Reservoir A reservoir that would store water abstracted during periods of high river flow then release into the river for re-abstraction downstream.
Shapefile A Shapefile is a vector storage format used in ArcView for storing the location, shape and attributes of geographical features. It is in a form of a map layer containing a series of points, lines and polygons can be displayed in ArcView.
Water Framework Directive EC water legislation that requires all inland and coastal waters to reach "good status" by 2015. It will do this by establishing a river basin district structure within which demanding environmental objectives will be set, including ecological targets for surface waters.
Water Resource Zone The largest possible zone in which all resources, including external transfers, can be shared and hence the zone in which all customers experience the same risk of supply failure from a resource shortfall.
Water Well Log Information The record of geological strata collected when a well or borehole is created
µm Micron (one thousandth of a millimetre)

Upper Thames Major Resource Development Reservoir Site Selection Study
LIST OF ABBREVIATIONS
AGLV Area of Great Landscape Value
AHLV Area of High Landscape Value
AONB Area of Outstanding Natural Beauty
AP Assessment Point
AS Archaeological Sensitivity
BGS British Geological Survey
BMVL Best and Most Versatile Agricultural Land
CCA Countryside Character Area
CLA County Landscape Assessments
CWS County Wildlife Site
DEFRA Department of Environment, Food and Rural Affairs
EA Environment Agency
EIA Environment Impact Assessment
EN English Nature
EW Environmental Weighting
FDC Flow Duration Curves
GIS Geographic Information System
GLA Greater London Authority
Ha Hectares
HA Highways Agency
HAP Habitat Action Plan
HOF Hands off Flow
HOP Hands Off Peak
IEMA Institute of Environmental Management and Assessment
km Kilometre
LCA Landscape Character Area
Ml Million litres
Ml/d Million litres per day
Mm³ Million cubic metres (cumecs)
Mwh Mega Watts per Hour
NLUD National Land Use Database
NMR National Monuments Record
NNR National Nature Reserve
OA Output Area
ODPM Office of the Deputy Prime Minister
ONS Office for National Statistics
OS Ordnance Survey
PPG Planning Policy Guidance
PPS Planning Policy Statement
Upper Thames Major Resource Development Reservoir Site Selection Study
PV Present Value
RAM Resource Assessment and Management
RFO River Flow Objective
ROSE Rest of the South East
RPG Regional Planning Guidance
SAC Special Area of Conservation
SINC Site of Importance for Nature Conservation
SLA Strategic Landscape Area
SLCM Strategic Land Classification Maps
SM Scheduled Monument
SMR Sites and Monuments Record
SPA Special Protection Area
SSSI Site of Special Scientific Interest
SWOX Swindon Oxford Water Resource Zone
TIF Tagged Image File Format
UK BAP United Kingdom Biodiversity Action Plan
VOWH Vale of White Horse
WARMS Water Resources Management Systems
Upper Thames Major Resource Development Reservoir Site Selection Study
Thames Water Page i 14/09/06
EXECUTIVE SUMMARY
Introduction The principal objective of the site selection study was to identify a preferred site or sites that would be suitable for development of reservoirs of varying sizes for direct supply, regulating or dual function to help meet Thames Water’s identified water supply requirements. Having identified this, the option of a reservoir would then be further assessed for its suitability as a resource scheme alongside others using the water resource programme assessment methodology described in the Stage 1 report.
Methodology A draft methodology for the study was prepared in spring 2005 and was the subject of consultation with local authorities and appropriate national and regional organisations and agencies within the study area (see Appendices A and B). Overall there was a general endorsement of the approach by those bodies that responded, although some had detailed comments on how the methodology could be improved. Where appropriate and possible these comments were taken on board and a revised methodology was prepared.
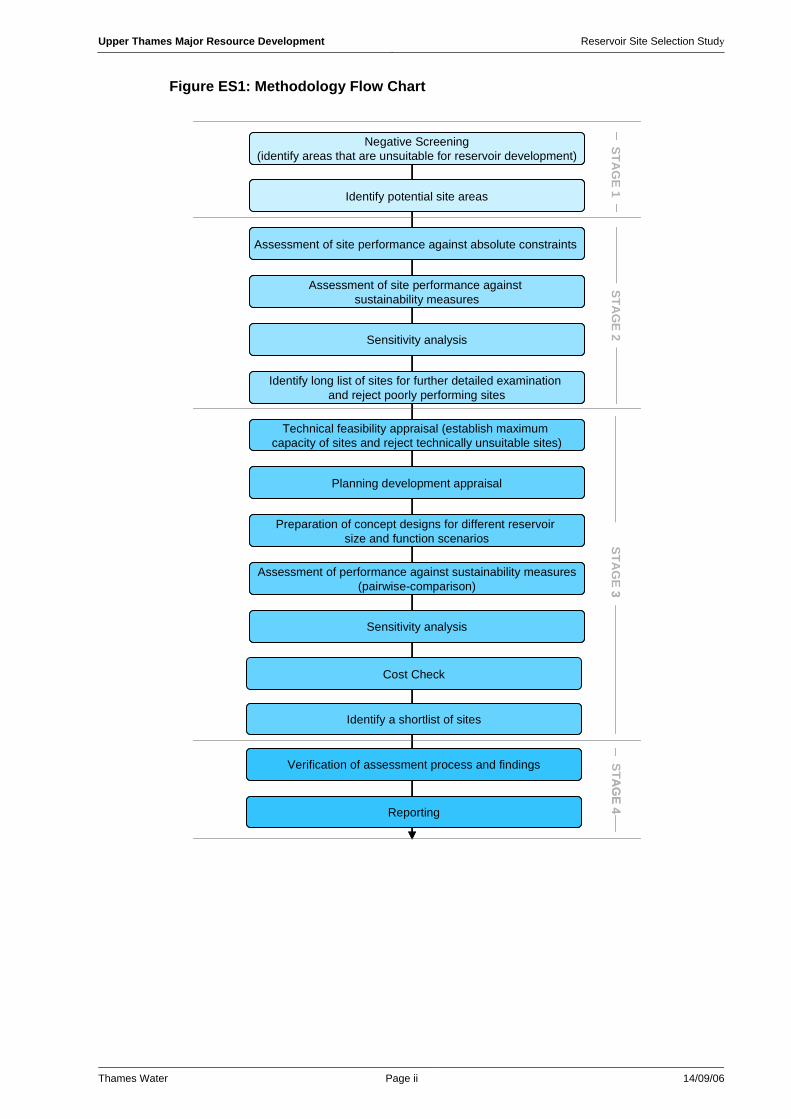
Figure ES1 sets out the stages of the site selection study. The following sections of this chapter firstly summarise the approach to the work (as presented in the final methodology) and then describes the findings for each stage of the study.
Stage 1 – Identification of potential reservoir sites
Negative Screening to Identify Areas Unsuitable for Reservoir Development
The first stage of the work involved identifying sites that would have potential for reservoir development within the River Thames catchment area. The work was undertaken by mapping areas, informed by geology and physical attributes, where it would clearly be unsuitable to construct a reservoir (this was referred to as a negative screening exercise). The mapped constraints were as follows:
• Areas of permeable strata.
• Areas that were remote from rivers that had been identified as having sufficient flows to enable the refilling of reservoirs.
• Areas of major built development and infrastructure.
Identify Potential Reservoir Site Areas
Potential sites were identified within those parts of the River Thames catchment that were free of these constraints. The minimum site area for a reservoir was set at 200 hectares – which could accommodate a reservoir with capacity for 30,000Ml. This size reservoir would be sufficient to meet the anticipated water storage requirements for the Swindon and Oxfordshire water resource zone (at 2030).
Stage 2 – Identification of a long list of sites Assessment of Site Performance Against Absolute Constraints
The sites identified at stage 1 were initially appraised against four significant technical and environmental constraints (referred to as absolute constraints). Given the significance of these constraints (as informed by the review of national and regional planning policy) sites would be rejected if they were found to be affected by or impact on any of these four constraints. The four absolute constraints were:
Upper Thames Major Resource Development Reservoir Site Selection Study
Thames Water Page ii 14/09/06
Figure ES1: Methodology Flow Chart
Negative Screening(identify areas that are unsuitable for reservoir development)
Identify potential site areas
Assessment of site performance against absolute constraints
Assessment of site performance against sustainability measures
Sensitivity analysis
Identify long list of sites for further detailed examination and reject poorly performing sites
Technical feasibility appraisal (establish maximum capacity of sites and reject technically unsuitable sites)
Planning development appraisal
Preparation of concept designs for different reservoir size and function scenarios
Assessment of performance against sustainability measures(pairwise-comparison)
Sensitivity analysis
Identify a shortlist of sites
Verification of assessment process and findings
Reporting
STAG
E 1STA
GE 2
STAG
E 3STA
GE 4
Cost Check
Upper Thames Major Resource Development Reservoir Site Selection Study
Thames Water Page iii 14/09/06
• International and national nature conservation designations, such as Sites of Special Scientific Interest (SSSIs) and Special Protection Areas (SPAs).
• International and national heritage designations, such as Scheduled Monuments and Grade 1 listed buildings.
• Sites within 3km of an airfield. A government circular (01/2003) identifies “birdstrike as one of the major controllable hazards to aviation” and it was considered that introducing a new major water body (that would potentially attract birds) near to an airfield (within 3km) would be unacceptable.
• Clay thickness of 10 metres or less. Any reservoir requires a sufficient depth of clay to provide an impermeable base and the engineering consultants advised that at least 10 metres of clay would be required for this purpose to ensure that there is no leakage into the ground water.
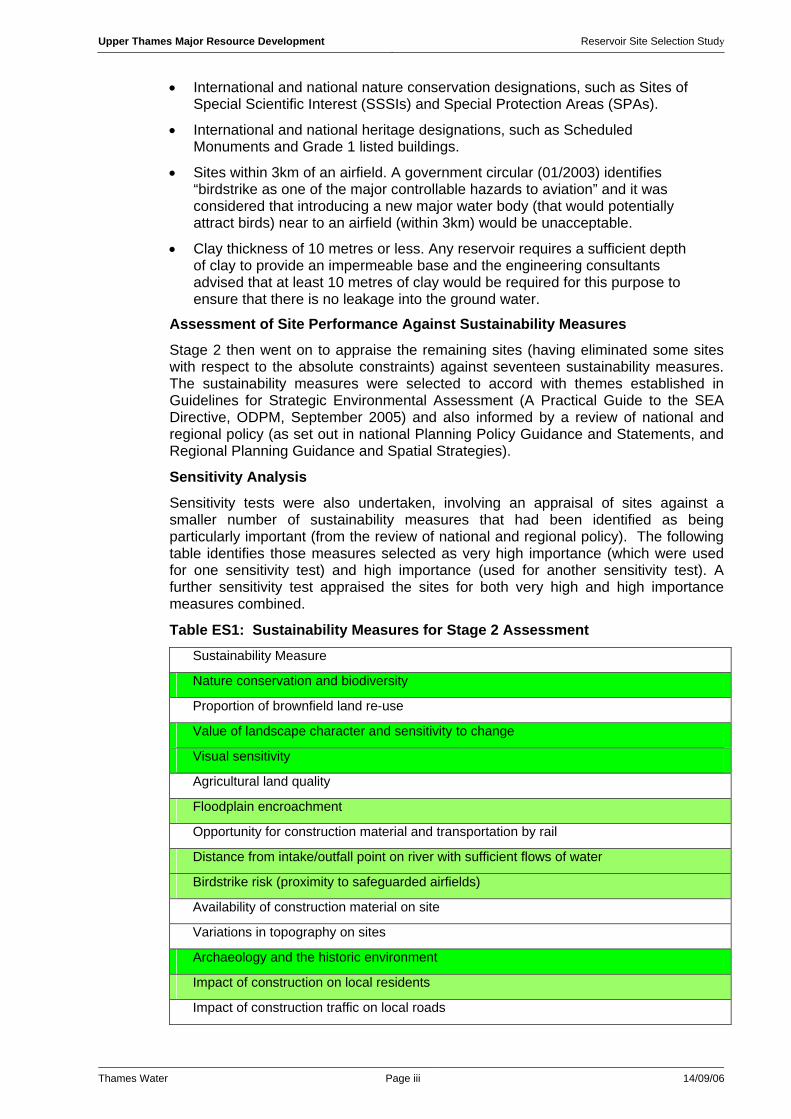
Assessment of Site Performance Against Sustainability Measures
Stage 2 then went on to appraise the remaining sites (having eliminated some sites with respect to the absolute constraints) against seventeen sustainability measures. The sustainability measures were selected to accord with themes established in Guidelines for Strategic Environmental Assessment (A Practical Guide to the SEA Directive, ODPM, September 2005) and also informed by a review of national and regional policy (as set out in national Planning Policy Guidance and Statements, and Regional Planning Guidance and Spatial Strategies).
Sensitivity Analysis
Sensitivity tests were also undertaken, involving an appraisal of sites against a smaller number of sustainability measures that had been identified as being particularly important (from the review of national and regional policy). The following table identifies those measures selected as very high importance (which were used for one sensitivity test) and high importance (used for another sensitivity test). A further sensitivity test appraised the sites for both very high and high importance measures combined.
Table ES1: Sustainability Measures for Stage 2 Assessment Sustainability Measure
Nature conservation and biodiversity
Proportion of brownfield land re-use
Value of landscape character and sensitivity to change
Visual sensitivity
Agricultural land quality
Floodplain encroachment
Opportunity for construction material and transportation by rail
Distance from intake/outfall point on river with sufficient flows of water
Birdstrike risk (proximity to safeguarded airfields)
Availability of construction material on site
Variations in topography on sites
Archaeology and the historic environment
Impact of construction on local residents
Impact of construction traffic on local roads
Upper Thames Major Resource Development Reservoir Site Selection Study
Thames Water Page iv 14/09/06
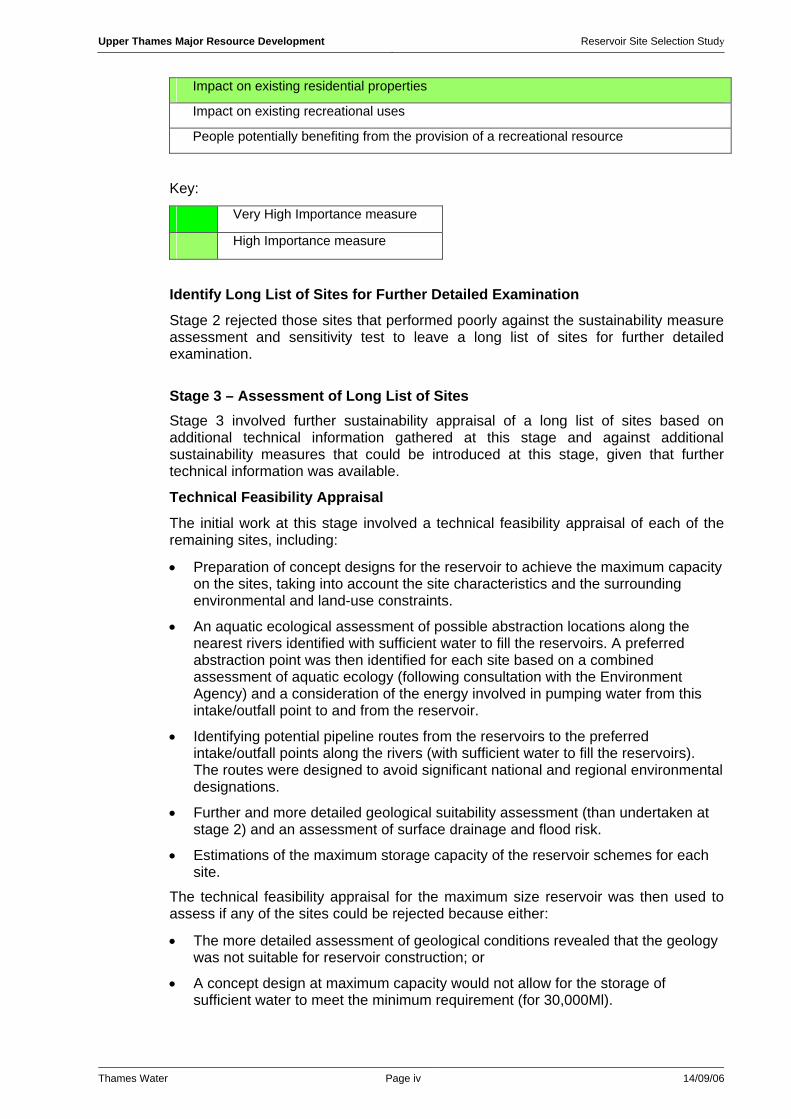
Impact on existing residential properties
Impact on existing recreational uses
People potentially benefiting from the provision of a recreational resource
Key:
Very High Importance measure
High Importance measure
Identify Long List of Sites for Further Detailed Examination
Stage 2 rejected those sites that performed poorly against the sustainability measure assessment and sensitivity test to leave a long list of sites for further detailed examination.
Stage 3 – Assessment of Long List of Sites Stage 3 involved further sustainability appraisal of a long list of sites based on additional technical information gathered at this stage and against additional sustainability measures that could be introduced at this stage, given that further technical information was available.
Technical Feasibility Appraisal
The initial work at this stage involved a technical feasibility appraisal of each of the remaining sites, including:
• Preparation of concept designs for the reservoir to achieve the maximum capacity on the sites, taking into account the site characteristics and the surrounding environmental and land-use constraints.
• An aquatic ecological assessment of possible abstraction locations along the nearest rivers identified with sufficient water to fill the reservoirs. A preferred abstraction point was then identified for each site based on a combined assessment of aquatic ecology (following consultation with the Environment Agency) and a consideration of the energy involved in pumping water from this intake/outfall point to and from the reservoir.
• Identifying potential pipeline routes from the reservoirs to the preferred intake/outfall points along the rivers (with sufficient water to fill the reservoirs). The routes were designed to avoid significant national and regional environmental designations.
• Further and more detailed geological suitability assessment (than undertaken at stage 2) and an assessment of surface drainage and flood risk.
• Estimations of the maximum storage capacity of the reservoir schemes for each site.
The technical feasibility appraisal for the maximum size reservoir was then used to assess if any of the sites could be rejected because either:
• The more detailed assessment of geological conditions revealed that the geology was not suitable for reservoir construction; or
• A concept design at maximum capacity would not allow for the storage of sufficient water to meet the minimum requirement (for 30,000Ml).

Upper Thames Major Resource Development Reservoir Site Selection Study
Thames Water Page v 14/09/06
Planning Appraisal
A planning appraisal was then undertaken of the remaining sites to identify any additional planning designations or major allocations for development or consents for development which might constrain the construction of a reservoir
Preparation of Concept Designs for Different Reservoir Size and Function Scenarios
For each of the remaining sites a number of concept designs were prepared for reservoirs of varying size and function. These ranged from 30,000Ml up to a maximum size of reservoir the site could accommodate.
Assessment of Performance Against Sustainability Measures
The sites were then appraised for each size and function against each of the sustainability measures used at stage 2 as well as additional sustainability measures (that could be introduced at this stage given that more detailed technical information was available). The additional sustainability measures are identified in Table ES2.
Table ES2: Additional Sustainability Measures used at Stage 3 Sustainability Measure
Opportunity for bio-diversity improvement
Need for imported sand and gravel for construction on-site
Potential loss of employment on site
Opportunity for on-site mitigation measures
Annual net pumping energy associated with the pipeline routes
The additional technical information available at this stage for each of the remaining sites allowed for a more detailed appraisal against the sustainability measures and also allowed for different values and units of measurement to be used. Pair-wise comparisons were undertaken using the data from the appraisal against the sustainability measures. Each site was appraised against each of the other sites within the size bands. The objective was to identify those sites that performed relatively poorly and could be rejected from the long list for each size.
Sensitivity Analysis
Three sensitivity tests (as for stage 2) were undertaken (against very high importance measures, high importance measures and combined very high and high importance measures) to ensure that the findings were robust.
Cost Check
Finally the reservoir options (for each site size and function) were costed and this was used as a final check before presenting the overall conclusions and recommendations.
Identify a Shortlist of Sites
The output from this stage was the identification of a preferred site or sites for each size and function scenario.
Stage 4 – Verification of Assessment Process and Findings, and Reporting The approach set out in the methodology was confirmed in December 2005 (taking on board where appropriate comments from the consultation with key stakeholders). No further changes were made to the methodology after this date. Nevertheless at
Upper Thames Major Resource Development Reservoir Site Selection Study
Thames Water Page vi 14/09/06
the end of each stage the work and the findings were checked and verified. For instance it was important to check that there had not been any significant changes to the planning policy framework that could influence the findings. A final report was prepared in May to July 2006, which is available in full on the Thames Water web site.
Findings
Stage 1 Findings Negative Screening to Identify Areas Unsuitable for Reservoir Development and Identifying Potential Reservoir Site Areas
Fifty-five sites were identified within the unconstrained areas suitable for the development of a reservoir (see Appendix R). The sites ranged in size from 200 hectares to 1,400 hectares. Size bands were used to group sites to allow sites to be assessed on a consistent basis and ultimately to allow for various sized sites with varying functions to come through to a long list (to be assessed at stage 3). The following numbers of sites were identified within the three size bands.
Band A (200-399 hectares) 17 sites
Band B (400-699 hectares) 27 sites
Band C (700+ hectares) 11 sites
Stage 2 Findings Assessment of Site Performance Against Absolute Constraints
The 55 sites were assessed against the criteria that were defined as absolute constraints, within their size bands. Twenty eight sites were found either to impact on or be affected in some way by the constraints. Of these 28 sites, eight were found to have an insufficient depth of clay to provide an impermeable lining to any reservoir development and revising the boundary for these sites would not remove this constraint. These eight sites were therefore rejected. For the remaining 20 sites further assessment was undertaken to consider whether the boundary could be revised, although still providing a site of more than 200 hectares, to avoid impacting on or being affected by the other absolute constraints.
It was found that for nine of the sites the boundary could not be revised to avoid impacting on or affecting national/international heritage or nature conservation designations or to ensure that the boundary of the site would fall outside of a 3km radius of an airfield. For the remaining 11 sites the boundary was revised to avoid impacting on or being affected by the absolute constraints and these sites along with the 27 other sites (that were not affected by absolute constraints) were the subject of sensitivity appraisal (in total 38 sites).
Assessment of Site Performance Against Sustainability Measures
Each of the 38 sites was appraised to identify how they performed in respect of each of the 17 sustainability measures (as set out in Table ES1). Two sites were found to perform poorly against a substantial number of the sustainability measures and therefore could be rejected at an early stage of the assessment.
Upper Thames Major Resource Development Reservoir Site Selection Study
Thames Water Page vii 14/09/06
Sensitivity Analysis
The sensitivity analysis was then undertaken on the remaining 36 sites to assess their performance against very high and high importance measures. The sensitivity analysis clearly identified 26 further sites that performed poorly and could therefore be excluded from further examination. Fourteen of the excluded sites were in size Band A (200-399 hectares); nine in size Band B (400-699 hectares) and three in size Band C (700 hectares or more).
The finding from the sensitivity analysis was that 10 sites performed consistently well against the sustainability measures and it was therefore recommended that these sites should be taken forward for further analysis.
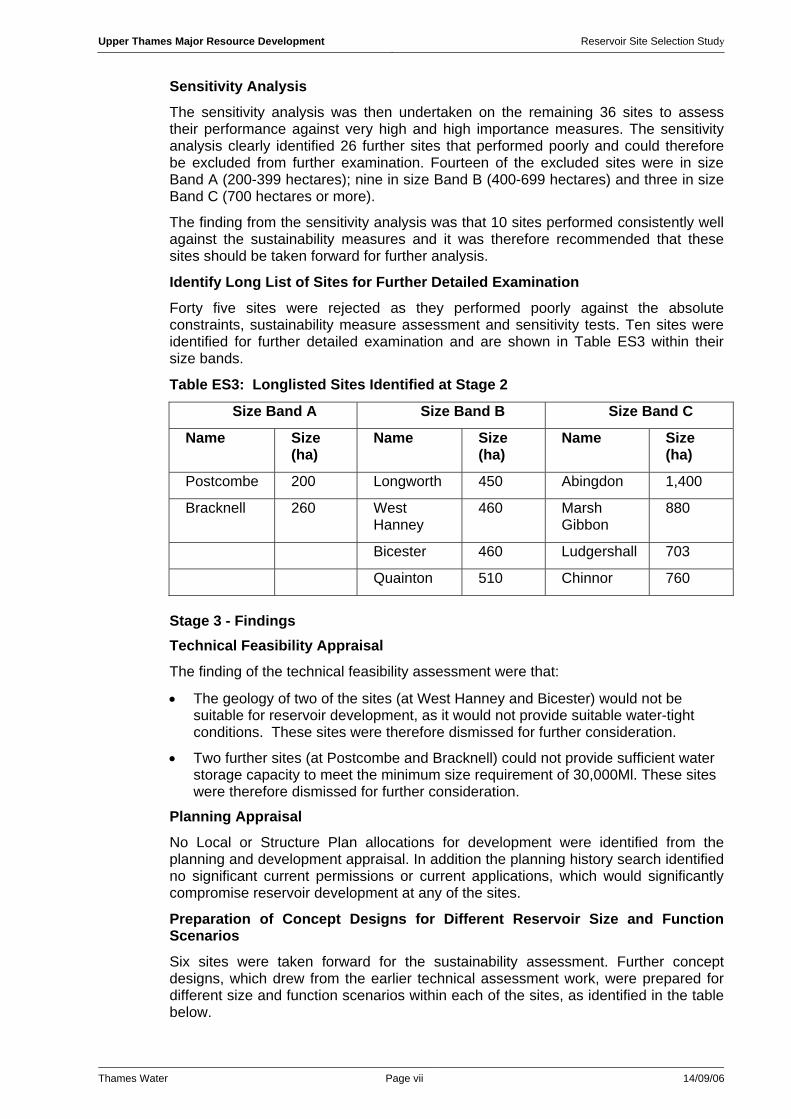
Identify Long List of Sites for Further Detailed Examination
Forty five sites were rejected as they performed poorly against the absolute constraints, sustainability measure assessment and sensitivity tests. Ten sites were identified for further detailed examination and are shown in Table ES3 within their size bands.
Table ES3: Longlisted Sites Identified at Stage 2
Size Band A Size Band B Size Band C
Name Size (ha)
Name Size (ha)
Name Size (ha)
Postcombe 200 Longworth 450 Abingdon 1,400
Bracknell 260 West Hanney
460 Marsh Gibbon
880
Bicester 460 Ludgershall 703
Quainton 510 Chinnor 760
Stage 3 - Findings Technical Feasibility Appraisal
The finding of the technical feasibility assessment were that:
• The geology of two of the sites (at West Hanney and Bicester) would not be suitable for reservoir development, as it would not provide suitable water-tight conditions. These sites were therefore dismissed for further consideration.
• Two further sites (at Postcombe and Bracknell) could not provide sufficient water storage capacity to meet the minimum size requirement of 30,000Ml. These sites were therefore dismissed for further consideration.
Planning Appraisal
No Local or Structure Plan allocations for development were identified from the planning and development appraisal. In addition the planning history search identified no significant current permissions or current applications, which would significantly compromise reservoir development at any of the sites.
Preparation of Concept Designs for Different Reservoir Size and Function Scenarios
Six sites were taken forward for the sustainability assessment. Further concept designs, which drew from the earlier technical assessment work, were prepared for different size and function scenarios within each of the sites, as identified in the table below.
Upper Thames Major Resource Development Reservoir Site Selection Study
Thames Water Page viii 14/09/06
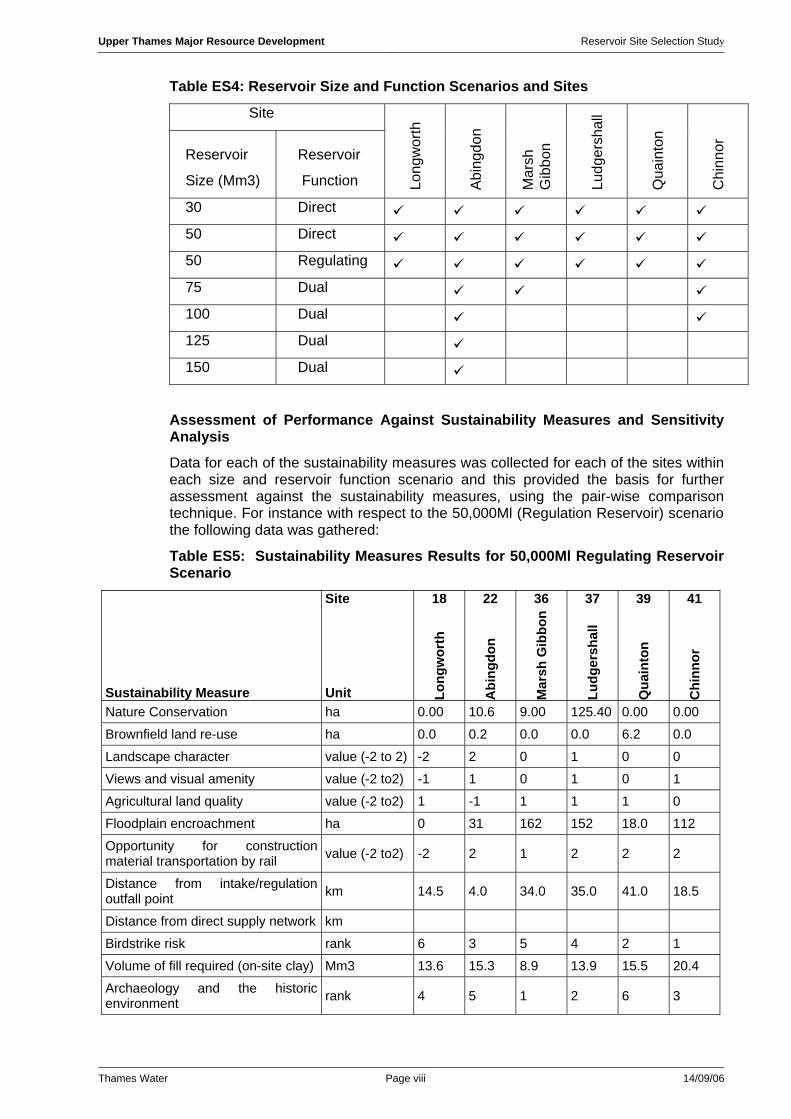
Table ES4: Reservoir Size and Function Scenarios and Sites
Site
Reservoir
Size (Mm3)
Reservoir
Function Long
wor
th
Abi
ngdo
n
Mar
sh
Gib
bon
Ludg
ersh
all
Qua
into
n
Chi
nnor
30 Direct 50 Direct 50 Regulating 75 Dual 100 Dual 125 Dual 150 Dual
Assessment of Performance Against Sustainability Measures and Sensitivity Analysis
Data for each of the sustainability measures was collected for each of the sites within each size and reservoir function scenario and this provided the basis for further assessment against the sustainability measures, using the pair-wise comparison technique. For instance with respect to the 50,000Ml (Regulation Reservoir) scenario the following data was gathered:
Table ES5: Sustainability Measures Results for 50,000Ml Regulating Reservoir Scenario
Site 18 22 36 37 39 41
Sustainability Measure Unit Long
wor
th
Abi
ngdo
n
Mar
sh G
ibbo
n
Ludg
ersh
all
Qua
into
n
Chi
nnor
Nature Conservation ha 0.00 10.6 9.00 125.40 0.00 0.00
Brownfield land re-use ha 0.0 0.2 0.0 0.0 6.2 0.0
Landscape character value (-2 to 2) -2 2 0 1 0 0
Views and visual amenity value (-2 to2) -1 1 0 1 0 1
Agricultural land quality value (-2 to2) 1 -1 1 1 1 0
Floodplain encroachment ha 0 31 162 152 18.0 112
Opportunity for construction material transportation by rail value (-2 to2) -2 2 1 2 2 2
Distance from intake/regulation outfall point km 14.5 4.0 34.0 35.0 41.0 18.5
Distance from direct supply network km
Birdstrike risk rank 6 3 5 4 2 1
Volume of fill required (on-site clay) Mm3 13.6 15.3 8.9 13.9 15.5 20.4
Archaeology and the historic environment rank 4 5 1 2 6 3

Upper Thames Major Resource Development Reservoir Site Selection Study
Thames Water Page ix 14/09/06
Local residents potentially affected by construction number 187 77 174 104 74 125
Impact of construction traffic on local roads value (-2 to 2) 2 2 2 2 2 0
Impact on existing residential properties value (-2 to 2) 1 1 1 1 1 1
Impact on existing recreation uses number 2 4 1 4 8 8
People potentially benefiting from provision of significant recreational resource
number 8,348 28,905 8,192 8,628 6,824 32,366
Opportunity for biodiversity improvement value (-2 to 2) 1 0 1 2 1 1
Need for imported sand and gravel for construction on site million tonnes 1.70 1.90 1.10 1.80 2.00 2.60
Loss of employment number 0 100 0 0 26 0
Opportunity for on-site mitigation percentage of site 42% 83% 62% 66% 51% 74%
Annual net pumping energy/total yield MWh/Ml* 0.16 0.03 0.06 0.13 0.16 0.03
For each size and reservoir function identified in Table ES4 data were gathered for each sustainability measure in the same format and unit of measurement as shown in the example shown above (Table ES5).
For a number of the sustainability measures it was possible to gather information in the form of a unit of measurement (such as the number of hectares of nature conservation designations affected or the number of people potentially benefiting from a recreational resource). However, not all the sustainability measures could be quantified in this way and it was necessary to grade the sites on a preference scale from least to most preferred, as illustrated in Table ES6, or to rank sites, with 1 being the most preferred site.
Table ES6: Sustainability Measure Values
Sustainability Measure Preference Sustainability Measure Value
Most preferred 2
1
0
-1
Least preferred -2
The full results of the appraisals for each reservoir size and function scenario are provided in the full Reservoir Site Selection Report.
The pair-wise comparison compared all of the sites against one another using the data for each sustainability measure (as illustrated in the example at Table ES5), in order to discount those sites that were less suitable for reservoir development.
As for stage 2, a sensitivity test was also undertaken to assess their performance against very high and high importance measures for each size and function scenario.
Upper Thames Major Resource Development Reservoir Site Selection Study
Thames Water Page x 14/09/06
The findings for each reservoir size and function scenario, pair-wise comparison (including the sensitivity tests) were as follows:
30,000Ml Direct Supply Reservoir
Assessment of Performance Against Sustainability Measures
The finding of the pair-wise comparison against all of the sustainability measures for this sized reservoir was that the Longworth site was preferred overall but only marginally preferred to the Abingdon and Ludgershall sites. The Longworth 30,000Ml scheme would not encroach on the flood plain (while all the other schemes on other sites would) and it also performed well in terms of its impact on archaeology and the historic environment and impact on nature conservation. The volume of fill required for the construction of the Longworth 30,000Ml scheme was relatively low as was the need for imported sand and gravel and hence the construction impacts were assessed to be relatively low compared to the other sites.
Sensitivity Analysis
The sensitivity tests (against very high and high importance measures) did not confirm the findings from the assessment against all the sustainability measures that Longworth was the preferred site. The impact on landscape character and visual impacts were identified as very high measures and birdstrike risk as a high measure and Longworth performed badly with respect to these three measures in particular.
Overall the sensitivity test for the 30Mm³ reservoir scenario found that the Abingdon and Quainton sites were preferred when compared to other sites for the combined high and very high measures and for the high measures only. Marsh Gibbon was found to perform well in respect of the very high measures only. Given the sensitivity findings it was concluded overall that at 30Mm³ there was no clear preference for a site.
50,000Ml Regulation only Reservoir Scenario
Assessment of Performance Against Sustainability Measures
The finding of the pair-wise comparison against all of the sustainability measures for this sized reservoir was that the Abingdon site was preferred overall. The site performed well with respect to the landscape character and visual impact measures. It was assessed that the reservoir embankments would be regarded as a man made feature along with other urban features within or near to the site (pylons, war time depot, elevated A34 and in the distance Didcot power station). The scheme for 50,000Ml at Abingdon also performed well given the relatively short distance of the site to the intake/outfall points, its proximity to the rail network, the anticipated low impacts of construction traffic on local residents and the potential to incorporate on-site mitigation. It performed badly though in terms of its impact on agricultural land, archaeology and loss of employment (although the employment loss for this scheme was associated with a storage depot where there were already proposals to cease business on the site).
Sensitivity Analysis
The sensitivity tests for the very high and high importance measures supported the findings from the pair-wise comparisons against all the sustainability measures that Abingdon was the preferred site. This was principally due to the site’s strong performance with respect to landscape character and visual impact measures (very high importance measures) and impact of construction on local residents (high importance measure).
Upper Thames Major Resource Development Reservoir Site Selection Study
Thames Water Page xi 14/09/06
50,000Ml Direct Supply only Reservoir Scenario
Assessment of Performance Against Sustainability Measures
The results for this scheme were essentially the same as for the 50,000Ml regulation scenario. The only differences related to annual net pumping energy measure (revised to reflect the reservoir function and the need to connect to the direct supply network) and the introduction of a new measure associated with the pipeline distance to connect to the direct supply network. Taking into account these changes, the finding of the pair-wise comparison against all of the sustainability measures for this size and function of reservoir was similar to that for the Regulation only reservoir. That is the Abingdon site was preferred overall.
Sensitivity Analysis
The sensitivity tests (as for the Regulation only reservoir) supported the finding that Abingdon was the preferred site.
75,000Ml Dual Function Reservoir
Assessment of Performance Against Sustainability Measures
Only three sites could accommodate a 75,000Ml reservoir scheme (Abingdon, Marsh Gibbon and Chinnor). The finding of the pair-wise comparison against all of the sustainability measures for the three sites was that the Abingdon site was preferred. As for the 50,000Ml scheme it performed well with respect to the landscape character and visual impact measures as well as distance of the site to the intake/outfall points, its proximity to the rail network, the anticipated low impacts of construction traffic on local residents and the potential to incorporate on-site mitigation. It also performed relatively well in terms of its impact on the flood plain. As for the 50,000Ml scheme Abingdon again performed relatively badly in terms of its impact on agricultural land, archaeology and loss of employment (although as for 50,000Ml the employment loss for this scheme was associated with a storage depot where there were already proposals to cease business on the site).
Sensitivity Analysis
For similar reasons as the 50,000Ml scheme the sensitivity tests for the very high and high importance measures supported the findings from the original pair-wise comparisons that Abingdon was the preferred site for a 75,000Ml scheme.
100,000Ml Dual Function reservoir
Assessment of Performance Against Sustainability Measures
Only two sites could accommodate a 100,000Ml dual supply reservoir scheme (Abingdon and Chinnor). Abingdon was preferred to Chinnor for this sized scheme for 12 out of the 22 measures (clearly preferred with respect to impact on landscape character, floodplain encroachment, distance from intake/outfall point and supply network and impact of construction on residents and local roads). The Chinnor scheme was preferred to Abingdon for 6 of the measures (including nature conservation, impact on agricultural land, birdstrike risk and impact on archaeology and the historic environment). For the remaining measures the sites were assessed to have a similar performance. Overall Abingdon was the preferred site based on the initial pair-wise comparison results.
Sensitivity Analysis
Two out of the three sensitivity tests supported the findings from the original pair-wise comparisons that Abingdon was the preferred site for a 100,000Ml scheme. For a third sensitivity text (against very high importance measures only) the Chinnor site was preferred. Given that for two out of the three sensitivity tests Abingdon was still

Upper Thames Major Resource Development Reservoir Site Selection Study
Thames Water Page xii 14/09/06
preferred for a 100,000Ml scheme it was concluded that the sensitivity tests were not sufficient to change the original preference for Abingdon.
125,000Ml and 150,000Ml Dual Function reservoir
The concept design work concluded that only one site (Abingdon) could accommodate reservoirs of 125,000Ml and 150,000Ml. The other sites were assessed to be too small to accommodate these sized schemes. Therefore no further sustainability assessments were undertaken (beyond those undertaken at stage 2) for reservoirs of this size.
Cost Check
A review of the anticipated costs associated with each of the reservoir scenarios did not identify any factors that would overturn the findings. Overall the costs were supportive of the findings for each reservoir size scenario.
Identifying a Shortlist of Sites
It was concluded that in all but one case (for 50,000Ml (regulating only), 50,000Ml (direct supply only) and 75,000Ml, 100,000Ml and 125,000Ml (dual function)) the preferred site for a reservoir would be the Abingdon site. For the 30,000Ml direct supply function scenario (given the findings of the sensitivity tests) there was no conclusive results and four sites could be preferred for a scheme of this size (Longworth, Abingdon, Marsh Gibbon and Quainton). These alternatives for a 30,000Ml reservoir were thus taken forward for consideration in the water resource programme assessment.
Upper Thames Major Resource Development Reservoir Site Selection Study
Thames Water Page 1 14/09/06
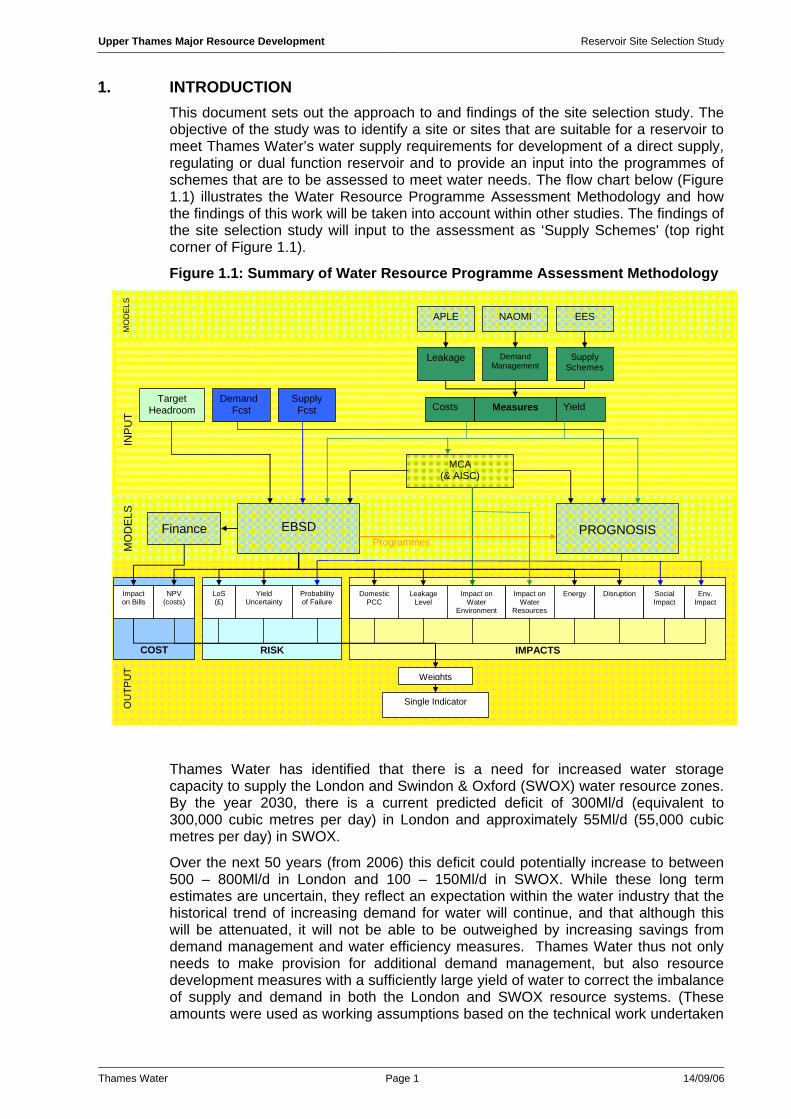
1. INTRODUCTION This document sets out the approach to and findings of the site selection study. The objective of the study was to identify a site or sites that are suitable for a reservoir to meet Thames Water’s water supply requirements for development of a direct supply, regulating or dual function reservoir and to provide an input into the programmes of schemes that are to be assessed to meet water needs. The flow chart below (Figure 1.1) illustrates the Water Resource Programme Assessment Methodology and how the findings of this work will be taken into account within other studies. The findings of the site selection study will input to the assessment as ‘Supply Schemes' (top right corner of Figure 1.1).
Figure 1.1: Summary of Water Resource Programme Assessment Methodology
RISK
IMPACTS
COST
EBSD
PROGNOSIS
Supply Fcst
Demand Fcst
Target Headroom Measures Costs Yield
MCA (& AISC)
Impact on Bills
Yield Uncertainty
Probability of Failure
Impact on Water
Resources
Energy Disruption Social Impact
Env. Impact
Weights
Single Indicator
INP
UT
MO
DE
LS
OU
TPU
T
Leakage Supply Schemes
APLE NAOMI
Demand Management
EES
MO
DE
LS
Finance
NPV (costs)
Programmes
Impact on Water
Environment
Leakage Level
Domestic PCC
LoS (£)
Thames Water has identified that there is a need for increased water storage capacity to supply the London and Swindon & Oxford (SWOX) water resource zones. By the year 2030, there is a current predicted deficit of 300Ml/d (equivalent to 300,000 cubic metres per day) in London and approximately 55Ml/d (55,000 cubic metres per day) in SWOX.
Over the next 50 years (from 2006) this deficit could potentially increase to between 500 – 800Ml/d in London and 100 – 150Ml/d in SWOX. While these long term estimates are uncertain, they reflect an expectation within the water industry that the historical trend of increasing demand for water will continue, and that although this will be attenuated, it will not be able to be outweighed by increasing savings from demand management and water efficiency measures. Thames Water thus not only needs to make provision for additional demand management, but also resource development measures with a sufficiently large yield of water to correct the imbalance of supply and demand in both the London and SWOX resource systems. (These amounts were used as working assumptions based on the technical work undertaken
Upper Thames Major Resource Development Reservoir Site Selection Study
Thames Water Page 2 14/09/06
at that time for the UTMRD needs case but it was recognised that these assumptions could change as further work was undertaken on the needs case)
One way of providing this additional capacity could be through the storage of water abstracted from rivers when flows are high, which generally occurs in the winter, in a reservoir for use in the summer. There are three types of reservoir that can be constructed to serve this purpose. That most commonly in use is known as a direct supply reservoir. Here the water stored in the reservoir is transferred directly to a water treatment works and then put into the distribution network. All Thames Water’s existing reservoirs are of this type. The second type of reservoir is where the stored water is released back into the river for re-abstraction downstream, for example at Thames Water’s existing intakes in the lower River Thames, when the flows downstream are insufficient on their own to meet the needs for abstraction. This type of reservoir is known as a regulating reservoir. The third type is a dual-function reservoir that has the combined function of both direct supply and river regulation.
Any reservoir that is developed needs to provide a water resource that is robust under drought conditions and is capable of producing the required output under these conditions. The River Thames and most of its tributaries rise on the limestone of the Cotswolds and the chalk downlands of the London basin. The chalk and limestone are permeable rocks that store winter rainfall. This is released over the summer to provide flow in the river system. This means that the most severe droughts in the Thames basin occur when this winter replenishment of groundwater storage is significantly reduced. In other words the pattern of a dry summer, followed by a dry winter half year (October to March) followed by a second dry summer produces the most severe droughts. This may be seen from an examination of the long-term hydrometric records maintained by the Environment Agency. There were four of these protracted dry periods in the last century, in 1921/2, 1933/4, 1943/4 and 1975/6. Any resource developed needs to be robust against events at least as severe as these historic periods because climate change research has indicated that both the frequency and duration of the more rare events, such as droughts and floods, are likely to increase as the impact of change increases with time.
The length of these critical drought periods is a key driver of the required storage volume from any reservoir development. The Environment Agency is responsible for the overall management of water resources and as part of this process sets the conditions under which abstraction can take place. Their abstraction management strategy specifies a value, based on their assessment of the environmental, social, recreational and economic needs of flow in a catchment, of river flows below which abstraction cannot take place. They have provided a value for the purposes of site selection that means it is unlikely that any significant quantities of water can be abstracted during these critical drought periods.
In order to assess the comparative suitability of sites for reservoir development it was determined that a range of reservoir size scenarios should be considered, and that the minimum size reservoir would be 30,000Ml. A 30,000Ml reservoir would meet the predicted SWOX deficit of 55Ml/d. This approach ensures flexibility in terms of the outputs that would feed into the Water Resource Programme Assessment Methodology.
Previous studies in relation to this issue have identified a number of sites that might be considered suitable for a reservoir. A site near Abingdon (located between East Hanney and Steventon to the west of the A34) has previously been identified as the preferred site and has been the focus of further study as a result.
This present study will supersede previous studies. It has been undertaken independently of the earlier work, in order to provide an objective analysis against agreed criteria to identify an optimal site for the resource.
Upper Thames Major Resource Development Reservoir Site Selection Study
Thames Water Page 3 14/09/06
Accordingly, the key objectives for the implementation of the methodology were that site assessment should:
• Be robust and defensible (at inquiry if necessary);
• Be based on an appropriate range of evaluation criteria (encompassing hydrological, social, environmental, economic and cost considerations);
• Be easily understood, transparent and capable of communication to a wide range of interests/stakeholders; and
• Be capable of providing recommendations with a clear record of the steps taken and the decisions reached.
The site selection exercise has been completed by the team of consultants listed below. For reference each consultant’s area of expertise, in respect of the site selection study, is identified.
Arup Planning (Lead Consultant)
Jacobs Engineering, technical feasibility and costs
Applied Ecology Nature conservation, biodiversity
Cascade Consulting Water resources, aquatic ecology
Central Science Laboratory Birdstrike
Land Use Consultants Landscape, visual impact
Oxford Archaeology Archaeology and the historic environment
Reading Agricultural Consultants Agricultural land quality
Steer Davies Gleave Transport
The following sections of this report set out full details of the final methodology (Section 2) and the findings of the study (Sections 3-5). The report should be read with its appendices which are provided in three separate volumes (as listed on the contents page).
Upper Thames Major Resource Development Reservoir Site Selection Study
Thames Water Page 4 14/09/06
2. METHODOLOGY
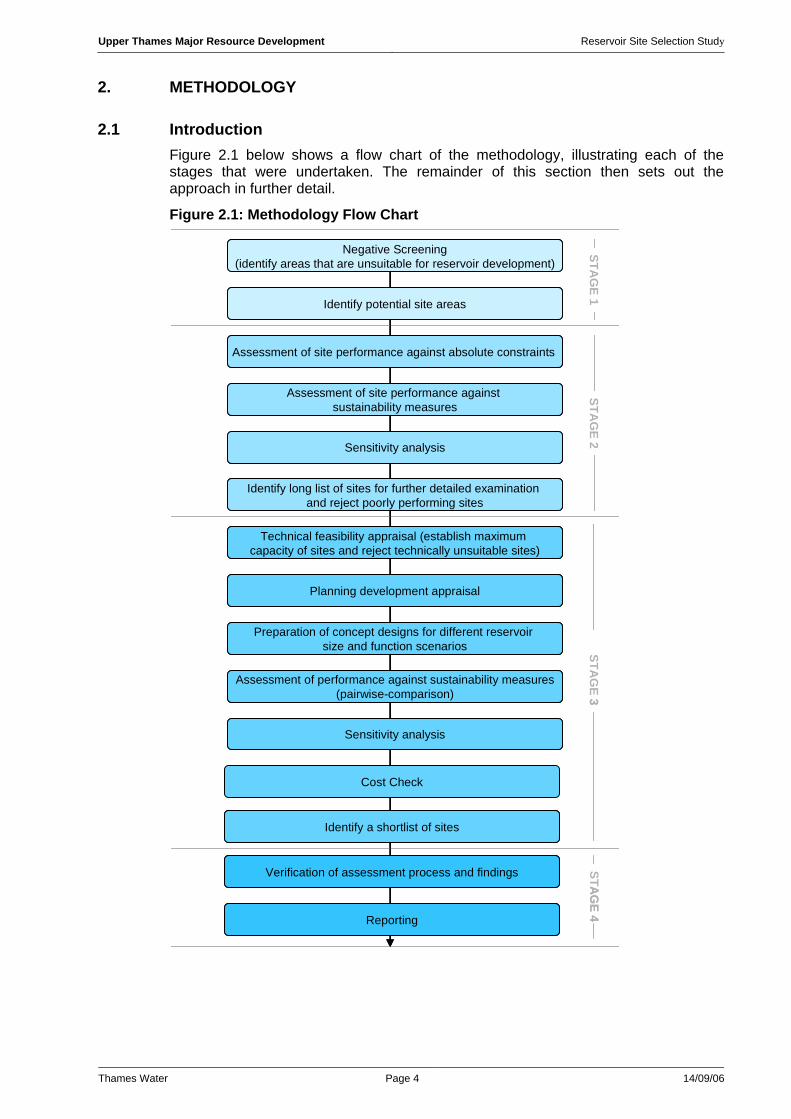
2.1 Introduction Figure 2.1 below shows a flow chart of the methodology, illustrating each of the stages that were undertaken. The remainder of this section then sets out the approach in further detail.
Figure 2.1: Methodology Flow Chart
Negative Screening(identify areas that are unsuitable for reservoir development)
Identify potential site areas
Assessment of site performance against absolute constraints
Assessment of site performance against sustainability measures
Sensitivity analysis
Identify long list of sites for further detailed examination and reject poorly performing sites
Technical feasibility appraisal (establish maximum capacity of sites and reject technically unsuitable sites)
Planning development appraisal
Preparation of concept designs for different reservoir size and function scenarios
Assessment of performance against sustainability measures(pairwise-comparison)
Sensitivity analysis
Identify a shortlist of sites
Verification of assessment process and findings
Reporting
STAG
E 1STA
GE 2
STAG
E 3STA
GE 4
Cost Check
Upper Thames Major Resource Development Reservoir Site Selection Study
Thames Water Page 5 14/09/06
It must be acknowledged that the methodology provides a framework for decision making, and that at each stage there was a requirement for decisions to be made as to which sites are taken forward for further consideration. The methodology assists the decision making process by providing a systematic means by which data is presented at each stage to allow reasoned and transparent decisions to be made.
2.2 Methodology Consultation A consultation exercise was undertaken to inform the process of preparing the methodology. A copy of the draft methodology was sent to 67 bodies (28 June 2005); and a letter informing 40 additional bodies was circulated (28 June 2005). Follow up letters were circulated to bodies who had not responded (dated 5 August 2005).
The period for consultation ran from 28 June 2005 until 19 August 2005, although where requested additional time was given for comments. A list of the parties consulted is provided at Appendix A together with a matrix setting out a summary of the comments received (Appendix B) and how they were taken into account. The methodology set out below has been finalised in light of the comments received.
It should be noted that the methodology was confirmed in December 2005 (taking on board comments from the consultation with key stakeholders). No further changes were made to the methodology after this date.
The following sections set out the final version of the methodology (word for word) that was approved (it is therefore written in the future tense).
2.3 Stage 1 – Refining the Area of Search and Identifying Potential Sites The first stage of the methodology will comprise a desk top exercise that will establish in spatial terms:
• those areas that are unsuitable for reservoir development; thus identifying • those areas that are worthy of further consideration.
To enable this negative screening exercise to be completed, the criteria set out below (2.3.1) will be utilised in the initial stage of the site selection study.
The findings in relation to each of the criteria will be mapped and each individual map overlaid and combined to produce a composite plan of those areas that are unsuitable for reservoir development. These areas will then be excluded from further study. All mapping will use the most recent version issued by Ordnance Survey and the most up-to-date data available.
The remaining areas will then be examined to identify whether there is adequate space to construct a reservoir that provides sufficient storage either for a minimum size direct supply or regulating reservoir. The assumptions regarding the minimum reservoir size are set out below (2.3.2).
Once potential reservoir locations have been identified, an initial boundary will be drawn for each site that shows the indicative maximum area that could be utilised for reservoir development. A map will be produced showing the location of all potential sites that will be subject to further examination at Stage 2.
It is anticipated that a range of site sizes will be identified, ranging from the minimum site area upwards. At this stage it is not possible to define what the range of site sizes might be. However, sites will be grouped by area (hectares), so as to allow a comparison of sites of similar sizes. Otherwise, when assessing sites, like will not be compared with like. The banding of site areas will be determined once the potential site sizes have been confirmed. It is anticipated that no more than three bandings should be utilised in order to maintain a level of simplicity within the approach. It is
Upper Thames Major Resource Development Reservoir Site Selection Study
Thames Water Page 6 14/09/06
anticipated that grouping sites into size bands will allow for various size reservoirs to be assessed.
2.3.1 Stage 1 Negative Screening Criteria
i. Any site should be located in the catchment of the River Thames. A reservoir constructed to service the water supply need identified by Thames Water will be required to form a part of the existing network of water provision operated by the company. All water within the existing network is drawn from within the River Thames catchment. Water within this catchment can be mixed without additional treatment. However, if water is drawn from other river catchments (for example the River Severn or the River Avon (Bristol)) it would be necessary to provide some form of treatment prior to it being mixed and stored with River Thames water in order to overcome possible quality variations and to avoid any alien species being transferred to the Thames catchment. The implications of this are the provision of additional water treatment works, additional operating costs and potential environmental impacts on other river catchments arising from the abstraction of water. Therefore, the area of search will be restricted to being within the catchment of the River Thames.
The overall catchment boundary and sub boundaries (upper, mid and lower) for the River Thames will be sourced from the Environment Agency.
ii. Any site should be located primarily on an area of impermeable strata. There are a range of factors that result in the requirement for any site to be situated primarily (more than 90% of the site area) on an area of impermeable strata. These factors include the potential impact on groundwater/hydrology, engineering complexities, and consequential prohibitive costs. However a site could be sited partially (approximately 10%) on an area of permeable strata as it would be feasible to implement measures that can prevent leakage of the water from the reservoir. These measures could include lining the reservoir floor with a clay blanket or a geomembrane.
A sufficient thickness of impermeable strata must be left in place as the reservoir is constructed to isolate the borrow pit from underlying aquifers and, therefore, prevent heave of the borrow pit floor due to uplift pressures. For the purposes of this study, it is considered that half of the estimated thickness of clay must be left in place to ensure against leakage.
Permeable geology would not be suitable for the construction of a reservoir as it would not provide a watertight base on which to construct it. Although it might be technically feasible to construct a reservoir on permeable strata, it would require engineering solutions to be tested, at a scale that has not been undertaken previously. There are also potential environmental impacts in terms of any risk associated with leakage into the groundwater in the area, which could change the hydrological profile of the catchment. Thus it is not appropriate to locate a reservoir on an area of primarily permeable strata.
To establish those locations where the underlying geology is unsuitable for reservoir development, British Geological Survey (BGS) maps will be utilised. Thames Water’s engineering consultants, Jacobs, will examine and interpret the maps to identify where the strata are permeable or impermeable. The data will then be classified to identify permeable and impermeable areas. These areas will then be mapped and any predominantly permeable areas eliminated from the area of search.
Upper Thames Major Resource Development Reservoir Site Selection Study
Thames Water Page 7 14/09/06
iii. Any site should be situated in a location that has sufficient river flow to enable refilling. An exercise will be undertaken to establish the availability of water in the River Thames and its primary tributaries. The objective of this exercise will be to establish whether there are any tributaries or reaches of the River Thames where there is insufficient flow to fill/refill the minimum required reservoir capacity. The results of this exercise will be reported and the findings mapped to provide additional limits to the area of search. Those reaches of the River Thames or its tributaries which have insufficient flow will be excluded from further study.
The following assumptions will be utilised in the preliminary assessment of the availability of water for abstraction. The assumptions have been prepared by the consultant team in discussion with Thames Water.
1. Analysis is to be undertaken using observed daily mean flow data on the assumption that the available flow record is representative of long term conditions. Observed daily mean flow data gives a broad indication of the availability of water under the current abstraction and discharge regime. The robustness of the analysis is improved by the use of a long period of flow data. The length of flow records from gauging stations in the Thames Catchment may vary from a few years to many decades. However, the full available record for the catchment or sub-catchment concerned will be used in the analysis. Short records that do not include relatively dry periods (and also relatively wet periods) may as a result give a biased indication of the availability and reliability of abstraction potential. Tributaries that may have sufficient water available but have flow records which are not of sufficient length to provide reliable statistics will not be rejected at this stage.
2. Abstractions from watercourses are authorised and licensed by the Environment Agency. To ensure fair access to water and to protect the water environment, conditions are usually specified in a licence to restrict the timing and volumes of water available for abstraction. Thames Region of the Environment Agency have specified that for the purpose of a preliminary screening of sites, that a hands off flow (HOF) of Q50 based on the flow record from the nearest downstream gauging station is appropriate.
The Q50 flow within the Thames Region can expect to be exceeded, other than for isolated short term flood peaks, only during the wetter months. Typically the Thames at Day’s Weir1 has flows above the Q50 value between the months of October to May although this varies somewhat year to year. Thus the Q50 flow constraint set by the Environment Agency effectively restricts abstractions to the winter months.
3. An upper HOF of Q10 will be applied. In discussion, the Environment Agency has indicated that they would not wish to see the natural variations in flow that occur to be fully truncated by abstraction. In other words there should be some variation in flow during the times when abstraction is taking place, so that a more natural regime is maintained to provide benefits to the river channel and also to meet the public expectation of variability in the flow regime. The experience of the consultant team has indicated that the Q10 figure will provide the sort of variability that is required.
4. Water availability will be assessed to determine that there is sufficient water available to fill the minimum required reservoir capacity.
5. The long term reliability of the yield will not be comprehensively assessed at this stage. The average water availability under the above assumptions will be calculated using the available flow data.
1 Days Weir is located between Little Wittenham and Dorchester.
Upper Thames Major Resource Development Reservoir Site Selection Study
Thames Water Page 8 14/09/06
6. At this stage, a river will be considered to be unsuitable for consideration if, over the period of flow record available, the annual average volume of water available for abstraction is less than 100% of that required for the minimum reservoir size or the year on year reliability of the resource is very poor.
The data to establish the water availability will be sourced from the database that is shared by the Environment Agency and Thames Water.
v. Any site should be free from elements of built development. Within any broad area of search there will be elements of existing built development. These elements will include motorways, ‘A’ roads, railways and settlements of 50 or more dwellings in close proximity to one another. Where these elements exist it will not be appropriate to site a reservoir for the following reasons:
• The potential disruption associated with relocation or rerouting of existing major infrastructure is likely to be prohibitive and would be unacceptable to society; and
• The potential loss of communities associated with existing settlements would be unduly disruptive. Furthermore, the costs associated with any compensation arising from settlement relocation would also be high.
Isolated dwellings or small groups of dwellings are not excluded by this criterion.
For the purposes of Stage 1 of the study the spatial criteria set out below will be utilised to identify those areas that comprise built development that cannot be relocated as a consequence of the proposed scheme.
• Within 100 metres of a motorway, strategic route (A road) or railway;
• Within 50 metres of a settlement or group of dwellings.
The criteria are based on a judgement as to the thresholds that should be used in determining the suitability of an area for development. The judgement is based on the consultant team’s experience of assessing the suitability of sites for development and its understanding of the issues associated with reservoir development.
vi. Any site for a regulating reservoir outfall which uses the River Thames should be located upstream of Windsor.
The existing Thames Water abstractions from the River Thames for London are six points situated between Datchet, just upstream of Windsor, and Surbiton, between Molesey and Teddington Weirs. In order for a regulating reservoir to maximise any benefits in terms of increased river flows during low flow periods, particularly in droughts, the discharge point must be located sufficiently far upstream of any intake (abstraction) points to provide those benefits to a significant length of the river channel. As the furthest upstream (and largest) licensed abstraction for Thames Water at Datchet is situated upstream of Windsor, a discharge downstream of this point would have a negligible impact in terms of regulating river flows. In addition, there are in the same geographical area as the abstractions a number of points where access may be possible to the network of aqueducts, tunnels and pipelines which transfer water from the existing reservoirs to the treatment works. When this is feasible it means that a direct supply, rather than regulating, reservoir is likely to be the preferred solution. Therefore in order to provide even a minimal benefit from river regulation, the discharge to any regulating reservoir would need to be located upstream of the town of Windsor.
Upper Thames Major Resource Development Reservoir Site Selection Study
Thames Water Page 9 14/09/06
vii. Any reservoir intake on the River Thames should be located upstream of Teddington Weir. Separate direct supply reservoir storage is required for the SWOX water resource system, and could be needed to augment the existing London reservoir network.
Teddington Weir marks the downstream limit of fresh water in the River Thames. Below the Weir is the Thames Tideway that has both a tidal pattern and is comprised of saline water. Salinity increases downstream as the fresh water input from above the Weir is progressively mixed with the saline water from the North Sea. Salinity in the upper Tideway also varies daily in response to the tidal pattern and seasonally in response to, for example, fluvial flooding from the River Thames. This would mean that any abstraction, even from the upper Tideway, would need to be desalinated before transfer into a direct supply reservoir. It is uneconomic to have desalination as a pre-storage process before the water is introduced to a stored water network to be treated a second time before being put into supply. Desalination is a stand-alone water supply option in its own right and is not appropriate as a pre-processor for water to be included in a raw water storage system.
viii. Any site should be located within a reasonable distance of the intake and outfall points. An adapted version of the proximity principle will be adopted to restrict water transfer distance. For the case of a reservoir it will be presumed that the reservoir should be located as close as possible to the intake (abstraction) point. This is because water transfer results in its own environmental impacts that arise from the pipeline construction and the energy consumption associated with operation – this is particularly relevant for a regulating reservoir where water would be transferred from the river intake (abstraction) point to the reservoir and from the reservoir to the river outfall point. Therefore by minimising the distance over which it is transferred the environmental impacts will be minimised. Without site-specific details it is not possible to quantify the extent of the environmental effects, but the consultant team’s experience is that increased length of transfer equates to greater impacts.
Stage 1 requires a spatial interpretation of the criterion so a threshold of 15km will be applied to the water transfer distance. The threshold of 15km has been selected as it results in the overlap of most sub-catchments in the River Thames catchment. However, areas which are shown to be acceptable in respect of all other Stage 1 criteria, but which fall outside the water transfer threshold, will also be examined to identify whether suitable sites may be found in that area that should be taken forward for further consideration.
2.3.2 Stage 1 Minimum Reservoir Sizes For the purposes of Stage 1 it is assumed that the maximum reservoir depth is 40m. Forty metres is the deepest viable depth for a regulating or direct supply reservoir because beyond this depth it becomes difficult to control the chemical and biological quality of the water. The quality of the reservoir water is maintained by mixing the water to ensure that levels of algae are controlled. If there is too much algae it results in ‘eutrophication’ which reduces the levels of dissolved oxygen in the water and can result in the extinction of other species. Ideally a reservoir should be more than 25 metres deep so that algae can be controlled during the summer months.
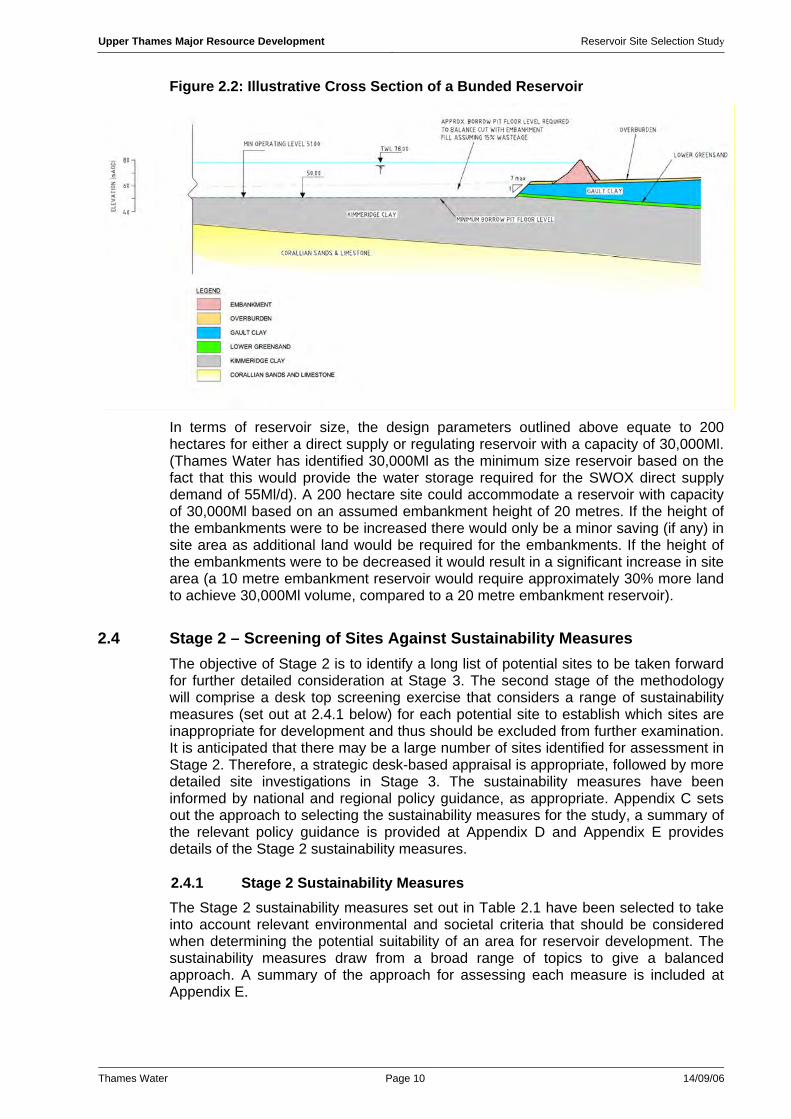
The reservoir is likely to be constructed by digging a borrow pit which will supply the materials for the embankments, which will be sloped at an angle to provide structural stability. The angle and height of the embankment, with the depth of the borrow pit will influence the volume of any reservoir. A generic bunded reservoir section is illustrated in Figure 2.2, as guidance on the form of proposed development.
Upper Thames Major Resource Development Reservoir Site Selection Study
Thames Water Page 10 14/09/06
Figure 2.2: Illustrative Cross Section of a Bunded Reservoir
In terms of reservoir size, the design parameters outlined above equate to 200 hectares for either a direct supply or regulating reservoir with a capacity of 30,000Ml. (Thames Water has identified 30,000Ml as the minimum size reservoir based on the fact that this would provide the water storage required for the SWOX direct supply demand of 55Ml/d). A 200 hectare site could accommodate a reservoir with capacity of 30,000Ml based on an assumed embankment height of 20 metres. If the height of the embankments were to be increased there would only be a minor saving (if any) in site area as additional land would be required for the embankments. If the height of the embankments were to be decreased it would result in a significant increase in site area (a 10 metre embankment reservoir would require approximately 30% more land to achieve 30,000Ml volume, compared to a 20 metre embankment reservoir).
2.4 Stage 2 – Screening of Sites Against Sustainability Measures The objective of Stage 2 is to identify a long list of potential sites to be taken forward for further detailed consideration at Stage 3. The second stage of the methodology will comprise a desk top screening exercise that considers a range of sustainability measures (set out at 2.4.1 below) for each potential site to establish which sites are inappropriate for development and thus should be excluded from further examination. It is anticipated that there may be a large number of sites identified for assessment in Stage 2. Therefore, a strategic desk-based appraisal is appropriate, followed by more detailed site investigations in Stage 3. The sustainability measures have been informed by national and regional policy guidance, as appropriate. Appendix C sets out the approach to selecting the sustainability measures for the study, a summary of the relevant policy guidance is provided at Appendix D and Appendix E provides details of the Stage 2 sustainability measures.
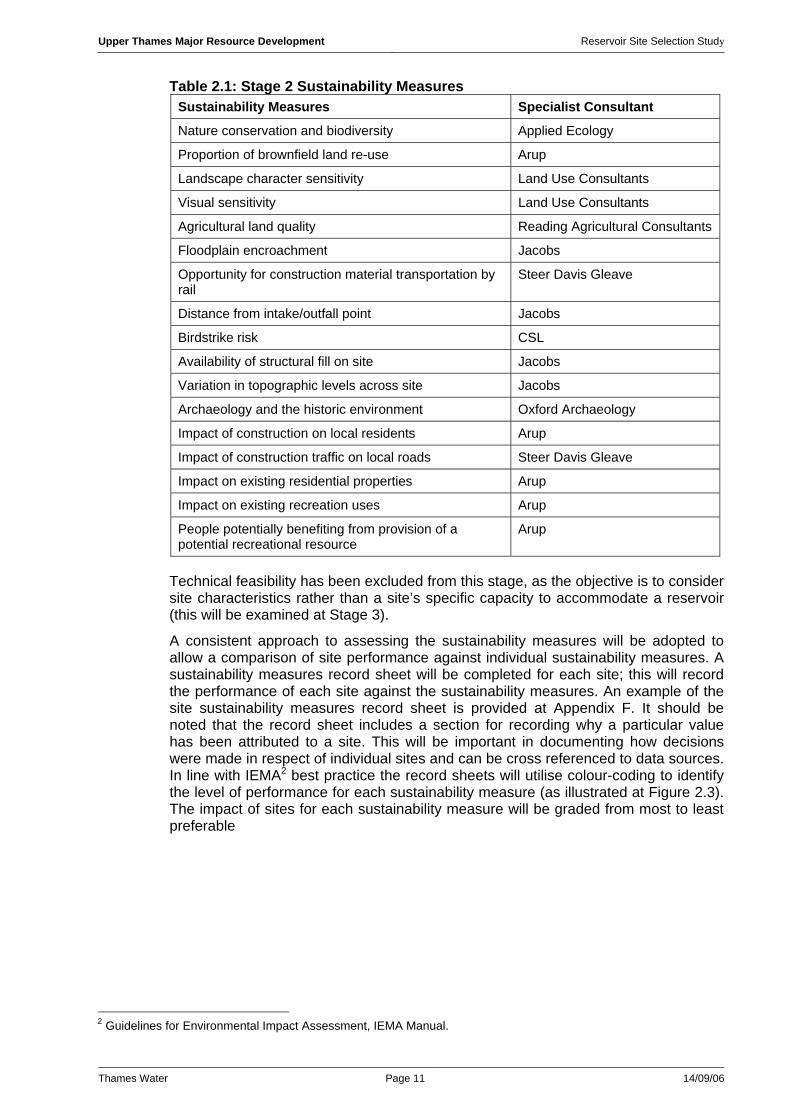
2.4.1 Stage 2 Sustainability Measures The Stage 2 sustainability measures set out in Table 2.1 have been selected to take into account relevant environmental and societal criteria that should be considered when determining the potential suitability of an area for reservoir development. The sustainability measures draw from a broad range of topics to give a balanced approach. A summary of the approach for assessing each measure is included at Appendix E.
Upper Thames Major Resource Development Reservoir Site Selection Study
Thames Water Page 11 14/09/06
Table 2.1: Stage 2 Sustainability Measures Sustainability Measures Specialist Consultant
Nature conservation and biodiversity Applied Ecology
Proportion of brownfield land re-use Arup
Landscape character sensitivity Land Use Consultants
Visual sensitivity Land Use Consultants
Agricultural land quality Reading Agricultural Consultants
Floodplain encroachment Jacobs
Opportunity for construction material transportation by rail
Steer Davis Gleave
Distance from intake/outfall point Jacobs
Birdstrike risk CSL
Availability of structural fill on site Jacobs
Variation in topographic levels across site Jacobs
Archaeology and the historic environment Oxford Archaeology
Impact of construction on local residents Arup
Impact of construction traffic on local roads Steer Davis Gleave
Impact on existing residential properties Arup
Impact on existing recreation uses Arup
People potentially benefiting from provision of a potential recreational resource
Arup
Technical feasibility has been excluded from this stage, as the objective is to consider site characteristics rather than a site’s specific capacity to accommodate a reservoir (this will be examined at Stage 3).
A consistent approach to assessing the sustainability measures will be adopted to allow a comparison of site performance against individual sustainability measures. A sustainability measures record sheet will be completed for each site; this will record the performance of each site against the sustainability measures. An example of the site sustainability measures record sheet is provided at Appendix F. It should be noted that the record sheet includes a section for recording why a particular value has been attributed to a site. This will be important in documenting how decisions were made in respect of individual sites and can be cross referenced to data sources. In line with IEMA2 best practice the record sheets will utilise colour-coding to identify the level of performance for each sustainability measure (as illustrated at Figure 2.3). The impact of sites for each sustainability measure will be graded from most to least preferable
2 Guidelines for Environmental Impact Assessment, IEMA Manual.

Upper Thames Major Resource Development Reservoir Site Selection Study
Thames Water Page 12 14/09/06
Figure 2.3: Sustainability Measure Colour Coding Sustainability Measure
Preference Sustainability
Measure Value
Most preferred 2
1
0
-1
Least preferred -2
2.4.2 Absolute Constraints The record sheets will make provision for the identification of any ‘absolute’ constraints that should be taken into account for the individual site. The specialist consultant team identified any factors which would be an absolute constraint on reservoir development, taking into account the national and regional policy framework. Absolute constraints were identified as follows:
• SPA, SAC, Ramsar and SSSI designated conservation sites. These designations are regarded as the UK’s best wildlife habitats and as such should be protected from development. SPA, SAC and Ramsar sites are protected under European Directives. PPS9 ‘Biodiversity and Geological Conservation’ (2005) identifies that where proposed development on land within or outside a SSSI is likely to have an adverse effect on a SSSI, planning permission should not normally be granted. Accordingly, the incidence of any of these factors within a site should be considered sufficient to render it unsuitable for reservoir development.
• Scheduled Monuments, World Heritage Sites and Grade I listed buildings. These designations relate to the most valuable heritage which should be preserved from development on the basis that they are irreplaceable. PPG16 ‘Archaeology and Planning’ (1990) states ‘where nationally important archaeological remains, whether scheduled or not, and their settings, are affected by proposed development there should be a presumption in favour of their physical preservation’. The guidance goes onto state that ‘the desirability of preserving an ancient monument and its setting is a material consideration’. These constraints are considered to be of such importance that their presence should render a site unsuitable for development.
• Any operational airfield within 3km of the site. ODPM Circular 01/2003 identifies that birdstrike is “one of the major controllable hazards to aviation” and that “common birds have caused catastrophic accidents to all types of aircraft”. As such any reservoir site should not potentially increase any existing hazard. However, at a distance of more than 3km, aircraft are generally flying at a higher altitude than birds. As such the risk of bird strike lessens with distance.
• Clay thickness of less than 10 metres. Any reservoir site will require a sufficient depth of clay to provide an impermeable base. The depth of this layer would be determined by site-specific factors. However, a depth of at least 10 metres will be required for lining purposes to ensure that there is no leakage into the groundwater and to contribute to the construction of embankments. Where the thickness of clay is 10 metres or less, sites should not be considered, as it is unsustainable in terms of environmental impacts external to the site to import large volumes of clay.
Upper Thames Major Resource Development Reservoir Site Selection Study
Thames Water Page 13 14/09/06
Where an absolute constraint is identified for a site it will be excluded from further examination, unless a smaller site of sufficient size can be accommodated within the original boundary without detrimental effect on the identified constraint. In this case the site boundary would be amended to reflect the smaller site.
2.4.3 Performance Matrix A performance matrix will be prepared utilising the information collated on the sustainability measures record sheet for each site. Each column of the performance matrix will set out the site options, and each row will describe the performance against each sustainability measure. The colour-coding approach described above will be used in the performance matrix. The performance matrix will incorporate site size banding (if utilised at Stage 1).
The performance matrix will be analysed to identify any dominant sites. The analysis will consider those sites that perform consistently well against individual sustainability measures and those that perform poorly against each measure. A judgement will be made as to what constitutes good or poor performance once the initial performance matrix has been completed. At this stage, it is anticipated that good performance will recognise a high proportion of more preferential results, i.e. the two lightest colour bands, over the majority of the sustainability measures (when compared to other sites) and that poor performance will reflect a high proportion of less preferential results, i.e. the darkest two colour bands (when compared to other sites). Absolute constraints will exclude sites from further examination as a part of the site selection study. This initial stage of analysis will enable unacceptable sites to be excluded from further examination.
2.4.4 Sensitivity Analysis To further examine site performance, a sensitivity analysis will be undertaken, against selected very high importance and high importance sustainability measures:
i) Very high importance and high importance sustainability measures
Although all of the Stage 2 sustainability measures are relevant to the study it is recognised that not all the sustainability measures are of equal importance. The sensitivity analysis, as informed by the regional and national policy context, will be undertaken against the following very high or high importance measures.
Very High Importance
• Nature conservation and biodiversity;
• Landscape character sensitivity;
• Visual sensitivity; and
• Archaeology and the historic environment.
High Importance
• Floodplain encroachment;
• Distance from intake/outfall;
• Birdstrike risk;
• Impact of construction on local residents; and
• Impact on existing residential properties.
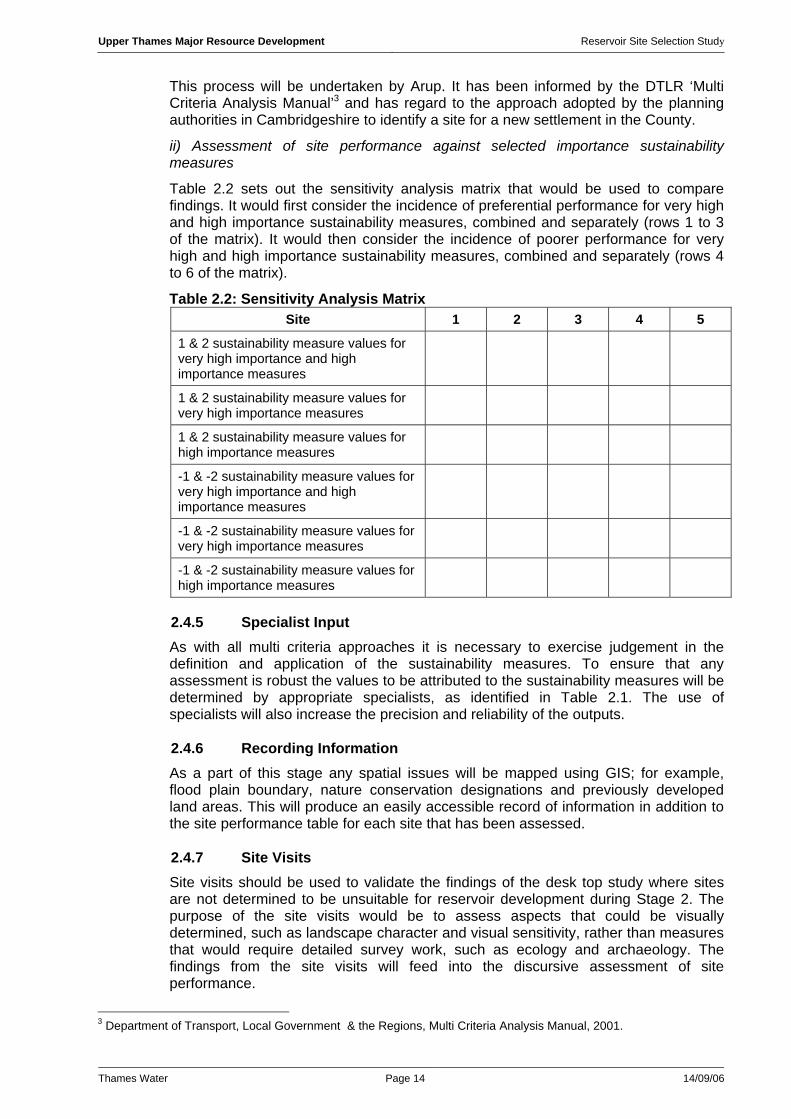
Upper Thames Major Resource Development Reservoir Site Selection Study
Thames Water Page 14 14/09/06
This process will be undertaken by Arup. It has been informed by the DTLR ‘Multi Criteria Analysis Manual’3 and has regard to the approach adopted by the planning authorities in Cambridgeshire to identify a site for a new settlement in the County.
ii) Assessment of site performance against selected importance sustainability measures
Table 2.2 sets out the sensitivity analysis matrix that would be used to compare findings. It would first consider the incidence of preferential performance for very high and high importance sustainability measures, combined and separately (rows 1 to 3 of the matrix). It would then consider the incidence of poorer performance for very high and high importance sustainability measures, combined and separately (rows 4 to 6 of the matrix).
Table 2.2: Sensitivity Analysis Matrix Site 1 2 3 4 5
1 & 2 sustainability measure values for very high importance and high importance measures
1 & 2 sustainability measure values for very high importance measures
1 & 2 sustainability measure values for high importance measures
-1 & -2 sustainability measure values for very high importance and high importance measures
-1 & -2 sustainability measure values for very high importance measures
-1 & -2 sustainability measure values for high importance measures
2.4.5 Specialist Input As with all multi criteria approaches it is necessary to exercise judgement in the definition and application of the sustainability measures. To ensure that any assessment is robust the values to be attributed to the sustainability measures will be determined by appropriate specialists, as identified in Table 2.1. The use of specialists will also increase the precision and reliability of the outputs.
2.4.6 Recording Information As a part of this stage any spatial issues will be mapped using GIS; for example, flood plain boundary, nature conservation designations and previously developed land areas. This will produce an easily accessible record of information in addition to the site performance table for each site that has been assessed.
2.4.7 Site Visits Site visits should be used to validate the findings of the desk top study where sites are not determined to be unsuitable for reservoir development during Stage 2. The purpose of the site visits would be to assess aspects that could be visually determined, such as landscape character and visual sensitivity, rather than measures that would require detailed survey work, such as ecology and archaeology. The findings from the site visits will feed into the discursive assessment of site performance.
3 Department of Transport, Local Government & the Regions, Multi Criteria Analysis Manual, 2001.

Upper Thames Major Resource Development Reservoir Site Selection Study
Thames Water Page 15 14/09/06
2.4.8 Stage 2 Findings The findings for each site will be examined to identify sites that perform poorly from the screening exercise and sensitivity analysis. Poor performing sites as well as the sites impacting on absolute constraints will be rejected at this stage. Hence, the sites to be taken forward (to be referred to as the longlist) will be those that have no absolute constraints and that perform consistently well in relation to the sustainability measures. It will be necessary to ensure that the reasons for selecting the longlist are transparent and this will be clearly reported.
A workshop will be held to discuss the findings, and will be attended by the specialists that have contributed to data collation.
2.5 Stage 3 – Reviewing the Longlist In order to identify preferred sites suitable for different sized reservoirs, Stage 3 will comprise further examination of the longlist of sites identified at Stage 2. The first part of Stage 3 will establish the technical feasibility of the sites and the second part will assess each site in respect of a number of reservoir size scenarios to compare their performance. For the purposes of assessing the identified sites the following reservoir size scenarios will be used:
Table 2.3: Stage 3 Reservoir Size Scenarios Reservoir Size (Ml) Reservoir Function
30,000 Direct supply
50,000 Direct supply OR Regulating supply
75,000 Dual function
100,000 Dual function
125,000 Dual function
150,000 Dual function
The reservoir size scenarios have been selected to reflect the minimum size reservoir required (30,000Ml) and then incremental reservoir size increases. A total of six reservoir size scenarios is proposed to enable a range of different options to be assessed as a part of the site selection study. If very large sites are identified it may be necessary to include additional, larger reservoir sizes. This will be reviewed at the start of Stage 3.
2.5.1 Technical Feasibility Assessment At this stage it will be important to establish with more certainty the technical feasibility of locating a reservoir on the identified sites. The technical feasibility of sites will be assessed by the specialist consultants initially in respect of the largest size reservoir that could be developed. For each site this stage will address:
• Concept reservoir scheme design (including site reservoir capacity);
• Potential pipeline routes, including potential intake/outfall locations (as informed by assessment of impact on aquatic ecology);
• Geology (at a higher level of detail than Stage 2);
• Surface drainage/groundwater implications/flood risk;
• Water availability (a more detailed assessment to examine the availability of water to fill the concept design reservoir);
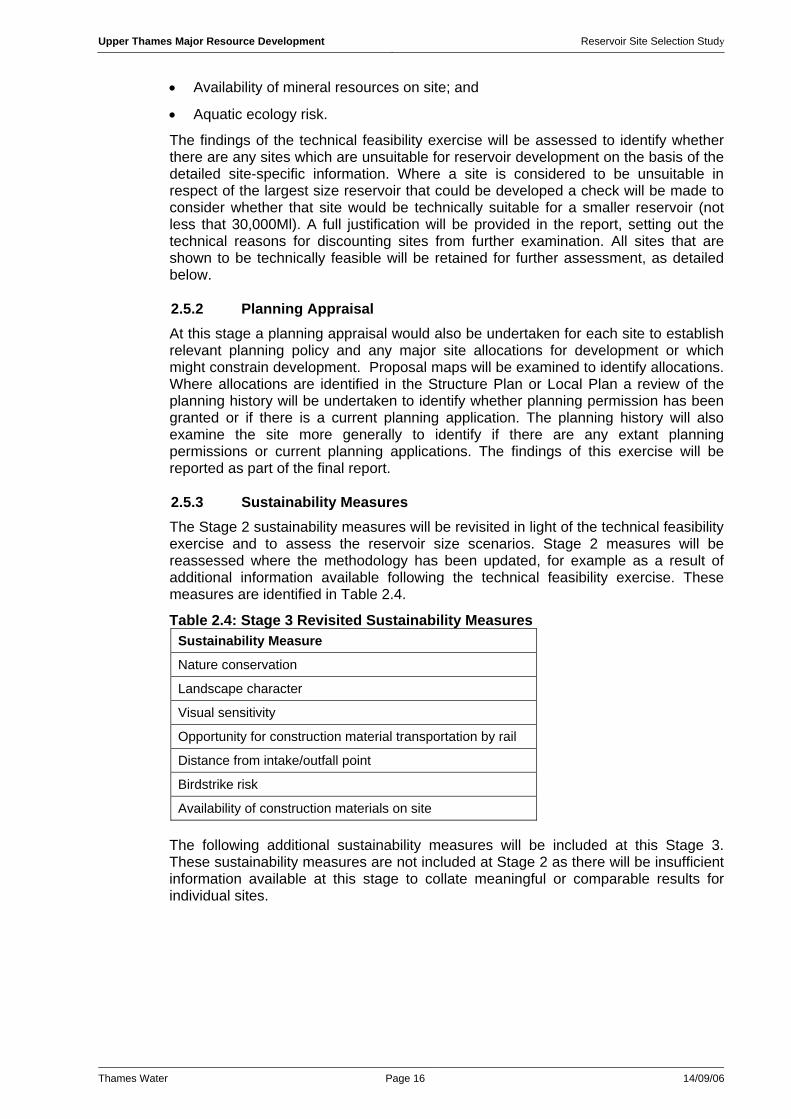
Upper Thames Major Resource Development Reservoir Site Selection Study
Thames Water Page 16 14/09/06
• Availability of mineral resources on site; and
• Aquatic ecology risk.
The findings of the technical feasibility exercise will be assessed to identify whether there are any sites which are unsuitable for reservoir development on the basis of the detailed site-specific information. Where a site is considered to be unsuitable in respect of the largest size reservoir that could be developed a check will be made to consider whether that site would be technically suitable for a smaller reservoir (not less that 30,000Ml). A full justification will be provided in the report, setting out the technical reasons for discounting sites from further examination. All sites that are shown to be technically feasible will be retained for further assessment, as detailed below.
2.5.2 Planning Appraisal At this stage a planning appraisal would also be undertaken for each site to establish relevant planning policy and any major site allocations for development or which might constrain development. Proposal maps will be examined to identify allocations. Where allocations are identified in the Structure Plan or Local Plan a review of the planning history will be undertaken to identify whether planning permission has been granted or if there is a current planning application. The planning history will also examine the site more generally to identify if there are any extant planning permissions or current planning applications. The findings of this exercise will be reported as part of the final report.
2.5.3 Sustainability Measures The Stage 2 sustainability measures will be revisited in light of the technical feasibility exercise and to assess the reservoir size scenarios. Stage 2 measures will be reassessed where the methodology has been updated, for example as a result of additional information available following the technical feasibility exercise. These measures are identified in Table 2.4.
Table 2.4: Stage 3 Revisited Sustainability Measures Sustainability Measure
Nature conservation
Landscape character
Visual sensitivity
Opportunity for construction material transportation by rail
Distance from intake/outfall point
Birdstrike risk
Availability of construction materials on site
The following additional sustainability measures will be included at this Stage 3. These sustainability measures are not included at Stage 2 as there will be insufficient information available at this stage to collate meaningful or comparable results for individual sites.
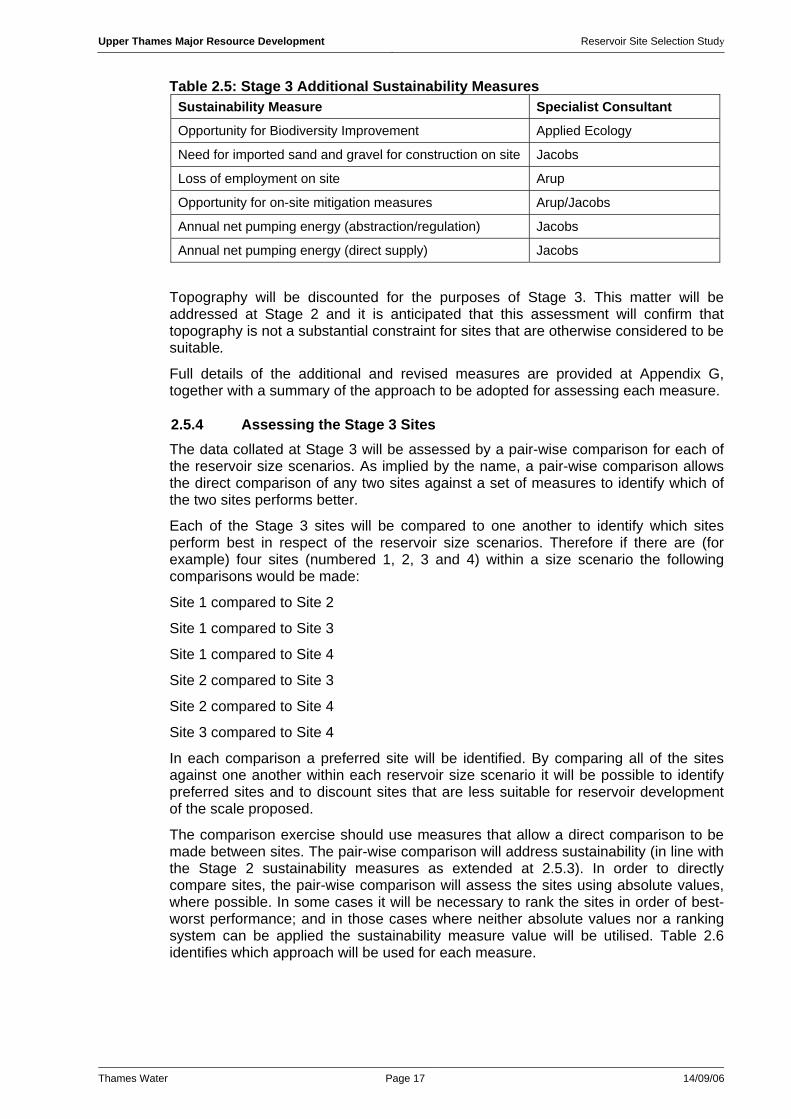
Upper Thames Major Resource Development Reservoir Site Selection Study
Thames Water Page 17 14/09/06
Table 2.5: Stage 3 Additional Sustainability Measures Sustainability Measure Specialist Consultant
Opportunity for Biodiversity Improvement Applied Ecology
Need for imported sand and gravel for construction on site Jacobs
Loss of employment on site Arup
Opportunity for on-site mitigation measures Arup/Jacobs
Annual net pumping energy (abstraction/regulation) Jacobs
Annual net pumping energy (direct supply) Jacobs
Topography will be discounted for the purposes of Stage 3. This matter will be addressed at Stage 2 and it is anticipated that this assessment will confirm that topography is not a substantial constraint for sites that are otherwise considered to be suitable.
Full details of the additional and revised measures are provided at Appendix G, together with a summary of the approach to be adopted for assessing each measure.
2.5.4 Assessing the Stage 3 Sites The data collated at Stage 3 will be assessed by a pair-wise comparison for each of the reservoir size scenarios. As implied by the name, a pair-wise comparison allows the direct comparison of any two sites against a set of measures to identify which of the two sites performs better.
Each of the Stage 3 sites will be compared to one another to identify which sites perform best in respect of the reservoir size scenarios. Therefore if there are (for example) four sites (numbered 1, 2, 3 and 4) within a size scenario the following comparisons would be made:
Site 1 compared to Site 2
Site 1 compared to Site 3
Site 1 compared to Site 4
Site 2 compared to Site 3
Site 2 compared to Site 4
Site 3 compared to Site 4
In each comparison a preferred site will be identified. By comparing all of the sites against one another within each reservoir size scenario it will be possible to identify preferred sites and to discount sites that are less suitable for reservoir development of the scale proposed.
The comparison exercise should use measures that allow a direct comparison to be made between sites. The pair-wise comparison will address sustainability (in line with the Stage 2 sustainability measures as extended at 2.5.3). In order to directly compare sites, the pair-wise comparison will assess the sites using absolute values, where possible. In some cases it will be necessary to rank the sites in order of best-worst performance; and in those cases where neither absolute values nor a ranking system can be applied the sustainability measure value will be utilised. Table 2.6 identifies which approach will be used for each measure.
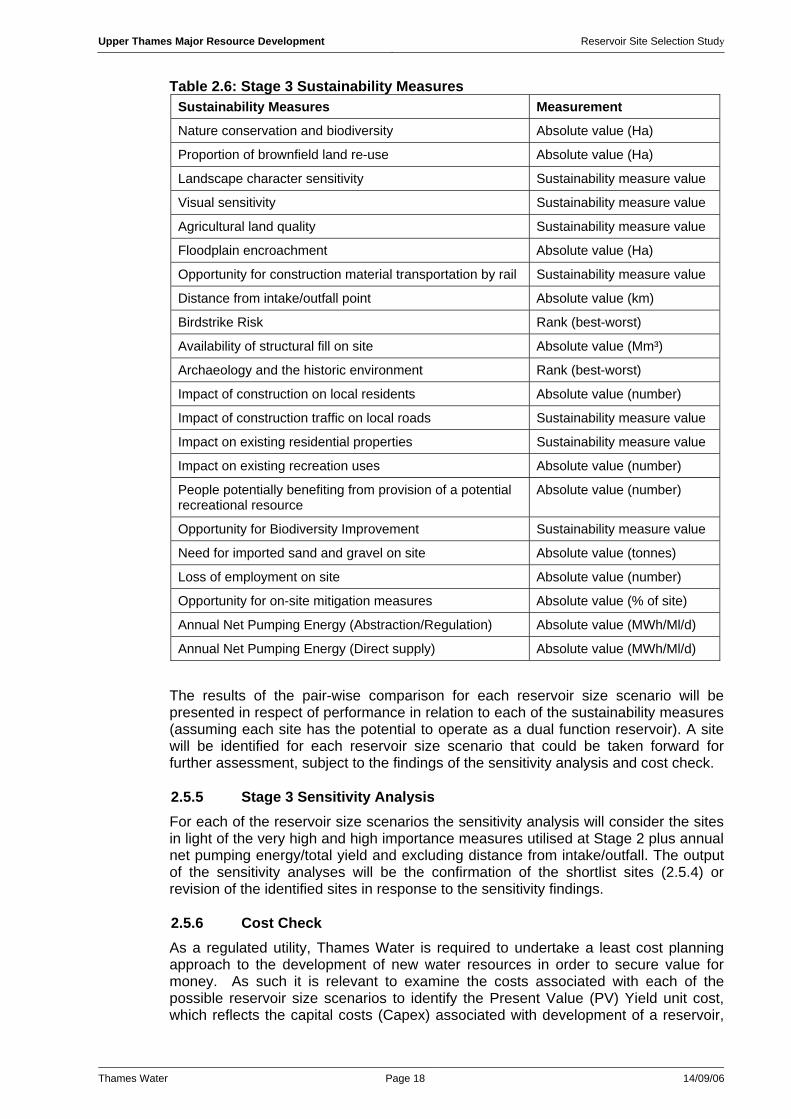
Upper Thames Major Resource Development Reservoir Site Selection Study
Thames Water Page 18 14/09/06
Table 2.6: Stage 3 Sustainability Measures Sustainability Measures Measurement
Nature conservation and biodiversity Absolute value (Ha)
Proportion of brownfield land re-use Absolute value (Ha)
Landscape character sensitivity Sustainability measure value
Visual sensitivity Sustainability measure value
Agricultural land quality Sustainability measure value
Floodplain encroachment Absolute value (Ha)
Opportunity for construction material transportation by rail Sustainability measure value
Distance from intake/outfall point Absolute value (km)
Birdstrike Risk Rank (best-worst)
Availability of structural fill on site Absolute value (Mm³)
Archaeology and the historic environment Rank (best-worst)
Impact of construction on local residents Absolute value (number)
Impact of construction traffic on local roads Sustainability measure value
Impact on existing residential properties Sustainability measure value
Impact on existing recreation uses Absolute value (number)
People potentially benefiting from provision of a potential recreational resource
Absolute value (number)
Opportunity for Biodiversity Improvement Sustainability measure value
Need for imported sand and gravel on site Absolute value (tonnes)
Loss of employment on site Absolute value (number)
Opportunity for on-site mitigation measures Absolute value (% of site)
Annual Net Pumping Energy (Abstraction/Regulation) Absolute value (MWh/Ml/d)
Annual Net Pumping Energy (Direct supply) Absolute value (MWh/Ml/d)
The results of the pair-wise comparison for each reservoir size scenario will be presented in respect of performance in relation to each of the sustainability measures (assuming each site has the potential to operate as a dual function reservoir). A site will be identified for each reservoir size scenario that could be taken forward for further assessment, subject to the findings of the sensitivity analysis and cost check.
2.5.5 Stage 3 Sensitivity Analysis For each of the reservoir size scenarios the sensitivity analysis will consider the sites in light of the very high and high importance measures utilised at Stage 2 plus annual net pumping energy/total yield and excluding distance from intake/outfall. The output of the sensitivity analyses will be the confirmation of the shortlist sites (2.5.4) or revision of the identified sites in response to the sensitivity findings.
2.5.6 Cost Check As a regulated utility, Thames Water is required to undertake a least cost planning approach to the development of new water resources in order to secure value for money. As such it is relevant to examine the costs associated with each of the possible reservoir size scenarios to identify the Present Value (PV) Yield unit cost, which reflects the capital costs (Capex) associated with development of a reservoir,
Upper Thames Major Resource Development Reservoir Site Selection Study
Thames Water Page 19 14/09/06
the operating costs (Opex) for each of the identified locations and the size of each proposed scheme.
Costs will be assessed for each site / reservoir size scenario to identify whether any cost is so significant that the option can not be taken forward.
2.5.7 Recommendations Recommendations for each reservoir size scenario will take into account the findings of the pair-wise comparison and sensitivity analysis. Those sites which are technically feasible (as identified at 2.5.1 above) and which have the least impact in terms of the indicators (within each reservoir size scenario) would be taken forward for further assessment using the Water Resources Programme Assessment Methodology (these sites will be referred to as the shortlist). All other sites would be rejected on the basis that they perform relatively poorly on technical and sustainability grounds compared to the shortlisted sites. A short discursive summary will be completed for each reservoir size scenario setting out the findings in relation to the measures assessed at Stage 3.
2.6 Stage 4 – Verification and Reporting The final stage will comprise a verification exercise that will confirm that the original assumptions have not altered as a result of new information that has become available, such as regulatory changes that are currently unknown and therefore have not been taken into account. In addition, there will be checks to ratify the assumptions and findings at each stage.
A final report will be prepared that sets out the approach to and findings of all stages of the study.
Upper Thames Major Resource Development Reservoir Site Selection Study
Thames Water Page 20 14/09/06
3. STAGE 1 FINDINGS
3.1 Introduction This section provides a record of the steps undertaken during Stage 1 of the site selection study. The objective of Stage 1 was to identify sites worthy of further assessment at Stage 2.
Stage 1 involved a desk top exercise to establish in spatial terms:
• those areas that are unsuitable for reservoir development; thus identifying
• those areas that are worthy of further consideration.
This work was undertaken using a negative screening exercise in line with the approach set out in the methodology (as set out in Section 2).
3.2 Negative Screening This section summarises the sources of information that were used to undertake the negative screening exercise. It also summarises how the information was used to define the geographic areas that are unsuitable for reservoir development. For a number of the criteria, such as defining the extent of the River Thames catchment, Stage 1 comprised a mapping exercise only. Other criteria, such as sufficient river flow, required further analysis of data prior to spatial interpretation of the results.
3.2.1 River Thames Catchment The boundary of the River Thames catchment was defined and provided by the Environment Agency (EA) in the form of a TIF file. This information was geo-referenced against the Ordnance Survey (OS) base map, and digitised around the boundary shown on the TIF file. The digitised boundary was then saved as a separate layer which was subsequently overlaid on the base map to establish the area of search defined by this criterion. The map at Appendix H identifies the River Thames catchment boundary.
3.2.2 Impermeable Strata Sections of the British Geological Survey (BGS) map were provided, by Jacobs to Arup, as a series of Shapefiles. The Shapefiles identified the main geological strata within the River Thames catchment area in respect of permeable areas and clay belts, which were shown as permeable and impermeable areas respectively. The Shapefiles were overlaid onto the OS base map to define the geological strata elements in relation to the River Thames catchment area.
For the purposes of the initial stage of negative screening, permeable and impermeable areas were identified as follows:
• a permeable area is an area of permeable strata, such as limestone or greensands; and
• a impermeable area is an area of impermeable strata, such as clay belts.
Table 3.1 identifies which strata were classified as permeable and which as impermeable within the River Thames catchment area. For the purposes of Stage 1, more geological detail was not necessary. The purpose of the negative screen was simply to establish areas of permeable strata, which are areas that are unsuitable for reservoir development, and hence areas that were then excluded from further investigation.
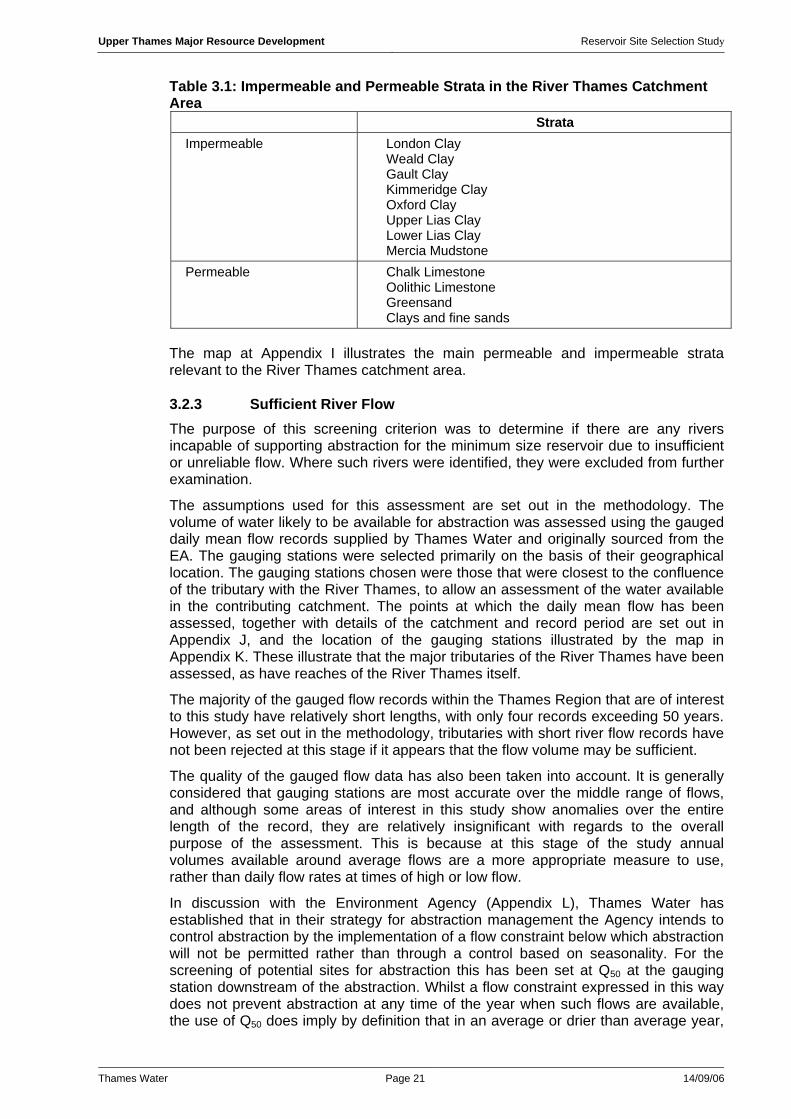
Upper Thames Major Resource Development Reservoir Site Selection Study
Thames Water Page 21 14/09/06
Table 3.1: Impermeable and Permeable Strata in the River Thames Catchment Area
Strata Impermeable London Clay
Weald Clay Gault Clay Kimmeridge Clay Oxford Clay Upper Lias Clay Lower Lias Clay Mercia Mudstone
Permeable Chalk Limestone Oolithic Limestone Greensand Clays and fine sands
The map at Appendix I illustrates the main permeable and impermeable strata relevant to the River Thames catchment area.
3.2.3 Sufficient River Flow The purpose of this screening criterion was to determine if there are any rivers incapable of supporting abstraction for the minimum size reservoir due to insufficient or unreliable flow. Where such rivers were identified, they were excluded from further examination.
The assumptions used for this assessment are set out in the methodology. The volume of water likely to be available for abstraction was assessed using the gauged daily mean flow records supplied by Thames Water and originally sourced from the EA. The gauging stations were selected primarily on the basis of their geographical location. The gauging stations chosen were those that were closest to the confluence of the tributary with the River Thames, to allow an assessment of the water available in the contributing catchment. The points at which the daily mean flow has been assessed, together with details of the catchment and record period are set out in Appendix J, and the location of the gauging stations illustrated by the map in Appendix K. These illustrate that the major tributaries of the River Thames have been assessed, as have reaches of the River Thames itself.
The majority of the gauged flow records within the Thames Region that are of interest to this study have relatively short lengths, with only four records exceeding 50 years. However, as set out in the methodology, tributaries with short river flow records have not been rejected at this stage if it appears that the flow volume may be sufficient.
The quality of the gauged flow data has also been taken into account. It is generally considered that gauging stations are most accurate over the middle range of flows, and although some areas of interest in this study show anomalies over the entire length of the record, they are relatively insignificant with regards to the overall purpose of the assessment. This is because at this stage of the study annual volumes available around average flows are a more appropriate measure to use, rather than daily flow rates at times of high or low flow.
In discussion with the Environment Agency (Appendix L), Thames Water has established that in their strategy for abstraction management the Agency intends to control abstraction by the implementation of a flow constraint below which abstraction will not be permitted rather than through a control based on seasonality. For the screening of potential sites for abstraction this has been set at Q50 at the gauging station downstream of the abstraction. Whilst a flow constraint expressed in this way does not prevent abstraction at any time of the year when such flows are available, the use of Q50 does imply by definition that in an average or drier than average year,

Upper Thames Major Resource Development Reservoir Site Selection Study
Thames Water Page 22 14/09/06
abstraction is only likely to be possible in the winter half-year, that is between October and March. A further flow constraint of Q10 has also been applied. This is because it is unlikely to be licensed and undesirable that all the water above Q50 be abstracted. Therefore, for the purposes of this assessment, only the water between Q50 and Q10 is considered as an available resource.
To establish whether a particular catchment has sufficient water available to support abstraction for a reservoir, for screening purposes a direct supply reservoir was selected. This was in order to test whether any of the Thames tributary catchments could sustain any reservoir rather than restrict potential abstraction to the main River Thames only. The reservoir volume selected for screening purposes was 30,000 Ml of usable capacity, the smallest reservoir volume that can provide the required direct supply of 55Ml/d.
Each river has been assessed for its potential to support a reservoir of 30,000 Ml. As an initial assessment, the annual average availability of water in the river between Q50 and Q10 was calculated and converted to a long term average daily water availability. Those rivers in which less than 50 Ml/d is available on average for abstraction are unlikely to be able to support such an abstraction. Table 3.2 shows the results from this initial analysis where the water availability has been calculated from available daily mean flow data. It is important to note that the analysis has been carried out on records of varying length, some too short to cover a representative range of anticipated flow variability.
Table 3.2 Water availability River Gauging Station Water availability (Ml/d) Cherwell Enslow 153.5 Cole Inglesham 48.2 Colne Denham 77.5 Darent Hawley 23.4 Evenlode Cassington 148.1 Hogsmill Kingston 19.1 Kennet Theale 231.8 Leach Lechlade 34.3 Lee Feildes Weir 163.1 Loddon Sheepbridge 160.4 Mole Esher 190.4 Ock Abingdon 59.7 Stort Glen Faba 73.7 Thame Wheatley 195.6 Thames Day’s 457 Wandle Connollys Mill 34.1 Wey Weybridge 188 Windrush Newbridge 106.2 Wye Bourne End (Hedsor) 15.8
Six rivers, highlighted in grey in Table 3.2 have, on average, insufficient runoff to support an abstraction of 55 Ml/d: the Rivers Cole, Darent, Hogsmill, Leach, Wandle and Wye. However, this is a long term average assessment and it is important to also look at the reliability of the resource. The reliability of each river has thus been assessed for its ability to supply a reservoir of 30,000Ml. Table 3.3 shows the annual availability of water and the reliability of the source, full detail is shown at Appendix M. In order to maximise the number of water year totals, it has been necessary to infill missing data at some sites for a small number of consecutive days. Where large volumes of data are missing, the water year has been excluded from the analysis.
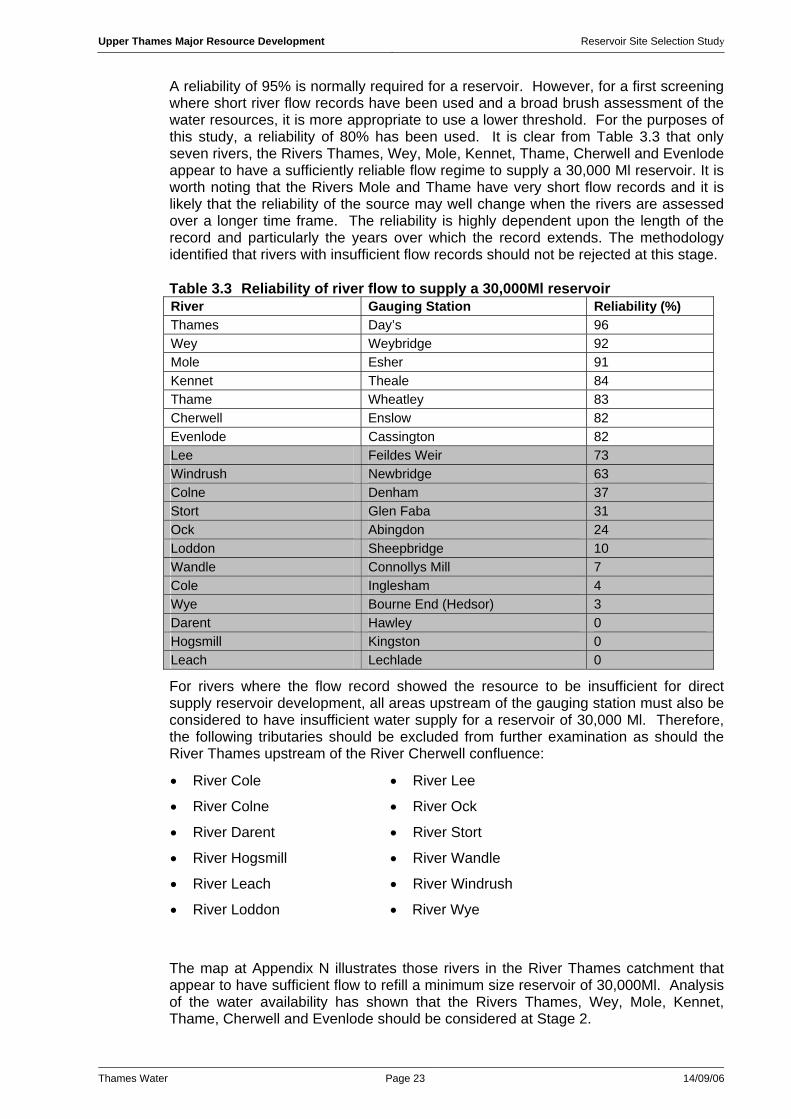
Upper Thames Major Resource Development Reservoir Site Selection Study
Thames Water Page 23 14/09/06
A reliability of 95% is normally required for a reservoir. However, for a first screening where short river flow records have been used and a broad brush assessment of the water resources, it is more appropriate to use a lower threshold. For the purposes of this study, a reliability of 80% has been used. It is clear from Table 3.3 that only seven rivers, the Rivers Thames, Wey, Mole, Kennet, Thame, Cherwell and Evenlode appear to have a sufficiently reliable flow regime to supply a 30,000 Ml reservoir. It is worth noting that the Rivers Mole and Thame have very short flow records and it is likely that the reliability of the source may well change when the rivers are assessed over a longer time frame. The reliability is highly dependent upon the length of the record and particularly the years over which the record extends. The methodology identified that rivers with insufficient flow records should not be rejected at this stage.
Table 3.3 Reliability of river flow to supply a 30,000Ml reservoir River Gauging Station Reliability (%) Thames Day’s 96 Wey Weybridge 92 Mole Esher 91 Kennet Theale 84 Thame Wheatley 83 Cherwell Enslow 82 Evenlode Cassington 82 Lee Feildes Weir 73 Windrush Newbridge 63 Colne Denham 37 Stort Glen Faba 31 Ock Abingdon 24 Loddon Sheepbridge 10 Wandle Connollys Mill 7 Cole Inglesham 4 Wye Bourne End (Hedsor) 3 Darent Hawley 0 Hogsmill Kingston 0 Leach Lechlade 0
For rivers where the flow record showed the resource to be insufficient for direct supply reservoir development, all areas upstream of the gauging station must also be considered to have insufficient water supply for a reservoir of 30,000 Ml. Therefore, the following tributaries should be excluded from further examination as should the River Thames upstream of the River Cherwell confluence:
• River Cole
• River Colne
• River Darent
• River Hogsmill
• River Leach
• River Loddon
• River Lee
• River Ock
• River Stort
• River Wandle
• River Windrush
• River Wye
The map at Appendix N illustrates those rivers in the River Thames catchment that appear to have sufficient flow to refill a minimum size reservoir of 30,000Ml. Analysis of the water availability has shown that the Rivers Thames, Wey, Mole, Kennet, Thame, Cherwell and Evenlode should be considered at Stage 2.
Upper Thames Major Resource Development Reservoir Site Selection Study
Thames Water Page 24 14/09/06
3.2.4 Free from Elements of Built Development The methodology identifies those elements considered to be built development. Utilising strategic layers within GBPro200 motorways, class ‘A’ roads, rail lines and urban areas were identified. A model was built within ArcView to draw a buffer around each identified element in line with the approach set out in the methodology. The digitised boundary was then saved as a separate layer and subsequently overlaid on the OS base map.
The map at Appendix O illustrates those areas that are identifiable as major built development at a strategic level. Due to the scale of the strategic mapping it was not possible to identify all settlements with more than fifty dwellings. When identifying potential site boundaries, the number of dwellings that fall within potential site boundaries was checked against the 1:50,000 OS plans. If more than fifty dwellings were estimated to fall within the site then the site was rejected, or the boundary amended.
3.2.5 Distance from Intake/Outfall Point In order to establish a water transfer area for each of the main tributaries with sufficient flow to meet the minimum requirement, a 15km buffer was drawn along each side of those rivers with sufficient flow, in line with the approach set out in the methodology. In the case of the River Thames, the upper most point from which the buffer was drawn was the confluence with the River Cherwell. For the River Cherwell, the gauging station at Enslow was used, for the River Thame, the gauging station at Wheatley was used, for the River Kennet the gauging station at Theale was used, for the River Wey the gauging station at Weybridge and for the River Mole the gauging station at Esher. Utilising MapInfo DATA GBPro200, all of the relevant rivers within the catchment boundary were selected and a model was built within ArcView to draw a 15km buffer, in line with the restrictions set out above. The digitised boundary was then saved as a separate layer.
At Stage 1, it was not considered appropriate to determine the location of feasible intake/outfall points, as this would be dealt with as a part of the technical evaluation at Stage 3. Instead, the distance from the river(s) was considered to be the appropriate measure.
The map at Appendix P identifies the areas that are defined by this criterion. This map indicates that for most of the tributaries the water transfer zones overlap one another, except at the upper reaches of tributaries.
3.2.6 Combining the Findings For each of the criteria set out above a digitised map layer was produced, to provide a spatial illustration of the findings. As indicated, some layers were produced using GBPro200 and others by digitising boundaries based on 1:50,000 OS maps. The digitised layers define the areas that should be excluded from further examination for each negative screening criterion. In order to establish the combined area that should be excluded from further examination all of the layers were overlaid on the OS base map in ArcView.
The map at Appendix Q illustrates the combined negative screening criteria findings.
Upper Thames Major Resource Development Reservoir Site Selection Study
Thames Water Page 25 14/09/06
3.3 Potential Site Area Identification
3.3.1 Approach The findings of the negative screening exercise were printed to scale on a 1:50,000 OS base map. The map was then assessed to identify potential sites with a minimum area of 200 hectares, in line with the approach set out in the methodology. Initially, the areas within the 15km buffer zone around rivers with sufficient water were assessed. The search was then extended to identify sites in areas beyond the buffer zone but which met all other criteria.
In identifying possible sites it was determined that potential areas of search in the area stretching from Watford to Harlow would be discounted. This area is highly constrained by existing levels of built development. Furthermore, these areas would require relatively lengthy pipelines to allow water transfer from a point on the River Thames or other river with sufficient flow resource. Given the levels of major built development any such pipeline would probably have to be even longer, to circumnavigate or otherwise overcome these constraints.
The areas remaining from the negative screening exercise were then assessed by three members of the team to identify potential locations worthy of further consideration. Each potential location was marked on the plan.
Each marked area was then reviewed to identify a potential site area that should be considered further. The criteria for identifying potential site areas were:
• any site should not be within an area excluded during the negative screening. The only exception was in relation to the permeable area that runs through the centre of the search area. (Where a potential site was found that was primarily in the impermeable and approximately 10 percent in the permeable area, this was considered acceptable);
• any site should be at least 200 hectares in size; and
• any site should be more than 50 metres from any development element.
Each potential site area was outlined on the OS base plan taking into account these criteria. It should be noted that when identifying potential site areas, consideration was not given to technical feasibility, potential planning or other constraints as these would be assessed under Stages 2 and 3 of the assessment. The potential site areas were then digitised and this layer overlaid on the 1:50,000 OS base map and the site area calculated to ensure that it met the minimum size requirement of 100 hectares. Each site was also given a reference comprised of a number and name. The numbers are sequential and the name refers to the nearest settlement.
3.3.2 Identified sites In total, fifty-five possible sites were identified by the above exercise. The map at Appendix R illustrates the location of each one together with a list that sets out the name and number attributed to each site and details of the site area in hectares.
It is acknowledged that a number of sites are some distance from the points in the river catchment where there is sufficient flow resource to meet the minimum size requirement. If these sites were considered to be suitable for reservoir development at later stages of the study then it must be accepted that it would be necessary to transfer water over a considerable distance with associated sustainability consequences.

Upper Thames Major Resource Development Reservoir Site Selection Study
Thames Water Page 26 14/09/06
3.3.3 Size bands The size of sites identified ranges from approximately 200 hectares (Site 40 – Postcombe) to approximately 1,400 hectares (Site 22 – Abingdon). Clearly this is a considerable size range and as such it was necessary to define size bands that could be used at Stage 2 to allow the comparison of similarly sized sites. Following a review of the site sizes it was determined that the size bands would be:
• Band A: 200 – 399 hectares
• Band B: 400 – 699 hectares
• Band C: 700 hectares or larger
A total of seventeen sites are in Band A, twenty-seven in Band B and eleven in Band C. It is acknowledged that the range of the site size band for Band C is more than double that of the other size bands. However, there are only two sites which are considerably larger than the others (Site 27 – Beckley at 1,380 hectares and Site 22 – Abingdon at 1,400 hectares). A separate size band for only two sites was not considered appropriate as it would not allow any meaningful comparison. The tables at Appendix R set out the sites by size band.
3.4 Summary The Stage 1 negative screening exercise identified those areas that are unsuitable for reservoir development in line with the criteria set out in the methodology. A review of the areas that were identified as being potentially suitable for reservoir development resulted in the identification of fifty-five possible sites. Given the widely differing sizes of the potential sites, they were grouped into three size bands to facilitate comparison in later stages of the study.
The identified sites were taken forward for further consideration at Stage 2, the findings of which are described in the next section of this report.

Upper Thames Major Resource Development Reservoir Site Selection Study
Thames Water Page 27 14/09/06
4. STAGE 2 FINDINGS
4.1 Introduction Stage 1 of the study identified site areas that were potentially suitable for reservoir development, in line with the approach set out in the methodology (Section 2). A total of fifty-five sites were identified. Given the range of site sizes identified at Stage 1, the analysis of the sites was undertaken within size bands: Band A for sites between 200 and 399 hectares, Band B for sites between 400 and 699 hectares, and Band C for sites of more than 700 hectares.
This section of the report sets out the findings of Stage 2, provides a record of the steps taken to assess the suitability of sites against the sustainability measures, and identifies those sites that performed poorly against the measures. A sensitivity test was also undertaken at Stage 2 against important sustainability measures to assist the process of identifying poor performing sites and to select those sites to be taken forward to the next stage of the process (Stage 3).
For reference, a full set of the site performance tables is provided at Appendix S, together with maps T1-55 of the sites at Appendix T. Where sites are excluded at a particular stage of the process, these are clearly shown in this section of the report within a shaded text box.
Colour coding has been used for the purposes of recording the findings of the sustainability measures, although reference is sometimes made to the sustainability measure value. This is to reduce confusion in describing the relative shades.
4.2 Absolute Constraints This part of the study involved an assessment of the fifty-five sites against the absolute constraints, identified in the methodology (see section 2.4.2).
4.2.1 Initial Analysis Against Absolute Constraints For ease of interpretation the relevant sustainability measures where an absolute constraint has been identified for a site has been outlined in red on Table 4.1. The findings for the twenty eight sites where an absolute constraint was shown to have an impact upon or affect a site are also summarised in Table 4.2 and described below:
Nature Conservation and Biodiversity
This constraint was assessed to affect eight sites where the presence of a SSSI had been identified within the site boundary. Two of the sites were in Band A (Sites 4-Swindon and 25-Oxford); two sites were in Band C (Sites 27-Beckley and 36-Marsh Gibbon), and four sites were identified in Band B: (Sites 2-Leigh, 15-Bampton, 24-Kidlington and 31-Wheatley).
Birdstrike Risk
No sites in Band A were identified as impacting on this constraint. Of a total of six sites identified, four sites (Sites 14-Brize Norton, 32-Benson, 33-Chalgrove and 47-Bierton) were identified in Band B and two were in Band C (Sites 3-Cricklade and 38-Great Haseley).
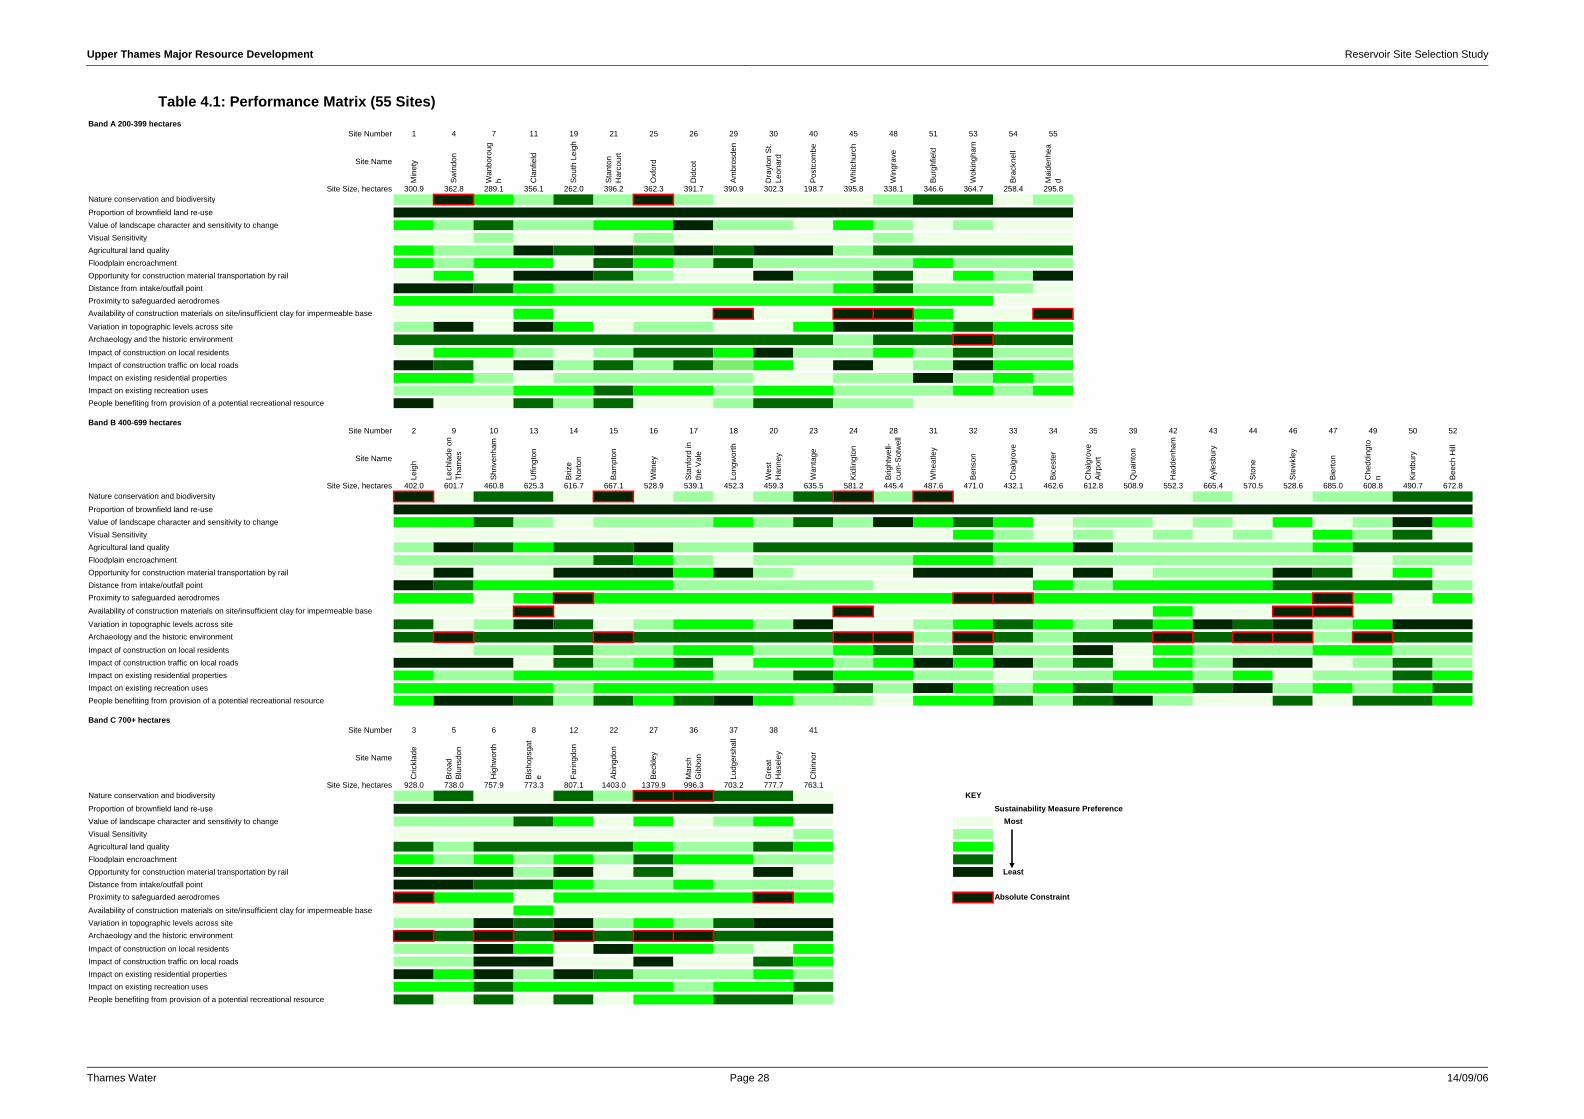
Upper Thames Major Resource Development Reservoir Site Selection Study
Thames Water Page 28 14/09/06
Table 4.1: Performance Matrix (55 Sites) Band A 200-399 hectares
Site Number 1 4 7 11 19 21 25 26 29 30 40 45 48 51 53 54 55
Site Name
Min
ety
Swin
don
Wan
boro
ugh C
lanf
ield
Sout
h Le
igh
Stan
ton
Har
cour
t
Oxf
ord
Did
cot
Ambr
osde
n
Dra
yton
St.
Leon
ard
Post
com
be
Whi
tchu
rch
Win
grav
e
Burg
hfie
ld
Wok
ingh
am
Brac
knel
l
Mai
denh
ead
Site Size, hectares 300.9 362.8 289.1 356.1 262.0 396.2 362.3 391.7 390.9 302.3 198.7 395.8 338.1 346.6 364.7 258.4 295.8Nature conservation and biodiversity
Proportion of brownfield land re-useValue of landscape character and sensitivity to changeVisual SensitivityAgricultural land qualityFloodplain encroachmentOpportunity for construction material transportation by railDistance from intake/outfall pointProximity to safeguarded aerodromesAvailability of construction materials on site/insufficient clay for impermeable base
Variation in topographic levels across siteArchaeology and the historic environment
Impact of construction on local residentsImpact of construction traffic on local roadsImpact on existing residential propertiesImpact on existing recreation usesPeople benefiting from provision of a potential recreational resource
Band B 400-699 hectaresSite Number 2 9 10 13 14 15 16 17 18 20 23 24 28 31 32 33 34 35 39 42 43 44 46 47 49 50 52
Site Name
Leig
h
Lech
lade
on
Tham
es
Shr
iven
ham
Uffi
ngto
n
Briz
e N
orto
n
Bam
pton
Witn
ey
Sta
nfor
d in
th
e Va
le
Long
wor
th
Wes
t H
anne
y
Wan
tage
Kid
lingt
on
Brig
htw
ell-
cum
-Sot
wel
l
Whe
atle
y
Ben
son
Cha
lgro
ve
Bic
este
r
Cha
lgro
ve
Airp
ort
Qua
into
n
Had
denh
am
Ayl
esbu
ry
Sto
ne
Ste
wkl
ey
Bie
rton
Che
ddin
gto
n Kin
tbur
y
Bee
ch H
ill
Site Size, hectares 402.0 601.7 460.8 625.3 616.7 667.1 528.9 539.1 452.3 459.3 635.5 581.2 445.4 487.6 471.0 432.1 462.6 612.8 508.9 552.3 665.4 570.5 528.6 685.0 608.8 490.7 672.8Nature conservation and biodiversity
Proportion of brownfield land re-useValue of landscape character and sensitivity to changeVisual SensitivityAgricultural land qualityFloodplain encroachmentOpportunity for construction material transportation by railDistance from intake/outfall pointProximity to safeguarded aerodromes
Availability of construction materials on site/insufficient clay for impermeable base
Variation in topographic levels across siteArchaeology and the historic environment
Impact of construction on local residentsImpact of construction traffic on local roadsImpact on existing residential propertiesImpact on existing recreation usesPeople benefiting from provision of a potential recreational resource
Band C 700+ hectaresSite Number 3 5 6 8 12 22 27 36 37 38 41
Site Name
Cric
klad
e
Bro
ad
Blu
nsdo
n
Hig
hwor
th
Bis
hops
gat
e Farin
gdon
Abi
ngdo
n
Bec
kley
Mar
sh
Gib
bon
Ludg
ersh
all
Gre
at
Has
eley
Chi
nnor
Site Size, hectares 928.0 738.0 757.9 773.3 807.1 1403.0 1379.9 996.3 703.2 777.7 763.1Nature conservation and biodiversity KEYProportion of brownfield land re-use Sustainability Measure PreferenceValue of landscape character and sensitivity to change MostVisual SensitivityAgricultural land qualityFloodplain encroachmentOpportunity for construction material transportation by rail LeastDistance from intake/outfall pointProximity to safeguarded aerodromes Absolute ConstraintAvailability of construction materials on site/insufficient clay for impermeable baseVariation in topographic levels across siteArchaeology and the historic environment
Impact of construction on local residentsImpact of construction traffic on local roadsImpact on existing residential propertiesImpact on existing recreation usesPeople benefiting from provision of a potential recreational resource

Upper Thames Major Resource Development Reservoir Site Selection Study
Thames Water Page 29 14/09/06
Insufficient Clay for an Impermeable Base
Eight sites were assessed to be affected by this constraint. Four sites were identified in Band A (Sites 29-Ambroseden, 45-Whitchurch, 48-Wingrave and 55-Maidenhead); and four sites in Band B (Sites 13-Uffington, 24-Kidlington, 46-Stewkley and 47-Bierton).
Archaeology and the Historic Environment
Fifteen sites were assessed to be affected by this constraint. One site was found within Band A (Site 53-Wokingham) and the majority of sites were in Band B, where nine sites were assessed to be affected by the constraint (Sites 9-Lechlade on Thames, 15-Bampton, 24-Kidlington, 28-Brightwell-cum-Sotwell, 32-Benson, 42-Haddenham, 44-Stone, 46-Stewkley and 49-Cheddington). There were five sites affected by this constraint in Band C (Sites 3-Cricklade, 6-Highworth, 12-Faringdon, 27-Beckley and 36-Marsh Gibbon).
Table 4.2 Sites with Absolute Constraints Sustainability
Measure
Site
Nature conservation
and biodiversity
Birdstrike Risk
Insufficient clay for an
Impermeable Base
Archaeology and the historic
environment
4-Swindon
25-Oxford
29-Ambrosden
45-Whitchurch
48-Wingrave
53-Wokingham
Band A
55-Maidenhead
2-Leigh
9-Lechlade-on-Thames
13-Uffington
14-Brize Norton
15-Bampton
24-Kidlington
28-Brightwell-cum-Sotwell
31-Wheatley
32-Benson
33-Chalgrove
42-Haddenham
44-Stone
46-Stewkley
47-Bierton
Band B
49-Cheddington
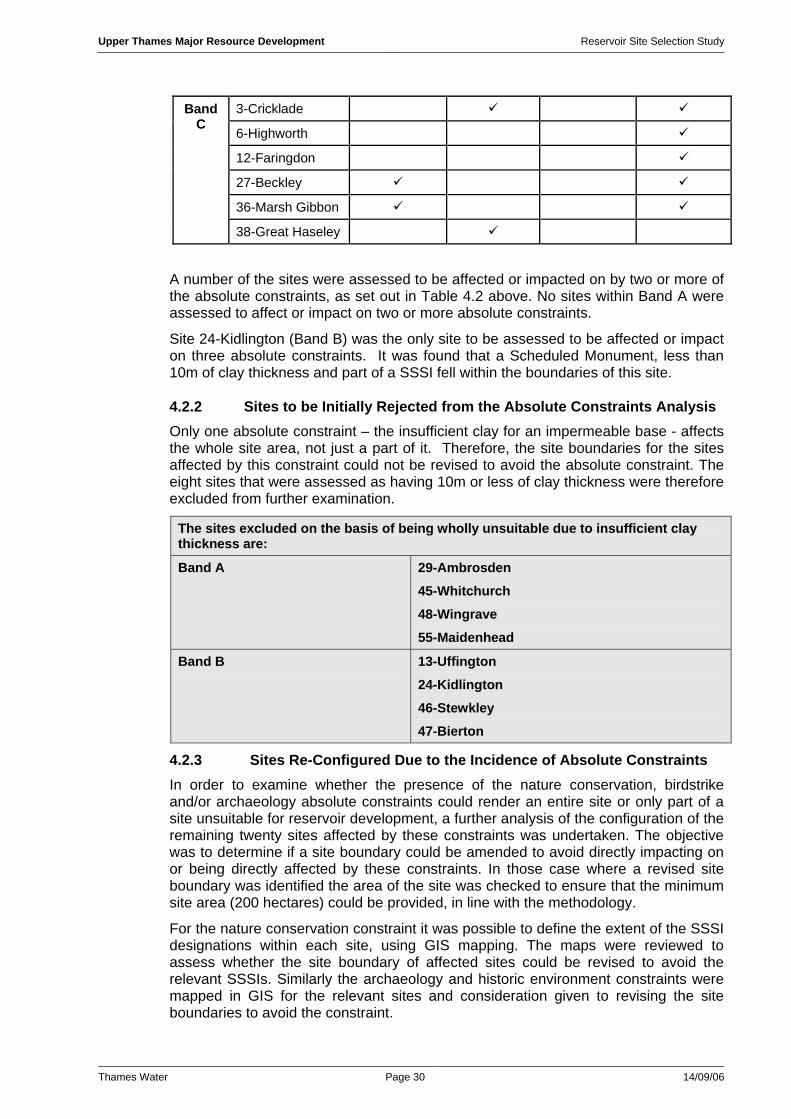
Upper Thames Major Resource Development Reservoir Site Selection Study
Thames Water Page 30 14/09/06
3-Cricklade
6-Highworth
12-Faringdon
27-Beckley
36-Marsh Gibbon
Band C
38-Great Haseley
A number of the sites were assessed to be affected or impacted on by two or more of the absolute constraints, as set out in Table 4.2 above. No sites within Band A were assessed to affect or impact on two or more absolute constraints.
Site 24-Kidlington (Band B) was the only site to be assessed to be affected or impact on three absolute constraints. It was found that a Scheduled Monument, less than 10m of clay thickness and part of a SSSI fell within the boundaries of this site.
4.2.2 Sites to be Initially Rejected from the Absolute Constraints Analysis Only one absolute constraint – the insufficient clay for an impermeable base - affects the whole site area, not just a part of it. Therefore, the site boundaries for the sites affected by this constraint could not be revised to avoid the absolute constraint. The eight sites that were assessed as having 10m or less of clay thickness were therefore excluded from further examination.
The sites excluded on the basis of being wholly unsuitable due to insufficient clay thickness are:
Band A 29-Ambrosden
45-Whitchurch
48-Wingrave
55-Maidenhead
Band B
13-Uffington
24-Kidlington
46-Stewkley
47-Bierton
4.2.3 Sites Re-Configured Due to the Incidence of Absolute Constraints In order to examine whether the presence of the nature conservation, birdstrike and/or archaeology absolute constraints could render an entire site or only part of a site unsuitable for reservoir development, a further analysis of the configuration of the remaining twenty sites affected by these constraints was undertaken. The objective was to determine if a site boundary could be amended to avoid directly impacting on or being directly affected by these constraints. In those case where a revised site boundary was identified the area of the site was checked to ensure that the minimum site area (200 hectares) could be provided, in line with the methodology.
For the nature conservation constraint it was possible to define the extent of the SSSI designations within each site, using GIS mapping. The maps were reviewed to assess whether the site boundary of affected sites could be revised to avoid the relevant SSSIs. Similarly the archaeology and historic environment constraints were mapped in GIS for the relevant sites and consideration given to revising the site boundaries to avoid the constraint.
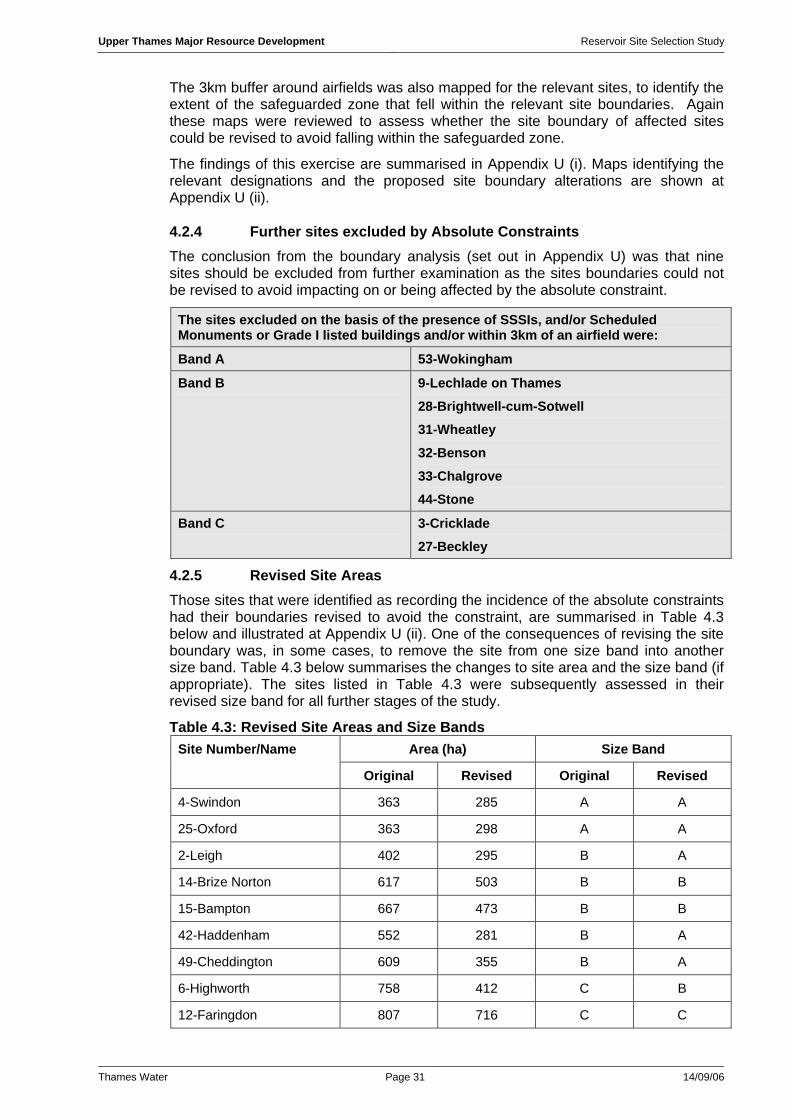
Upper Thames Major Resource Development Reservoir Site Selection Study
Thames Water Page 31 14/09/06
The 3km buffer around airfields was also mapped for the relevant sites, to identify the extent of the safeguarded zone that fell within the relevant site boundaries. Again these maps were reviewed to assess whether the site boundary of affected sites could be revised to avoid falling within the safeguarded zone.
The findings of this exercise are summarised in Appendix U (i). Maps identifying the relevant designations and the proposed site boundary alterations are shown at Appendix U (ii).
4.2.4 Further sites excluded by Absolute Constraints The conclusion from the boundary analysis (set out in Appendix U) was that nine sites should be excluded from further examination as the sites boundaries could not be revised to avoid impacting on or being affected by the absolute constraint.
The sites excluded on the basis of the presence of SSSIs, and/or Scheduled Monuments or Grade I listed buildings and/or within 3km of an airfield were:
Band A 53-Wokingham
Band B
9-Lechlade on Thames
28-Brightwell-cum-Sotwell
31-Wheatley
32-Benson
33-Chalgrove
44-Stone
Band C
3-Cricklade
27-Beckley
4.2.5 Revised Site Areas Those sites that were identified as recording the incidence of the absolute constraints had their boundaries revised to avoid the constraint, are summarised in Table 4.3 below and illustrated at Appendix U (ii). One of the consequences of revising the site boundary was, in some cases, to remove the site from one size band into another size band. Table 4.3 below summarises the changes to site area and the size band (if appropriate). The sites listed in Table 4.3 were subsequently assessed in their revised size band for all further stages of the study.
Table 4.3: Revised Site Areas and Size Bands Area (ha) Size Band Site Number/Name
Original Revised Original Revised
4-Swindon 363 285 A A
25-Oxford 363 298 A A
2-Leigh 402 295 B A
14-Brize Norton 617 503 B B
15-Bampton 667 473 B B
42-Haddenham 552 281 B A
49-Cheddington 609 355 B A
6-Highworth 758 412 C B
12-Faringdon 807 716 C C
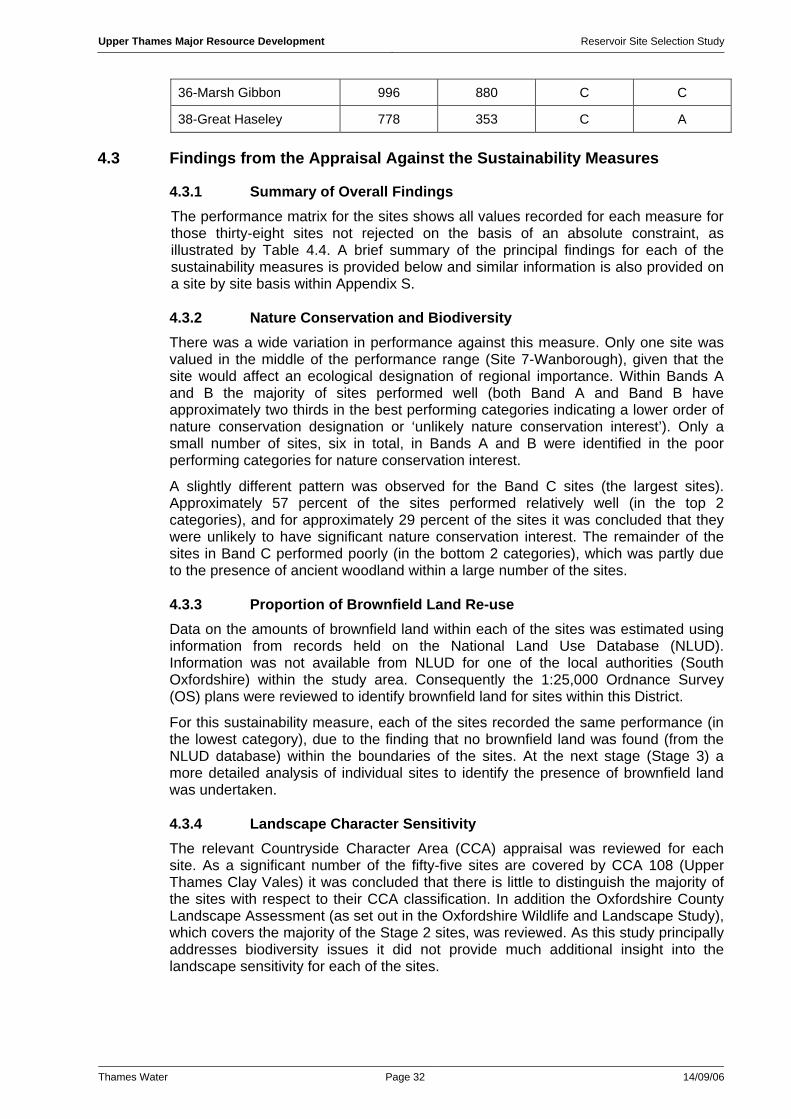
Upper Thames Major Resource Development Reservoir Site Selection Study
Thames Water Page 32 14/09/06
36-Marsh Gibbon 996 880 C C
38-Great Haseley 778 353 C A
4.3 Findings from the Appraisal Against the Sustainability Measures
4.3.1 Summary of Overall Findings The performance matrix for the sites shows all values recorded for each measure for those thirty-eight sites not rejected on the basis of an absolute constraint, as illustrated by Table 4.4. A brief summary of the principal findings for each of the sustainability measures is provided below and similar information is also provided on a site by site basis within Appendix S.
4.3.2 Nature Conservation and Biodiversity There was a wide variation in performance against this measure. Only one site was valued in the middle of the performance range (Site 7-Wanborough), given that the site would affect an ecological designation of regional importance. Within Bands A and B the majority of sites performed well (both Band A and Band B have approximately two thirds in the best performing categories indicating a lower order of nature conservation designation or ‘unlikely nature conservation interest’). Only a small number of sites, six in total, in Bands A and B were identified in the poor performing categories for nature conservation interest.
A slightly different pattern was observed for the Band C sites (the largest sites). Approximately 57 percent of the sites performed relatively well (in the top 2 categories), and for approximately 29 percent of the sites it was concluded that they were unlikely to have significant nature conservation interest. The remainder of the sites in Band C performed poorly (in the bottom 2 categories), which was partly due to the presence of ancient woodland within a large number of the sites.
4.3.3 Proportion of Brownfield Land Re-use Data on the amounts of brownfield land within each of the sites was estimated using information from records held on the National Land Use Database (NLUD). Information was not available from NLUD for one of the local authorities (South Oxfordshire) within the study area. Consequently the 1:25,000 Ordnance Survey (OS) plans were reviewed to identify brownfield land for sites within this District.
For this sustainability measure, each of the sites recorded the same performance (in the lowest category), due to the finding that no brownfield land was found (from the NLUD database) within the boundaries of the sites. At the next stage (Stage 3) a more detailed analysis of individual sites to identify the presence of brownfield land was undertaken.
4.3.4 Landscape Character Sensitivity The relevant Countryside Character Area (CCA) appraisal was reviewed for each site. As a significant number of the fifty-five sites are covered by CCA 108 (Upper Thames Clay Vales) it was concluded that there is little to distinguish the majority of the sites with respect to their CCA classification. In addition the Oxfordshire County Landscape Assessment (as set out in the Oxfordshire Wildlife and Landscape Study), which covers the majority of the Stage 2 sites, was reviewed. As this study principally addresses biodiversity issues it did not provide much additional insight into the landscape sensitivity for each of the sites.

Upper Thames Major Resource Development Reservoir Site Selection Study
Thames Water Page 33 14/09/06
Table 4.4: Performance Matrix (38 Sites) Band A 200-399 hectares
Site Number 1 2 4 7 11 19 21 25 26 30 38 40 42 49 51 54
Site Name
Min
ety
Leig
h
Swin
don
Wan
boro
ugh C
lanf
ield
Sout
h Le
igh
Stan
ton
Har
cour
t
Oxf
ord
Did
cot
Dra
yton
St.
Leon
ard
Gre
at
Has
eley
Post
com
be
Had
denh
am
Che
ddin
gto
n Burg
hfie
ld
Brac
knel
l
Site Size, hectares 300.9 295.0 285.0 289.1 356.1 262.0 396.2 298.0 391.7 302.3 353.0 198.7 281.0 355.0 346.6 258.4Nature conservation and biodiversityProportion of brownfield land re-useValue of landscape character and sensitivity to changeVisual SensitivityAgricultural land qualityFloodplain encroachmentOpportunity for construction material transportation by railDistance from intake/outfall pointProximity to safeguarded aerodromesAvailability of construction materials on site/insufficient clay for impermeable baseVariation in topographic levels across siteArchaeology and the historic environmentImpact of construction on local residentsImpact of construction traffic on local roadsImpact on existing residential propertiesImpact on existing recreation usesPeople benefiting from provision of a potential recreational resource
Band B 400-699 hectaresSite Number 6 10 14 15 16 17 18 20 23 34 35 39 43 50 52
Site Name
Hig
hwor
th
Shr
iven
ham
Briz
e N
orto
n
Bam
pton
Witn
ey
Stan
ford
in
the
Vale
Long
wor
th
Wes
t H
anne
y
Wan
tage
Bic
este
r
Cha
lgro
ve
Airp
ort
Qua
into
n
Ayl
esbu
ry
Kin
tbur
y
Bee
ch H
ill
Site Size, hectares 412.0 460.8 503.0 473.0 528.9 539.1 452.3 459.3 635.5 462.6 612.8 508.9 665.4 490.7 672.8Nature conservation and biodiversityProportion of brownfield land re-useValue of landscape character and sensitivity to changeVisual SensitivityAgricultural land qualityFloodplain encroachmentOpportunity for construction material transportation by railDistance from intake/outfall pointProximity to safeguarded aerodromesAvailability of construction materials on site/insufficient clay for impermeable baseVariation in topographic levels across siteArchaeology and the historic environmentImpact of construction on local residentsImpact of construction traffic on local roadsImpact on existing residential propertiesImpact on existing recreation usesPeople benefiting from provision of a potential recreational resource
Band C 700+ hectaresSite Number 5 8 12 22 36 37 41
Site Name
Bro
ad
Blu
nsdo
n
Bis
hops
gat
e Farin
gdon
Abi
ngdo
n
Mar
sh
Gib
bon
Ludg
ersh
all
Chi
nnor
Site Size, hectares 738.0 773.3 716.0 1403.0 880.0 703.2 763.1Nature conservation and biodiversity KEYProportion of brownfield land re-use Sustainability Measure PreferenceValue of landscape character and sensitivity to change MostVisual SensitivityAgricultural land qualityFloodplain encroachmentOpportunity for construction material transportation by rail LeastDistance from intake/outfall pointProximity to safeguarded aerodromesAvailability of construction materials on site/insufficient clay for impermeable baseVariation in topographic levels across siteArchaeology and the historic environmentImpact of construction on local residentsImpact of construction traffic on local roadsImpact on existing residential propertiesImpact on existing recreation usesPeople benefiting from provision of a potential recreational resource

Upper Thames Major Resource Development Reservoir Site Selection Study
Thames Water Page 34 14/09/06
Local Plans were reviewed to identify local landscape designations. Where the adopted local plan did not contain local landscape designation the most recent previous version of the local plan was referred to that did contain this form of designation, as follows:
• South Oxfordshire – adopted 1997; • West Oxfordshire – adopted 1997; • Cherwell – adopted 1996; • Swindon – adopted 1999; and • Basingstoke & Deane – adopted 1998.
No National Parks were located within 1km of any of the sites. Three Areas of Outstanding Natural Beauty (AONBs) were identified within proximity to some of the sites: the North Wessex Downs AONB, the Chilterns AONB, and the Cotswolds AONB.
The majority of the sites performed relatively well against this measure (being within the top 2 categories). For the Band A sites almost 60 percent of the sites were within the best performing categories and a similar result was recorded for the Band B sites. For Band C approximately 70 percent of the sites were assessed to be in the best performing categories. Similar proportions of the remaining sites were found in the worst performing categories for Bands A and B, and one site was recorded in the worst performing categories for Band C.
4.3.5 Visual Sensitivity A number of panoramic views, relating primarily to the chalk ridges in the study area, were identified, as illustrated at Appendix V. The viewpoints that were used to assess visual sensitivity are:
• Jarn Mound overlooking City of Oxford; • Ivinghoe Beacon; • Aston Hill; • Coombe Hill; • Robertson Corner (in Dunstable Country Park); • Cookham Dean (just south of the Chilterns AONB); • Barbary Castle (on the Ridgeway National Trail); • White Horse Hill; • Inkpen, Newbury; • Beacon Hill, Newbury; and • Wittenham (within the North Wessex downs AONB).
Campbell Park near Milton Keynes was measured to be more than 10km from the nearest possible site, and was therefore excluded from the assessment.
The zone of visibility was mapped from each viewpoint, based on a point of 1.7m above ground level at the viewpoint, to take into account an average viewer’s eye height. For Jarn Mound (an artificial mound) an additional 2m was added to the ground level to take into account the height of the mound from which the view is experienced.
Given that it was found that the visual impact from the viewpoints would be limited it was concluded that most of the sites performed relatively well against this measure. The exception was Site 50-Kintbury which recorded poor performance against this measure.
Upper Thames Major Resource Development Reservoir Site Selection Study
Thames Water Page 35 14/09/06
4.3.6 Agricultural Land Quality The lowest category of performance for the agricultural land quality measure was based on an assessment of a predominantly ‘high’ DEFRA prediction for a site and a second best performance was based on an assessment of a universal ‘low’ prediction. For the categories between these two extremes the performance was based on a mix of predictive conditions and a judgement was made on the quantitative balance (that is whether it tended towards the higher or the lower predictive category).
There were no sites within the best performing category (no agricultural land affected). There was a small amount of non-agricultural land at Site 35-Chalgrove Airport, although there were relatively large amounts of high quality agricultural land within the rest of this site.
Within each of the size bands approximately half of all sites were found to be in areas with medium proportions (20-60 percent) of best and most versatile agricultural land (BMVL). It was found that approximately 30 percent of sites in Band A were in the lowest performance category. None of the sites in Band C were assessed to be in the lowest performance category (more than 60 percent BMVL).
4.3.7 Floodplain Encroachment Most sites in size bands A and B were recorded as having less than 25 percent of their site areas in the 100 year floodplain (the second best performing category). For approximately 30 percent of Band A sites between 25 and 50 percent of the site area was assessed to be within a floodplain (the mid performance category). None of the Band A and B sites were assessed to be located entirely within a floodplain (the worst performance category) and only four sites (4-Swindon, 19-South Leigh, 18-Longworth and 49-Cheddington) were located entirely outside a floodplain (the best performance category).
For the Band C sites it was found that a similar proportion of sites had between 1 and 25 percent of the site in the floodplain (second best performance); and between 25 and 50 percent of the site in the floodplain (mid performance). No sites were found to be located entirely within a floodplain.
4.3.8 Opportunity for Construction Material Transportation by Rail A number of sites within each size band benefit from close proximity to a rail line. The rail lines that were considered in the assessment are:
• Swindon – Standish Junction
• Swindon – Didcot
• Didcot – Oxford
• Oxford - Bicester
• Bicester – Princes Risborough
• Aylesbury – Claydon LNE Junction
• Bletchley - Bicester
For Band A a relatively large number of the sites were assessed to fall within the best performance categories (either less than 1 km from an operational railway or between 1 and 5 km from an operational railway line). Four sites were assessed to fall within the least preferred categories (more than 5km from an operational railway – with or without 3 or more structures to cross to reach the railway lines).
In Band B almost half of the sites were assessed to fall within the best performance categories. In Band C it was found that over 70 percent of sites fall within the best performance categories.
Upper Thames Major Resource Development Reservoir Site Selection Study
Thames Water Page 36 14/09/06
4.3.9 Distance from Intake/Outfall Point Measurements were taken from each of the thirty-eight possible reservoir site centroids to points on the nearest river with sufficient flow to meet the requirement for a minimum size direct supply reservoir. The points were:
A – Confluence of the Rivers Ock and Thames;
B – Confluence of Rivers Cherwell and Thames;
C – Confluence of Rivers Thame and Thames;
D – River Thame at Wheatley;
E – River Thames at Pangbourne;
F – River Thames at Reading;
G – River Thames at Boveney; and
F – River Kennet at Theale.
A straight-line measurement was always taken to the nearest identified point. The distances measured for each site were then assessed against the sustainability measure.
The range of distances recorded for this measure ranged from 2.9km to 45.9km. The largest number of sites were recorded within the second performance category (a water transfer distance of between 5.1 and 15 km). Eleven sites were recorded within the mid performance category (a water transfer distance of 15.1 to 25 km). Four sites (Sites 1-Minety, 2-Leigh, 4-Swindon and 5-Broad Blunsdon - the western-most sites identified at Stage 1) were recorded as being situated more than 35km from an identified node (the lowest performance category). No sites were recorded as having a distance of less than 5km (the highest performance category).
4.3.10 Birdstrike Risk Three performance categories were used for this sustainability measure. The absolutes constraints exercise removed sites that were assessed to fall within 3km of an airfield. However, the principal finding was that a relatively large number of sites within each size band were assessed to be located within one or more airfield consultation zones. The majority of sites in all size bands were found to be within 15km of an airfield. A small number of sites, for all three size bands, were assessed to be located beyond the 15km aerodrome consultation zone.
4.3.11 Availability of Construction Materials on Site The availability of construction materials within the sites was assessed through estimating the thickness of the clay within the sites, based on the assumption that the clay would be used for lining and constructing the embankments for any reservoir developed on the sites. The highest level of performance was recorded for sites where it was found that the thickness of clay was greater than 20m; mid performance was for clay thickness of between 10 and 20m of clay.
The majority of sites (thirty-four) were assessed to fall within the highest performance category, while just four sites (Band A: Sites 11-Clanfield, 42-Haddenham, 51-Burghfield; and Band C: Site 8-Bishopsgate) were assessed to fall within the mid performance category. No sites were assessed to fall within the lowest performance category as these had been eliminated as an absolute constraint. Within the bands it was assessed that over 80 percent of Band A sites were assessed as falling within the best performance category and 100 percent in Band B and 85 percent in Band C.
Upper Thames Major Resource Development Reservoir Site Selection Study
Thames Water Page 37 14/09/06
4.3.12 Variation in Topographic Levels Across Site The principal finding from the topography sustainability measure assessment was that there was a broadly even distribution of performance across the performance range for all the size bands. For those sites with a greater recorded variation in topography it was assessed that there was likely to be the need to handle a greater proportion of materials within the site and potentially the need to dispose of some material off-site.
4.3.13 Archaeology and the Historic Environment It was necessary to construct a database to analyse the archaeological and historic environment data, to assist in the interpretation of data provided in different formats from a number of different sources.
It was concluded from this analysis that all the sites had archaeological or historic interest, although the extent of this interest varied significantly. In Band A, 94 percent of the sites were assessed to fall within the second lowest performance category, and one site was identified in the lowest performance category (affecting nationally important designations). For Band B just over 86 percent were assessed to fall within the second lowest performance category, with 7 percent (one sites) assessed to fall within the lowest performance category and 7 percent in the second best performance category. For Band C a similar proportion (86 percent) were estimated to fall within the second lowest performance category and the other site assessed to fall within the second best category (areas of lesser or uncertain archaeological sensitivity).
4.3.14 Impact of Construction on Local Residents The principal finding from the assessment against this sustainability measure was that the majority of sites would have potential to impact during the construction phase on populations of between 100 and 299 persons (around mid range in the performance categories). It was assessed that in the case of Band A, approximately 56 percent of sites fell within this range, approximately 75 percent for Band B, and approximately 70 percent for Band C. A small number of sites were assessed as falling within the lowest performance categories (where it was assessed that more than 300 persons in the immediate vicinity could be affected by the construction process), this related to the following sites Band A: Sites 30-Drayton St Leonard; Band B: Sites 6-Highworth and 35-Chalgrove Airport; and Band C: Site 22-Abingdon.
4.3.15 Impact of Construction Traffic on Local Roads The principal finding for this measure was that for size Bands A and B the results were fairly evenly distributed across the performance categories. It was found in Band C that the majority of sites fall in the most preferred performance category.
4.3.16 Impact on Existing Residential Properties The majority of sites fell within the good to mid performance range indicating a loss of between 1 and 10 dwellings. It was assessed that for only a small number of sites would the loss of residential properties be greater than 10 dwellings.
4.3.17 Impact on Existing Recreation Uses The principal finding for this measure was that within the majority of sites there are some local recreational facilities (principally footpaths and bridleways) that would be lost or disrupted from development of the sites. A small number of sites were assessed to fall within the least preferred performance categories (indicating that few sites contained major recreational activities – such as national trails, Forestry Commission/ National Trust sites and national cycle trails).
Upper Thames Major Resource Development Reservoir Site Selection Study
Thames Water Page 38 14/09/06
4.3.18 People Benefiting from Provision of a Potential Recreational Resource
No consistent pattern was observed for the results recorded for this sustainability measure. For Band A, the highest proportion of sites fell within the best performance categories (30,000 to 40,000 plus population within 5km). Within Band B the highest proportion of sites were assessed to fall within middle and second least performance categories, associated with populations of between 10,000 and 29,000 within 5km of the site. In Band C, the highest number of sites were assessed to fall within the most preferred performance categories (57 percent), although no sites in Band C were found to be located in areas with less than 9,999 persons within 5km.
4.4 Sites Performing Consistently Poorly The performance matrix was analysed to identify if any sites recorded poor performance over a large proportion of the seventeen sustainability measures. The findings from this exercise were that:
• Site 6-Highworth recorded ten incidences of least or second least preferred performance. Five incidences of least performance and five incidences of second least performance were recorded. Given this finding it was recommended that this site should be excluded from further examination.
• Site 50-Kintbury also recorded ten incidences of least or second least preferred performance. Three incidences of least performance and seven incidences of second least preferred performance were recorded. Given this finding it was recommended that this site should be excluded from further examination
The following sites were excluded from further examination on the basis that they were assessed to be performing consistently poorly: Band B Site 6 – Highworth
Site 50 – Kintbury
4.5 Sensitivity Analysis The sensitivity analysis was undertaken on the thirty-six remaining sites, as identified in Table 4.5, for the importance measures set out in the methodology (see section 2.4.4). Sixteen sites were in Band A, thirteen sites in Band B and seven sites in Band C.
Upper Thames Major Resource Development Reservoir Site Selection Study
Thames Water Page 39 14/09/06
Table 4.5: Stage 2 Sensitivity Analysis Sites Site Band Site Number/Name
A 1-Minety
2-Leigh
4-Swindon
7-Wanborough
11-Clanfield
19-South Leigh
21-Stanton Harcourt
25-Oxford
26-Didcot
30-Drayton St Leonard
38-Great Haseley
40- Postcombe
42-Haddenham
49-Cheddington
51-Burghfield
54-Bracknell
B 10-Shrivenham
14-Brize Norton
15-Bampton
16-Witney
17-Stanford in the Vale
18-Longworth
20-West Hanney
23-Wantage
34-Bicester
35-Chalgrove Airport
39-Quainton
43-Aylesbury
52-Beech Hill
C 5-Broad Blunsdon
8-Bishopsgate
12-Faringdon
22-Abingdon
36-Marsh Gibbon
37-Ludgershall
41-Chinnor
A sensitivity analysis matrix (Table 4.6) was prepared to allow for comparison of the findings for the very high and high importance sustainability measures. It was important to ensure that the sites were assessed within their relevant size bands to ensure that like was compared with like.
The following sections set out a summary of the sensitivity analysis findings and the recommendations on which sites should be excluded from further examination.
4.5.1 Band A (200-399 hectares) Sites 40-Postcombe and 54-Bracknell also performed strongly when compared to other sites in Band A against the importance measures. Only one negative performance was recorded for each site for the sensitivity tests. For Site 40-Postcombe it was due to the presence of archaeological features within the site, including one site of likely high archaeological sensitivity. For Site 54-Bracknell it was due to the presence of a Grade II listed building within the site. These features were not considered to be of sufficient significance to outweigh the otherwise good performance for these sites. It was therefore recommended that Postcombe and Bracknell should be taken forward to Stage 3 for further assessment.
Site 25-Oxford recorded the poorest performance against the importance measures for a number of the sensitivity tests. It was therefore recommended that this site should be excluded from further examination.

Upper Thames Major Resource Development Reservoir Site Selection Study
Thames Water Page 40 14/09/06
Table 4.6: Sensitivity Matrix
BAND A 200-399 hectares
Site Number 1 2 4 7 11 19 21 25 26 30 38 40 42 49 51 54
Site Name
Min
ety
Leig
h
Sw
indo
n
Wan
boro
ugh
Cla
nfie
ld
Sou
th L
eigh
Stan
ton
Har
cour
t
Oxf
ord
Did
cot
Dra
yton
St.
Leon
ard
Gre
at
Has
eley
Pos
tcom
be
Had
denh
am
Che
ddin
gton
Burg
hfie
ld
Bra
ckne
ll
Site Size, hectares 300.9 295.0 285.0 289.0 356 262.0 396.0 298.0 392.0 302.0 353.0 199.0 281.0 355.0 347.0 258.01&2 values for very high and high importance measures
1&2 values for very high importance measures
1&2 values for high importance measures
-1 & -2 values for very high and high importance measures
-1 & -2 values for very high importance measures
-1 & -2 values for high importance measures
BAND B 400-699 hectaresSite Number 10 14 15 16 17 18 20 23 34 35 39 43 52
Site Name Shr
iven
ham
Briz
e N
orto
n
Bam
pton
Witn
ey
Stan
ford
in
the
Vale
Long
wor
th
Wes
t H
anne
y
Wan
tage
Bice
ster
Cha
lgro
ve
Airp
ort
Qua
into
n
Ayl
esbu
ry
Beec
h H
ill
Site Size, hectares 461.0 503.0 473.0 529.0 539.0 452.0 459.0 636.0 463.0 613.0 509.0 665.0 673.01&2 values for very high and high importance measures
1&2 values for very high importance measures
1&2 values for high importance measures
-1 & -2 values for very high and high importance measures
-1 & -2 values for very high importance measures
-1 & -2 values for high importance measures
BAND C 700+ hectaresSite Number 5 8 12 22 36 37 41
Site Name
Bro
ad
Blun
sdon
Bish
opsg
ate
Farr
ingd
on
Abin
gdon
Mar
sh
Gib
bon
Ludg
ersh
all
Chi
nnor
Site Size, hectares 738.0 773.0 716.0 1403.0 880.0 703.0 763.0 KEY Sustainability Measure Preference1&2 values for very high and high importance measures Most1&2 values for very high importance measures
1&2 values for high importance measures
-1 & -2 values for very high and high importance measures
-1 & -2 values for very high importance measures Least-1 & -2 values for high importance measures

Upper Thames Major Resource Development Reservoir Site Selection Study
Thames Water Page 41 14/09/06
Site 7- Wanborough also performed poorly against the importance measures. This was due principally to the assessment of the potential impact of this site on landscape character, as well as the distance from intake/outfall. The site was also assessed to impact on an area of likely high archaeological sensitivity. It was therefore recommended that the site should be excluded from further examination.
Sites 1-Minety, 4-Swindon and 26-Didcot performed relatively poorly against the importance measures compared to other sites in Band A. Didcot was the only site within Band A to record a very poor performance against the landscape character sensitivity measure and Swindon and Minety were the only sites in Band A with a very poor performance against the distance to intake/outfall measure. It was therefore recommended that these sites should be excluded from further examination.
Site 2-Leigh performed poorly against most of the importance measures. The site was assessed to be more than 35km from an intake/outfall point and contained one site of likely high archaeological importance. It was therefore recommended that the site should be excluded from further examination.
Although Site 30-Drayton St Leonard performed relatively well against a number of the importance measures, it recorded the poorest value within Band A against the impact of construction on residential properties measure. This reflects the site’s location close to Berinsfield where it was assessed that potentially over 400 people (the least preferred category) could be affected by the noise, dust and other impacts arising from the construction process. It was therefore recommended that the site should be excluded from further examination.
Site 51-Burghfield performed relatively poorly against the importance measures and was found to perform particularly badly against the archaeology and historic environment measure (the site contained a very high number of areas of archaeological sensitivity). It was therefore recommended that the site should be excluded from further examination.
Site 19-South Leigh performed relatively well in respect of some of the importance measures. However it was assessed that the site did include an area of ancient woodland which would be impossible to replace during the lifetime of the project. A number of archaeological and heritage constraints were also identified within the site, including one Grade II listed building and five sites of likely high archaeological sensitivity. It was therefore recommended that the site should be excluded from further examination.
Site 21-Stanton Harcourt, performed poorly against the importance measures. It was also the only remaining site in Band A where more than 50 percent of the site was in the floodplain. It was also assessed that the site contained seven sites of likely high archaeological sensitivity. It was therefore recommended that the site should be excluded from further examination.
Site 42-Haddenham and Site 11-Clanfield also did not perform well against the importance measures and it was recommended that these sites should be excluded from further examination.
Site 49-Cheddington did not perform particularly well when compared to other sites in Band A. It was assessed that the site was more than 25km from an intake/outfall point and contained a number of archaeological and heritage features. It was therefore recommended that the site should be excluded from further examination.
Site 38-Great Haseley performed relatively poorly against the importance measures when compared to other sites in Band A. The site contained ancient woodland, a number of archaeological features and was in close proximity to Chalgrove airfield. It was therefore recommended that the site should be excluded from further examination.
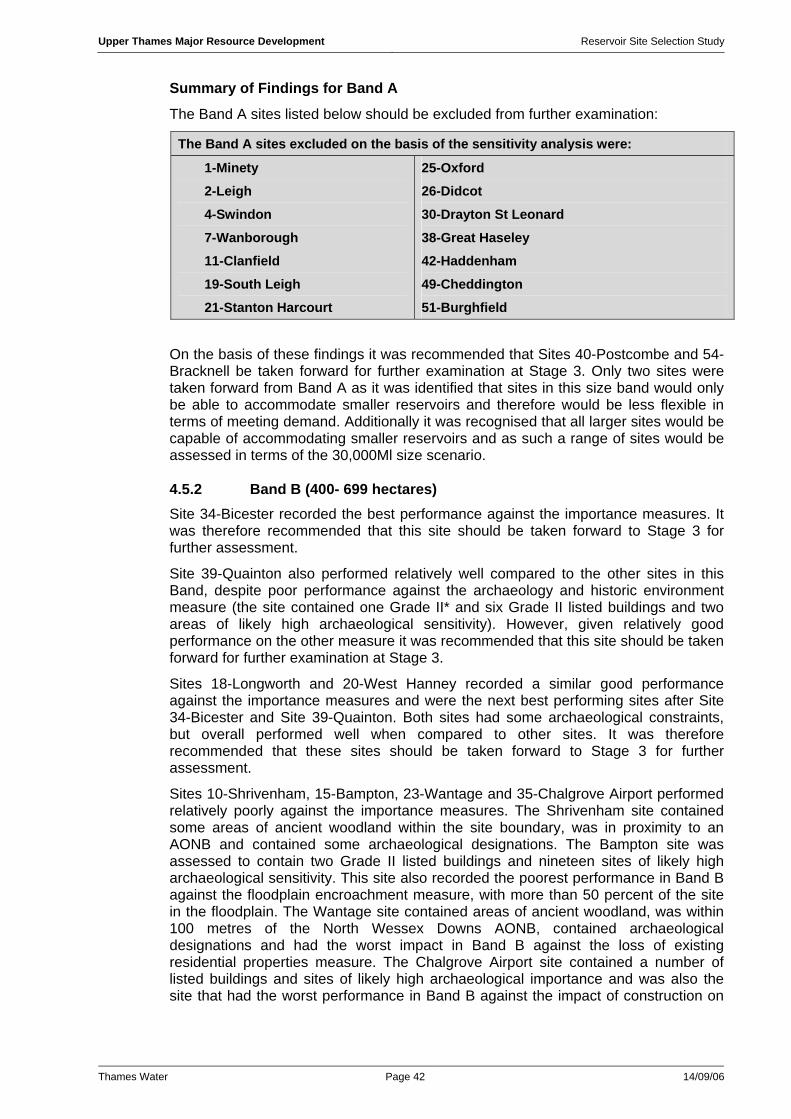
Upper Thames Major Resource Development Reservoir Site Selection Study
Thames Water Page 42 14/09/06
Summary of Findings for Band A
The Band A sites listed below should be excluded from further examination:
The Band A sites excluded on the basis of the sensitivity analysis were:
1-Minety
2-Leigh
4-Swindon
7-Wanborough
11-Clanfield
19-South Leigh
21-Stanton Harcourt
25-Oxford
26-Didcot
30-Drayton St Leonard
38-Great Haseley
42-Haddenham
49-Cheddington
51-Burghfield
On the basis of these findings it was recommended that Sites 40-Postcombe and 54-Bracknell be taken forward for further examination at Stage 3. Only two sites were taken forward from Band A as it was identified that sites in this size band would only be able to accommodate smaller reservoirs and therefore would be less flexible in terms of meeting demand. Additionally it was recognised that all larger sites would be capable of accommodating smaller reservoirs and as such a range of sites would be assessed in terms of the 30,000Ml size scenario.
4.5.2 Band B (400- 699 hectares) Site 34-Bicester recorded the best performance against the importance measures. It was therefore recommended that this site should be taken forward to Stage 3 for further assessment.
Site 39-Quainton also performed relatively well compared to the other sites in this Band, despite poor performance against the archaeology and historic environment measure (the site contained one Grade II* and six Grade II listed buildings and two areas of likely high archaeological sensitivity). However, given relatively good performance on the other measure it was recommended that this site should be taken forward for further examination at Stage 3.
Sites 18-Longworth and 20-West Hanney recorded a similar good performance against the importance measures and were the next best performing sites after Site 34-Bicester and Site 39-Quainton. Both sites had some archaeological constraints, but overall performed well when compared to other sites. It was therefore recommended that these sites should be taken forward to Stage 3 for further assessment.
Sites 10-Shrivenham, 15-Bampton, 23-Wantage and 35-Chalgrove Airport performed relatively poorly against the importance measures. The Shrivenham site contained some areas of ancient woodland within the site boundary, was in proximity to an AONB and contained some archaeological designations. The Bampton site was assessed to contain two Grade II listed buildings and nineteen sites of likely high archaeological sensitivity. This site also recorded the poorest performance in Band B against the floodplain encroachment measure, with more than 50 percent of the site in the floodplain. The Wantage site contained areas of ancient woodland, was within 100 metres of the North Wessex Downs AONB, contained archaeological designations and had the worst impact in Band B against the loss of existing residential properties measure. The Chalgrove Airport site contained a number of listed buildings and sites of likely high archaeological importance and was also the site that had the worst performance in Band B against the impact of construction on
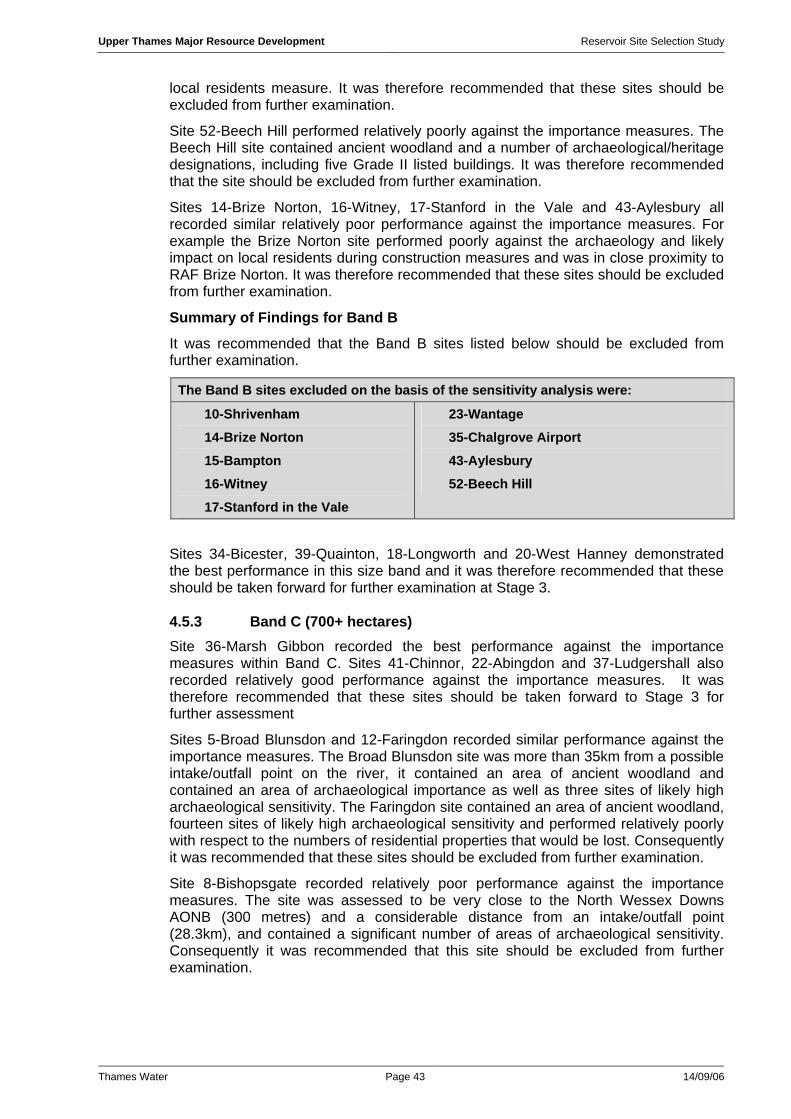
Upper Thames Major Resource Development Reservoir Site Selection Study
Thames Water Page 43 14/09/06
local residents measure. It was therefore recommended that these sites should be excluded from further examination.
Site 52-Beech Hill performed relatively poorly against the importance measures. The Beech Hill site contained ancient woodland and a number of archaeological/heritage designations, including five Grade II listed buildings. It was therefore recommended that the site should be excluded from further examination.
Sites 14-Brize Norton, 16-Witney, 17-Stanford in the Vale and 43-Aylesbury all recorded similar relatively poor performance against the importance measures. For example the Brize Norton site performed poorly against the archaeology and likely impact on local residents during construction measures and was in close proximity to RAF Brize Norton. It was therefore recommended that these sites should be excluded from further examination.
Summary of Findings for Band B
It was recommended that the Band B sites listed below should be excluded from further examination.
The Band B sites excluded on the basis of the sensitivity analysis were:
10-Shrivenham
14-Brize Norton
15-Bampton
16-Witney
17-Stanford in the Vale
23-Wantage
35-Chalgrove Airport
43-Aylesbury
52-Beech Hill
Sites 34-Bicester, 39-Quainton, 18-Longworth and 20-West Hanney demonstrated the best performance in this size band and it was therefore recommended that these should be taken forward for further examination at Stage 3.
4.5.3 Band C (700+ hectares) Site 36-Marsh Gibbon recorded the best performance against the importance measures within Band C. Sites 41-Chinnor, 22-Abingdon and 37-Ludgershall also recorded relatively good performance against the importance measures. It was therefore recommended that these sites should be taken forward to Stage 3 for further assessment
Sites 5-Broad Blunsdon and 12-Faringdon recorded similar performance against the importance measures. The Broad Blunsdon site was more than 35km from a possible intake/outfall point on the river, it contained an area of ancient woodland and contained an area of archaeological importance as well as three sites of likely high archaeological sensitivity. The Faringdon site contained an area of ancient woodland, fourteen sites of likely high archaeological sensitivity and performed relatively poorly with respect to the numbers of residential properties that would be lost. Consequently it was recommended that these sites should be excluded from further examination.
Site 8-Bishopsgate recorded relatively poor performance against the importance measures. The site was assessed to be very close to the North Wessex Downs AONB (300 metres) and a considerable distance from an intake/outfall point (28.3km), and contained a significant number of areas of archaeological sensitivity. Consequently it was recommended that this site should be excluded from further examination.
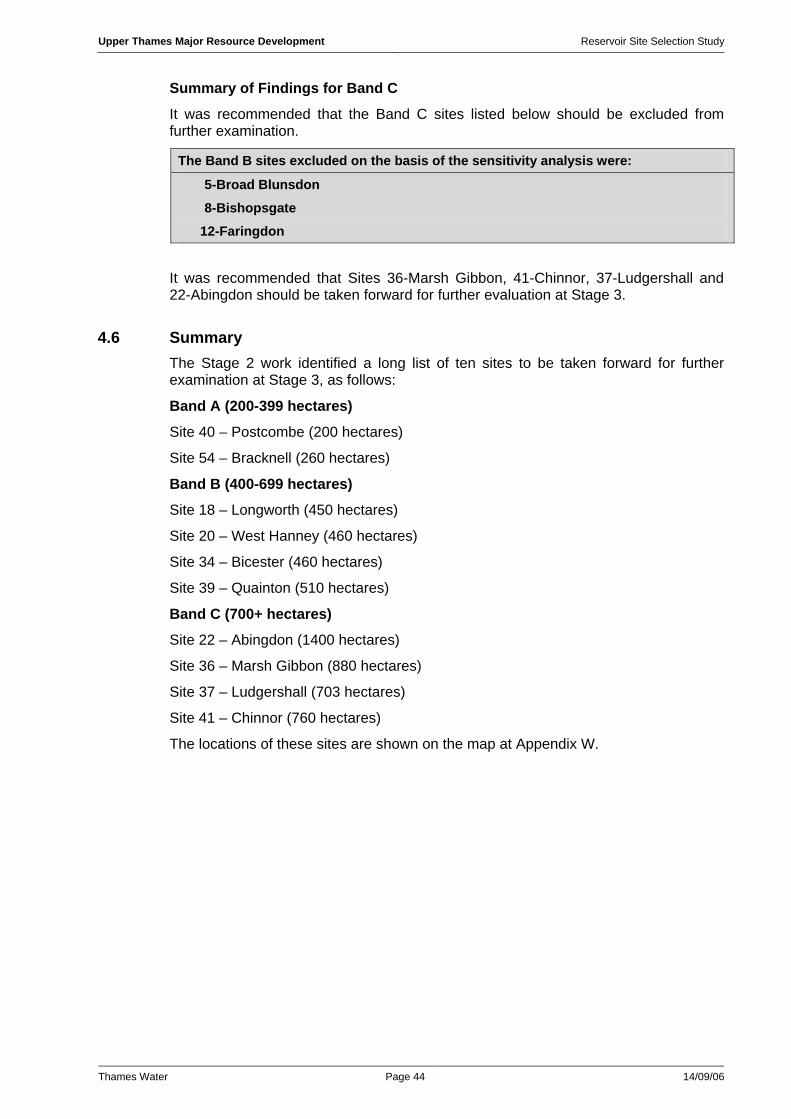
Upper Thames Major Resource Development Reservoir Site Selection Study
Thames Water Page 44 14/09/06
Summary of Findings for Band C
It was recommended that the Band C sites listed below should be excluded from further examination.
The Band B sites excluded on the basis of the sensitivity analysis were:
5-Broad Blunsdon
8-Bishopsgate
12-Faringdon
It was recommended that Sites 36-Marsh Gibbon, 41-Chinnor, 37-Ludgershall and 22-Abingdon should be taken forward for further evaluation at Stage 3.
4.6 Summary The Stage 2 work identified a long list of ten sites to be taken forward for further examination at Stage 3, as follows:
Band A (200-399 hectares)
Site 40 – Postcombe (200 hectares)
Site 54 – Bracknell (260 hectares)
Band B (400-699 hectares)
Site 18 – Longworth (450 hectares)
Site 20 – West Hanney (460 hectares)
Site 34 – Bicester (460 hectares)
Site 39 – Quainton (510 hectares)
Band C (700+ hectares)
Site 22 – Abingdon (1400 hectares)
Site 36 – Marsh Gibbon (880 hectares)
Site 37 – Ludgershall (703 hectares)
Site 41 – Chinnor (760 hectares)
The locations of these sites are shown on the map at Appendix W.
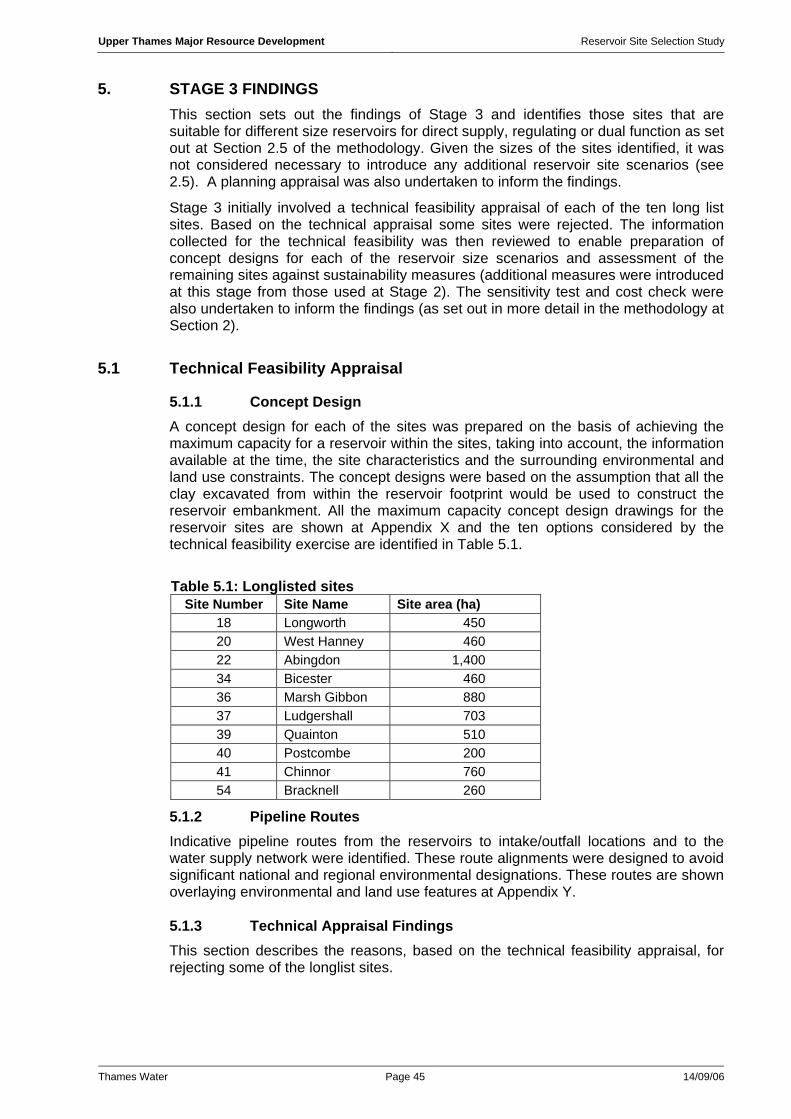
Upper Thames Major Resource Development Reservoir Site Selection Study
Thames Water Page 45 14/09/06
5. STAGE 3 FINDINGS This section sets out the findings of Stage 3 and identifies those sites that are suitable for different size reservoirs for direct supply, regulating or dual function as set out at Section 2.5 of the methodology. Given the sizes of the sites identified, it was not considered necessary to introduce any additional reservoir site scenarios (see 2.5). A planning appraisal was also undertaken to inform the findings.
Stage 3 initially involved a technical feasibility appraisal of each of the ten long list sites. Based on the technical appraisal some sites were rejected. The information collected for the technical feasibility was then reviewed to enable preparation of concept designs for each of the reservoir size scenarios and assessment of the remaining sites against sustainability measures (additional measures were introduced at this stage from those used at Stage 2). The sensitivity test and cost check were also undertaken to inform the findings (as set out in more detail in the methodology at Section 2).
5.1 Technical Feasibility Appraisal
5.1.1 Concept Design A concept design for each of the sites was prepared on the basis of achieving the maximum capacity for a reservoir within the sites, taking into account, the information available at the time, the site characteristics and the surrounding environmental and land use constraints. The concept designs were based on the assumption that all the clay excavated from within the reservoir footprint would be used to construct the reservoir embankment. All the maximum capacity concept design drawings for the reservoir sites are shown at Appendix X and the ten options considered by the technical feasibility exercise are identified in Table 5.1.
Table 5.1: Longlisted sites Site Number Site Name Site area (ha)
18 Longworth 450 20 West Hanney 460 22 Abingdon 1,400 34 Bicester 460 36 Marsh Gibbon 880 37 Ludgershall 703 39 Quainton 510 40 Postcombe 200 41 Chinnor 760 54 Bracknell 260
5.1.2 Pipeline Routes Indicative pipeline routes from the reservoirs to intake/outfall locations and to the water supply network were identified. These route alignments were designed to avoid significant national and regional environmental designations. These routes are shown overlaying environmental and land use features at Appendix Y.
5.1.3 Technical Appraisal Findings This section describes the reasons, based on the technical feasibility appraisal, for rejecting some of the longlist sites.
Upper Thames Major Resource Development Reservoir Site Selection Study
Thames Water Page 46 14/09/06
5.1.3.1 Geological Suitability The geological suitability of each site was assessed to determine whether the sites would be sufficiently water-tight for a reservoir. At Stage 3 more detailed geological maps were reviewed, which provided more information for each site when compared to that data used at Stage 1. Permeable geology would not be suitable for the construction of a reservoir as it would not provide a watertight base on which to construct it. Although it might be technically feasible to construct a reservoir on permeable strata, it would require engineering solutions to be tested, at a scale that has not been undertaken previously (further explanation is provided at section 2.3.1(ii) of the Methodology). The assessment found that the geology at West Hanney and Bicester would not be suitable as it could not guarantee water-tight conditions for a reservoir.
Site 20-West Hanney
Given the adverse geological conditions at West Hanney it was concluded that without using an artificial lining, the maximum useful storage volume that could potentially be provided within a water-tight reservoir would be around 1,600Ml. The potential impact on groundwater/hydrology and the engineering complexities, and consequential prohibitive costs of providing an artificial lining were assessed to be significant for a reservoir larger than 1,600Ml on this site. It was concluded that a smaller reservoir (of 1,600Ml) would be too small to provide either a useful regulating or direct supply function. A further finding of the geological assessment was that there was very limited availability of clay material for construction of an embankment within the West Hanney site and therefore considerable clay would have to be imported in order to construct a reservoir on this site. For these reasons the West Hanney site was rejected and was not taken forward to the next stage of analysis.
Site 34-Bicester
It was concluded that severe leakage would be expected at the Bicester site, without using an artificial lining. The potential impact on groundwater/hydrology and the engineering complexities, and consequential prohibitive costs of providing an artificial lining were assessed to be significant. In addition it was also found that there was very limited clay material available for the construction of an embankment within the Bicester site and considerable clay material would need to be imported in order to construct a reservoir. It was concluded that a smaller reservoir was not feasible for the same reasons. For these reasons the Bicester site was rejected and not taken forward to the next stage of analysis.
More details are provided on the geological conditions of these two sites at Appendix X.
Sites excluded on the basis of unsuitable geology at Stage 3 were:
20-West Hanney
34-Bicester
5.1.3.2 Surface Drainage and Flood Impact It was found that most of the sites would impact on flood plains (to varying degrees). This was not considered to be a sufficient reason for rejecting any of the sites, as in all cases it was concluded that it would be feasible to provide drainage solutions and suitable compensation for the loss of any flood plain.
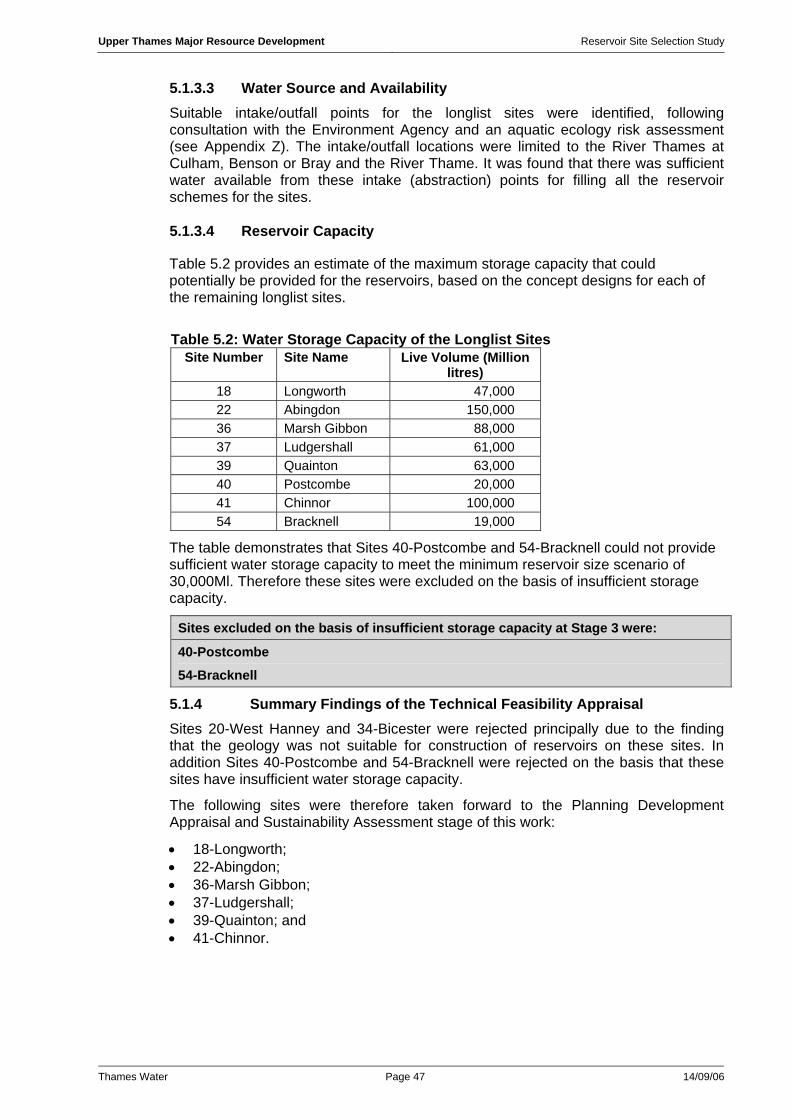
Upper Thames Major Resource Development Reservoir Site Selection Study
Thames Water Page 47 14/09/06
5.1.3.3 Water Source and Availability Suitable intake/outfall points for the longlist sites were identified, following consultation with the Environment Agency and an aquatic ecology risk assessment (see Appendix Z). The intake/outfall locations were limited to the River Thames at Culham, Benson or Bray and the River Thame. It was found that there was sufficient water available from these intake (abstraction) points for filling all the reservoir schemes for the sites.
5.1.3.4 Reservoir Capacity
Table 5.2 provides an estimate of the maximum storage capacity that could potentially be provided for the reservoirs, based on the concept designs for each of the remaining longlist sites.
Table 5.2: Water Storage Capacity of the Longlist Sites Site Number Site Name Live Volume (Million
litres) 18 Longworth 47,000 22 Abingdon 150,000 36 Marsh Gibbon 88,000 37 Ludgershall 61,000 39 Quainton 63,000 40 Postcombe 20,000 41 Chinnor 100,000 54 Bracknell 19,000
The table demonstrates that Sites 40-Postcombe and 54-Bracknell could not provide sufficient water storage capacity to meet the minimum reservoir size scenario of 30,000Ml. Therefore these sites were excluded on the basis of insufficient storage capacity.
Sites excluded on the basis of insufficient storage capacity at Stage 3 were:
40-Postcombe
54-Bracknell
5.1.4 Summary Findings of the Technical Feasibility Appraisal Sites 20-West Hanney and 34-Bicester were rejected principally due to the finding that the geology was not suitable for construction of reservoirs on these sites. In addition Sites 40-Postcombe and 54-Bracknell were rejected on the basis that these sites have insufficient water storage capacity.
The following sites were therefore taken forward to the Planning Development Appraisal and Sustainability Assessment stage of this work:
• 18-Longworth; • 22-Abingdon; • 36-Marsh Gibbon; • 37-Ludgershall; • 39-Quainton; and • 41-Chinnor.
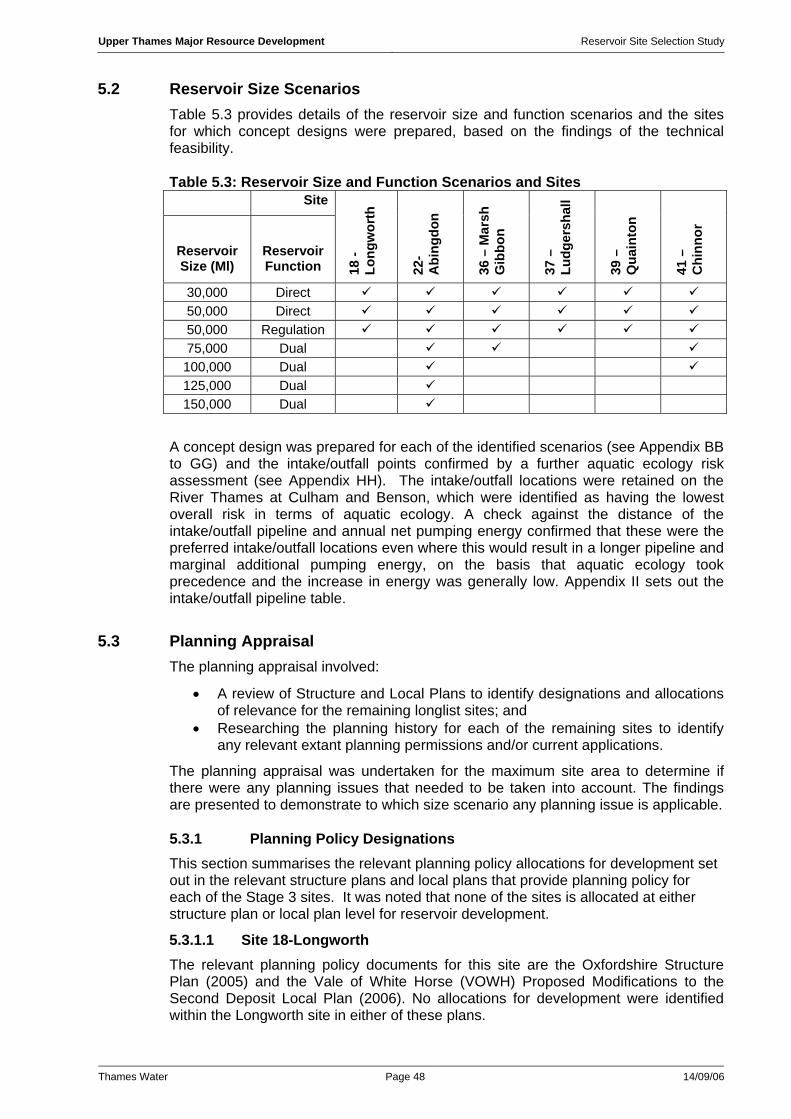
Upper Thames Major Resource Development Reservoir Site Selection Study
Thames Water Page 48 14/09/06
5.2 Reservoir Size Scenarios Table 5.3 provides details of the reservoir size and function scenarios and the sites for which concept designs were prepared, based on the findings of the technical feasibility.
Table 5.3: Reservoir Size and Function Scenarios and Sites Site
Reservoir Size (Ml)
Reservoir Function 18
- Lo
ngw
orth
22-
Abi
ngdo
n
36 –
Mar
sh
Gib
bon
37 –
Lu
dger
shal
l
39 –
Q
uain
ton
41 –
C
hinn
or
30,000 Direct 50,000 Direct 50,000 Regulation 75,000 Dual 100,000 Dual 125,000 Dual 150,000 Dual
A concept design was prepared for each of the identified scenarios (see Appendix BB to GG) and the intake/outfall points confirmed by a further aquatic ecology risk assessment (see Appendix HH). The intake/outfall locations were retained on the River Thames at Culham and Benson, which were identified as having the lowest overall risk in terms of aquatic ecology. A check against the distance of the intake/outfall pipeline and annual net pumping energy confirmed that these were the preferred intake/outfall locations even where this would result in a longer pipeline and marginal additional pumping energy, on the basis that aquatic ecology took precedence and the increase in energy was generally low. Appendix II sets out the intake/outfall pipeline table.
5.3 Planning Appraisal The planning appraisal involved:
• A review of Structure and Local Plans to identify designations and allocations of relevance for the remaining longlist sites; and
• Researching the planning history for each of the remaining sites to identify any relevant extant planning permissions and/or current applications.
The planning appraisal was undertaken for the maximum site area to determine if there were any planning issues that needed to be taken into account. The findings are presented to demonstrate to which size scenario any planning issue is applicable.
5.3.1 Planning Policy Designations This section summarises the relevant planning policy allocations for development set out in the relevant structure plans and local plans that provide planning policy for each of the Stage 3 sites. It was noted that none of the sites is allocated at either structure plan or local plan level for reservoir development.
5.3.1.1 Site 18-Longworth The relevant planning policy documents for this site are the Oxfordshire Structure Plan (2005) and the Vale of White Horse (VOWH) Proposed Modifications to the Second Deposit Local Plan (2006). No allocations for development were identified within the Longworth site in either of these plans.

Upper Thames Major Resource Development Reservoir Site Selection Study
Thames Water Page 49 14/09/06
Nevertheless the VOWH Local Plan (2006) shows that the site at Longworth falls within the North Vale Corallian Ridge, protected by Local Plan Policy NE7. This states that:
‘Development which would harm the prevailing character and appearance of the North Vale Corallian Ridge, as shown on the proposals map, will not be permitted unless there is an overriding need for the development and all steps will be taken to minimise the impact on the landscape.’
This designation affects each of the reservoir size scenarios for Site 18-Longworth.
The need to protect local landscape character is reaffirmed in the Oxfordshire Structure Plan Policy EN4. This policy designation was taken account of as part of the landscape sustainability measure assessment.
5.3.1.2 Site 22-Abingdon The relevant planning policy documents for this site are the Oxfordshire Structure Plan (2005) and the VOWH Proposed Modifications to the Second Deposit Local Plan (2006).
No allocations for development were identified at the Abingdon site in either the Oxfordshire Structure Plan (2005) or the VOWH Proposed Modifications to the Second Deposit Local Plan (2006).
The Structure Plan Policy R4 seeks to safeguard and protect canals and waterways. It states that:
‘The historic route of the Wilts and Berks Canal and appropriate alternative routes where this not possible will be safeguarded with a view to its long-term re-establishment as a navigable waterway. Proposals for development which will adversely affect the character or setting of these canal corridors will not be permitted’.
The following policy designations were identified in the Local Plan.
The line of the Wiltshire and Berkshire Canal crosses the site south west to north east. Policy L13 of the VOWH Local Plan states that:
‘Development which would cause demonstrable harm to the essential character of the Wilts and Berks Canal or to its setting, or would be likely to prevent or impair the restoration of the Canal, or would result in the loss of any buildings, locks or other structures associated with the original waterway function of the canal will not be permitted.
‘Development on or close to the route of the canal will be required to facilitate development of its recreational potential and/or protect its nature conservation and heritage value.
‘Development that would prevent the restoration of the canal on its historic alignment as shown on the proposals map will only be permitted if arrangements for the reinstatement of the canal on a viable alternative route can be secured by the developer.’
This designation affects each of the reservoir size scenarios for Site 22-Abingdon.
Steventon Storage Facility (former Home Office stores site) is located to the south of the site. Local Plan Policy E16 states:
‘At Steventon Storage Facility, proposals for new buildings, increases in overall floorspace or changes of use will not be permitted. The council will seek the complete cessation of business uses and clearance and restoration of the site.’
Upper Thames Major Resource Development Reservoir Site Selection Study
Thames Water Page 50 14/09/06
With the exception of the 30,000Ml scenario this designation affects each of the reservoir size scenarios for Site 22-Abingdon.
The eastern edge of the site falls within a locally designated Area for Landscape Enhancement. Policy NE11 states:
‘Proposals for development within or affecting areas of damaged or compromised landscape, in particular those areas defined for landscape enhancement on the proposals maps, must provide a landscaping scheme which enhances the appearance of the area. Development which would further erode or damage the character of the landscape will not be permitted.’
This designation affects each of the reservoir size scenarios for Site 22-Abingdon.
In addition an Area of Ancient Woodland, protected by Policy NE4, is identified on the proposals map of the VOWH Local Plan to the south of the site but outside the Abingdon site boundaries.
5.3.1.3 Sites 36-Marsh Gibbon and 37-Ludgershall The Structure Plan and Local Plans for the above sites are the Buckinghamshire Structure Plan (1996), the Oxfordshire Structure Plan (2005), the Aylesbury Vale Local Plan (2004) and the Cherwell Local Plan (2004). A review of these documents identified no relevant policy designations or allocations for development.
5.3.1.4 Site 39-Quainton The relevant planning policy documents for this site are the Buckinghamshire Structure Plan (1996) and the Aylesbury Vale Local Plan (2004). A review of these plans identified no relevant policy designations or allocations for development.
5.3.1.5 Site 41-Chinnor The relevant planning policy documents for this site are the Buckinghamshire Structure Plan (1996), the Oxfordshire Structure Plan (2005), the Aylesbury Vale Local Plan (2004), the Draft South Oxfordshire Local Plan (2003) and the Wycombe Local Plan (2004). No relevant policy designations or allocations for development were identified from these plans.
5.3.2 Planning History No major extant planning permissions or current planning applications of relevance were identified for the remaining longlist of sites. For reference the findings from the assessment of the planning history for each site is set out at Appendix AA.
5.3.3 Summary No Structure Plan or Local Plan allocations for development were identified from the planning and development appraisal. In addition the planning history search identified no significant extant permissions or current applications which would significantly compromise reservoir development at any of the remaining longlist sites.
The review of Structure and Local Plans did identify some important environmental designations that are taken into account in the sustainability measures used at Stages 2 and 3 of the study.
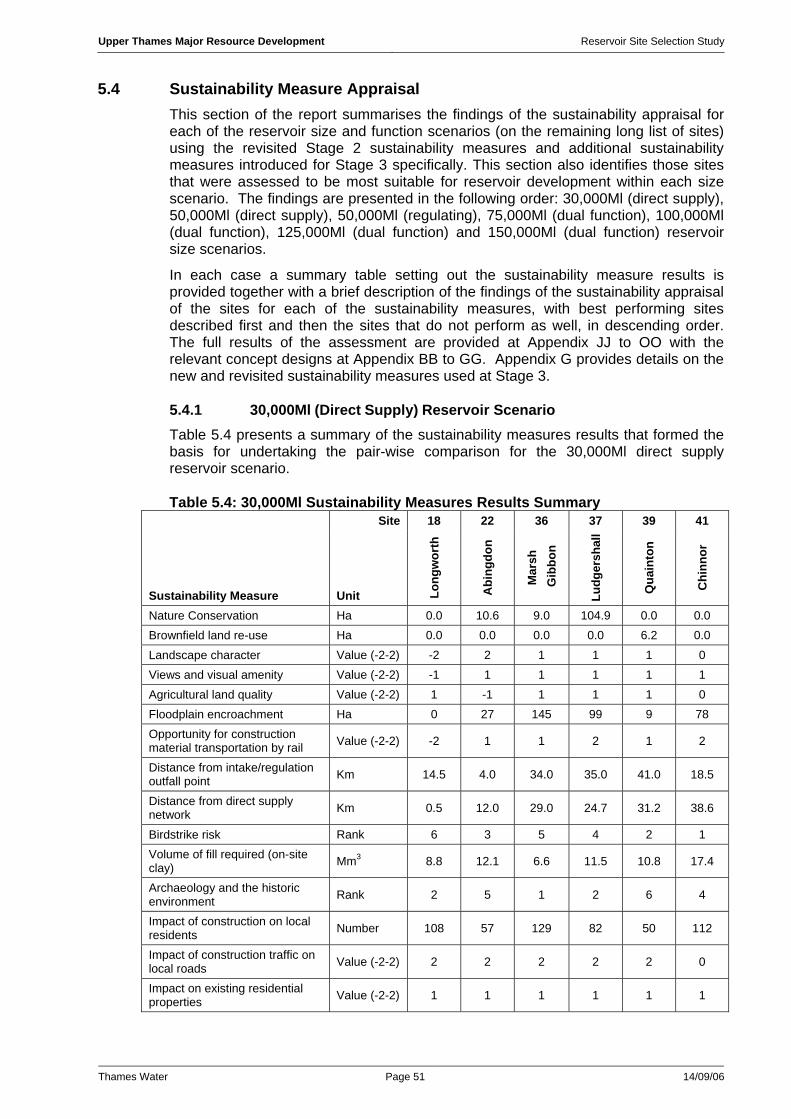
Upper Thames Major Resource Development Reservoir Site Selection Study
Thames Water Page 51 14/09/06
5.4 Sustainability Measure Appraisal This section of the report summarises the findings of the sustainability appraisal for each of the reservoir size and function scenarios (on the remaining long list of sites) using the revisited Stage 2 sustainability measures and additional sustainability measures introduced for Stage 3 specifically. This section also identifies those sites that were assessed to be most suitable for reservoir development within each size scenario. The findings are presented in the following order: 30,000Ml (direct supply), 50,000Ml (direct supply), 50,000Ml (regulating), 75,000Ml (dual function), 100,000Ml (dual function), 125,000Ml (dual function) and 150,000Ml (dual function) reservoir size scenarios.
In each case a summary table setting out the sustainability measure results is provided together with a brief description of the findings of the sustainability appraisal of the sites for each of the sustainability measures, with best performing sites described first and then the sites that do not perform as well, in descending order. The full results of the assessment are provided at Appendix JJ to OO with the relevant concept designs at Appendix BB to GG. Appendix G provides details on the new and revisited sustainability measures used at Stage 3.
5.4.1 30,000Ml (Direct Supply) Reservoir Scenario
Table 5.4 presents a summary of the sustainability measures results that formed the basis for undertaking the pair-wise comparison for the 30,000Ml direct supply reservoir scenario.
Table 5.4: 30,000Ml Sustainability Measures Results Summary Site 18 22 36 37 39 41
Sustainability Measure Unit Long
wor
th
Abi
ngdo
n
Mar
sh
Gib
bon
Ludg
ersh
all
Qua
into
n
Chi
nnor
Nature Conservation Ha 0.0 10.6 9.0 104.9 0.0 0.0 Brownfield land re-use Ha 0.0 0.0 0.0 0.0 6.2 0.0 Landscape character Value (-2-2) -2 2 1 1 1 0 Views and visual amenity Value (-2-2) -1 1 1 1 1 1 Agricultural land quality Value (-2-2) 1 -1 1 1 1 0 Floodplain encroachment Ha 0 27 145 99 9 78 Opportunity for construction material transportation by rail Value (-2-2) -2 1 1 2 1 2
Distance from intake/regulation outfall point Km 14.5 4.0 34.0 35.0 41.0 18.5
Distance from direct supply network Km 0.5 12.0 29.0 24.7 31.2 38.6
Birdstrike risk Rank 6 3 5 4 2 1 Volume of fill required (on-site clay) Mm3 8.8 12.1 6.6 11.5 10.8 17.4
Archaeology and the historic environment Rank 2 5 1 2 6 4
Impact of construction on local residents Number 108 57 129 82 50 112
Impact of construction traffic on local roads Value (-2-2) 2 2 2 2 2 0
Impact on existing residential properties Value (-2-2) 1 1 1 1 1 1

Upper Thames Major Resource Development Reservoir Site Selection Study
Thames Water Page 52 14/09/06
Impact on existing recreation uses Number 1 3 0 3 5 6
People benefiting from provision of significant recreational resource
Number 7,905 28,100 7,074 8,255 6,414 32,024
Opportunity for biodiversity improvement Value (-2-2) 1 0 1 1 1 1
Need for imported sand and gravel for construction on site
Million tonnes 1.10 1.50 0.80 1.50 1.40 2.20
Loss of employment Number 0 0 0 0 26 0
Opportunity for on-site mitigation Percentage of site 59% 91% 83% 79% 81% 87%
Annual net pumping energy/total yield MWh/Ml 0.24 0.24 0.28 0.31 0.33 0.31
5.4.1.1 Findings from the Sustainability Appraisal This section first provides a summary of the findings of the sustainability appraisal pair-wise comparisons for the 30,000Ml reservoir scenario and then considers the results of the pair-wise comparison for this scenario. The full findings of the sustainability appraisal are set out at Appendix JJ and the results of the pair-wise comparison at Appendix PP.
5.4.1.2 Nature Conservation The designations identified at Stage 2 (including ancient woodland, regional designations (CWS, SINC), Local Wildlife Site or UK Priority BAP habitat - see Appendix E) were measured to identify the total area of these designations potentially affected by reservoir development.
It was found that three of the remaining sites (Sites 18-Longworth, 39-Quainton and 41-Chinnor) were unlikely to contain any important nature conservation interest. All of the other sites were found to contain floodplain grazing marsh UK Bio-diversity Action Plan (BAP) priority habitat. The Ludgershall (37) site was found to contain the largest area of BAP habitat at 105 hectares.
5.4.1.3 Brownfield Land Re-use Site visits identified potential areas of brownfield land within only one of the sites (39-Quainton). This was measured using GIS. No previously developed land was recorded at the remaining five sites.
5.4.1.4 Landscape Character Sensitivity It was found that Site 22-Abingdon would result in slight adverse effects with respect to landscape character. It was assessed that the reservoir embankments would be regarded as a man made feature along with other urban features within or near to the site (pylons, war time depot, elevated A34 and in the distance Didcot power station).
It was found that a 30,000Ml reservoir at Sites 36-Marsh Gibbon, 37-Ludgershall and 39-Quainton would result in a combination of slight and moderate adverse effects with respect to landscape character. Reservoir developments at these sites would be at slight variance with the landform and would result in the loss of some existing ponds, hedgerows and hedgerow trees. It was found that development at Site 41-Chinnor would result in moderate adverse effects as the footprint of a reservoir would be out of scale with the field pattern in this area.
Upper Thames Major Resource Development Reservoir Site Selection Study
Thames Water Page 53 14/09/06
It was found that a 30,000Ml reservoir at Site 18-Longworth would result in large adverse effects with respect to all landscape considerations. The landform at Longworth is steeply undulating and provides some opportunity for land modelling. However, the existing landform forms an important part of the Thames Valley and would be adversely affected by the building of large scale embankments.
5.4.1.5 Views and Visual Amenity A 30,000Ml reservoir at Sites 22-Abingdon (assumed embankment height 16-25m), 36-Marsh Gibbon (assumed embankment height 10-16m), 37-Ludgershall (assumed embankment height 0-19m), 39-Quainton (assumed embankment height 6-25m) and 41-Chinnor (assumed embankment height 0-25m) would result in a combination of slight and moderate adverse effects with respect to visual considerations.
It was concluded that Site 18-Longworth (assumed embankment height 0-20m) would result in a combination of moderate and large adverse effects with respect to visual considerations. Reservoir development in this location would create extremely prominent embankments and a number of views would be interrupted. Overall it was considered that a reservoir would adversely affect high quality views and adversely affect a large number of sensitive receptors (large adverse effect).
5.4.1.6 Agricultural Land Quality Sites 18-Longworth, 36-Marsh Gibbon, 37-Ludgershall and 39-Quainton are categorised by all ‘low’ DEFRA predictions of the likelihood of best and most versatile land. A ‘low’ DEFRA prediction indicates that less than 20% of the land is likely to be ‘best and most versatile’ agricultural land.
It was found that the Chinnor site (41) is made up of predominantly ‘low’ and some ‘moderate’ DEFRA predictions of the likelihood of ‘best and most versatile’ agricultural land.
Site 22-Abingdon was assessed to be the worst performing site as it comprises all ‘moderate’ DEFRA predictions of the likelihood of ‘best and most versatile’ agricultural land. A ‘moderate’ DEFRA prediction indicates that 20-60% of the land is likely to be ‘best and most versatile’.
5.4.1.7 Floodplain Encroachment It was found that Site 18-Longworth was the only site which would not impact directly on a floodplain. Sites 39-Quainton and 22-Abingdon contain only small areas of floodplain, 9 hectares and 27 hectares respectively. Site 41-Chinnor contains approximately 80 hectares and Site 37-Ludgershall contains approximately 100 hectares. It was found that Site 36-Marsh Gibbon contains the largest area of floodplain at 145 hectares.
5.4.1.8 Opportunity for Construction Material to be Transported by Rail Rail access was considered to be practical and viable for Sites 22-Abingdon, 36-Marsh Gibbon, 37-Ludgershall, 39-Quainton and 41-Chinnor. It was concluded that there was no practical and viable opportunity to link Site 18-Longworth site to a rail line.
5.4.1.9 Distance from Intake/Outfall Points It was found that the shortest water transfer distance from a suitable intake/outfall point to a reservoir would be 4km for Site 22-Abingdon. It was estimated that the distance to Site 18-Longworth would be 14.5km and to Site 41-Chinnor, 18.5km. The
Upper Thames Major Resource Development Reservoir Site Selection Study
Thames Water Page 54 14/09/06
longest proposed water transfer distances were estimated to be 34km to Site 36-Marsh Gibbon, 35km to Site 37-Ludgershall and 41km to Site 39-Quainton.
5.4.1.10 Distance from Direct Supply Network It was concluded that Site 18-Longworth would be closest to the direct supply network (with a pipeline link of 0.5 km) required. The water transfer distance from Site 22-Abingdon was estimated to be 12km. All the other sites were estimated to be approximately 25km away, or more: Sites 37-Ludgershall (24.7km), 36-Marsh Gibbon (29km), 39-Quainton (31.2km) and 41-Chinnor (38.6km).
5.4.1.11 Birdstrike Risk An assessment of the potential to increase birdstrike at operational airfields found that potential flight lines created by a reservoir site at Chinnor (41) could potentially move birds away from RAF Benson and Chalgrove and hence this site performed the best on the birdstrike risk measure. It was found that Site 39-Quainton did not fall within any of the safeguarded areas referred to in Circular 01/2003, it is not under any runway approaches and was therefore assessed to be of low risk of increased birdstrike.
It was assessed at Sites 36-Marsh Gibbon, 37-Ludgershall and 22-Abingdon that the development of reservoirs at these sites could potentially introduce new flight lines for birds. However given that there were no large concentrations of waterfowl and given the relatively long distance of these sites from the nearest airfields it was also concluded that these new flight lines would be unlikely to prove hazardous.
The site considered to pose the greatest risk is Site 18-Longworth. It was assessed that there is potential to introduce a greater number of birds on flight lines between the Longworth site and landfill sites to the south east of RAF Dalton, which would cross the approaches to both runways at RAF Dalton.
5.4.1.12 Volume of Structural Fill Excavated on Site The volume of structural fill excavated, transported and compacted on site is used to reflect the potential scale and duration of the construction activity on site as well as the energy used in the construction process (see Appendix G for further details).
The volume of structural fill (clay) extracted at each site is determined by the availability of materials on site. Where there is no shortage of available fill materials, embankment height, and therefore the volume of clay extracted, is limited for reasons of practicality and proportion.
The site at Marsh Gibbon (36) would require the least structural fill at 6.6Mm³. Site 18-Longworth would require 8.8Mm³. Sites 22-Abingdon, 37-Ludgershall and 39-Quainton would require between 10.8 and 12.1 Mm³. The Chinnor site (41) would require 17.4Mm³, due to this site having higher embankments.
5.4.1.13 Archaeology and the Historic Environment The construction of a 30,000Ml reservoir at Site 36-Marsh Gibbon was assessed to have the least potential impact on archaeology and the historic environment. The site would contain one site of likely moderate archaeological sensitivity (a/s) only.
Sites 18-Longworth and 37-Ludgershall were ranked equal second, as each site was found to be likely to effect the setting of an adjacent conservation area and to contain one site of lesser or uncertain a/s.
Fourth ranked Site 41-Chinnor was found to contain one site of likely high a/s, one site of moderate a/s and three sites of lesser or uncertain a/s.

Upper Thames Major Resource Development Reservoir Site Selection Study
Thames Water Page 55 14/09/06
Site 22-Abingdon was found to contain one site of likely high archaeological sensitivity, 2 sites of moderate a/s and 9 sites of lesser or uncertain a/s.
Site 39-Quainton was assessed to have the largest potential impact on archaeology and the historic environment, of the 30,000Ml sites. It would contain two sites of likely high archaeological sensitivity, two sites of moderate a/s and three sites of lesser or uncertain a/s.
5.4.1.14 Impact of Construction on Local Residents The smallest population estimated to be located within a 300m radius of the sites was at Sites 39-Quainton, where it was estimated that 50 residents were within this distance and 22-Abingdon (57). 37-Ludgershall was estimated to have a population of 82 within 300m. For all the other sites it was estimated that there is a population of over 100 within 300m: Marsh Gibbon (129), Longworth (108) and Chinnor (112).
5.4.1.15 Impact of Construction Traffic on Local Roads It was assessed that the construction of all the remaining longlist sites, with the exception of Site 41-Chinnor, would potentially have a low impact on local roads. It was concluded that access to all these sites would be possible from strategic routes without construction traffic having to pass through built-up or semi-built-up areas.
It was found that the access to the site at Chinnor would be from the M40 via the A4129 and construction traffic would need to pass through the edge of the settlement of Thame.
5.4.1.16 Impact on Existing Residential Properties All sites were found to have the same impact on existing residential properties with all sites assessed to affect between one and five properties.
5.4.1.17 Impact on Existing Recreation Uses No existing recreation uses would be affected by the scheme for Site 36-Marsh Gibbon. One footpath was found to traverse Site 18-Longworth. Site 22-Abingdon contains three bridleways and three footpaths were found at Site 37-Ludgershall. It was also found that Site 41-Chinnor site contains five footpaths and a bridleway and Site 39-Quainton contains four footpaths and one bridleway.
5.4.1.18 People Benefiting from Provision of a Potential Recreational Resource
It was estimated that the largest population within a 5km radius of any site is around 32,024 for Site 41-Chinnor. In descending order, the sites with the greatest estimated population found within a 5km radius are Sites 22-Abingdon (28,100), 37-Ludgershall (8,255), 18-Longworth (7,905) 36-Marsh Gibbon (7,074 and 39-Quainton (6,414).
5.4.1.19 Opportunity for Biodiversity Improvement It was assessed that with the exception of Site 22-Abingdon all sites offered the opportunity for either biodiversity improvement (through increasing the ecological connectivity of woodland habitats close to but beyond the site boundary) or wetland habitat creation (through the diversion of watercourses flowing within the site).
By comparison it was found that Site 22-Abingdon would only offer opportunity for biodiversity improvement associated with the outer embankments and not the wider surrounding area.
Upper Thames Major Resource Development Reservoir Site Selection Study
Thames Water Page 56 14/09/06
5.4.1.20 Need for Imported Sand and Gravel on Site It was found that all the sites would require 100% of sand and gravel to be imported. It was estimated that Site 18-Longworth would require at least (1.1 million tonnes), Site 39-Quainton (1.4 million tonnes), Site 22-Abingdon (1.5 million tonnes), Site 37-Ludgershall (1.5 million tonnes) and Site 36-Marsh Gibbon (0.8 million tonnes). The largest requirements were estimated to be for Site 41-Chinnor (2.2 million tonnes).
5.4.1.21 Loss of Employment The greatest loss of employment at any site was estimated to be around 26 depot-related jobs at Site 39-Quainton.
For all sites it is estimated that there would be some loss of employment within the agricultural sector, although this loss cannot be reliably estimated and therefore does not form part of the assessment.
5.4.1.22 Opportunity for On-Site Mitigation On-site mitigation may include habitat creation, compensatory flood areas and/or recreational facilities. The area available for mitigation has been assessed as the area surrounding the reservoir, within the site area including the embankments (for further details on this measure see Appendix G).
The potential area for mitigation as a proportion of total site would be greatest at Site 22-Abingdon (91%). The area remaining for mitigation would also be relatively high at Sites 39-Quainton (81%), 37-Ludgershall (79%), 41-Chinnor (87%) and 36-Marsh Gibbon (83%). (38%). The site with the smallest proportion, based on concept designs, would be 59% at Site 18- Longworth.
5.4.1.23 Annual Net Pumping Energy/Total Yield Annual net pumping energy has been estimated, taking into account the energy required to re-fill a reservoir from the river, the delivery of treated water to the direct supply network and the energy that can be generated by releasing water from the reservoir back to the river (for further details on this measure see Appendix G).
Based on indicative estimates, Sites 18-Longworth and 22-Abingdon were the most energy-efficient schemes (0.24 MWh/Ml). Site 36-Marsh Gibbon (0.28 MWh/Ml) follows. The least energy-efficient schemes are located at Sites 41-Chinnor (0.31 MWh/Ml), 37-Ludgershall (0.31 MWh/Ml), and 39-Quainton (0.33 MWh/Ml).
5.4.1.24 Preferred Site(s) The pair-wise comparison compared all of the remaining long list sites against one another, across each of the sustainability measures, to identify a preferred site and to thus discount those sites that are less suitable for reservoir development of 30,000Ml.
The pair-wise comparison results, (see Appendix PP), show that Site 18-Longworth is marginally preferred when compared to Sites 22-Abingdon and 37-Ludgershall, and preferred when compared to Sites 39-Quainton and 41-Chinnor. However, it was identified that the 30,000m² sites had similar performance to one another.
Preferred site for a 30,000Ml (direct supply) reservoir on the basis of sustainability assessment performance at Stage 3 was:
18-Longworth

Upper Thames Major Resource Development Reservoir Site Selection Study
Thames Water Page 57 14/09/06
5.4.2 50,000Ml (Direct Supply) Reservoir Scenario Table 5.5 presents a summary of the sustainability measures results that formed the basis for undertaking the pair-wise comparison for the 50,000Ml direct supply reservoir scenario.
Table 5.5: 50,000Ml (direct supply) Sustainability Measures Results Summary 18 22 36 37 39 41
Sustainability Measure Unit Long
wor
th
Abi
ngdo
n
Mar
sh G
ibbo
n
Ludg
ersh
all
Qua
into
n
Chi
nnor
Nature Conservation Ha 0.00 10.6 9.00 125.40 0.00 0.00
Brownfield land re-use Ha 0.0 0.2 0.0 0.0 6.2 0.0
Landscape character Value (-2-2) -2 2 0 1 0 0
Views and visual amenity Value (-2-2) -1 1 0 1 0 1
Agricultural land quality Value (-2-2) 1 -1 1 1 1 0
Floodplain encroachment Ha 0 31 162 152 18.0 112
Opportunity for construction material transportation by rail Value (-2-2) -2 2 1 2 2 2
Distance from intake/regulation outfall point Km 14.5 4.0 34.0 35.0 41.0 18.5
Distance from direct supply network Km 0.5 12.0 29.0 24.7 31.2 38.6
Birdstrike risk Rank 6 3 5 4 2 1 Volume of fill required (on-site clay) Mm3 13.6 15.3 8.9 13.9 15.5 20.4
Archaeology and the historic environment Rank 4 5 1 2 6 3
Impact of construction on local residents Number 187 77 174 104 74 125
Impact of construction traffic on local roads Value (-2-2) 2 2 2 2 2 0
Impact on existing residential properties Value (-2-2) 1 1 1 1 1 1
Impact on existing recreation uses Number 2 4 1 4 8 8
People benefiting from provision of significant recreational resource
Number 8,348 28,905 8,192 8,628 6,824 32,366
Opportunity for biodiversity improvement Value (-2-2) 1 0 1 2 1 1
Need for imported sand and gravel for construction on site
Million tonnes 1.70 1.90 1.10 1.80 2.00 2.60
Loss of employment Number 0 100 0 0 26 0
Opportunity for on-site mitigation Percentage of site 42% 83% 62% 66% 51% 74%
Annual net pumping energy/total yield MWh/Ml 0.26 0.24 0.33 0.36 0.39 0.36
Upper Thames Major Resource Development Reservoir Site Selection Study
Thames Water Page 58 14/09/06
5.4.2.1 Findings from the Sustainability Appraisal This section first provides a summary of the findings of the sustainability appraisal pair-wise comparisons for the 50,000Ml reservoir scenario and then considers the results of the pair-wise comparison for this scenario. The full findings of the sustainability appraisal are set out at Appendix KK and the results of the pair-wise comparison at Appendix QQ.
5.4.2.2 Nature Conservation The designations identified at Stage 2 were measured to identify the area potentially affected by reservoir development.
Three sites, Sites 18-Longworth, 39-Quainton and 41-Chinnor were found to be unlikely to contain any important nature conservation interest. Sites 22-Abingdon and 36-Marsh Gibbon were found to contain floodplain grazing marsh UK Biodiversity Action Plan (BAP) priority habitat. The Ludgershall site (37) was found to contain the largest area of BAP priority habitat at 125 hectares and 0.38 hectares of Ancient Woodland. Ancient Woodland was considered to be the only designation identified that could potentially have greater significance than BAP priority habitat. This is due to Ancient Woodland being a mature habitat that could not be restored or recreated. Given Site 37-Ludgershall was the poorest performing overall it was not necessary to further distinguish between the BAP and Ancient Woodland.
5.4.2.3 Brownfield Land Re-use Site visits identified potential areas of brownfield land within site areas, these were measured using GIS.
6.2 hectares of previously developed land was found at Site 39-Quainton and a small area of previously developed land was identified at Site 22-Abingdon (0.2 hectares). No previously developed land was recorded at the remaining four sites.
5.4.2.4 Landscape Character Sensitivity It was found that Site 22-Abingdon would result in slight adverse effects with respect to landscape character. It was assessed that the reservoir embankments would be regarded as a man made feature along with other urban features within or near to the site (pylons, war time depot, elevated A34 and in the distance Didcot power station). Site 37-Ludgershall was found to have a combination of slight and moderate adverse effects, reflecting the loss of Tetchwick Brook and Tittershall Wood. It was found that Sites 36-Marsh Gibbon, 39-Quainton and 41-Chinnor would result in moderate adverse effects with respect to landscape character. Reservoir developments at these sites would be at slight variance with the landform and would result in the loss of some existing ponds, hedgerows and hedgerow trees.
It was found that Site 18-Longworth would result in large adverse effects with respect to all landscape considerations. The landform at Longworth is steeply undulating and provides some opportunity for land modelling. However, the existing landform forms an important part of the Thames Valley and would be adversely affected by the building of large scale embankments.
5.4.2.5 Views and Visual Amenity It was found that Site 22-Abingdon (assumed embankment height 16-25m), Site 37-Ludgershall (assumed embankment height 0-19m) or Site 41-Chinnor (assumed embankment height 0-25m) would result in a combination of slight and moderate adverse effects with respect to visual considerations. In all cases it was concluded that the embankments would result in prominent new features in the landscape.
Upper Thames Major Resource Development Reservoir Site Selection Study
Thames Water Page 59 14/09/06
It was concluded that Site 36-Marsh Gibbon (assumed embankment height 10-16m) would result in moderate adverse effects with respect to visual considerations.
Site 39-Quainton (assumed embankment height 6-25m) was found to have a combination of slight and large adverse effects with respect to visual considerations. The hills in the vicinity of the site and vegetation cover would help to integrate the embankments into the landscape. However, embankments of up to 25m would remain visible in local views (slight adverse effect). Overall it was concluded that the reservoir would adversely affect some existing high quality views and adversely affect many sensitive receptors (large adverse effect).
A 50,000Ml reservoir at Site 18-Longworth (assumed embankment height 0-20m) would result in a combination of moderate and large adverse effects with respect to visual considerations. Reservoir development in this location would create extremely prominent embankments and a number of views would be interrupted. Overall it was considered that a reservoir would adversely affect high quality views and adversely affect a large number of sensitive receptors (large adverse effect).
5.4.2.6 Agricultural Land Quality Sites 18-Longworth, 36-Marsh Gibbon, 37-Ludgershall and 39-Quainton are all categorised by ‘low’ DEFRA predictions of the likelihood of best and most versatile land. A ‘low’ DEFRA prediction indicates that less than 20% of the land is likely to be ‘best and most versatile agricultural land’.
It was found that the Chinnor site (41) is made up of predominantly ‘low’ and some ‘moderate’ DEFRA predictions of the likelihood of ‘best and most versatile’ agricultural land.
Site 22-Abingdon was assessed to be the worst performing site as it comprises all ‘moderate’ DEFRA predictions of the likelihood of ‘best and most versatile’ agricultural land. A ‘moderate’ DEFRA prediction indicates that 20-60% of the land is likely to be ‘best and most versatile’.
5.4.2.7 Floodplain Encroachment It was found that Site 18-Longworth was the only site which would not impact directly on a floodplain. Sites 22-Abingdon and 39-Quainton contain relatively small areas of floodplain, 31 and 18 hectares respectively. The remaining sites were all found to contain more than 100 hectares of floodplain: Sites 41-Chinnor (112 hectares), 37-Ludgershall (152 hectares) and 36-Marsh Gibbon (162 hectares).
5.4.2.8 Opportunity for Construction Material to be Transported by Rail Rail access was considered to be practical and viable for Sites 22-Abingdon, 36-Marsh Gibbon, 37-Ludgershall, 39-Quainton and 41-Chinnor. It was concluded that there was no practical and viable opportunity to link Site 18-Longworth site to a rail line.
5.4.2.9 Distance from Intake/Outfall Points It was found that the shortest water transfer distance from a suitable intake/outfall point to a reservoir would be 4km for Site 22-Abingdon. It was estimated that the distance to Site 18-Longworth would be 14.5km and to Site 41-Chinnor, 18.5km. The longest proposed water transfer distances were estimated to be 34km to Site 36-Marsh Gibbon, 35km to Site 37-Ludgershall and 41km to Site 39-Quainton.
Upper Thames Major Resource Development Reservoir Site Selection Study
Thames Water Page 60 14/09/06
5.4.2.10 Distance from Direct Supply Network It was concluded that Site 18-Longworth would be closest to the direct supply network (with a pipeline link of 0.5 km) required. The water transfer distance from Site 22-Abingdon was estimated to be 12km. All the other sites were estimated to be approximately 25km away, or more: Sites 37-Ludgershall (24.7km), 36-Marsh Gibbon (29km), 39-Quainton (31.2km) and 41-Chinnor (38.6km).
5.4.2.11 Birdstrike Risk An assessment of the potential to increase birdstrike at operational airfields found that potential flight lines created by a reservoir site at Chinnor (41) could potentially move birds away from RAF Benson and Chalgrove and hence this site performed the best on the birdstrike risk measure. It was found that Site 39-Quainton did not fall within any of the safeguarded areas referred to in Circular 01/2003, is not under any runway approaches and was therefore assessed to be of low risk of increased birdstrike.
It was assessed at Sites 36-Marsh Gibbon, 37-Ludgershall and 22-Abingdon that the development of reservoirs at these sites could potentially introduce new flight lines for birds. However given that there were no large concentrations of waterfowl and given the relatively long distance of these sites from the nearest airfields it was also concluded that these new flight lines would be unlikely to prove hazardous.
The site considered to pose the greatest risk is Site 18-Longworth. It was assessed that there is potential to introduce a greater number of birds on flight lines between the Longworth site and landfill sites to the south east of RAF Dalton, which would cross the approaches to both runways at RAF Dalton.
5.4.2.12 Volume of Structural Fill Excavated on Site The volume of structural fill excavated, transported and compacted on site is used to reflect the potential scale and duration of the construction activity on site as well as the energy used in the construction process (see Appendix G for the further details).
The volume of structural fill (clay) extracted at each site is determined by the availability of materials on site. Where there is no shortage of available fill materials embankment height, and therefore the volume of clay extracted, is limited for reasons of practicality and proportion.
Site 36-Marsh Gibbon was found to require the least volume of fill at 8.9Mm³. Sites 18-Longworth, 22-Abingdon, 37-Ludgershall and 39-Quainton were found to have a similar requirement ranging from 13.6Mm³ to 15.5Mm³. Site 41-Chinnor was found to have the greatest requirement for 20.4Mm³; this reservoir would have higher embankments.
5.4.2.13 Archaeology and the Historic Environment The construction of a 50,000Ml reservoir at Site 36-Marsh Gibbon was assessed to have the least potential impact on archaeology and the historic environment. The site was found to contain one site of likely moderate archaeological sensitivity (a/s) only.
Site-37 Ludgershall, ranked second, would be likely to effect the setting of the Ludgershall Conservation Area, and was found to contain one site of lesser or uncertain a/s.
Third ranked Site 41-Chinnor would contain one site of likely high archaeological sensitivity, one site of moderate a/s and four sites of lesser or uncertain a/s.

Upper Thames Major Resource Development Reservoir Site Selection Study
Thames Water Page 61 14/09/06
Site 18-Longworth would be likely to affect on the setting of the Longworth Conservation Area, and contains one site of high archaeological sensitivity and one site of low a/s
Site 22-Abingdon, ranked fifth, was found to contain one site of likely high archaeological sensitivity, two sites of moderate a/s and twelve sites of lesser or uncertain a/s.
Site 39-Quainton was assessed to have the largest potential impact on archaeology and the historic environment, of the 50,000Ml sites. It would contain 2 Grade II Listed Buildings (also designated as sites of high a/s but not double counted), 1 site of high archaeological sensitivity, 5 sites of moderate a/s and 4 sites of lesser or uncertain a/s.
5.4.2.14 Impact of Construction on Local Residents The sites with the smallest population located within 300m radius of the sites were Site 22-Abingdon where it was estimated that 77 residents were within this distance and Site 39-Quainton were 74 residents were estimated to be within 300 metres. Site 37-Ludgershall was estimated to have a population of 104 and Site 41-Chinnor a population of 125. The remaining sites were estimated to have populations of over 170: Sites 36-Marsh Gibbon (174) and 18-Longworth (187).
5.4.2.15 Impact of Construction Traffic on Local Roads It was assessed that the construction of all the remaining longlist sites, with the exception of Site 41-Chinnor, would potentially have a low impact on local roads. It was concluded that access to all these sites would be possible from strategic routes without construction traffic having to pass through built-up or semi-built-up areas.
It was found that the access to the site at Chinnor (41) would be from the M40 via the A4129 and construction traffic would need to pass through the edge of the settlement of Thame.
5.4.2.16 Impact on Existing Residential Properties All the sites were found to have a similar impact on existing residential properties with all sites estimated to contain five or less dwellings. Site 37-Ludgershall was estimated to contain two existing properties and the other sites four or five properties.
5.4.2.17 Impact on Existing Recreation Uses Less than ten footpaths and bridleways were found to traverse all sites. Site 36-Marsh Gibbon was found to contain one footpath; Site 18-Longworth one footpath and one bridleway; Sites 22-Abingdon and 37-Ludgershall were each found to contain four bridleways or footpaths; and Sites 39-Quainton and 41-Chinnor each contain a total of eight bridleways and footpaths. It was also found that the Chinnor site contains a National Cycle Route.
5.4.2.18 People Benefiting from Provision of a Potential Recreational Resource
It was estimated that the largest population within a 5km radius of any site is around 32,000 for site 41-Chinnor. Site 22-Abingdon also has a relatively high population within 5km at just under 29,000. The remaining sites were all found to have a population of less than 9,000, with the lowest population being found around Site 39-Quainton.
Upper Thames Major Resource Development Reservoir Site Selection Study
Thames Water Page 62 14/09/06
5.4.2.19 Opportunity for Biodiversity Improvement It was assessed that Site 37-Ludgershall offered the best opportunity for both biodiversity improvement (through increasing the ecological connectivity of woodland habitats close to but beyond the site boundary) and wetland habitat creation (through the diversion of watercourses flowing within the site).
It was assessed that Sites 18-Longworth, 36-Marsh Gibbon, 39-Quainton and 41-Chinnor would offer the opportunity for either wetland habitat creation or woodland linkage.
It was found that Site 22-Abingdon would offer little opportunity for biodiversity improvement in the surrounding area, beyond that associated with the outer bank of the reservoir scheme.
5.4.2.20 Need for Imported Sand and Gravel on Site It was estimated that Site 36-Marsh Gibbon would require the least imported sand and gravel (1.1 million tonnes). Site 18-Longworth was found to require 1.7 million tonnes; Site 37-Ludgershall 1.8 million tonnes; Site 22-Abingdon 1.9 million tonnes and Site 39-Quainton 2 million tonnes. The largest requirement was estimated to be for Site 41-Chinnor at 2.6 million tonnes.
5.4.2.21 Loss of Employment It was estimated that the development of Site 22-Abingdon would result in the loss of 100 depot-related jobs. It should be recognised that most of these jobs would potentially be lost without reservoir development as the loss is principally associated with the Steventon Storage Facility site where there are proposals to cease business activity. Policy E16 of the Vale of White Horse Local Plan proposes that ‘the Council will seek the complete cessation of business uses and clearance and restoration of the site’.
The only other site where a loss of employment was estimated was Site 39-Quainton where 26 jobs were lost. For all sites it is estimated that there would be some loss of employment within the agricultural sector, although this loss cannot be reliably estimated and therefore does not form part of the assessment.
5.4.2.22 Opportunity for On-Site Mitigation On-site mitigation may include habitat creation, compensatory flood areas and/or recreational facilities. The area available for mitigation has been assessed as the area surrounding the reservoir, within the site area including the embankments (for further details on this measure see Appendix G).
The potential area for mitigation as a proportion of the total site would be greatest at Sites 22-Abingdon (83%) and 41-Chinnor (74%). The site with the least potential area for mitigation was 18-Longworth (42%).
5.4.2.23 Annual Net Pumping Energy/Total Yield Annual net pumping energy has been estimated taking into account the energy required to re-fill a reservoir from the river, the delivery of treated water to the direct supply network and the energy that can be generated by releasing water from the reservoir back to the river (for further details on this measure see Appendix G).
The estimation of annual net pumping energy/total yield (expressed as MWh/Ml) found that the most energy efficient site was Site 22-Abingdon (0.24 Mwh/Ml). Sites 18-Longworth (0.26 MWh/Ml), 36-Marsh Gibbon (0.33 MWh/Ml), 37-Ludgershall and 41-Chinnor (0.36 MWh/Ml) follow. The least energy efficient site was 39-Quainton at 0.39 MWh/Ml.

Upper Thames Major Resource Development Reservoir Site Selection Study
Thames Water Page 63 14/09/06
5.4.2.24 Preferred Site(s) The pair-wise comparison (Appendix QQ) compared all of the remaining long list sites against one another, across each of the sustainability measures, to identify a preferred site and thus to discount those sites that are less suitable for reservoir development of 50,000Ml (direct supply).
Site 22-Abingdon was found to be preferred when compared to all other sites, with the exception of Site 18-Longworth. When Site 22-Abingdon and Site18-Longworth were compared no overall preference was found. Given that Site 18-Longworth was only preferred when compared to Site 39-Quainton, overall it was found that generally Site 18-Longworth was not preferred. On balance it was assessed that that Site 22-Abingdon was the preferred site for development of a 50,000Ml direct supply reservoir.
Preferred site for a 50,000Ml (direct supply) reservoir on the basis of sustainability assessment performance at Stage 3 was:
22-Abingdon
5.4.3 50,000Ml(Regulation)Reservoir Scenario Table 5.6 presents a summary of the sustainability measures results that formed the basis for undertaking the pair-wise comparison for the 50,000Ml regulation reservoir scenario.
Table 5.6: 50,000Ml (Regulation) Sustainability Measures Results Summary
Site 18 22 36 37 39 41
Sustainability Measure Unit Long
wor
th
Abi
ngdo
n
Mar
sh
Gib
bon
Ludg
ersh
all
Qua
into
n
Chi
nnor
Nature Conservation Ha 0.00 10.6 9.00 125.40 0.00 0.00
Brownfield land re-use Ha 0.0 0.2 0.0 0.0 6.2 0.0
Landscape character Value (-2-2) -2 2 0 1 0 0
Views and visual amenity Value (-2-2) -1 1 0 1 0 1
Agricultural land quality Value (-2-2) 1 -1 1 1 1 0
Floodplain encroachment Ha 0 31 162 152 18.0 112
Opportunity for construction material transportation by rail Value (-2-2) -2 2 1 2 2 2
Distance from intake/regulation outfall point Km 14.5 4.0 34.0 35.0 41.0 18.5
Distance from direct supply network Km
Birdstrike risk Rank 6 3 5 4 2 1 Volume of fill required (on-site clay) Mm3 13.6 15.3 8.9 13.9 15.5 20.4
Archaeology and the historic environment Rank 4 5 1 2 6 3
Impact of construction on local residents Number 187 77 174 104 74 125
Impact of construction traffic on local roads Value (-2-2) 2 2 2 2 2 0
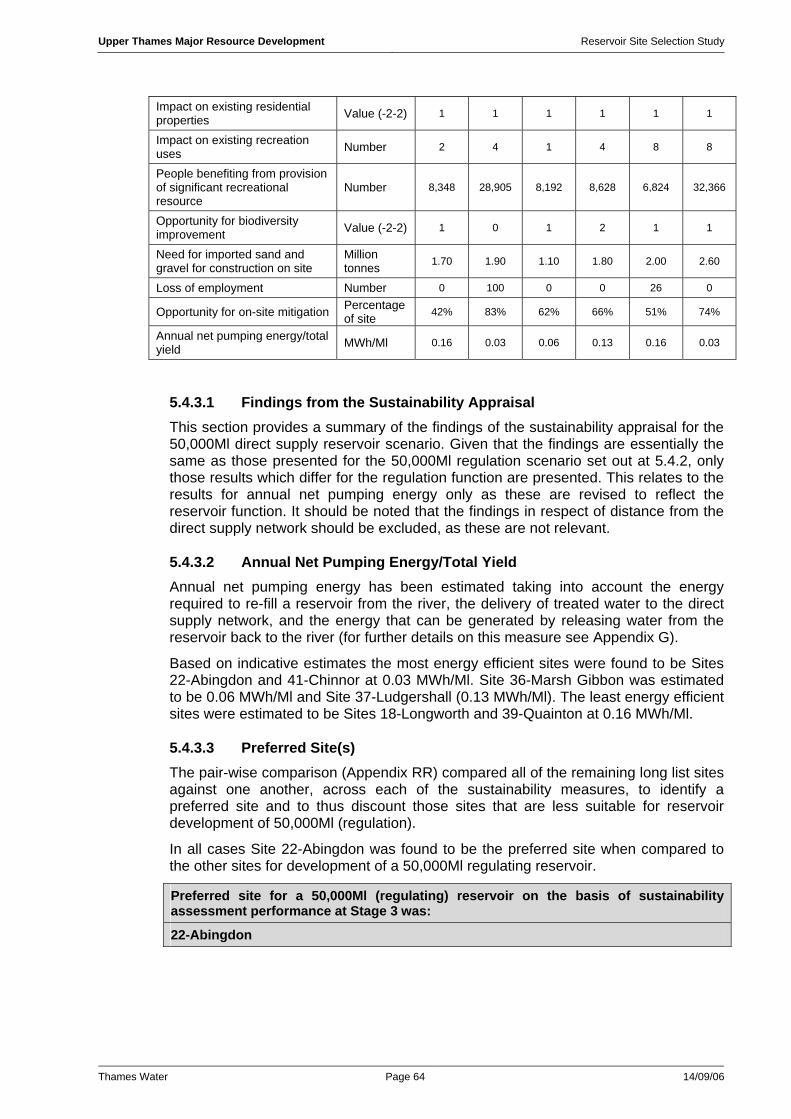
Upper Thames Major Resource Development Reservoir Site Selection Study
Thames Water Page 64 14/09/06
Impact on existing residential properties Value (-2-2) 1 1 1 1 1 1
Impact on existing recreation uses Number 2 4 1 4 8 8
People benefiting from provision of significant recreational resource
Number 8,348 28,905 8,192 8,628 6,824 32,366
Opportunity for biodiversity improvement Value (-2-2) 1 0 1 2 1 1
Need for imported sand and gravel for construction on site
Million tonnes 1.70 1.90 1.10 1.80 2.00 2.60
Loss of employment Number 0 100 0 0 26 0
Opportunity for on-site mitigation Percentage of site 42% 83% 62% 66% 51% 74%
Annual net pumping energy/total yield MWh/Ml 0.16 0.03 0.06 0.13 0.16 0.03
5.4.3.1 Findings from the Sustainability Appraisal This section provides a summary of the findings of the sustainability appraisal for the 50,000Ml direct supply reservoir scenario. Given that the findings are essentially the same as those presented for the 50,000Ml regulation scenario set out at 5.4.2, only those results which differ for the regulation function are presented. This relates to the results for annual net pumping energy only as these are revised to reflect the reservoir function. It should be noted that the findings in respect of distance from the direct supply network should be excluded, as these are not relevant.
5.4.3.2 Annual Net Pumping Energy/Total Yield Annual net pumping energy has been estimated taking into account the energy required to re-fill a reservoir from the river, the delivery of treated water to the direct supply network, and the energy that can be generated by releasing water from the reservoir back to the river (for further details on this measure see Appendix G).
Based on indicative estimates the most energy efficient sites were found to be Sites 22-Abingdon and 41-Chinnor at 0.03 MWh/Ml. Site 36-Marsh Gibbon was estimated to be 0.06 MWh/Ml and Site 37-Ludgershall (0.13 MWh/Ml). The least energy efficient sites were estimated to be Sites 18-Longworth and 39-Quainton at 0.16 MWh/Ml.
5.4.3.3 Preferred Site(s) The pair-wise comparison (Appendix RR) compared all of the remaining long list sites against one another, across each of the sustainability measures, to identify a preferred site and to thus discount those sites that are less suitable for reservoir development of 50,000Ml (regulation).
In all cases Site 22-Abingdon was found to be the preferred site when compared to the other sites for development of a 50,000Ml regulating reservoir.
Preferred site for a 50,000Ml (regulating) reservoir on the basis of sustainability assessment performance at Stage 3 was:
22-Abingdon
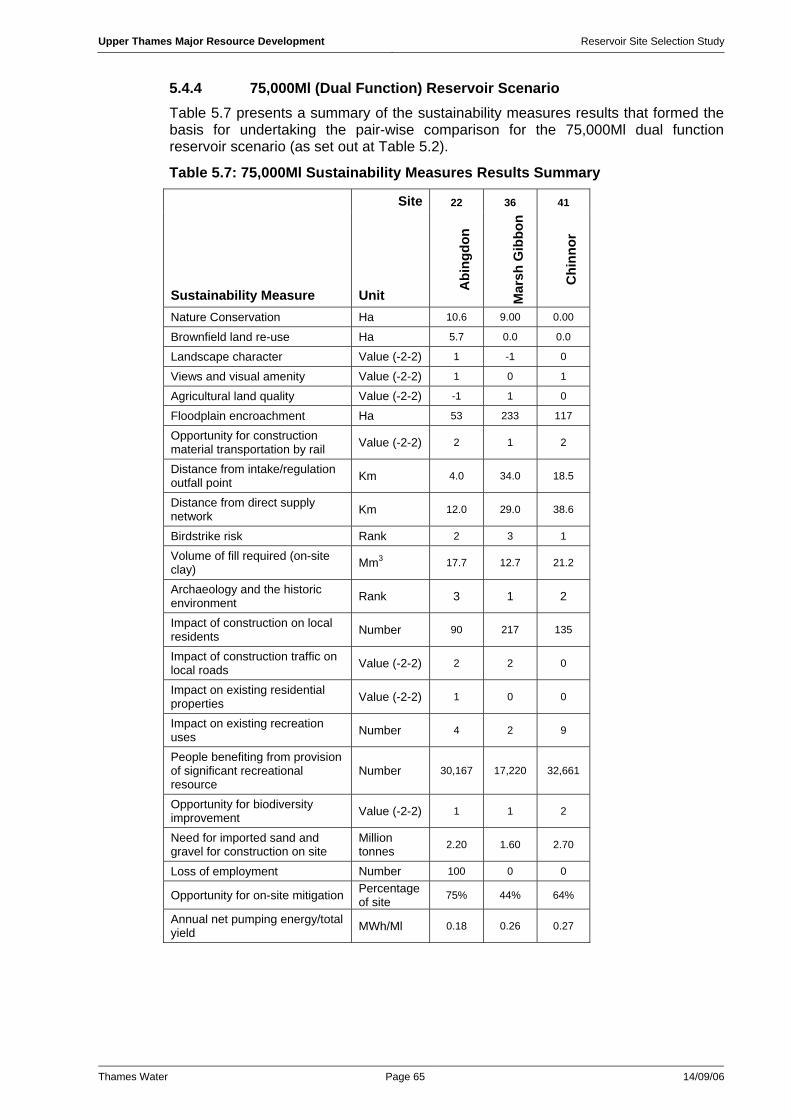
Upper Thames Major Resource Development Reservoir Site Selection Study
Thames Water Page 65 14/09/06
5.4.4 75,000Ml (Dual Function) Reservoir Scenario
Table 5.7 presents a summary of the sustainability measures results that formed the basis for undertaking the pair-wise comparison for the 75,000Ml dual function reservoir scenario (as set out at Table 5.2).
Table 5.7: 75,000Ml Sustainability Measures Results Summary
Site 22 36 41
Sustainability Measure Unit Abi
ngdo
n
Mar
sh G
ibbo
n
Chi
nnor
Nature Conservation Ha 10.6 9.00 0.00
Brownfield land re-use Ha 5.7 0.0 0.0
Landscape character Value (-2-2) 1 -1 0
Views and visual amenity Value (-2-2) 1 0 1
Agricultural land quality Value (-2-2) -1 1 0
Floodplain encroachment Ha 53 233 117
Opportunity for construction material transportation by rail Value (-2-2) 2 1 2
Distance from intake/regulation outfall point Km 4.0 34.0 18.5
Distance from direct supply network Km 12.0 29.0 38.6
Birdstrike risk Rank 2 3 1
Volume of fill required (on-site clay) Mm3 17.7 12.7 21.2
Archaeology and the historic environment Rank 3 1 2
Impact of construction on local residents Number 90 217 135
Impact of construction traffic on local roads Value (-2-2) 2 2 0
Impact on existing residential properties Value (-2-2) 1 0 0
Impact on existing recreation uses Number 4 2 9
People benefiting from provision of significant recreational resource
Number 30,167 17,220 32,661
Opportunity for biodiversity improvement Value (-2-2) 1 1 2
Need for imported sand and gravel for construction on site
Million tonnes 2.20 1.60 2.70
Loss of employment Number 100 0 0
Opportunity for on-site mitigation Percentage of site 75% 44% 64%
Annual net pumping energy/total yield MWh/Ml 0.18 0.26 0.27

Upper Thames Major Resource Development Reservoir Site Selection Study
Thames Water Page 66 14/09/06
5.4.4.1 Findings from the Sustainability Appraisal This section first provides a summary of the findings of the sustainability appraisal pair-wise comparisons for the 75,000Ml reservoir scenario and then considers the results of the pair-wise comparison for this scenario. The full findings of the sustainability appraisal are set out at Appendix LL and the results of the pair-wise comparison at Appendix SS.
5.4.4.2 Nature Conservation The designations identified at Stage 2 were measured to identify the area potentially affected by reservoir development.
Site 41-Chinnor was found to be unlikely to contain any important nature conservation interest. Sites 22-Abingdon and 36-Marsh Gibbon were found to contain floodplain grazing marsh UK Bio-diversity Action Plan (BAP) priority habitat.
5.4.4.3 Brownfield Land Re-use 5.7 hectares of previously developed land was found at Site 22-Abingdon. No previously developed land was recorded at the remaining two sites.
5.4.4.4 Landscape Character Sensitivity It was found that Site 22-Abingdon would result in a combination of slight and moderate adverse effects with respect to landscape character. It was assessed that the reservoir embankments would be regarded as a man made feature along with other urban features within or near to the site (pylons, war time depot, elevated A34 and in the distance Didcot power station).
Site 36-Marsh Gibbon was found to result in a combination of moderate and large adverse effects, as the scheme would be at considerable variance with the scale and pattern of the existing landscape in this location. It was found that Site 41-Chinnor would result in moderate adverse effects with respect to landscape character.
5.4.4.5 Visual Sensitivity It was found that Sites 22-Abingdon (assumed embankment height 16-25m) and 41-Chinnor (assumed embankment height 0-25m) would result in a combination of slight and moderate adverse effects with respect to visual considerations. It was concluded that the embankments would result in prominent new features in the landscape.
Site 36-Marsh Gibbon (assumed embankment height 10-16m) was found to result in moderate adverse effects with respect to visual considerations.
5.4.4.6 Agricultural Land Quality Site 36-Marsh Gibbon, was categorised by ‘low’ DEFRA predictions of the likelihood of best and most versatile land. A ‘low’ DEFRA prediction indicates that less than 20% of the land is likely to be ‘best and most versatile agricultural land’.
It was found that the Chinnor site (41) is made up of predominantly ‘low’ and some ‘moderate’ DEFRA predictions of the likelihood of ‘best and most versatile’ agricultural land.
Site 22-Abingdon was assessed to be the worst performing site as it comprises all ‘moderate’ DEFRA predictions of the likelihood of ‘best and most versatile’ agricultural land. A ‘moderate’ DEFRA prediction indicates that 20-60% of the land is likely to be ‘best and most versatile’.
Upper Thames Major Resource Development Reservoir Site Selection Study
Thames Water Page 67 14/09/06
5.4.4.7 Floodplain Encroachment All sites in this scenario were found to contain areas of floodplain. Site 22-Abingdon (53 hectares), Site 41-Chinnor (117 hectares) and Site 36-Marsh Gibbon (233 hectares).
5.4.4.8 Opportunity for Construction Material to be Transported by Rail Rail access was considered to be practical and viable for all sites in this reservoir size scenario. It was found that it would be easier to connect to Sites 22-Abingdon and 41-Chinnor compared to Site 36-Marsh Gibbon.
5.4.4.9 Distance from Intake/Outfall Points It was found that the shortest water transfer distance from a suitable intake/outfall point to a reservoir would be 4km for Site 22-Abingdon. It was estimated that the distance to Site 41-Chinnor would be 18.5km. The longest proposed water transfer distance was estimated to be 34km to Site 36-Marsh Gibbon.
5.4.4.10 Distance from Direct Supply Network It was concluded that Site 22-Abingdon would be closest to the direct supply network, with a pipeline link of 12 km required. All the other sites were estimated to be approximately 25km away, or more: Marsh Gibbon (29km) and Chinnor (38.6km).
5.4.4.11 Birdstrike Risk An assessment of the potential to increase birdstrike at operational airfields found that potential flight lines created by a reservoir site at Chinnor (41) could potentially move birds away from RAF Benson and Chalgrove, and hence this site performed the best on the birdstrike risk measure.
It was assessed at Sites 36-Marsh Gibbon and 22-Abingdon that the development of reservoirs at these sites could potentially introduce new flight lines for birds. However, given that there were no large concentrations of waterfowl, and given the relatively long distance of these sites from the nearest airfields, it was also concluded that these new flight lines would be unlikely to prove hazardous. On balance Site 36-Marsh Gibbon was found to be the least preferred in terms of birdstrike risk.
5.4.4.12 Volume of Structural Fill Excavated on Site The volume of structural fill excavated, transported and compacted on site is used to reflect the potential scale and duration of the construction activity on site as well as the energy used in the construction process (see Appendix G for the further details).
The volume of structural fill (clay) extracted at each site is determined by the availability of materials on site. Where there is no shortage of available fill materials embankment height, and therefore the volume of clay extracted, is limited for reasons of practicality and proportion.
Site 36-Marsh Gibbon was found to require the least volume of fill at 12.7Mm³. Site 22-Abingdon was found to have a requirement of 17.7Mm³. Site 41-Chinnor was found to have the greatest requirement for 21.2Mm³; this reservoir would have higher embankments.
5.4.4.13 Archaeology and the Historic Environment The construction of a 75,000Ml reservoir at Site 36-Marsh Gibbon was assessed to have the least potential impact on archaeology and the historic environment. The site would contain one site of high archaeological sensitivity (a/s) and one site of moderate a/s.

Upper Thames Major Resource Development Reservoir Site Selection Study
Thames Water Page 68 14/09/06
Second ranked Site 41-Chinnor was found to contain one site of likely high a/s, one site of moderate a/s and four sites of lesser or uncertain a/s.
Site 22-Abingdon, was assessed to have the largest potential impact on archaeology and the historic environment, of the 75,000Ml sites. It would contain one site of likely high archaeological sensitivity, four sites of moderate a/s and thirteen sites of lesser or uncertain a/s.
5.4.4.14 Impact of Construction on Local Residents The site with the smallest population located within 300m radius of the site was Site 22-Abingdon where it was estimated that 90 residents were within this distance followed by Site 41-Chinnor with a population of 135. The remaining site, Site 36-Marsh Gibbon was estimated to have a population of 217 within 300m.
5.4.4.15 Impact of Construction Traffic on Local Roads It was assessed that the construction of the 75,000Ml reservoir scenario sites, with the exception of Site 41-Chinnor, would potentially have a low impact on local roads. It was concluded that access to all these sites would be possible from strategic routes without construction traffic having to pass through built-up or semi-built-up areas.
It was found that the access to the site at Chinnor would be from the M40 via the A4129 and construction traffic would need to pass through the edge of the settlement of Thame.
5.4.4.16 Impact on Existing Residential Properties Site 22-Abingdon was found to have the lowest impact on existing residential properties, with less than five dwellings. Sites 36-Marsh Gibbon and 41-Chinnor were found to contain less than ten dwellings.
5.4.4.17 Impact on Existing Recreation Uses Site 36-Marsh Gibbon was found to contain two footpaths. Site 22-Abingdon was found to contain four bridleways and Site 41-Chinnor a total of eight bridleways and footpaths. It was also found that the Chinnor (41) site contains a National Cycle Route.
5.4.4.18 People Benefiting from Provision of a Potential Recreational Resource
It was estimated that the largest population within a 5km radius of any site is around 32,000 for Site 41-Chinnor. Site 22-Abingdon also has a relatively high population within 5km at just over 30,000. Site 36-Marsh Gibbon was found to have a population in the 5km radius of just over 17,000.
5.4.4.19 Opportunity for Biodiversity Improvement It was assessed that Site 41-Chinnor offered the best opportunity for both biodiversity improvement (through increasing the ecological connectivity of woodland habitats close to but beyond the site boundary) and wetland habitat creation (through the diversion of watercourses flowing within the site).
It was assessed that Sites 22-Abingdon and 36-Marsh Gibbon would offer the opportunity for wetland habitat creation.
5.4.4.20 Need for Imported Sand and Gravel on Site It was estimated that Site 36-Marsh Gibbon would require the least imported sand and gravel (1.6 million tonnes). Site 22-Abingdon was found to require 2.2 million
Upper Thames Major Resource Development Reservoir Site Selection Study
Thames Water Page 69 14/09/06
tonnes. The largest requirement was estimated to be for Site 41-Chinnor at 2.7 million tonnes.
5.4.4.21 Loss of Employment The greatest loss of employment was estimated to be around 100 industrial sector jobs for Site 22-Abingdon. It should be recognised that most of these jobs would potentially be lost without reservoir development as the loss is principally associated with the Steventon Storage Facility site where there are proposals to cease business activity. Policy E16 of the Vale of White Horse Local Plan proposes that ‘the Council will seek the complete cessation of business uses and clearance and restoration of the site’.
For all sites it is estimated that there would be some loss of employment within the agricultural sector, although this loss cannot be reliably estimated and therefore does not form part of the assessment.
5.4.4.22 Opportunity for On-Site Mitigation On-site mitigation may include habitat creation, compensatory flood areas and/or recreational facilities. The area available for mitigation has been assessed as the area surrounding the reservoir, within the site area including the embankments (for further details on this measure see Appendix G).
The potential area for mitigation as a proportion of the total site would be greatest at Site 22-Abingdon (75%) and then Site 41-Chinnor (64%). The site with the least potential area for mitigation was found to be Site 36-Marsh Gibbon (44%).
5.4.4.23 Annual Net Pumping Energy/Total Yield Annual net pumping energy has been estimated taking into account the energy required to re-fill a reservoir from the river, the delivery of treated water to the direct supply network and the energy that can be generated by releasing water from the reservoir back to the river (for further details on this measure see Appendix G).
The estimation of annual net pumping energy/total yield (expressed as MWh/Ml) found that the most energy efficient site was 22-Abingdon (0.18 Mwh/Ml). Sites 36-Marsh Gibbon and 41-Chinnor were found to have a similar level of 0.26 and 0.27MWh/Ml respectively.
5.4.4.24 Preferred Site(s) The pair-wise comparison (Appendix SS) compared all of the remaining long list sites against one another, across each of the sustainability measures, to identify a preferred site and thus to discount those sites that are less suitable for reservoir development of 75,000Ml.
In all cases Site 22-Abingdon was found to be the preferred site when compared to the other sites for development of a 75,000Ml dual function reservoir.
Preferred site for a 75,000Ml (dual function) reservoir on the basis of sustainability assessment performance at Stage 3 was:
22-Abingdon

Upper Thames Major Resource Development Reservoir Site Selection Study
Thames Water Page 70 14/09/06
5.4.5 100,000Ml (Dual Function) Reservoir Scenario
Table 5.8 presents a summary of the sustainability measures results that formed the basis for undertaking the pair-wise comparison for the 100,000Ml dual function reservoir scenario (as set out at Table 5.2).
Table 5.8: 100,000Ml Sustainability Measures Results Summary Table
Site 22 41
Sustainability Measure Unit Abi
ngdo
n
Chi
nnor
Nature Conservation Ha 10.6 0.00
Brownfield land re-use Ha 7.9 0.0
Landscape character Value (-2-2) 1 -1
Views and visual amenity Value (-2-2) 0 0
Agricultural land quality Value (-2-2) -1 0
Floodplain encroachment Ha 64 122
Opportunity for construction material transportation by rail Value (-2-2) 2 2
Distance from intake/regulation outfall point Km 4.0 18.5
Distance from direct supply network Km 12.0 38.6
Birdstrike risk Rank 2 1 Volume of fill required (on-site clay) Mm3 19.4 26.8
Archaeology and the historic environment Rank 2 1
Impact of construction on local residents Number 98 196
Impact of construction traffic on local roads Value (-2-2) 2 0
Impact on existing residential properties Value (-2-2) 0 0
Impact on existing recreation uses Number 5 13
People benefiting from provision of significant recreational resource
Number 33,872 33,638
Opportunity for biodiversity improvement Value (-2-2) 1 1
Need for imported sand and gravel for construction on site
Million tonnes 2.50 3.40
Loss of employment Number 100 0
Opportunity for on-site mitigation Percentage of site 69% 35%
Annual net pumping energy/total yield MWh/Ml 0.16 0.24
Upper Thames Major Resource Development Reservoir Site Selection Study
Thames Water Page 71 14/09/06
5.4.5.1 Findings from the Sustainability Appraisal This section first provides a summary of the findings of the sustainability appraisal pair-wise comparisons for the 30,000Ml reservoir scenario and then considers the results of the pair-wise comparison for this scenario. The full findings of the sustainability appraisal are set out at Appendix MM and the results of the pair-wise comparison at Appendix TT.
5.4.5.2 Nature Conservation The designations identified at Stage 2 were measured to identify the area potentially affected by reservoir development.
Site 41-Chinnor was found to be unlikely to contain any important nature conservation interest. Site 22-Abingdon was found to contain floodplain grazing marsh UK Bio-diversity Action Plan (BAP) priority habitat.
5.4.5.3 Brownfield Land Re-use Site visits identified potential areas of brownfield land within site areas, these were measured using GIS.
6.2 hectares of previously developed land was found at Site 22-Abingdon (5.7 hectares). No previously developed land was recorded at the Chinnor site.
5.4.5.4 Landscape Character Sensitivity It was found that Site 22-Abingdon would result in a combination of slight and moderate adverse effects with respect to landscape character It was assessed that the reservoir embankments would be regarded as a man made feature as the site already contains or is near to urban features (pylons, war time depot, elevated A34 and in the distance Didcot power station). Site 41-Chinnor was found to result in moderate adverse effects.
5.4.5.5 Visual Sensitivity It was found that Site 22-Abingdon (assumed embankment height 16-25m) and Site 41-Chinnor (assumed embankment height 0-25m) would result in a combination of slight and moderate adverse effects with respect to visual considerations. It was concluded that the embankments would result in prominent new features in the landscape.
5.4.5.6 Agricultural Land Quality It was found that the Chinnor site (41) is made up of predominantly ‘low’ and some ‘moderate’ DEFRA predictions of the likelihood of ‘best and most versatile’ agricultural land.
Site 22-Abingdon was assessed to be the worst performing site as it comprises all ‘moderate’ DEFRA predictions of the likelihood of ‘best and most versatile’ agricultural land. A ‘moderate’ DEFRA prediction indicates that 20-60% of the land is likely to be ‘best and most versatile’.
5.4.5.7 Floodplain Encroachment Site 22-Abingdon was found to contain 64 hectares of floodplain and Site 41-Chinnor 122 hectares of floodplain.
Upper Thames Major Resource Development Reservoir Site Selection Study
Thames Water Page 72 14/09/06
5.4.5.8 Opportunity for Construction Material to be Transported by Rail Rail access was considered to be practical and viable for both sites in this reservoir size scenario.
5.4.5.9 Distance from Intake/Outfall Points It was found that the shorter water transfer distance from a suitable intake/outfall point to a reservoir would be 4km for Site 22-Abingdon. It was estimated that the distance to Site 41-Chinnor would be 18.5km.
5.4.5.10 Distance from Direct Supply Network It was concluded that Site 22-Abingdon would be closer to the direct supply network with a pipeline link of 12km required. The Chinnor site would require a 38.6km pipeline.
5.4.5.11 Birdstrike Risk An assessment of the potential to increase birdstrike at operational airfields found that potential flight lines created by a reservoir site at Chinnor (41) could potentially move birds away from RAF Benson and Chalgrove, and hence this site performed the best on the birdstrike risk measure.
It was assessed that at Site 22-Abingdon the development of reservoirs could potentially introduce new flight lines for birds. However, given that there were no large concentrations of waterfowl and given the relatively long distance of this site from the nearest airfields, it was also concluded that these new flight lines would be unlikely to prove hazardous.
5.4.5.12 Volume of Structural Fill Excavated on Site The volume of structural fill excavated, transported and compacted on site is used to reflect the potential scale and duration of the construction activity on site as well as the energy used in the construction process (see Appendix G for the further details).
The volume of structural fill (clay) extracted at each site is determined by the availability of materials on site. Where there is no shortage of available fill materials embankment height, and therefore the volume of clay extracted, is limited for reasons of practicality and proportion.
Site 22-Abingdon was found to have a requirement of 19.4Mm³. Site 41-Chinnor was found to have a greater requirement for 26.8Mm³; this reservoir would have higher embankments.
5.4.5.13 Archaeology and the Historic Environment The construction of a 100,000Ml reservoir at Site 41-Chinnor was assessed to have the least potential impact on archaeology and the historic environment. The site would contain one site of likely high archaeological sensitivity (a/s), two site of moderate a/s and six sites of lesser or uncertain a/s.
Site 22-Abingdon, was assessed to have the largest potential impact on archaeology and the historic environment, of the 100,000Ml sites. It would contain one site of likely high a/s, four sites of moderate a/s and fifteen sites of lesser or uncertain a/s.
5.4.5.14 Impact of Construction on Local Residents Site 22-Abingdon was estimated to have a population of 98 within 300 metres and Site 41-Chinnor was estimated to have a population of 196 within a radius of 300 metres of the site.
Upper Thames Major Resource Development Reservoir Site Selection Study
Thames Water Page 73 14/09/06
5.4.5.15 Impact of Construction Traffic on Local Roads Site 22-Abingdon was found to potentially have a low impact on local roads. It was found that the access to Site 41-Chinnor would be from the M40 via the A4129 and construction traffic would need to pass through the edge of the settlement of Thame.
5.4.5.16 Impact on Existing Residential Properties The two sites in this reservoir size scenario were estimated to have a similar impact on existing residential properties with Site 22-Abingdon found to affect eight dwellings and Site 41-Chinnor nine dwellings.
5.4.5.17 Impact on Existing Recreation Uses Site 22-Abingdon was found to contain one footpath and four bridleways. Site 41-Chinnor was found to contain a total of ten footpaths, two bridleways and a National Cycle Route.
5.4.5.18 People Benefiting from Provision of a Potential Recreational Resource
The two sites in this reservoir size scenario have similar estimations of population within a 5km radius. Site 22-Abingdon was estimated to have a population of 33,872 and Site 41-Chinnor 33,638.
5.4.5.19 Opportunity for Biodiversity Improvement Both sites were found to have the opportunity for potential wetland habitat creation.
5.4.5.20 Need for Imported Sand and Gravel on Site It was estimated that Site 22-Abingdon would require less imported sand and gravel at 2.5 million tonnes. Site 41-Chinnor was found to require the importation of 3.4 million tonnes of sand and gravel.
5.4.5.21 Loss of Employment It was found that no employment would be lost at the Chinnor site. For all sites it is estimated that there would be some loss of employment within the agricultural sector, although this loss cannot be reliably estimated and therefore does not form part of the assessment.
The greatest loss of employment was estimated to be around 100 depot type jobs for Site 22-Abingdon. It should be recognised that most of these jobs would potentially be lost without reservoir development, as the loss is principally associated with the Steventon Storage Facility site, where there are proposals to cease business activity. Policy E16 of the Vale of White Horse Local Plan proposes that ‘the Council will seek the complete cessation of business uses and clearance and restoration of the site’.
5.4.5.22 Opportunity for On-Site Mitigation On-site mitigation may include habitat creation, compensatory flood areas and/or recreational facilities. The area available for mitigation has been assessed as the area surrounding the reservoir, within the site area including the embankments (for further details on this measure see Appendix G).
The potential area for mitigation as a proportion of the total site would be greater at Site 22-Abingdon (69%). The site with the lower potential area for mitigation was 41-Chinnor (35%).
Upper Thames Major Resource Development Reservoir Site Selection Study
Thames Water Page 74 14/09/06
5.4.5.23 Annual Net Pumping Energy/Total Yield Annual net pumping energy has been estimated taking into account the energy required to re-fill a reservoir from the river, the delivery of treated water to the direct supply network and the energy that can be generated by releasing water from the reservoir back to the river (for further details on this measure see Appendix G).
The estimation of annual net pumping energy/total yield (expressed as MWh/Ml) found that the more energy efficient site was 22-Abingdon (0.16 Mwh/Ml). Site 41-Chinnor was found to have a level of 0.24 MWh/Ml.
5.4.5.24 Preferred Site(s) The pair-wise comparison (Appendix TT) compared the sites within the 100,000Ml reservoir size scenario against one another, across each of the sustainability measures, to identify a preferred site and, to thus discount those sites that are less suitable for reservoir development of 100,000Ml.
In all cases Site 22-Abingdon was found to be the preferred site when compared to the other sites for development of a 100,000Ml dual function reservoir.
Preferred site for a 100,000Ml (dual function) reservoir on the basis of sustainability assessment performance at Stage 3 was:
22-Abingdon
5.4.6 125,000Ml (Dual Function) Reservoir Scenario The only site that can accommodate a reservoir of 125,000Ml is Site 22-Abingdon. Therefore for this reservoir scenario Site 22-Abingdon is the preferred site.
Preferred site for a 125,000Ml (dual function) reservoir on the basis of sustainability assessment performance at Stage 3 was:
22-Abingdon
5.4.7 150,000Ml (Dual Function) Reservoir Scenario The only site that can accommodate a reservoir of 150,000Ml is Site 22-Abingdon. Therefore for this reservoir scenario Site 22-Abingdon is the preferred site.
Preferred site for a 150,000Ml (dual function) reservoir on the basis of sustainability assessment performance at Stage 3 was:
22-Abingdon
5.5 Sensitivity Analysis The sensitivity test considered the reservoir size scenarios in light of the very high and high importance measures utilised at Stage 2 plus annual net pumping energy/total yield and excluding distance from intake/outfall. The analysis was undertaken for each size scenario.
The sensitivity test for the 30,000Ml reservoir scenario (Appendix UU) found that Sites 22-Abingdon and 39-Quainton were generally preferred when compared to other sites in respect of the combined high and very high measures and high measures. Marsh Gibbon (Site 36) was found to perform well in respect of the very high measures. Given the sensitivity findings it was concluded that at 30,000Ml there

Upper Thames Major Resource Development Reservoir Site Selection Study
Thames Water Page 75 14/09/06
was no clear preference for a site. Either Sites 18-Longworth (preferred as part of the initial assessment), 22-Abingdon or 39-Quainton (preferred in the sensitivity test for high and combined high and very high measures), or 36-Marsh Gibbon (preferred in the sensitivity test for very high measures) could be taken forward. There was no conclusive result.
The findings of the sensitivity tests for the 50,000Ml reservoir scenario (Appendix V V and WW) for both direct supply and regulation concluded that Site 22-Abingdon was the preferred site. Therefore, the sensitivity test supported the pair-wise comparison findings.
The sensitivity test for the 75,000Ml reservoir scenario (Appendix XX) found that when the combined high and very high measures were considered Site 22-Abingdon was the preferred site. The same pattern was observed in respect of the high importance measures. When the very high measures alone were assessed the preferred site was Chinnor reflecting a no preference finding in respect of visual sensitivity. Overall the sensitivity test did not reveal any results that would revise the pair-wise comparison findings.
The findings of the sensitivity test for the 100,000Ml reservoir scenario (Appendix YY) found that Site 22-Abingdon was the preferred site for the combined high and very high measures and the high measures. Site 41-Chinnor was found to be the preferred site for the very high measures. Given that for two out of the three sensitivity tests Site 22-Abingdon was still preferred it was concluded that the sensitivity tests findings were not sufficient to change the original preference for Site 22-Abingdon.
The sensitivity test was not undertaken for the 125 and 150Ml options as only one site would meet this requirement.
5.6 Cost Check A review of the anticipated costs associated with each of the reservoir scenarios did not identify any factors that would overturn the findings. Overall the costs (set out at Appendix ZZ) are supportive of the findings for each reservoir size scenario.
5.7 Conclusions and Recommendations It was concluded that in all but one case the preferred site for each reservoir size scenario would not be revised as a result of the sensitivity test. The 30,000Ml scenario pair-wise findings were revised to reflect that the findings were inconclusive and therefore identify several possible sites for reservoir development.
The overall findings are summarised below:
Reservoir Size Site
• 30,000Ml 18-Longworth, 22-Abingdon, 36-Marsh Gibbon, 39-Quainton;
• 50,000Ml 22-Abingdon (both direct supply and regulation);
• 75,000Ml 22-Abingdon;
• 100,000Ml 22-Abingdon;
• 125,000Ml 22-Abingdon; and
• 150,000Ml 22-Abingdon.

Upper Thames Major Resource Development Reservoir Site Selection Study
Thames Water Page 76 14/09/06
6. NEXT STAGE OF WORK - SUMMARY The results of the alternative sites assessment will be used to provide the base data on preferred reservoir options. These options feed into the long list of measures that can be used to compile water resource programmes for London and SWOX. A range of programmes comprising different combinations of demand management and supply side measures will subsequently be subject to a sustainability assessment based on consideration of the costs, risks to security of supply, and environmental and social impacts of each programme.
As a development of the regulatory requirement to undertake water resource planning on the basis of least economic cost, the sustainability assessment will use a wider range of indicators to compare the performance and robustness of different programmes. It will also facilitate the selection of a preferred combination of demand management and leakage reduction measures, before considering additional new resource developments. Thames Water consider that this approach allows the aspirations of the company and its stakeholders in terms of balancing supply and demand over the 25 year planning horizon to be met in the most sustainable way.


![Thames Region Land Drainage - gov.uk · Thames Water Authority LAND DRAINAGE BYELAWS 1981 [as amended by the Thames Region FLOOD DEFENCE BYELAWS 1991] The Thames Water Authority,](https://img.pdfslide.us/doc/110x75/5ead899913c7690cc165ecc9/thames-region-land-drainage-govuk-thames-water-authority-land-drainage-byelaws.jpg)