Embed Size (px)
Citation preview
Reservoir Model Information System: REMIS
Sang Yun Lee*a, Kwang-Wu Leea, Taehyun Rheea, Ulrich Neumann†a aDept. of Computer Science, Univ. of S. Calif./941 W. 37th Pl. LA, CA USA 90089-0781
ABSTRACT We describe a novel data visualization framework named Reservoir Model Information System (REMIS) for the display of complex and multi-dimensional data sets in oil reservoirs. It is aimed at facilitating visual exploration and analysis of data sets as well as user collaboration in an easier way. Our framework consists of two main modules: the data access point module and the data visualization module. For the data access point module, the Phrase-Driven Grammar System (PDGS) is adopted for helping users facilitate the visualization of data. It integrates data source applications and external visualization tools and allows users to formulate data query and visualization descriptions by selecting graphical icons in a menu or on a map with step-by-step visual guidance. For the data visualization module, we implemented our first prototype of an interactive volume viewer named REMVR to classify and to visualize geo-spatial specific data sets. By combining PDGS and REMVR, REMIS assists users better in describing visualizations and exploring data so that they can easily find desired data and explore interesting or meaningful relationships including trends and exceptions in oil reservoir model data.
Keywords: Phrase-Driven Grammar, User Interface, Data Query, Data Visualization, Data Visualization Language.
1. INTRODUCTION In our previous work, we introduced the Phrase-Driven Grammar System (PDGS) [12], which can help users make data query and visualization using a variety of tables, 2D plots, and 2D maps in an interactive way. We extended our previous work to 3D visualization and show its application to oil reservoir models in terms of data visualization. We devised a visualization framework named Reservoir Model Information System (REMIS) as our first prototype according to the following requirements from our project:
- Offer easy user interface/easy to understand system. - Provide interactive visualization and data manipulation. - Ultimately, provide a variety of visualization techniques so that a user can find anomaly or correlation between data sets such
as patterns, trends, and exceptions.
This system is intended for non-IT experts such as geologists, reservoir engineers, staffs, or mid/high-level decision makers in this field so that they can understand, communicate, and repeatedly play with their data of interest in an easier way. REMIS can visualize a geo-science and engineering reservoir model consisting of multiple data sets such as seismic data, well data, well test data, geologic data, rock and fluid data, and interpretive input data related to oil reservoir. In this prototype, we only deal with geologic data sets coming from seismic data pre-processed by geoscientists and engineers instead of raw seismic data sets.
To meet the requirements above, we designed REMIS into two parts: the data access point module and the data visualization module. The data access point module is responsible for querying and acquiring data from data sources. This module is from our previous work, the Phrase-Driven Grammar System (PDGS). PDGS works as a middleware bridging between data sources and 3rd party visualization applications such as MS-Excel and Spotfire. By interfacing to other 3rd visualization tools, a user can bring up different types of data visualization without knowing a specific usage of a visualization tool. For example, if a user created a 2D plot visualization description, he can send that description over the connected 3rd party visualization tools such as MS-Excel and Spotfire and get the representation without knowing
* [email protected], † [email protected]
Visualization and Data Analysis 2009, edited by Katy Börner, Jinah Park, Proc. of SPIE-IS&T Electronic Imaging, SPIE Vol. 7243, 72430L · © 2009 SPIE-IS&T · CCC code: 0277-786X/09/$18 · doi: 10.1117/12.806773
SPIE-IS&T/ Vol. 7243 72430L-1
how to use them. To support usability, expressibility, and dynamic interactivity of data visualization, PDGS adopts structured language-like grammar named Phrase-Driven Grammar (PDG). A data visualization description is expressed with relatively short and simple English-like sentences. Most importantly, each stage of constructing a sentence is guided visually by the GUI of the system. A completed data visualization description is readable and understandable and can also be hand over to peers and be executed just like a scripting language in computer programming. Recipients can run and update the received sentences by themselves as well. Since our target is non IT experts, this grammar only deals with and common coarse control of data visualization.
For the data visualization module, we implemented a new tool, REMVR. It is not only an interactive 3D volume visualization tool but also a 3D geo-spatial information system, which means that all rendered objects are selectable data objects and if a user picks a rendered object in the tool, then relevant data is queried and REMVR displays the result. REMVR is implemented on top of Simian [7], which is a direct volume rendering tool for scientific visualization and developed at the University of Utah in collaboration with the Advanced Computing Laboratory at LANL. REMVR has general 3D volume visualization features like other commercial or open source 3D volume visualization tools have. Our project-specific enhancements regarding REMVR are described in Section 3.3. It should be noted that REMVR is useful only with geo-centric location data. If the data does not come with geo-location specific information, then a user needs to add them by manual or in a pre-configured way. By integrating these two modules, PDGS and REMVR, REMIS provides an integrated and powerful oil reservoir model information system. The main contributions of REMIS are in easy and effective oil reservoir visualization as follows:
- It enables users to create or update a visualization, which also can specify data to be associated with the visual object interactively using PDG.
- Each process in constructing a PDG visualization description is guided in a user-friendly way so that users begin to work with
little training. - Users can visualize a data set without knowing how to use specific visualization applications.
Let us take an example of the benefits of REMIS. When a user displays a 3D volume of a geological data set on REMVR, the user notices that some parts of the data set are not complete. Now, the user wants to make changes of values for those parts. The user selects the incomplete parts in REMVR. Then, the selected data is stored as a temporary object in REMVR automatically and also shared with PDGS. The user opens up the original property data set, displays them using a text editor through PDGS, and finds the selected parts of REMVR in the original data set. For the matching region of the original data set, the user makes updates, create a new data set, and triggers REMVR to visualize with the new data set. Another example is that a user wants to see a 2D plot of time vs. oil production for each well in a selected region in terms of well name and associated rock properties at the same time. Without knowing what visualization type he needs to use and how to use a 3D volume viewer, the user can see a 2D plot of time vs. oil for each well and its associated rock properties by use of PDGS. It will display Trellis visualization for all the well charts and bring up REMVR to display the 3D rock properties for the selected region.
Our challenge here is to achieve an optimal balance between usability and expressive power in visualization. Our policy is to get most frequently used and common cases work and leave the complicated and fine controls to the domain expert system. For this, we have been closely communicating with our customer, geo-scientists and petroleum engineers, and have reflected their inputs iteratively. In this paper, we focus on showing how to easily and effectively explore major oil reservoir data sets (focus on usability, flexibility, extensibility, and interactivity). The remainder of this paper proceeds as follows. Section 2 discusses related works and tools in areas of data visualization. Section 3 presents the overview of the system and explanation follows regarding two modules, REMVR and PDGS. Lastly, some examples produced with REMIS are presented in Section 4.
2. RELATED WORKS Regarding related works of PDGS, we briefly describe here. Refer to our previous work [12] for more detail. Steven F. Roth at al. identified four dimensions that emerged repeatedly in user interface design for visualization and information exploration workspace [13]. Ben Shneiderman proposed Dynamic Query. It has the interactive control by a user of visual query parameters that generate an animated visual play of database search results. Since this is intuitive and comprehensive, users do not need to learn SQL in order to issue queries. This system also provides immediate visual
SPIE-IS&T/ Vol. 7243 72430L-2
GUI
PDGS Engine
3 Party Application
DE
I REMVR I
Event Handler
Queri Result
Data Converter PDGS
Excel Others
Visualization
PDGS
Data Source
feedback with visual presentation. But still, it is more effective in simpler queries rather than in complex queries [1, 6, 15]. Chris Stole at al. suggested a database visualization method [4, 10], which is a graphical application of Pivot Tables. It is very strong in showing a report such as a summary of data and visual analytics, but has a limited capability of supporting various visualizations compared to other visual tools. In short, SQL is hard to learn, but can express all types of queries. On the other hand, graphical user interfaces and natural language interfaces are relatively easier to learn and use. A GUI is suitable for simpler query tasks, not for complicated queries or domain-independent aspect. A natural language interface (NLI) sometimes helps to express long or complicated queries easily, but involves a degree of ambiguity and uncertainty. Our approach combines a NLI and a graphical user interface in order to complement each other's drawbacks, thus allowing for better interactivity and expressiveness.
There are many commercial or free visualization systems available such as ParaView, VisTrails, OpenDX, Voxler, and GoCAD to name a few [16]. ParaView and OpenDX are widely used in visualization, but their solution does not provide direct volume rendering that is a crucial to our requirement for interactive real-time volume visualization. VisTrails introduced a noble way of querying and creating visualization using analogy, but it needs a significant amount of training for non-IT personnel. GoCAD is an expert system most widely used by geo-scientists as a geo-modeling tool and has specific functionalities to represent sophisticated geological situations in 3D. Also, it offers a plug-in module to support queries for 3D spatial/non-spatial objects to work as a 3D geo-spatial information system (GIS) [11]. A geo-spatial query is another big research topic in 3D GIS and is out of scope in this paper. Though it supports a variety of features, it is hard to learn and requires high cost to maintain. Voxler is a light-weighted solution for geo-scientists. It is suitable for some specific common and repeated tasks, but lacks in flexibility to be used as a general visualization module. REMIS is simpler than GoCAD in usability and functionality, but provides more functionalities and flexibility than Voxler. It provides a more intuitive and expressive user interface, and it supports a direct volume rendering techniques [5, 8] as well as traditional rendering methods for flexible data visualization in REMVR.
3. RESERVOIR MODEL INFORMATION SYSTEM: REMIS In this section, we introduce the system, REMIS. The design of REMIS is primarily focused on usability based on simplicity and intuitiveness, with the goal that even inexperienced people, without fear or complication, may use it for data access and visualization. First, the system overview is presented and then the data visualization module and the data access point module are discussed in order.
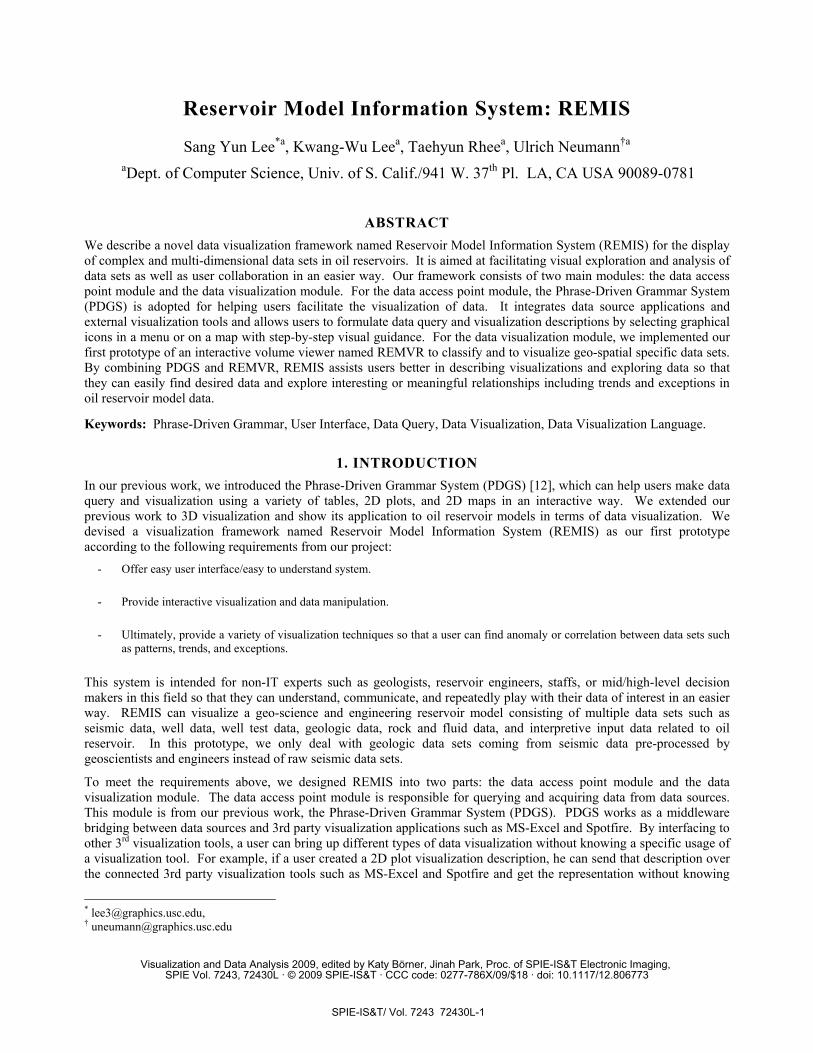
Figure 1. Architecture of REMIS.
3.1 System Overview REMIS has two main modules, the data access point module and the data visualization module. Simply, the data access point module triggers the data visualization module or 3rd party visualization applications to render a graphical representation and they can exchange events and data objects for interactive data visualization. The data access point module, thick-lined box in Figure 1, is an integration framework for visualization that can streamline the data query and analysis process. It is developed as a middle-layer application between data source applications and external visualization tools. It acquires data from its connected data source applications according to user's requests/commands, provides a way of manipulating the requested data, and then sends it over to a set of external visualization tools for
SPIE-IS&T/ Vol. 7243 72430L-3
Reservoir
Time
Location
MBB
Properties
Map
Child Obi
Layer
Fault
PlanarLocation
Geo centric3D Volume 3D Surface 2D Map Line Point
Reservoir Fault Section Well Pipes Well
Reservoir Properties Layer Pattern Water lniection Oil Production
Rock Properties Lease
Section Zone
Pattern Zone
Layer Zone
Lease Zone
output. The data visualization module, dotted-lined box in Figure 1, is designed to be not only an independent volume visualization tool but also a dependent application, which interacts with the data access point module.
Users and REMIS directly communicate with each other using graphical user interfaces of PDGS and REMVR. Users can make a request for visualization through the GUI of PDGS and see intermediate/final outputs presented in a specified output visualization application such as REMVR or connected 3rd party applications. REMIS takes care of all communications between users and the system and parses user's requests. Submitted commands/requests are interpreted and then executed by the system. Moreover, all user commands accepted are recorded as an internal format for future reuse. Finally, data communications with external applications and a data converter are handled by PDGS. The Event Handler module of PDGS in Figure 1 takes charge of the communication with 3rd party visualization applications and the Query Result module is in charge of communicating with the Data Converter. The Data Converter module of PDGS in Figure 1 is the integration point of all data sources and it can have a variety of interpreters to serve different types of data formats and data sources. Currently supported data sources of PDGS are relational databases, text and MS-Excel data file as a form of 1D/2D/3D vectors, and hierarchical data object model using XML schema. The Query Result module connects to this service and gets required data. As an alternative, the QueryResult module can directly read and write to MS-Excel or text file format. In our paper, we assume that there is a centralized web service that combines all related data sources together and organizes them hierarchically.
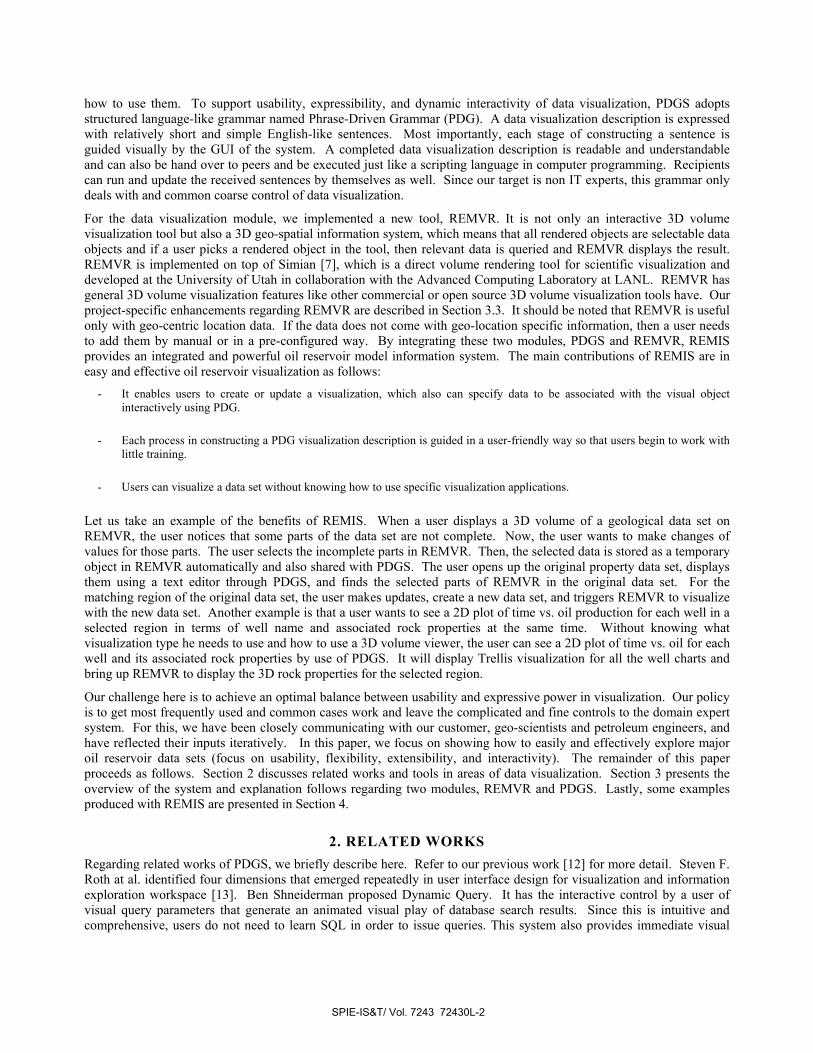
Figure 2. (a) Reservoir Data Object and its Hierarchy. (b) Default Mapping between Visual Objects and Data Objects.
REMIS is an object-oriented system. All objects in REMIS are organized hierarchically. There are two types of objects supported in the system: the data object type and the visual object type. The data object type has a geo-centric location information in the beginning while the visual object does not.
The examples of the data object type are reservoir, time, section, and well data objects. The diagram in Figure 2 (a) shows the hierarchical structure of one reservoir data object. When REMIS starts, it loads all the related data sets and generates required data sets as a pre-processing procedure. For instance, when one reservoir object is loaded, the system aggregates all time related data sets including child objects of the reservoir object, creates a unified time scale and saves. MBB stands for Minimum Bounding Box. It is also calculated and saved along with its top, bottom, sides, and center information when loading for each data object. All data objects inherit the same geometry class definition and their structures are similar. A data object, which has a volume type, is voxelized according to its geometrical information and a mapping mechanism between geo-centric locations and voxels is generated. Section, pattern, layer data objects creates their volume objects, which include depth information: section zone, pattern zone, and layer zone, respectively. At the end of the pre-processing procedure, all required data sets are generated and the system is ready for data query and visualization.
The visual object type is used to specify how to visualize a data set. The instances of the visual object type are point, line, curve, circle, square, arrow, cube, sphere, cylinder, mesh, grid, voxel, and 3D volume. The table in Figure 2 (b) shows the default mapping between reservoir data objects and their visual objects. A user can assign different types of objects to one specific object as its children. In addition, REMIS is similar to a 3D GIS in that all objects have a unique identification number, geometrical and topological information, and universal time information and can be queried using this information. By default, REMIS keeps all data objects, which do not have geometrical and topological information and an ancestor object, under the root object unless they are specified by users.
(b) (a)
SPIE-IS&T/ Vol. 7243 72430L-4
visual grammar qI.irk-Info
4dLfl,
4.
D DEl '0
Data Phrase
Command Phrase
Data Source Data Source
H Data Source Modifier
Command
-i Data Modifier
Output
DS Modifier
show
Viz
Parameters
Simple Modifier
DataModifier
Sort
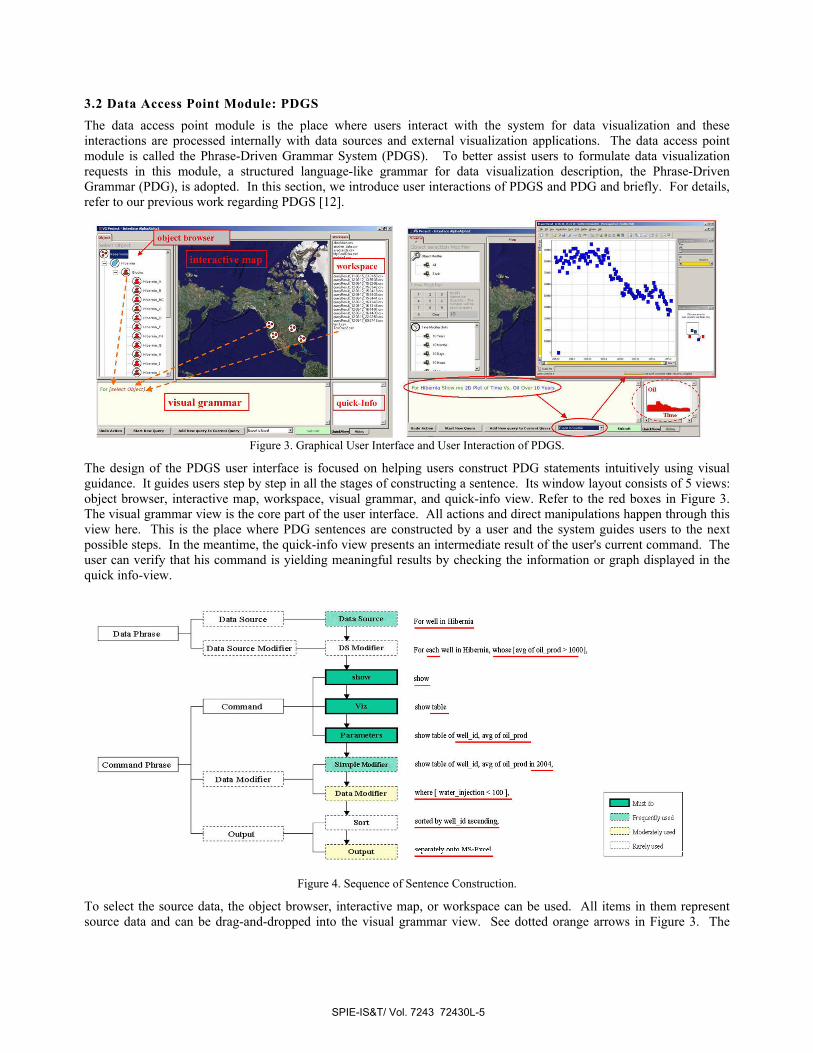
3.2 Data Access Point Module: PDGS The data access point module is the place where users interact with the system for data visualization and these interactions are processed internally with data sources and external visualization applications. The data access point module is called the Phrase-Driven Grammar System (PDGS). To better assist users to formulate data visualization requests in this module, a structured language-like grammar for data visualization description, the Phrase-Driven Grammar (PDG), is adopted. In this section, we introduce user interactions of PDGS and PDG and briefly. For details, refer to our previous work regarding PDGS [12].
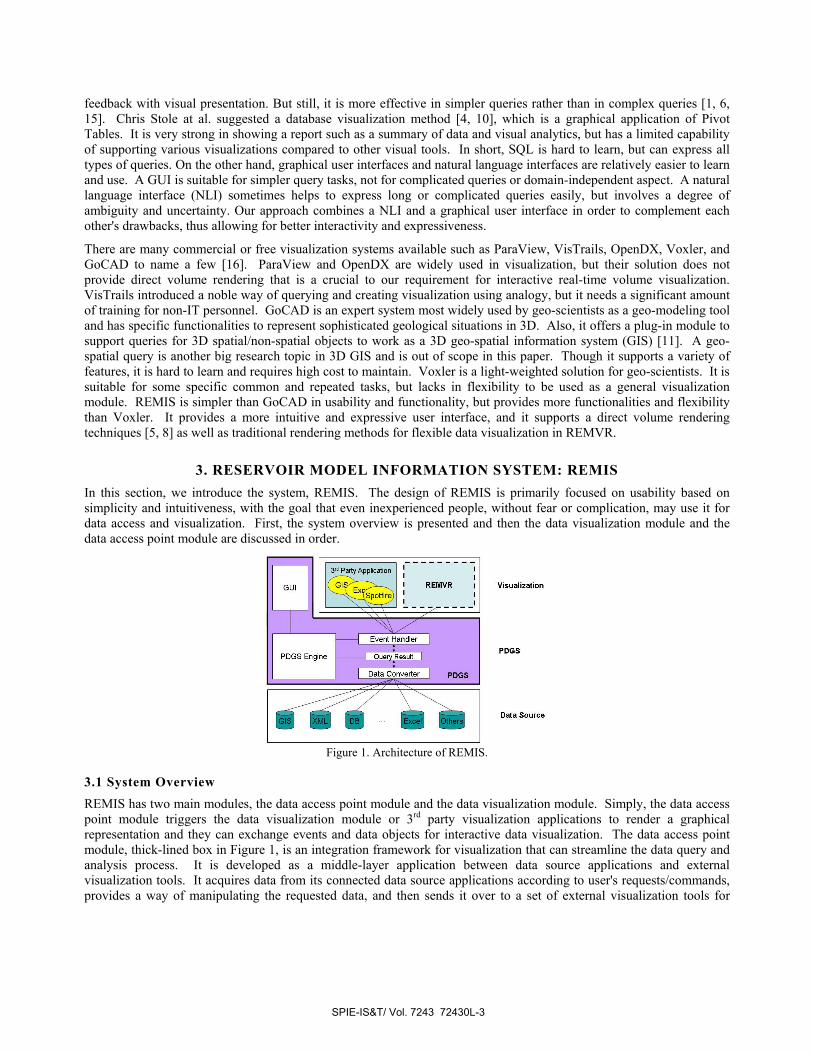
Figure 3. Graphical User Interface and User Interaction of PDGS.
The design of the PDGS user interface is focused on helping users construct PDG statements intuitively using visual guidance. It guides users step by step in all the stages of constructing a sentence. Its window layout consists of 5 views: object browser, interactive map, workspace, visual grammar, and quick-info view. Refer to the red boxes in Figure 3. The visual grammar view is the core part of the user interface. All actions and direct manipulations happen through this view here. This is the place where PDG sentences are constructed by a user and the system guides users to the next possible steps. In the meantime, the quick-info view presents an intermediate result of the user's current command. The user can verify that his command is yielding meaningful results by checking the information or graph displayed in the quick info-view.
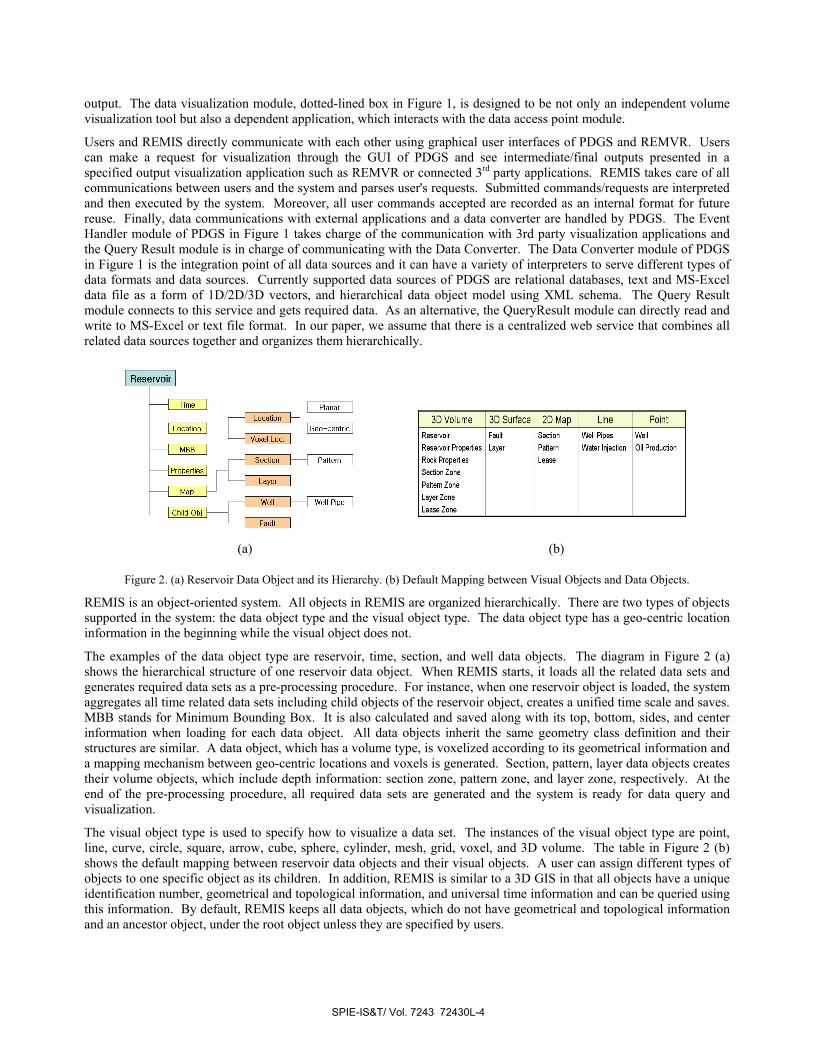
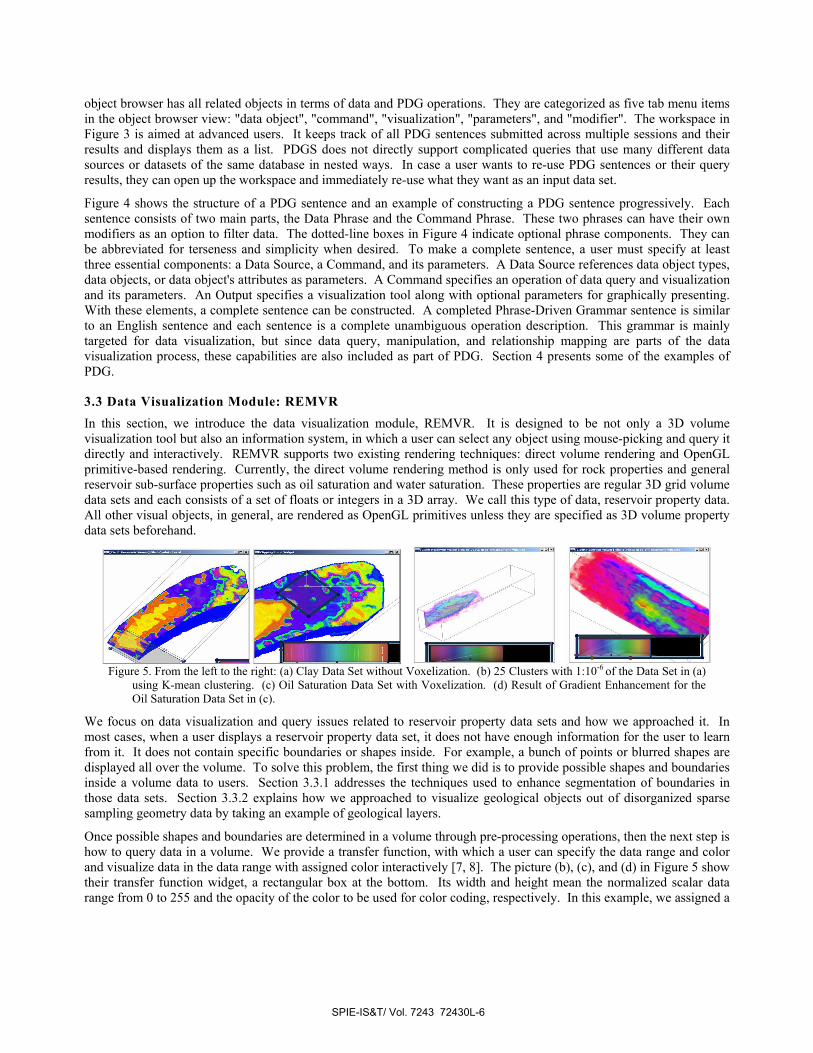
Figure 4. Sequence of Sentence Construction by Phrase.
Figure 4. Sequence of Sentence Construction.
To select the source data, the object browser, interactive map, or workspace can be used. All items in them represent source data and can be drag-and-dropped into the visual grammar view. See dotted orange arrows in Figure 3. The
SPIE-IS&T/ Vol. 7243 72430L-5
object browser has all related objects in terms of data and PDG operations. They are categorized as five tab menu items in the object browser view: "data object", "command", "visualization", "parameters", and "modifier". The workspace in Figure 3 is aimed at advanced users. It keeps track of all PDG sentences submitted across multiple sessions and their results and displays them as a list. PDGS does not directly support complicated queries that use many different data sources or datasets of the same database in nested ways. In case a user wants to re-use PDG sentences or their query results, they can open up the workspace and immediately re-use what they want as an input data set.
Figure 4 shows the structure of a PDG sentence and an example of constructing a PDG sentence progressively. Each sentence consists of two main parts, the Data Phrase and the Command Phrase. These two phrases can have their own modifiers as an option to filter data. The dotted-line boxes in Figure 4 indicate optional phrase components. They can be abbreviated for terseness and simplicity when desired. To make a complete sentence, a user must specify at least three essential components: a Data Source, a Command, and its parameters. A Data Source references data object types, data objects, or data object's attributes as parameters. A Command specifies an operation of data query and visualization and its parameters. An Output specifies a visualization tool along with optional parameters for graphically presenting. With these elements, a complete sentence can be constructed. A completed Phrase-Driven Grammar sentence is similar to an English sentence and each sentence is a complete unambiguous operation description. This grammar is mainly targeted for data visualization, but since data query, manipulation, and relationship mapping are parts of the data visualization process, these capabilities are also included as part of PDG. Section 4 presents some of the examples of PDG.
3.3 Data Visualization Module: REMVR In this section, we introduce the data visualization module, REMVR. It is designed to be not only a 3D volume visualization tool but also an information system, in which a user can select any object using mouse-picking and query it directly and interactively. REMVR supports two existing rendering techniques: direct volume rendering and OpenGL primitive-based rendering. Currently, the direct volume rendering method is only used for rock properties and general reservoir sub-surface properties such as oil saturation and water saturation. These properties are regular 3D grid volume data sets and each consists of a set of floats or integers in a 3D array. We call this type of data, reservoir property data. All other visual objects, in general, are rendered as OpenGL primitives unless they are specified as 3D volume property data sets beforehand.
Figure 5. From the left to the right: (a) Clay Data Set without Voxelization. (b) 25 Clusters with 1:10-6 of the Data Set in (a)
using K-mean clustering. (c) Oil Saturation Data Set with Voxelization. (d) Result of Gradient Enhancement for the Oil Saturation Data Set in (c).
We focus on data visualization and query issues related to reservoir property data sets and how we approached it. In most cases, when a user displays a reservoir property data set, it does not have enough information for the user to learn from it. It does not contain specific boundaries or shapes inside. For example, a bunch of points or blurred shapes are displayed all over the volume. To solve this problem, the first thing we did is to provide possible shapes and boundaries inside a volume data to users. Section 3.3.1 addresses the techniques used to enhance segmentation of boundaries in those data sets. Section 3.3.2 explains how we approached to visualize geological objects out of disorganized sparse sampling geometry data by taking an example of geological layers.
Once possible shapes and boundaries are determined in a volume through pre-processing operations, then the next step is how to query data in a volume. We provide a transfer function, with which a user can specify the data range and color and visualize data in the data range with assigned color interactively [7, 8]. The picture (b), (c), and (d) in Figure 5 show their transfer function widget, a rectangular box at the bottom. Its width and height mean the normalized scalar data range from 0 to 255 and the opacity of the color to be used for color coding, respectively. In this example, we assigned a
SPIE-IS&T/ Vol. 7243 72430L-6
raindow-like color coding operator, which is a raindow colored box inside the transfer function widget, to a certain data range, as a result, REMVR displays the volume in Figure 5.
3.3.1 Data Pre-processing For some reservoir property data sets, special data processing is needed before visualization to offer users better insights. We address two pre-processing operations: K-mean data clustering and gradient-enhancement. The K-mean clustering is well known as a fast and simple method over other clustering methods. We adopted a general K-mean clustering technique with coordinates and scalar data values as parameters. Then compute the gradient magnitude of the clustered label volume space and add it to the original data set. We skip the detailed description of our K-mean data clustering process. The picture (a) and (b) in Figure 5 show the comparison of an original data set (a) and the data set, which is clustered by 25 pieces with 10-6 weight on spatial distance, hence, emphasizing data value more over spatial distance (b). The picture (b) in Figure 5 shows more simplified results. To complement the K-mean clustering method, we have devised a non-destructive way to visualize the volumetric data while enhancing data boundaries by altering the gradient. The idea is to simply double the gradient value of volume or boundary of our interest. The picture (c) and (d) in Figure 5 show the comparison of the original data set (c) and the gradient-enhanced data set (d). The picture (d) in Figure 5 shows more clear data pattern of the reservoir property data and it shows the more noticeable histogram in the transfer function widget [7], which is inside the transfer function widget, than the original one.
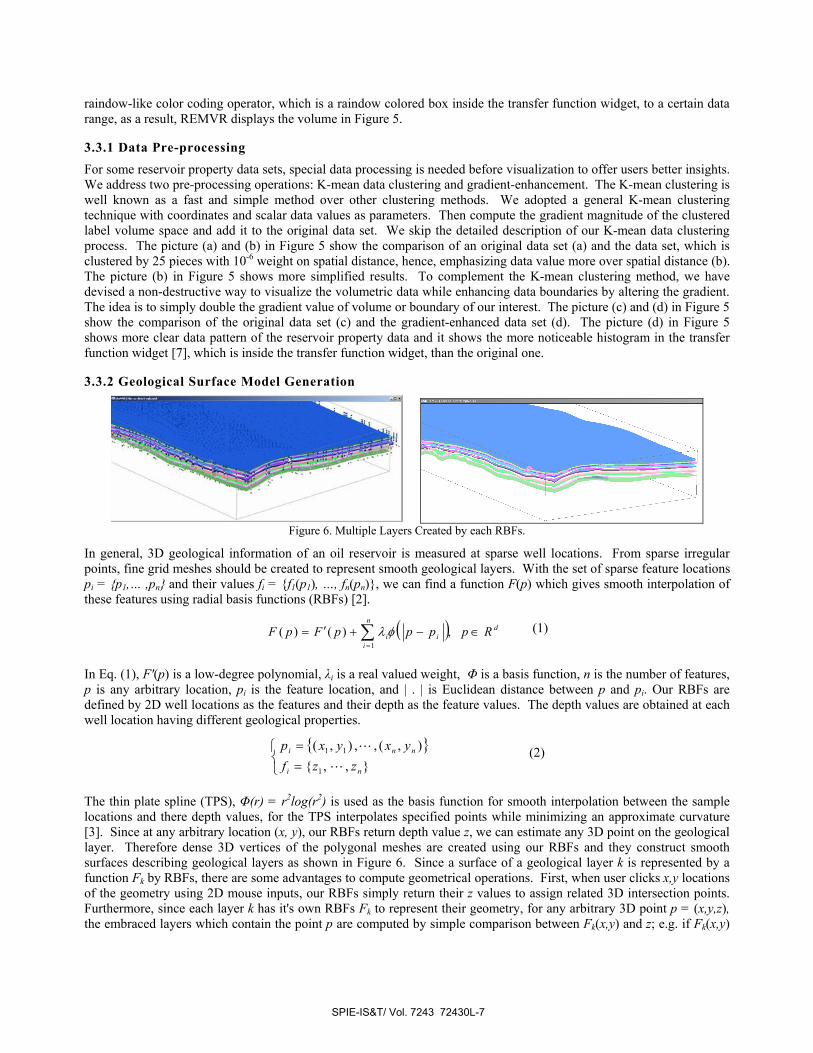
3.3.2 Geological Surface Model Generation
Figure 6. Multiple Layers Created by each RBFs.
In general, 3D geological information of an oil reservoir is measured at sparse well locations. From sparse irregular points, fine grid meshes should be created to represent smooth geological layers. With the set of sparse feature locations pi = {p1,… ,pn} and their values fi = {f1(p1), …, fn(pn)}, we can find a function F(p) which gives smooth interpolation of these features using radial basis functions (RBFs) [2].
( )∑=
∈−+′=n
i
dii RppppFpF
1
,)()( φλ (1)
In Eq. (1), F'(p) is a low-degree polynomial, λi is a real valued weight, Φ is a basis function, n is the number of features, p is any arbitrary location, pi is the feature location, and | . | is Euclidean distance between p and pi. Our RBFs are defined by 2D well locations as the features and their depth as the feature values. The depth values are obtained at each well location having different geological properties.
{ }⎩⎨⎧
==
},,{),(,,),(
1
11
ni
nni
zzfyxyxp
L
L (2)
The thin plate spline (TPS), Φ(r) = r2log(r2) is used as the basis function for smooth interpolation between the sample locations and there depth values, for the TPS interpolates specified points while minimizing an approximate curvature [3]. Since at any arbitrary location (x, y), our RBFs return depth value z, we can estimate any 3D point on the geological layer. Therefore dense 3D vertices of the polygonal meshes are created using our RBFs and they construct smooth surfaces describing geological layers as shown in Figure 6. Since a surface of a geological layer k is represented by a function Fk by RBFs, there are some advantages to compute geometrical operations. First, when user clicks x,y locations of the geometry using 2D mouse inputs, our RBFs simply return their z values to assign related 3D intersection points. Furthermore, since each layer k has it's own RBFs Fk to represent their geometry, for any arbitrary 3D point p = (x,y,z), the embraced layers which contain the point p are computed by simple comparison between Fk(x,y) and z; e.g. if Fk(x,y)
SPIE-IS&T/ Vol. 7243 72430L-7
< z < Fk+1(x,y), then p=(x,y,z) is located between layer k and layer k+1. A similar technique is used to generate other surfaces, for example, faults.
4. DATA VISUALIZATION AND EXPLORATION In this section, we show several examples of what REMIS can do in terms of data exploration and visualization. We assume that “Reservoir_LH” is a reservoir data object, which has all related data sets including data objects and visual objects. REMVR supports visualization of a 3D volume box to display oil reservoir property data sets using the visualization type called, “3D Volume”. “Geometry” is used to specify whether a given volume data needs to be voxelized with geometry information given or not by REMVR. The complete example of the PDG sentence is: For Reservoir_LH with Geometry, show 3D Volume of Oil Saturation.
The PDG sentence above displays a oil saturation data set in Reservoir_LH as a 3D volume. Unless colors specified, REMVR uses its default color scheme. Users can assign a color to a specified data range of the volume data interactively:
For Oil Saturation in Reservoir_LH, show Red_color, [where Oil Saturation > 10K and Oil Saturation < 100K].
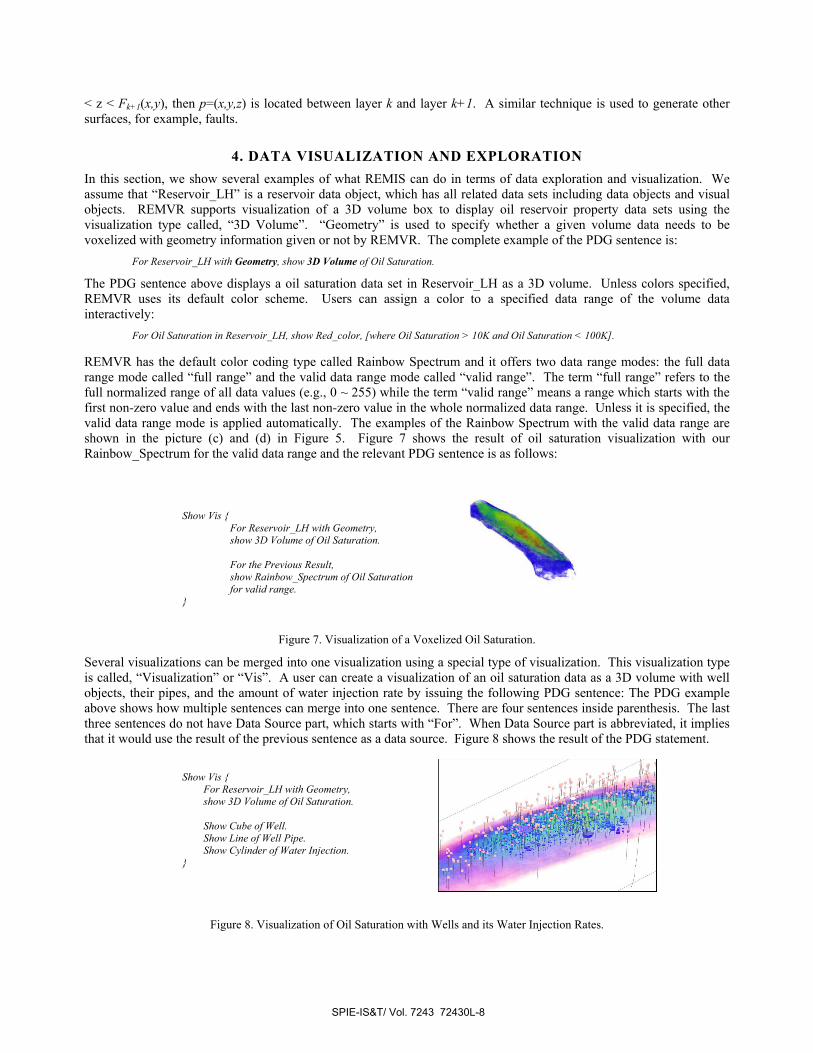
REMVR has the default color coding type called Rainbow Spectrum and it offers two data range modes: the full data range mode called “full range” and the valid data range mode called “valid range”. The term “full range” refers to the full normalized range of all data values (e.g., 0 ~ 255) while the term “valid range” means a range which starts with the first non-zero value and ends with the last non-zero value in the whole normalized data range. Unless it is specified, the valid data range mode is applied automatically. The examples of the Rainbow Spectrum with the valid data range are shown in the picture (c) and (d) in Figure 5. Figure 7 shows the result of oil saturation visualization with our Rainbow_Spectrum for the valid data range and the relevant PDG sentence is as follows:
Figure 7. Visualization of a Voxelized Oil Saturation.
Several visualizations can be merged into one visualization using a special type of visualization. This visualization type is called, “Visualization” or “Vis”. A user can create a visualization of an oil saturation data as a 3D volume with well objects, their pipes, and the amount of water injection rate by issuing the following PDG sentence: The PDG example above shows how multiple sentences can merge into one sentence. There are four sentences inside parenthesis. The last three sentences do not have Data Source part, which starts with “For”. When Data Source part is abbreviated, it implies that it would use the result of the previous sentence as a data source. Figure 8 shows the result of the PDG statement.
Figure 8. Visualization of Oil Saturation with Wells and its Water Injection Rates.
Show Vis { For Reservoir_LH with Geometry, show 3D Volume of Oil Saturation. Show Cube of Well. Show Line of Well Pipe.
Show Cylinder of Water Injection. }
Show Vis { For Reservoir_LH with Geometry, show 3D Volume of Oil Saturation. For the Previous Result, show Rainbow_Spectrum of Oil Saturation for valid range.
}
SPIE-IS&T/ Vol. 7243 72430L-8
PDGS also can help to visualize oil production data and water injection data, which are a set of time-series values for each specific well. We assume that all oil production data and water injection data are tied with its well geo-location and we display oil production and water injection data based on their well information. The PDG sentence below describes a visualization of an oil saturation sub-surface model with the amount of an oil production as bubble map and the amount of a water injection as a cylinder:
Show Vis { For Reservoir_LH, show 3D Volume of Oil Saturation. For Previous Result, show Bubble Map of Oil Production. For Previous Result, show Cylinder of Water Injection. }
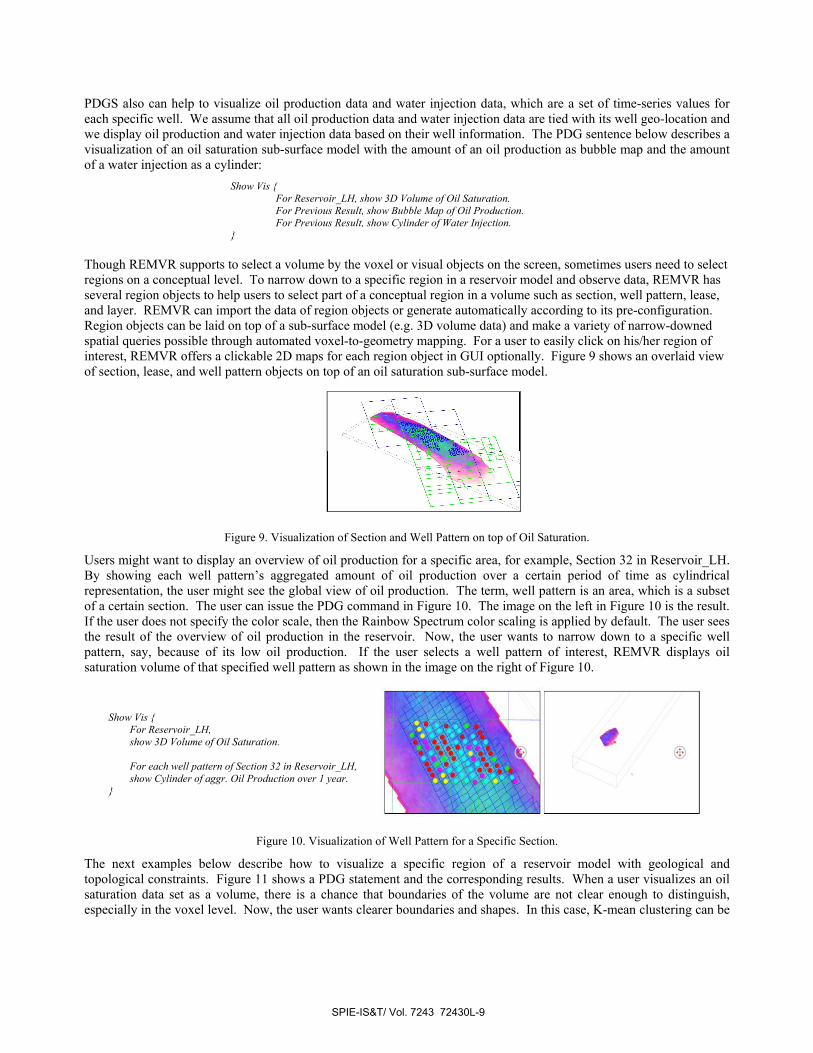
Though REMVR supports to select a volume by the voxel or visual objects on the screen, sometimes users need to select regions on a conceptual level. To narrow down to a specific region in a reservoir model and observe data, REMVR has several region objects to help users to select part of a conceptual region in a volume such as section, well pattern, lease, and layer. REMVR can import the data of region objects or generate automatically according to its pre-configuration. Region objects can be laid on top of a sub-surface model (e.g. 3D volume data) and make a variety of narrow-downed spatial queries possible through automated voxel-to-geometry mapping. For a user to easily click on his/her region of interest, REMVR offers a clickable 2D maps for each region object in GUI optionally. Figure 9 shows an overlaid view of section, lease, and well pattern objects on top of an oil saturation sub-surface model.
Figure 9. Visualization of Section and Well Pattern on top of Oil Saturation.
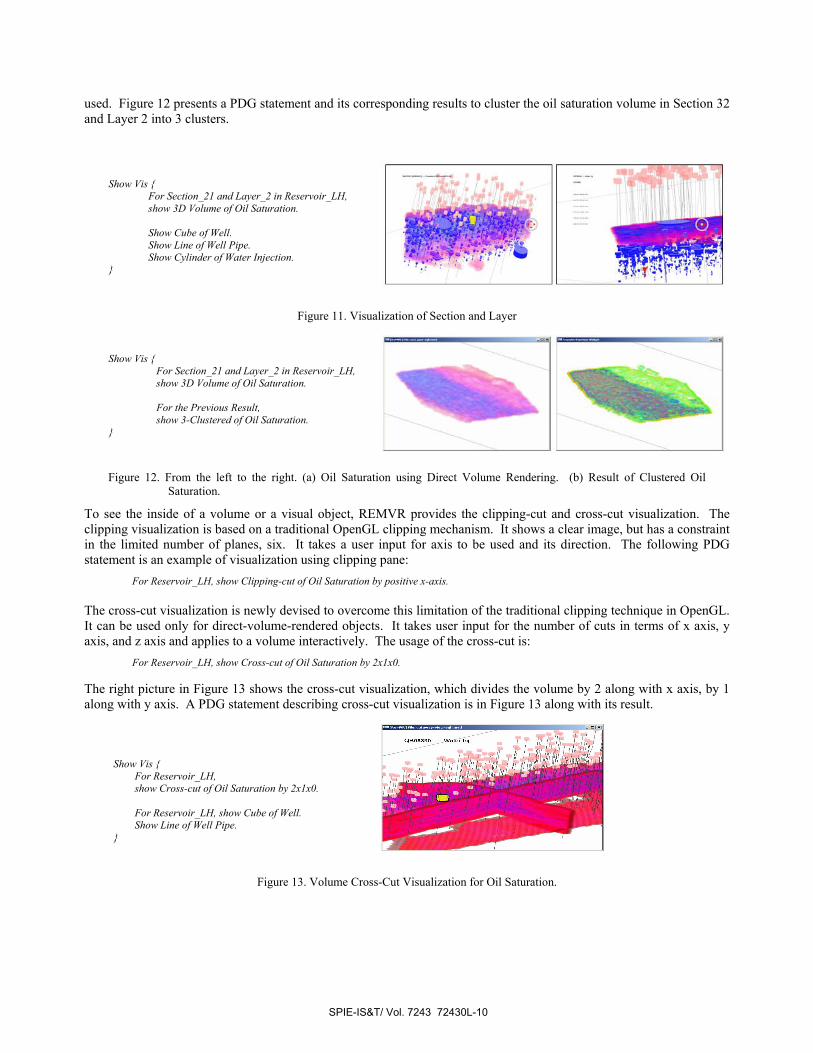
Users might want to display an overview of oil production for a specific area, for example, Section 32 in Reservoir_LH. By showing each well pattern’s aggregated amount of oil production over a certain period of time as cylindrical representation, the user might see the global view of oil production. The term, well pattern is an area, which is a subset of a certain section. The user can issue the PDG command in Figure 10. The image on the left in Figure 10 is the result. If the user does not specify the color scale, then the Rainbow Spectrum color scaling is applied by default. The user sees the result of the overview of oil production in the reservoir. Now, the user wants to narrow down to a specific well pattern, say, because of its low oil production. If the user selects a well pattern of interest, REMVR displays oil saturation volume of that specified well pattern as shown in the image on the right of Figure 10.
Figure 10. Visualization of Well Pattern for a Specific Section.
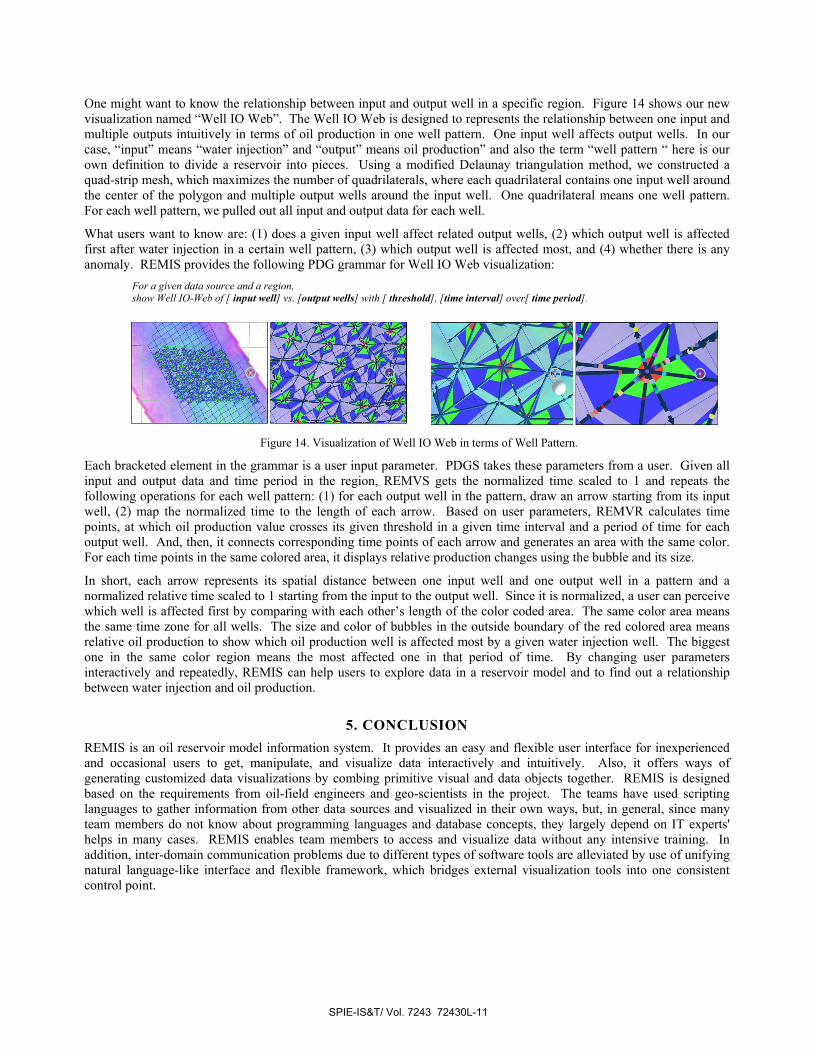
The next examples below describe how to visualize a specific region of a reservoir model with geological and topological constraints. Figure 11 shows a PDG statement and the corresponding results. When a user visualizes an oil saturation data set as a volume, there is a chance that boundaries of the volume are not clear enough to distinguish, especially in the voxel level. Now, the user wants clearer boundaries and shapes. In this case, K-mean clustering can be
Show Vis { For Reservoir_LH, show 3D Volume of Oil Saturation.
For each well pattern of Section 32 in Reservoir_LH, show Cylinder of aggr. Oil Production over 1 year.
}
SPIE-IS&T/ Vol. 7243 72430L-9
OO83eO
used. Figure 12 presents a PDG statement and its corresponding results to cluster the oil saturation volume in Section 32 and Layer 2 into 3 clusters.
Figure 11. Visualization of Section and Layer
Figure 12. From the left to the right. (a) Oil Saturation using Direct Volume Rendering. (b) Result of Clustered Oil
Saturation.
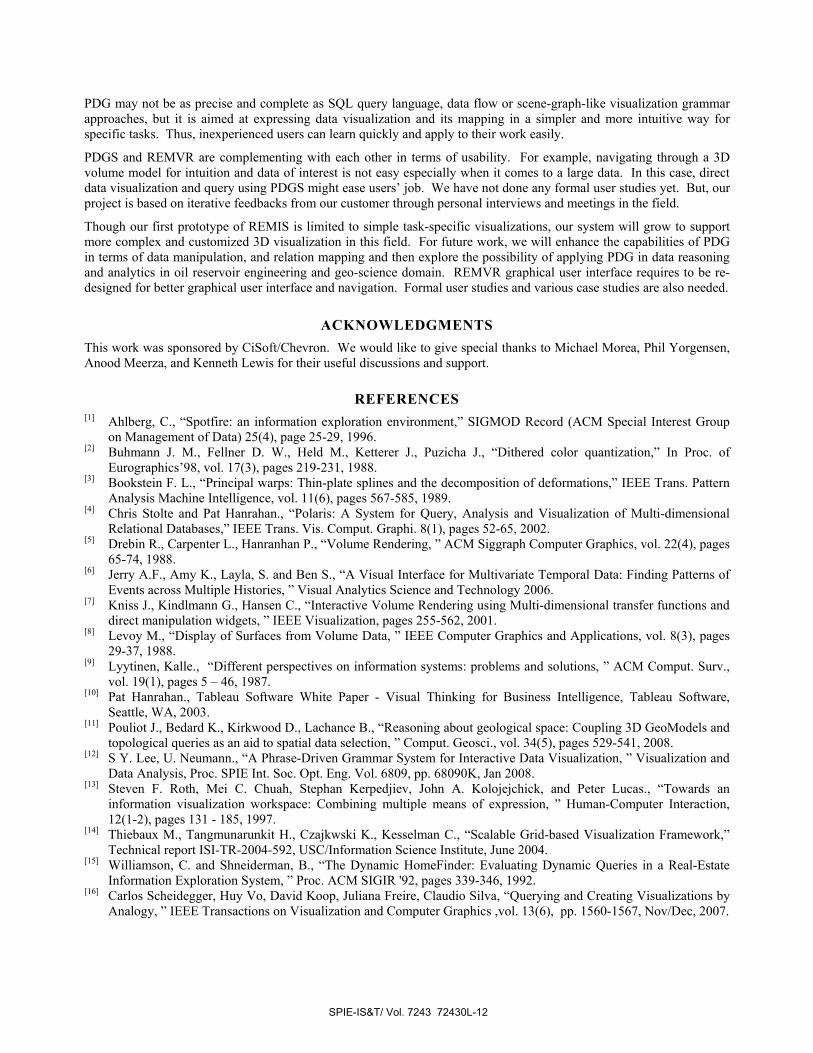
To see the inside of a volume or a visual object, REMVR provides the clipping-cut and cross-cut visualization. The clipping visualization is based on a traditional OpenGL clipping mechanism. It shows a clear image, but has a constraint in the limited number of planes, six. It takes a user input for axis to be used and its direction. The following PDG statement is an example of visualization using clipping pane:
For Reservoir_LH, show Clipping-cut of Oil Saturation by positive x-axis.
The cross-cut visualization is newly devised to overcome this limitation of the traditional clipping technique in OpenGL. It can be used only for direct-volume-rendered objects. It takes user input for the number of cuts in terms of x axis, y axis, and z axis and applies to a volume interactively. The usage of the cross-cut is:
For Reservoir_LH, show Cross-cut of Oil Saturation by 2x1x0.
The right picture in Figure 13 shows the cross-cut visualization, which divides the volume by 2 along with x axis, by 1 along with y axis. A PDG statement describing cross-cut visualization is in Figure 13 along with its result.
Figure 13. Volume Cross-Cut Visualization for Oil Saturation.
Show Vis { For Section_21 and Layer_2 in Reservoir_LH, show 3D Volume of Oil Saturation. Show Cube of Well. Show Line of Well Pipe. Show Cylinder of Water Injection.
}
Show Vis { For Section_21 and Layer_2 in Reservoir_LH, show 3D Volume of Oil Saturation. For the Previous Result, show 3-Clustered of Oil Saturation.
}
Show Vis { For Reservoir_LH, show Cross-cut of Oil Saturation by 2x1x0. For Reservoir_LH, show Cube of Well. Show Line of Well Pipe.
}
SPIE-IS&T/ Vol. 7243 72430L-10
One might want to know the relationship between input and output well in a specific region. Figure 14 shows our new visualization named “Well IO Web”. The Well IO Web is designed to represents the relationship between one input and multiple outputs intuitively in terms of oil production in one well pattern. One input well affects output wells. In our case, “input” means “water injection” and “output” means oil production” and also the term “well pattern “ here is our own definition to divide a reservoir into pieces. Using a modified Delaunay triangulation method, we constructed a quad-strip mesh, which maximizes the number of quadrilaterals, where each quadrilateral contains one input well around the center of the polygon and multiple output wells around the input well. One quadrilateral means one well pattern. For each well pattern, we pulled out all input and output data for each well.
What users want to know are: (1) does a given input well affect related output wells, (2) which output well is affected first after water injection in a certain well pattern, (3) which output well is affected most, and (4) whether there is any anomaly. REMIS provides the following PDG grammar for Well IO Web visualization: For a given data source and a region, show Well IO-Web of [ input well] vs. [output wells] with [ threshold], [time interval] over[ time period].
Figure 14. Visualization of Well IO Web in terms of Well Pattern.
Each bracketed element in the grammar is a user input parameter. PDGS takes these parameters from a user. Given all input and output data and time period in the region, REMVS gets the normalized time scaled to 1 and repeats the following operations for each well pattern: (1) for each output well in the pattern, draw an arrow starting from its input well, (2) map the normalized time to the length of each arrow. Based on user parameters, REMVR calculates time points, at which oil production value crosses its given threshold in a given time interval and a period of time for each output well. And, then, it connects corresponding time points of each arrow and generates an area with the same color. For each time points in the same colored area, it displays relative production changes using the bubble and its size.
In short, each arrow represents its spatial distance between one input well and one output well in a pattern and a normalized relative time scaled to 1 starting from the input to the output well. Since it is normalized, a user can perceive which well is affected first by comparing with each other’s length of the color coded area. The same color area means the same time zone for all wells. The size and color of bubbles in the outside boundary of the red colored area means relative oil production to show which oil production well is affected most by a given water injection well. The biggest one in the same color region means the most affected one in that period of time. By changing user parameters interactively and repeatedly, REMIS can help users to explore data in a reservoir model and to find out a relationship between water injection and oil production.
5. CONCLUSION REMIS is an oil reservoir model information system. It provides an easy and flexible user interface for inexperienced and occasional users to get, manipulate, and visualize data interactively and intuitively. Also, it offers ways of generating customized data visualizations by combing primitive visual and data objects together. REMIS is designed based on the requirements from oil-field engineers and geo-scientists in the project. The teams have used scripting languages to gather information from other data sources and visualized in their own ways, but, in general, since many team members do not know about programming languages and database concepts, they largely depend on IT experts' helps in many cases. REMIS enables team members to access and visualize data without any intensive training. In addition, inter-domain communication problems due to different types of software tools are alleviated by use of unifying natural language-like interface and flexible framework, which bridges external visualization tools into one consistent control point.
SPIE-IS&T/ Vol. 7243 72430L-11
PDG may not be as precise and complete as SQL query language, data flow or scene-graph-like visualization grammar approaches, but it is aimed at expressing data visualization and its mapping in a simpler and more intuitive way for specific tasks. Thus, inexperienced users can learn quickly and apply to their work easily.
PDGS and REMVR are complementing with each other in terms of usability. For example, navigating through a 3D volume model for intuition and data of interest is not easy especially when it comes to a large data. In this case, direct data visualization and query using PDGS might ease users’ job. We have not done any formal user studies yet. But, our project is based on iterative feedbacks from our customer through personal interviews and meetings in the field.
Though our first prototype of REMIS is limited to simple task-specific visualizations, our system will grow to support more complex and customized 3D visualization in this field. For future work, we will enhance the capabilities of PDG in terms of data manipulation, and relation mapping and then explore the possibility of applying PDG in data reasoning and analytics in oil reservoir engineering and geo-science domain. REMVR graphical user interface requires to be re-designed for better graphical user interface and navigation. Formal user studies and various case studies are also needed.
ACKNOWLEDGMENTS This work was sponsored by CiSoft/Chevron. We would like to give special thanks to Michael Morea, Phil Yorgensen, Anood Meerza, and Kenneth Lewis for their useful discussions and support.
REFERENCES [1] Ahlberg, C., “Spotfire: an information exploration environment,” SIGMOD Record (ACM Special Interest Group
on Management of Data) 25(4), page 25-29, 1996. [2] Buhmann J. M., Fellner D. W., Held M., Ketterer J., Puzicha J., “Dithered color quantization,” In Proc. of
Eurographics’98, vol. 17(3), pages 219-231, 1988. [3] Bookstein F. L., “Principal warps: Thin-plate splines and the decomposition of deformations,” IEEE Trans. Pattern
Analysis Machine Intelligence, vol. 11(6), pages 567-585, 1989. [4] Chris Stolte and Pat Hanrahan., “Polaris: A System for Query, Analysis and Visualization of Multi-dimensional
Relational Databases,” IEEE Trans. Vis. Comput. Graphi. 8(1), pages 52-65, 2002. [5] Drebin R., Carpenter L., Hanranhan P., “Volume Rendering, ” ACM Siggraph Computer Graphics, vol. 22(4), pages
65-74, 1988. [6] Jerry A.F., Amy K., Layla, S. and Ben S., “A Visual Interface for Multivariate Temporal Data: Finding Patterns of
Events across Multiple Histories, ” Visual Analytics Science and Technology 2006. [7] Kniss J., Kindlmann G., Hansen C., “Interactive Volume Rendering using Multi-dimensional transfer functions and
direct manipulation widgets, ” IEEE Visualization, pages 255-562, 2001. [8] Levoy M., “Display of Surfaces from Volume Data, ” IEEE Computer Graphics and Applications, vol. 8(3), pages
29-37, 1988. [9] Lyytinen, Kalle., “Different perspectives on information systems: problems and solutions, ” ACM Comput. Surv.,
vol. 19(1), pages 5 – 46, 1987. [10] Pat Hanrahan., Tableau Software White Paper - Visual Thinking for Business Intelligence, Tableau Software,
Seattle, WA, 2003. [11] Pouliot J., Bedard K., Kirkwood D., Lachance B., “Reasoning about geological space: Coupling 3D GeoModels and
topological queries as an aid to spatial data selection, ” Comput. Geosci., vol. 34(5), pages 529-541, 2008. [12] S Y. Lee, U. Neumann., “A Phrase-Driven Grammar System for Interactive Data Visualization, ” Visualization and
Data Analysis, Proc. SPIE Int. Soc. Opt. Eng. Vol. 6809, pp. 68090K, Jan 2008. [13] Steven F. Roth, Mei C. Chuah, Stephan Kerpedjiev, John A. Kolojejchick, and Peter Lucas., “Towards an
information visualization workspace: Combining multiple means of expression, ” Human-Computer Interaction, 12(1-2), pages 131 - 185, 1997.
[14] Thiebaux M., Tangmunarunkit H., Czajkwski K., Kesselman C., “Scalable Grid-based Visualization Framework,” Technical report ISI-TR-2004-592, USC/Information Science Institute, June 2004.
[15] Williamson, C. and Shneiderman, B., “The Dynamic HomeFinder: Evaluating Dynamic Queries in a Real-Estate Information Exploration System, ” Proc. ACM SIGIR '92, pages 339-346, 1992.
[16] Carlos Scheidegger, Huy Vo, David Koop, Juliana Freire, Claudio Silva, “Querying and Creating Visualizations by Analogy, ” IEEE Transactions on Visualization and Computer Graphics ,vol. 13(6), pp. 1560-1567, Nov/Dec, 2007.
SPIE-IS&T/ Vol. 7243 72430L-12