Embed Size (px)
Citation preview

Finding Petroleum 16 May 2017
Reservoir engineering of fractured systems
(very brief overview)Kes Heffer
Reservoir Dynamics Ltd.
1

Finding Petroleum 16 May 2017
Fracture & Vuggy Porosity estimates
• Weber & Bakker (1981) SPE 10332
Using cores (31), outcrops (4), material balance (19), res eng (4), logs (3)
• Monoclines & low-dip anticlines 0.01 - 0.1% 6
• Strongly folded anticlines 0.1 - 0.3% 13
• Enhanced by leaching 0.2 - 1.0% 9
• Karst aquifers, surface – shallow 0.2 - 3.0% 14
• Deeply buried brecciated karst/ collapsed breccias 0.5 - 2.0% 5
• Fractured chert 5.0 - 8.0% 1
• Fractured tuffs / igneous rocks 2.0 - 8.0% 3
-51
• Van Golf-Racht ‘Fundamentals of Fractured Reservoir Engineering’
From core and log analysis (unspecified)
• Macrofracture network 0.01 - 0.5%
• Isolated fissures 0.001 - 0.01%
• Fissure network 0.01 - 2%
• Vugs (in Karstic rock) 0.1 - 3%
2
No. of fields

Finding Petroleum 16 May 2017
time
pre
ssu
re
Warren & Root dual porosity model applied to pressure build-up well-tests
3
Separation depends on w
w = f𝐶f
f𝐶f+m𝐶m
Proportion of
storage due to
fractures
Transition time depends on l
l = a.Km.rw2
Kf
What is fracture compressibility, 𝐶f ??
Local fracture storage masks 1st
straight line

Finding Petroleum 16 May 2017
Material Balance; example formulation
4
From Penuela et al. SPE 68831
Initial oil + gas in fractures
= Later oil + gas in fractures
+oil + gas from matrix
+ Expansion of fracture connate water
- oil + gas produced
Expansion of fracture pore volume
+
Gas from solution
Or gas-cap expansion
Or aquifer influx
Rearrange terms to give linear equation in oil-in-place in matrix and in fractures
• Errors can be large• Non-uniform pressures (esp.
poor communication between matrix & fractures)
• Reservoir pressure ~ bubble point and gas comes out of solution

Finding Petroleum 16 May 2017
Dual porosity simulation modelTransfer function for flow from matrix into fractures
5
s is the shape factor, 4n(n+2)/L2
n is the number of flow dimensionsL is characteristic dimension of matrix blockkm is the matrix permeabilitykr is the relative permeabilitym is the fluid viscositypm is the average matrix pressure pf is the fracture pressure
• Distribution of shape factor values• Time-varying shape factors
Viscous forces
𝜏 = 𝜎𝑘𝑚𝑘𝑟
μ𝑝𝑚 − 𝑝𝑓 + ……+ Gravity forces + Capillary forces
(Sudation)
Co-current vs counter-current?
Direct flow between matrix blocks => dual permeability model
Capillary continuity?
reco
very
Cumulative volume injected
+ pore, fracture, fluid vol. expansions

Finding Petroleum 16 May 2017
Frequency distribution of fracture porosity
Unsaturated fractured tuffIllman, Water Res Res v41 (2005)
Crampin, Geophys. J. Int. (1994) 118Aspect ratio assumed = 0.02
Unsaturated fractured tuffIllman, Water Res Res v41 (2005)

Finding Petroleum 16 May 2017
Fracture lengths and apertures
7
~N, density
𝑛(𝑐 .𝑑𝑐
𝑉= 𝑁. 𝑐−4.dcFor a volume: Max. fracture aperture vs length
From core data in 2 separate fieldsHeffer & Koutsabeloulis, 1993
Field 1
Field 2

Finding Petroleum 16 May 2017
Permeability increases with scale of measurement
8
Fractured granite
and so does porosity
Crystalline rocks ‘Double porosity’ limestone/dolomite
Cross-hole hydraulic testsIllman & Tartakovsky, Ground Water 2006 v44(4)

Finding Petroleum 16 May 2017
Well-test poroperms in fractured reservoirs are weakly related to fracture densities in wellsIllman, 2005, WATER RESOURCES RESEARCH, VOL. 41
9
Porosity from test
Perm’yfrom test
Fracture density from BHTV (counts/m) Fracture connectivity is complex!
Finding Petroleum 16 May 2017
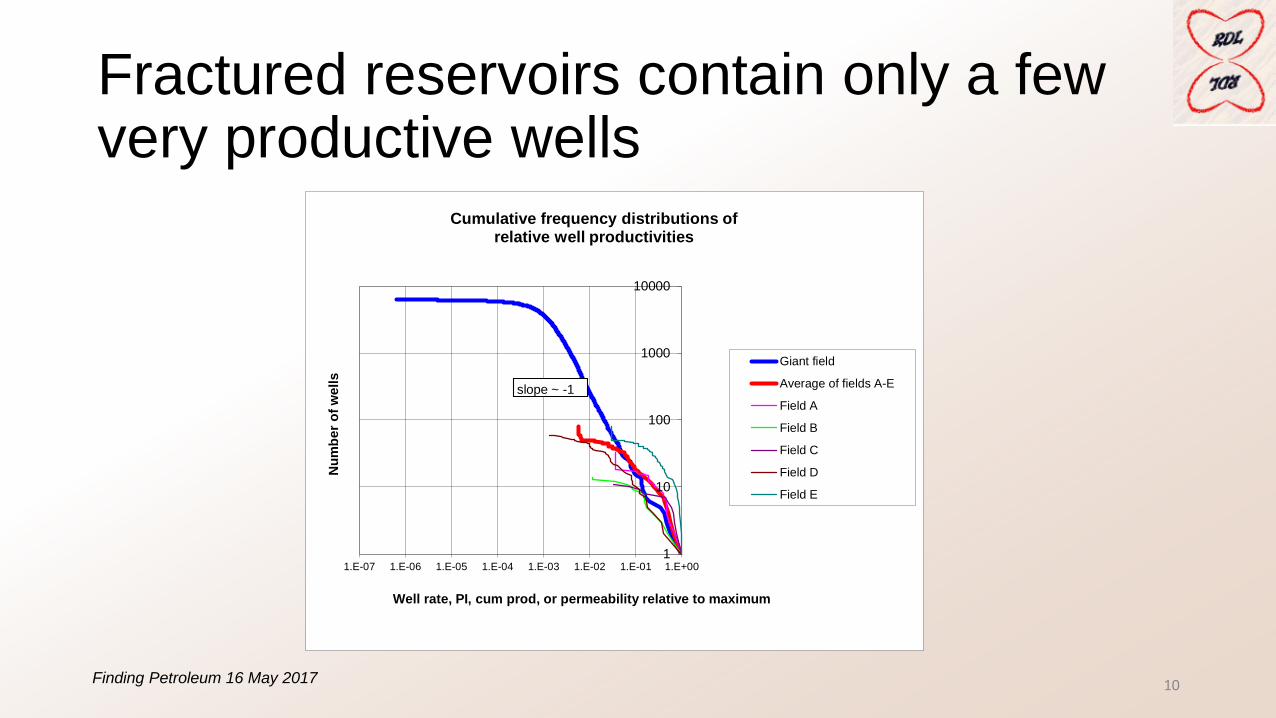
Fractured reservoirs contain only a few very productive wells
10
1
10
100
1000
10000
1.E-07 1.E-06 1.E-05 1.E-04 1.E-03 1.E-02 1.E-01 1.E+00
Nu
mb
er
of
we
lls
Well rate, PI, cum prod, or permeability relative to maximum
Cumulative frequency distributions of relative well productivities
Giant field
Average of fields A-E
Field A
Field B
Field C
Field D
Field E
slope ~ -1

Finding Petroleum 16 May 2017
Time-dependent well-test permeabilities(large carbonate field)
frequency distribution of d(kh)/dt
0
0.1
0.2
0.3
0.4
0.5
0.6
-0.5 -0.3 -0.1 0.1 0.3 0.5
d(Kh)/dt / final(Kh) (per year)
producers injectors
cumulative frequency distribution of
absolute values of d(Kh)/dt / final(Kh)
producers and injectors combined
0.001
0.01
0.1
1
0.00001 0.001 0.1 10 1000 100000
abs [d(Kh)/dt / final(Kh)] (per year)
Of the wells with multiple tests, 20% showed
rates of change of Kh more than 10% per
annum

Finding Petroleum 16 May 2017
Field Directionality is a vital influence on recovery.Areal sweep efficiency and anisotropic permeability(classic: Caudle 1959)
12
0
10
20
30
40
50
60
70
80
90
100
0.1 1.0 10.0
Mobility ratio
Isotropic
Favourable
Unfavourable
Areal sweep efficiency, % To breakthough:
Physical model with Kmax/Kmin = 16
Isotropic
Favourable
Unfavourable
To 90% watercut:
Orientation (+/- 45o) of well pattern relative to permeability axes can change recoveries by 10’s of % points
For a 5 spot pattern of wells:
I
P
P
P
P
unfavourable
Kmax
Kmin
favourable
Permeability axes
Kmax
Kmin
‘Fractured’Reservoirs(33 cases)
Flooding directionalities are strongly related to stress state
Shmax

Finding Petroleum 16 May 2017
Strain modelling for fracture spatial distribution from palinspastic reconstruction of structure followed by FE forward modelling of structural history -> inelastic strains
Combination of structural & depletion effects – predicted permeability vs actual r2~ 0.6
Test
per
mea
bili
ties
, md
Plastic strain

Finding Petroleum 16 May 2017
Time-dependent fracture permeabilityExacerbation of thief layer (higher density fracturing) by cooling & pressurisation – coupled geomechanical-flow modelling
initial
Final, after
significant
time of cool
water
injection
Ratio, final/initial
Permeabilities across cross-section
Layered carbonate reservoir

Finding Petroleum 16 May 2017
Well flowrate fluctuation correlations followstructural trends
Structural
lineaments
Porosity
trends
Core
fracture
density
trends
Composite of
all 4 principal
components

Finding Petroleum 16 May 2017
Scientific test of a model is whether it can skilfully predict new data
Probabilistic forecasts vs reality
16
Comparison between probabilistic forecast of production1 and subsequent actual production2 from 4
fractured chalk/sst fields in a Norwegian production licence
1published by Jensen, T.B. in SPE 49091, 1998
2published by Norwegian Petroleum Directorate on website: http://factpages.npd.no/factpages/
* each difference normalised by prediction standard deviation, which was estimated from forecasts as (P90-P10)/2.56.
The distribution of normalised errors* in prediction is much wider than the forecast uncertainties.
The standard deviation of errors appears to be ~3 x predicted standard deviation.

Finding Petroleum 16 May 2017
The Naked Truth?
“All models are wrong; some are useful” George Box


![[T. Van Golf-Racht] Fundamentals of Fractured Reservoir Engineering](https://img.pdfslide.us/doc/110x75/55cf989c550346d03398a841/t-van-golf-racht-fundamentals-of-fractured-reservoir-engineering.jpg)


![Golf-Racht, T. D. Van. - Fundamentals of Fractured Reservoir Engineering[1]](https://img.pdfslide.us/doc/110x75/55cf98ae550346d033990efe/golf-racht-t-d-van-fundamentals-of-fractured-reservoir-engineering1.jpg)