Embed Size (px)
Citation preview

Reserve Bank of Malawi
Monthly
Economic
Review
March 2021

Table of Contents
1.0 INTRODUCTION ...................................................................................................... 1
1.1 Gross Official Reserves ..............................................................................................1
1.2 Exchange Rates ...........................................................................................................1
1.3 Money Supply .............................................................................................................1
1.4 Interest Rates ..............................................................................................................1
1.5 Central Government Budgetary Operations ...........................................................1
1.6 Inflation .......................................................................................................................1
2.0 EXTERNAL SECTOR .............................................................................................. 2
3.0 BANKING AND FINANCE ...................................................................................... 3
4.0 CENTRAL GOVERNMENT BUDGETARY OPERATIONS .............................. 6
5.0 PRODUCTION AND PRICES ................................................................................. 7
6.0 MONEY AND SECURITIES MARKET ................................................................. 8
7.0 CAPITAL MARKETS ............................................................................................. 13
LIST OF TABLES
Table 1: Money Supply and its Sources (in MK’ billion, unless otherwise stated)......................... 3
Table 2: Sectoral Composition of Private Sector Credit (in percent of total credit) ...................... 5
Table 3: Central Government Budgetary Operations (MK’ billion) ............................................... 7
Table 4: Financial Market Operations (MK’ billion) ....................................................................... 9
Table 5: Treasury Bills Issuance and Maturity (MK’ billion) ....................................................... 10
Table 6: Banking System Liquidity (MK’ billion) ........................................................................... 12
Table 7: Interest Rate Structure (percent) ....................................................................................... 12
Table 8: Selected Economic Indicators (in MK’ billion, unless otherwise stated) ........................ 16
Table 9: Year on year Inflation (2012=100, 2017=100) ................................................................... 17
Table 10: National Consumer Price Indices (2017=100) ................................................................. 18
Table 11: Selected Average Exchange Rates .................................................................................... 19
Table 12: Selected End Period Exchange Rates .............................................................................. 20
Table 13: Malawi All Share Index (1999=100) ................................................................................ 21

GENERAL NOTES
This Economic Review is produced by the Reserve Bank of Malawi (RBM) with the aim of providing
current economic information to stakeholders. The Review is expected to be published within six
weeks after the end of the review month. This particular issue outlines domestic financial and
macroeconomic developments during the month of March 2021.
Owing to the rounding up of figures, separate items may not always sum to corresponding totals.
In the tables, the following symbols should be noted:
.. Means not available
- Means nil or less than one half the significant digit
* Means projection
+ Means revised figure
^ Means preliminary figure
All queries relating to this publication should be forwarded to the Director, Economic Policy
Research Department, Reserve Bank of Malawi, P.O. Box 30063, Capital City, Lilongwe 3.
Tel: 265 1 771 600; or Fax 265 1 770 593; or Email: [email protected].
Monthly Economic Review March 2021
1
1.0 INTRODUCTION
This Economic Review highlights economic developments for the month of March 2021. The
analysis covers developments in exchange rates, monetary aggregates, credit and interest rates,
inflation, national accounts and capital markets. The report also highlights developments in
government operations.1
1.1 Gross Official Reserves
Gross official reserves closed March 2021 at US$399.7 million (1.9 months of imports) compared to
US$482.7 million (2.3 months of imports) recorded in the preceding month.
1.2 Exchange Rates
The Malawi kwacha exhibited mixed performance against its major trading partners’ currencies in
March 2021.
1.3 Money Supply
Money supply (M2) registered an annual growth rate of 24.2 percent in March 2021, up from 18.2
percent recorded in the preceding month and 10.2 percent registered in a corresponding month of
2020.
1.4 Interest Rates
The Policy rate remained at 12.00 percent in March 2021, where it has been since November 2020.
Meanwhile, the Reference rate dropped to 11.90 percent in the month under review, down from 12.00
percent recorded in the previous month.
1.5 Central Government Budgetary Operations
Central government budgetary operations recorded an overall deficit equivalent to 0.9 percent of GDP
in March 2021, compared to a deficit of 0.4 percent of GDP in the preceding month.
1.6 Inflation
Headline inflation rate accelerated by 1.1 percentage points to 9.4 percent in March 2021 from 8.3
percent registered in the previous month. Both food and non-food inflation contributed to this
upsurge.
1 The Review reports only government transactions through the Reserve Bank of Malawi and the commercial banks

Monthly Economic Review March 2021
2
2.0 EXTERNAL SECTOR
2.1 Merchandise Trade
According to the Malawi Revenue Authority (MRA) data, merchandise trade deficit was estimated
at US$156.9 million (K124.3 billion) in March 2021 compared to a deficit of US$133.2 million
(K104.5 billion) recorded in the previous month, and US$164.6 million (K122.7 billion) registered
in a corresponding period of 2020. The widening of the trade deficit was attributed to a faster increase
in imports than the export proceeds required to finance them. Specifically, imports rose by US$36.8
million to US$232.5 million (K183.6 billion) in March 2021 from US$195.9 million (K153.5 billion)
in the preceding month. On the other hand, exports increased by US$12.8 million to US$75.6 million
(K59.4 billion) from the preceding month’s position of US$62.8 million (K48.9 billion).
2.2 The Malawi Kwacha Exchange Rate
The Malawi kwacha exhibited mixed performance against its trading partners’ currencies in March
2021. In particular, the kwacha recorded a monthly depreciation of 0.4 percent against the United
States dollar and traded at K790.30 per US dollar at the end of March 2021 due to continued foreign
exchange supply shortages on the market. However, the local currency appreciated against the British
pound and the euro by 0.1 percent and 1.4 percent and traded at K1,139.62 per pound and K993.04
per euro as of end-March 2021, respectively. The appreciation reflected weakening of the pound and
the euro amid COVID-19 mutations and negative sentiments concerning the side effects of the
coronavirus vaccine.
Following a spike in number of coronavirus cases in India, the kwacha also appreciated against the
Indian rupee by 0.9 percent and traded at K10.67 per rupee at the end of March 2021. Similarly, the
local currency appreciated against the Japanese yen by 3.6 percent and traded at K7.09 per Japanese
yen. The appreciation of the kwacha was partly explained by a relatively weaker yen as investors
preferred riskier assets than the Japanese investments facilities during the period under review.
Meanwhile, the kwacha remained relatively stable against the Chinese yuan and traded at K119.54
per yuan at the end of the review month.
Within the SADC region, the local currency depreciated by 0.8 percent against the South African
rand and traded at K56.13 per rand at the end of March 2021. The depreciation of the kwacha was
explained by strengthening of the rand on account of rising commodity prices on the international
markets following a rebound in global demand. However, the Malawi kwacha gained 0.9 percent
against the Zambian kwacha (ZMK) and traded at K35.54 per ZMK at the end of the review period.
Monthly Economic Review March 2021
3
The supply of foreign exchange in Zambia continued to dwindle during the review period, leading to
the loss in value of its currency.
3.0 BANKING AND FINANCE
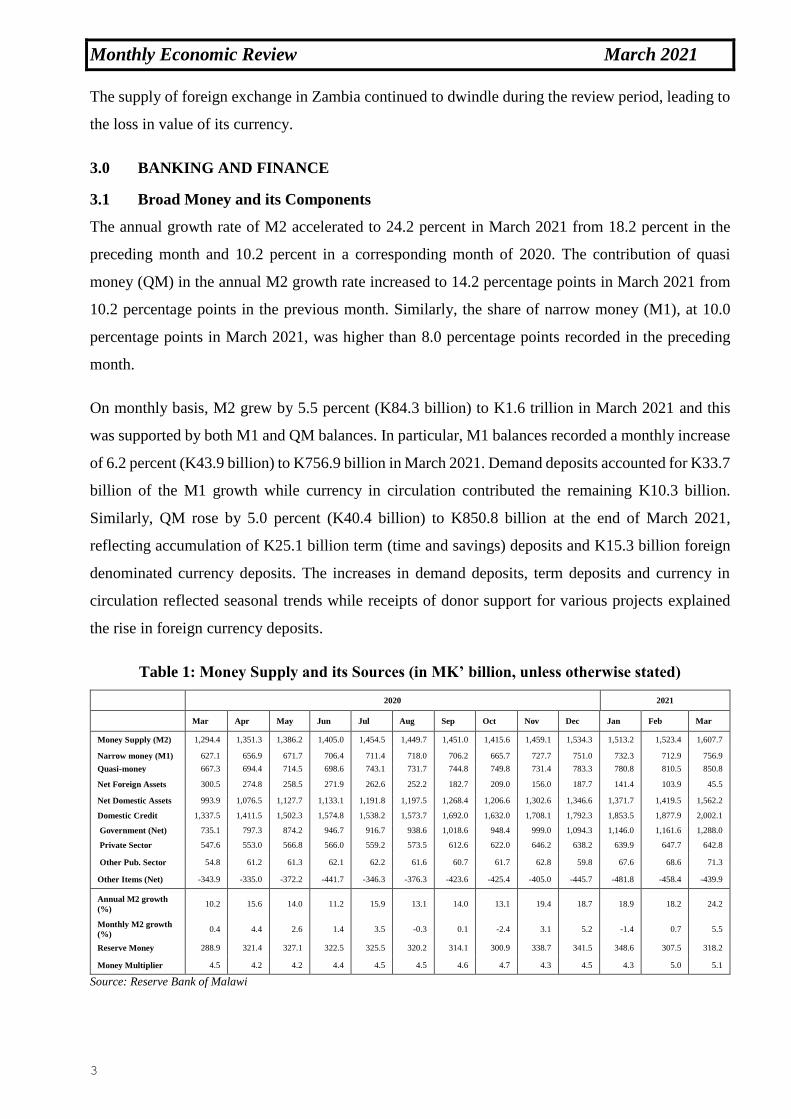
3.1 Broad Money and its Components
The annual growth rate of M2 accelerated to 24.2 percent in March 2021 from 18.2 percent in the
preceding month and 10.2 percent in a corresponding month of 2020. The contribution of quasi
money (QM) in the annual M2 growth rate increased to 14.2 percentage points in March 2021 from
10.2 percentage points in the previous month. Similarly, the share of narrow money (M1), at 10.0
percentage points in March 2021, was higher than 8.0 percentage points recorded in the preceding
month.
On monthly basis, M2 grew by 5.5 percent (K84.3 billion) to K1.6 trillion in March 2021 and this
was supported by both M1 and QM balances. In particular, M1 balances recorded a monthly increase
of 6.2 percent (K43.9 billion) to K756.9 billion in March 2021. Demand deposits accounted for K33.7
billion of the M1 growth while currency in circulation contributed the remaining K10.3 billion.
Similarly, QM rose by 5.0 percent (K40.4 billion) to K850.8 billion at the end of March 2021,
reflecting accumulation of K25.1 billion term (time and savings) deposits and K15.3 billion foreign
denominated currency deposits. The increases in demand deposits, term deposits and currency in
circulation reflected seasonal trends while receipts of donor support for various projects explained
the rise in foreign currency deposits.
Table 1: Money Supply and its Sources (in MK’ billion, unless otherwise stated)
2020 2021
Mar Apr May Jun Jul Aug Sep Oct Nov Dec Jan Feb Mar
Money Supply (M2) 1,294.4 1,351.3 1,386.2 1,405.0 1,454.5 1,449.7 1,451.0 1,415.6 1,459.1 1,534.3 1,513.2 1,523.4 1,607.7
Narrow money (M1) 627.1 656.9 671.7 706.4 711.4 718.0 706.2 665.7 727.7 751.0 732.3 712.9 756.9
Quasi-money 667.3 694.4 714.5 698.6 743.1 731.7 744.8 749.8 731.4 783.3 780.8 810.5 850.8
Net Foreign Assets 300.5 274.8 258.5 271.9 262.6 252.2 182.7 209.0 156.0 187.7 141.4 103.9 45.5
Net Domestic Assets 993.9 1,076.5 1,127.7 1,133.1 1,191.8 1,197.5 1,268.4 1,206.6 1,302.6 1,346.6 1,371.7 1,419.5 1,562.2
Domestic Credit 1,337.5 1,411.5 1,502.3 1,574.8 1,538.2 1,573.7 1,692.0 1,632.0 1,708.1 1,792.3 1,853.5 1,877.9 2,002.1
Government (Net) 735.1 797.3 874.2 946.7 916.7 938.6 1,018.6 948.4 999.0 1,094.3 1,146.0 1,161.6 1,288.0
Private Sector 547.6 553.0 566.8 566.0 559.2 573.5 612.6 622.0 646.2 638.2 639.9 647.7 642.8
Other Pub. Sector 54.8 61.2 61.3 62.1 62.2 61.6 60.7 61.7 62.8 59.8 67.6 68.6 71.3
Other Items (Net) -343.9 -335.0 -372.2 -441.7 -346.3 -376.3 -423.6 -425.4 -405.0 -445.7 -481.8 -458.4 -439.9
Annual M2 growth
(%) 10.2 15.6 14.0 11.2 15.9 13.1 14.0 13.1 19.4 18.7 18.9 18.2 24.2
Monthly M2 growth
(%) 0.4 4.4 2.6 1.4 3.5 -0.3 0.1 -2.4 3.1 5.2 -1.4 0.7 5.5
Reserve Money 288.9 321.4 327.1 322.5 325.5 320.2 314.1 300.9 338.7 341.5 348.6 307.5 318.2
Money Multiplier 4.5 4.2 4.2 4.4 4.5 4.5 4.6 4.7 4.3 4.5 4.3 5.0 5.1
Source: Reserve Bank of Malawi

Monthly Economic Review March 2021
4
3.2 Counterparts to Broad Money
On the asset side, the annual M2 growth rate continued to be explained by creation of Net Domestic
Assets (NDA) as Net Foreign Assets (NFA) sustained a declining trend during the review month.
Specifically, the contribution of NDA to annual growth of M2 increased to 43.9 percentage points in
March 2021 from 38.6 percentage points in the preceding month, while that of NFA stood at minus
19.7 percentage points from minus 20.4 percentage points.
Consistent with the annual developments, the monthly increase in M2 was explained by NDA which
increased by K142.7 billion to K1.6 trillion at the end of March 2021. In contrast, NFA declined by
K58.4 billion (US$76.2 million) to K45.5 billion (US$57.6 million), partly counteracting the increase
in NDA.
3.2.1 Net Domestic Assets
The expansion in NDA was explained by a K124.2 billion increase in net domestic credit to K2.0
trillion and this was complemented by an K18.5 billion growth in other items (net) to minus K439.9
billion during the month under review.
3.2.1.1 Domestic Credit
Net domestic credit increased solely on account of a rise in credit to the public (central government
and statutory bodies) sector as the stock of private sector credit declined in the review month.
Specifically, net credit to central government and credit to statutory bodies rose by K126.5 billion
and K2.7 billion to K1.3 billion and K71.3 billion at the end of March 2021, respectively. In contrast,
private sector credit recorded a net repayment of K4.9 billion, closing the review month at K642.8
billion.
i. Credit to the Public Sector
The increase in claims on the public sector reflected borrowing from both the commercial banks and
the monetary authorities. In particular, net credit to the central government from commercial banks
increased by K66.6 billion to K916.3 billion in March 2021. The upsurge was explained by
commercial banks’ uptake of K37.0 billion Treasury notes, which was reinforced by a drawdown of
K29.2 billion government deposits. During the same period, the stock of outstanding credit to state-
owned enterprises (SOEs) increased by K2.7 billion to K71.3 billion.
From the monetary authorities, government’s net outstanding credit grew by K59.8 billion to K371.7
billion at the end of March, 2021. The outturn was explained by drawdown of government deposits

Monthly Economic Review March 2021
5
amounting to K54.9 billion, which was reinforced by uptake of K5.0 billion Ways and Means
advances.
ii. Credit to the Private Sector
The annual growth rate of private sector credit remained firm at 17.4 percent in March 2021.
However, this growth was lower than 17.6 percent recorded in the preceding month and 23.8 percent
in a corresponding month of 2020. The monthly developments showed that K4.9 billion was repaid
in March 2021 compared to a credit expansion of K7.8 billion recorded in the previous month. Of the
March 2021 repayments, K10.9 billion was in respect of individual loans while K10.1 billion was
towards foreign currency denominated loans. This notwithstanding, commercial and industrial loans
as well as mortgages recorded monthly increases of K12.4 billion and K885.3 million, respectively.
In terms of economic sectors, repayments of private sector credit were observed under the Wholesale
and retail trade (K12.3 billion), Manufacturing (K5.0 billion), Electricity, gas, water and energy
(K803.1 million) and Financial services (K773.4 million) during the month under review. In contrast,
credit to Agriculture, forestry, fishing and hunting; and Community, social and personal services
sectors increased by K6.5 billion and K5.2 billion, respectively. The foregoing notwithstanding, the
Community, social and personal services sector held the largest share of outstanding private sector
credit at 30.8 percent, followed by the Wholesale and retail trade at 22.4 percent, Agriculture,
forestry, fishing and hunting at 19.8 percent and Manufacturing at 11.5 percent.
Table 2: Sectoral Composition of Private Sector Credit (in percent of total credit)
2020 2021
Sector Mar Apr May Jun Jul Aug Sep Oct Nov Dec Jan Feb Mar
Agriculture,
forestry, fishing
and hunting
23.5 21.2 21.3 20.8 20.5 19.0 20.6 20.2 19.2 18.9 19.1 18.7 19.8
Manufacturing 13.8 16.1 15.0 15.9 15.6 16.2 14.4 14.6 14.7 13.3 12.4 12.2 11.5
Wholesale and
retail trade 24.3 23.5 22.4 23.6 23.5 23.8 24.2 24.7 23.7 23.7 24.5 24.2 22.4
Community,
social and
personal
services
13.1 14.9 15.9 14.8 15.5 16.3 16.9 16.7 17.4 18.4 29.7 29.8 30.8
Other sectors1 30.6 30.5 30.4 29.3 29.7 29.6 28.7 28.7 29.9 29.8 18.9 19.9 19.7
Provisions for
losses
-5.3 -6.1 -4.9 -4.5 -4.8 -4.9 -4.7 -4.8 -4.8 -4.2 -4.6 -4.6 -4.2
TOTAL2 100.0 100.0 100.0 100.0 100.0 100.0 100.0 100.0 100.0 100.0 100.0 100.0 100.0
Source: Reserve Bank of Malawi
Note: 1Other sectors include Transport, storage and communications; Restaurants and hotels; Construction; Electricity, gas, water
and energy; Financial Services; Real Estate; Mining and quarrying and Others 2Due to rounding, the total may not be exactly 100 for some months

Monthly Economic Review March 2021
6
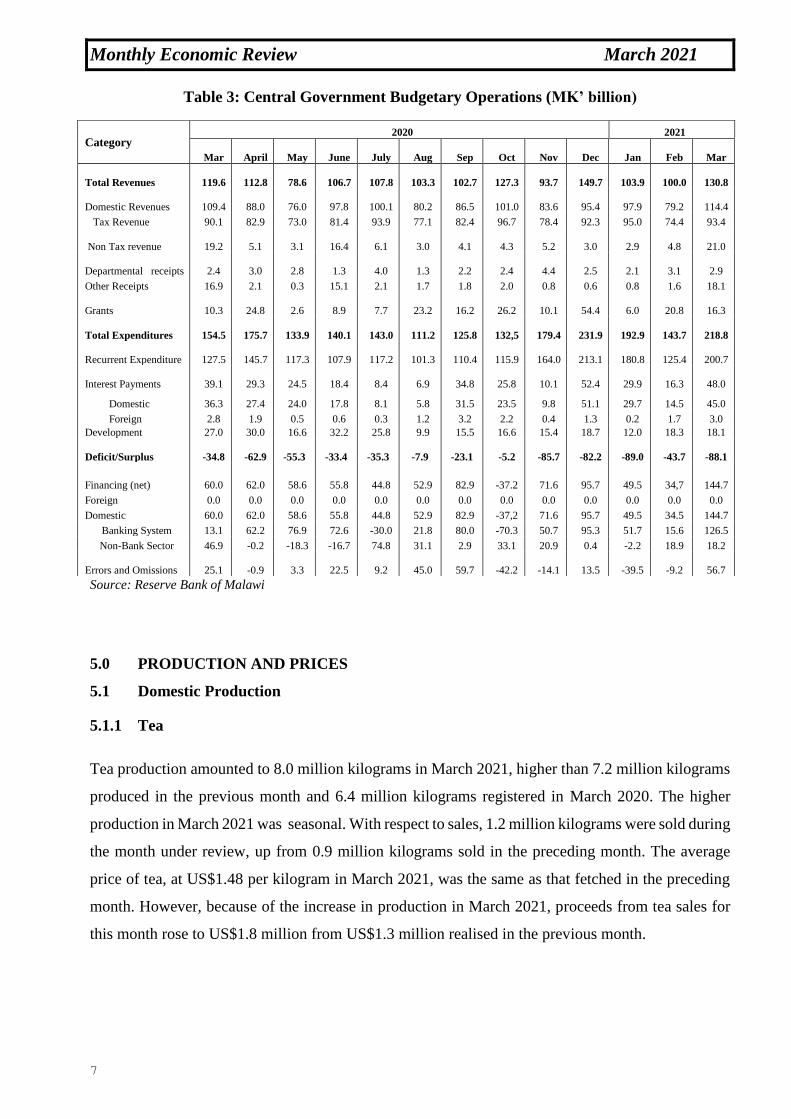
4.0 CENTRAL GOVERNMENT BUDGETARY OPERATIONS
Central government budgetary operations closed the month of March 2021 with an overall deficit
equivalent to 0.9 percent of GDP, which was higher than a deficit of 0.4 percent reported in both the
preceding month and corresponding month of 2020. Total revenues and total expenditures increased
by 30.8 percent and 52.3 percent in March 2021, respectively.
4.1 Revenues2
Revenue collections for the month of March 2021 grew by 30.8 percent (K30.8 billion) to K130.8
billion. Annually, the revenues rose by 12.4 percent (K11.1 billion) from K119.6 billion collected in
a corresponding month of 2020.The increase in the March 2021 revenues was attributed to improved
domestic revenues which outweighed the decrease in foreign receipts. Domestic revenues rose by 44.5
percent (K35.2 billion) to K114.4 billion in March 2021 and this was supported by both tax and non-
tax revenues. Tax revenues increased to K93.4 billion in March from K74.4 billion in the preceding
month, while non-tax revenues edged up to K21.0 billion from the preceding month’s position of K4.8
billion.
Meanwhile, foreign receipts registered a decline of 21.3 percent to K16.4 billion (US$ 20.7 million)
in March 2021. The main grant received during the review month was K15.4 billion (US$ 19.5 million)
from International Development Association (IDA) which was split as follows: US$6.2 million (K4.9
billion) for the Digital Malawi project, US$4.3 million (K3.4 billion) each for the Southern Africa TB
and Health Systems Support and Governance to Enable Service Delivery project, US$4.2 million
(K3.3 billion) towards Malawi Watershed Services Improvement Project, and US$0.5 million (K394.9
million) for the Malawi Covid-19 Preparedness Project. The remaining K970.6 million (US$1.2
million) were transfers from different development partners for various projects.
4.2 Expenditures
Total government expenditures for March 2021 rose by 52.3 percent (K75.2 billion) to K218.8 billion.
The increase was attributed to recurrent spending which registered a growth of 60.0 percent to K200.7
billion from K125.4 billion recorded in the previous month, on account of local transfers and interest
payments. On the other hand, development expenditures slightly declined by 0.7 percent to K18.1
billion during the month under review.
2Revenue figures may slightly differ with those reported by the Malawi Revenue Authority as RBM records represent data actually
remitted into the consolidated account on a particular transfer date. It may also differ with those reported by Treasury due to inter-
month transactions, where one month’s funding may be cleared in the banking system in the month that followsjh.
Monthly Economic Review March 2021
7
Table 3: Central Government Budgetary Operations (MK’ billion)
Source: Reserve Bank of Malawi
5.0 PRODUCTION AND PRICES
5.1 Domestic Production
5.1.1 Tea
Tea production amounted to 8.0 million kilograms in March 2021, higher than 7.2 million kilograms
produced in the previous month and 6.4 million kilograms registered in March 2020. The higher
production in March 2021 was seasonal. With respect to sales, 1.2 million kilograms were sold during
the month under review, up from 0.9 million kilograms sold in the preceding month. The average
price of tea, at US$1.48 per kilogram in March 2021, was the same as that fetched in the preceding
month. However, because of the increase in production in March 2021, proceeds from tea sales for
this month rose to US$1.8 million from US$1.3 million realised in the previous month.
Category 2020 2021
Mar
April
May
June
July
Aug
Sep Oct Nov Dec Jan Feb Mar
Total Revenues
119.6
112.8
78.6
106.7
107.8
103.3
102.7 127.3 93.7 149.7 103.9 100.0 130.8
Domestic Revenues
109.4
88.0
76.0
97.8
100.1
80.2
86.5 101.0 83.6 95.4 97.9 79.2 114.4
Tax Revenue 90.1 82.9 73.0 81.4 93.9 77.1 82.4 96.7 78.4 92.3 95.0 74.4 93.4
Non Tax revenue
19.2
5.1
3.1
16.4
6.1
3.0
4.1 4.3 5.2 3.0 2.9 4.8 21.0
Departmental receipts
2.4
3.0
2.8
1.3
4.0
1.3
2.2 2.4 4.4 2.5 2.1 3.1 2.9
Other Receipts 16.9 2.1 0.3 15.1 2.1 1.7 1.8 2.0 0.8 0.6 0.8 1.6 18.1
Grants
10.3
24.8
2.6
8.9
7.7
23.2
16.2 26.2 10.1 54.4 6.0 20.8 16.3
Total Expenditures
154.5
175.7
133.9
140.1
143.0
111.2
125.8 132,5 179.4 231.9 192.9 143.7 218.8
Recurrent Expenditure
127.5
145.7
117.3
107.9
117.2
101.3
110.4 115.9 164.0 213.1 180.8 125.4 200.7
Interest Payments
39.1
29.3
24.5
18.4
8.4
6.9
34.8 25.8 10.1 52.4 29.9 16.3 48.0
Domestic 36.3 27.4 24.0 17.8 8.1 5.8 31.5 23.5 9.8 51.1 29.7 14.5 45.0
Foreign 2.8 1.9 0.5 0.6 0.3 1.2 3.2 2.2 0.4 1.3 0.2 1.7 3.0
Development 27.0 30.0 16.6 32.2 25.8 9.9 15.5 16.6 15.4 18.7 12.0 18.3 18.1
Deficit/Surplus
-34.8
-62.9
-55.3
-33.4
-35.3
-7.9
-23.1 -5.2 -85.7 -82.2 -89.0 -43.7 -88.1
Financing (net)
60.0
62.0
58.6
55.8
44.8
52.9
82.9 -37.2 71.6 95.7 49.5 34,7 144.7
Foreign 0.0 0.0 0.0 0.0 0.0 0.0 0.0 0.0 0.0 0.0 0.0 0.0 0.0
Domestic 60.0 62.0 58.6 55.8 44.8 52.9 82.9 -37,2 71.6 95.7 49.5 34.5 144.7
Banking System 13.1 62.2 76.9 72.6 -30.0 21.8 80.0 -70.3 50.7 95.3 51.7 15.6 126.5
Non-Bank Sector 46.9 -0.2 -18.3 -16.7 74.8 31.1 2.9 33.1 20.9 0.4 -2.2 18.9 18.2
Errors and Omissions
25.1
-0.9
3.3
22.5
9.2
45.0
59.7 -42.2 -14.1 13.5
-39.5 -9.2 56.7

Monthly Economic Review March 2021
8
5.2 Domestic Prices
Headline inflation rate edged up to 9.4 percent in March 2021 from 8.3 percent registered in the
previous month. The outturn was attributed to an increase in food prices as well as energy prices.
Nonetheless, the March 2021 headline inflation rate was lower than 9.8 percent recorded in a
corresponding period of 2020.
Food inflation rate increased by 1.4 percentage points to 11.7 percent in March 2021 from 10.3
percent in the previous month, reflecting seasonal trends. The March 2021 food inflation rate was,
however, lower than 14.7 percent recorded in a corresponding period of 2020.
Non-food inflation rate also rose by 0.6 percentage points to 6.9 percent in March 2021 from 6.3
percent in the preceding month and compared to 5.2 percent in March 2020. The outturn was
attributed to the impact of the recent upward adjustment in domestic fuel pump prices which was
reflected in an increase in prices for items under the transportation, alcoholic drinks and tobacco and
health components. Fuel prices increased by an average of 11.0 percent in March 2021.
On monthly basis, headline inflation rate eased to 0.9 percent in March 2021 from 1.9 percent in the
preceding month and this was attributed to both food and non-food inflation. Food inflation recorded
a moderate month-on-month inflation rate of 1.3 percent in March 2021 compared to 2.5 percent
registered in the previous month. Similarly, the month-on-month non-food inflation rate of 0.6
percent for March 2021 was lower than 1.1 percent recorded in the preceding month.
6.0 MONEY AND SECURITIES MARKET
6.1 Open Market Operations
Overall, monetary operations between the central bank and commercial banks were contractionary in
March 2021, as evidenced by net withdrawals from the banking system amounting to K13.1 billion.
Net foreign exchange and open market operations withdrew K5.0 billion and K23.1 billion,
respectively, as opposed to net injections through government operations amounting to K15.1 billion
(see Table 3).

Monthly Economic Review March 2021
9
Table 4: Financial Market Operations (MK’ billion)
(MWK’billion)
(Net Operations + = injection & - = withdrawal)
Oct Nov Dec Jan Feb Mar
2020 2020 2020 2021 2021 2021
Net Government Operations 8.3 90.0 15.9 -139.0 -23.1 15.1
Net Government Position excluding grants 2.3 70.8 80.5 62.6 31.1 54.1
Revenue 101.0 83.6 95.4 97.9 85.3 115.1
MRA 96.7 78.4 92.3 95.0 74.4 93.4
Non-tax, excluding grants 4.3 5.2 3.0 2.9 10.9 21.8
Expenditure 103.4 154.4 175.8 160.5 116.4 169.2
Net Government Domestic Borrowing 5.9 19.3 -64.6 -201.6 -54.2 -39.0
Treasury Securities issuance 24.6 24.9 103.5 261.9 106.5 88.4
Treasury Securities maturity 30.6 44.1 39.0 60.3 52.3 49.4
Net Forex Operations -59.9 -39.1 -27.0 -16.1 -23.1 -5.0
Sales 59.9 39.1 27.0 16.1 23.1 5.0
Purchases 0.0 0.0 0.0 0.0 0.0 0.0
Net OMO 63.1 27.2 5.8 210.9 -22.1 -23.1
Injections 1,068.3 986.1 323.4 579.4 198.0 447.6
Maturity of RBM securities 0.0 0.0 0.0 0.0 0.0 0.0
Purchase of Treasury securities 0.0 0.0 10.3 66.3 56.7 0.0
Maturity of OMO T-bills 0.0 0.0 0.0 0.0 0.0 0.0
Maturing Deposits on Deposit Facility 0.0 0.0 0.0 0.0 0.0 0.0
Reverse Repos 30.0 75.6 27.7 232.4 0.0 55.5
Access on the Lombard Facility 1,038.3 910.5 285.4 280.8 141.3 392.1
Repo maturities 0.0 0.0 0.0 0.0 0.0 0.0
Withdrawals 1,005.3 958.8 317.6 368.5 220.1 470.7
Issue of Monetary Policy T-bills 0.0 0.0 0.0 0.0 0.0 0.0
Issue of RBM securities 0.0 0.0 0.0 0.0 0.0 0.0
Deposits on Deposit Facility 0.0 0.0 0.0 0.0 0.0 0.0
Maturity of Reverse Repos 0.0 13.3 26.8 64.4 99.1 69.3
Sale of Treasury securities 0.0 0.0 0.0 0.0 0.0 0.0
Maturing Access on the Lombard Facility 1,005.3 945.6 290.8 304.1 121.0 401.4
Repos 0.0 0.0 0.0 0.0 0.0 0.0
Net Operations 11.5 78.2 -5.3 55.8 -68.3 -13.1
Reserve Money Estimate: 300.9 339.1 353.8 348.7 307.7 315.3
Currency in Circulation 250.5 251.6 296.6 246.7 238.7 257.1
Bankers Deposits 50.4 87.5 57.2 102.0 69.1 58.2
Reserve Money Target
Reserve Money Target Over (-)/Under (+)
Performance
Source: Reserve Bank of Malawi
6.2 Government Securities Market
6.2.1 Treasury Bills Primary Market
The primary market for Treasury bills attracted total subscriptions of K33.3 billion in March 2021, a
decrease from K83.8 billion registered in the previous month. The majority of the subscriptions were

Monthly Economic Review March 2021
10
on the 364-day tenor, which attracted 66.1 percent of total subscriptions, followed by the 182-day
tenor with 33.8 percent, while the 91-day tenor attracted 0.1 percent.
There were no rejections on Treasury bills subscriptions and this led to a total allotment of K33.3
billion. Similarly, there were no conversions of Ways and Means advances into Treasury bills during
the month review month.
On the other hand, total Treasury bills redemptions amounted to K33.7 billion in March 2021. Given
the Treasury bills issuances of K33.3 billion against the total maturities of K33.7 billion, there was a
net redemption of K0.4 billion. Consequently, the stock of Treasury bills decreased to K399.1 billion
in March 2021 from K399.4 billion recorded at the end of the previous month.
Table 5: Treasury Bills Issuance and Maturity (MK’ billion)
Source: Reserve Bank of Malawi
6.2.2 Treasury Bills Yields
The average monthly all-type Treasury bill yield marginally increased by 1 basis point to 12.18
percent in March 2021 from 12.17 percent in the previous month. The average yields for the 91-day
and 182-day tenors remained flat while the average yield for the 364-day tenor increased by 3 basis
points. Thus, the average yields closed at 9.95 percent, 12.80 percent and 13.80 percent for the 91-
day, 182-day and 364-day tenors, respectively.
Sep 20 Oct 20 Nov 20 Dec 20 Jan 21 Feb 21 Mar 21
Total Subscription 25.9 11.2 9.2 44.8 99.3 83.8 33.3
Issues 43.8 11.2 9.2 43.8 99.3 75.8 33.3
Normal 15.3 11.2 9.2 43.8 99.3 75.8 33.3
TB from Conversion 0.0 0.0 0.0 0.0 0.0 0.0 0.0
Switches 28.5 0.0 0.0 0.0 0.0 0.0 0.0
Maturities 44.7 17.6 21.7 24.2 76.2 24.6 33.7
Normal 44.7 17.6 21.7 24.2 76.2 24.6 33.7
TB from Conversion 0.0 0.0 0.0 0.0 0.0 0.0 0.0
Net Issues (+)/maturities(-) -0.9 -6.4 -12.5 19.6 23.1 51.2 -0.4
T-Bill stock at Face Value 324.4 318.0 305.5 325.1 348.3 399.4 399.1
Memorandum Items:
Conversions 0.0 0.0 0.0 0.0 0.0 0.0 0.0
T-Bill stock at Cost Value 293.1 286.9 275.1 292.4 311.6 357.2 356.5

Monthly Economic Review March 2021
11
Chart 1: Treasury Bills Yields
Source: Reserve Bank of Malawi
6.2.3 Treasury Notes Market
Total subscriptions for Treasury notes on the primary market amounted to K73.4 billion in March
2021. Of these subscriptions, total issuances were K70.8 billion and this represented 96.5 percent of
the total subscribed funds. There were no conversions of Ways and Means advances into Treasury
notes during the period under review. The K70.8 billion issues comprised K43.5 billion issued on a
2-year Treasury note at an average yield of 16.50 percent and K27.3 billion issued on a 5-year
Treasury note at an average yield of 19.98 percent. There were no bullet maturities of Treasury notes
in the review month. However, Government repaid K3.9 billion on the amortized Treasury notes,
resulting into a net issue of K66.9 billion in March 2021. Consequently, the stock of Treasury Notes
at the end of March 2021 increased to K2.6 trillion from K2.5 trillion in the preceding month.
6.2.4 Inter-Bank Money Market
Banking system liquidity tightened in March 2021, as evidenced by the decline in excess reserves
before borrowing from the central bank (un-borrowed excess reserves) from an average of K14.9
billion per day recorded in the previous month to negative K2.8 billion per day (see Table 5). In
tandem with the liquidity condition, commercial banks significantly increased borrowing from the
interbank market as well as from the central bank. The trading activity on the interbank market rose
to K14.7 billion per day in March 2021 from K5.8 billion per day recorded in the preceding month,
while access on Lombard facility increased to K17.8 billion per day from K7.6 billion per day
observed in the previous month. The overnight interbank market rate (IBR) was contained within the

Monthly Economic Review March 2021
12
target corridor of plus 0.2 and minus 4.0 percentage points around the policy rate in the month under
review. The IBR closed the month at 11.62 percent, 32 basis points above the end position of the
previous month, reflecting the prevailing liquidity conditions.
Table 6: Banking System Liquidity (MK’ billion)
(K’bn) Oct
2020
Nov
2020
Dec
2020
Jan
2021
Feb
2021
Mar
2021
Daily Average Total Reserves 55.7 66.3 74.2 74.2 76.4 69.8
Daily Average Required Reserves 51.1 50.2 51.3 52.8 53.9 54.8
Daily Average Excess Reserves 4.6 16.1 22.9 21.3 22.5 15.0
Daily Average Un-borrowed Excess Reserves -42.5 -24.7 10.8 7.3 14.9 -2.8
Daily Average Lombard Facility Access 47.1 40.8 12.1 14.0 7.6 17.8
Daily Average Inter-bank Market Trading 6.0 6.1 12.5 9.9 5.8 14.7
Inter-bank Market Rate (End Period, Percentage) 13.60 12.05 11.42 11.37 11.30 11.62
Source: Reserve Bank of Malawi
6.2.5 Interest Rates
The Policy rate stood at 12.00 percent in March 2021, unchanged from the previous month’s position.
Meanwhile, the Reference rate dropped to 11.90 percent from 12.00 percent recorded in the previous
month, whilst the average IBR and Treasury bill yield edged upwards to 11.39 percent and 12.18
percent in March 2021, from 10.71 percent and 12.17 registered in the previous month. On the
deposits rates, commercial banks’ average savings rate remained unchanged at 4.09 percent in March
2021.
Table 7: Interest Rate Structure (percent)
2020 2021
Mar May Jun Jul Aug Sep Oct Nov Dec Jan Feb Mar
Policy Rate 13.50 13.50 13.50 13.50 13.50 13.50 13.50 13.50 12.00 12.00 12.00 12.00
Base/Reference Rate 13.30 13.30 13.40 13.40 13.40 13.60 13.60 13.60 12.30 12.10 12.00 11.90
3-mon Fixed Rate 5.77 5.77 5.77 5.77 5.77 5.56 5.56 5.56 4.96 4.96 4.96 4.96
Savings Rate 4.32 4.20 4.20 4.20 4.20 4.11 4.11 4.11 4.09 4.09 4.09 4.09
Interbank Rate
Minimum 13.00 13.42 13.40 13.55 13.57 13.60 13.60 12.05 11.04 11.30 10.30 11.21
Maximum 13.80 13.60 13.59 13.60 13.63 13.64 13.64 13.62 12.10 11.46 11.30 11.62
Average 13.43 13.48 13.49 13.58 13.59 13.61 13.62 12.48 11.38 11.34 10.71 11.39
All Type Treasury bill
Yield 9.23 10.10 10.61 11.11 12.04 12.09 12.23 12.03 11.99 12.07 12.17 12.18
91 Days 7.50 7.58 7.54 7.50 9.85 9.94 9.95 9.95 9.95 9.95 9.95 9.95
182 Days - 10.00 11.29 12.22 12.55 12.58 12.87 12.73 12.49 12.62 12.80 12.80
364 Days 10.95 12.73 13.00 13.61 13.73 13.74 13.88 13.40 13.53 13.64 13.77 13.80
Mortgage (min) 21.00 21.00 21.00 21.00 21.00 21.00 21.00 21.00 21.00 21.00 21.00 21.00
Source: Reserve Bank of Malawi
*From September 2019, the base rate was replaced with the Reference Rate. The Reference Rate is a weighted average of Lombard
Rate, Interbank Rate (IBR), All-type Treasury Bill Rate and Savings Deposit Rate

Monthly Economic Review March 2021
13
7.0 CAPITAL MARKETS
7.1 Stock Market
7.1.1 Primary Market
There was no listing on the primary stock market, hence the number of companies listed on Malawi
Stock Exchange remained at 16.
7.1.2 Secondary Stock Market
The secondary stock market recorded an increase in both volume and value of shares traded when
compared to the previous month. A total of 17.9 million shares earning K688.6 million were traded
in the month compared to 12.1 million shares which earned K438.9 million in the preceding month.
This represented increases of 48.4 percent in volume traded and 56.9 percent in value of shares traded.
The increase in trading activity was explained by investors’ responding to the release of audited
financial statements for the year ended 2020 by companies listed on the Malawi Stock Exchange.
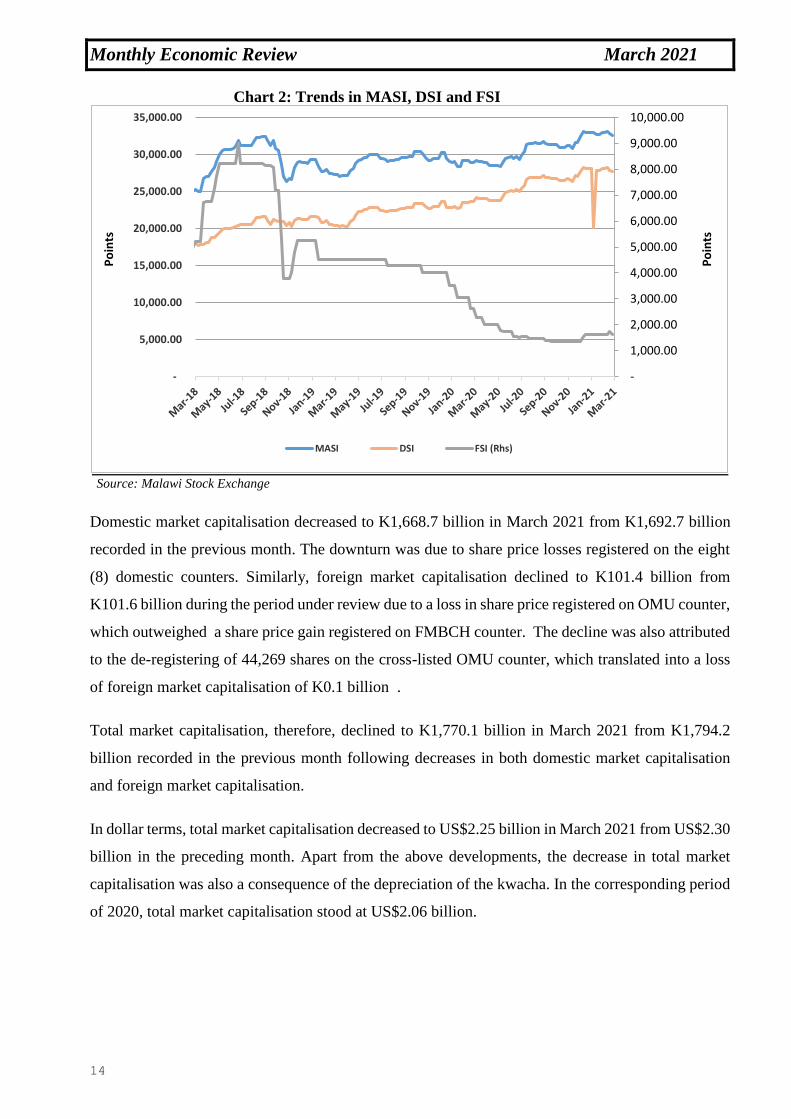
The Malawi All Share Index (MASI) lost 446.79 points to close the month at 32,562.96 points which,
in turn, translated into a month-on-month return on index of -1.35 percent. The decrease in MASI
was on account of a downward movement in both the Domestic Share Index (DSI) and the Foreign
Share Index (FSI). The DSI closed the month at 27,710.72 points, lower than 28,108.19 points in the
preceding month. The decrease in DSI was on account of share price losses registered on AIRTEL,
ICON, ILLOVO, MPICO, NICO, NITL, PCL and TNM counters. These share price losses offset
share price gains registered on four other domestic counters, namely: FDHB, NBM, NBS and STD
Bank hence the decline in DSI. The FSI closed the month at a marginally lower position of 1,614.33
points than 1,614.45 points in the preceding month (refer to Chart 1 below ). The decrease in FSI was
due to a share price loss registered on OMU counter.
Monthly Economic Review March 2021
14
Chart 2: Trends in MASI, DSI and FSI
Source: Malawi Stock Exchange
Domestic market capitalisation decreased to K1,668.7 billion in March 2021 from K1,692.7 billion
recorded in the previous month. The downturn was due to share price losses registered on the eight
(8) domestic counters. Similarly, foreign market capitalisation declined to K101.4 billion from
K101.6 billion during the period under review due to a loss in share price registered on OMU counter,
which outweighed a share price gain registered on FMBCH counter. The decline was also attributed
to the de-registering of 44,269 shares on the cross-listed OMU counter, which translated into a loss
of foreign market capitalisation of K0.1 billion .
Total market capitalisation, therefore, declined to K1,770.1 billion in March 2021 from K1,794.2
billion recorded in the previous month following decreases in both domestic market capitalisation
and foreign market capitalisation.
In dollar terms, total market capitalisation decreased to US$2.25 billion in March 2021 from US$2.30
billion in the preceding month. Apart from the above developments, the decrease in total market
capitalisation was also a consequence of the depreciation of the kwacha. In the corresponding period
of 2020, total market capitalisation stood at US$2.06 billion.
-
1,000.00
2,000.00
3,000.00
4,000.00
5,000.00
6,000.00
7,000.00
8,000.00
9,000.00
10,000.00
-
5,000.00
10,000.00
15,000.00
20,000.00
25,000.00
30,000.00
35,000.00
Po
ints
Po
ints
MASI DSI FSI (Rhs)

Monthly Economic Review March 2021
15
Chart 3: Total Market Capitalization
Source: Malawi Stock Exchange
7.2 Debt Market
There were no listings on the debt market during the period under review. Therefore, the number of
debt instruments on the market stood at 26, comprising 5 corporate bonds and 21 treasury notes.
There was no trade registered on the secondary market during the review period.
-
5,000.00
10,000.00
15,000.00
20,000.00
25,000.00
30,000.00
35,000.00
1,000.00
3,000.00
5,000.00
7,000.00
9,000.00
11,000.00
13,000.00
15,000.00
17,000.00
19,000.00
Po
ints
K'b
illio
n
TMC (Lhs) MASI (Rhs)

Monthly Economic Review March 2021
16
APPENDIX
Table 8: Selected Economic Indicators (in MK’ billion, unless otherwise stated)
2013 2014 2015 2016 2017 2018
2019
2020 2020
Mar
2021
Mar
Real Sector3
Population (million) 15.3 15.8 16.3 16.8 17.4 17.9 18.5 19.1 19.1 19.5
GDP at current market prices 1,924.1 2,534.5 3,212.7 3,812.6 4,631.9 5,266.3 8,098.5 8,816.2 8,816.2 10,601.1 Real GDP growth (percent) 6.3 6.2 3.3 2.7 5.1 4.0 5.1 0.9 0.9 3.8
GDP per capita (K’000) 133.6 160.4 197.1 226.9 266.6 293.7 437.8 461.6 461.6 499.1
GDP per capita (US$) 361.9 378.0 394.5 318.1 365.1 401.0 592.2 615.8 615.8 601.4
Consumer Price Index (CPI)4 127.3 157.6 192.0 233.7 260.7 104.7 114.5 124.4 126.9 139.8
Year-on-year inflation rate (percent) 27.3 23.8 21.9 21.7 11.5 9.2 9.4 8.6 9.8 9.4
Fiscal Sector
Total Revenue 476.4 535.9 661.3 810.0 946.6 1,079.1 1,208.5 1,302.0 119.6 130.8 Domestic Revenues 373.0 483.0 614.2 742.0 858.7 988.6 1,058.5 1,096.0 109.4 114.4
Grants 103.4 52.9 47.1 67.0 87.9 90.5 145.0 206.1 10.3 16.4
Total expenditure 539.3 593.1 762.7 964.3 1,136.1 1,316.7 1,446.2 1,804.4 154.5 218.8 Recurrent 459.9 534.4 667.2 832.5 973.1 1,119.9 1,241.9 1,557.0 127.5 200.7
Development 79.4 58.7 95.5 131.8 163.0 196.9 204.3 247.4 27.0 18.1
Deficit/GDP ratio (after grants) -3.4 -2.6 -3.2 -4.0 -4.1 -4.5 -2.9 -5.7 -0.4 -0.9
Monetary Sector
Net Foreign Assets 134.2 241.6 339.5 355.8 455.7 372.6 403.4 187.7 300.5 45.5
Net Domestic Credit 452.4 458.2 604.4 755.0 937.8 1,098.1 1,238.8 1,792.3 1,337.5 2,002.1
Government 184.1 153.4 209.0 337.5 519.9 606.8 629.0 1,094.3 735.1 1,288.0 Statutory bodies 17.8 4.3 5.1 9.2 8.1 34.5 55.7 59.8 54.8 71.3
Private (gross) 250.4 300.5 390.3 408.3 409.8 456.7 554.1 638.2 547.6 642.8
Money Supply (M2) 522.0 629.8 778.8 897.3 1,074.4 1,196.5 1,293.0 1,534.3 1,294.4 1,607.7 M2 Growth Rate (annual percent) 35.1 20.7 23.7 15.2 19.7 11.4 8.1 18.7 10.2 24.2
Reserve Money 156.9 212.3 206.0 240.6 278.9 289.4 278.1 341.5 288.9 318.2
Banks Deposits 61.6 92.4 66.0 56.2 78.2 59.6 26.0 57.3 72.1 61.4
External Sector
Overall Balance 68.6 76.3 45.1 -45.0 1.9 -2.8 54.5.4 -191.7 .. .. Current Account -449.1 -482.1 -550.1 -727.6 -1,088.9 -814.5 -945.0 -1058.0 .. ..
Exports (fob ) 435.6 600.9 531.6 737.5 611.2 814.5 975.4 838.3 141.3 59.4
Imports (cif) 1035.5 1171.4 1,134.6 1,577.6 1,864.1 2,141.6 2,421.2 2,285.7 514.3 183.6 Trade balance -599.9 -570.4 -603.0 -840.1 -1,252.9 -1,327.1 -1,445.9 -1,447.5 -372.9 -124.3
Capital account balance 222.7 194.1 114.0 525.1 761.8 629.1 693.8 613.0 ..
Gross foreign exchange reserves 279.8 389.6 549.2 586.7 739.4 660.1 700.6 731.3 586.0 477.6 Official 174.4 276.6 445.3 438.6 549.9 548.2 605.5 437.2 521.9 315.9
Commercial banks 105.4 113.0 103.9 148.1 189.5 111.9 95.2 188.9 64.1 161.7
Import cover (Official reserves in months) 2.1 3.1 3.2
2.9 3.6 3.6 3.9
2.7 3.4 1.9
Current account balance/GDP
(percent) -27.6 -19.7 -17.1 -19.1 -23.5 -17.3 -15.1
-12.1 ..
.. Debt/GDP (percent) 58.9 48.6 49.5 54.0 59.8 62.9 61.2 50.7 40.8 28.9
Debt Service/Exports (percent) 2.5 3.4 3.8 2.4 5.5 4.9 11.0 19.58 30.72 ..
MK/US Dollar (eop) 435.229 435.229 664.365 725.01 730.46 733.69 738.87 773.11 741.02 790.30 MK/US Dollar (pd avg) 369.181 369.181 499.607 713.85 726.65 732.33 742.23 749.53 742.06 787.68
Source: National Statistical Office, Reserve Bank of Malawi and Ministry of Finance
3 GDP figures were rebased in 2019 4 2000=100 for the years 2007-2009 and 2012; 2010= 100 for the years 2010, 2011 and 2013.

Monthly Economic Review March 2021
17
Table 9: Year on year Inflation (2012=100, 2017=100)
All items Food & Non-alcoholic Non-food inflation
2018 9.2 9.8 9.0
2019 9.4 14.3 5.4
2020 8.6 13.1 4.7
2018
Jan5 8.1 7.6 9.6
Feb 7.8 7.3 9.4
Mar 9.9 10.6 9.7
Apr 9.7 10.0 8.9
May 8.9 9.5 8.4
Jun 8.6 9.1 8.2
Jul 9.0 9.5 8.7
Aug 9.3 10.1 8.7
Sep 9.5 10.2 8.9
Oct 9.7 10.4 9.2
Nov 10.1 10.8 9.5
Dec 9.9 12.0 8.2
2019
Jan 8.8 10.7 7.1
Feb 7.9 10.8 5.4
Mar 9.3 14.4 5.0
Apr 9.1 13.8 5.4
May 8.9 13.0 5.7
Jun 9.0 13.7 5.4
Jul 9.3 14.2 5.5
Aug 9.5 14.6 5.4
Sep 9.2 13.9 5.4
Oct 9.6 16.0 4.3
Nov 10.4 17.2 4.7
Dec 11.5 19.3 4.9
2020
Jan 11.1 17.6 5.1
Feb 11.0 17.0 5.4
Mar 9.8 14.7 5.1
Apr 9.4 14.6 5.0
May 8.7 13.7 4.5
Jun 8.5 13.4 4.5
Jul 8.0 12.2 4.4
Aug 7.6 11.3 4.4
Sep 7.1 10.3 4.4
Oct 7.5 10.9 4.4
Nov 7.3 10.4 4.4
Dec 7.6 10.5 4.9
2021
Jan 7.7 9.7 5.6
Feb 8.3 10.3 6.3
Mar 9.4 11.7 6.9 Source: National Statistical Office
5 From Jan 2018 base year is 2017 (i.e. 2017=100)

Monthly Economic Review March 2021
18
Table 10: National Consumer Price Indices (2017=100)
All
items
Food &
Non-
alcoholic
Alcoholic
drinks
&
Tobacco
Clothing
&
Footwear
Housing,
water &
electricit
y
Furnishing
&
Household Health
Transp
ortation
Commu
nication
Recreation
& Culture Education
Restauran
ts &
Hotels
Miscellan
eous
Weighti
100
50.2
2.4
5.9
12.6
3.0
1.3
11.7
3.6
1.2
3.0
1.3
3.9
Weightii 100 45.2 2.5 2.9 23.1 4.6 2.9 8.4 3.7 0.9 2.1 2.0 1.6
2018
2019
104.7
114.5
104.1
119.0
105.9
114.1
105.5
113.4
106.2
110.0
105.0
112.8
104.3
114.4
105.2
112.2
102.0
104.6
103.5
107.7
100.9
106.7
103.7
108.3
106.0
115.8 2020 124.4 134.6 122.0 120.6 112.8 124.7 122.2 119.0 107.5 110.2 111.5 113.1 125.0
2018 Jan 104.5 108.4 100.0 100.1 103.0 100.1 100.5 100.2 100.0 100.4 100.0 100.4 100.4
Feb 106.8 110.9 101.3 102.4 105.5 102.5 101.6 102.1 101.0 101.7 100.0 101.9 102.4
Mar 105.8 107.9 103.5 103.6 106.2 102.9 102.1 102.6 101.1 101.8 100.2 102.2 103.6
Apr 101.8 99.3 104.1 104.0 105.6 103.0 102.5 102.7 101.1 102.1 100.2 102.3 103.8
May 101.2 97.7 104.8 104.5 105.6 103.3 102.8 103.1 101.8 102.8 100.2 10.3.0 104.1
Jun 101.0 96.5 106.3 104.7 105.7 104.3 103.3 104.5 101.9 103.5 100.2 103.5 104.9 Jul 101.6 97.5 107.0 105.2 105.7 105.1 103.3 105.8 101.9 103.6 100.2 103.8 105.3
Aug 103.0 100.1 107.9 106.3 105.9 106.0 104.2 106.4 102.3 104.4 100.2 104.0 107.4
Sep 105.1 103.7 108.3 107.8 106.0 107.6 106.8 107.2 103.0 105.1 101.5 105.4 109.4 Oct 107.1 106.2 108.7 108.7 108.5 108.3 107.4 108.7 103.3 105.4 102.5 105.7 110.0
Nov 108.7 109.4 109.1 109.2 108.5 108.5 108.3 109.5 103.3 105.8 103.1 105.8 110.2
Dec 109.9 112.0 109.4 109.6 108.5 108.7 108.6 109.6 103.4 106.0 103.1 105.9 110.4
2019
Jan 113.7 119.9 110.1 109.8 109.2 109.2 109.2 109.4 103.4 106.2 103.4 106.3 111.5 Feb 115.2 122.9 111.1 109.9 109.3 109.5 111.3 109.5 103.4 106.3 106.6 106.4 112.7
Mar 115.6 123.4 111.4 110.4 109.3 110.1 112.0 110.2 104.3 106.4 103.6 106.5 113.6
Apr 111.1 113.0 112.2 111.3 109.4 110.8 112.9 110.5 104.3 107.0 103.6 106.7 113.8 May 110.2 110.4 112.6 111.9 110.1 111.7 113.1 110.9 104.4 107.1 103.6 107.1 114.3
Jun 110.0 109.8 113.4 112.7 110.1 112.3 113.2 111.2 104.4 107.4 103.6 107.2 110.3
Jul 111.0 111.4 113.9 113.4 110.3 112.9 114.0 112.5 104.7 107.8 103.6 107.8 115.6
Aug 112.8 114.7 114.9 115.1 110.4 114.4 115.2 112.7 105.1 108.2 103.6 108.5 116.4
Sept 114.8 118.1 115.8 115.6 110.6 115.2 116.9 113.0 105.4 108.4 110.3 109.9 118.3
Oct 117.3 123.1 117.4 116.2 111.0 115.5 117.5 113.5 105.4 108.6 111.5 110.5 118.8 Nov 119.9 128.2 117.8 117.0 111.1 116.0 118.3 116.1 105.4 109.1 111.5 111.2 119.4
Dec 122.6 133.6 118.3 117.2 111.2 116.5 119.4 116.8 105.6 109.4 111.5 111.5 119.8
2020
Jan 126.3 141.1 118.8 117.8 111.3 122.2 119.7 116.8 105.6 109.7 111.5 111.7 121.5
Feb 127.9 143.8 119.1 118.8 112.1 123.0 120.7 117.1 106.2 109.7 111.5 111.9 122.6 Mar 126.9 141.6 119.5 119.2 112.1 123.2 121.0 116.9 106.3 109.7 111.5 112.2 122.9
Apr 121.6 129.6 120.2 119.4 112.2 123.7 121.1 116.1 107.3 110.0 111.5 112.5 123.4
May 119.8 125.6 120.5 119.8 112.2 124.0 121.5 115.9 107.6 110.1 111.5 112.7 124.0 Jun 119.4 124.5 121.8 120.5 112.2 124.4 121.8 116.1 107.7 110.2 111.5 112.9 124.1
Jul 119.9 125.0 122.2 121.1 112.3 124.6 122.4 118.1 107.8 110.3 111.5 113.2 124.8
Aug 121.3 127.6 122.8 121.5 112.8 125.1 122.6 119.0 107.8 110.5 111.5 113.8 125.3 Sep 123.0 130.3 123.6 121.7 113.3 125.5 122.9 121.2 107.9 110.5 111.5 113.8 127.0
Oct 126.1 136.5 124.5 122.2 114.0 126.3 123.4 121.7 107.9 110.5 111.5 114.0 127.3
Nov 128.6 141.5 125.2 122.5 114.5 127.4 123.9 122.7 108.4 110.8 111.5 114.1 127.9
Dec 131.9 147.6 125.9 122.8 114.9 127.6 125.5 126.1 109.6 110.8 111.6 114.2 129.4
2021
Jan 136.0 154.7 126.4 124.1 117.2 128.4 126.2 127.7 109.6 110.9 113.2 115.5 130.2
Feb 138.5 158.7 127.3 125.8 119.1 130.6 128.8 127.9 109.7 111.7 114.0 116.7 130.3 Mar 139.8 160.7 128.0 126.2 119.7 130.8 129.3 129.7 110.0 112.4 114.1 117.0 130.9
Note: Weighti implies base year is 2012 (i.e. 2012=100); Weightii implies base year is 2017 (i.e. 2017=100)
Source: National Statistical Office

Monthly Economic Review March 2021
19
Table 11: Selected Average Exchange Rates
US dollar Euro British pound Chinese yuan SA rand ZMK
Buy Sell Buy Sell Buy Sell Buy Sell Buy Sell Buy Sell
2017 727.928 733.447 819.526 834.266 935.918 953.000 106.051 108.729 53.794 55.267 75.296 77.042
2018 729.651 735.014 856.079 869.892 968.269 984.301 108.661 111.450 54.388 56.164 69.062 70.835
2019 742.305 748.775 830.306 842.362 946.845 962.467 106.238 109.004 51.458 52.521 57.646 59.151
2020 747.802 751.254 869.499 876.818 970.375 981.280 106.852 108.986 45.623 47.638 40.949 41.767
2016
Jan 689.273 707.802 735.692 754.318 994.826 1020.01 105.961 108.643 42.216 43.284 62.063 63.634
Feb 733.310 751.496 814.174 834.368 1050.36 1076.41 112.257 115.058 46.563 47.718 64.740 66.346
Mar 676.070 694.295 766.535 787.199 954.023 993.090 106.735 109.517 46.244 47.491 69.387 71.256
April 676.069 694.295 766.534 787.199 954.023 993.090 104.443 107.254 46.244 47.490 71.256 70.321
May 691.907 708.911 781.808 801.144 1006.07 1030.95 106.107 108.696 45.074 46.189 68.885 70.589
June 702.361 718.710 788.202 806.547 996.913 1020.12 106.451 108.949 46.445 47.526 65.451 66.975
July 707.082 725.022 782.366 802.215 932.749 956.413 106.028 108.713 49.128 50.375 71.436 73.249
Aug 711.599 729.887 797.475 817.970 932.851 956.826 106.956 109.681 51.748 53.078 70.656 72.472
Sept 712.351 730.113 798.610 818.523 937.345 960.718 106.780 109.437 50.691 51.955 71.480 73.262
Oct 712.296 730.153 785.775 805.475 880.354 902.425 105.875 108.530 51.178 52.461 71.929 73.732
Nov 716.301 733.994 761.643 780.457 894.159 916.246 104.219 106.847 51.462 52.733 72.500 74.291
Dec 715.802 734.216 753.882 773.277 879.076 901.692 103.484 106.208 52.606 53.960 72.786 74.658
2017
Jan 725.426 733.768 773.148 786.079 908.281 921.047 103.894 106.514 53.232 54.638 72.392 72.392
Feb 727.551 734.109 766.153 776.630 899.648 914.206 104.272 106.866 55.685 56.739 75.424 77.287
Mar 730.455 733.541 770.795 785.490 899.134 910.368 103.941 106.490 52.618 54.754 74.303 76.123
Apr 727.924 733.788 785.475 799.857 931.334 950.682 104.127 106.614 54.770 55.370 76.492 78.271
May 726.340 734.136 809.439 822.489 927.763 942.523 104.210 106.681 55.263 56.086 77.598 79.435
Jun 725.009 732.019 821.648 841.292 937.907 958.245 105.303 107.935 55.475 56.350 77.851 79.854
Jul 728.553 732.543 853.031 863.850 947.279 968.040 105.715 108.481 55.710 56.516 80.658 82.766
Aug 730.621 733.596 850.556 872.749 936.025 951.950 107.303 110.105 55.749 56.461 78.563 80.601
Sept 729.534 733.718 854.065 866.222 967.268 987.703 109.046 111.870 53.274 54.425 73.932 75.849
Oct 728.501 733.550 850.088 863.901 953.606 971.940 108.059 110.862 50.168 53.739 73.431 75.335
Nov 728.026 733.313 845.541 862.629 954.842 971.968 108.181 110.958 48.949 52.223 71.665 73.505
Dec 727.197 733.288 854.369 870.008 967.933 987.336 108.563 111.365 54.632 55.905 71.245 73.084
2018
Jan 728.995 728.995 892.879 909.208 1032.51 1045.15 111.392 114.254 60.972 62.317 73.158 75.068
Feb 728.995 733.988 892.879 909.208 1009.67 1028.42 113.333 116.293 60.972 62.317 73.158 75.068
Mar 729.275 734.004 891.443 906.858 1012.08 1027.82 113.419 116.384 61.015 62.145 73.758 75.686
Apr 728.105 734.004 888.479 902.409 1019.50 1037.19 113.765 116.736 56.673 60.867 74.908 76.865
May 727.547 733.789 855.950 868.811 974.522 991.191 112.448 115.341 57.772 58.741 71.133 72.963
Jun 728.060 733.909 845.839 858.046 961.666 977.244 110.859 113.743 54.484 55.579 71.164 73.016
Jul 727.323 733.367 845.584 858.657 954.371 968.441 106.716 109.455 53.924 54.948 72.372 74.229
Aug 728.112 733.698 834.501 849.175 933.500 947.867 104.684 107.302 51.537 52.457 71.229 73.009
Sept 729.920 734.331 843.875 859.303 945.543 961.283 104.681 107.273 46.710 50.144 66.217 67.857
Oct 733.006 737.337 837.572 847.406 946.607 960.791 103.981 106.577 50.059 51.152 60.371 61.879
Nov 734.445 738.709 829.096 840.370 940.229 955.658 103.875 106.544 51.586 52.831 60.915 62.480
Dec 733.315 739.564 828.089 842.811 922.366 939.924 104.777 107.498 48.686 52.399 60.726 62.304
2019
Jan 733.463 738.449 831.468 845.497 933.840 954.533 106.019 108.854 52.390 53.608 60.402 62.017
Feb 731.909 739.743 827.082 839.898 948.727 963.568 106.845 109.815 52.701 53.883 60.471 62.152
Mar 734.635 740.669 825.030 837.653 961.860 977.338 107.324 110.329 50.745 51.786 60.018 61.698
Apr 739.444 745.369 825.152 837.926 958.331 972.991 107.814 110.899 51.799 52.874 59.134 60.826
May 747.349 754.837 830.806 844.502 952.922 970.197 106.641 109.704 51.329 52.512 55.357 56.947
Jun 773.912 780.894 866.595 878.689 971.914 988.050 109.620 112.694 52.541 53.842 58.010 59.636
Jul 763.498 772.922 852.960 867.230 947.255 967.427 109.858 112.899 54.385 55.442 59.370 61.013
Aug 734.731 743.437 815.403 828.210 888.600 906.030 102.554 105.576 48.383 49.339 55.661 57.301
Sep 735.331 741.418 847.705 861.349 959.553 976.147 108.056 110.930 53.408 54.912 65.163 66.890
Oct 734.453 741.465 819.410 827.400 948.604 959.293 103.354 105.421 48.731 49.532 54.841 55.938
Nov 737.612 742.782 813.044 821.276 947.025 958.290 103.740 105.825 49.621 50.386 49.621 50.386
Dec 739.767 743.580 818.123 826.583 966.357 977.493 103.900 105.987 51.052 51.793 50.541 51.556
2020
Jan 740.428 744.049 818.835 827.213 963.457 974.356 105.326 107.433 51.164 51.984 50.771 51.786
Feb 739.846 743.334 806.536 813.750 958.564 966.578 104.195 106.278 46.658 49.845 49.766 50.761
Mar 740.201 743.916 819.609 826.055 913.027 924.138 103.945 106.024 44.378 45.180 44.707 45.601
Apr 740.483 743.315 805.739 813.704 917.419 926.552 103.054 105.115 40.231 40.662 39.385 40.173
May
June
740.412
740.066
743.545
743.857
811.154
841.025
819.291
848.634
911.351
930.078
921.297
940.641
102.655
103.007
104.704
105.041
36.772
43.931
41.928
44.730
40.060
40.213
40.860
41.007
July
Aug
741.323
748.034
745.905
752.432
862.339
910.229
869.930
917.297
947.531
998.642
957.744
1010.10
104.365
106.544
106.447
108.673
45.058
42.945
46.080
45.939
40.425
39.519
41.231
40.309
Sep
Oct
754.412
758.149
757.714
760.591
919.987
927.437
927.488
934.616
998.392
1009.71
1010.04
1023.07
109.072
110.874
111.254
113.091
46.765
48.659
48.070
49.396
37.550
37.012
38.301
37.752
Nov
Dec
762.360
767.905
765.045
771.339
939.898
971.202
945.153
978.689
1036.85
1059.48
1045.23
1075.61
113.598
115.587
115.870
117.899
51.773
49.145
52.615
55.231
36.070
35.911
36.791
36.629
2021
Jan 775.032 778.859 987.607 995.416 1091.39 1107.31 118.055 120.416 54.272 55.150 35.899 36.617
Feb 779.918 783.123 996.3740 1005.21 1122.40 1135.45 118.854 121.225 56.143 56.994 35.597 36.307
Mar 785.518 789.838 988.2782 1000.54 1132.51 1146.21 118.918 121.296 55.577 56.419 35.260 35.965
Source: Reserve Bank of Malawi
1 Averages of daily rates quoted by the Reserve Bank for dealing with commercial banks in Malawi

Monthly Economic Review March 2021
20
Table 12: Selected End Period Exchange Rates
US dollar Euro British pound Chinese yuan SA rand ZMK
Buy Sell Buy Sell Buy Sell Buy Sell Buy Sell Buy Sell
2016
Jan 728.286 730.292 793.314 808.186 1043.470 1066.359 109.421 112.191 44.988 46.265 63.947 65.566
Feb 740.542 752.009 805.474 824.411 1019.476 1046.119 112.171 115.011 46.004 46.770 64.506 66.139
Mar 685.235 694.748 771.116 789.239 977.220 993.202 104.415 107.252 44.936 46.634 60.831 62.483
Apr 688.590 696.037 779.477 797.854 1005.891 1018.818 104.816 107.534 46.911 48.784 70.845 72.682
May 710.001 716.897 780.346 800.854 1036.012 1053.825 106.485 109.050 44.808 46.261 67.373 68.996
Jun 716.765 721.590 786.047 803.113 957.158 970.615 105.985 108.559 47.687 49.062 67.729 69.375
Jul 719.268 728.935 790.539 811.482 954.157 962.029 106.947 109.677 50.589 51.573 69.577 71.353
Aug 722.051 729.574 799.353 811.491 944.671 958.330 106.627 109.327 49.135 50.661 75.012 76.911
Sep 720.023 728.837 803.826 819.783 932.131 949.512 106.844 109.461 51.621 52.504 72.646 74.426
Oct 723.281 729.888 787.938 800.908 878.275 889.569 105.148 107.875 52.211 53.420 73.077 74.972
Nov 727.064 733.864 763.433 779.687 908.081 916.373 104.026 106.595 52.167 53.035 72.500 74.291
Dec 724.384 732.855 756.755 775.296 882.872 904.778 103.002 105.652 52.124 53.505 72.786 74.658
2017
Jan 725.426 733.768 773.148 786.079 908.282 921.047 104.066 106.722 53.232 54.638 72.392 72.392
Feb 727.551 734.109 766.153 776.630 899.648 914.206 104.307 106.883 55.685 56.739 75.424 77.287
Mar 730.455 733.541 770.796 785.490 899.134 910.368 103.941 106.487 52.618 54.754 74.303 76.123
Apr 727.924 733.788 785.476 799.857 931.334 950.682 104.158 106.581 54.769 55.370 76.492 78.271
May 726.340 734.136 809.440 822.489 927.763 942.523 105.032 107.518 55.263 56.086 77.598 79.435
Jun 725.009 732.019 821.648 841.292 937.908 958.245 105.831 108.554 55.475 56.350 77.851 79.854
Jul 728.553 732.543 853.032 863.850 947.280 968.040 106.408 109.189 55.710 56.516 80.658 82.766
Aug 730.621 733.596 850.556 872.749 936.025 951.950 108.531 111.345 55.749 56.461 78.563 80.601
Sep 729.534 733.718 854.065 866.222 967.268 987.703 107.253 110.034 53.274 54.425 73.932 75.849
Oct 726.586 734.571 845.614 855.314 947.054 971.066 108.033 110.834 51.397 52.409 71.800 73.662
Nov 730.767 733.724 851.672 869.187 970.202 984.065 108.424 111.236 52.821 53.853 70.729 72.563
Dec 730.548 733.502 859.936 878.213 969.018 990.045 109.925 112.708 58.501 59.585 71.921 73.742
2018
Jan 730.438 734.016 897.382 907.558 1032.502 1045.139 113.240 116.177 60.343 61.637 73.297 75.198
Feb 730.877 734.282 884.961 897.120 1000.508 1020.382 113.192 116.150 61.500 62.784 73.348 75.265
Mar 729.274 734.051 891.689 906.055 1015.096 1028.939 113.833 116.809 61.221 62.605 74.453 76.398
Apr 729.923 734.802 872.418 893.419 998.584 1015.811 113.202 116.114 58.402 59.625 73.492 75.383
May 724.599 733.549 851.093 853.078 955.888 978.985 111.949 114.829 57.714 58.810 69.934 71.733
Jun 728.632 732.825 842.525 843.351 947.074 966.889 108.305 111.135 52.515 53.784 71.730 73.605
Jul 730.629 733.167 843.787 860.087 952.471 965.961 105.107 107.746 55.046 55.889 71.699 73.499
Aug 729.742 733.913 844.482 860.148 941.985 959.427 104.983 107.576 49.392 50.066 70.238 71.973
Sep 730.790 734.236 846.803 857.501 956.949 965.158 104.378 106.977 51.542 54.301 58.641 60.101
Oct 734.217 737.957 826.755 837.601 937.136 939.749 103.355 105.971 50.099 50.779 61.532 63.090
Nov 740.014 742.200 821.294 840.479 936.624 950.681 104.138 106.860 53.383 54.457 60.399 61.978
Dec 728.956 738.427 828.519 844.985 915.003 938.665 104.686 107.422 50.361 51.560 60.485 62.066
2019
Jan 732.370 739.562 836.579 851.686 951.557 970.087 107.457 110.465 53.700 55.856 60.327 62.015
Feb 735.092 740.643 828.388 843.213 976.919 987.717 107.756 110.749 51.950 53.359 60.192 61.864
Mar 735.196 742.392 820.768 834.118 956.008 970.825 107.320 110.368 49.983 51.338 59.386 61.073
Apr 743.279 750.207 825.257 833.675 950.311 971.627 107.733 110.815 51.192 52.288 57.167 58.802
May 759.885 764.550 841.159 851.446 946.121 962.734 107.081 110.232 51.406 51.821 55.201 56.825
Jun 783.369 787.077 876.775 893.522 983.860 996.011 111.318 114.503 54.904 55.846 59.520 61.222
Jul 741.203 754.904 819.373 841.750 896.864 918.665 106.653 109.725 52.176 53.461 57.063 58.707
Aug 736.513 742.310 810.419 818.887 883.176 906.793 100.919 103.868 47.432 48.633 55.257 56.871
Sep 737.201 741.318 805.507 810.750 899.819 912.429 102.123 104.166 48.518 49.092 55.240 56.345
Oct 734.453 741.464 819.410 827.400 948.604 959.293 103.354 105.421 48.731 49.532 54.841 55.938
Nov 738.811 744.540 813.436 821.032 955.743 962.301 103.657 105.751 49.977 51.008 50.273 51.288
Dec 736.547 741.200 821.322 829.973 961.104 977.285 104.600 106.691 51.985 52.884 52.079 53.121
2020
Jan 740.185 742.021 816.758 821.675 964.577 975.829 105.131 107.233 50.114 50.637 49.419 50.407
Feb 739.780 742.417 813.706 819.967 951.987 964.495 104.125 106.207 47.076 48.143 48.733 49.708
Mar 738.276 743.757 819.410 820.439 913.647 918.683 102.930 104.988 41.294 41.940 40.752 41.566
Apr 737.692 744.341 806.253 813.495 923.852 933.217 103.420 105.488 41.324 41.955 39.097 39.878
May 739.118 743.638 829.515 837.248 916.003 924.882 102.090 104.070 42.629 43.645 40.045 40.822
Jun 742.328 743.769 841.638 848.853 922.885 925.365 103.219 105.283 43.600 44.443 40.281 41.087
Jul 740.709 748.765 898.201 908.319 982.766 1005.90 105.181 107.284 45.506 46.872 40.354 41.161
Aug 754.333 755.086 925.817 945.312 1017.89 1031.88 108.114 110.276 47.014 48.042 38.006 38.766
Sep
Oct
754.204
755.889
759.650
763.057
927.255
923.908
929.455
926.552
996.184
1009.41
1003.57
1020.80
109.156
111.815
111.339
114.051
46.553
48.558
48.113
49.803
37.197
36.420
37.940
37.149
Nov
Dec
762.459
769.187
769.391
777.038
957.926
987.809
958.755
997.774
1060.35
1082.29
1063.16
1104.50
114.319
116.764
116.606
119.099
52.658
56.166
53.530
56.909
35.900
36.111
36.618
36.833
2021
Jan 773.082 779.892 988.168 995.399 1097.88 116.62 118.216 120.580 53.715 55.477 35.698 36.411
Feb 786.348 787.719 999.718 1013.71 1134.69 1147.11 119.462 121.851 55.242 56.136 35.520 36.231
Mar 788.431 792.161 991.211 994.865 1135.68 1143.55 118.355 120.722 55.406 56.855 35.192 35.896
Source: Reserve Bank of Malawi
1 End period daily rates quoted by the Reserve Bank for dealing with commercial banks in Malawi

Monthly Economic Review March 2021
21
Table 13: Malawi All Share Index (1999=100)
Period INDICES
RETURN
SHARE TURNOVER
CAPITALISATION
Domestic
Share
Index
Foreign
Share
Index
All share
Index
Dividend
Yield
Earnings per
Share
(Kwacha)
Volume of shares traded Value
(Malawi Kwacha)
Value of shares issued
(Malawi Kwacha)
2017 16,272.6 3,519.4 21,598.1 2.7 32.4 698,894,283 13,516,146,248.3 10,609,490.8
2018 28,983.5 5,265.1 21,318.1 1.9 6.9 958,247,064 48,695,858,938.08 1,284,705.7
2019 23,599.75 4,024.86 30,252.20 2.0 3.7 28,867,524 859,930,072.00 1,428,752.94
2020 27,755.46 1,363.88 32,392.84 2.7 2.39 161,286,709 3,860,233,393.68 1,759,857.40
2017
Jan 10,303.61 2,026.07 13,127.73 5.2 42.8 9,462,616 299,523,065.19 8,508,182.95
Feb 10,707.55 2,026.07 13,635.67 5.2 42.8 12,896,314 179,654,629.77 8,530,208.72
Mar 11,437.62 2,308.87 14,577.62 4.6 43.3 15,057,251 248,460,512.40 9,679,155.09
April 11,935.73 2,308.87 15,203.97 4.6 43.5 10,160,058 788,100,892.16 9,706,315.56
May 12,228.65 2,325.21 15,573.68 4.6 43.5 71,859,658 1,343,060,713.98 9,786,371.11
June 12,386.77 2,325.21 15,772.51 2.9 35.39 24,562,635 1,065,495,688.62 9,794,992.97
July 13,265.14 2,325.21 16,877.16 2.9 32.38 230,820,088 1,759,096,772.00 9,856,500.67
Aug 15,780.73 2,425.75 20,049.44 2.8 32.38 43,516,315 1,587,733,421.39 10,390,610.09
Sept 15,687.31 2,425.75 19,920.42 2.7 30.00 83,482,149 1,325,916,804.33 10,488,063.79
Oct 15,760.94 2,474.85 20,049.06 2.7 30.00 60,346,580 2,108,221,256.74 10,494,708.34
Nov 15,850.21 3,516.49 21,122.43 2.7 30.00 14,395,164 763,567,556.43 10,547,692.73
Dec 16,272.64 3,519.43 21,598.07 2.7 32.38 122,335,455 2,047,314,935.24 10,609,490.79
2018
Jan 16,692.97 3,673.87 22,223.44 2.7 32.38 36,519,356 1,318,037,153.35 10,661,816.40
Feb 17,535.66 3,706.12 23,182.59 2.6 32.38 245,801,275 7,696,394,315.30 10,827,425.44
Mar 18,009.73 5,197.43 25,286.79 2.3 32.10 39,059,770 1,133,690,674.34 12,435,390.30
Apr 18,158.46 6,743.62 27,092.17 2.3 51.62 80,903,126 3,676,838,010.81 15,654,624.25
May
Jun
Jul
19,436.22
20,033.47
20,513.69
8,201.57
8,237.82
8,237.32
30,043.03
30,736.95
31,263.14
2.2
1.8
1.7
50.89
6.66
6.45
265,730,032
6,468,082
13,787,978
10,613,139,506.1
213,441,483.83
590,259,713.23
16,006,955.25
1,370,739.23
1,385,750.21
Aug
Sep
Oct
Nov
Dec
2019
Jan
Feb
Mar
April
May
June
July
Aug
Sept
Oct
Nov
Dec
2020
Jan
Feb
Mar
Apr
May
June
July
Aug
Sept
Oct
21,145.76
21,621.84
20,938.61
20,772.39
28,983.53
21,159.22
20,829.45
20,483.29
20,334.43
22,235.79
22,877.77
22,387.89
22,420.52
22,735.48
23,445.64
22,664.27
23,599.75
22,903.36
23,506.15
24,138.22
24,097.69
23,780.75
25,117.92
25,360.04
26,732.01
27,101.51
26,787.57
8,237.32
8,138.23
7,196.88
3,778.77
5,265.12
5,265.12
4,521.94
4,521.94
4,521.94
4,521.93
4,520.31
4,520.31
4,272.58
4,272.58
4,272.58
4,024.86
4,024.86
3,529.41
3,046.35
2,290.78
1,993.51
1,993.51
1,757.76
1,535.30
1,460.99
1,460.99
1,362.39
31,956.43
32,373.19
30,622.36
26,803.80
21,318.07
28,808.89
27,687.33
27,303.65
27,138.65
29,246.08
29,956.00
29,413.02
29,197.17
29,546.27
30,344.49
29,215.33
30,252.20
28,976.30
29,162.28
29,176.23
28,857.39
28,501.97
29,784.70
29,851.63
31,328.10
31.743.36
31,303.78
1.7
1.8
1.8
2.0
1.9
1.8
1.9
1.9
1.9
2.0
2.0
2.0
2.0
2.0
2.0
2.0
2.0
2.1
1.9
2.0
2.1
2.2
3.0
2.9
2.7
2.7
2.7
6.45
6.45
6.45
6.89
6.89
5.64
6.07
5.63
5.66
4.84
4.37
4.37
4.00
4.00
4.00
3.70
3.70
3.78
2.80
2.96
2.70
2.85
2.80
2.80
2.55
2.55
2.55
43,722,958
27,090,165
46,485,804
109,803,770
42,869,348
46,773,797
165,978,557
207,926.826
53,606,240
139,056,337
14,124,014
27,022,913
27,644,237
154,699,117
185,453,439
342,696,807
28,867,524
19,417,258
14,722,356
36,746,715
14,400,820
100,211,589
64,711,565
62,683,022
314,772,282
173,592,463
659,979,164
3,009,473,246.19
3,758,351,970.38
5,845,797,261.15
8,429,682,349.22
2,410,753,256.42
2,357,679,787.25
6,984,580,841.27
4,822,095,283.42
5,237,292,481.94
9,091,064,161.08
807,635,164.50
2,203,627,437.99
798,659,625.46
3,706,719,491.33
2,495,407,311.96
7,012,268,671.68
859,930,072.00
610,173,293.32
421,390,547.14
791,098,926.99
2,384,558,649.69
2,990,942,804.95
1,382,505,684.85
1,263,639,879.92
4,857,975,498.30
6,263,997,275.34
13,075,408,794.09
1,416,480.06
1,434,953.37
1,357,347.23
1,188,088.65
1,284,705.65
1,347,534.92
1,293,719.15
1,275,935.00
1,281,524.29
1,379,206.06
1,412,128.98
1,387,035.06
1,378,000.47
1,394,440.03
1,433,241.37
1,380,557.13
1,428,752.94
1,368,393.31
1,519,742.06
1,518,611.82
1,501,515.90
1,483,373.69
1,546,551.01
1,550,744.90
1.702,073.76
1,724,325.27
1,700,452.27
Nov 26,717.15 1,362.89 31,225.08 2.7 2.55 22,670,196 3,183,659,610.28 1,696,893.16
Dec 27,755.46 1,363.88 32,392.84 2.7 2.39 161,286,709
3,860,233,393.68 1,759,857.40
2021
Jan 28,090.02 1,613.58 32,988.58 2.7 2.39 2,280,928 62,754,084.91 1,792,930.12
Feb 28,108.19 1,614.45 33,009.75 2.7 `2.39 12,052,809 438,930,171.04 1,794,234.77
Mar 27,710.72 1,614.33 32,562.96 2.8 2.49 17,884,334 688,596,224.08 1,770,108.50
Source: Malawi Stock Exchange