Embed Size (px)
Citation preview
Researching Society and Culture
Week 4 - Quantitative Methods I
Stella Chatzitheochari
What are quantitative methods?
On Statistics (I)
There are lies, damned lies and statistics
Mark Twain (Benjamin Disraeli)
Statistical thinking will
one day be as necessary for efficient citizenship
as the ability to read
and write H.G. Wells
On Statistics (II)
The death of one person is a tragedy, a million deaths is a statistic Joseph Stalin
The mark of a truly educated person is that he or she can be emotionally moved by statisticsBertrand Russell
Sociology and quantitative methods
describe the structure and organization of societies and human behaviour
identify regularities and patterns worth explaining
test our theories about how the world works
address social problems, implement changes
The Art of Generalization (I)
Inductive reasoning:
Observations Patterns Theory
Examples
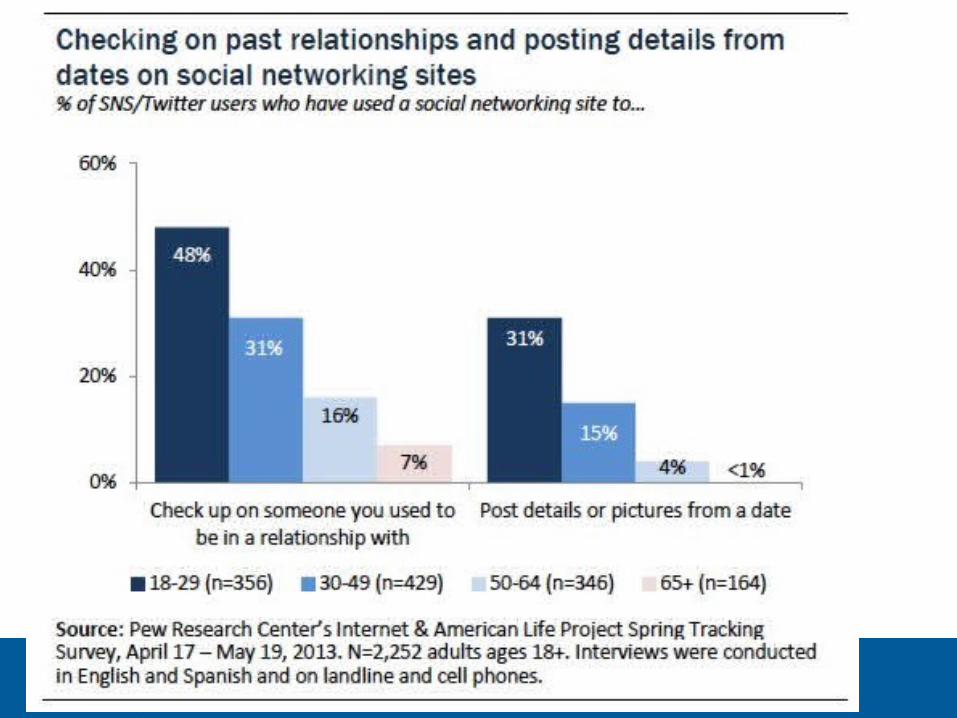
1.My friend’s ex boyfriends
2.Self-diagnosing and internet forums
3.Austerity and right-wing populism
Is generalization (external validity) appropriate in these cases?
The Art of Generalization (II)
• Induction often relies on an inadequate and selective number of cases that do not represent the population of interest (i.e. men, countries)
• But we cannot study everyone/everything • So we select a sample• Large enough & representative• A sample should capture sufficient variability in the
characteristics that we are interested in (variables)
How do we draw a sample?
• Optimal way is called random sampling• This means that if each unit in the population of
interest (i.e. students at Warwick University) have an EQUAL chance of being selected.
• Analogous to putting everyone's name into a hat and drawing out several names
Other types of sampling exist e.g. stratified, convenience, snowball sampling
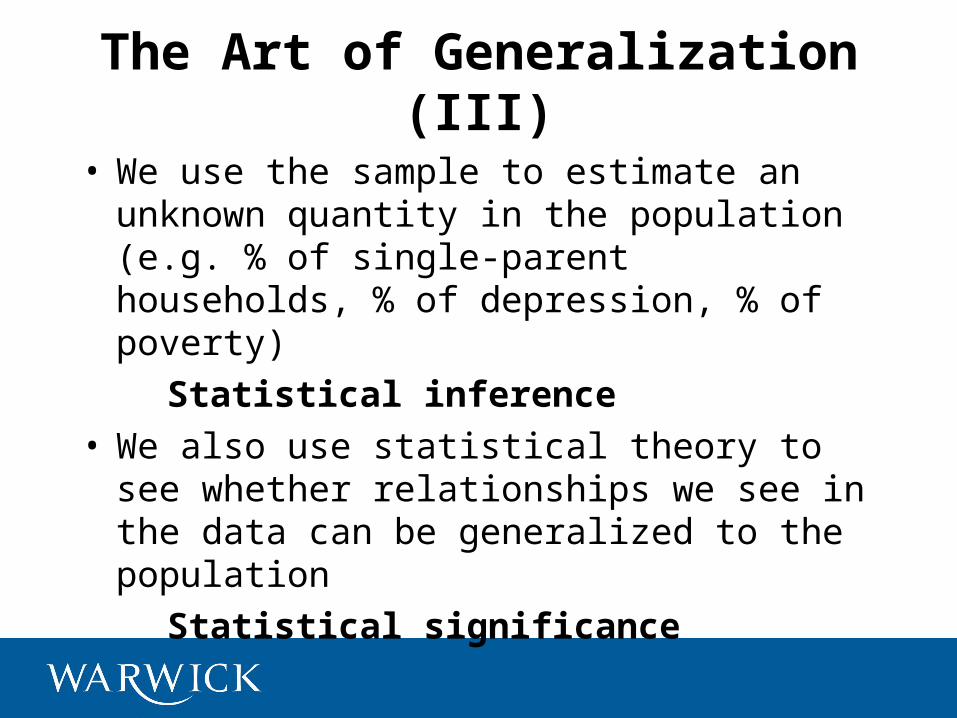
The Art of Generalization (III)
• We use the sample to estimate an unknown quantity in the population (e.g. % of single-parent households, % of depression, % of poverty)
Statistical inference• We also use statistical theory to see whether
relationships we see in the data can be generalized to the population
Statistical significance
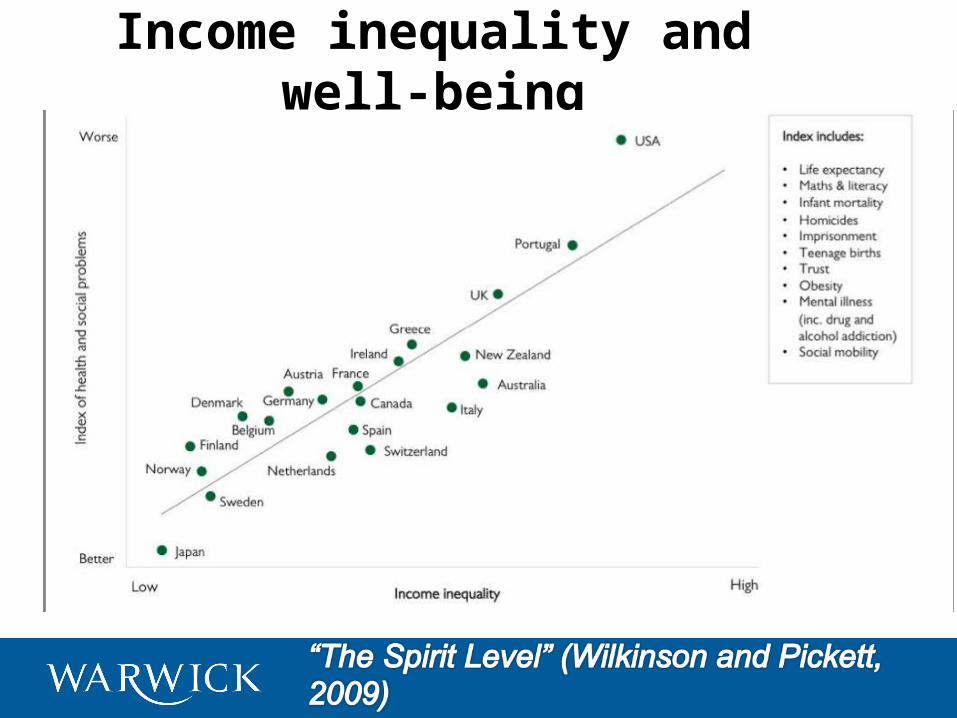
Income inequality and well-being
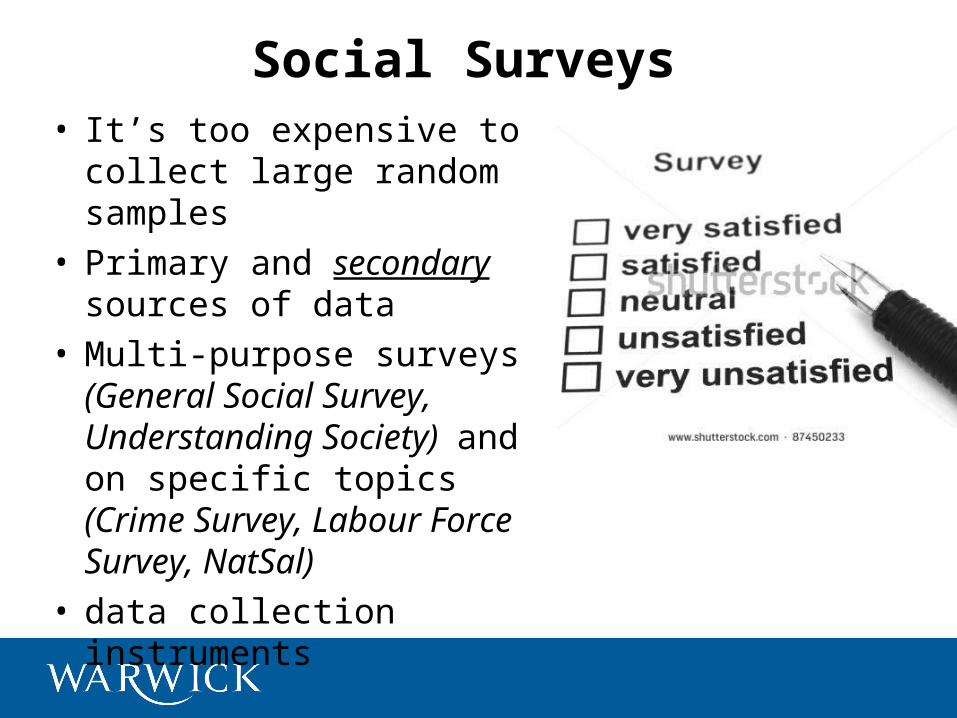
Social Surveys • It’s too expensive to collect
large random samples • Primary and secondary
sources of data • Multi-purpose surveys
(General Social Survey, Understanding Society) and on specific topics (Crime Survey, Labour Force Survey, NatSal)
• data collection instruments
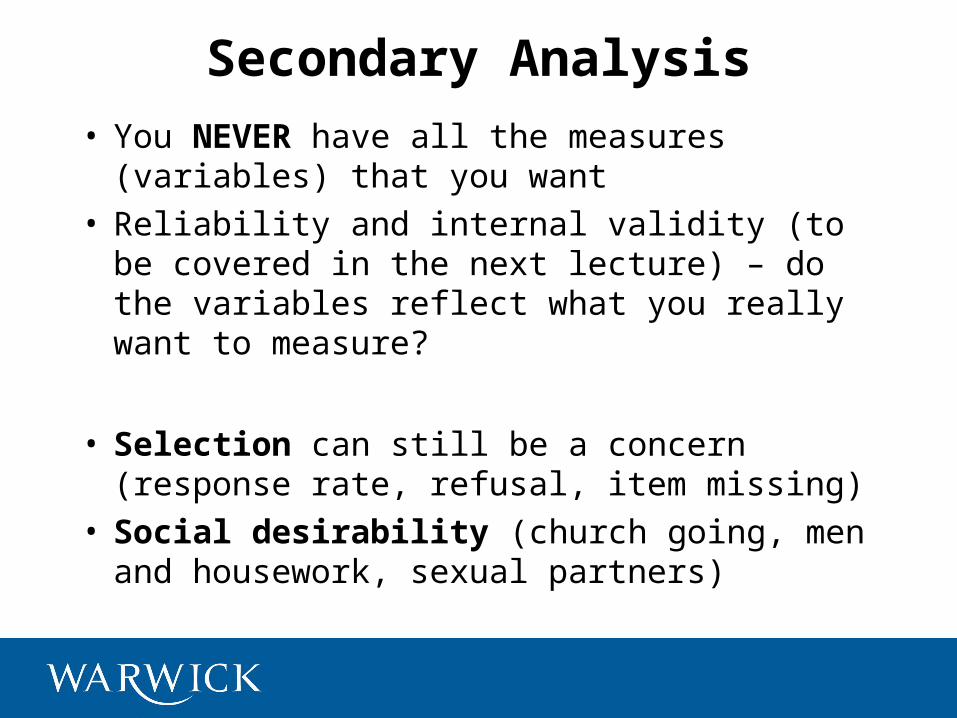
Secondary Analysis
• You NEVER have all the measures (variables) that you want
• Reliability and internal validity (to be covered in the next lecture) – do the variables reflect what you really want to measure?
• Selection can still be a concern (response rate, refusal, item missing)
• Social desirability (church going, men and housework, sexual partners)
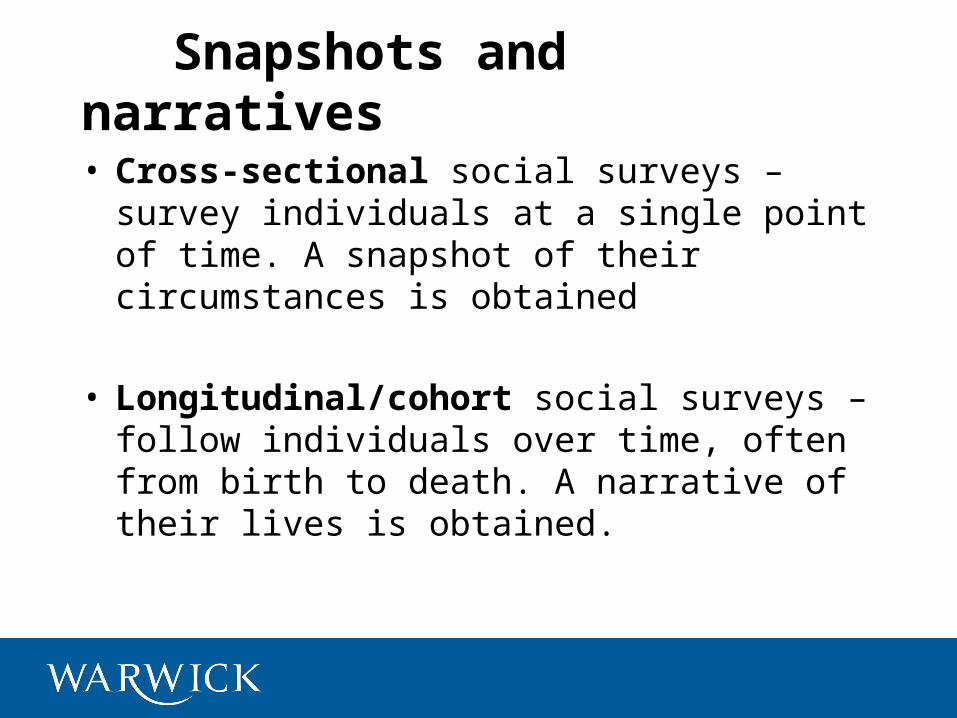
Snapshots and narratives
• Cross-sectional social surveys – survey individuals at a single point of time. A snapshot of their circumstances is obtained
• Longitudinal/cohort social surveys – follow individuals over time, often from birth to death. A narrative of their lives is obtained.
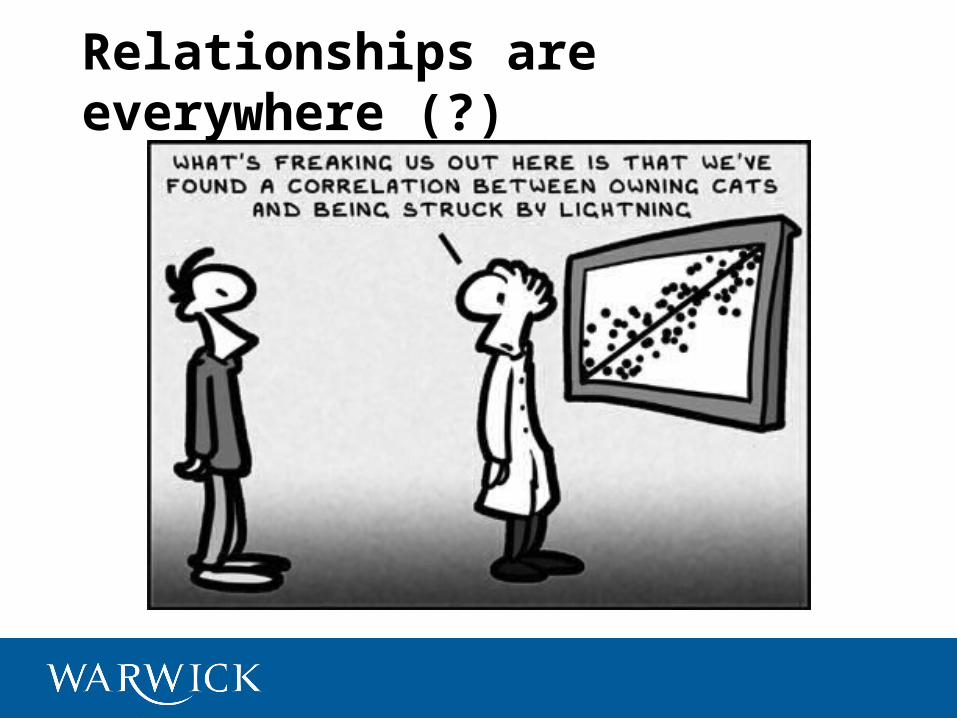
Relationships are everywhere (?)
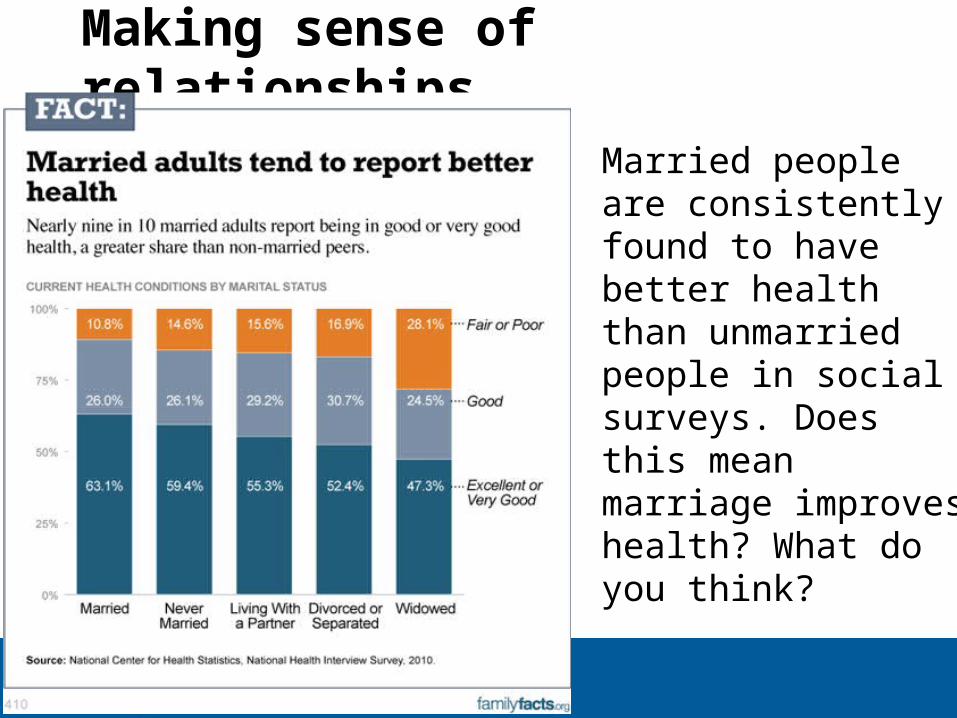
Making sense of relationships…
Married people are consistently found to have better health than unmarried people in social surveys. Does this mean marriage improves health? What do you think?
Making sense of relationships…
Not, necessarily. Married people may have been healthier than divorced people even before they were married. And those with worse health may have been less likely to marry. But it may also be that married people are more wealthy and this is the main driver behind their better health. Or that divorced/widowed people are older
Correlation is not causation!We can only say that A causes B if:
1. There is a link between A and B
2. A took place before B (what happened first?/temporal order)
3. The relationship is not driven by C (another variable/spurious correlation)
Longitudinal surveys and causation
detect spurious correlations (third variable involved?)
establish temporal order between causes and effects
Multiple causal factors can be distinguished
Test potential mechanisms that bring about an identified effect