Embed Size (px)
Citation preview
RESEARCH ARTICLE
18O-Tracer Metabolomics Reveals ProteinTurnover and CDP-Choline Cycle Activity inDifferentiating 3T3-L1 Pre-AdipocytesJay S. Kirkwood1,2, Cristobal L. Miranda1,2, Gerd Bobe1,3, Claudia S. Maier1,4, JanF. Stevens1,2*
1 Linus Pauling Institute, Oregon State University, Corvallis, United States of America, 2 Department ofPharmaceutical Sciences, Oregon State University, Corvallis, United States of America, 3 Department ofAnimal and Rangeland Sciences, Oregon State University, Corvallis, United States of America,4 Department of Chemistry, Oregon State University, Corvallis, United States of America
AbstractThe differentiation of precursor cells into mature adipocytes (adipogenesis) has been an
area of increased focus, spurred by a rise in obesity rates. Though our understanding of adi-
pogenesis and its regulation at the cellular level is growing, many questions remain, espe-
cially regarding the regulation of the metabolome. The 3T3-L1 cell line is the most well
characterized cellular model of adipogenesis. Using a time course metabolomics approach,
we show that the 3T3-L1 preadipocyte metabolome is greatly altered during the first 48
hours of differentiation, where cells go through about two rounds of cell division, a process
known as mitotic clonal expansion. Short-chain peptides were among several small mole-
cules that were increased during mitotic clonal expansion. Additional indicators of protein
turnover were also increased, including bilirubin, a degradation product of heme-containing
proteins, and 3-methylhistidine, a post-translationally modified amino acid that is not reuti-
lized for protein synthesis. To study the origin of the peptides, we treated differentiating pre-
adipocytes with 18O labeled water and found that 18O was incorporated into the short chain
peptides, confirming them, at least in part, as products of hydrolysis. Inhibitors of the protea-
some or matrix metalloproteinases affected the peptide levels during differentiation, but
inhibitors of autophagy or peptidases did not. 18O was also incorporated into several choline
metabolites including cytidine 5'-diphosphocholine (CDP-choline), glycerophosphocholine,
and several phosphatidylcholine species, indicative of phosphatidylcholine synthesis/deg-
radation and of flux through the CDP-choline cycle, a hallmark of proliferating cells. 18O-
Tracer metabolomics further showedmetabolic labeling of glutamate, suggestive of glutami-
nolysis, also characteristic of proliferating cells. Together, these results highlight the utility
of 18O isotope labeling in combination with metabolomics to uncover changes in cellular
metabolism that are not detectable by time-resolved metabolomics.
PLOS ONE | DOI:10.1371/journal.pone.0157118 June 8, 2016 1 / 18
a11111
OPEN ACCESS
Citation: Kirkwood JS, Miranda CL, Bobe G, MaierCS, Stevens JF (2016) 18O-Tracer MetabolomicsReveals Protein Turnover and CDP-Choline CycleActivity in Differentiating 3T3-L1 Pre-Adipocytes.PLoS ONE 11(6): e0157118. doi:10.1371/journal.pone.0157118
Editor: Victor Sanchez-Margalet, Virgen MacarenaUniversity Hospital, School of Medicine, University ofSeville, SPAIN
Received: March 4, 2015
Accepted: May 25, 2016
Published: June 8, 2016
Copyright: © 2016 Kirkwood et al. This is an openaccess article distributed under the terms of theCreative Commons Attribution License, which permitsunrestricted use, distribution, and reproduction in anymedium, provided the original author and source arecredited.
Data Availability Statement: All relevant data arewithin the paper and its Supporting Information files.
Funding: National Institutes of Health (GrantsS10RR027878 to JFS; P30ES000120 Core to CSM)and the College of Pharmacy, Oregon StateUniversity. The funders had no role in study design,data collection and analysis, decision to publish, orpreparation of the manuscript.
Competing Interests: The authors have declaredthat no competing interests exist.
IntroductionAdipose tissue plays a major role in whole-body energy homeostasis. During times of energyexcess, white adipose tissue serves as a storage depot, harboring intracellular droplets of lipids.When energy is in short supply, the stored lipids are liberated for utilization by peripheral tis-sues. Adipose tissue mass is primarily determined by lipid droplet size and adipocyte number.Adipocytes increase in size when energy stores are increasing through expansion, and adipo-cytes increase in number through the differentiation of precursor cells, a process known as adi-pogenesis. Adipogenesis occurs primarily during childhood and adolescence [1]. However,new adipocytes are formed during the entire lifespan to replace dying adipocytes or to increasethe storage capacity of adipose tissue. The majority of white adipocytes are thought to bederived from tissue-resident mesenchymal progenitor cells. Additionally, bone marrow-derived progenitor cells can accumulate in adipose tissue and differentiate into adipocytes inadults [2, 3].
Adipogenesis can be broken down into early and later phases. The later phase is character-ized by lipid droplet formation and triglyceride accumulation. In the early stage, a transcriptioncascade is initiated, where CCAAT/enhancer-binding protein (C/EBP) β activates the expres-sion of peroxisome proliferator-activated receptor γ (PPARγ) and C/EBPα, both consideredmaster regulators of adipogenesis [4, 5]. Also early in adipogenesis, preadipocytes undergoabout two rounds of cell division, a process known as mitotic clonal expansion [5].
Mitotic clonal expansion (MCE) occurs within the first 48 hours of adipogenesis and isrequired for complete differentiation of cells in culture [4,5]. Recent evidence suggests MCEmay also play a significant role during adipogenesis in animals, perhaps extending to humans.Merkestein et al. [6] recently discovered that the fat mass and obesity-associated (FTO) geneinfluences adipogenesis by regulating MCE. The FTO gene was the first gene with commonvariants that affect susceptibility to obesity in the general population [7].
Many natural products that inhibit adipogenesis in cell culture have been shown to act byaffecting MCE. Rohitukine [8], hirsutenone [9], piceatannol [10], and dehydrodiconiferyl alco-hol [11] are few among many natural products that have recently been found to inhibit adipo-genesis by interfering with MCE. In view of recent findings that adipogenesis also occurs inadults, small-molecule inhibitors of adipogenesis that affect MCE may find clinical applicationin the treatment of obesity.
The transcriptional, translational, and post-translational events that occur during adipogen-esis have been under fairly intense scrutiny [12–14]. Studies focusing on the impact of endoge-nous metabolites have identified several modulators of adipogenesis, including polyamines,branched-chain and other amino acids, and cellular anti-oxidants. Polyamine levels increaseduring adipogenesis, and their depletion inhibits adipogenesis [15–17]. It was recently foundthat polyamines are required for efficient activation of both C/EBP β and MCE [17].
Amino acid metabolism is also involved in adipogenesis. Green et al. [18] found that catabo-lism of branched-chain amino acids contributes to both adipogenesis and lipid accumulation.Using isotopically labeled metabolic tracers, the authors determined that protein degradationwas largely supporting the increase in branched-chain amino acids that were used for lipid syn-thesis. The specific protein degradation processes or enzymes responsible for the production ofbranched-chain amino acids and other lipogenic products are largely unknown. It is known,however, that several proteolytic pathways are active during adipogenesis, including autophagy[19], proteasomal degradation [20], and matrix metalloproteinase-mediated proteolysis [21].
Reactive oxygen species (ROS) also play a significant role during adipogenesis. Glutathione,a tripeptide antioxidant present intracellularly at millimolar concentrations, exists in oxidized(GSSG) and reduced (GSH) forms. During adipogenesis, the ratio of GSSG to GSH increases.
18O-Tracer Metabolomics to Characterize Early Adipogenesis
PLOS ONE | DOI:10.1371/journal.pone.0157118 June 8, 2016 2 / 18
Antioxidants that prevent the oxidative conversion of GSH into GSSG inhibit adipogenesis,while inhibitors of GSH synthesis stimulate adipogenesis [22]. ROS activates adipogenesis inpart through regulation of MCE [23].
In this study, we used a metabolomics approach to uncover changes in small molecules dur-ing adipogenesis using the common model 3T3-L1 cells. We specifically focused on the first 48hours, i.e., during MCE, because metabolic alterations associated with MCE may reveal novelendpoints and targets for developing anti-obesity therapies. Our results regarding changes inpolyamines, amino acids, and glutathione agree well with the literature on adipogenesis [16,22, 24–26]. In addition, we found an increase in several short-chain peptides of unknown ori-gin. The levels of the peptides were altered by an inhibitor of the proteasome (epoxomicin) or abroad spectrum metalloproteinase inhibitor (batimastat). Using cells exposed to isotopicallylabeled water (H2
18O), we determined that the peptides are products of proteolysis. Theselabeling experiments also revealed glutaminolysis and CDP-choline cycle activity in differenti-ating 3T3-L1 cells. Taken together, our isotope-assisted metabolomics approach highlights themetabolic alterations during MCE and provides a set of metabolic endpoints for studies aimedat developing inhibitors of MCE.
Materials and Methods
ChemicalsBafilomycin A1, epoxomicin, bestatin, and EUK134 (chloro[[2,2'-[1,2-ethanediylbis[(nitrilo-κN)methylidyne]]bis[6-methoxyphenolato-κO]]]-manganese) were from Cayman ChemicalCompany (Ann Arbor, MI, USA). MnTMPyP (Mn(III)tetrakis(1-methyl-4-pyridyl)porphyrin)was from ENZO life sciences (Farmingdale, NY, USA). 3-Isobutyl-1-methylxanthine (IBMX),dexamethasone (DEX), insulin, hydrogen peroxide, epoxomicin, batimastat, and H2
18O werefrom Sigma (St. Louis, MO, USA). Chemical standards used for metabolite identification werefrom TCI America (Portland, OR, USA) and when unavailable, Sigma.
Cell culture and treatmentThe 3T3-L1 cell line used here was from ATCC (Manassas, VA, USA). Cells were first propa-gated in 75 cm2 flasks using a culture medium consisting of DMEM (Life Technologies, GrandIsland, NY, USA), 10% fetal bovine serum, 100 units/ml penicillin, 100 μg/ml streptomycin,and 1 mM pyruvate. Differentiation of 2-day post confluent (designated day 0) 3T3-L1 cellswas induced by a standard chemical cocktail, designated MDI, which included insulin (200nM), dexamethasone (250 nM), and 3-isobutyl-1-methylxanthine (500 μM). When cells weredifferentiating in the presence of metalloporphyrin complexes, MnTMPyP and EUK134 wereadded 30 min prior to the MDI cocktail at a final concentration of 40 μM. PEG-catalase wasincubated with cells 18 h prior to MDI addition. Hydrogen peroxide (H2O2) was added 30 minafter MDI and cells extracted 12 h later. Epoxomicin, bafilomycin A1, bestatin, batimastat, andH2
18O were added 12 h after MDI. H218O or control H2O was added at a final level of 6% by
volume.
LC-MS/MS based metabolomicsMetabolomics experiments, including metabolite extraction, data collection, statistical analysis,and metabolite identification, were performed as previously described [27, 28]. Briefly, metabo-lites were extracted with cold solvent (50:50 MeOH:EtOH v:v), centrifuged, then the superna-tant was analyzed. MeOH:EtOH was chosen as the extraction solvent because it efficientlyprecipitates proteins yielding a clean extract, and it extracts both polar and nonpolar
18O-Tracer Metabolomics to Characterize Early Adipogenesis
PLOS ONE | DOI:10.1371/journal.pone.0157118 June 8, 2016 3 / 18
metabolites. Metabolites were separated on an Inertsil Phenyl-3 stationary phase (GL Sciences)coupled to a quadrupole-time-of-flight mass spectrometer (Triple TOF 5600, AB SCIEX) withMS/MS spectra recorded on the fly on an information-dependent basis. Only spectral featureswith peak areas greater than 10,000 units were included for further analysis. Metaboliteswere identified using an in-house library of standards based on accurate mass (errortolerance< 10 ppm), fragmentation pattern (library score> 70), isotope distribution(difference< 10%), and retention time (error tolerance< 9%). A list of identified metabolitescan be found in S1 Table.
Determination of cellular protein contentThe change in total protein content of differentiating adipocytes was determined using theCoomassie Plus Protein Assay Reagent (Pierce, Rockford, IL) according to the manufacturer’sinstructions. At 24 h post differentiation, cells were washed once with HBSS, then 500 μL coldlysis buffer was added to each well of the 6-well plate. Lysates or bovine serum albumin (to gen-erate a standard curve) was diluted with water into 96-well plates, then Coomassie Plus reagentwas added and after a 10-min incubation, the absorbance was read at 590 nm using a Spectra-Max 190 plate reader.
OCR and ECARmeasurementsOxygen consumption rate (OCR) and extracellular acidification rate (ECAR) measurementswere performed with a Seahorse XF 24 Analyzer from Seahorse Bioscience (North Billerica,MA, USA). 3T3-L1 Fibroblasts were plated at a density of 30,000 cells per well and then differ-entiated as described above 2 days after reaching confluence. XF medium from Seahorse Bio-science was used for OCR and ECAR measurements and contained 25 mM glucose, 1 mMpyruvate, and 200 nM insulin.
Statistical analysisStatistical analyses were performed using GraphPad Prism 4.0 software and SAS 9.3 software.In studies with only two experimental groups, we compared the two groups using Student’sunpaired t-test. If there were more than two groups, we used an ANOVA and compared thegroups using Tukey’s range test, which is a post hoc test that accounts for multiple compari-sons. All statistical tests were two-sided. Significance was declared at p< 0.05; the exception isthe untargeted metabolomics study, in which significance was declared at q< 0.05, using theadaptive linear step-up procedure of Benjamini [29] to control for the false discovery rate.
Results and Discussion
Time course metabolomics reveals significant alterations in the 3T3-L1preadipocyte metabolome shortly after initiating differentiationTo determine the effect of differentiation on the adipocyte metabolome, 3T3-L1 preadipocyteswere extracted at several time points (10 min, 1 h, 2 h, 3 h, 4 h, 6 h, 8h, 12 h, 24 h, and 48 h)after chemically initiating differentiation into mature adipocytes. In addition to potentiallyuncovering novel differentiation-associated changes in cellular metabolism, this method allowsus to track over time the metabolite changes that have been reported previously in the earlystages of adipocyte differentiation, validating this method and providing temporal data forseveral differentiation-associated metabolic switches. A principal components discriminantanalysis (PCA-DA) plot shows tight sample grouping and clear group separation of the adipo-cytes extracted 8–48 h post differentiation (Fig 1) suggesting significant alterations to the
18O-Tracer Metabolomics to Characterize Early Adipogenesis
PLOS ONE | DOI:10.1371/journal.pone.0157118 June 8, 2016 4 / 18
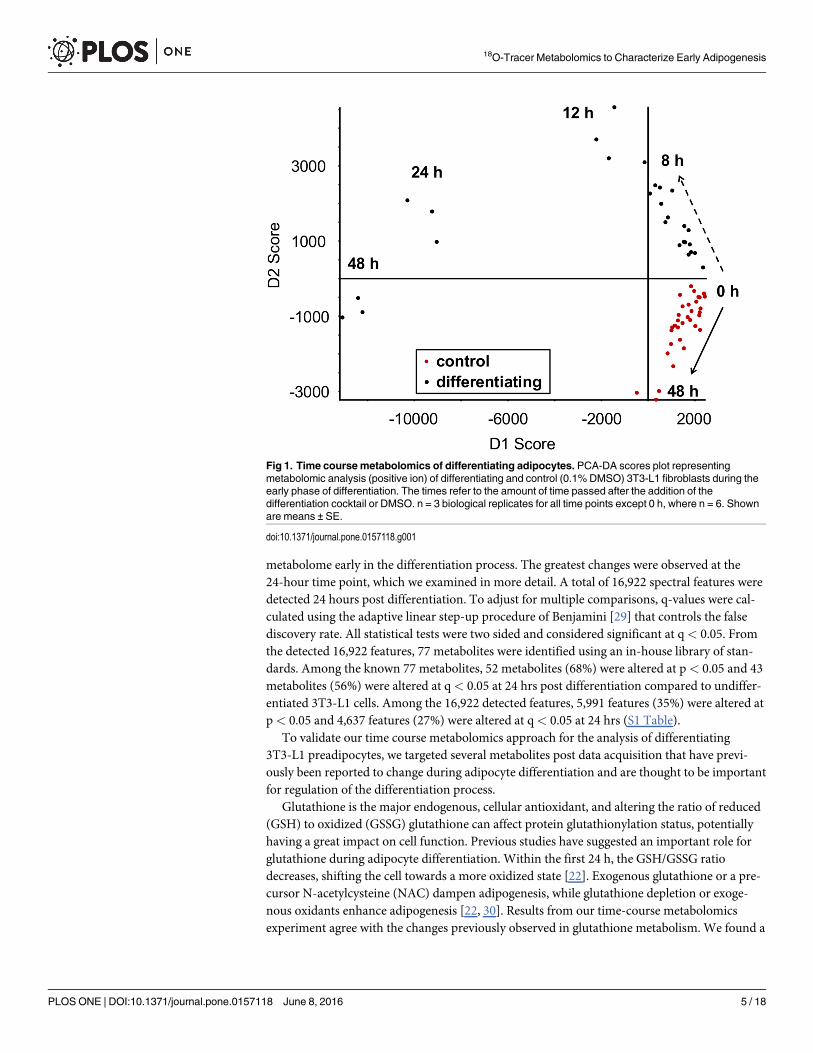
metabolome early in the differentiation process. The greatest changes were observed at the24-hour time point, which we examined in more detail. A total of 16,922 spectral features weredetected 24 hours post differentiation. To adjust for multiple comparisons, q-values were cal-culated using the adaptive linear step-up procedure of Benjamini [29] that controls the falsediscovery rate. All statistical tests were two sided and considered significant at q< 0.05. Fromthe detected 16,922 features, 77 metabolites were identified using an in-house library of stan-dards. Among the known 77 metabolites, 52 metabolites (68%) were altered at p< 0.05 and 43metabolites (56%) were altered at q< 0.05 at 24 hrs post differentiation compared to undiffer-entiated 3T3-L1 cells. Among the 16,922 detected features, 5,991 features (35%) were altered atp< 0.05 and 4,637 features (27%) were altered at q< 0.05 at 24 hrs (S1 Table).
To validate our time course metabolomics approach for the analysis of differentiating3T3-L1 preadipocytes, we targeted several metabolites post data acquisition that have previ-ously been reported to change during adipocyte differentiation and are thought to be importantfor regulation of the differentiation process.
Glutathione is the major endogenous, cellular antioxidant, and altering the ratio of reduced(GSH) to oxidized (GSSG) glutathione can affect protein glutathionylation status, potentiallyhaving a great impact on cell function. Previous studies have suggested an important role forglutathione during adipocyte differentiation. Within the first 24 h, the GSH/GSSG ratiodecreases, shifting the cell towards a more oxidized state [22]. Exogenous glutathione or a pre-cursor N-acetylcysteine (NAC) dampen adipogenesis, while glutathione depletion or exoge-nous oxidants enhance adipogenesis [22, 30]. Results from our time-course metabolomicsexperiment agree with the changes previously observed in glutathione metabolism. We found a
Fig 1. Time coursemetabolomics of differentiating adipocytes. PCA-DA scores plot representingmetabolomic analysis (positive ion) of differentiating and control (0.1% DMSO) 3T3-L1 fibroblasts during theearly phase of differentiation. The times refer to the amount of time passed after the addition of thedifferentiation cocktail or DMSO. n = 3 biological replicates for all time points except 0 h, where n = 6. Shownare means ± SE.
doi:10.1371/journal.pone.0157118.g001
18O-Tracer Metabolomics to Characterize Early Adipogenesis
PLOS ONE | DOI:10.1371/journal.pone.0157118 June 8, 2016 5 / 18
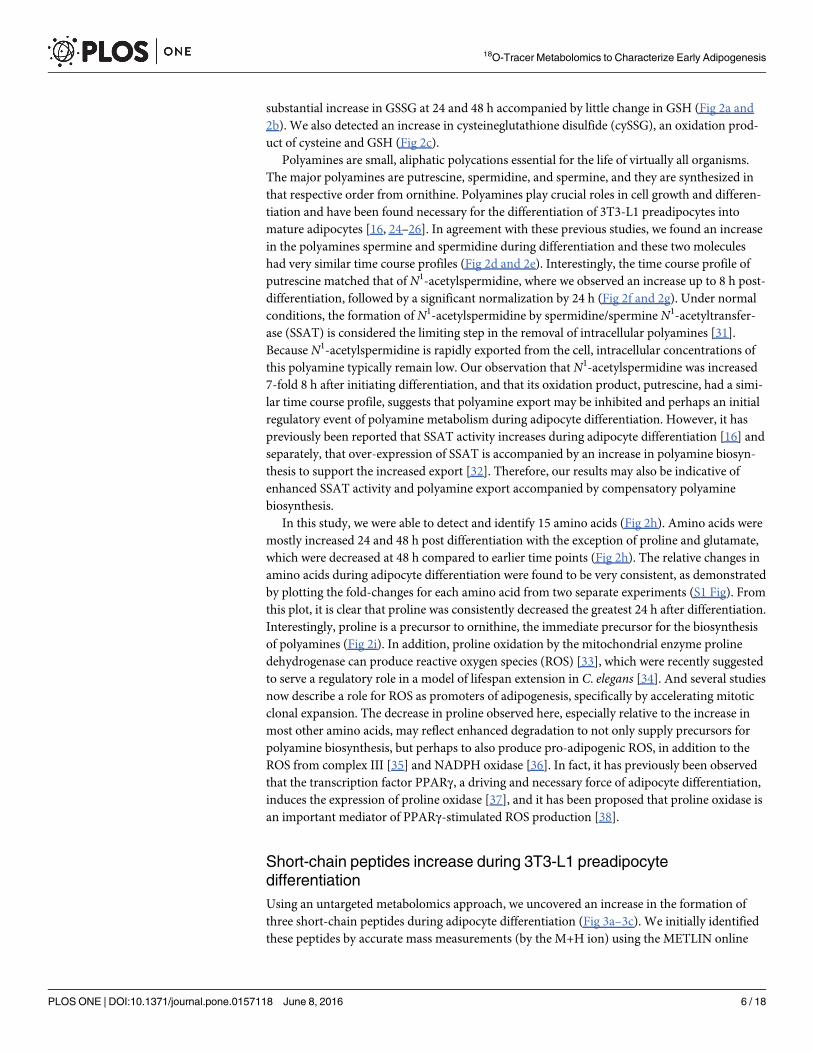
substantial increase in GSSG at 24 and 48 h accompanied by little change in GSH (Fig 2a and2b). We also detected an increase in cysteineglutathione disulfide (cySSG), an oxidation prod-uct of cysteine and GSH (Fig 2c).
Polyamines are small, aliphatic polycations essential for the life of virtually all organisms.The major polyamines are putrescine, spermidine, and spermine, and they are synthesized inthat respective order from ornithine. Polyamines play crucial roles in cell growth and differen-tiation and have been found necessary for the differentiation of 3T3-L1 preadipocytes intomature adipocytes [16, 24–26]. In agreement with these previous studies, we found an increasein the polyamines spermine and spermidine during differentiation and these two moleculeshad very similar time course profiles (Fig 2d and 2e). Interestingly, the time course profile ofputrescine matched that of N1-acetylspermidine, where we observed an increase up to 8 h post-differentiation, followed by a significant normalization by 24 h (Fig 2f and 2g). Under normalconditions, the formation of N1-acetylspermidine by spermidine/spermine N1-acetyltransfer-ase (SSAT) is considered the limiting step in the removal of intracellular polyamines [31].Because N1-acetylspermidine is rapidly exported from the cell, intracellular concentrations ofthis polyamine typically remain low. Our observation that N1-acetylspermidine was increased7-fold 8 h after initiating differentiation, and that its oxidation product, putrescine, had a simi-lar time course profile, suggests that polyamine export may be inhibited and perhaps an initialregulatory event of polyamine metabolism during adipocyte differentiation. However, it haspreviously been reported that SSAT activity increases during adipocyte differentiation [16] andseparately, that over-expression of SSAT is accompanied by an increase in polyamine biosyn-thesis to support the increased export [32]. Therefore, our results may also be indicative ofenhanced SSAT activity and polyamine export accompanied by compensatory polyaminebiosynthesis.
In this study, we were able to detect and identify 15 amino acids (Fig 2h). Amino acids weremostly increased 24 and 48 h post differentiation with the exception of proline and glutamate,which were decreased at 48 h compared to earlier time points (Fig 2h). The relative changes inamino acids during adipocyte differentiation were found to be very consistent, as demonstratedby plotting the fold-changes for each amino acid from two separate experiments (S1 Fig). Fromthis plot, it is clear that proline was consistently decreased the greatest 24 h after differentiation.Interestingly, proline is a precursor to ornithine, the immediate precursor for the biosynthesisof polyamines (Fig 2i). In addition, proline oxidation by the mitochondrial enzyme prolinedehydrogenase can produce reactive oxygen species (ROS) [33], which were recently suggestedto serve a regulatory role in a model of lifespan extension in C. elegans [34]. And several studiesnow describe a role for ROS as promoters of adipogenesis, specifically by accelerating mitoticclonal expansion. The decrease in proline observed here, especially relative to the increase inmost other amino acids, may reflect enhanced degradation to not only supply precursors forpolyamine biosynthesis, but perhaps to also produce pro-adipogenic ROS, in addition to theROS from complex III [35] and NADPH oxidase [36]. In fact, it has previously been observedthat the transcription factor PPARγ, a driving and necessary force of adipocyte differentiation,induces the expression of proline oxidase [37], and it has been proposed that proline oxidase isan important mediator of PPARγ-stimulated ROS production [38].
Short-chain peptides increase during 3T3-L1 preadipocytedifferentiationUsing an untargeted metabolomics approach, we uncovered an increase in the formation ofthree short-chain peptides during adipocyte differentiation (Fig 3a–3c). We initially identifiedthese peptides by accurate mass measurements (by the M+H ion) using the METLIN online
18O-Tracer Metabolomics to Characterize Early Adipogenesis
PLOS ONE | DOI:10.1371/journal.pone.0157118 June 8, 2016 6 / 18
metabolite database. The tripeptide that showed a molecular ion [M+H]+ at m/z 306.1293 pro-duced prominent fragment ions with m/z 177.0853 (y2 ion), m/z 159.0741 (y2–H2O), and m/z74 (y1–HCOOH), consistent with the sequence Glu-Gly-Thr. A second peptide (m/z 249.1062[M+H]+) produced fragment ions with m/z 231.0969 [MH–H2O]
+, m/z 120.0645 (y ion), m/z102.0557 (y–H2O), m/z 84.0447 (y–2H2O), m/z 74 (y–HCOOH), and m/z 130.0488 (b ion),consistent with the sequence Glu-Thr. A third metabolite, m/z 290.1333, retrieved severalmatches in METLIN within 5 ppm and all were tripeptides containing the amino acids gluta-mate, alanine, and alanine, or glycine, valine, and aspartate, or serine, serine, and proline. Thetripeptide’s sequence could not be established due to low abundance of its fragment ions.
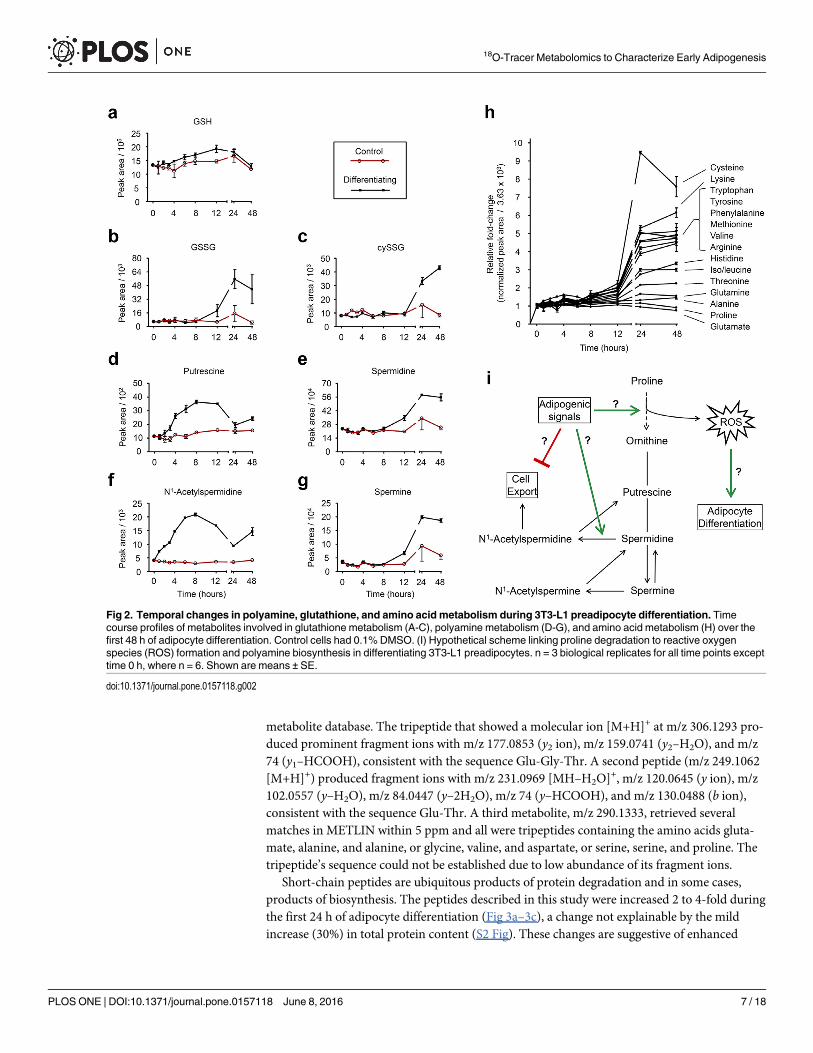
Short-chain peptides are ubiquitous products of protein degradation and in some cases,products of biosynthesis. The peptides described in this study were increased 2 to 4-fold duringthe first 24 h of adipocyte differentiation (Fig 3a–3c), a change not explainable by the mildincrease (30%) in total protein content (S2 Fig). These changes are suggestive of enhanced
Fig 2. Temporal changes in polyamine, glutathione, and amino acid metabolism during 3T3-L1 preadipocyte differentiation. Timecourse profiles of metabolites involved in glutathione metabolism (A-C), polyamine metabolism (D-G), and amino acid metabolism (H) over thefirst 48 h of adipocyte differentiation. Control cells had 0.1% DMSO. (I) Hypothetical scheme linking proline degradation to reactive oxygenspecies (ROS) formation and polyamine biosynthesis in differentiating 3T3-L1 preadipocytes. n = 3 biological replicates for all time points excepttime 0 h, where n = 6. Shown are means ± SE.
doi:10.1371/journal.pone.0157118.g002
18O-Tracer Metabolomics to Characterize Early Adipogenesis
PLOS ONE | DOI:10.1371/journal.pone.0157118 June 8, 2016 7 / 18
protein degradation during adipocyte differentiation. 3-Methylhistidine, a post-translationallymodified amino acid and product of protein degradation that is not reutilized for protein syn-thesis [39], was also increased 24 and 48 h after initiating adipocyte differentiation, supportingthe notion of up-regulated protein degradation during this period (Fig 3d). Also in support ofenhanced protein degradation is the observation that bilirubin, a degradation product ofheme-containing proteins [40], was undetectable in control, undifferentiating 3T3-L1 preadi-pocytes, but consistently present in differentiating adipocytes (Fig 3e). Together these resultsstrongly suggest an increase in protein degradation during the early stages of 3T3-L1 preadipo-cyte differentiation.
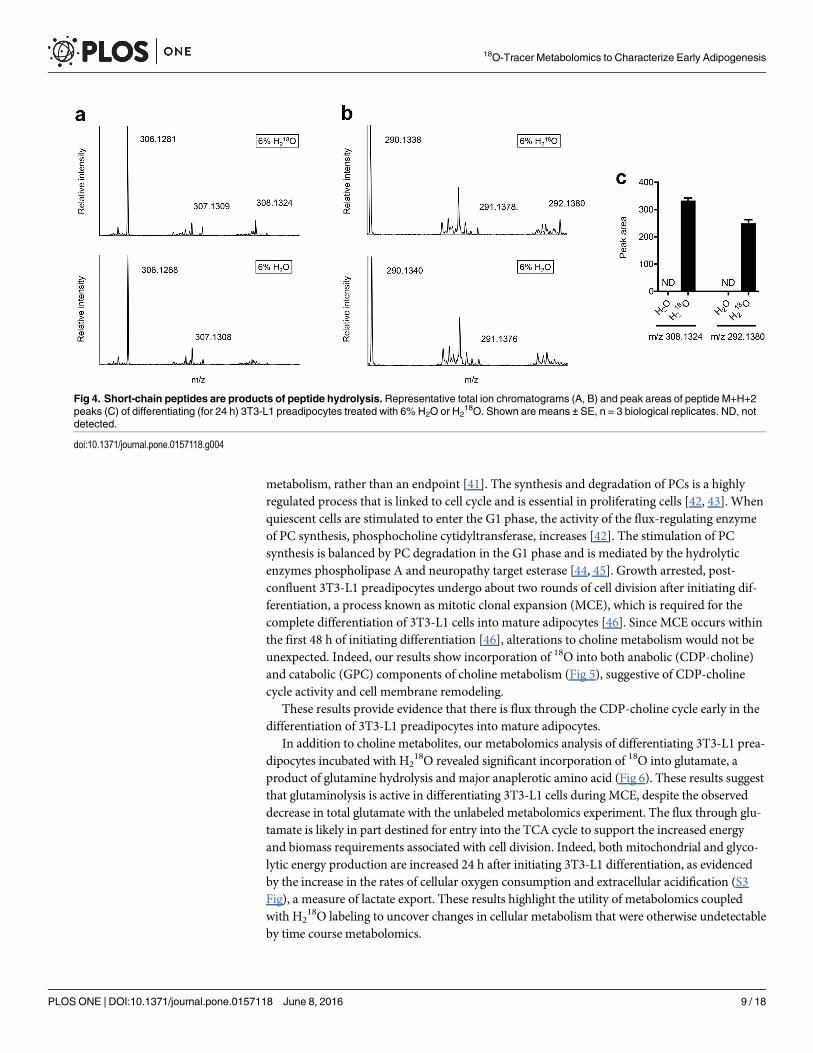
Short-chain peptides are products of peptide hydrolysisTo confirm that the short-chain peptides described in this study are products of peptide or pro-tein hydrolysis, we incubated differentiating 3T3-L1 preadipocytes with 18O labeled water(H2
18O) and as a control, unlabeled water (H2O). As expected,18O was consistently incorpo-
rated into the short-chain peptides (Fig 4), confirming them at least partially as products ofhydrolysis and potential markers of protein and/or peptide degradation.
Metabolomics of H218O-treated differentiating 3T3-L1 preadipocytes
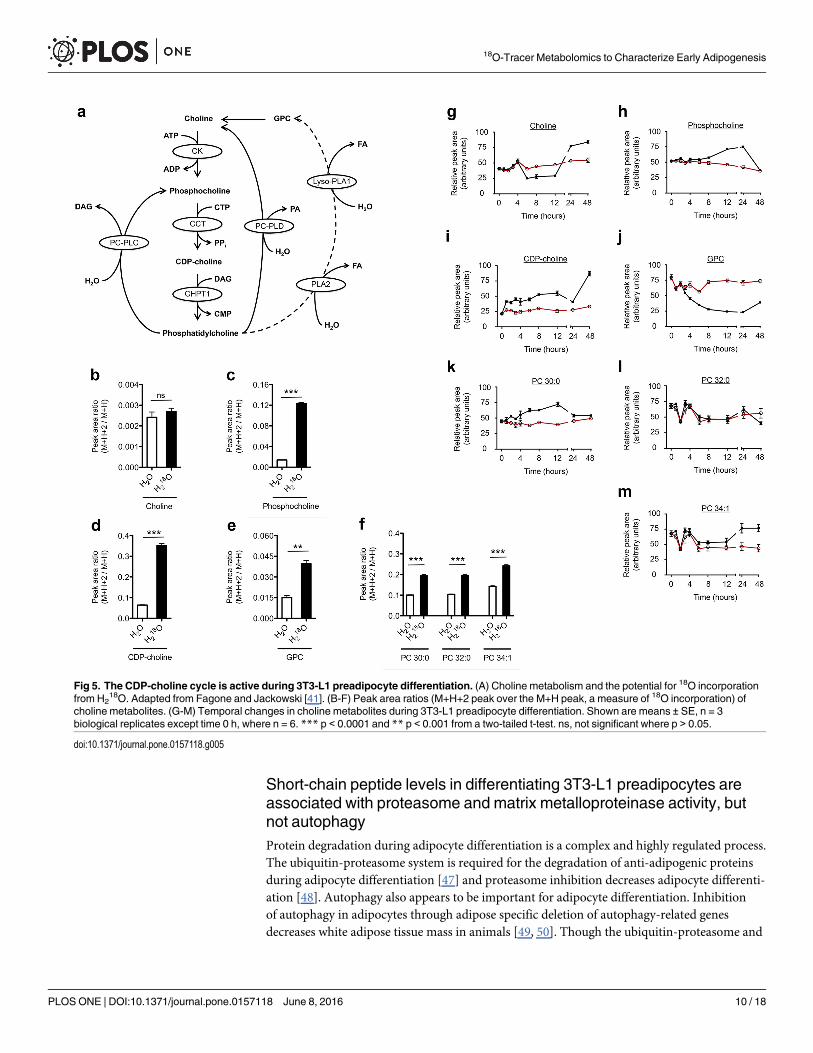
reveals CDP-choline cycle activity and glutaminolysisAn untargeted metabolomic analysis of differentiating adipocytes treated with H2
18O revealedincorporation of 18O into several choline metabolites, including phosphocholine, CDP-choline,glycerophosphocholine (GPC), and several phosphatidylcholine (PC) species (Fig 5). PC is amajor component of biological membranes and is considered an intermediate of choline
Fig 3. Temporal changes in products of protein degradation during adipocyte differentiation. Time course profiles of short-chain peptides(A-C), methylhistidine (D), and bilirubin (E) over the first 48 h of adipocyte differentiation. Control cells had only 0.1% DMSO. n = 3 biologicalreplicates for all time points except time 0 h, where n = 6. Shown are means ± SE.
doi:10.1371/journal.pone.0157118.g003
18O-Tracer Metabolomics to Characterize Early Adipogenesis
PLOS ONE | DOI:10.1371/journal.pone.0157118 June 8, 2016 8 / 18
metabolism, rather than an endpoint [41]. The synthesis and degradation of PCs is a highlyregulated process that is linked to cell cycle and is essential in proliferating cells [42, 43]. Whenquiescent cells are stimulated to enter the G1 phase, the activity of the flux-regulating enzymeof PC synthesis, phosphocholine cytidyltransferase, increases [42]. The stimulation of PCsynthesis is balanced by PC degradation in the G1 phase and is mediated by the hydrolyticenzymes phospholipase A and neuropathy target esterase [44, 45]. Growth arrested, post-confluent 3T3-L1 preadipocytes undergo about two rounds of cell division after initiating dif-ferentiation, a process known as mitotic clonal expansion (MCE), which is required for thecomplete differentiation of 3T3-L1 cells into mature adipocytes [46]. Since MCE occurs withinthe first 48 h of initiating differentiation [46], alterations to choline metabolism would not beunexpected. Indeed, our results show incorporation of 18O into both anabolic (CDP-choline)and catabolic (GPC) components of choline metabolism (Fig 5), suggestive of CDP-cholinecycle activity and cell membrane remodeling.
These results provide evidence that there is flux through the CDP-choline cycle early in thedifferentiation of 3T3-L1 preadipocytes into mature adipocytes.
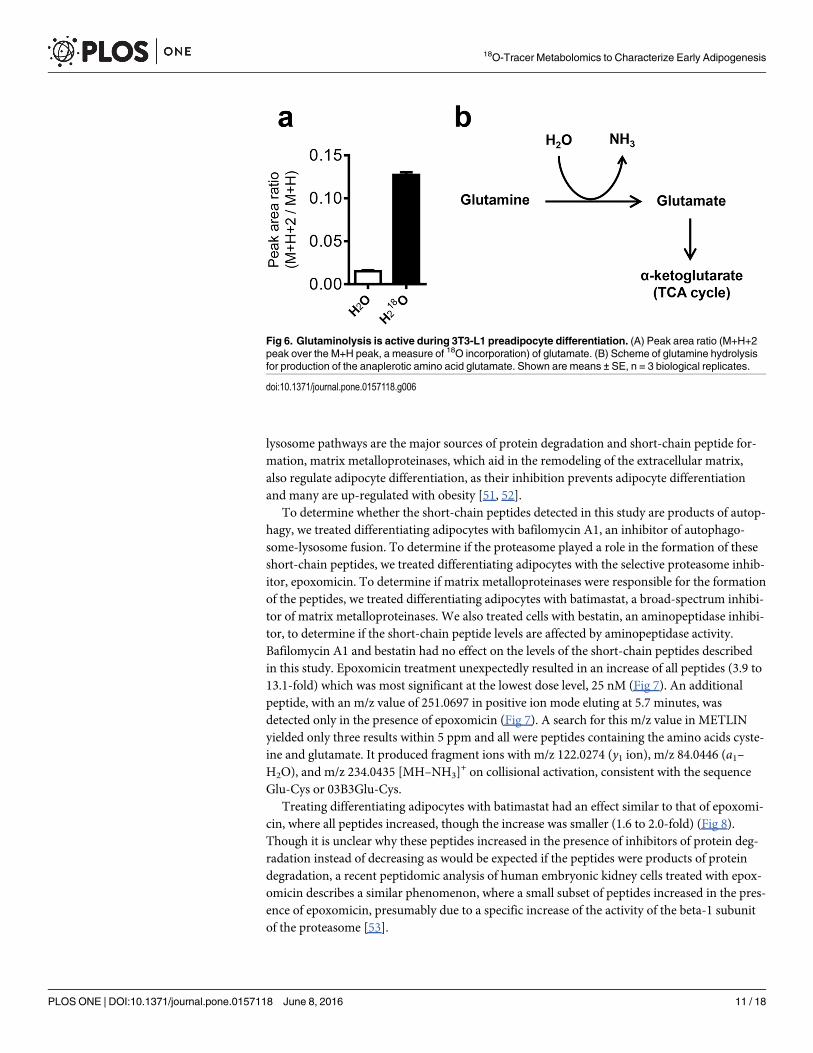
In addition to choline metabolites, our metabolomics analysis of differentiating 3T3-L1 prea-dipocytes incubated with H2
18O revealed significant incorporation of 18O into glutamate, aproduct of glutamine hydrolysis and major anaplerotic amino acid (Fig 6). These results suggestthat glutaminolysis is active in differentiating 3T3-L1 cells during MCE, despite the observeddecrease in total glutamate with the unlabeled metabolomics experiment. The flux through glu-tamate is likely in part destined for entry into the TCA cycle to support the increased energyand biomass requirements associated with cell division. Indeed, both mitochondrial and glyco-lytic energy production are increased 24 h after initiating 3T3-L1 differentiation, as evidencedby the increase in the rates of cellular oxygen consumption and extracellular acidification (S3Fig), a measure of lactate export. These results highlight the utility of metabolomics coupledwith H2
18O labeling to uncover changes in cellular metabolism that were otherwise undetectableby time course metabolomics.
Fig 4. Short-chain peptides are products of peptide hydrolysis. Representative total ion chromatograms (A, B) and peak areas of peptide M+H+2peaks (C) of differentiating (for 24 h) 3T3-L1 preadipocytes treated with 6% H2O or H2
18O. Shown are means ± SE, n = 3 biological replicates. ND, notdetected.
doi:10.1371/journal.pone.0157118.g004
18O-Tracer Metabolomics to Characterize Early Adipogenesis
PLOS ONE | DOI:10.1371/journal.pone.0157118 June 8, 2016 9 / 18
Short-chain peptide levels in differentiating 3T3-L1 preadipocytes areassociated with proteasome and matrix metalloproteinase activity, butnot autophagyProtein degradation during adipocyte differentiation is a complex and highly regulated process.The ubiquitin-proteasome system is required for the degradation of anti-adipogenic proteinsduring adipocyte differentiation [47] and proteasome inhibition decreases adipocyte differenti-ation [48]. Autophagy also appears to be important for adipocyte differentiation. Inhibitionof autophagy in adipocytes through adipose specific deletion of autophagy-related genesdecreases white adipose tissue mass in animals [49, 50]. Though the ubiquitin-proteasome and
Fig 5. The CDP-choline cycle is active during 3T3-L1 preadipocyte differentiation. (A) Choline metabolism and the potential for 18O incorporationfrom H2
18O. Adapted from Fagone and Jackowski [41]. (B-F) Peak area ratios (M+H+2 peak over the M+H peak, a measure of 18O incorporation) ofcholine metabolites. (G-M) Temporal changes in choline metabolites during 3T3-L1 preadipocyte differentiation. Shown are means ± SE, n = 3biological replicates except time 0 h, where n = 6. *** p < 0.0001 and ** p < 0.001 from a two-tailed t-test. ns, not significant where p > 0.05.
doi:10.1371/journal.pone.0157118.g005
18O-Tracer Metabolomics to Characterize Early Adipogenesis
PLOS ONE | DOI:10.1371/journal.pone.0157118 June 8, 2016 10 / 18
lysosome pathways are the major sources of protein degradation and short-chain peptide for-mation, matrix metalloproteinases, which aid in the remodeling of the extracellular matrix,also regulate adipocyte differentiation, as their inhibition prevents adipocyte differentiationand many are up-regulated with obesity [51, 52].
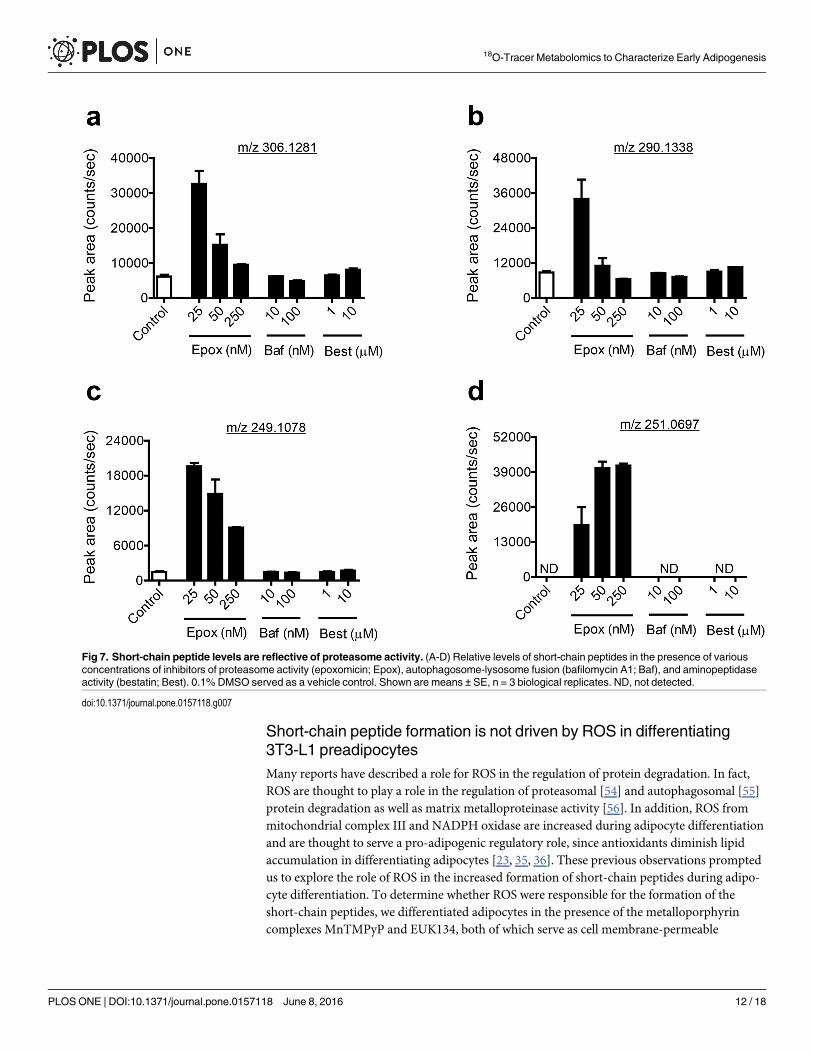
To determine whether the short-chain peptides detected in this study are products of autop-hagy, we treated differentiating adipocytes with bafilomycin A1, an inhibitor of autophago-some-lysosome fusion. To determine if the proteasome played a role in the formation of theseshort-chain peptides, we treated differentiating adipocytes with the selective proteasome inhib-itor, epoxomicin. To determine if matrix metalloproteinases were responsible for the formationof the peptides, we treated differentiating adipocytes with batimastat, a broad-spectrum inhibi-tor of matrix metalloproteinases. We also treated cells with bestatin, an aminopeptidase inhibi-tor, to determine if the short-chain peptide levels are affected by aminopeptidase activity.Bafilomycin A1 and bestatin had no effect on the levels of the short-chain peptides describedin this study. Epoxomicin treatment unexpectedly resulted in an increase of all peptides (3.9 to13.1-fold) which was most significant at the lowest dose level, 25 nM (Fig 7). An additionalpeptide, with an m/z value of 251.0697 in positive ion mode eluting at 5.7 minutes, wasdetected only in the presence of epoxomicin (Fig 7). A search for this m/z value in METLINyielded only three results within 5 ppm and all were peptides containing the amino acids cyste-ine and glutamate. It produced fragment ions with m/z 122.0274 (y1 ion), m/z 84.0446 (a1–H2O), and m/z 234.0435 [MH–NH3]
+ on collisional activation, consistent with the sequenceGlu-Cys or 03B3Glu-Cys.
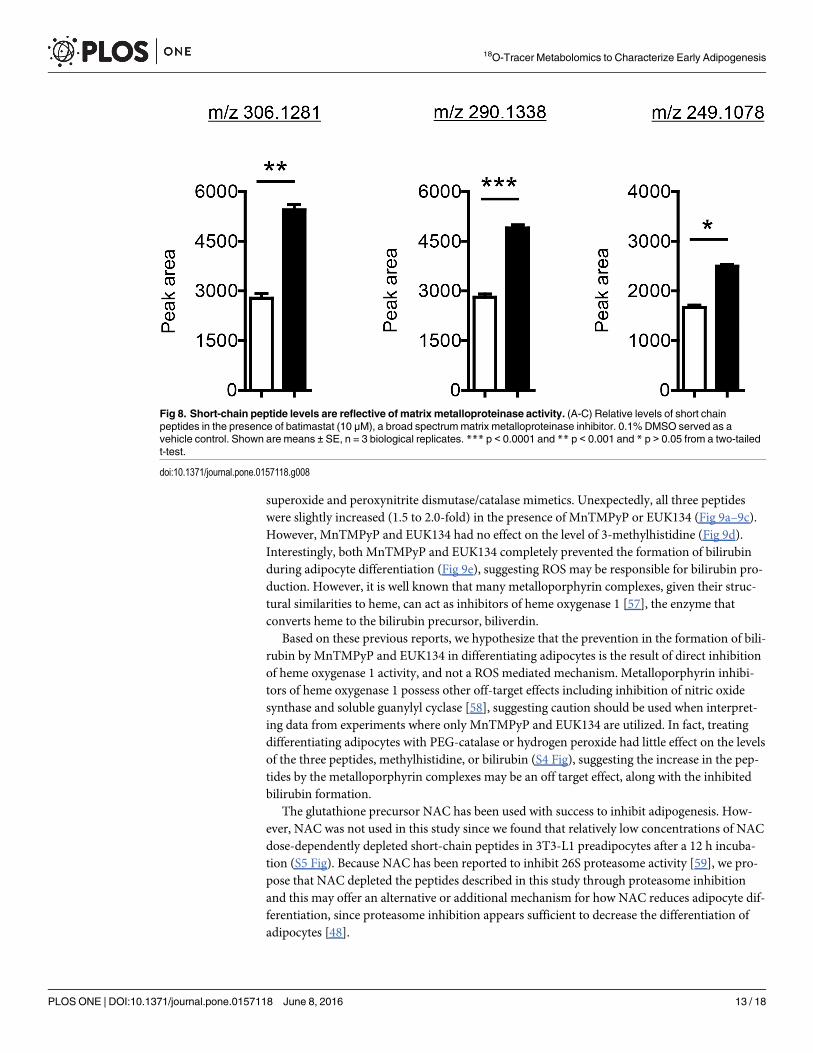
Treating differentiating adipocytes with batimastat had an effect similar to that of epoxomi-cin, where all peptides increased, though the increase was smaller (1.6 to 2.0-fold) (Fig 8).Though it is unclear why these peptides increased in the presence of inhibitors of protein deg-radation instead of decreasing as would be expected if the peptides were products of proteindegradation, a recent peptidomic analysis of human embryonic kidney cells treated with epox-omicin describes a similar phenomenon, where a small subset of peptides increased in the pres-ence of epoxomicin, presumably due to a specific increase of the activity of the beta-1 subunitof the proteasome [53].
Fig 6. Glutaminolysis is active during 3T3-L1 preadipocyte differentiation. (A) Peak area ratio (M+H+2peak over the M+H peak, a measure of 18O incorporation) of glutamate. (B) Scheme of glutamine hydrolysisfor production of the anaplerotic amino acid glutamate. Shown are means ± SE, n = 3 biological replicates.
doi:10.1371/journal.pone.0157118.g006
18O-Tracer Metabolomics to Characterize Early Adipogenesis
PLOS ONE | DOI:10.1371/journal.pone.0157118 June 8, 2016 11 / 18
Short-chain peptide formation is not driven by ROS in differentiating3T3-L1 preadipocytesMany reports have described a role for ROS in the regulation of protein degradation. In fact,ROS are thought to play a role in the regulation of proteasomal [54] and autophagosomal [55]protein degradation as well as matrix metalloproteinase activity [56]. In addition, ROS frommitochondrial complex III and NADPH oxidase are increased during adipocyte differentiationand are thought to serve a pro-adipogenic regulatory role, since antioxidants diminish lipidaccumulation in differentiating adipocytes [23, 35, 36]. These previous observations promptedus to explore the role of ROS in the increased formation of short-chain peptides during adipo-cyte differentiation. To determine whether ROS were responsible for the formation of theshort-chain peptides, we differentiated adipocytes in the presence of the metalloporphyrincomplexes MnTMPyP and EUK134, both of which serve as cell membrane-permeable
Fig 7. Short-chain peptide levels are reflective of proteasome activity. (A-D) Relative levels of short-chain peptides in the presence of variousconcentrations of inhibitors of proteasome activity (epoxomicin; Epox), autophagosome-lysosome fusion (bafilomycin A1; Baf), and aminopeptidaseactivity (bestatin; Best). 0.1% DMSO served as a vehicle control. Shown are means ± SE, n = 3 biological replicates. ND, not detected.
doi:10.1371/journal.pone.0157118.g007
18O-Tracer Metabolomics to Characterize Early Adipogenesis
PLOS ONE | DOI:10.1371/journal.pone.0157118 June 8, 2016 12 / 18
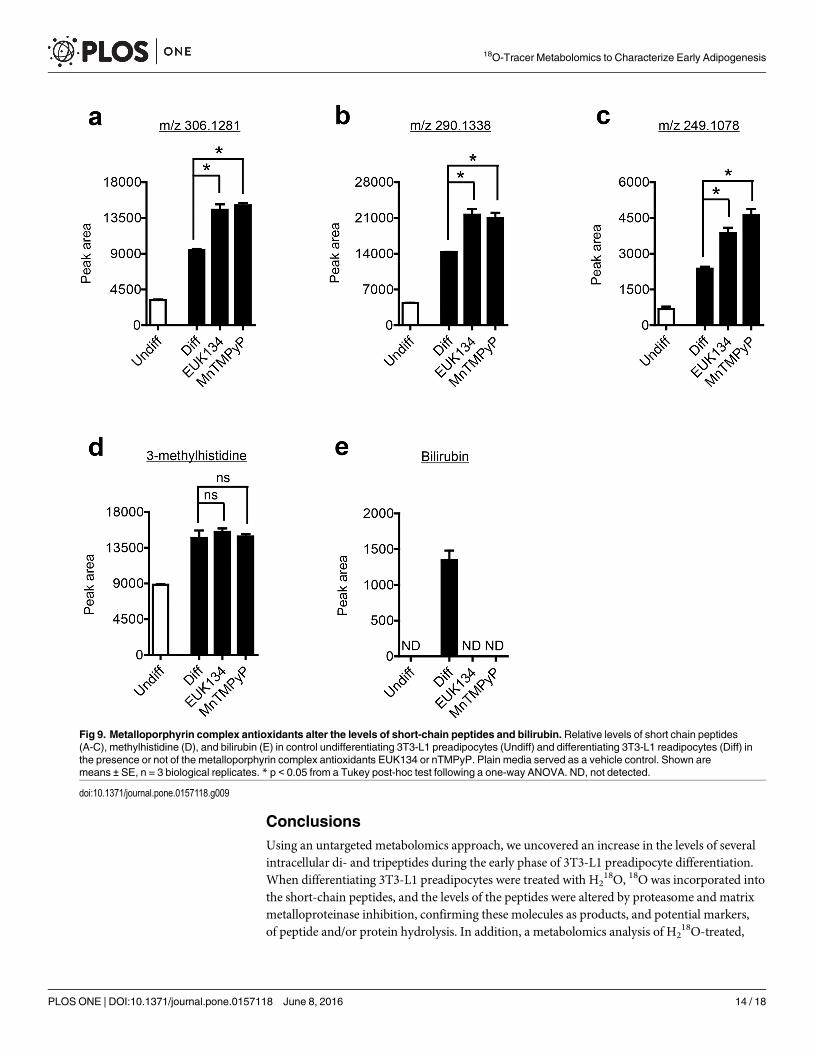
superoxide and peroxynitrite dismutase/catalase mimetics. Unexpectedly, all three peptideswere slightly increased (1.5 to 2.0-fold) in the presence of MnTMPyP or EUK134 (Fig 9a–9c).However, MnTMPyP and EUK134 had no effect on the level of 3-methylhistidine (Fig 9d).Interestingly, both MnTMPyP and EUK134 completely prevented the formation of bilirubinduring adipocyte differentiation (Fig 9e), suggesting ROS may be responsible for bilirubin pro-duction. However, it is well known that many metalloporphyrin complexes, given their struc-tural similarities to heme, can act as inhibitors of heme oxygenase 1 [57], the enzyme thatconverts heme to the bilirubin precursor, biliverdin.
Based on these previous reports, we hypothesize that the prevention in the formation of bili-rubin by MnTMPyP and EUK134 in differentiating adipocytes is the result of direct inhibitionof heme oxygenase 1 activity, and not a ROS mediated mechanism. Metalloporphyrin inhibi-tors of heme oxygenase 1 possess other off-target effects including inhibition of nitric oxidesynthase and soluble guanylyl cyclase [58], suggesting caution should be used when interpret-ing data from experiments where only MnTMPyP and EUK134 are utilized. In fact, treatingdifferentiating adipocytes with PEG-catalase or hydrogen peroxide had little effect on the levelsof the three peptides, methylhistidine, or bilirubin (S4 Fig), suggesting the increase in the pep-tides by the metalloporphyrin complexes may be an off target effect, along with the inhibitedbilirubin formation.
The glutathione precursor NAC has been used with success to inhibit adipogenesis. How-ever, NAC was not used in this study since we found that relatively low concentrations of NACdose-dependently depleted short-chain peptides in 3T3-L1 preadipocytes after a 12 h incuba-tion (S5 Fig). Because NAC has been reported to inhibit 26S proteasome activity [59], we pro-pose that NAC depleted the peptides described in this study through proteasome inhibitionand this may offer an alternative or additional mechanism for how NAC reduces adipocyte dif-ferentiation, since proteasome inhibition appears sufficient to decrease the differentiation ofadipocytes [48].
Fig 8. Short-chain peptide levels are reflective of matrix metalloproteinase activity. (A-C) Relative levels of short chainpeptides in the presence of batimastat (10 μM), a broad spectrummatrix metalloproteinase inhibitor. 0.1% DMSO served as avehicle control. Shown are means ± SE, n = 3 biological replicates. *** p < 0.0001 and ** p < 0.001 and * p > 0.05 from a two-tailedt-test.
doi:10.1371/journal.pone.0157118.g008
18O-Tracer Metabolomics to Characterize Early Adipogenesis
PLOS ONE | DOI:10.1371/journal.pone.0157118 June 8, 2016 13 / 18
ConclusionsUsing an untargeted metabolomics approach, we uncovered an increase in the levels of severalintracellular di- and tripeptides during the early phase of 3T3-L1 preadipocyte differentiation.When differentiating 3T3-L1 preadipocytes were treated with H2
18O, 18O was incorporated intothe short-chain peptides, and the levels of the peptides were altered by proteasome and matrixmetalloproteinase inhibition, confirming these molecules as products, and potential markers,of peptide and/or protein hydrolysis. In addition, a metabolomics analysis of H2
18O-treated,
Fig 9. Metalloporphyrin complex antioxidants alter the levels of short-chain peptides and bilirubin. Relative levels of short chain peptides(A-C), methylhistidine (D), and bilirubin (E) in control undifferentiating 3T3-L1 preadipocytes (Undiff) and differentiating 3T3-L1 readipocytes (Diff) inthe presence or not of the metalloporphyrin complex antioxidants EUK134 or nTMPyP. Plain media served as a vehicle control. Shown aremeans ± SE, n = 3 biological replicates. * p < 0.05 from a Tukey post-hoc test following a one-way ANOVA. ND, not detected.
doi:10.1371/journal.pone.0157118.g009
18O-Tracer Metabolomics to Characterize Early Adipogenesis
PLOS ONE | DOI:10.1371/journal.pone.0157118 June 8, 2016 14 / 18
differentiating 3T3-L1 preadipocytes revealed flux through the CDP-choline cycle and glutami-nolysis in differentiating 3T3-L1 preadipocytes, highlighting the potential for isotope labelingexperiments to uncover active metabolic pathways during fundamental cellular processes andthe inability of single point or time course metabolomics experiments to detect such changes.Though 3T3-L1 preadipocytes have been a robust model of adipocyte differentiation, metabo-lism in human adipocytes can differ and future efforts will be necessary to confirm these find-ings in human adipocytes.
Supporting InformationS1 Fig. The relative changes in amino acid levels during 3T3-L1 preadipocyte differentia-tion are consistent. Fold-changes (undifferentiating vs. 24 h differentiating 3T3-L1 preadipo-cytes) for all amino acids detected (except cysteine, which has been removed for clarity due tolarge fold-change) from two separate experiments plotted against each other.(PDF)
S2 Fig. Effect of 3T3-L1 preadipocyte differentiation on total cellular protein content.Change in total cellular protein content after 24 h of 3T3-L1 preadipocyte differentiation inthe presence and absence of metalloporphyrin complex antioxidants. Plain media served as avehicle control. Shown are means ± SE, n = 3. ��� p< 0.001 from a Tukey post-hoc test follow-ing a one-way ANOVA. ns, not significant where p> 0.05; Ctrl, control; E, EUK134; M,MnTMPyP.(PDF)
S3 Fig. Effect of 3T3-L1 preadipocyte differentiation on OCR and ECAR. Changes in theoxygen consumption rate (OCR) (A) and extracellular acidification rate (ECAR) (B) after 24 hof 3T3-L1 preadipocyte differentiation in the presence and absence of metalloporphyrincomplex antioxidants. Plain media served as a vehicle control. Shown are means ± SE, n = 5.��� p< 0.001 and � p< 0.05 from a Tukey post-hoc test following a one-way ANOVA. ns, notsignificant; Ctrl, control; E, EUK134; M, MnTMPyP.(PDF)
S4 Fig. Reactive oxygen species do not play a major role in short-chain peptide formationduring 3T3-L1 preadipocyte differentiation. Relative levels of short chain peptides, 3-methyl-histidine, and bilirubin in differentiating 3T3-L1 preadipocytes treated with various concentra-tions of H2O2 or PEG-catalase. Plain media served as a vehicle control. Shown are means ± SE,n = 3.(PDF)
S5 Fig. Effect of NAC on short-chain peptide levels in 3T3-L1 preadipocytes. Changes inshort-chain peptide levels in 2-day post-confluent 3T3-L1 preadipocytes after a 12 h incuba-tion with various concentrations of N-acetylcysteine (NAC). Plain media served as a vehiclecontrol. Shown are means ± SE, n = 3. ND, not detected.(PDF)
S1 Table. Identified metabolites.(XLSX)
AcknowledgmentsWe thank Mr. Jeffrey Morré for assistance with mass spectrometry experiments.
18O-Tracer Metabolomics to Characterize Early Adipogenesis
PLOS ONE | DOI:10.1371/journal.pone.0157118 June 8, 2016 15 / 18
Author ContributionsConceived and designed the experiments: JSK JFS. Performed the experiments: JSK CLM. Ana-lyzed the data: JSK CLM GB CSM JFS. Contributed reagents/materials/analysis tools: CSM GBJFS. Wrote the paper: JSK CLM GB CSM JFS.
References1. Spalding KL, Arner E, Westermark PO, Bernard S, Buchholz BA, Bergmann O, et al. Dynamics of fat
cell turnover in humans. Nature. 2008; 453(7196):783–7. doi: 10.1038/nature06902 PMID: 18454136
2. Gavin KM, Gutman JA, Kohrt WM, Wei Q, Shea KL, Miller HL, et al. De novo generation of adipocytesfrom circulating progenitor cells in mouse and human adipose tissue. FASEB J 2016; 30(3):1096–108.doi: 10.1096/fj.15-278994 PMID: 26581599
3. Qian SW, Li X, Zhang YY, Huang HY, Liu Y, Sun X, et al. Characterization of adipocyte differentiationfrom human mesenchymal stem cells in bone marrow. BMC Dev Biol. 2010; 10:47. doi: 10.1186/1471-213X-10-47 PMID: 20459638
4. Tontonoz P, Hu E, Spiegelman BM. Regulation of adipocyte gene expression and differentiation by per-oxisome proliferator activated receptor gamma. Curr Opin Genet Dev. 1995; 5(5):571–6. PMID:8664544
5. Tang QQ, Lane MD. Adipogenesis: from stem cell to adipocyte. Annu Rev Biochem. 2012; 81:715–36.doi: 10.1146/annurev-biochem-052110-115718 PMID: 22463691
6. Merkestein M, Laber S, McMurray F, Andrew D, Sachse G, Sanderson J, et al. FTO influences adipo-genesis by regulating mitotic clonal expansion. Nat Commun. 2015; 6:6792. doi: 10.1038/ncomms7792 PMID: 25881961
7. Yeo GS. The role of the FTO (Fat Mass and Obesity Related) locus in regulating body size and compo-sition. Mol Cell Endocrinol. 2014; 397(1–2):34–41. doi: 10.1016/j.mce.2014.09.012 PMID: 25224490
8. Varshney S, Shankar K, Beg M, Balaramnavar VM, Mishra SK, Jagdale P, et al. Rohitukine inhibits invitro adipogenesis arresting mitotic clonal expansion and improves dyslipidemia in vivo. J Lipid Res.2014; 55(6):1019–32. PMID: 24646949
9. Cheong LY, Suk S, Thimmegowda NR, ChungMY, Yang H, Seo SG, et al. Hirsutenone Directly Tar-gets PI3K and ERK to Inhibit Adipogenesis in 3T3-L1 Preadipocytes. J Cell Biochem. 2015; 116(7):1361–70. doi: 10.1002/jcb.25093 PMID: 25756947
10. Kwon JY, Seo SG, Heo YS, Yue S, Cheng JX, Lee KW, et al. Piceatannol, natural polyphenolic stil-bene, inhibits adipogenesis via modulation of mitotic clonal expansion and insulin receptor-dependentinsulin signaling in early phase of differentiation. J Biol Chem. 2012; 287(14):11566–78. doi: 10.1074/jbc.M111.259721 PMID: 22298784
11. Lee J, Kim D, Choi J, Choi H, Ryu JH, Jeong J, et al. Dehydrodiconiferyl alcohol isolated from Cucurbitamoschata shows anti-adipogenic and anti-lipogenic effects in 3T3-L1 cells and primary mouse embry-onic fibroblasts. J Biol Chem. 2012; 287(12):8839–51. doi: 10.1074/jbc.M111.263434 PMID: 22262865
12. Gao Y, Kalkhoven E. TIPping the balance in adipogenesis: USP7-mediated stabilization of Tip60. Adi-pocyte. 2014; 3(2):160–5. doi: 10.4161/adip.28307 PMID: 24719792
13. Jiang Y, Guo L, Xie LQ, Zhang YY, Liu XH, Zhang Y, et al. Proteome profiling of mitotic clonal expan-sion during 3T3-L1 adipocyte differentiation using iTRAQ-2DLC-MS/MS. J Proteome Res. 2014; 13(3):1307–14. doi: 10.1021/pr401292p PMID: 24450392
14. Guo L, Li X, Tang QQ. Transcriptional regulation of adipocyte differentiation: a central role for CCAAT/enhancer-binding protein (C/EBP) beta. J Biol Chem. 2015; 290(2):755–61. doi: 10.1074/jbc.R114.619957 PMID: 25451943
15. Hyvonen MT, Koponen T, Weisell J, Pietila M, Khomutov AR, Vepsalainen J, et al. Spermidine pro-motes adipogenesis of 3T3-L1 cells by preventing interaction of ANP32 with HuR and PP2A. BiochemJ. 2013; 453(3):467–74. doi: 10.1042/BJ20130263 PMID: 23672317
16. Ishii I, Ikeguchi Y, Mano H, Wada M, Pegg AE, Shirahata A. Polyamine metabolism is involved in adipo-genesis of 3T3-L1 cells. Amino Acids. 2012; 42(2–3):619–26. doi: 10.1007/s00726-011-1037-5 PMID:21809076
17. Brenner S, Bercovich Z, Feiler Y, Keshet R, Kahana C. Dual Regulatory Role of Polyamines in Adipo-genesis. J Biol Chem. 2015; 290(45):27384–92. doi: 10.1074/jbc.M115.686980 PMID: 26396188
18. Green CR, Wallace M, Divakaruni AS, Phillips SA, Murphy AN, Ciaraldi TP, et al. Branched-chainamino acid catabolism fuels adipocyte differentiation and lipogenesis. Nat Chem Biol. 2016; 12:15–21.doi: 10.1038/nchembio.1961 PMID: 26571352
18O-Tracer Metabolomics to Characterize Early Adipogenesis
PLOS ONE | DOI:10.1371/journal.pone.0157118 June 8, 2016 16 / 18
19. Goldman S, Zhang Y, Jin S. Autophagy and adipogenesis: implications in obesity and type II diabetes.Autophagy. 2010; 6(1):179–81. PMID: 20110772
20. Farmer SR. Regulation of PPARgamma activity during adipogenesis. Int J Obes (Lond). 2005; 29Suppl 1:S13–6.
21. Bauters D, Scroyen I, Van Hul M, Lijnen HR. Gelatinase A (MMP-2) promotes murine adipogenesis.Biochim Biophys Acta. 2015; 1850(7):1449–56. doi: 10.1016/j.bbagen.2015.04.003 PMID: 25869489
22. Vigilanza P, Aquilano K, Baldelli S, Rotilio G, Ciriolo MR. Modulation of intracellular glutathione affectsadipogenesis in 3T3-L1 cells. J Cell Physiol. 2011; 226(8):2016–24. doi: 10.1002/jcp.22542 PMID:21520053
23. Lee H, Lee YJ, Choi H, Ko EH, Kim JW. Reactive oxygen species facilitate adipocyte differentiation byaccelerating mitotic clonal expansion. J Biol Chem. 2009; 284(16):10601–9. doi: 10.1074/jbc.M808742200 PMID: 19237544
24. Hyvonen MT, Koponen T, Weisell J, Pietila M, Khomutov AR, Vepsalainen J, et al. Spermidine pro-motes adipogenesis of 3T3-L1 cells by preventing interaction of ANP32 with HUR and PP2A. BiochemJ. 2013; 453(3):467–74. doi: 10.1042/BJ20130263 PMID: 23672317
25. Roberts LD, Virtue S, Vidal-Puig A, Nicholls AW, Griffin JL. Metabolic phenotyping of a model of adipo-cyte differentiation. Physiol Genomics. 2009; 39(2):109–19. doi: 10.1152/physiolgenomics.90365.2008PMID: 19602617
26. Vuohelainen S, Pirinen E, Cerrada-Gimenez M, Keinanen TA, Uimari A, Pietila M, et al. Spermidine isindispensable in differentiation of 3T3-L1 fibroblasts to adipocytes. J Cell Mol Med. 2010; 14(6B):1683–92. doi: 10.1111/j.1582-4934.2009.00808.x PMID: 19538475
27. Kirkwood JS, Legette LL, Miranda CL, Jiang Y, Stevens JF. A metabolomics driven elucidation of theanti-obesity mechanisms of xanthohumol. J Biol Chem. 2013; 288(26):19000–13. doi: 10.1074/jbc.M112.445452 PMID: 23673658
28. Kirkwood JS, Maier C, Stevens JF. Simultaneous, untargeted metabolic profiling of polar and nonpolarmetabolites by LC-Q-TOFmass spectrometry. Curr Protoc Toxicol. 2013; Chapter 4:Unit 4.39.
29. Benjamini Y, Krieger A, Yekutieli D. Adaptive linear step-up procedures that control the false discoveryrate. Biometrika. 2006; 93:491–507.
30. Calzadilla P, Sapochnik D, Cosentino S, Diz V, Dicelio L, Calvo JC, et al. N-Acetylcysteine ReducesMarkers of Differentiation in 3T3-L1 Adipocytes. Int J Mol Sci. 2011; 12(10):6936–51. doi: 10.3390/ijms12106936 PMID: 22072928
31. Vujcic S, Halmekyto M, Diegelman P, Gan G, Kramer DL, Janne J, et al. Effects of conditional overex-pression of spermidine/spermine N1-acetyltransferase on polyamine pool dynamics, cell growth, andsensitivity to polyamine analogs. J Biol Chem. 2000; 275(49):38319–28. PMID: 10978316
32. Kramer DL, Diegelman P, Jell J, Vujcic S, Merali S, Porter CW. Polyamine acetylation modulates poly-amine metabolic flux, a prelude to broader metabolic consequences. J Biol Chem. 2008; 283(7):4241–51. PMID: 18089555
33. Liu Y, Borchert GL, Surazynski A, Hu CA, Phang JM. Proline oxidase activates both intrinsic and extrin-sic pathways for apoptosis: the role of ROS/superoxides, NFAT and MEK/ERK signaling. Oncogene.2006; 25(41):5640–7. PMID: 16619034
34. Zarse K, Schmeisser S, Groth M, Priebe S, Beuster G, Kuhlow D, et al. Impaired insulin/IGF1 signalingextends life span by promoting mitochondrial L-proline catabolism to induce a transient ROS signal.Cell Metab. 2012; 15(4):451–65. doi: 10.1016/j.cmet.2012.02.013 PMID: 22482728
35. Tormos KV, Anso E, Hamanaka RB, Eisenbart J, Joseph J, Kalyanaraman B, et al. Mitochondrial com-plex III ROS regulate adipocyte differentiation. Cell Metab. 2011; 14(4):537–44. doi: 10.1016/j.cmet.2011.08.007 PMID: 21982713
36. Kanda Y, Hinata T, Kang SW,Watanabe Y. Reactive oxygen species mediate adipocyte differentiationin mesenchymal stem cells. Life Sci. 2011; 89(7–8):250–8. doi: 10.1016/j.lfs.2011.06.007 PMID:21722651
37. Pandhare J, Cooper SK, Phang JM. Proline oxidase, a proapoptotic gene, is induced by troglitazone:evidence for both peroxisome proliferator-activated receptor gamma-dependent and -independentmechanisms. J Biol Chem. 2006; 281(4):2044–52. PMID: 16303758
38. Phang JM, Pandhare J, Zabirnyk O, Liu Y. PPARgamma and Proline Oxidase in Cancer. PPAR Res.2008; 2008:542694. doi: 10.1155/2008/542694 PMID: 18670615
39. Young VR, Havenberg LN, Bilmazes C, Munro HN. Potential use of 3-methylhistidine excretion as anindex of progressive reduction in muscle protein catabolism during starvation. Metabolism. 1973; 23(2):1429–36. PMID: 4749543
40. Tenhunen R, Marver HS, Schmid R. Microsomal heme oxygenase. Characterization of the enzyme. JBiol Chem. 1969; 244(23):6388–94. PMID: 4390967
18O-Tracer Metabolomics to Characterize Early Adipogenesis
PLOS ONE | DOI:10.1371/journal.pone.0157118 June 8, 2016 17 / 18
41. Fagone P, Jackowski S. Phosphatidylcholine and the CDP-choline cycle. Biochim Biophys Acta. 2013;1831(3):523–32. doi: 10.1016/j.bbalip.2012.09.009 PMID: 23010477
42. Northwood IC, Tong AH, Crawford B, Drobnies AE, Cornell RB. Shuttling of CTP:Phosphocholine cyti-dylyltransferase between the nucleus and endoplasmic reticulum accompanies the wave of phosphati-dylcholine synthesis during the G(0)—>G(1) transition. J Biol Chem. 1999; 274(37):26240–8. PMID:10473578
43. Terce F, Brun H, Vance DE. Requirement of phosphatidylcholine for normal progression through thecell cycle in C3H/10T1/2 fibroblasts. J Lipid Res. 1994; 35(12):2130–42. PMID: 7897311
44. Zaccheo O, Dinsdale D, Meacock PA, Glynn P. Neuropathy target esterase and its yeast homologuedegrade phosphatidylcholine to glycerophosphocholine in living cells. J Biol Chem. 2004; 279(23):24024–33. PMID: 15044461
45. Manguikian AD, Barbour SE. Cell cycle dependence of group VIA calcium-independent phospholipaseA2 activity. J Biol Chem. 2004; 279(51):52881–92. PMID: 15385540
46. Tang QQ, Otto TC, Lane MD. Mitotic clonal expansion: a synchronous process required for adipogen-esis. Proc Natl Acad Sci U S A. 2003; 100(1):44–9. PMID: 12502791
47. ChutkowWA, Lee RT. Thioredoxin regulates adipogenesis through thioredoxin-interacting protein(Txnip) protein stability. J Biol Chem. 2011; 286(33):29139–45. doi: 10.1074/jbc.M111.267666 PMID:21705327
48. Dasuri K, Zhang L, Ebenezer P, Fernandez-Kim SO, Bruce-Keller AJ, Szweda LI, et al. Proteasomealterations during adipose differentiation and aging: links to impaired adipocyte differentiation anddevelopment of oxidative stress. Free Radic Biol Med. 2011; 51(9):1727–35. doi: 10.1016/j.freeradbiomed.2011.08.001 PMID: 21871954
49. Singh R, Xiang Y, Wang Y, Baikati K, Cuervo AM, Luu YK, et al. Autophagy regulates adipose massand differentiation in mice. J Clin Invest. 2009; 119(11):3329–39. doi: 10.1172/JCI39228 PMID:19855132
50. Zhang Y, Goldman S, Baerga R, Zhao Y, Komatsu M, Jin S. Adipose-specific deletion of autophagy-related gene 7 (atg7) in mice reveals a role in adipogenesis. Proc Natl Acad Sci U S A. 2009; 106(47):19860–5. doi: 10.1073/pnas.0906048106 PMID: 19910529
51. Croissandeau G, Chretien M, Mbikay M. Involvement of matrix metalloproteinases in the adipose con-version of 3T3-L1 preadipocytes. Biochem J. 2002; 364(Pt 3):739–46. PMID: 12049638
52. Chavey C, Mari B, Monthouel MN, Bonnafous S, Anglard P, Van Obberghen E, et al. Matrix metallopro-teinases are differentially expressed in adipose tissue during obesity and modulate adipocyte differenti-ation. J Biol Chem. 2003; 278(14):11888–96. PMID: 12529376
53. Fricker LD, Gelman JS, Castro LM, Gozzo FC, Ferro ES. Peptidomic analysis of HEK293T cells: effectof the proteasome inhibitor epoxomicin on intracellular peptides. J Proteome Res. 2012; 11(3):1981–90. doi: 10.1021/pr2012076 PMID: 22304392
54. Aiken CT, Kaake RM, Wang X, Huang L. Oxidative stress-mediated regulation of proteasome com-plexes. Mol Cell Proteomics. 2011; 10(5):R110.006924. doi: 10.1074/mcp.M110.006924 PMID:21543789
55. Gibson SB. Investigating the role of reactive oxygen species in regulating autophagy. Methods Enzy-mol. 2013; 528:217–35. doi: 10.1016/B978-0-12-405881-1.00013-6 PMID: 23849868
56. Zhang HJ, ZhaoW, Venkataraman S, Robbins ME, Buettner GR, Kregel KC, et al. Activation of matrixmetalloproteinase-2 by overexpression of manganese superoxide dismutase in human breast cancerMCF-7 cells involves reactive oxygen species. J Biol Chem. 2002; 277(23):20919–26. PMID:11929863
57. Vreman HJ, Ekstrand BC, Stevenson DK. Selection of metalloporphyrin heme oxygenase inhibitorsbased on potency and photoreactivity. Pediatr Res. 1993; 33(2):195–200. PMID: 8433895
58. Appleton SD, Chretien ML, McLaughlin BE, Vreman HJ, Stevenson DK, Brien JF, et al. Selective inhibi-tion of heme oxygenase, without inhibition of nitric oxide synthase or soluble guanylyl cyclase, by metal-loporphyrins at low concentrations. Drug Metab Dispos. 1999; 27(10):1214–9. PMID: 10497150
59. Pajonk F, Riess K, Sommer A, McBride WH. N-acetyl-L-cysteine inhibits 26S proteasome function:implications for effects on NF-kappaB activation. Free Radic Biol Med. 2002; 32(6):536–43. PMID:11958954
18O-Tracer Metabolomics to Characterize Early Adipogenesis
PLOS ONE | DOI:10.1371/journal.pone.0157118 June 8, 2016 18 / 18