Embed Size (px)
Citation preview
RESEARCH ARTICLE
Individual Variability and Test-RetestReliability Revealed by Ten RepeatedResting-State Brain Scans over One MonthBing Chen1,2☯, Ting Xu3☯, Changle Zhou1, LuoyuWang2, Ning Yang3,4,5, Ze Wang2, Hao-Ming Dong3,4,5, Zhi Yang3,5, Yu-Feng Zang2, Xi-Nian Zuo3,5,6,7*, Xu-ChuWeng1,2*
1 Fujian Provincial Key Lab of the Brain-like Intelligent systems, Xiamen University School of InformationScience and Engineering, Xiamen, Fujian 361005, China, 2 Zhejiang Key Laboratory for Research inAssessment of Cognitive Impairments, Center for Cognition and Brain Disorders, Hangzhou NormalUniversity, Hangzhou, Zhejiang 311121, China, 3 Key Laboratory of Behavioural Sciences and MagneticResonance Imaging Research Center, Institute of Psychology, Chinese Academy of Sciences, Beijing100101, China, 4 University of Chinese Academy of Sciences, Beijing 100049, China, 5 Laboratory forFunctional Connectome and Development, Institute of Psychology, Chinese Academy of Sciences, Beijing100101, China, 6 Faculty of Psychology, Southwest University, Beibei, Chongqing 400715, China,7Department of Psychology, School of Education Science, Guangxi Teachers Education University,Nanning, Guangxi 530001, China
☯ These authors contributed equally to this work.* [email protected] (XNZ); [email protected] (XW)
AbstractIndividual differences in mind and behavior are believed to reflect the functional variability of
the human brain. Due to the lack of a large-scale longitudinal dataset, the full landscape of
variability within and between individual functional connectomes is largely unknown. We
collected 300 resting-state functional magnetic resonance imaging (rfMRI) datasets from 30
healthy participants who were scanned every three days for one month. With these data,
both intra- and inter-individual variability of six common rfMRI metrics, as well as their test-
retest reliability, were estimated across multiple spatial scales. Global metrics were more
dynamic than local regional metrics. Cognitive components involving working memory, inhi-
bition, attention, language and related neural networks exhibited high intra-individual vari-
ability. In contrast, inter-individual variability demonstrated a more complex picture across
the multiple scales of metrics. Limbic, default, frontoparietal and visual networks and their
related cognitive components were more differentiable than somatomotor and attention net-
works across the participants. Analyzing both intra- and inter-individual variability revealed
a set of high-resolution maps on test-retest reliability of the multi-scale connectomic metrics.
These findings represent the first collection of individual differences in multi-scale and multi-
metric characterization of the human functional connectomes in-vivo, serving as normal ref-
erences for the field to guide the use of common functional metrics in rfMRI-based
applications.
PLOS ONE | DOI:10.1371/journal.pone.0144963 December 29, 2015 1 / 21
a11111
OPEN ACCESS
Citation: Chen B, Xu T, Zhou C, Wang L, Yang N,Wang Z, et al. (2015) Individual Variability and Test-Retest Reliability Revealed by Ten RepeatedResting-State Brain Scans over One Month. PLoSONE 10(12): e0144963. doi:10.1371/journal.pone.0144963
Editor: Gaolang Gong, Beijing Normal University,CHINA
Received: September 11, 2015
Accepted: November 27, 2015
Published: December 29, 2015
Copyright: © 2015 Chen et al. This is an openaccess article distributed under the terms of theCreative Commons Attribution License, which permitsunrestricted use, distribution, and reproduction in anymedium, provided the original author and source arecredited.
Data Availability Statement: All neuroimagingimage files are available from FigShare (https://figshare.com/s/7dac285e153e176d90e8) with adigital object identifier (10.6084/m9.figshare.2007483).
Funding: This work was partially supported by theNational Key Basic Research and Development (973)Program (2015CB351702, X-NZ), the Major JointFund for International Cooperation and Exchange ofthe National Natural Science Foundation(81220108014, X-NZ), the Hundred Talents Programand the Key Research Program (KSZD-EW-TZ-002,
IntroductionFunctional connectomics with resting-state functional magnetic resonance imaging (rfMRI)is a widely used tool to map the intrinsic architecture in the human brain [1–4]. Differentcomputational methods have been developed to examine the functional changes associatedwith development and disease processes [5, 6]. The rfMRI-derived metrics can be categorizedinto three different types according to the spatial scale at which they characterize humanbrain function, namely the local scale (brain areas/regions), meso-scale (subnetworks ormodules), and global brain. At each scale these metrics aim to characterize information seg-regation and integration in functional connectomics. Functional connectivity between brainareas can be defined in a relatively straightforward manner with temporal correlations [7, 8];other measures of connectivity can be used, but may be difficult hard to interpret, partlybecause there are many confounds [9] that can affect these metrics [10–13]. Fortunately, sev-eral recent studies have made efforts on explore the potential neurobiological significance ofthese metrics [14–16].
High test-retest reliability is a necessary requirement for developing a biomarker of func-tional connectomics for clinical application [17]. The existing rfMRI-derived metrics havedemonstrated moderate to high test-retest reliabilities and are widely used to study differentaspects of the human brain’s intrinsic functional architecture or functional connectomics[18], and systematically reviewed in [19]. Specifically, at local scales, the amplitude measuresexhibit moderate to substantial reliability [20] whereas the local functional homogeneitymetrics are highly reliable (substantial to almost perfect) [21]. At the scale of networks, com-mon intrinsic connectivity networks show relatively high reliability while the seed-basedmethods [22] are relatively less reliable than independent component analysis [23]. At scalesof the entire connectome, various centrality metrics exhibit only fair to moderate test-retestreliability [2], although this can be affected by sampling rates, preprocessing and computa-tional strategies [24–27]. Test-retest reliability of these metrics have been partly examined intypically [28, 29] or atypically developing children [29] as well as normal [30–32] and abnor-mal aging people [33].
Test-retest reliability is an integrative statistical measure of both intra-individual variability(intraVar) and inter-individual variability (interVar) [34, 35], composing so-called individualdifferences. Previous studies have presented significant individual differences in human brainintrinsic function at both the group and individual level [1, 15, 36–38], although most focusedon seed-based functional connectivity. The distribution of individual differences to within- andbetween-subject variability determines the degree of test-retest reliability of the functional mea-sures. However, very few studies have explored details of both intraVar and interVar of com-mon functional measurements due to lacking a richly-sampled datasets within and betweenindividuals. One representative work on interVar was recently conducted by Mueller and col-leagues [39], shedding light on the role of intrinsic functional connectivity in brain evolutionand development by relating individual differences to interVar of cortical morphology, ana-tomical distance and cognition. This dataset has been employed as normal reference in guidingindividual-level network parcellation of the human cortex [40]. Another seminal work investi-gated the spatial structure of intraVar of whole-brain intrinsic connectivity within one-hourrfMRI scans from 10 participants and concluded that this intraVar also reflected functionallyspecialized and flexible configuration across the human brain cerebral cortex [41]. A recentwork on the MyConnectome project [42] by Poldrack and colleagues has yielded the mostdetailed depiction of an individual brain’s function across one year (almost daily scanned) [43],together with the work from Choe and colleagues on rfMRI-derived networks of an individual
Individual Differences in Functional Connectomics
PLOS ONE | DOI:10.1371/journal.pone.0144963 December 29, 2015 2 / 21
X-NZ) of the Chinese Academy of Sciences, theNatural Science Foundation of China (31070905,31371134, 81171409 and 81471740) and theNational Social Science Foundation of China(11AZD119).
Competing Interests: The authors have declaredthat no competing interests exist.
across a period of 3.5 years (weekly scanned) [44], further highlighting the value of mappingintra-individual variability more accurately to probe the intrinsic function.
While the mapping of the individual differences are fundamentally important to understandhow the human brain organizes, changes dynamically, as well as how it is altered by diseaseconditions [45, 46], a comprehensive study of both intraVar and interVar of the rfMRI mea-sures in a single sample is still missing. The major challenge is to obtain a longitudinal datasetwith enough samples at both the group and individual levels. In the present research, wescanned 30 healthy adults using rfMRI with a one-month longitudinal experiment design. Thisallowed each participant to undergo an rfMRI scanning session every 2–3 days, resulting in tenrepeated measurements for each participant. This test-retest sample has been released (http://dx.doi.org/10.15387/fcp_indi.corr.hnu1) as part of the Consortium for Reliability and Repro-ducibility (CoRR) [47], which shares the data via the Neuroimaging Informatics Tools andResources Clearinghouse (NITRC). It is also available at FigShare (https://figshare.com/s/7dac285e153e176d90e8) with a digital object identifier (10.6084/m9.figshare.2007483). Usingthis dataset, we 1) implement surface-based computation of the common rfMRI metrics atscales of local areas, subnetwork/module and global connectome; 2) delineate both intraVarand interVar of the common rfMRI metrics at the three different spatial scales; 3) examinetest-retest reliability of these common brain connectomics metrics and generate their corticalsurfaces; 4) related these individual differences and the test-retest reliability to the brain net-works and the cognitive components in the intrinsic functional architecture.
Methods and Analysis
ParticipantsThirty participants aged 20 to 30 years old (15 females, mean age = 24, SD = 2.41) wererecruited and scanned ten times over approximately one month. None of participants had ahistory of neurological or psychiatric disorders, substance abuse, or head injury with loss ofconsciousness. The ethics committee of the Center for Cognition and Brain Disorders (CCBD)at Hangzhou Normal University approved this study. Written informed consent was obtainedfrom each participant prior to data collection.
MRI Data AcquisitionMRI Imaging sessions were performed using a GE MR750 3.0 Tesla scanner (GE Medical Sys-tems, Waukesha, WI) at CCBD, Hangzhou Normal University. Each participant underwentten imaging scans over one month with one scan every three days, during which two imagingsequences were completed to measure individual brain structure and function. Specifically, aT2-weighted echo-planar imaging (EPI: TR = 2000 ms, TE = 30 ms, flip angle = 90°, field ofview = 220 × 220 mm, matrix = 64 × 64, voxel size = 3.4 × 3.4 × 3.4 mm, 43 slices) sequencewas performed to obtain resting state fMRI images for 10 minutes. A T1-weighted Fast SpoiledGradient echo (FSPGR: TR = 8.1 ms, TE = 3.1 ms, TI = 450 ms, flip angle = 8°, field ofview = 256 × 256 mm, matrix = 256 × 256, voxel size = 1.0 × 1.0 × 1.0 mm, 176 sagittal slices)was carried out to acquire a high-resolution anatomical image of the brain structure. To mini-mize head movement, straps and foam pads were used to fix the head snugly during each scan.The participants were instructed to relax and remain still with their eyes open, not to fall asleep,and not to think about anything in particular. The screen presented a black fixation point ‘+’ inthe center of the gray background. After the scans, all the participants were interviewed, andnone of them reported to have fallen asleep in the scanner. The time of day of MRI acquisitionwas controlled within participants.
Individual Differences in Functional Connectomics
PLOS ONE | DOI:10.1371/journal.pone.0144963 December 29, 2015 3 / 21
MRI Data PreprocessingThe Connectome Computation System (CCS: https://github.com/zuoxinian/CCS) was devel-oped to provide a multimodal image analysis platform for the discovery science of humanbrain function by integrating three main MRI data processing packages [48–50] with ourMATLAB implementations of various computational modules for image quality control, sur-face-based rfMRI metrics, data mining algorithms, reliability and reproducibility assessmentsand visualization. The primary CCS pipeline consists of both anatomical and functional pro-cessing, which are documented in the CCS paper in details [51]. Here, we only provide an over-all description of these steps.
The CCS anatomical pipeline first removed noise from individual MR T1 images by adoptinga spatially adaptive non-local means filter [52, 53]. For each participant, regarding that the focusof the present analysis is changes of rfMRI metrics, we aligned and averaged the ten de-noised T1images to produce a robust, high-resolution anatomical image with high contrast between graymatter (GM) and white matter (WM) for generation of an individual cortical surface model asanatomical reference. Using this image, the skull was then stripped and manually edited for a bet-ter brain extraction, and the 3D extracted brain volume was segmented into different tissues suchas cerebrospinal fluid (CSF), WM, GM and further parcellation of the GM tissue. With suchinformation, individual pial (GM/CSF boundary) and white (GM/WM boundary) surfaces werereconstructed and spatially normalized to match a group-level standard template surface in theMontreal Neurological Institute (MNI) space via a sphere registration [49, 54, 55].
The subsequent CCS functional pipeline discarded the first 5 EPI volumes (10 seconds),removed and interpolated temporal spikes (see instructions in [56, 57] regarding in-scannerhead motion), corrected acquisition timing among image slices and head motion among imagevolumes and normalized the 4D global mean intensity to 10,000. White surfaces were thenemployed by a boundary-based registration (BBR) algorithm to match spatial correspondencesbetween individual functional images to anatomical images [58]. To further eliminate the effectof head motion and physiological noises during the rfMRI scanning session, we regressed outthe estimated Friston’s 24-parameter motion curves [37] and nuisance signals measured asWM and CSF mean time series [59] from individual rfMRI time series. Linear and quadratictrends were also regressed out from the rfMRI data by multiple linear regressions. Finally, thedata were projected onto the fsaverage surface grid (average inter-vertex distance = 1 mm) anddown-sampled to the fsaverge5 surface grid (average inter-vertex distance = 4 mm) for subse-quent rfMRI computation.
Participant-level rfMRI Metrics DerivationThe overall analytic strategy is presented in Fig 1. The above CCS pipeline preprocessed allindividual rfMRI images (Fig 1A) and projected individual rfMRI time series onto a uniformcortical surface grid (fsaverge5) based upon the brain tissue classification (Fig 1B and 1C). As aproof of concept, an individual-level functional connectome can be modeled as a graph or net-work with vertices as nodes and pair-nodes dependency as edges (Fig 1D). To achieve a system-atic and comprehensive characterization of the brain graph, we proposed a set of metrics atthree different scales from a single vertex to the whole cortex (Fig 1E). Given an arbitrary vertexvi(i = 1, � � �, V) on the surface where V is the number of all vertices of the fsaverge5 surface grid,its time series measured with rfMRI is vi(tj)(j = 1, � � �, T) where T is the number of time pointsof the rfMRI scan (assume an even number). All these metrics are summarized in this sectionwith computational details.
Scales of Local Area. To measure local-scale characteristics of the human brain function,two amplitude metrics were employed, namely, the amplitude of low frequency fluctuation
Individual Differences in Functional Connectomics
PLOS ONE | DOI:10.1371/journal.pone.0144963 December 29, 2015 4 / 21
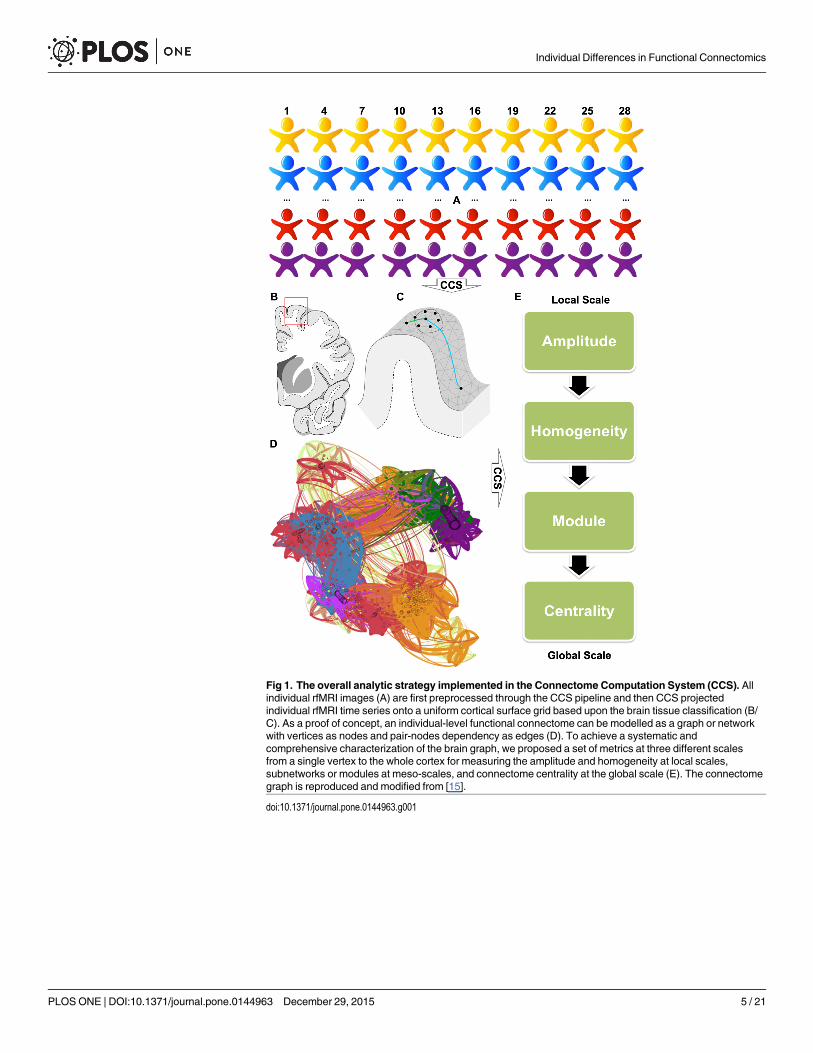
Fig 1. The overall analytic strategy implemented in the Connectome Computation System (CCS). Allindividual rfMRI images (A) are first preprocessed through the CCS pipeline and then CCS projectedindividual rfMRI time series onto a uniform cortical surface grid based upon the brain tissue classification (B/C). As a proof of concept, an individual-level functional connectome can be modelled as a graph or networkwith vertices as nodes and pair-nodes dependency as edges (D). To achieve a systematic andcomprehensive characterization of the brain graph, we proposed a set of metrics at three different scalesfrom a single vertex to the whole cortex for measuring the amplitude and homogeneity at local scales,subnetworks or modules at meso-scales, and connectome centrality at the global scale (E). The connectomegraph is reproduced and modified from [15].
doi:10.1371/journal.pone.0144963.g001
Individual Differences in Functional Connectomics
PLOS ONE | DOI:10.1371/journal.pone.0144963 December 29, 2015 5 / 21
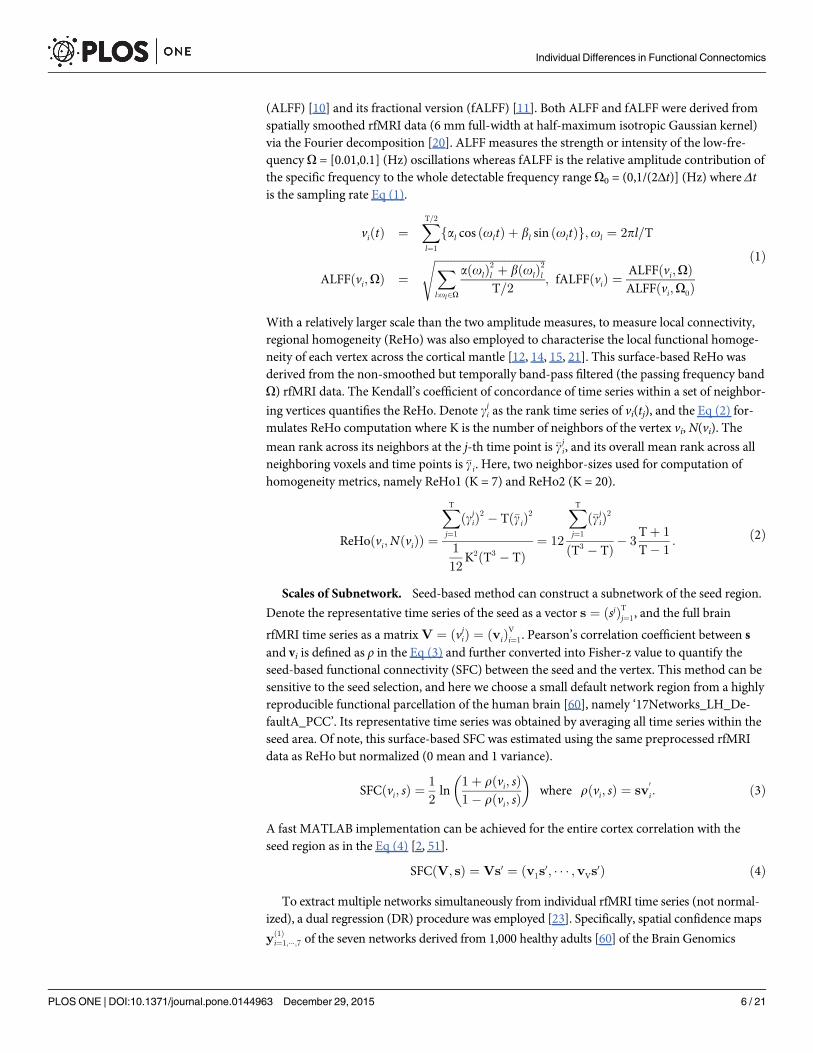
(ALFF) [10] and its fractional version (fALFF) [11]. Both ALFF and fALFF were derived fromspatially smoothed rfMRI data (6 mm full-width at half-maximum isotropic Gaussian kernel)via the Fourier decomposition [20]. ALFF measures the strength or intensity of the low-fre-quency O = [0.01,0.1] (Hz) oscillations whereas fALFF is the relative amplitude contribution ofthe specific frequency to the whole detectable frequency range O0 = (0,1/(2Δt)] (Hz) where Δtis the sampling rate Eq (1).
viðtÞ ¼XT=2l¼1
fal cos ðoltÞ þ bl sin ðoltÞg;ol ¼ 2pl=T
ALFFðvi;OÞ ¼ffiffiffiffiffiffiffiffiffiffiffiffiffiffiffiffiffiffiffiffiffiffiffiffiffiffiffiffiffiffiffiffiffiffiffiffiffiffiffiffiXl:ol2O
aðolÞ2l þ bðolÞ2lT=2
s; fALFFðviÞ ¼
ALFFðvi;OÞALFFðvi;O0Þ
ð1Þ
With a relatively larger scale than the two amplitude measures, to measure local connectivity,regional homogeneity (ReHo) was also employed to characterise the local functional homoge-neity of each vertex across the cortical mantle [12, 14, 15, 21]. This surface-based ReHo wasderived from the non-smoothed but temporally band-pass filtered (the passing frequency bandO) rfMRI data. The Kendall’s coefficient of concordance of time series within a set of neighbor-
ing vertices quantifies the ReHo. Denote gji as the rank time series of vi(tj), and the Eq (2) for-mulates ReHo computation where K is the number of neighbors of the vertex vi, N(vi). The
mean rank across its neighbors at the j-th time point is �g ji, and its overall mean rank across allneighboring voxels and time points is �g i. Here, two neighbor-sizes used for computation ofhomogeneity metrics, namely ReHo1 (K = 7) and ReHo2 (K = 20).
ReHoðvi;NðviÞÞ ¼
XTj¼1
ðgjiÞ2 � Tð�g iÞ2
1
12K2ðT3 � TÞ
¼ 12
XTj¼1
ð�g jiÞ2
ðT3 � TÞ � 3Tþ 1
T� 1: ð2Þ
Scales of Subnetwork. Seed-based method can construct a subnetwork of the seed region.
Denote the representative time series of the seed as a vector s ¼ ðsjÞTj¼1, and the full brain
rfMRI time series as a matrixV ¼ ðvjiÞ ¼ ðviÞVi¼1. Pearson’s correlation coefficient between sand vi is defined as ρ in the Eq (3) and further converted into Fisher-z value to quantify theseed-based functional connectivity (SFC) between the seed and the vertex. This method can besensitive to the seed selection, and here we choose a small default network region from a highlyreproducible functional parcellation of the human brain [60], namely ‘17Networks_LH_De-faultA_PCC’. Its representative time series was obtained by averaging all time series within theseed area. Of note, this surface-based SFC was estimated using the same preprocessed rfMRIdata as ReHo but normalized (0 mean and 1 variance).
SFCðvi; sÞ ¼1
2ln
1þ rðvi; sÞ1� rðvi; sÞ� �
where rðvi; sÞ ¼ sv0i: ð3Þ
A fast MATLAB implementation can be achieved for the entire cortex correlation with theseed region as in the Eq (4) [2, 51].
SFCðV; sÞ ¼ Vs0 ¼ ðv1s0; � � � ;vVs
0Þ ð4Þ
To extract multiple networks simultaneously from individual rfMRI time series (not normal-ized), a dual regression (DR) procedure was employed [23]. Specifically, spatial confidence maps
yð1Þi¼1;���;7 of the seven networks derived from 1,000 healthy adults [60] of the Brain Genomics
Individual Differences in Functional Connectomics
PLOS ONE | DOI:10.1371/journal.pone.0144963 December 29, 2015 6 / 21
Superstruct Project [61] were employed in the first regression on individual rfMRI images to con-
struct the characteristic time series xð1Þi¼1;���;7 of the seven networks at individual level in Eq (5).
These characteristic time series were further entered into the second regression on the individual
rfMRI time series to extract individual spatial maps of the seven networks yð2Þi¼1;���;7 in Eq (6).
DRð1ÞðV;yð1Þi¼1;���;7Þ : V0 ¼ ðyð1Þ
1 ; � � � ;yð1Þ7 Þðxð1Þ
1 ; � � � ;xð1Þ7 Þ0 þ Eð1Þ ð5Þ
DRð2ÞðV;xð1Þi¼1;���;7Þ : V ¼ ðxð1Þ
1 ; � � � ;xð1Þ7 Þðyð2Þ
1 ; � � � ;yð2Þ7 Þ0 þEð2Þ ð6Þ
Scales of Global Connectome. At this scale, an individual functional connectome wasreconstructed by computing the full cortical correlation matrix V V0. This surface-based com-putation constructed weighted graphs for individual brains by quantifying the inter-vertex con-nection as the Pearson’s correlation between their preprocessed rfMRI signals (not smoothedbut temporally band-pass filtered) [2]. All these cortical graphs were set to have the same edgedensity (0.05) to make them comparable across participants and time. Denote the adjacencymatrix as in Eq (7).
A ¼ ðaijÞ ¼1
2ln
1þ rðvi; vjÞ1� rðvi; vjÞ
!; i; j ¼ 1; � � � ;V ð7Þ
We applied degree centrality (DCw)[2, 62] and eigenvector centrality (ECw) [2, 63, 64] tocapture the feature of the information processing in the weighted functional connectomes.DCw is the degree of the functional connectivity by measuring the sum of weighted connec-tions for each node vertex Eq (8). ECw is the eigenvector corresponding to the maximal eigen-value λ1 of the adjacency matrix Eq (8) and captures an aspect of centrality that extends toglobal features of the weighted brain graph.
DCwðviÞ ¼XVj¼1
aij; ECwðviÞ ¼1
l1
XVj¼1
aijECwðvjÞ ð8Þ
Group-level Statistical AssessmentsTo examine the dynamic changes of human brain function for individual subjects and amongdifferent subjects over one month, we applied the Linear Mixed Effects (LME) models to 300samples of each functional metric. We also included various potential confounding factors inLMMs such as the age, sex, mean frame-wise displacement (meanFD) of head motion, andBBR minimum cost (mcBBR) at the participant-level.
At the whole-brain level, for each specific functional metric M 2 {ALFF, fALFF, ReHo1,ReHo2, SFC, DR, DCw, ECw}, we employed the model as in Eq (9) to estimate both intraVarand interVar. We denote gMij as the global mean metric of the i-th measurement of the j-thparticipant (for i = 1� � �10 and j = 1� � �30).
gMij ¼ m00 þ g0j þ agej þ sexj þmotionij þ �ij ð9Þ
Interplays between each pair of the DR-derived networks were estimated as the temporalcorrelation between each pair of their characteristic time series. This interplay correlationalmatrix was converted to Fisher’s z-values. An LME model Eq (9) was then applied to each ofthe interplay metric for estimation of their variance components.
At the vertex-level, Eq (9) was further refined by including the global mean metric as acovariate to assess the network-specific variability of the metric within and between subjects.
Individual Differences in Functional Connectomics
PLOS ONE | DOI:10.1371/journal.pone.0144963 December 29, 2015 7 / 21
Such a strategy of post-hoc standardization in functional connectomics has been proposedrecently and is more efficient and reliable to detect individual differences [38]. Specifically, theregression model, as shown in Eq (10), was applied to each vertex on the fsaverage5 surface andyielded vertex-wise statistical assessments. To account for heterogeneous changes in regionalvolume, the amount of regional volume change required to warp a subject into the standardsurface, fsaverage, is measured using the vertex-wise covariate derived from the Jacobian deter-minant of the spherical transform in FreeSurfer.
MijðvÞ ¼ m00ðvÞ þ gMij þ g0jðvÞ þ agej þ sexj
þmotionij þmcBBRij þ JacobianjðvÞ þ �ijðvÞð10Þ
LME models (9) and (10) contain parameters of both fixed and random effects, and the ran-dom error term. The basic assumption of an LME is that the observed variable and error termare normally distributed with mean 0 and variances. Here, the variance s2
b is the inter-individ-ual or between-subject variance (interVar); in other words, the variation between participantswhile s2
w is the intra-individual or within-subject variance representing the variation withinsingle subjects across one month (intraVar). In order to evaluate the test-retest reliability of thefunctional metrics, the intra-class correlation (ICC) was calculated by according to its defini-tion as ICC ¼ s2
w=ðs2b þ s2
wÞ. All the estimation of the variances was implemented by CCS. Toavoid negative estimation of the ICC, the variance components in the LMMs were estimatedwith the restricted maximum likelihood (ReML) approach with the covariance structure ofcompound symmetrical matrix. From this reliability definition, it is clear that the test-retestreliability integrates both intra-individual and inter-individual variability. Low intra-individualvariability or high inter-individual variability will lead to high test-retest reliability. The reli-ability bounds the validity of various metrics used in clinical diagnoses and thus becomes anessential requirement on developing a biomarker in applications [17].
ResultsOur analyses produced a set of maps of the individual differences in intrinsic functional archi-tecture by delineating intra-individual, inter-individual variability and test-retest reliabilityacross multiple metrics and multiple spatial scales of the human connectome. Specifically, wecomputed eight different functional metrics to characterize the human brain connectome atlocal, meso and global scales: ALFF, fALFF, ReHo1, ReHo2, SFC, DR, DCw and ECw to cap-ture the feature of the information processing in the weighted functional connectomes [2]. Ver-tex-wise maps of the individual variability and test-retest reliability depicted high-resolutiondistributions of variability and stability of these functional connectomics. In reporting thesefindings, we categorized the ICC into five common intervals [65]: 0< ICC� 0.2 (slight); 0.2<ICC� 0.4 (fair); 0.4< ICC� 0.6 (moderate); 0.6< ICC� 0.8 (substantial); and 0.8<ICC� 1.0 (almost perfect). Global mean measures of all these metrics (for DR, no global meancalculated regarding its methodological consideration) only exhibited fair to moderate test-retest reliability (Fig 2C), indicating their dynamic nature within subjects (Fig 2A) or limitedbetween-subject variability (Fig 2B).
To summarize these findings at multiple scales, together with presentation of these vertex-wise maps, we documented our results in following subsections for the individual differencesaccording their distributions across the common brain networks and cognitive components.The seven large-scale networks derived from 1,000 healthy resting-state brains [60] are ren-dered in Fig 3: visual (Visual), somatomotor (SomMot), dorsal attention (DorsAttn), ventralattention (VentAttn), limbic (Limbic), frontoparietal control (Control), default (Default) net-work, and a cognitive ontology of the brain derived from a large data set of neuroimaging
Individual Differences in Functional Connectomics
PLOS ONE | DOI:10.1371/journal.pone.0144963 December 29, 2015 8 / 21
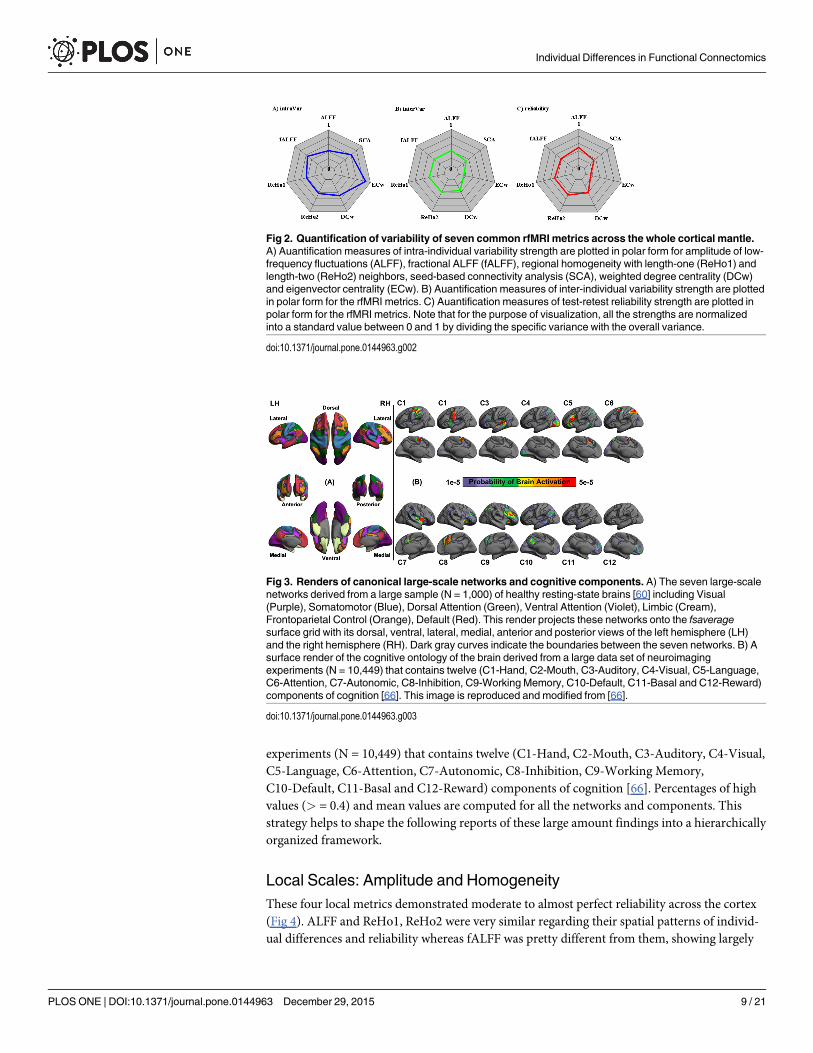
experiments (N = 10,449) that contains twelve (C1-Hand, C2-Mouth, C3-Auditory, C4-Visual,C5-Language, C6-Attention, C7-Autonomic, C8-Inhibition, C9-Working Memory,C10-Default, C11-Basal and C12-Reward) components of cognition [66]. Percentages of highvalues (> = 0.4) and mean values are computed for all the networks and components. Thisstrategy helps to shape the following reports of these large amount findings into a hierarchicallyorganized framework.
Local Scales: Amplitude and HomogeneityThese four local metrics demonstrated moderate to almost perfect reliability across the cortex(Fig 4). ALFF and ReHo1, ReHo2 were very similar regarding their spatial patterns of individ-ual differences and reliability whereas fALFF was pretty different from them, showing largely
Fig 2. Quantification of variability of seven common rfMRI metrics across the whole cortical mantle.A) Auantification measures of intra-individual variability strength are plotted in polar form for amplitude of low-frequency fluctuations (ALFF), fractional ALFF (fALFF), regional homogeneity with length-one (ReHo1) andlength-two (ReHo2) neighbors, seed-based connectivity analysis (SCA), weighted degree centrality (DCw)and eigenvector centrality (ECw). B) Auantification measures of inter-individual variability strength are plottedin polar form for the rfMRI metrics. C) Auantification measures of test-retest reliability strength are plotted inpolar form for the rfMRI metrics. Note that for the purpose of visualization, all the strengths are normalizedinto a standard value between 0 and 1 by dividing the specific variance with the overall variance.
doi:10.1371/journal.pone.0144963.g002
Fig 3. Renders of canonical large-scale networks and cognitive components. A) The seven large-scalenetworks derived from a large sample (N = 1,000) of healthy resting-state brains [60] including Visual(Purple), Somatomotor (Blue), Dorsal Attention (Green), Ventral Attention (Violet), Limbic (Cream),Frontoparietal Control (Orange), Default (Red). This render projects these networks onto the fsaveragesurface grid with its dorsal, ventral, lateral, medial, anterior and posterior views of the left hemisphere (LH)and the right hemisphere (RH). Dark gray curves indicate the boundaries between the seven networks. B) Asurface render of the cognitive ontology of the brain derived from a large data set of neuroimagingexperiments (N = 10,449) that contains twelve (C1-Hand, C2-Mouth, C3-Auditory, C4-Visual, C5-Language,C6-Attention, C7-Autonomic, C8-Inhibition, C9-Working Memory, C10-Default, C11-Basal and C12-Reward)components of cognition [66]. This image is reproduced and modified from [66].
doi:10.1371/journal.pone.0144963.g003
Individual Differences in Functional Connectomics
PLOS ONE | DOI:10.1371/journal.pone.0144963 December 29, 2015 9 / 21
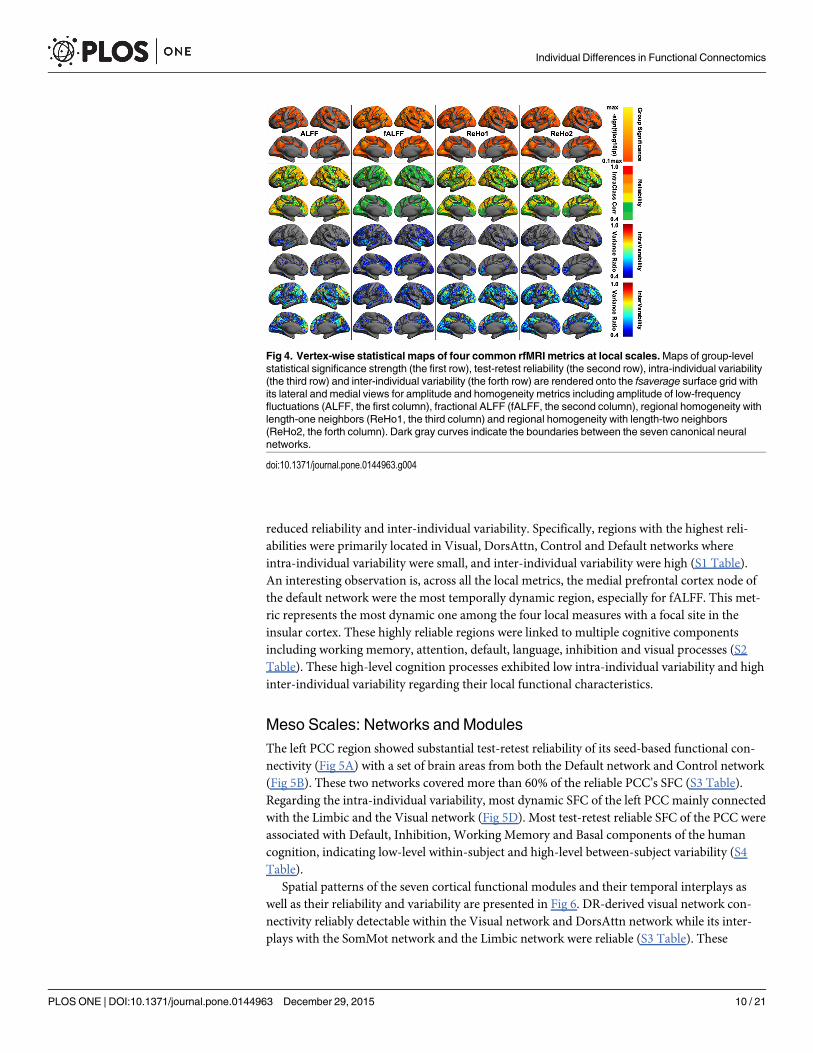
reduced reliability and inter-individual variability. Specifically, regions with the highest reli-abilities were primarily located in Visual, DorsAttn, Control and Default networks whereintra-individual variability were small, and inter-individual variability were high (S1 Table).An interesting observation is, across all the local metrics, the medial prefrontal cortex node ofthe default network were the most temporally dynamic region, especially for fALFF. This met-ric represents the most dynamic one among the four local measures with a focal site in theinsular cortex. These highly reliable regions were linked to multiple cognitive componentsincluding working memory, attention, default, language, inhibition and visual processes (S2Table). These high-level cognition processes exhibited low intra-individual variability and highinter-individual variability regarding their local functional characteristics.
Meso Scales: Networks and ModulesThe left PCC region showed substantial test-retest reliability of its seed-based functional con-nectivity (Fig 5A) with a set of brain areas from both the Default network and Control network(Fig 5B). These two networks covered more than 60% of the reliable PCC’s SFC (S3 Table).Regarding the intra-individual variability, most dynamic SFC of the left PCC mainly connectedwith the Limbic and the Visual network (Fig 5D). Most test-retest reliable SFC of the PCC wereassociated with Default, Inhibition, Working Memory and Basal components of the humancognition, indicating low-level within-subject and high-level between-subject variability (S4Table).
Spatial patterns of the seven cortical functional modules and their temporal interplays aswell as their reliability and variability are presented in Fig 6. DR-derived visual network con-nectivity reliably detectable within the Visual network and DorsAttn network while its inter-plays with the SomMot network and the Limbic network were reliable (S3 Table). These
Fig 4. Vertex-wise statistical maps of four common rfMRI metrics at local scales.Maps of group-levelstatistical significance strength (the first row), test-retest reliability (the second row), intra-individual variability(the third row) and inter-individual variability (the forth row) are rendered onto the fsaverage surface grid withits lateral and medial views for amplitude and homogeneity metrics including amplitude of low-frequencyfluctuations (ALFF, the first column), fractional ALFF (fALFF, the second column), regional homogeneity withlength-one neighbors (ReHo1, the third column) and regional homogeneity with length-two neighbors(ReHo2, the forth column). Dark gray curves indicate the boundaries between the seven canonical neuralnetworks.
doi:10.1371/journal.pone.0144963.g004
Individual Differences in Functional Connectomics
PLOS ONE | DOI:10.1371/journal.pone.0144963 December 29, 2015 10 / 21
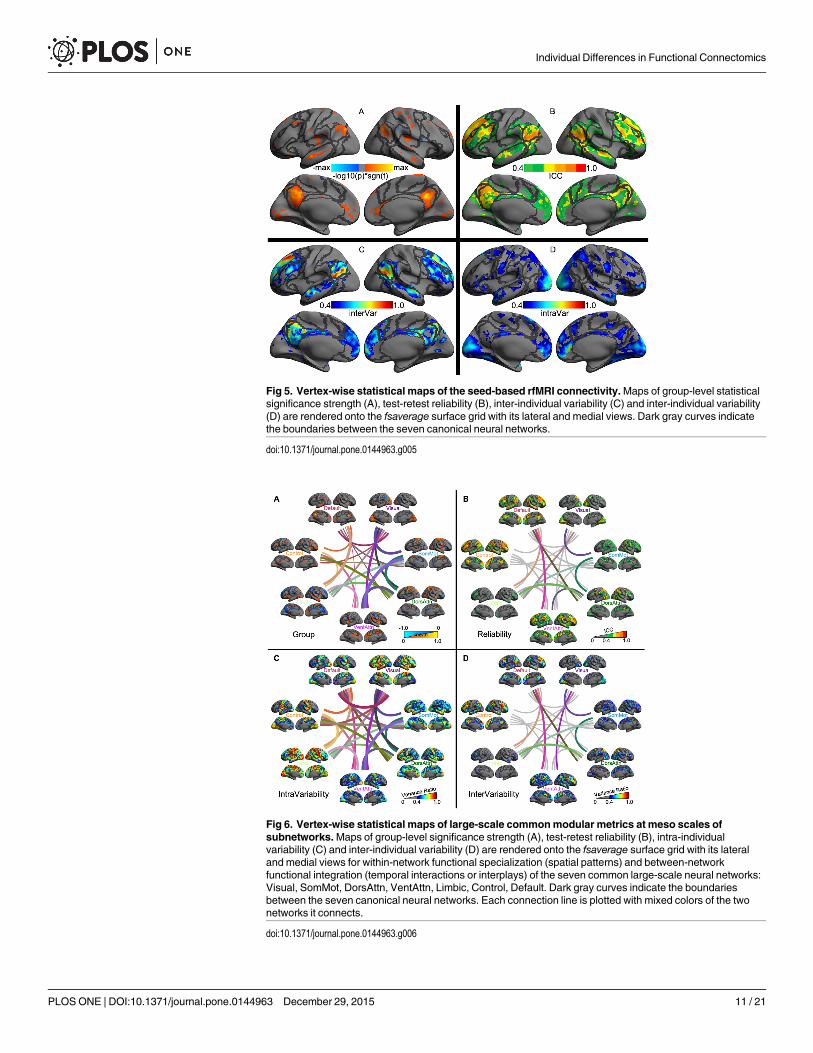
Fig 5. Vertex-wise statistical maps of the seed-based rfMRI connectivity.Maps of group-level statisticalsignificance strength (A), test-retest reliability (B), inter-individual variability (C) and inter-individual variability(D) are rendered onto the fsaverage surface grid with its lateral and medial views. Dark gray curves indicatethe boundaries between the seven canonical neural networks.
doi:10.1371/journal.pone.0144963.g005
Fig 6. Vertex-wise statistical maps of large-scale commonmodular metrics at meso scales ofsubnetworks.Maps of group-level significance strength (A), test-retest reliability (B), intra-individualvariability (C) and inter-individual variability (D) are rendered onto the fsaverage surface grid with its lateraland medial views for within-network functional specialization (spatial patterns) and between-networkfunctional integration (temporal interactions or interplays) of the seven common large-scale neural networks:Visual, SomMot, DorsAttn, VentAttn, Limbic, Control, Default. Dark gray curves indicate the boundariesbetween the seven canonical neural networks. Each connection line is plotted with mixed colors of the twonetworks it connects.
doi:10.1371/journal.pone.0144963.g006
Individual Differences in Functional Connectomics
PLOS ONE | DOI:10.1371/journal.pone.0144963 December 29, 2015 11 / 21
functional connectivity spatially distributed to Visual and Attention cognitive components (S4Table). The reliable SomMot network connectivity existed within itself and the two attention(DorsAttn and VentAttn) networks, and were involved in Hand and Mouth cognitive process.Beyond with the Visual network, its interplays with both the DorsAttn and the Limbic net-works were reliable. DR-derived connectivity of the Limbic network were not reliable in generalwhile it had reliable interplays with other networks including Visual, SomMot, DorsAttn, Ven-tAttn and Default networks. No cognitive component contained test-retest reliable DR-derivedLimbic connectivity.
DR-derived connectivity of the DorsAttn network were reliably presented with itself andthe Control network while its temporal interactions with the VentAttn, Default, SomMot andLimbic networks were reliable. Regarding the related cognition processes, these DR-derivedconnectivity profiles were linked to Attention, Working Memory and Visual components (S4Table). The within-network DR connectivity of the VentAttn network and its connectivitywith Control, DorsAttn, Default and SomMot networks were test-retest reliable. Dynamicinteractions between the VentAttn network and Default, Limbic and DorsAttn networks werealso reliably observed. Interestingly, this salience-related network showed reliable connectivityacross all the 12 cognitive components, among which Inhibition, Working Memory and Atten-tion were the highest three. Beyond within-network connectivity, the Control network exhib-ited highly reliable connectivity with the two attention and default networks while no reliablebetween-network interplays were observed for such a highly flexible network. Working Mem-ory, Inhibition, Language and Attention components all had reliable connectivity with this net-work. Finally, the Default network DR connectivity were reliably distributed within Default,Control and Attention networks whereas its interplays with the two attention networks and theLimbic network were also test-retest reliable. This kind of reliable connectivity were reflectedin cognitive components of Working Memory, Inhibition, Default, Language, Basal andAuditory.
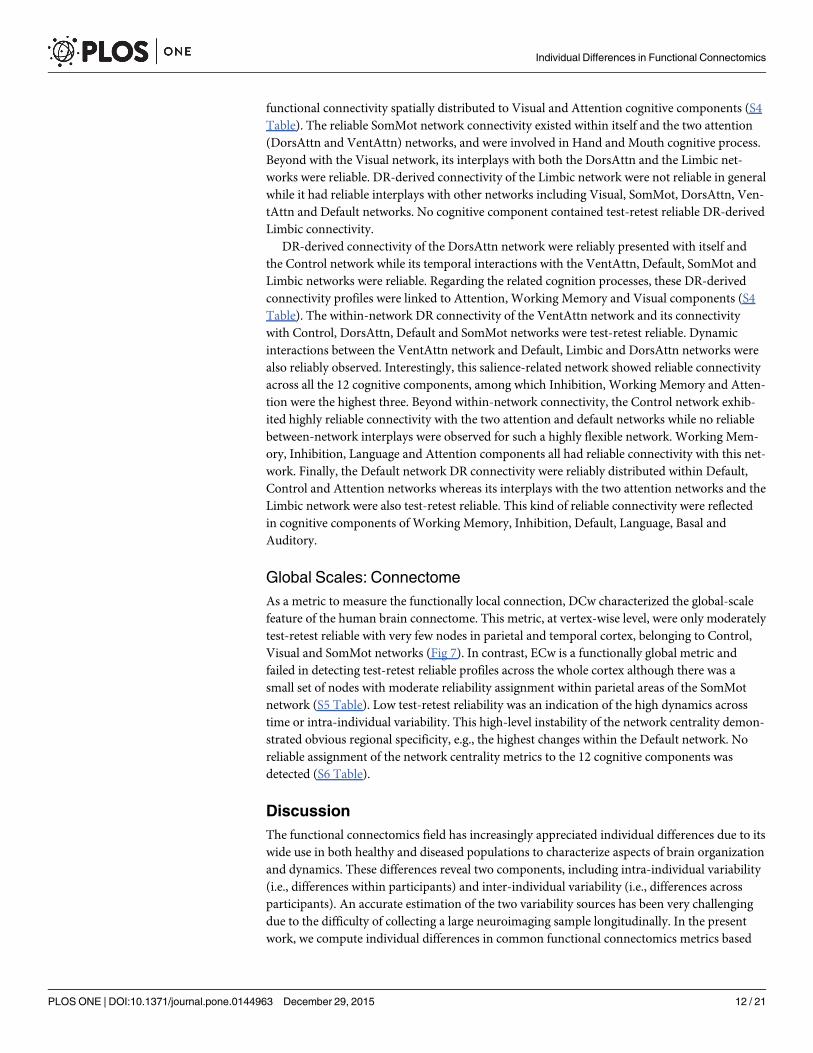
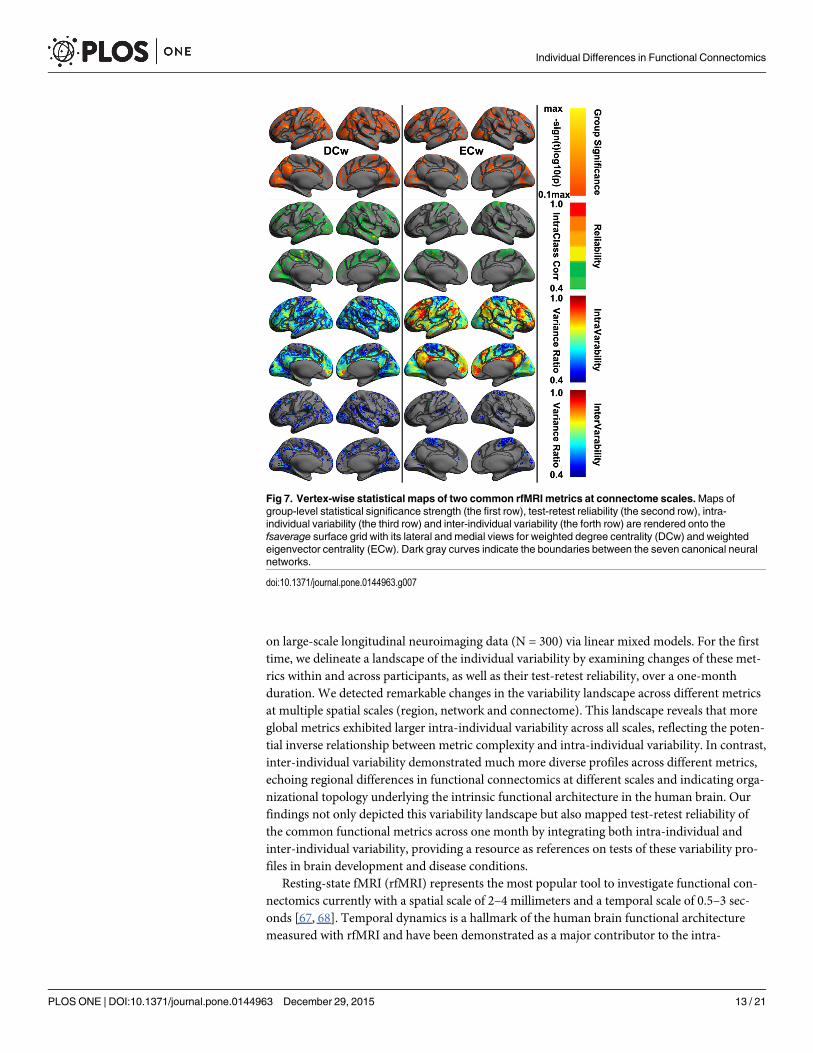
Global Scales: ConnectomeAs a metric to measure the functionally local connection, DCw characterized the global-scalefeature of the human brain connectome. This metric, at vertex-wise level, were only moderatelytest-retest reliable with very few nodes in parietal and temporal cortex, belonging to Control,Visual and SomMot networks (Fig 7). In contrast, ECw is a functionally global metric andfailed in detecting test-retest reliable profiles across the whole cortex although there was asmall set of nodes with moderate reliability assignment within parietal areas of the SomMotnetwork (S5 Table). Low test-retest reliability was an indication of the high dynamics acrosstime or intra-individual variability. This high-level instability of the network centrality demon-strated obvious regional specificity, e.g., the highest changes within the Default network. Noreliable assignment of the network centrality metrics to the 12 cognitive components wasdetected (S6 Table).
DiscussionThe functional connectomics field has increasingly appreciated individual differences due to itswide use in both healthy and diseased populations to characterize aspects of brain organizationand dynamics. These differences reveal two components, including intra-individual variability(i.e., differences within participants) and inter-individual variability (i.e., differences acrossparticipants). An accurate estimation of the two variability sources has been very challengingdue to the difficulty of collecting a large neuroimaging sample longitudinally. In the presentwork, we compute individual differences in common functional connectomics metrics based
Individual Differences in Functional Connectomics
PLOS ONE | DOI:10.1371/journal.pone.0144963 December 29, 2015 12 / 21
on large-scale longitudinal neuroimaging data (N = 300) via linear mixed models. For the firsttime, we delineate a landscape of the individual variability by examining changes of these met-rics within and across participants, as well as their test-retest reliability, over a one-monthduration. We detected remarkable changes in the variability landscape across different metricsat multiple spatial scales (region, network and connectome). This landscape reveals that moreglobal metrics exhibited larger intra-individual variability across all scales, reflecting the poten-tial inverse relationship between metric complexity and intra-individual variability. In contrast,inter-individual variability demonstrated much more diverse profiles across different metrics,echoing regional differences in functional connectomics at different scales and indicating orga-nizational topology underlying the intrinsic functional architecture in the human brain. Ourfindings not only depicted this variability landscape but also mapped test-retest reliability ofthe common functional metrics across one month by integrating both intra-individual andinter-individual variability, providing a resource as references on tests of these variability pro-files in brain development and disease conditions.
Resting-state fMRI (rfMRI) represents the most popular tool to investigate functional con-nectomics currently with a spatial scale of 2–4 millimeters and a temporal scale of 0.5–3 sec-onds [67, 68]. Temporal dynamics is a hallmark of the human brain functional architecturemeasured with rfMRI and have been demonstrated as a major contributor to the intra-
Fig 7. Vertex-wise statistical maps of two common rfMRI metrics at connectome scales.Maps ofgroup-level statistical significance strength (the first row), test-retest reliability (the second row), intra-individual variability (the third row) and inter-individual variability (the forth row) are rendered onto thefsaverage surface grid with its lateral and medial views for weighted degree centrality (DCw) and weightedeigenvector centrality (ECw). Dark gray curves indicate the boundaries between the seven canonical neuralnetworks.
doi:10.1371/journal.pone.0144963.g007
Individual Differences in Functional Connectomics
PLOS ONE | DOI:10.1371/journal.pone.0144963 December 29, 2015 13 / 21
individual variability across different temporal scales [69–71]. Previous studies have demon-strated that these intra-individual differences could be primarily dominated by the non-sta-tionary components in the rfMRI signals [72]. The time-varying degrees of functionalconnectivity were commonly thought of as a reflection of flexibility in the functional coordina-tion between different neural systems [45, 73, 74]. Specifically, at the scale of minutes, highintra-individual variability was mainly presented in homotopic functional connectivity as wellas non-homotopic between-network connectivity [41]. However, the spatial distribution of themost variable functional connectivity has been a controversy [45, 75, 76]. Our results provideevidence that local features or short-range metrics were more temporally stable than remotefeatures or long-range metrics at scales of days. These parallel to those recent observations atscales of years (development or aging) [77, 78].
Regarding spatial locations, the somatomotor network was the most temporally stable net-work, and this observation echoed the low intra-individual variability of sensory motor-relatedcognitive components including hand, mouth and auditory. The limbic network seemed to bemost dynamic over the one month, although this might be an indication of the low signal-to-noise ratio during the rfMRI scan within this network. Beyond the two networks, the defaultnetwork and dorsal attention network were also highly variable over a single month. Thesefindings enriched previous observations of the dynamic functional connectivity at single scalesby providing a full picture of its multi-scale spatial distribution (whole brain, networks andvoxels). One significant and novel addition from the present work to the existing literature isthe one-month temporal stability of 12 components of human cognition. Notably, workingmemory, inhibition, attention, language and visual process are the five most variable cognitivecomponents in terms of their changes of the rfMRI metrics across different scales, whereashand, auditory, mouth, autonomic, reward, basal and default components remain relativelystable over one month. Mapping intra-individual variability of various functional metricsderived from rfMRI voxel-wise further offered a high-resolution landscape of temporal dynam-ics in functional connectomes. This presents a resource for understanding how individual sta-ble structural connectomes generate their vast functional repertoire [79, 80] and relateddynamics [81–83] in enabling action, perception and cognition [73], as well as their alterations,under disease conditions [84].
Driving forces behind the inter-individual variability of brain structure and function arerelated to both genetic and environmental factors [85]. Such variability of the high-order asso-ciation cortex is less influenced by genetic factors with their neuroanatomical properties duringdevelopment, preserving room for environmental factors to exert impacts on the functionalvariability [86]. With rfMRI, recent studies have increasingly shown inter-individual variabilityin functional connectivity. One consistent finding is that the variability in the heteromodalassociation cortex was significantly higher than that in unimodal cortex [39, 87]. Inter-individ-ual variability in connectivity was significantly correlated with the degree of evolutionary corti-cal expansion [39]. Of note, all previous studies employed seed-based correlation orindependent component analysis methods to examine connectivity profiles [88], leaving a lackof inter-individual variability in other functional metrics across the cerebral cortex. Our find-ings filled this void by assessing the inter-individual variability of six other functional metrics.Specifically, at the global brain level, two network centrality metrics are less variable whereasfour other local metrics are relatively more variable across participants. The dorsal attentionnetwork, ventral attention network and somatomotor network are more stable across partici-pants whereas the limbic network, default network, frontoparietal control network and visualnetwork demonstrate high inter-individual variability of these functional metrics. Intriguingly,hand, auditory, language, mouth, attention and autonomic components showed small inter-individual variability. In contrast, visual, inhibition, default, basal and reward cognitive
Individual Differences in Functional Connectomics
PLOS ONE | DOI:10.1371/journal.pone.0144963 December 29, 2015 14 / 21
components are more variable across participants. Together with vertex-wise high-resolutionmaps of this variability, the present work delineates a more completed picture of inter-individ-ual variability in functional connectomes, indicating the complexity of different aspects ofinformation processing through connectomes and their individual differences reflected in thehuman brain intrinsic architecture [1, 89].
By employing a set of canonical templates of the large-scale cortical functional networks [60],the dual regression method offers us the opportunity of examining the brain dynamics in func-tional connectomics across the one month. This depicts a relatively full picture of the functionalconnectome regarding its temporal variability and individual differences. One interesting obser-vation is that long-distance functional connectivity between networks or interplays/integrationsseemmore temporally dynamic than their changes across subjects (Fig 6C). In contrast, short-distance connectivity within the networks or functional specialization remained temporally stablethan their between-subject variability (Fig 6D). These findings are consistent with the previousreports at scales of years (brain development and aging across the lifespan) [90–96], whichrecently have been linked to lifespan changes of behaviors across individuals [97].
Intra-individual and inter-individual variability are two important contributing factors tothe reliability of metrics in functional connectomics. Applications, especially in clinical diagno-sis, favor metrics with high test-retest reliability, which optimizes a trade-off between the twovariability components with low intra-individual variability (more stable across different mea-suring occasions) and high inter-individual variability (more differentiable across participants),and serves as a necessary condition for high validity of a biomarker [17]. Previous studies havedemonstrated moderate to high test-retest reliability of common functional connectome met-rics [19], although the sample sizes in these test-retest studies were limited. A recent Consor-tium for Reliability and Reproducibility (CoRR) released more than 5,000 test-retest multi-modal imaging datasets to the connectomics field [47], providing an open resource for large-scale test-retest reliability exploration in functional connectomics. The present datasets arepart of the CoRR datasets. All the preprocessed data and CCS scripts in the present work willbe made public to the field soon after the final acceptance of the current work via a data-shar-ing platform in the Institute of Psychology, Chinese Academy of Sciences. These findings rep-resent the first collection of test-retest reliability for multi-scale and multi-metriccharacterization of functional human connectomes. As demonstrated in a recent study on reli-ability-based correction for functional connectivity [98], these test-retest reliability maps gen-erated by the current work can serve as the essential resources for attenuation correction forfunctional connectomics (i.e., these rfMRI-based metrics) [19] and thus are crucial for the fieldto guide the use and correction of common functional metrics, as well as their explanation, inapplications.
Regional differences in signal-to-noise ratio [60, 61] have been reported, and their influ-ences on test-retest reliability need further investigation in future. Methodological issues suchas smoothing, filtering and global signal regression could disturb individual variability [99,100]. Although these confounding variables have been handled to some degree here, moreaccurate and sophisticated solutions should be developed in future studies [15, 19, 51]. Basedupon a more richly-sampled test-retest samples, the current work provided consistent resultswith those derived from our recent meta-summary on previous test-retest studies [19].Although small potential differences existed between the two studies, generally speaking, wewould recommend the readers to use them as two complementary references for guiding theuse of rfMRI-derived metrics for human brain functional connectomics in application. One bigimprovement we made in the present work is to compute all the metrics on the cortical surfacesand thus leads to increases of the reliability of some metrics (e.g., seed-based functional con-nectivity [22]).
Individual Differences in Functional Connectomics
PLOS ONE | DOI:10.1371/journal.pone.0144963 December 29, 2015 15 / 21
Supporting InformationS1 Table. Network summary on individual differences and test-retest reliability of commonrfMRI metrics at local scales.(PDF)
S2 Table. Cognition summary on individual differences and test-retest reliability of com-mon rfMRI metrics at local scales.(PDF)
S3 Table. Network summary on individual differences and test-retest reliability of commonrfMRI metrics at meso scales.(PDF)
S4 Table. Cognition summary on individual differences and test-retest reliability of com-mon rfMRI metrics at meso scales.(PDF)
S5 Table. Network summary on individual differences and test-retest reliability of commonrfMRI metrics at global scales.(PDF)
S6 Table. Cognition summary on individual differences and test-retest reliability of com-mon rfMRI metrics at global scales.(PDF)
AcknowledgmentsThis work was partially supported by the National Key Basic Research and Development (973)Program (2015CB351702, X-NZ), the Major Joint Fund for International Cooperation andExchange of the National Natural Science Foundation (81220108014, X-NZ), the HundredTalents Program and the Key Research Program (KSZD-EW-TZ-002, X-NZ) of the ChineseAcademy of Sciences, the Natural Science Foundation of China (31070905, 31371134,81171409 and 81471740) and the National Social Science Foundation of China (11AZD119).The computations were performed on the Dell Blade Cluster System at the Institute of Psychol-ogy, Chinese Academy of Sciences. We thank Dr. B.T. Thomas Yeo for discussions about theuse of the cognitive ontology and Dr. Richard F. Betzel for proof-reading of the final version ofthe manuscript.
Author ContributionsConceived and designed the experiments: XNZ XW. Performed the experiments: BC. Analyzedthe data: BC TX XNZ. Contributed reagents/materials/analysis tools: BC TX NY HMD ZYXNZ. Wrote the paper: BC TX CZ LW ZWNY HMD ZY YFZ XNZ XW.
References1. Biswal BB, Mennes M, Zuo XN, Gohel S, Kelly C, Smith SM, et al. Toward discovery science of
human brain function. Proc Natl Acad Sci U S A. 2010; 107(10):4734–9. doi: 10.1073/pnas.0911855107 PMID: 20176931
2. Zuo XN, Ehmke R, Mennes M, Imperati D, Castellanos FX, Sporns O, et al. Network centrality in thehuman functional connectome. Cereb Cortex. 2012; 22(8):1862–75. doi: 10.1093/cercor/bhr269PMID: 21968567
Individual Differences in Functional Connectomics
PLOS ONE | DOI:10.1371/journal.pone.0144963 December 29, 2015 16 / 21
3. Smith SM, Vidaurre D, Beckmann CF, Glasser MF, Jenkinson M, Miller KL, et al. Functional connec-tomics from resting-state fMRI. Trends Cogn Sci. 2013; 17(12):666–82. doi: 10.1016/j.tics.2013.09.016 PMID: 24238796
4. Buckner RL, Krienen FM, Yeo BT. Opportunities and limitations of intrinsic functional connectivityMRI. Nat Neurosci. 2013; 16(7):832–7. doi: 10.1038/nn.3423 PMID: 23799476
5. Zhang D, Raichle ME. Disease and the brain’s dark energy. Nat Rev Neurol. 2010; 6(1):15–28. doi:10.1038/nrneurol.2009.198 PMID: 20057496
6. Di Martino A, Yan CG, Li Q, Denio E, Castellanos FX, Alaerts K, et al. The autism brain imaging dataexchange: towards a large-scale evaluation of the intrinsic brain architecture in autism. Mol Psychia-try. 2014; 19(6):659–67. doi: 10.1038/mp.2013.78 PMID: 23774715
7. Biswal B, Yetkin FZ, Haughton VM, Hyde JS. Functional connectivity in the motor cortex of restinghuman brain using echo-planar MRI. Magn Reson Med. 1995; 34(4):537–41. doi: 10.1002/mrm.1910340409 PMID: 8524021
8. Greicius MD, Krasnow B, Reiss AL, Menon V. Functional connectivity in the resting brain: a networkanalysis of the default mode hypothesis. Proc Natl Acad Sci U S A. 2003; 100(1):253–8. doi: 10.1073/pnas.0135058100 PMID: 12506194
9. Murphy K, Birn RM, Bandettini PA. Resting-state fMRI confounds and cleanup. Neuroimage. 2013;80:349–59. doi: 10.1016/j.neuroimage.2013.04.001 PMID: 23571418
10. Zang YF, He Y, Zhu CZ, Cao QJ, Sui MQ, Liang M, et al. Altered baseline brain activity in children withADHD revealed by resting-state functional MRI. Brain Dev. 2007; 29(2):83–91. doi: 10.1016/j.braindev.2006.07.002 PMID: 16919409
11. Zou QH, Zhu CZ, Yang Y, Zuo XN, Long XY, Cao QJ, et al. An improved approach to detection ofamplitude of low-frequency fluctuation (ALFF) for resting-state fMRI: fractional ALFF. J NeurosciMethods. 2008; 172(1):137–41. doi: 10.1016/j.jneumeth.2008.04.012 PMID: 18501969
12. Zang Y, Jiang T, Lu Y, He Y, Tian L. Regional homogeneity approach to fMRI data analysis. Neuro-image. 2004; 22(1):394–400. doi: 10.1016/j.neuroimage.2003.12.030 PMID: 15110032
13. He Y, Wang J, Wang L, Chen ZJ, Yan C, Yang H, et al. Uncovering intrinsic modular organization ofspontaneous brain activity in humans. PLoS One. 2009; 4(4):e5226. doi: 10.1371/journal.pone.0005226 PMID: 19381298
14. Jiang L, Xu T, He Y, Hou XH, Wang J, Cao XY, et al. Functional homogeneity in the human cortex:Regional variation, morphological association and functional covariance network. Brain Struct Funct.2015; 220(5):2485–507. doi: 10.1007/s00429-014-0795-8 PMID: 24903825
15. Jiang L, Zuo XN. Regional homogeneity: A multi-modal, multi-scale neuroimaging marker of thehuman brain connectome. Neuroscentist. 2015; Epub ahead of print: In press.
16. Anderson JS, Zielinski BA, Nielsen JA, Ferguson MA. Complexity of low-frequency blood oxygenlevel-dependent fluctuations covaries with local connectivity. Hum Brain Mapp. 2014; 35(4):1273–83.doi: 10.1002/hbm.22251 PMID: 23417795
17. Kraemer HC. The reliability of clinical diagnoses: state of the art. Annu Rev Clin Psychol. 2014;10:111–30. doi: 10.1146/annurev-clinpsy-032813-153739 PMID: 24387235
18. Li Z, Kadivar A, Pluta J, Dunlop J, Wang Z. Test-retest stability analysis of resting brain activityrevealed by blood oxygen level-dependent functional MRI. J Magn Reson Imaging. 2002; 36(2):344–54. doi: 10.1002/jmri.23670
19. Zuo XN, Xing XX. Test-retest reliabilities of resting-state FMRI measurements in human brain func-tional connectomics: a systems neuroscience perspective. Neurosci Biobehav Rev. 2014; 45:100–18. doi: 10.1016/j.neubiorev.2014.05.009 PMID: 24875392
20. Zuo XN, Di Martino A, Kelly C, Shehzad ZE, Gee DG, Klein DF, et al. The oscillating brain: complexand reliable. Neuroimage. 2010; 49(2):1432–45. doi: 10.1016/j.neuroimage.2009.09.037 PMID:19782143
21. Zuo XN, Xu T, Jiang L, Yang Z, Cao XY, He Y, et al. Toward reliable characterization of functionalhomogeneity in the human brain: preprocessing, scan duration, imaging resolution and computationalspace. Neuroimage. 2013; 65:374–86. doi: 10.1016/j.neuroimage.2012.10.017 PMID: 23085497
22. Shehzad Z, Kelly AM, Reiss PT, Gee DG, Gotimer K, Uddin LQ, et al. The resting brain: unconstrainedyet reliable. Cereb Cortex. 2009; 19(10):2209–29. doi: 10.1093/cercor/bhn256 PMID: 19221144
23. Zuo XN, Kelly C, Adelstein JS, Klein DF, Castellanos FX, MilhamMP. Reliable intrinsic connectivitynetworks: test-retest evaluation using ICA and dual regression approach. Neuroimage. 2010; 49(3):2163–77. doi: 10.1016/j.neuroimage.2009.10.080 PMID: 19896537
24. Wang JH, Zuo XN, Gohel S, MilhamMP, Biswal BB, He Y. Graph theoretical analysis of functionalbrain networks: test-retest evaluation on short- and long-term resting-state functional MRI data. PLoSOne. 2011; 6(7):e21976. doi: 10.1371/journal.pone.0021976 PMID: 21818285
Individual Differences in Functional Connectomics
PLOS ONE | DOI:10.1371/journal.pone.0144963 December 29, 2015 17 / 21
25. Wang J, Zuo X, Dai Z, Xia M, Zhao Z, Zhao X, et al. Disrupted functional brain connectome in individu-als at risk for Alzheimer’s disease. Biol Psychiatry. 2013; 73(5):472–81. doi: 10.1016/j.biopsych.2012.03.026 PMID: 22537793
26. Liao XH, Xia MR, Xu T, Dai ZJ, Cao XY, Niu HJ, et al. Functional brain hubs and their test-retest reli-ability: A multiband resting-state functional MRI study. Neuroimage. 2013; 83:969–82. doi: 10.1016/j.neuroimage.2013.07.058 PMID: 23899725
27. Du HX, Liao XH, Lin QX, Li GS, Chi YZ, Liu X, et al. Test-Retest reliability of graph metrics in high-res-olution functional connectomics: A resting-state functional MRI study. CNS Neurosci Ther. 2015; 21(10):802–16. doi: 10.1111/cns.12431 PMID: 26212146
28. Thomason ME, Dennis EL, Joshi AA, Joshi SH, Dinov ID, Chang C, et al. Resting-state fMRI can reli-ably map neural networks in children. Neuroimage. 2011; 55(1):165–75. doi: 10.1016/j.neuroimage.2010.11.080 PMID: 21134471
29. Somandepalli K, Kelly C, Reiss PT, Zuo XN, Craddock RC, Yan CG, et al. Short-term test-retest reli-ability and repeatability of resting state fMRI metrics in children with and without attention-deficit/hyperactivity disorder. Dev Cogn Neurosci. 2015; 15:83–93. doi: 10.1016/j.dcn.2015.08.003 PMID:26365788
30. Guo CC, Kurth F, Zhou J, Mayer EA, Eickhoff SB, Kramer JH, et al. One-year test-retest reliability ofintrinsic connectivity network fMRI in older adults. Neuroimage. 2012; 61(4):1471–83. doi: 10.1016/j.neuroimage.2012.03.027 PMID: 22446491
31. Song J, Desphande AS, Meier TB, Tudorascu DL, Vergun S, Nair VA, et al. Age-related differences intest-retest reliability in resting-state brain functional connectivity. PLoS One. 2012; 7(12):e49847. doi:10.1371/journal.pone.0049847 PMID: 23227153
32. Orban P, Madjar C, Savard M, Dansereau C, Tam A, Das S, et al. Test-retest resting-state fMRI inhealthy elderly persons with a family history of Alzheimer’s disease. Sci Data. 2015; 2:150043. doi:10.1038/sdata.2015.43 PMID: 26504522
33. Blautzik J, Keeser D, Berman A, Paolini M, Kirsch V, Mueller S, et al. Long-term test-retest reliabilityof resting-state networks in healthy elderly subjects and with amnestic mild cognitive impairmentpatients. J Alzheimers Dis. 2013; 34(3):741–54. PMID: 23271315
34. Shrout PE, Fleiss JL. Intraclass correlations: uses in assessing rater reliability. Psychol Bull. 1979; 86(2):420–8. doi: 10.1037/0033-2909.86.2.420 PMID: 18839484
35. Weir JP. Quantifying test-retest reliability using the intraclass correlation coefficient and the SEM. JStrength Cond Res. 2005; 19(1):231–40. doi: 10.1519/00124278-200502000-00038 PMID:15705040
36. Yan C, Liu D, He Y, Zou Q, Zhu C, Zuo X, et al. Spontaneous brain activity in the default mode networkis sensitive to different resting-state conditions with limited cognitive load. PLoS One. 2009; 4(5):e5743. doi: 10.1371/journal.pone.0005743 PMID: 19492040
37. Yan CG, Cheung B, Kelly C, Colcombe S, Craddock RC, Di Martino A, et al. A comprehensiveassessment of regional variation in the impact of head micromovements on functional connectomics.Neuroimage. 2013; 76:183–201. doi: 10.1016/j.neuroimage.2013.03.004 PMID: 23499792
38. Yan CG, Craddock RC, Zuo XN, Zang YF, MilhamMP. Standardizing the intrinsic brain: towardsrobust measurement of inter-individual variation in 1000 functional connectomes. Neuroimage. 2013;80:246–62. doi: 10.1016/j.neuroimage.2013.04.081 PMID: 23631983
39. Mueller S, Wang DH, Fox MD, Yeo BTT, Sepulcre J, Sabuncu MR, et al. Individual variability in func-tional connectivity architecture of the human brain. Neuron. 2013; 77(3):586–95. doi: 10.1016/j.neuron.2012.12.028 PMID: 23395382
40. Wang D, Buckner RL, Fox MD, Holt DJ, Holmes AJ, Stoecklein S, et al. Parcellating cortical functionalnetworks in individuals. Nat Neurosci. 2015; 18(2):1853–60. doi: 10.1038/nn.4164 PMID: 26551545
41. Gonzalez-Castillo J, Handwerker DA, Robinson ME, Hoy CW, Buchanan LC, Saad ZS, et al. The spa-tial structure of resting state connectivity stability on the scale of minutes. Front Neurosci. 2014;8:138. doi: 10.3389/fnins.2014.00138 PMID: 24999315
42. Poldrack RA, Laumann T, Koyejo O, Gregory R, Hover A, Chen MY, et al. Long-term neural and phys-iological phenotyping of a single human. Nat Commun. 2015; 6:8885. doi: 10.1038/ncomms9885PMID: 26648521
43. Laumann TO, Gordon EM, Adeyemo B, Snyder AZ, Joo SJ, Chen MY, et al. Functional system andareal organization of a highly sampled individual human brain. Neuron. 2015; 87(3):657–70. doi: 10.1016/j.neuron.2015.06.037 PMID: 26212711
44. Choe AS, Jones CK, Joel SE, Muschelli J, Belegu V, Caffo BS, et al. Reproducibility and temporalstructure in weekly resting-state fMRI over a period of 3.5 years. PLoS One. 2015; 10(10):e0140134.doi: 10.1371/journal.pone.0140134 PMID: 26517540
Individual Differences in Functional Connectomics
PLOS ONE | DOI:10.1371/journal.pone.0144963 December 29, 2015 18 / 21
45. Allen EA, Damaraju E, Plis SM, Erhardt EB, Eichele T, Calhoun VD. Tracking whole-brain connectivitydynamics in the resting state. Cereb Cortex. 2014; 24:663–76. doi: 10.1093/cercor/bhs352 PMID:23146964
46. Kelly C, Biswal BB, Craddock RC, Castellanos FX, MilhamMP. Characterizing variation in the func-tional connectome: promise and pitfalls. Trends Cogn Sci. 2012; 16(3):181–8. doi: 10.1016/j.tics.2012.02.001 PMID: 22341211
47. Zuo XN, Anderson JS, Bellec P, Birn RM, Biswal BB, Blautzik J, et al. An open science resource forestablishing reliability and reproducibility in functional connectomics. Sci Data. 2014; 1:140049. doi:10.1038/sdata.2014.49 PMID: 25977800
48. Cox RW. AFNI: what a long strange trip it’s been. Neuroimage. 2012; 62(2):743–7. doi: 10.1016/j.neuroimage.2011.08.056 PMID: 21889996
49. Fischl B, Sereno MI, Dale AM. Cortical surface-based analysis. II: Inflation, flattening, and a surface-based coordinate system. Neuroimage. 1999; 9(2):195–207. doi: 10.1006/nimg.1998.0396 PMID:9931269
50. Jenkinson M, Beckmann CF, Behrens TE, Woolrich MW, Smith SM. FSL. Neuroimage. 2012; 62(2):782–90. doi: 10.1016/j.neuroimage.2011.09.015 PMID: 21979382
51. Xu T, Yang Z, Jiang L, Xing XX, Zuo XN. A Connectome Computation System for discovery scienceof brain. Sci Bull. 2015; 60(1):86–95. doi: 10.1007/s11434-014-0698-3
52. Xing XX, Zhou YL, Adelstein JS, Zuo XN. PDE-based spatial smoothing: a practical demonstration ofimpacts on MRI brain extraction, tissue segmentation and registration. Magn Reson Imaging. 2011;29(5):731–8. doi: 10.1016/j.mri.2011.02.007 PMID: 21531104
53. Zuo XN, Xing XX. Effects of non-local diffusion on structural MRI preprocessing and default networkmapping: statistical comparisons with isotropic/anisotropic diffusion. PLoS One. 2011; 6(10):e26703.doi: 10.1371/journal.pone.0026703 PMID: 22066005
54. Dale AM, Fischl B, Sereno MI. Cortical surface-based analysis. I. Segmentation and surface recon-struction. Neuroimage. 1999; 9(2):179–94. doi: 10.1006/nimg.1998.0395 PMID: 9931268
55. Segonne F, Pacheco J, Fischl B. Geometrically accurate topology-correction of cortical surfacesusing nonseparating loops. IEEE Trans Med Imaging. 2007; 26(4):518–29. doi: 10.1109/TMI.2006.887364 PMID: 17427739
56. Power JD, Barnes KA, Snyder AZ, Schlaggar BL, Petersen SE. Spurious but systematic correlationsin functional connectivity MRI networks arise from subject motion. Neuroimage. 2012; 59(3):2142–54.doi: 10.1016/j.neuroimage.2011.10.018 PMID: 22019881
57. Carp J. Optimizing the order of operations for movement scrubbing: Comment on Power et al. Neuro-image. 2013; 76:436–8. doi: 10.1016/j.neuroimage.2011.12.061 PMID: 22227884
58. Greve DN, Fischl B. Accurate and robust brain image alignment using boundary-based registration.Neuroimage. 2009; 48(1):63–72. doi: 10.1016/j.neuroimage.2009.06.060 PMID: 19573611
59. Jo HJ, Saad ZS, SimmonsWK, Milbury LA, Cox RW. Mapping sources of correlation in resting stateFMRI, with artifact detection and removal. Neuroimage. 2010; 52(2):571–82. doi: 10.1016/j.neuroimage.2010.04.246 PMID: 20420926
60. Yeo BT, Krienen FM, Sepulcre J, Sabuncu MR, Lashkari D, Hollinshead M, et al. The organization ofthe human cerebral cortex estimated by intrinsic functional connectivity. J Neurophysiol. 2011; 106(3):1125–65. doi: 10.1152/jn.00338.2011 PMID: 21653723
61. Holmes AJ, Hollinshead MO, O�Keefe TM, Petrov VI, Fariello GR, Wald LL, et al. Brain GenomicsSuperstruct Project initial data release with structural, functional, and behavioral measures. Sci Data.2015; 2:150031. doi: 10.1038/sdata.2015.31 PMID: 26175908
62. Buckner RL, Sepulcre J, Talukdar T, Krienen FM, Liu H, Hedden T, et al. Cortical hubs revealed byintrinsic functional connectivity: mapping, assessment of stability, and relation to Alzheimer’s disease.J Neurosci. 2009; 29(6):1860–73. doi: 10.1523/JNEUROSCI.5062-08.2009 PMID: 19211893
63. Lohmann G, Margulies DS, Horstmann A, Pleger B, Lepsien J, Goldhahn D, et al. Eigenvector central-ity mapping for analyzing connectivity patterns in fMRI data of the human brain. PLoS One. 2010; 5(4):e10232. doi: 10.1371/journal.pone.0010232 PMID: 20436911
64. Wink AM, de Munck JC, van der Werf YD, van den Heuvel OA, Barkhof F. Fast eigenvector centralitymapping of voxel-wise connectivity in functional magnetic resonance imaging: implementation, valida-tion, and interpretation. Brain Connect. 2012; 2(5):265–74. doi: 10.1089/brain.2012.0087 PMID:23016836
65. Landis JR, Koch GG. The measurement of observer agreement for categorical data. Biometrics.1977; 33(1):159–74. doi: 10.2307/2529310 PMID: 843571
Individual Differences in Functional Connectomics
PLOS ONE | DOI:10.1371/journal.pone.0144963 December 29, 2015 19 / 21
66. Yeo BT, Krienen FM, Sepulcre J, Sabuncu MR, Lashkari D, Hollinshead M, et al. Functional speciali-zation and flexibility in human association cortex. Cereb Cortex. 2015; 25(10):3654–72. doi: 10.1093/cercor/bhu217 PMID: 25249407
67. Biswal BB. Resting state fMRI: a personal history. Neuroimage. 2012; 62(2):938–44. doi: 10.1016/j.neuroimage.2012.01.090 PMID: 22326802
68. Smith SM, Beckmann CF, Andersson J, Auerbach EJ, Bijsterbosch J, Douaud G, et al. Resting-statefMRI in the Human Connectome Project. Neuroimage. 2013; 80:144–68. doi: 10.1016/j.neuroimage.2013.05.039 PMID: 23702415
69. Hutchison RM, Womelsdorf T, Allen EA, Bandettini PA, Calhoun VD, Corbetta M, et al. Dynamic func-tional connectivity: promise, issues, and interpretations. Neuroimage. 2013; 80:360–78. doi: 10.1016/j.neuroimage.2013.05.079 PMID: 23707587
70. Calhoun VD, Miller R, Pearlson G, Adali T. The chronnectome: time-varying connectivity networks asthe next frontier in fMRI data discovery. Neuron. 2014; 84(2):262–74. doi: 10.1016/j.neuron.2014.10.015 PMID: 25374354
71. Keilholz SD. The neural basis of time-varying resting-state functional connectivity. Brain Connect.2014; 4(10):769–79. doi: 10.1089/brain.2014.0250 PMID: 24975024
72. Messe A, Rudrauf D, Benali H, Marrelec G. Relating structure and function in the human brain: relativecontributions of anatomy, stationary dynamics, and non-stationarities. PLoS Comput Biol. 2014; 10(3):e1003530. doi: 10.1371/journal.pcbi.1003530 PMID: 24651524
73. Park HJ, Friston K. Structural and functional brain networks: from connections to cognition. Science.2013; 342(6158):1238411. doi: 10.1126/science.1238411 PMID: 24179229
74. Baker AP, Brookes MJ, Rezek IA, Smith SM, Behrens T, Probert Smith PJ, et al. Fast transient net-works in spontaneous human brain activity. Elife. 2014; 3:e01867. doi: 10.7554/eLife.01867 PMID:24668169
75. Zalesky A, Fornito A, Cocchi L, Gollo LL, Breakspear M. Time-resolved resting-state brain networks.Proc Natl Acad Sci U S A. 2014; 111(28):10341–6. doi: 10.1073/pnas.1400181111 PMID: 24982140
76. Schaefer A, Margulies DS, Lohmann G, Gorgolewski KJ, Smallwood J, Kiebel SJ, et al. Dynamic net-work participation of functional connectivity hubs assessed by resting-state fMRI. Front Hum Neu-rosci. 2014; 8:195. doi: 10.3389/fnhum.2014.00195 PMID: 24860458
77. Betzel RF, Fukushima M, He Y, Zuo XN, Sporns O. Dynamic fluctuations coincide with periods of highand low modularity in resting-state functional brain networks. arXiv.org. 2015;arXiv:1511.06352v1.
78. FukushimaM, Betzel RF, He Y, Zuo XN, Sporns O. Characterizing spatial patterns and flow dynamicsin functional connectivity states and their changes across the human lifespan. arXiv.org. 2015;arXiv:1511.06427v1.
79. Honey CJ, Kotter R, Breakspear M, Sporns O. Network structure of cerebral cortex shapes functionalconnectivity on multiple time scales. Proc Natl Acad Sci U S A. 2007; 104(24):10240–5. doi: 10.1073/pnas.0701519104 PMID: 17548818
80. Deco G, Ponce-Alvarez A, Mantini D, Romani GL, Hagmann P, Corbetta M. Resting-state functionalconnectivity emerges from structurally and dynamically shaped slow linear fluctuations. J Neurosci.2013; 33(27):11239–52. doi: 10.1523/JNEUROSCI.1091-13.2013 PMID: 23825427
81. Deco G, McIntosh AR, Shen K, Hutchison RM, Menon RS, Everling S, et al. Identification of optimalstructural connectivity using functional connectivity and neural modeling. J Neurosci. 2014; 34(23):7910–6. doi: 10.1523/JNEUROSCI.4423-13.2014 PMID: 24899713
82. Barttfeld P, Uhrig L, Sitt JD, Sigman M, Jarraya B, Dehaene S. Signature of consciousness in thedynamics of resting-state brain activity. Proc Natl Acad Sci U S A. 2015; 112(3):887–92. doi: 10.1073/pnas.1418031112 PMID: 25561541
83. Shen K, Hutchison RM, Bezgin G, Everling S, McIntosh AR. Network structure shapes spontaneousfunctional connectivity dynamics. J Neurosci. 2015; 35(14):5579–88. doi: 10.1523/JNEUROSCI.4903-14.2015 PMID: 25855174
84. Hellyer PJ, Scott G, ShanahanM, Sharp DJ, Leech R. Cognitive Flexibility through Metastable NeuralDynamics Is Disrupted by Damage to the Structural Connectome. J Neurosci. 2015; 35(24):9050–63.doi: 10.1523/JNEUROSCI.4648-14.2015 PMID: 26085630
85. Anderson ML, Finlay BL. Allocating structure to function: the strong links between neuroplasticity andnatural selection. Front Hum Neurosci. 2014; 7(3):918. doi: 10.3389/fnhum.2013.00918 PMID:24431995
86. Petanjek Z, Judas M, Simic G, Rasin MR, Uylings HB, Rakic P, et al. Extraordinary neoteny of synap-tic spines in the human prefrontal cortex. Proc Natl Acad Sci U S A. 2011; 108(32):13281–6. doi: 10.1073/pnas.1105108108 PMID: 21788513
Individual Differences in Functional Connectomics
PLOS ONE | DOI:10.1371/journal.pone.0144963 December 29, 2015 20 / 21
87. GaoW, Elton A, Zhu H, Alcauter S, Smith JK, Gilmore JH, et al. Intersubject variability of and geneticeffects on the brain’s functional connectivity during infancy. J Neurosci. 2014; 34(34):11288–96. doi:10.1523/JNEUROSCI.5072-13.2014 PMID: 25143609
88. Smith DV, Utevsky AV, Bland AR, Clement N, Clithero JA, Harsch AE, et al. Characterizing individualdifferences in functional connectivity using dual-regression and seed-based approaches. Neuro-image. 2014; 95:1–12. doi: 10.1016/j.neuroimage.2014.03.042 PMID: 24662574
89. Bassett DS, Gazzaniga MS. Understanding complexity in the human brain. Trends Cogn Sci. 2011;15(5):200–9. doi: 10.1016/j.tics.2011.03.006 PMID: 21497128
90. Cao M, Wang JH, Dai ZJ, Cao XY, Jiang LL, Fan FM, et al. Topological organization of the humanbrain functional connectome across the lifespan. Dev Cogn Neurosci. 2014; 7:76–93. doi: 10.1016/j.dcn.2013.11.004 PMID: 24333927
91. Yang Z, Chang C, Xu T, Jiang L, Handwerker DA, Castellanos FX, et al. Connectivity trajectory acrosslifespan differentiates the precuneus from the default network. Neuroimage. 2014; 89C:45–56. doi:10.1016/j.neuroimage.2013.10.039
92. Betzel RF, Byrge L, He Y, Goni J, Zuo XN, Sporns O. Changes in structural and functional connectivityamong resting-state networks across the human lifespan. Neuroimage. 2014; 102 Pt 2:345–57. doi:10.1016/j.neuroimage.2014.07.067 PMID: 25109530
93. Betzel RF, Avena-Koenigsberger A, Goni J, He Y, de Reus MA, Griffa A, et al. Generative models ofthe human connectome. Neuroimage. 2016; 124(Pt A):1054–1064. doi: 10.1016/j.neuroimage.2015.09.041
94. Chan MY, Park DC, Savalia NK, Petersen SE, Wig GS. Decreased segregation of brain systemsacross the healthy adult lifespan. Proc Natl Acad Sci U S A. 2014; 111(46):E4997–5006. doi: 10.1073/pnas.1415122111 PMID: 25368199
95. Zhao T, Cao M, Niu H, Zuo XN, Evans A, He Y, et al. Age-related changes in the topological organiza-tion of the white matter structural connectome across the human lifespan. Hum Brain Mapp. 2015; 36(10):3777–92. doi: 10.1002/hbm.22877 PMID: 26173024
96. Gu S, Satterthwaite TD, Medaglia JD, Yang M, Gur RE, Gur RC, et al. Emergence of system roles innormative neurodevelopment. Proc Natl Acad Sci U S A. 2015; 112(44):13681–6. doi: 10.1073/pnas.1502829112 PMID: 26483477
97. He Y, Xu T, Wei Zhang, Zuo XN. Lifespan anxiety is reflected in intrinsic amygdala cortical connectiv-ity. Hum Brain Mapp. 2016; Epub ahead of print: In press.
98. Mueller S, Wang DH, Fox MD, Pan R, Lu J, Li K, et al. Reliability correction for functional connectivity:Theory and implementation. Hum Brain Mapp. 2015; 36(11):4664–80. doi: 10.1002/hbm.22947PMID: 26493163
99. Saad ZS, Gotts SJ, Murphy K, Chen G, Jo HJ, Martin A, et al. Trouble at rest: how correlation patternsand group differences become distorted after global signal regression. Brain Connect. 2012; 2(1):25–32. doi: 10.1089/brain.2012.0080 PMID: 22432927
100. Saad ZS, Reynolds RC, Jo HJ, Gotts SJ, Chen G, Martin A, et al. Correcting brain-wide correlation dif-ferences in resting-state FMRI. Brain Connect. 2013; 3(4):339–52. doi: 10.1089/brain.2013.0156PMID: 23705677
Individual Differences in Functional Connectomics
PLOS ONE | DOI:10.1371/journal.pone.0144963 December 29, 2015 21 / 21