Embed Size (px)
Citation preview

Page 0 of 66
Research Topic:
Information Communication Technologies (ICT)
and Its Impact on the livelihood of Communities
Involved in the Fisheries, Agriculture and
Livestock: A pilot Study of South Punjab and
South Sindh
Indus Consortium, Islamabad, Pakistan
This research work is completed by the JFK Institute of Technology and Management,
Islamabad, Pakistan with the help and support of Indus Consortium Pakistan.
Principal Investigator: Dr. Ijaz A. Qureshi, Email: [email protected]
Research Associate: Khola Ilyas
Research Associate: Ashok Lilani
Research Assistant: Junaid Khan

Page 1 of 66
Acknowledgements
Principal Investigator, Dr. Ijaz A. Qureshi from JFK Institute of Technology and
Management, Islamabad, Pakistan is grateful to the executives of Indus Consortium for
giving us the opportunity to complete this pilot study in the South Sindh and South Punjab
of Pakistan.
It was a challenging assignment as time given to complete this task was limited. However,
what our team found very helpful and supportive was round the clock communication with
Mr. Ashok Lilani who kindly arranged the support teams in the targeted villages for data
gathering and interviews. For sure without his trust and support this job would not have
been completed.
Research team is also thank full to Mr. Hussain Jarwar, CEO Indus Consortium and Mr.
Khalid Saifullah, National Coordinator of Indus Consortium for attending all the meetings
regarding the progress in research report. Mr. Jarwar and Mr. Saifullah kindly honored
the research team by joining us in the focus group discussion organized at Islamabad,
Pakistan.
Finally research team is also grateful to Mr. Ghulam Abbas, Project Officer ICT Multan,
Mr. Sabir Hussain Jarwar ICT Baddin and Thatta, Mr. Muhammad Adeel ICT Rajanpur,
Mr. Javed Iqbal, Mr. Jamshaid Farid, Mr. Qaisar Azam, Miss Bilqees Umar, Mr. Nazim
Baloch and Mr. Anwar Punjwani for making it possible to complete the field tasks
successfully. We know for sure your sincere support and effort made it possible to get the
job done in the desired time frame.
Thank you all once again, hope to have some more projects with you soon.
Page 2 of 66
Table of Contents Abstract ........................................................................................................................................................ 6
Introduction ................................................................................................................................................. 7
Literature Review ....................................................................................................................................... 8
ICT and Development ............................................................................................................................ 8
ICT and Rural Societies ......................................................................................................................... 8
Transformative Role of ICT .................................................................................................................. 11
1. Computerized Milk Collection Center .......................................................................................... 12
2. Improving Health Care.................................................................................................................. 12
3. ICT in Agriculture ......................................................................................................................... 12
4. Empowerment of Fisher Women .................................................................................................. 13
Methodology .............................................................................................................................................. 14
Data Analysis ........................................................................................................................................ 15
Data analysis of Fisheries Instrument ......................................................................................... 15
Demographic Details ............................................................................................................. 15
Graphical Presentation Of Fisheries ...................................................................................... 16
Reliability Analysis .............................................................................................................. 20
Principal Component Analysis ............................................................................................. 21
Regression analysis .............................................................................................................. 23
Overall Analysis of Fisheries ................................................................................................ 24
Data analysis of Agriculture Instrument ..................................................................................... 26
Demographic Details ............................................................................................................. 26
Graphical Presentation of Fisheries ....................................................................................... 27
Reliability Analysis .............................................................................................................. 32
Principal Component Analysis ............................................................................................. 32
Regression analysis .............................................................................................................. 34
Overall Analysis of Agriculture ............................................................................................ 35

Page 3 of 66
Data analysis of Livestock Instrument ....................................................................................... 36
Demographic Details ............................................................................................................. 36
Graphical Presentation of Livestock ...................................................................................... 37
Reliability Analysis .............................................................................................................. 42
Principal Component Analysis ............................................................................................. 43
Regression analysis .............................................................................................................. 44
Overall Analysis of Livestock ............................................................................................... 45
Conclusion and Recommendations................................................................................................. 47 to 49
References .................................................................................................................................................. 50
Appendix 1 .................................................................................................................................................. 54
Appendix 2 .................................................................................................................................................. 58
Appendix 3 .................................................................................................................................................. 61
Tables
Table 1: Percent of those respondents who say they understand English ................................................... 11
Table 2: Literacy Rate (10 Years and Above)-Pakistan and Provinces (2010-11) ..................................... 11
Table 3: Gender-Fisheries ........................................................................................................................... 16
Table 4: Age-Fisheries ................................................................................................................................ 16
Table 5: Education-Fisheries ..................................................................................................................... 17
Table 6: Income Source-Fisheries .............................................................................................................. 17
Table 7: Transportation-Fisheries .............................................................................................................. 18
Table 8: Monthly Income-Fisheries ........................................................................................................... 18
Table 9: ICT Services-Fisheries ................................................................................................................. 19
Table 10: Demographic ............................................................................................................................... 19
Table 11: Reliability analysis ..................................................................................................................... 21
Table 12: Principal Component Analysis .................................................................................................. 22

Page 4 of 66
Table 13: Model Summary ........................................................................................................................ 23
Table 14: coefficients ................................................................................................................................. 24
Table 15: Gender-Agriculture ..................................................................................................................... 27
Table 16: Age-Agriculture .......................................................................................................................... 27
Table 17: Education-Agriculture ................................................................................................................ 28
Table 18: Income Source-Agriculture ......................................................................................................... 28
Table 19: Transportation-Agriculture ......................................................................................................... 29
Table 20: Monthly Income-Agriculture ...................................................................................................... 29
Table 21: ICT Services-Agriculture ............................................................................................................ 30
Table 22: Demographics ............................................................................................................................. 31
Table 23: Reliability analysis ...................................................................................................................... 32
Table 24: Principal Component Analysis ................................................................................................... 33
Table 25: Model Summary ......................................................................................................................... 34
Table 26: Coefficients ................................................................................................................................. 34
Table 27: Gender-Livestock ....................................................................................................................... 37
Table 28: Age-Livestock ............................................................................................................................. 37
Table 29: Education-Livestock ................................................................................................................... 38
Table 30: Income Source-Livestock ........................................................................................................... 38
Table 31: Transportation-Livestock ............................................................................................................ 39
Table 32: Monthly Income-Livestock......................................................................................................... 39
Table 33: Livestock ..................................................................................................................................... 40
Table 34: ICT Services-Livestock .............................................................................................................. 40
Table 35: Demographics ............................................................................................................................. 41
Table 36: Reliability analysis ...................................................................................................................... 42
Table 37: Principal Component Analysis ................................................................................................... 43
Table 38: Model Summary ......................................................................................................................... 45

Page 5 of 66
Table 39: Coefficients ................................................................................................................................ 45s
Figures
Figure 1: Source: USF. ORG. PK ............................................................................................................... 10
Figure 2:Gender Of Fisheries Participant ................................................................................................... 16
Figure 3: Age Of Fisheries Participant ....................................................................................................... 16
Figure 4: Education of Fisheries Participant ............................................................................................... 17
Figure 5: Income Source of Fisheries Participant ....................................................................................... 17
Figure 6: Transportation of Fisheries Participant........................................................................................ 18
Figure 7: Monthly Income of Fisheries Participant .................................................................................... 18
Figure 8: ICT Services of Fisheries Participant .......................................................................................... 19
Figure 9: Gender of Agricultural Participant .............................................................................................. 27
Figure 10: Age of Agricultural Participant ................................................................................................. 27
Figure 11: Education of Agricultural Participant ........................................................................................ 28
Figure 12: Income Source of Agricultural Participant ................................................................................ 28
Figure 13: Transportation of Agricultural Participant ................................................................................ 29
Figure 14: Monthly Income of Agricultural Participant ............................................................................. 29
Figure 15: ICT Services Of Agricultural Participant .................................................................................. 30
Figure 16: Gender of Livestock Participant ................................................................................................ 37
Figure 17: Age of Livestock Participant ..................................................................................................... 37
Figure 18: Education of Livestock Participant............................................................................................ 38
Figure 19: Income Source of Livestock Participant .................................................................................... 38
Figure 20: Transportation of Livestock Participant .................................................................................... 39
Figure 21: Monthly Income of Livestock Participant ................................................................................. 39
Figure 22: Livestock ................................................................................................................................... 40
Figure 22: ICT Services of Livestock Participant ....................................................................................... 40

Page 6 of 66
ABSTRACT
This research, basically a pilot study is about the implementation of Information Communication
Technologies (ICTs) in the rural areas particularly south Punjab and south Sindh of Pakistan. Researchers
have conducted the field work in the twenty five villages of five districts i.e Rajanpur, Multan,
Muzaffargarh, Thatta and Badin. The objective of this research was to see if the implementation of ICT
would have any impact on the livelihood of people involved in the fisheries, agriculture and livestock.
Another variable “unemployment” was also added in the designed research tools to see if the ICT can be
helpful to unemployed members of these communities.
The questionnaire was distributed among the rural population of Rajanpur, Multan, Muzaffargarh, Thatta
and Badin on the basis of convenient sampling. In case of fisheries participants filled out 37-item
questionnaire. There were 120 questionnaires distributed among the participants and 106 were usable for
analysis purpose. For agriculture, participants filled out 36-item questionnaire. There were 250
questionnaires distributed among the participant and 212 were usable for analysis purpose. The
participants of the study in livestock filled out a 38-item questionnaire. There were 250 questionnaires
distributed. Among 250 questionnaires, 206 were usable for analysis purpose.
In addition to launching the surveys in the twenty five villages, JFK Institute of Technology and
Management research team organized focus group discussion in Islamabad where policy makers, ministry
officials, civil society representatives and university professors were invited to get their opinion on the
implementation of ICT in the stated communities. The panel stressed the need to launch the ICT project
on priority basis to enhance the economic opportunities for south Sindh and south Punjab.
Researchers analyzed the data using the SPSS software. Reliability Analysis, Principal Component
Analysis and Regression Analysis were conducted to analyze the data collected from the twenty five
villages.
Results show that a vast majority of the population is in favor of ICT implementation in the communities,
with the perception that it would help in improving the livelihood of those involved in fisheries,
agriculture and livestock.

Page 7 of 66
INTRODUCTION
Information and communication technologies (ICT) offer bright prospects for the developing
countries in picking up the pace for economic growth, reducing poverty and promoting
sustainable micro development. The role of ICTs in rural areas as an impetus for development
has long been acknowledged and therefore numerous public/private sector organizations, donor
agencies are involved in ICT related projects with the aim to improve quality of rural life.
According to infoDev report (2010), as outlined by United Nations Millennium Development
Goals, the international donor community has made concerted efforts to bridge the digital gap
between the haves and have-nots.
Although Jensen (2007) declared the impact of increased access of ICTs to developing societies
unclear but recent evidence suggests that ICTs can play a fundamental role in boosting the
livelihoods of rural population ( Aker & Mbiti, 2010; Dutta & Das, 2011; Kiiza & Peterson,
2012; Mamaghani, 2010; Omer & Chhachhar, 2012; Stienen, Bruinsma & Neuman, 2007).
Further strengthening the case are the views of Kgalema Motlanthe, Deputy President Africa,
regarding the solution of joblessness, poverty and health issues in Africa, “If you look at
countries such as India, they invested a lot in education, IT, and ICT and reap the benefits of
those investments. That’s “what Africa needs to do as well” (Dorr & Fine, 2010).
The research question framed in this study is:
“How does ICT impact the livelihoods of rural population of Pakistan?”
To attend to this research question, this paper provides an overview of the ICT perceptions of
rural population of Southern Sindh (Badin and Thatta) and Southern Punjab (Muzafargarh,
Multan and Rajanpur) related to daily life usage, agriculture, fisheries and livestock. A further
component of “unemployment” is added in the research to see how it would have any impact on
the lives of unemployed folks in the targeted areas.
The findings of this study would help the donor agencies and government development bodies to
understand the ICT need and perceptions of rural population in order to successfully conduct
projects in these poverty struck areas.

Page 8 of 66
LITERATURE REVIEW
ICT and Development
Information and Communication Technologies (ICT) refers to the use of electronic and
computers based technologies to access information and communicate with others (Angello and
wema 2010). Thus, the transfer of information takes place electronically through the electronic
devices like computers, mobile phones and tablets. The role of ICTs as enabler of socio-
economic development is being stressed by the international development communities because
of the prospects associated to it for the developing countries.
ICT offers major opportunities to the developing world in accelerating the economic growth,
encouraging local development and reduction in poverty (Mamaghani, 2010). As a result of this,
efforts are being made to utilize ICT for achieving development objectives in healthcare,
workforce, education, agriculture, government services etc. to improve the livelihood of poor
people. The achievement of these objectives is likely to cause a chain reaction instigating
positive impact on the position of developing countries in the global economy as a result of
improvement in the individual level income.
Some of the researchers have also contended that other than the economic impacts, the ICTs bear
positive spillover effects on various aspects of social life. For example, these technologies have
been linked to improving education delivery and e-government (Johnstone, 2007), develop civil
infrastructure (Ngwenyama, Andoh-Baidoo, Bollou & Morawczynski, 2006), empower
disregarded women (Huyer, 2005), maintain good governance (Meso, Datta, & Mbarika, 2005)
and augment health care (Von Lubitz & Wickramasinghe, 2006). Therefore, many researchers
argue the significance of ICT infrastructure for the rapid development of emerging economies
(Jukka & Pohjola, 2002; Madon, 2000; Pohjola, 2001).
ICT and Rural Societies
The last two decades have been characterized with the evolution in ICTs that have a profound
impact on all aspects of life. The developed countries in particular until now have been able to
reap the benefits of this revolution. On the other hand developing countries have lagged behind

Page 9 of 66
in adoption of ICT because of unequal access to Internet and wireless telephony between the
urban and rural populations. The matter gets further complicated by the fact that this digital
divide between the haves and have-nots decreases the value of time as compared to the access
costs in developing countries (Mathur & Ambani, 2005). As a result, limited deprived people
will invest in ICT (Cecchini & Scott, 2003).
Pakistan has extreme geographical importance because of its unique strategic position. With a
population of 170 million, it is the 6th most populous country in the world ( “About Pakistan,”
n.d.) . 67.5 % of the population resides in villages and 55% of population is under the age of 24
which is becoming more and more challenging to provide health, education and jobs to the rural
areas of Pakistan (Pakistan Economic Survey, 2011). Although Teledensity of 71.5% depicts
healthy trend in the expansion of telecommunication services but the scenario for the rural
residents may be different (“Telecom Indicators,” 2013). According to Universal Service Fund,
480 cities and towns of Pakistan lack broadband services with the major percentage comprising
in the rural areas (Iftikhar, 2012). The long hour power shutdown in the rural areas further
complicates the matter. Therefore, even with a flourishing IT industry having an estimated global
share of US$2.8 billion, including global sales revenue of US$1.6 billion, ICT expansion in rural
Pakistan will be a challenging task (“Industry Overview,” n.d.) .The reason can be attributed to
the fact that with the evolution of technology extending ICT networks to rural areas has been a
persistent challenge (Alleman, Rappoport, & Banerjee, 2010).

Page 10 of 66
Figure 1. Source: Research report by Iftikhar, USF.ORG.PK 2012.
Figure 1 is taken from the Universal Service Fund report published in 2012. The information
published shows that 62% rural population has no personal computer or any skill of how to use
the PC. At the same time 17% of the population has no access to broadband which consists of
480 cities and town. Only 21% of the nation has access to broadband in Pakistan as per this
report.
Apart from the absence of infrastructure and economic factors, major obstacles are illiteracy and
lack of awareness (Mathur & Ambani, 2005). Unlike other mediums of communications like
Radio and Television, Internet requires some basic level of literacy in order to communicate with
other people. BBC survey conducted in 2008, indicated 52% of respondents identified
themselves as illiterate, thus highlighting illiteracy as an important issue in Pakistan.
Furthermore, the digital gender divide clearly exists with low literacy rate among the women as

Page 11 of 66
Table 1: Percent of those respondents who say they understand English
Source: BBC Pakistan 2008: survey of adults (15+) n = 4020
compared to men. Table 1 indicates the danger of permanent backwardness in rural areas. One of
the possible reasons could be the socio-cultural issues in the rural societies which do not allow
much ICT access to women.
Table 2: Literacy Rate (10 Years and Above)-Pakistan and Provinces (2010-11).
Province Male % Female% Total%
Punjab
Urban 80 71 76
Rural 64 42 53
Sindh
Urban 82 68 75
Rural 60 22 42
Source: Pakistan Economic Survey 2012
Transformative Role of ICT
The transformative role of ICT cannot be denied with number of case studies witnessing its
power to improve livelihoods by eradicating poverty through empowerment of rural
communities. Chapman, Slayaker, and Young (2004) accentuated significance of ICTs for
providing information to rural residents in order to make livelihood strategies decisions and
institutions for developing policies and process for these strategies. The following case studies
highlight the successful application of ICTs in agriculture, livestock, mobile communications,
government and education sector.

Page 12 of 66
1. Computerized Milk Collection Centers
Lack of access to information about weather conditions, prices and market opportunities are
typically very common among farmers living in rural areas. ICT can remedy such situation by
timely access to the relevant information in less time. In Gujrat (India) electronic milk collection
centers have been set up which have integrated system to measure weights, test fat and plastic
card readers in order to ensure fair prices for the farmers who supply milk to dairy corporations
(Cecchini & Scott, 2003). Therefore, the farmers have been protected against the traditional
intransparent pricing practices and delayed payments. Consequently this initiative has allowed
50,000 farmers to benefit from the transparent and cooperative system on daily basis (Cecchini,
2001).
2. Improving Health Care
The Telecenters deployed by the United Nations Development Program (UNDP) and the
Ministry of Science and Technology (MoST) in Menwangzhuang and Pushang, China, meets the
information need of the rural population related to health care such as setting hospital
appointments and getting basic health advise (Soriano, 2007). Furthermore, the residents also
regarded mobile phones as efficient tools for getting information about jobs and the whereabouts
of their friends and family members.
Successful projects like Gyandoot Project and N-Logue Communications in India allow for
delivery of wide variety of services related to e-governance, health care information and other
services through intranet (Gyandoot) and corDect (N-Logue) which is wireless based
communication service (Dutta & Das, 2011). Furthermore, in Malawi, patients of HIV and Aids
can receive reminder to take their medicines on schedule through text messages (Aker & Mbiti,
2010).
3. ICT in Agriculture
E-Choupal is a cost effective initiative by ITC for direct procurement of export products from the
farmers of Indian villages through Internet (Wikipedia 2013). This technology based intervention
provides farmers the basic knowledge about risk management and logistic related issues, thereby,
empowering them to face global challenges (Dutta & Das, 2011).

Page 13 of 66
According to Aker and Mbiti (2010), mobile phones reduce the search costs for the traders as
they are able to know about prices in different regions. For example, in Ghana, farmers are able
to learn about the tomato and corn prices over 400 Kilometer away through text messages.
Similarly, Muto and Yumano (2009) found that mobile phones coverage resulted in 10 percent
increase in the likelihood of farmers involvement in market for bananas as compared to maze,
thereby signifying the importance of mobile phones for perishable products.
4. Empowerment of Fisher Women
Patterson, Linden, Bierbrier, Löfgren, Wilhelmsson and Edward (2008) conducted ICT training
for the fisher women of Siluvaipatti in Tuticorin district of Tamil Nadu State, southeastern India.
Although the literacy rate of the village is generally good when compared to other villages but
this particular training aimed to facilitate the uneducated women to get the basic knowledge of
getting development loans in order to improve their livelihood. For this reason two coordinators
were trained who taught English to low educated women and Tamil alphabets to the uneducated
women of the village. As a result of this training several women learned to write their names and
short sentences.

Page 14 of 66
METHODOLOGY
A methodology is usually a guideline system for solving a problem, with specific components
such as phases, tasks, methods, techniques and tools (Irny and Rose, 2005). It can be defined also
as follows:
1. "the analysis of the principles of methods, rules, and postulates employed by a discipline"
(Merriam–Webster, 2013).
2. "the systematic study of methods that are, can be, or have been applied within a
discipline" (Merriam–Webster, 2013).
3. "the study or description of methods" (Baskerville,1991).
This part of research contains analysis of three different segments of rural life i.e. Agriculture,
Fisheries and Livestock. Another important variable i.e. Unemployment is accommodated in all
three of the questionnaires.
Researchers have focused on knowing the perception of ICT by using the two different
methodologies i.e. questionnaires and focus group discussions. A focus group discussion was
organized in the city of Islamabad where academicians, policy makers and ministry of
information officials were invited to discuss and see the pros and cons of bringing ICT in the
rural life of South Sindh and South Punjab. Interestingly, all panel of experts agreed that there is
serious need to implement ICT in the described areas to enhance the livelihood of the
communities.
Researchers prepared and launched questionnaires for the communities involved in the
agriculture, fisheries and livestock. We also focused on the unemployed workforce in the
communities. In the unemployed part, it was checked how community member without job can
benefit from the ICT implementation in South Sindh and South Punjab.
Page 15 of 66
DATA ANALYSIS
Data gathering method, measurement instrument and method of analysis are described in this
section. In this research we developed three different questionnaires based on the specific
requirements of our targeted sample. The questionnaires comprised of Likert Scale in which 1
indicated “Strongly Disagree” and 5 indicated “Strongly Agree”. The sample population
comprised of agriculture, fisheries and livestock of the rural areas of south Punjab and south
Sindh in order to identify their ICT perception.
For response taking purpose the enumerators were trained in a 9 hour training session in order to
provide full understanding of instrument interpretation and customer services skills. The
responses from the target audience were then recorded by the enumerators on the questionnaire
in a one on one meeting in 25 villages of south Punjab and south Sindh in Pakistan.
1. Data Analysis of Fisheries Instrument
In case of fisheries participants filled out 37-item questionnaire. There were 120
questionnaires distributed among the participants and 106 were usable for analysis
purpose.
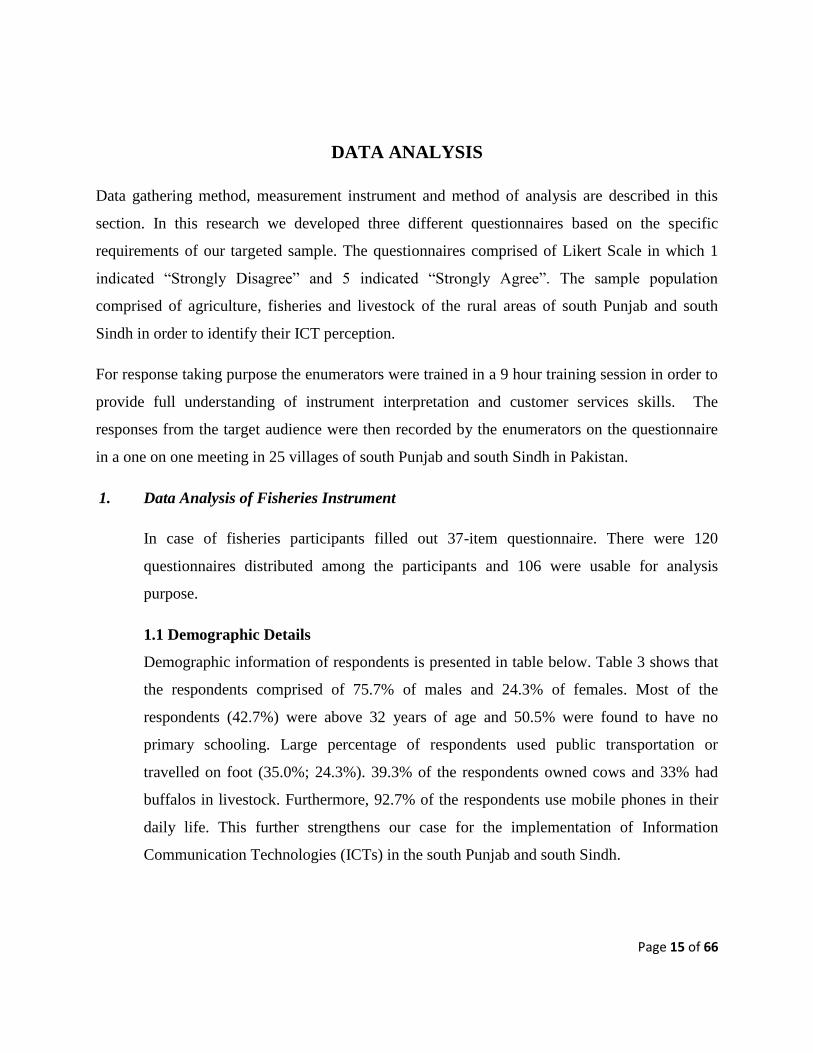
1.1 Demographic Details
Demographic information of respondents is presented in table below. Table 3 shows that
the respondents comprised of 75.7% of males and 24.3% of females. Most of the
respondents (42.7%) were above 32 years of age and 50.5% were found to have no
primary schooling. Large percentage of respondents used public transportation or
travelled on foot (35.0%; 24.3%). 39.3% of the respondents owned cows and 33% had
buffalos in livestock. Furthermore, 92.7% of the respondents use mobile phones in their
daily life. This further strengthens our case for the implementation of Information
Communication Technologies (ICTs) in the south Punjab and south Sindh.

Page 16 of 66
Table 3: Gender
Male 100
Figure 2: GENDER OF FISHERIES PARTICIPANT
Table 4: Age 15-20 years 12.3
21-26 years 27.4
27-32 years 30.2
Above 32 years 30.2
Figure 3: AGE OF THE FISHERIES PARTICIPANTS
Graphical Presentation of Fisheries

Page 17 of 66
Table 5: Education (%)
No formal schooling
36.8 Primary school
27.4 High school 14.2 Matriculation
4.7 Intermediate
11.3 Graduation 3.8 Master 1.9
Figure 4: EDUCATION OF THE FISHERIES PARTICIPANT
Table 6: Income Source
Fisheries 100
Figure 5: INCOME SOURCE OF THE FISHERIES PARTICIPANT

Page 18 of 66
Table 7: Transportation (%)
on foot 18.9 public transportation
44.3 private vehicle
23.6 2-0r-3 wheel
10.4 vehicle(motorbike, tricycle,
bicycle)
2.8
Table 8: Monthly Income %
5,000-15,000 91.5
16,000-26,000 7.5
27,000-37,000 0.9
Figure 7: MONTHLY INCOME OF THE FISHERIES PARTICIPANT
Figure 6: TRANSPORTATION OF THE FISHERIES PARTICIPANT

Page 19 of 66
Table 9: ICT Services Land line 0.9
Mobile phones
86.8 System 12.3
Figure 8: ICT SERVICES OF THE FISHERIES PARTICIPANT
Table 10: Demographics
Variable Items Frequency Percent
Gender Male 106 100.0
Age 15-20 years 13 12.3
21-26 years 29 27.4
27-32 years 32 30.2
above 32 years 32 30.2
Education No formal schooling 39 36.8
Primary school 29 27.4
High school 15 14.2
Matriculation 5 4.7
Intermediate 12 11.3
Graduation 4 3.8
Page 20 of 66
Master 2 1.9
Income source fisheries 106 100.0
Transportation on foot 20 18.9
public transportation 47 44.3
private vehicle 25 23.6
2-0r-3 wheel 11 10.4
vehicle(motorbike, tricycle,
bicycle)
3 2.8
Monthly_income 5,000-15,000 97 91.5
16,000-26,000 8 7.5
27,000-37,000 1 .9
ICT_Services Land line 1 .9
Mobile phones 92 86.8
System 13 12.3
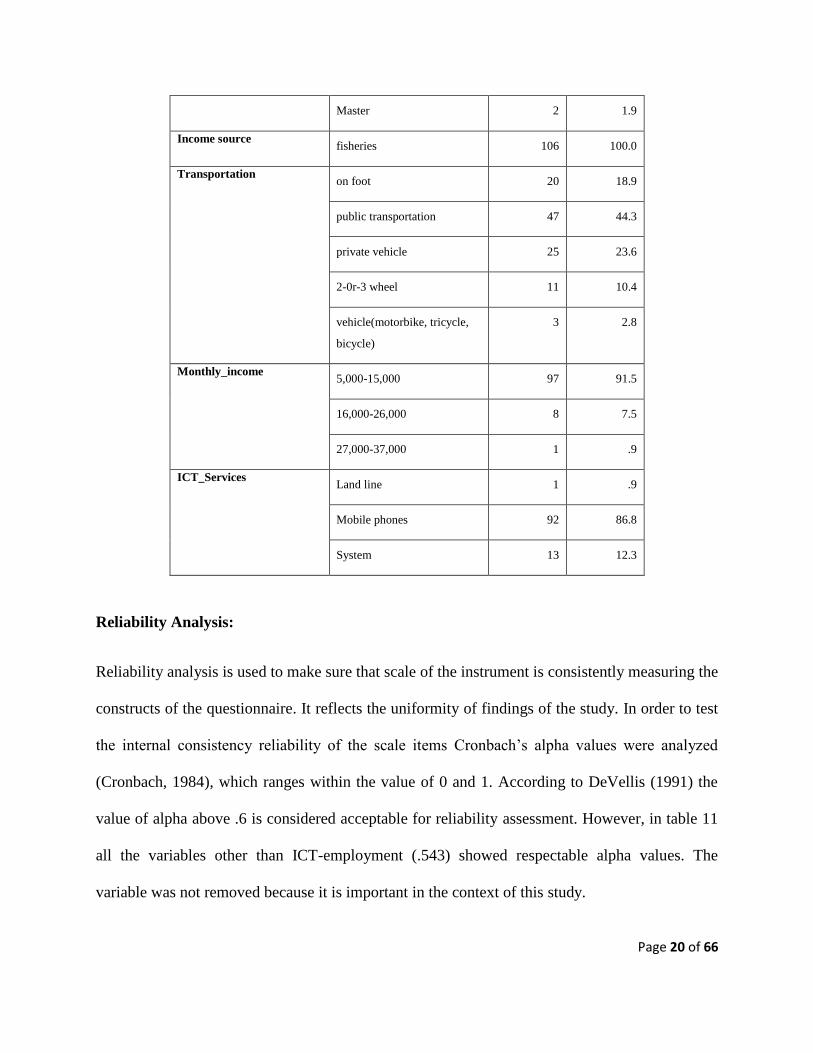
Reliability Analysis:
Reliability analysis is used to make sure that scale of the instrument is consistently measuring the
constructs of the questionnaire. It reflects the uniformity of findings of the study. In order to test
the internal consistency reliability of the scale items Cronbach’s alpha values were analyzed
(Cronbach, 1984), which ranges within the value of 0 and 1. According to DeVellis (1991) the
value of alpha above .6 is considered acceptable for reliability assessment. However, in table 11
all the variables other than ICT-employment (.543) showed respectable alpha values. The
variable was not removed because it is important in the context of this study.

Page 21 of 66
Table 11: Reliability analysis
Principal Component Analysis (PCA)
Principal Component Analysis (PCA) is a statistical method which explains the covariance
structure of a set of variables. In particular it allows us to identify the principal directions in
which the data varies (“Principle component analysis” n.d). Principal component analysis was
conducted on 37 items in order to identify the underlying perception of the rural farmers on
behavior intention to use ICT and also to screen the items. The items having factor loading of at
least .60 were kept in the measurement scale. PCA resulted in Kaiser-Meyer-Olkin Measure
(KMO) value of .838 for ICT-daily usage. Similarly, table 5 shows significant KMO values of
ICT-health (.845), ICT-fisheries (.784) and behavior intention (.602). However, ICT-
employment revealed the KMO value of .570 which is acceptable because it’s closer to the
minimum acceptable value of .60. Furthermore, ICT-daily usage explains 52.597% of the total
variance; ICT-health 49.21% of the total variance; ICT-fisheries 48.348% of the variance; ICT-
employment 52.81% of the variance and behavior intention explaining total variance of 56.52%.
Variables No. of Items Cronbach's
Alpha
ICT Usage in Daily Life 7 .848
ICT – Health 8 .849
ICT - Fisheries 8 .847
ICT - Employment 3 .543
Behavior Intention 3 .613

Page 22 of 66
Table 12: Principal Component Analysis (PCA)
Variables KMO Factor
Loading
Total
Variance
Explained
ICT_1 .838 .739 52.597
ICT_2 .685
ICT_3 .777
ICT_5 .769
ICT_6 .738
ICT_7 .636
ICT_8 .722
Health_1 .845 .725 49.21
Health_2 .730
Health_3 .704
Health_4 .800
Health_6 .658
Health_7 .639
Health_8 .691
Health_9 .650
Fisheries_3 .784 .750 48.348
Fisheries_4 .763
Fisheries_5 .635
Fisheries_6 .701

Page 23 of 66
Fisheries_7 .672
Fisheries_8 .742
Fisheries_10 .632
Fisheries_12 .654
ICT_EMP_1 .570 .671 52.810
ICT_EMP_2 .816
ICT_EMP_3 .684
BI_1 .602 .771 56.52
BI_2 .653
BI_3 .821
Kaiser-Meyer-Olkin Measure of Sampling Adequacy (KMO).
Regression Analysis
Regression analysis is a statistical procedure used for estimating the relationships
between variables. It facilitates identification of the relationship among variables (Sykes,
2011). Therefore, table 13 shows the relationship between the predictor variables and the
dependent variables. The coefficient of determination (R²) measures the degree of
variance in the mean of the dependent variable explained by the independent variable.
The (R²) value is 54.5% which means that the regression model explained 54.5% of the
variance in behavior intention. The explanatory power of regression model is considered
good as the value of R² is on the higher side.
Table 13: Model Summary
Model R R Square Adjusted R Square
Std. Error of the
Estimate
1 .738a .545 .527 .30589
a. Predictors: (Constant), ICT and Employment, ICT Usage in Daily Life, ICT
and Fisheries, ICT and Health

Page 24 of 66
Table 14: Coefficients
Model
Unstandardized Coefficients
Standardized
Coefficients
Sig. B Std. Error Beta
1 (Constant) .950 .336 .006
.788
.066
.004
.002
ICT - Daily Life Usage -.034 .125 -.037
ICT – Health .259 .140 .282
ICT – Fisheries .314 .107 .332
ICT - Employment .261 .082 .267
a. Dependent Variable: Behavior Intention
Furthermore, table 14 provides the beta value of the variables along with their
significance level. The highest the significant value of an item the greatest unique
contribution it makes to the dependent variable. The significance value reveals whether
the relationship among the variables is significant or insignificant. A value of greater than
.05 indicates insignificance and a value of less than .05 explain significance. ICT-
fisheries have the highest Beta value of .332 and significance value of .004, meaning that
the variable makes significant contribution to behavior intention. Similarly, ICT-
employment also makes significant contribution to behavior intention (β=.002, P=.002).
ICT- daily usage and health indicated low unique insignificant contribution to behavior
intention (p=.788).
OVERALL ANALYSIS OF FISHERIES:
Table 11: The internal consistency reliability measures whether the different items that
are proposed to measure the same concept provide similar scores. The chronbach’s alpha
value in this table reveals appropriate internal consistency reliability among all the
variables except ICT-employment as the values are above 0.6. However, ICT-
employment having alpha value of .53 was not removed because of its importance in the
context of the study.
Table 12:
KMO Value: It explains if the factor analysis is appropriate or not. The KMO values in
table 12 lie between the benchmark of 0.5 and 1.0 which shows the appropriateness of
factor analysis.

Page 25 of 66
Total Variance Explained: It indicates how much one unit change in independent variable
brings change in to the dependent variable.
Table 13:
R: It is the square root of R square.
R Square: It explains “goodness of fit” of the model i.e. how well the observations fit in
to the model. The R square in the model is .545 which means that the independent
variables (ICT Usage in Daily Life, ICT – Health, ICT – Fisheries and ICT –
Employment) can explain 54.5% of change in the dependent variable.
Adjusted R square: It measures the amount of variance in the dependent variable
(Behavior Intention) explained by variations in the independent variables. The adjusted R
square demonstrates that 52.7% variance was explained in this model.
Std. Error of the Estimate: It explains standard deviation of the error terms (Factors not
included in this model which could affect ICT behavior intention).
Table 14:
Coefficients: In regression with multiple independent variables, the coefficient explains
the degree to which dependent variable is expected to increase when the independent
variable is increased by one unit, thereby holding all the other independent variables
constant.
Standardized Coefficients: In order to compare different variables only standardized
estimates will be checked as all the variables in it have the same scale.
Beta and Sig : Beta explains the contribution of each independent variable. ICT-Fisheries,
with beta coefficient of .332 and sig. value of .004 make the strongest unique
contribution in explaining behavior intention to use ICT. Similarly ICT-Employment also
explains ICT usage behavior intention significantly (Beta= 267; p = .002). However ICT
daily life usage and ICT-Health do not significantly predict behavior intention because
the Sig. value is above .05.
Therefore, all the statistical test applied in this research after thorough literature review
suggests there is strong relationship between ICT and the fisheries communities. ICT
implementation would support communities involved in the fisheries and daily life usage
activities will result in positive behavioral intention to acceptance and use of ICT.

Page 26 of 66
Data Analysis of Agriculture Instrument
Demographic Details
In case of agriculture participants filled out 36-item questionnaire. There were 250
questionnaires distributed among the participant and 212 were usable for analysis
purpose.
The demographic detail of the respondents revealed that 81.6% of the respondents were
male. 47.2 % of the respondents were above the age of 32 and 50.5% received no formal
education. On the other hand only 24.1% had primary school level education. Most of the
respondents used 2-or-3 wheeled transport (26.9), public transport (23.6) or travelled on
foot (23.1). The monthly income level of 84% of the respondents was Rs. 5,000-15,000.
Interestingly 88.3 % of the respondents used mobile phones.

Page 27 of 66
Table 15: Gender % Male 81.6
Female 18.4
Figure 9: GENDER OF THE AGRICULTURE PARTICIPANT
Table 16: Age %
15-20 years 21 9.9 21-26 years 24.5 27-32 years 18.4 Above 32 years 47.2
Figure 10: AGE OF THE AGRICULTURE PARTICIPANT
Graphical Presentation of Agriculture
Page 28 of 66
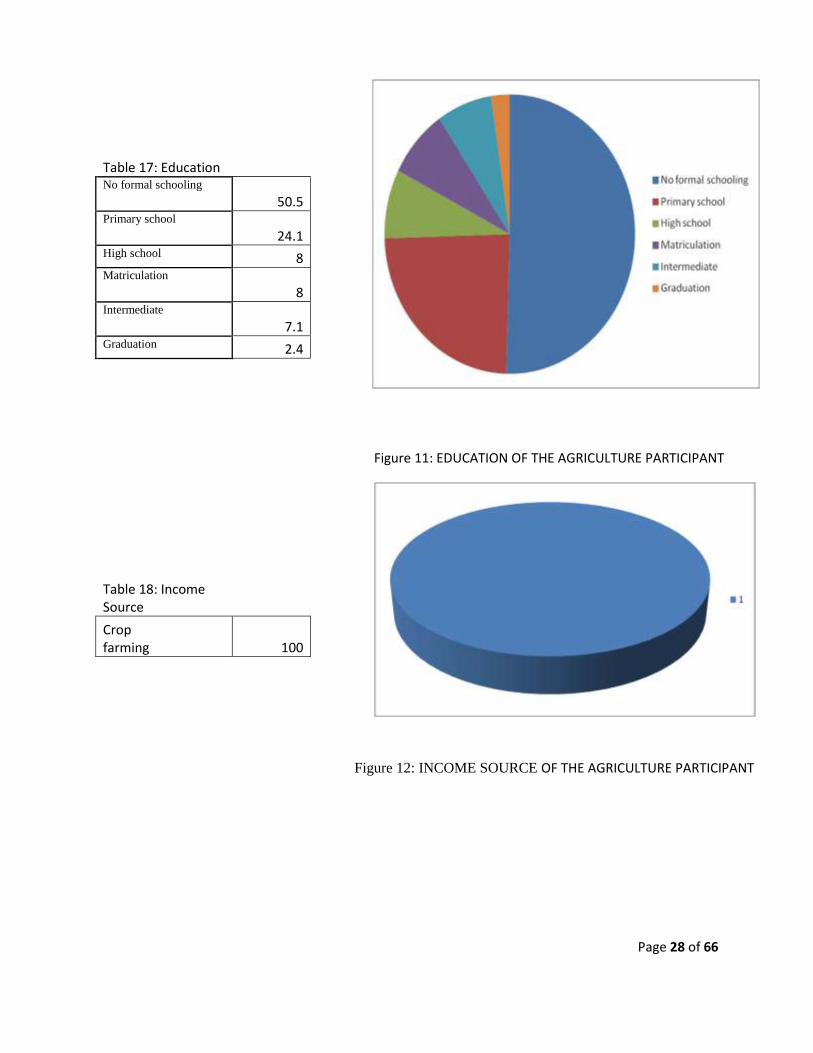
Table 17: Education
No formal schooling
50.5 Primary school
24.1 High school 8 Matriculation
8 Intermediate
7.1 Graduation 2.4
Figure 11: EDUCATION OF THE AGRICULTURE PARTICIPANT
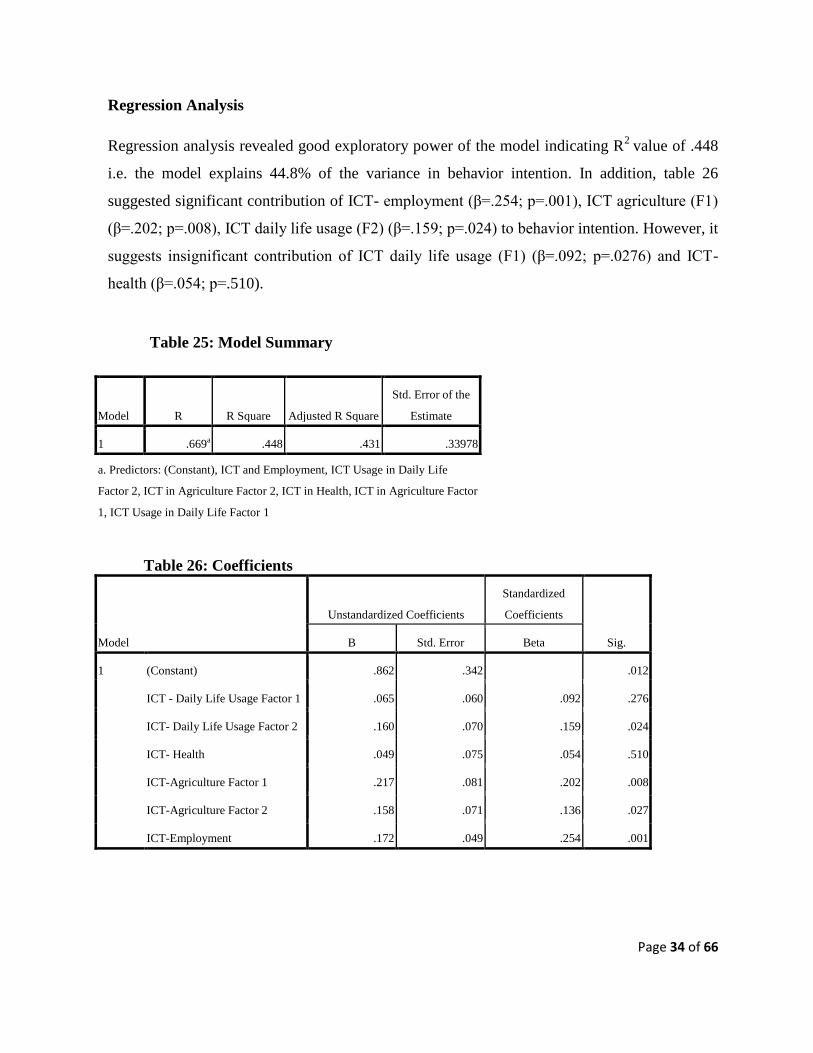
Table 18: Income Source
Crop farming 100
Figure 12: INCOME SOURCE OF THE AGRICULTURE PARTICIPANT

Page 29 of 66
Table 19 Transportation
on foot 23.1 public transportation 23.6 private vehicle 15.6 2-0r-3 wheel 26.9 vehicle(motorbike,
tricycle, bicycle) 10.8
Figure 13: Transportation OF THE AGRICULTURE PARTICIPANT
Figure 14: MONTHLY INCOME OF THE AGRICULTURE PARTICIPANT
Table 20: Monthly Income
5,000-15,000
84 16,000-26,000
5.2 27,000-37,000
1.4 Above 38,000
0.5 Missing System
9

Page 30 of 66
Table 21: ICT Services
Land line 0.5 Internet 0.5 Mobile phones 88.3 Computer 1.4 Internet Café
0.5 Other 5.1 System 3.7
Figure 15: ICT Services for AGRICULTURE PARTICIPANTS

Page 31 of 66
Table 22: Demographics
Reliability Analysis
Table 23 provided the Cronbach’s alpha depicting internal consistency reliability among the
items of measurement instrument. The alpha value of ICT- daily life usage (F1).805 and ICT-
Variable Item Frequency Percent Gender
Male 173 81.6
Female 39 18.4
Age 15-20 years 21 9.9
21-26 years 52 24.5
27-32 years 39 18.4
Above 32 years 100 47.2
Education No formal schooling 107 50.5
Primary school 51 24.1
High school 17 8.0
Matriculation 17 8.0
Intermediate 15 7.1
Graduation 5 2.4
Income source Crop farming 212 100.0
Transportation On foot 49 23.1
Public transportation 50 23.6
Private vehicle 33 15.6
2-0r-3 wheel 57 26.9
Vehicle(motorbike, tricycle,
bicycle)
23 10.8
Monthly income 5,000-15,000 178 84.0
16,000-26,000 11 5.2
27,000-37,000 3 1.4
Above 38,000 1 .5
Missing System 19 9.0
ICT-Services Land Line 1 .5
Internet 1 .5
Mobile phones 189 88.3
Computer 3 1.4
Internet Café 1 .5
Other 11 5.1
Missing System 8 3.7

Page 32 of 66
daily life usage (F2) .650 was found acceptable. Similarly, ICT-health, ICT-agriculture (F1),
ICT-agriculture (F2), ICT- employment and behavior intention exhibit high level of
reliabilities.
Table 23: Reliability Analysis
Variables No. of Items Cronbach's Alpha
ICT - Daily Life Usage (F1) 4 .805
ICT - Daily Life Usage (F2) 3 .650
ICT – Health 7 .825
ICT- Agriculture (F1) 5 .769
ICT - Agriculture (F2) 3 .618
ICT – Employment 3 .827
Behavior Intention 3 .725
Principal Component Analysis
In order to check the internal consistency reliability among the items the Principal component
analysis was conducted on 36 items of the measurement. PCA produced two factors. The KMO
value of ICT-daily life usage (F1) is .720 and it explained 63.153% of the total variance. ICT-
daily life usage (F2) provided a KMO value of .656 and explained total variance of 58.929%.
The total variance explained by ICT-health with a KMO value of .817 is 49.422%. ICT-
agriculture (F1) with KMO value of .766 and ICT-agriculture (F2) with KMO value of
.581explained total variance of 52.137% and 56.799%. Lastly, ICT-employment (KMO= .725)
explained total variance of 75.109% and behavior intention (KMO=.625) explained 64.606%
of the total variance.

Page 33 of 66
Table 24: Principal Component Analysis
Variables KMO Factor
Loading
Total
Variance
Explained
ICT_5(F1)
.720
.631
63.153 ICT_6(F1) .773
ICT_7(F1) .891
ICT_8(F1) .858
ICT_1(F2)
.656 .781
58.929
ICT_2(F2) .760
ICT_3(F2) .762
Health_1
.817
.652 49.422
Health_5 .683
Health_6 .706
Health_7 .691
Health_8 .730
Health_9 .744
Health_10 .710
Agriculture_3(F1)
.766
.686
52.137
Agriculture_4(F1) .673
Agriculture_5(F1) .777
Agriculture_6(F1) .726
Agriculture_7(F1) .743
Agriculture_9(F2)
.581 .666
56.799 Agriculture_11(F2) .841
Agriculture_12(F2) .743
ICT_EMP_1
.725 .856
75.109 ICT_EMP_2 .857
ICT_EMP_3 .856
BI_1
.625
.700
64.606 BI_2 .831
BI_3 .871
Kaiser-Meyer-Olkin Measure of Sampling Adequacy (KMO).
Page 34 of 66
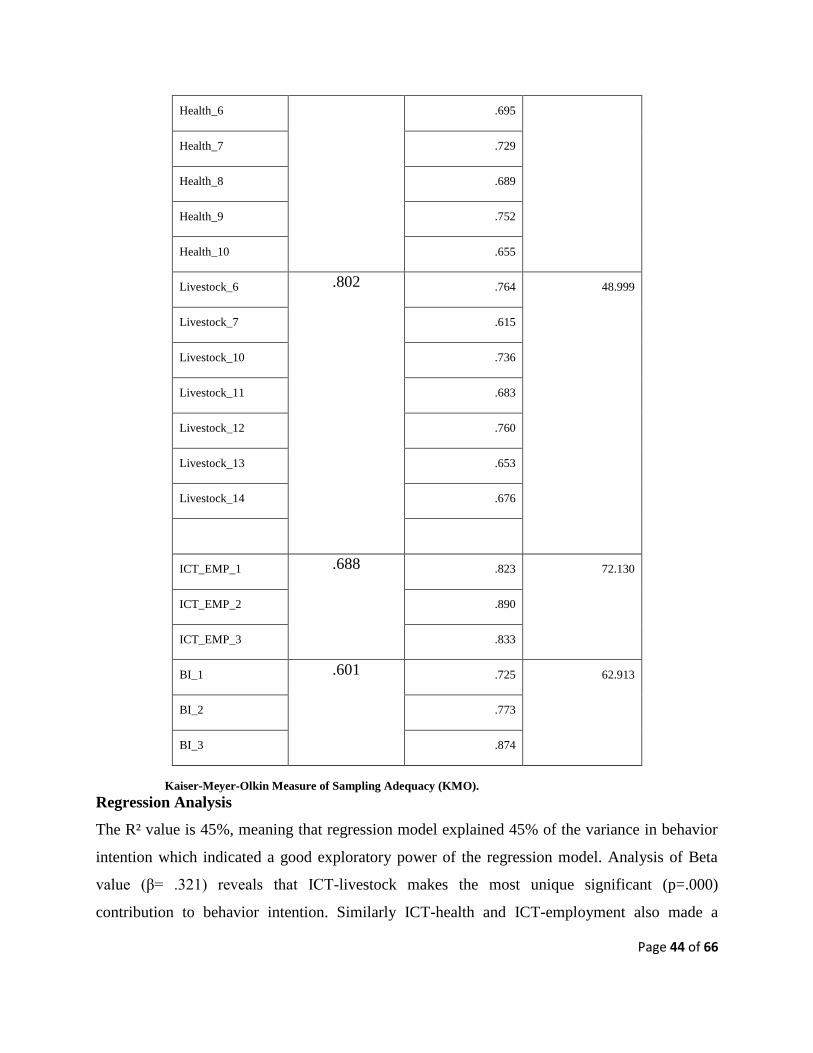
Regression Analysis
Regression analysis revealed good exploratory power of the model indicating R2
value of .448
i.e. the model explains 44.8% of the variance in behavior intention. In addition, table 26
suggested significant contribution of ICT- employment (β=.254; p=.001), ICT agriculture (F1)
(β=.202; p=.008), ICT daily life usage (F2) (β=.159; p=.024) to behavior intention. However, it
suggests insignificant contribution of ICT daily life usage (F1) (β=.092; p=.0276) and ICT-
health (β=.054; p=.510).
Table 25: Model Summary
Model R R Square Adjusted R Square
Std. Error of the
Estimate
1 .669a .448 .431 .33978
a. Predictors: (Constant), ICT and Employment, ICT Usage in Daily Life
Factor 2, ICT in Agriculture Factor 2, ICT in Health, ICT in Agriculture Factor
1, ICT Usage in Daily Life Factor 1
Table 26: Coefficients
Model
Unstandardized Coefficients
Standardized
Coefficients
Sig. B Std. Error Beta
1 (Constant) .862 .342 .012
ICT - Daily Life Usage Factor 1 .065 .060 .092 .276
ICT- Daily Life Usage Factor 2 .160 .070 .159 .024
ICT- Health .049 .075 .054 .510
ICT-Agriculture Factor 1 .217 .081 .202 .008
ICT-Agriculture Factor 2 .158 .071 .136 .027
ICT-Employment .172 .049 .254 .001

Page 35 of 66
OVER ALL ANALYSIS OF AGRICULTURE
Table 23:
Reliability Analysis: The internal consistency reliability measures whether the different items
that are proposed to measure the same concept provide similar scores. The chronbach’s alpha
value indicates appropriate internal consistency reliability among all the independent variables as
the values are above the bencmark 0.6.
Table 24:
KMO Value: It explains if the factor analysis is appropriate or not. The KMO values in table 24
lie between the benchmark of 0.5 and 1.0 which shows the appropriateness of factor analysis.
Total Variance Explained: It indicates how much one unit change in independent variable brings
change in to the dependent variable.
Table 25:
R: It is the square root of R square.
R Square: It explains “goodness of fit” of the model i.e. how well the observations fit in to the
model. The R square in the model is .448 which means that the independent variables (ICT
Usage in Daily Life (F1) (F2), ICT – Health, ICT – Agriculture (F1) F2) and ICT –
Employment) can explain 44.8% of change in the dependent variable.
Adjusted R square: It measures the amount of variance in the dependent variable (Behavior
Intention) explained by variations in the independent variables. The adjusted R square
demonstrates that 43.1% of the variance was explained in this model.
Std. Error of the Estimate: It explains the standard deviation of the error terms (Factors not
included in this model which could affect ICT behavior intention).
Table 26:
Coefficients: In regression with multiple independent variables, the coefficient explains the
degree to which dependent variable is expected to increase when the independent variable is
increased by one unit, thereby holding all the other independent variables constant.
Standardized Coefficients: In order to compare different variables only standardized estimates
will be checked as all the variables in it have the same scale.
Beta and Sig.: Beta explains the contribution of each independent variable. ICT-Employment
with beta coefficient of .254 and sig. value of .001 makes the strongest unique contribution in

Page 36 of 66
explaining behavior intention to use ICT. Similarly ICT agriculture (F1) (β=.202; p=.008) and
ICT daily life usage (F2) (β=.159; p=.024) also impact behavior intention significantly. On the
other hand, ICT daily life usage (F1) (β=.092; p=.0276) and ICT-health (β=.054; p=.510) with
sig. values above 0.5 indicate no significant impact of behavior intention to use ICT.
The statistical tests applied in case of agriculture also suggest there is strong relationship
between ICT and agriculture. Therefore, the farmers perceived that ICT implementation would
improve the delivery of information related to markets, products and services to agriculture
sector, enhance employment opportunities and daily activities.
Farmers believe that implementation of ICT in their communities would have direct positive
impact on their livelihood.
Data analysis of Livestock Instrument
The participants of the study in livestock filled out a 38-item questionnaire. There were 250
questionnaires distributed among the participants based on convenient sampling. Among 250
questionnaires, 206 were usable for analysis purpose.
Demographic
Demographic information of respondents is presented in table below. Table 1 show that the
respondents comprised of 100% males with most of the respondents in the age group of 27-32
and above 32. Most of the respondents had no formal schooling (36.8%) and only 27% had
received primary school education. Results revealed that 44% of the respondents’ used public
transportation and 91% had an income level within the Rs. 5000-15000 range. Furthermore,
mobile phones (86.8%) were indicated as the most used Information Communication
Technology (ICT)

Page 37 of 66
Graphical Presentation of Livestock
Table 27: Gender
Figure 16: GENDER OF THE LIVESTOCK PARTICIPANT
MEN 75.7
WOMEN 24.3
Table 28: Age
Figure 17: AGE OF THE LIVESTOCK PARTICIPANT
15-20 years 8.3
21-26 years 28.2
27-32 years 20.9
above 32 years 42.7

Page 38 of 66
Table 29: Education
No formal
schooling
50.5
Primary
school
32
High school 7.8
Matriculation 4.9
Intermediate 4.4
Graduation 0.5
Figure 18: EDUCATION OF THE LIVESTOCK PARTICIPANTS
Table 30 : Income Source
Livestock keeping 100
Figure 19: INCOME SOURCE OF THE LIVESTOCK PARTICIPANT

Page 39 of 66
Table 31: Transportation
Figure 20: TRANSPORTATION OF THE LIVESTOCK PARTICIPANT
on foot 24.3
public transportation 35
private vehicle 19.4
2-0r-3 wheel 19.4
vehicle(motorbike,
tricycle, bicycle)
1.9
Table 32: Monthly Income
Figure 21: MONTHLY INCOME OF THE LIVESTOCK PARTICIPANT
5,000-15,000 86.4
16,000-26,000 6.8
27,000-37,000 1.5
Above 38,000 1
Missing System 4.4

Page 40 of 66
Table 33 : Livestock
Horses 1
Goats 18.9
Cows 39.3
Buffalos 33
Poultry 7.8
Figure 22: LIVESTOCK OF THE LIVESTOCK
PARTICIPANT
Table 34: ICT services
Land line 0.5
Mobile phones 92.7
Computer 1
Other 5.3
System 0.5
Figure 23: ICT SERVICES OF THE LIVESTOCK
PARTICIPANT

Page 41 of 66
Table 35: Demographics
Variable Items Frequency Percent
Gender Male 156 75.7
Female 50 24.3
Age 15-20 years 17 8.3
21-26 years 58 28.2
27-32 years 43 20.9
above 32 years 88 42.7
Education No formal schooling 104 50.5
Primary school 66 32.0
High school 16 7.8
Matriculation 10 4.9
Intermediate 9 4.4
Graduation 1 .5
Income source livestock keeping 206 100
Transportation on foot 50 24.3
public transportation 72 35.0
private vehicle 40 19.4
2-0r-3 wheel 40 19.4
vehicle(motorbike, tricycle, bicycle) 4 1.9
Monthly income 5,000-15,000 178 86.4
16,000-26,000 14 6.8
27,000-37,000 3 1.5

Page 42 of 66
Above 38,000 2 1.0
Missing System 9 4.4
Livestock Horses 2 1.0
Goats 39 18.9
Cows 81 39.3
Buffalos 68 33.0
Poultry 16 7.8
ICT Services Land line 1 .5
Mobile phones 191 92.7
Computer 2 1.0
other 11 5.3
System 1 .5
Reliability Analysis
The reliability analysis conducted through Cronbach alpha reveals significant alpha values for all
the variables. ICT-daily life usage (.844), ICT-health (.861), ICT-livestock (.822), ICT-
employment (.804) and behavior intention (.698) showed acceptable Cronbach alpha value.
Table 36: Reliability
Variables No. of Items Cronbach's Alpha
ICT Usage in Daily Life 7 .844
ICT and Health 9 .861
ICT and Livestock 7 .822
ICT and Employment 3 .804

Page 43 of 66
Behavior Intention 3 .698
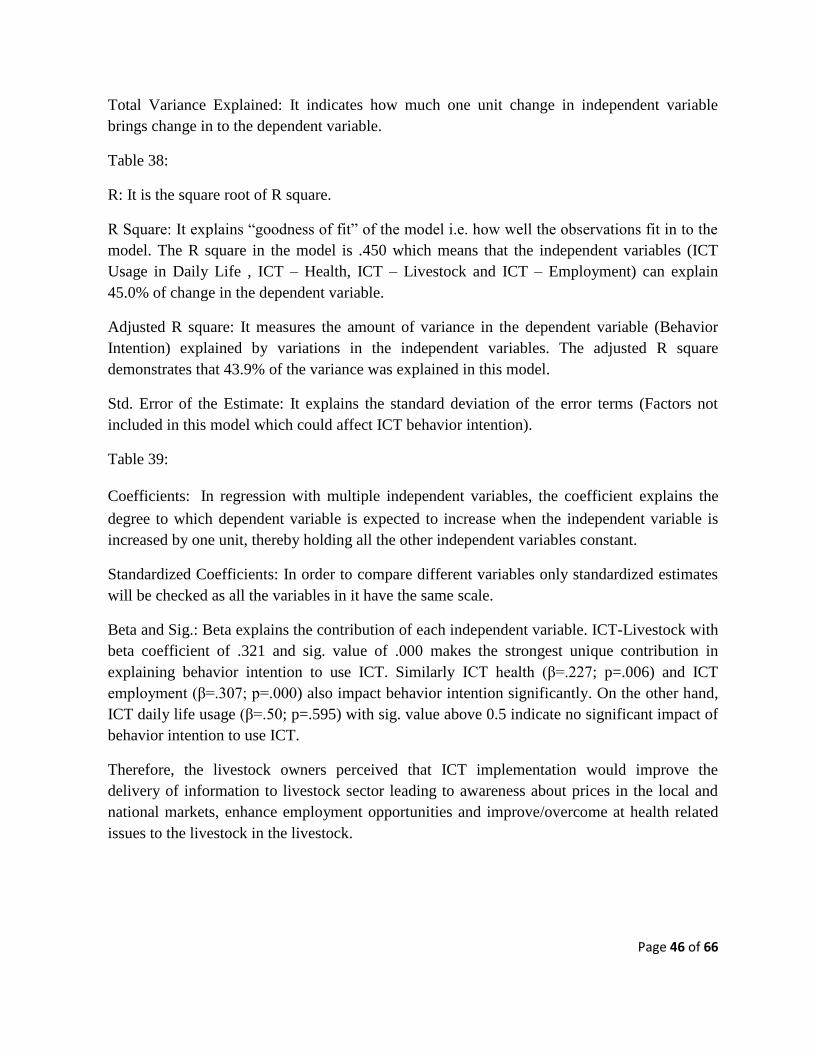
Principal Component Analysis
PCA carried out on the 39 items of the livestock measurement scale revealed the KMO values,
factor loadings and total variance explained by the variables. Factor loadings less than .60 were
removed from the measurement scale. ICT-daily usage indicated a KMO value of .832 and
explained a total variance of 52.165%. Similarly, the results revealed significant KMO value of
ICT-health (.850) and ICT-livestock (.802) and explained total variance of 47.883% and
48.999%. Furthermore, the KMO values of ICT-employment (.688) and ICT-behavior intention
(.601) were also found significant and explained total variance of 72.130% and 62.913%.
Table 37: Principal Component Analysis
Variables KMO Factor Loading Total Variance
Explained
ICT_1 .832 .605 52.165
ICT_3 .675
ICT_4 .581
ICT_5 .701
ICT_6 .728
ICT_7 .847
ICT_8 .868
Health_1 .850 .647 47.883
Health_2 .680
Health_3 .672
Health_5 .703
Page 44 of 66
Health_6 .695
Health_7 .729
Health_8 .689
Health_9 .752
Health_10 .655
Livestock_6 .802 .764 48.999
Livestock_7 .615
Livestock_10 .736
Livestock_11 .683
Livestock_12 .760
Livestock_13 .653
Livestock_14 .676
ICT_EMP_1 .688 .823 72.130
ICT_EMP_2 .890
ICT_EMP_3 .833
BI_1 .601 .725 62.913
BI_2 .773
BI_3 .874
Kaiser-Meyer-Olkin Measure of Sampling Adequacy (KMO). Regression Analysis
The R² value is 45%, meaning that regression model explained 45% of the variance in behavior
intention which indicated a good exploratory power of the regression model. Analysis of Beta
value (β= .321) reveals that ICT-livestock makes the most unique significant (p=.000)
contribution to behavior intention. Similarly ICT-health and ICT-employment also made a

Page 45 of 66
significant contribution to the dependent variable (β=.227, p=.006; β= .307, p=.000). However,
ICT-daily life usage contributed insignificantly to behavior intention (β=.227, p=.595).
Table 38: Model Summary
Model R R Square Adjusted R Square
Std. Error of the
Estimate
1 .671a .450 .439 .34121
a. Predictors: (Constant), ICT and Employment, livestock, ICT and
Health, ICT usage in Daily Life
Table 39 Coefficients
Model
Unstandardized Coefficients
Standardized
Coefficients
Sig. B Std. Error Beta
1 (Constant) 1.324 .269 .000
ICT usage in Daily Life -.041 .078 -.050 .595
ICT and Health .214 .077 .227 .006
Livestock .331 .077 .321 .000
ICT and Employment .213 .050 .307 .000
OVERALL ANALYSIS OF LIVESTOCK
Table 36:
Reliability Analysis: The internal consistency reliability measures whether the different items
that are proposed to measure the same concept provide similar scores. The chronbach’s alpha
values in table 36 are above the benchmark .06. Therefore, appropriate internal consistency
reliability exists among all the independent variables.
Table 37:
KMO Value: It explains if the factor analysis is appropriate or not. The KMO values in table
36 lie between the benchmark of 0.5 and 1.0 which shows the appropriateness of factor
analysis.
Page 46 of 66
Total Variance Explained: It indicates how much one unit change in independent variable
brings change in to the dependent variable.
Table 38:
R: It is the square root of R square.
R Square: It explains “goodness of fit” of the model i.e. how well the observations fit in to the
model. The R square in the model is .450 which means that the independent variables (ICT
Usage in Daily Life , ICT – Health, ICT – Livestock and ICT – Employment) can explain
45.0% of change in the dependent variable.
Adjusted R square: It measures the amount of variance in the dependent variable (Behavior
Intention) explained by variations in the independent variables. The adjusted R square
demonstrates that 43.9% of the variance was explained in this model.
Std. Error of the Estimate: It explains the standard deviation of the error terms (Factors not
included in this model which could affect ICT behavior intention).
Table 39:
Coefficients: In regression with multiple independent variables, the coefficient explains the
degree to which dependent variable is expected to increase when the independent variable is
increased by one unit, thereby holding all the other independent variables constant.
Standardized Coefficients: In order to compare different variables only standardized estimates
will be checked as all the variables in it have the same scale.
Beta and Sig.: Beta explains the contribution of each independent variable. ICT-Livestock with
beta coefficient of .321 and sig. value of .000 makes the strongest unique contribution in
explaining behavior intention to use ICT. Similarly ICT health (β=.227; p=.006) and ICT
employment (β=.307; p=.000) also impact behavior intention significantly. On the other hand,
ICT daily life usage (β=.50; p=.595) with sig. value above 0.5 indicate no significant impact of
behavior intention to use ICT.
Therefore, the livestock owners perceived that ICT implementation would improve the
delivery of information to livestock sector leading to awareness about prices in the local and
national markets, enhance employment opportunities and improve/overcome at health related
issues to the livestock in the livestock.

Page 47 of 66
CONCLUSION AND RECOMMENDATIONS
Conclusion
This pilot study revealed that the fishermen, farmers and livestock owners of southern Sindh and
southern Punjab believe that ICT will bring improvement in their work, health, employment
opportunities and hence would develop the efficiency and capacity of rural residents. Along with
information dissemination through mobile phones investments in other ICT infrastructure would
allow access not only to the national but also International markets.
Reliability Analysis, Principal Component Analysis and Regression Analysis were conducted to
analyze the data collected from the twenty five villages. All three areas (fisheries, agriculture,
live stock and unemployment) studied for this research show a strong positive relationship
between ICT and livelihood of communities involved in the fisheries, agriculture and livestock.
In addition to SPSS results, researchers organized a focus group discussion in Islamabad where
policy makers, ministry officials, civil society representatives and university professors were
invited to get their opinion on the implementation of ICT in the stated communities. The panel
stressed the need to launch the ICT project on priority basis to enhance the economic
opportunities for south Sindh and south Punjab.
Mobile telephone usage is almost 90% in all the five districts (twenty five villages) included in
this pilot study. It would be extremely important to take advantage of this mobile factor.
Communities would be better off if they are provided the opportunity to get their tasks
completed through the cell phones they carry.
Low income level, high percentage of uneducated rural population and low level of ICT
awareness requires the government and non government agencies to collaborate in building
sustainable ICT infrastructures. However, success of such initiatives requires involvement of
local population representatives as the decision makers throughout the whole process to gain
social acceptance.

Page 48 of 66
In nutshell the results of this research has proved that ICT is an important driver to put the
communities on the path of economic sustainability. The implementation ICT would not only
help the communities to have better livelihood but total awareness about what’s going on in and
around their communities.
Recommendations
Based on the results of the pilot study following recommendations are made to the involved
stakeholders in the southern Punjab and Southern Sindh.
National level consensus needs to be developed among the stakeholders about such rules and
regulations that facilitate the promotion of ICT for improving the livelihoods of rural population.
Furthermore, transparency should be maintained in all such initiatives to avoid inequity in the
implementation stage.
Dialogues need to be initiated between the government agencies and private development actors
to establish standards and protocols for secure information exchange between the involved
stakeholders.
Short message service (SMS) in local languages should be used to provide information about
market rate of goods; recommended chemicals for pest control; health service reminders;
weather forecasts and employment opportunities etc.
Message should be delivered to the rural population in local languages to avoid any resistance to
ICT usage. If required such software should be developed that enable display of local language
in ICT devices like Cell phones. Moreover, intellectual property should be protected in order to
avoid any infringement and ensure fair profits to the developers.
ICT literacy programs should be launched among the farmers, fishermen and livestock owners to
highlight the benefits of ICT for increasing their income and eventually improving their living
standards. For this purpose training workshops should be organized to ensure that the users exert
minimum effort to utilize ICTs for improving their livelihoods.
Page 49 of 66
ICT centers should be established within each village to allow them easy access to computers,
printing and fax facilities. Furthermore interactive website could be designed thereby allowing
the rural residents to share their issues online and obtain solutions from experts. In this manner
access to medical, employment related information resources can be easily provided.
Capacity building for the ICT center mangers should be conducted to facilitate successful
assistance to the rural population.
Monitoring and evaluation teams should quarterly visit the ICT centers and share progress
reports with the stakeholders.
Page 50 of 66
References About Pakistan(n.d.). Retrieved on 1
st April 2013 at 3.30.30 PM.
http://www.pakhc.or.ke/about_pakistan.html
Aker, J. C., & Mbiti, I.M. (2010). Mobile Phones and Economic Development in Africa. Journal
of Economic Perspectives, 24(3), 207-32.
Alleman, J.,Rappoport,P.,& Banerjee,A.(2010).Universalservice:anewdefinition?
Telecommunications Policy, 34(1–2), 86–91,http://dx.doi.org/ 10.1016/j.telpol.2009.11.009.
Angello, C. & Wema. (2010). Availability and usage of ICTs and e-resources by livestock
researchers in Tanzania: Challenges and ways forward. International Journal of Education and
Development using Information and Communication Technology (IJEDICT), 6 (1), 53-65.
Baskerville, R. (1991). "Risk Analysis as a Source of Professional Knowledge". Computers &
Security 10 (8): 749–764.
Cecchini, S. (2001). Back to Office Report: Information and Communications Technology for
Poverty Reduction in Rural India, Mimeo, World Bank, Washington, DC.
Cecchini, S., & Scott, C. (2003). Can information and communications technology applications
contribute to poverty reduction? Lessons from rural India. Information Technology for
Development, 10, 73–84.
Chapman, R., Slayaker, T. & Young, J.(2004). Livelihoods approaches to information and
communication in support of rural poverty elimination and food security and food security,
Overseas development institute, UK: Department of International Development and Food and
Agriculture Organization.
Devellis, R. F. (1991). Scale development: Theory and applications. Newbury Park, CA: Sage.
Cronbach, J. (1984). Essentials of psychological testing. New York: Harper & Row.
Dorr, N., & Fine, D.(2010). South Africa in the spotlight: An interview with Deputy President
Kgalema Motlanthe. McKinsey Quarterly
Dutta, S., & Das, S.(2011). ICT and Rural Infrastructure: Cases from Indian Rural Sector. The
IUPJournal of Infrastructure, IX ( 4), 37-46.
Hair, J. F. Jr. Black, W. C., Babin, B. J. Anderson, R. E. and Tatham, R. L. (2006).
Multivariate data analysis. 6th ed. New Jersey: Prentice Hall.
Huyer, S. (2005).Women, ICT and the information society: Global perspectives and initiatives.
ACM International Conference Proceeding Series, 126.

Page 51 of 66
Iftikhar, P. 2012. Universal service fund telecom for all. Retrieved on 28th
March 2013 at 7.20.55 PM.
http://usf.org.pk/FCKeditor/editor/filemanager/connectors/aspx/UserFiles/resources/newsletters/
USF%20Presentation%20at%20Secretaries%20IT-Edu%20Conference%20.pdf
Industry Overview. Retrieved on 24th
March 2013 at 2.20.15 PM.
http://www.pseb.org.pk/industry-overview.html
InfoDev. (2010). Overview. Retrieved on 26th
March 2013 at 7.20.55 PM.
http://www.infodev.org/en/Page.About.html.
Irny, S.I. and Rose, A.A. (2005) “Designing a Strategic Information Systems Planning
Methodology for Malaysian Institutes of Higher Learning (isp- ipta), Issues in Information
System, Volume VI, No. 1, 2005.
Jensen, R. (2007). The digital provide: Information (technology), market performance, and
welfare in the South Indian sheries sector. The Quarterly Journal of Economics, 122(3), 879–
924.
Johnstone J. (2007). "Technology as empowerment: a capability approach to computer ethics."
Ethics and Information Technology 9(1): 73-87.
Jukka, J., & Pohjola, M. (2002). Economic growth in the new economy: Evidence from
advanced economies. Information Economics and Policy, 14, 189–210.
Kapange, B. (2002). “ICTs and National Agricultural Research Systems–e-Development for the
Grassroots: The Tanzania Case”. Retrieved on 27th March, 2013 at 6.30.47 PM from
http://www.dgroups.org/groups/iNARS/docs/thinkpiecetanzania.doc?OutsideInServer=rules.
Kiiza, B., G. Pederson. (2012). ICT-based Market Information and Adoption of Agricultural
Seed. Technologies: Insights from Uganda, Journal of Telecommunication Policy, 253-259.
Madon, S. (2000). The Internet and socio-economic development: Exploring the interaction.
Information Technology and People, 13(2), 85–101.
Mamaghani, F. (2010). The social and economic impact of information and communication
technology on developing countries: An analysis. International Journal of Management, 27(3),
607-615,777.
Mathur, A., & Ambani, D. (2005). ICT and rural societies: Opportunities for growth. The
International Information & Library Review, 37(4), 345-351.
Merriam–Webster (2013) entry - Methodology Usage Notes.
Page 52 of 66
Meso, P., Datta, P., & Mbarika, V. (2005). Moderating information and communication
technologies‟ influences on socioeconomic development with good governance: A study of the
developing countries. Journal of the American Society for Information Science and Technology,
57, 186–197.
Muto, M., &Yamano. T. (2009). The Impact of Mobile Phone Coverage Expansion on Market
Participation: Panel Data Evidence from Uganda. World Development, 37(12), 1887–96.
Ngwenyama, O., Andoh-Baidoo, F. K., Bollou, F., & Morawczynski, O. (2006). Is there a
relationship between ICT, health, education and development? An empirical analysis of five
West African countries from 1997–2003. EJISDC: The Electronic Journal on Information
Systems in Developing Countries, 23(5), 1–11.
Omar, S.Z., and Chhachhar, A.R.(2012).A Review on the Roles of ICT Tools towards the
Development of Fishermen, Journal of Basic and Applied Scientific Research, 2(10),9905-9911.
Patterson. J., Lindén, E., Bierbrier, C.,r Löfgren I., & Edward, J.K. (2008). Community-based
adult education to fisher women of Rajapalyam fishing village, India. Australian Journal of
Adult Learning, 48 (2), 399 - 405.
Pakistan Economic Survey (2012) Accessed on February 15th
2013 at 8.30.58 PM.
http://www.finance.gov.pk/survey/chapter_12/10-Education.pdf
Pohjola, M. (2001). Information technology, productivity, and economic growth: International
evidence and implications for economic development. London: Oxford University Press.
Principle Component Analysis(n.d.). Retrieved on 2st
May 2013 at 5.10.30 PM.
http://www.doc.ic.ac.uk/~dfg/ProbabilisticInference/IDAPILecture15.pdf
Soriano, C., R. R. (2007). Exploring the ICT and Rural Poverty Reduction Link : Community
Telecenters and Rural Livelihoods in Wu ‟ an , China . Information Systems Journal, 32 (1), 1-
15.
Stienen, J., Bruinsma,W., & F. Neuman.(2007). How ICT Can Make a Difference in Agricultural
Livelihoods,the Commonwealth Ministers Reference Book, the Netherlands.
Sykes, A., O. (2011). An Introduction to Regression Analysis. The Inaugural Coarse Lecture.
Retrieved on April 4th
2013 at 7.30.45 PM.
http://www.law.uchicago.edu/files/files/20.Sykes_.Regression.pdf.
Telecom Indicators. 2013. Retrieved on 31st
March 2013 at 6.20.30 PM.
http://www.pta.gov.pk/index.php?option=com_content&view=article&id=269:telecom-
indicators&catid=124:industry-report&Itemid=599

Page 53 of 66
Von Lubitz, D., & Wickramasinghe, N. (2006). Healthcare and technology: the doctrine of
networkcentric healthcare. International Journal of Electronic Healthcare, 2, 322–344.
Wikipedia (2013) Retrieved from http://en.wikipedia.org/wiki/E-Choupal on March 15th
2013 at
7.15.49 PM
World Bank, Information and Communication Technologies: A World Bank Group Strategy,
Washington, DC, 2002. Retrieved on April 4th
2013 at 7.30.45 PM. From
info.worldbank.org/ict/ICT ssp.html.

Page 54 of 66
APPENDICES
Appendix 1
March 13, 2013
Dear Respondent,
IAQ Consulting (Research wing of JFK Institute of Technology and Management, Islamabad,
Pakistan) is conducting a study in South Punjab and South Sindh on “Information
Communication Technologies and its relationship with individuals involved in the Farming,
Fisheries, and Agriculture.” The objective of this research project is to “how implementation of
ICT would help the individuals/families involved in the Farming, Fisheries, and Agriculture for
making living.
Enclosed with this letter is a brief questionnaire that asks a variety of questions about the role of
ICT in the Farming, Fisheries, and Agriculture. You are requested to look over the questionnaire
and, if you choose to do so, complete the questionnaire and hand it to the staff.
If you choose to participate, do not write your name on the questionnaire. We do not need to
know who you are and no one will know whether you participated in this study. Your responses
will not be identified with you personally, nor will anyone be able to determine which
community, company or organization you work for. Nothing you say on the questionnaire will in
any way influence your present or future employment with your
company/community/organization.
I hope you will take a few minutes to complete this questionnaire. Without the help of people
like you, research on Information Communication Technologies and its relationship with
individuals involved in the Farming, Fisheries and Agriculture could not be conducted. Your
participation is voluntary and there is no penalty if you do not participate.
If you have any questions or concerns about completing the questionnaire or about participating
in this study, you may contact me through cell +92 51 430 7164 or by email at
[email protected]. If you have any questions about your rights as a research subject, you may
contact the JFK Institute of Technology and Management, Islamabad, Pakistan, Institutional
Review Board (IRB) by e-mail at [email protected]. This study (IRB #JFK-IC000)
was approved by the IRB on March 10th
2013.
Sincerely,
Enumerators in The Field,
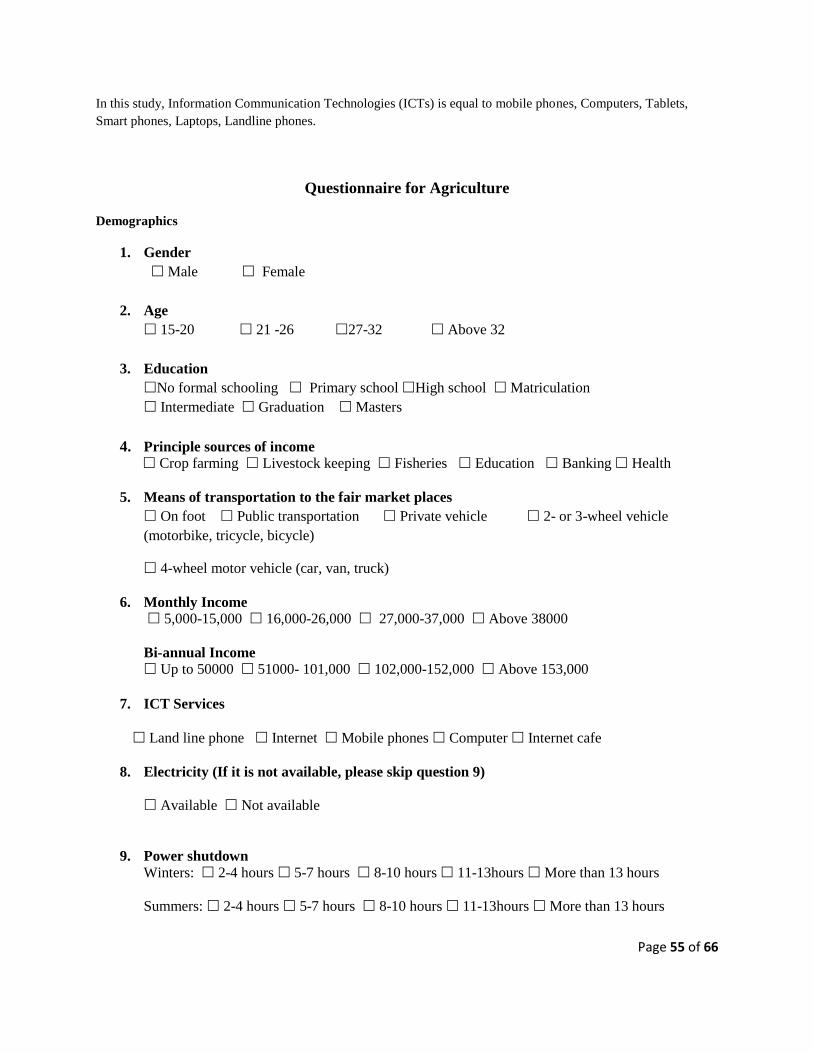
Page 55 of 66
In this study, Information Communication Technologies (ICTs) is equal to mobile phones, Computers, Tablets,
Smart phones, Laptops, Landline phones.
Questionnaire for Agriculture
Demographics
1. Gender
Male Female
2. Age
15-20 21 -26 27-32 Above 32
3. Education
No formal schooling Primary school High school Matriculation
Intermediate Graduation Masters
4. Principle sources of income Crop farming Livestock keeping Fisheries Education Banking Health
5. Means of transportation to the fair market places
On foot Public transportation Private vehicle 2- or 3-wheel vehicle
(motorbike, tricycle, bicycle)
4-wheel motor vehicle (car, van, truck)
6. Monthly Income
5,000-15,000 16,000-26,000 27,000-37,000 Above 38000
Bi-annual Income
Up to 50000 51000- 101,000 102,000-152,000 Above 153,000
7. ICT Services
Land line phone Internet Mobile phones Computer Internet cafe
8. Electricity (If it is not available, please skip question 9)
Available Not available
9. Power shutdown
Winters: 2-4 hours 5-7 hours 8-10 hours 11-13hours More than 13 hours
Summers: 2-4 hours 5-7 hours 8-10 hours 11-13hours More than 13 hours

Page 56 of 66
# Items Strongly
Disagree
Disagree Neutral Agree Strongly
Agree
ICT Usage in Daily Life
1 I use ICT for interaction with community
Members
2 I use ICT for interaction with friends and
relatives.
3 ICT has enhanced general security in the
neighborhood
4 ICT allows me to conduct cash transfers.
5 ICT allows access to political and
entertainment news through mobile phone.
6 Access to ICT helpline for the villagers to
consult with experts such as doctors,
agriculturists, lawyers, etc. will reduce
vulnerability.
7 Availability of forms and applications online
will be helpful.
8 Submission of form and applications to the
relevant offices online will be helpful.
Health
9 Information on good health practices e.g.
AIDS, Malaria, diahorrea etc through ICT will
improve villagers health.
10 Access to ICT helpline for the villagers to
consult with doctors will reduce vulnerability.
11 Information about availability of qualified
doctors through ICT will be helpful.
12 Information about availability of qualified
nurses through ICT will improve health
services.
13 Information about the nearest available health
centers through ICT will be helpful.
14 Information about availability of medicine
through ICT will be useful.
15 Reminder about doctor appointment on mobile
phone will improve patient care.
16 ICT based reminders will help the patients to
come in for vaccinations timely (Polio, AIDS
etc).
17 Mobile phone based medication reminders
will help to improve health.
18 Being able to call ambulance in case of
emergency is helpful.
Agriculture
19 It will be very useful to obtain information on
Agriculture inputs like seeds, fertilizers,
pesticides through ICT.
20 Information about commodity prices in far-off
mandis through ICT will create market
awareness.

Page 57 of 66
# Items Strongly
Disagree Disagree Neutral Agree Strongly
Agree
21 It will be very useful to receive
information about weather in advance
through ICT
22 Access to ICT based agriculture helpline
for the villagers to consult agriculturists
for pest management will reduce
vulnerability.
23 Access to ICT based agriculture helpline
for the villagers to consult agriculturists
for sowing practices will reduce
vulnerability.
24 Access to ICT based agriculture helpline
for the villagers to consult animal
husbandry specialist for raising hybrid
will reduce vulnerability.
25 Information on agricultural markets and
new procurement avenue for acquiring
tools, seeds, pesticides etc through ICT
will be helpful.
26 It will be useful to receive information on
Government schemes launched for
farmers through ICT.
27 ICT will help to enhance link between
traders, buyers and sellers.
28 ICT Support and help in case of natural
disasters (flood, fire and earthquake) will
reduce vulnerability
29 Acquiring timely information through
ICT will reduce the business risk.
30 ICT will help to reduce the cost of
travelling by providing timely
information.
ICT & Employment
31 ICT will provide employment related
opportunities in rural areas.
32 ICT will provide short term employment
opportunities in urban areas (cities) for
rural residents.
33 ICT will provide e-entrepreneurship
opportunities.
Behavior Intention
34 I intend to use ICT services for elevating
agricultural output when it becomes
available.
35 If I were asked to express my opinion of
ICT for improving agriculture, I intend to
say something favorable.
36 In the future, I intend to use ICT services
routinely for enhancing agricultural
efficiency.
Page 58 of 66
Appendix 2
March 13, 2013
Dear Respondent,
IAQ Consulting (Research wing of JFK Institute of Technology and Management, Islamabad,
Pakistan) is conducting a study in South Punjab and South Sindh on “Information
Communication Technologies and its relationship with individuals involved in the Farming,
Fisheries, and Agriculture.” The objective of this research project is to “how implementation of
ICT would help the individuals/families involved in the Farming, Fisheries, and Agriculture for
making living.
Enclosed with this letter is a brief questionnaire that asks a variety of questions about the role of
ICT in the Farming, Fisheries, and Agriculture. You are requested to look over the questionnaire
and, if you choose to do so, complete the questionnaire and hand it to the staff.
If you choose to participate, do not write your name on the questionnaire. We do not need to
know who you are and no one will know whether you participated in this study. Your responses
will not be identified with you personally, nor will anyone be able to determine which
community, company or organization you work for. Nothing you say on the questionnaire will in
any way influence your present or future employment with your
company/community/organization.
I hope you will take a few minutes to complete this questionnaire. Without the help of people
like you, research on Information Communication Technologies and its relationship with
individuals involved in the Farming, Fisheries and Agriculture could not be conducted. Your
participation is voluntary and there is no penalty if you do not participate.
If you have any questions or concerns about completing the questionnaire or about participating
in this study, you may contact me through cell +92 51 430 7164 or by email at
[email protected]. If you have any questions about your rights as a research subject, you may
contact the JFK Institute of Technology and Management, Islamabad, Pakistan, Institutional
Review Board (IRB) by e-mail at [email protected]. This study (IRB #JFK-IC000)
was approved by the IRB on March 10th
2013.
Sincerely,
Enumerators in The Field,

Page 59 of 66
ICT Questionnaire for Livestock
In this study, Information Communication Technologies (ICTs) is equal to mobile phones, Computers, Tablets,
Smart phones, Laptops, Landline phones.
Demographics
1. Gender
Male Female
2. Age
15-20 21 -26 27-32 Above 32
3. Education
No formal schooling Primary school High school Matriculation
Intermediate Graduation Masters
4. Principle sources of income Crop farming Livestock keeping Fisheries Education Banking Health
5. Means of transportation to the fair market places
On foot Public transportation Private vehicle 2- or 3-wheel vehicle
(motorbike, tricycle, bicycle)
4-wheel motor vehicle (car, van, truck)
6. Monthly Income
5,000-15,000 16,000-26,000 27,000-37,000 Above 38000
Bi-annual Income
Up to 50000 51000- 101,000 102,000-152,000 Above 153,000
7. Livestock
Horses Goats Cows Buffalos Poultry
8. ICT Services
Land line phone Internet Mobile phones Computer Internet cafe
9. Electricity (If it is not available, please skip question 10)
Available Not available
10. Power shutdown
Winters: 2-4 hours 5-7 hours 8-10 hours 11-13hours More than 13 hours
Summers: 2-4 hours 5-7 hours 8-10 hours 11-13hours More than 13 hours
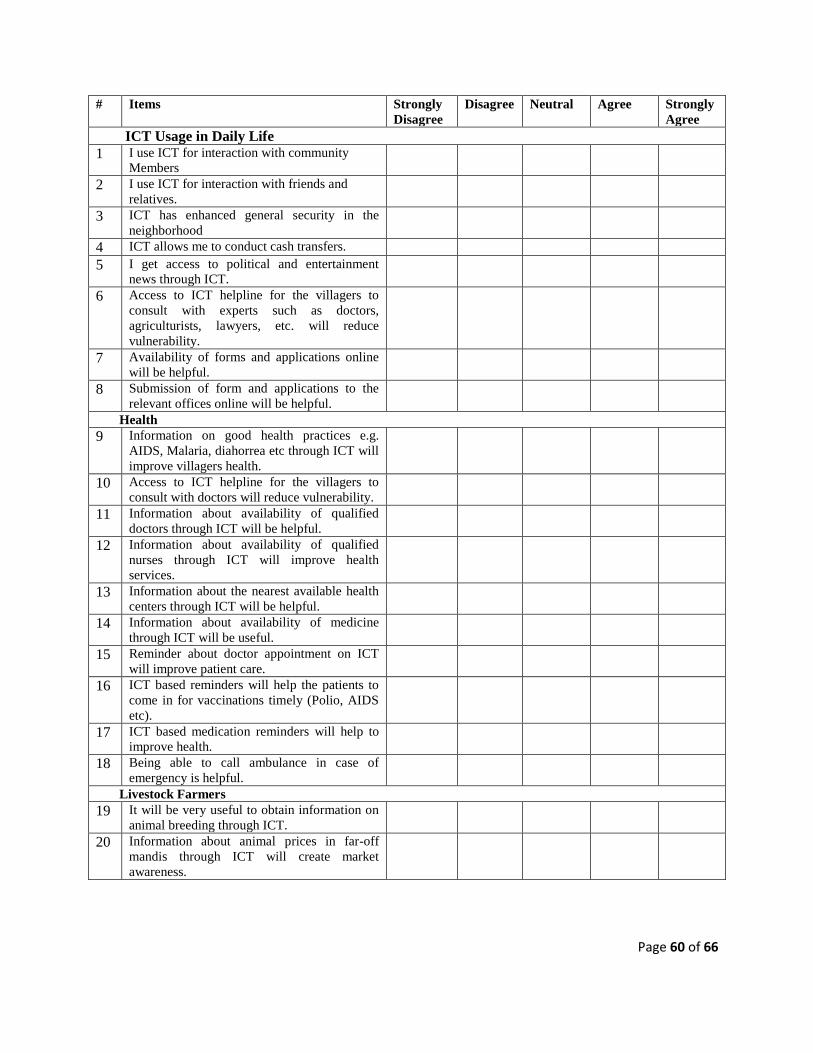
Page 60 of 66
# Items Strongly
Disagree
Disagree Neutral Agree Strongly
Agree
ICT Usage in Daily Life
1 I use ICT for interaction with community
Members
2 I use ICT for interaction with friends and
relatives.
3 ICT has enhanced general security in the
neighborhood
4 ICT allows me to conduct cash transfers.
5 I get access to political and entertainment
news through ICT.
6 Access to ICT helpline for the villagers to
consult with experts such as doctors,
agriculturists, lawyers, etc. will reduce
vulnerability.
7 Availability of forms and applications online
will be helpful.
8 Submission of form and applications to the
relevant offices online will be helpful.
Health
9 Information on good health practices e.g.
AIDS, Malaria, diahorrea etc through ICT will
improve villagers health.
10 Access to ICT helpline for the villagers to
consult with doctors will reduce vulnerability.
11 Information about availability of qualified
doctors through ICT will be helpful.
12 Information about availability of qualified
nurses through ICT will improve health
services.
13 Information about the nearest available health
centers through ICT will be helpful.
14 Information about availability of medicine
through ICT will be useful.
15 Reminder about doctor appointment on ICT
will improve patient care.
16 ICT based reminders will help the patients to
come in for vaccinations timely (Polio, AIDS
etc).
17 ICT based medication reminders will help to
improve health.
18 Being able to call ambulance in case of
emergency is helpful.
Livestock Farmers
19 It will be very useful to obtain information on
animal breeding through ICT.
20 Information about animal prices in far-off
mandis through ICT will create market
awareness.

Page 61 of 66
# Item Strongly
Disagree
Disagree Neutral Agree Strongly
Agree
21 It will be very useful to receive information
about weather in advance through ICT.
22 Access to ICT based livestock helpline for
livestock health care will improve livestock
health.
23 Access to ICT based livestock helpline for
quality management of livestock products
will reduce vulnerability.
24 Information on livestock markets and new
procurement avenue for acquiring animals,
tools, feed etc through ICT will be helpful.
25 Information about prevalent or emerging
livestock diseases through ICT will improve
livestock quality.
26 Information about livestock medicines
through ICT will improve livestock quality.
27 ICT based reminders about livestock
vaccinations will improve the livestock heath.
28 It will be useful to receive information on
Government schemes launched for livestock
farmers on ICT.
29 ICT will help to enhance link between
traders, buyers and sellers.
30 Support and help through ICT in case of
natural disasters (flood, fire and earthquake)
will reduce vulnerability.
31 Acquiring timely information through ICT
will reduce the business risk.
32 ICT will help to reduce the cost of travelling
by providing timely information.
ICT & Employment
33 ICT will provide employment related
opportunities in rural areas.
34 ICT will provide short term employment
opportunities in urban areas (cities) for rural
residents.
35 ICT will provide e-entrepreneurship
opportunities.
Behavior Intention
36 I intend to use ICT services for elevating
livestock health when it becomes available.
37 If I were asked to express my opinion of ICT
for improving livestock, I intend to say
something favorable.
38 In the future, I intend to use ICT services
routinely for enhancing livestock quality.

Page 62 of 66
Appendix 3
March 13, 2013
Dear Respondent,
IAQ Consulting (Research wing of JFK Institute of Technology and Management, Islamabad,
Pakistan) is conducting a study in South Punjab and South Sindh on “Information
Communication Technologies and its relationship with individuals involved in the Farming,
Fisheries, and Agriculture.” The objective of this research project is to “how implementation of
ICT would help the individuals/families involved in the Farming, Fisheries, and Agriculture for
making living.
Enclosed with this letter is a brief questionnaire that asks a variety of questions about the role of
ICT in the Farming, Fisheries, and Agriculture. You are requested to look over the questionnaire
and, if you choose to do so, complete the questionnaire and hand it to the staff.
If you choose to participate, do not write your name on the questionnaire. We do not need to
know who you are and no one will know whether you participated in this study. Your responses
will not be identified with you personally, nor will anyone be able to determine which
community, company or organization you work for. Nothing you say on the questionnaire will in
any way influence your present or future employment with your
company/community/organization.
I hope you will take a few minutes to complete this questionnaire. Without the help of people
like you, research on Information Communication Technologies and its relationship with
individuals involved in the Farming, Fisheries and Agriculture could not be conducted. Your
participation is voluntary and there is no penalty if you do not participate.
If you have any questions or concerns about completing the questionnaire or about participating
in this study, you may contact me through cell +92 51 430 7164 or by email at
[email protected]. If you have any questions about your rights as a research subject, you may
contact the JFK Institute of Technology and Management, Islamabad, Pakistan, Institutional
Review Board (IRB) by e-mail at [email protected]. This study (IRB #JFK-IC000)
was approved by the IRB on March 10th
2013.
Sincerely,
Enumerators in The Field,
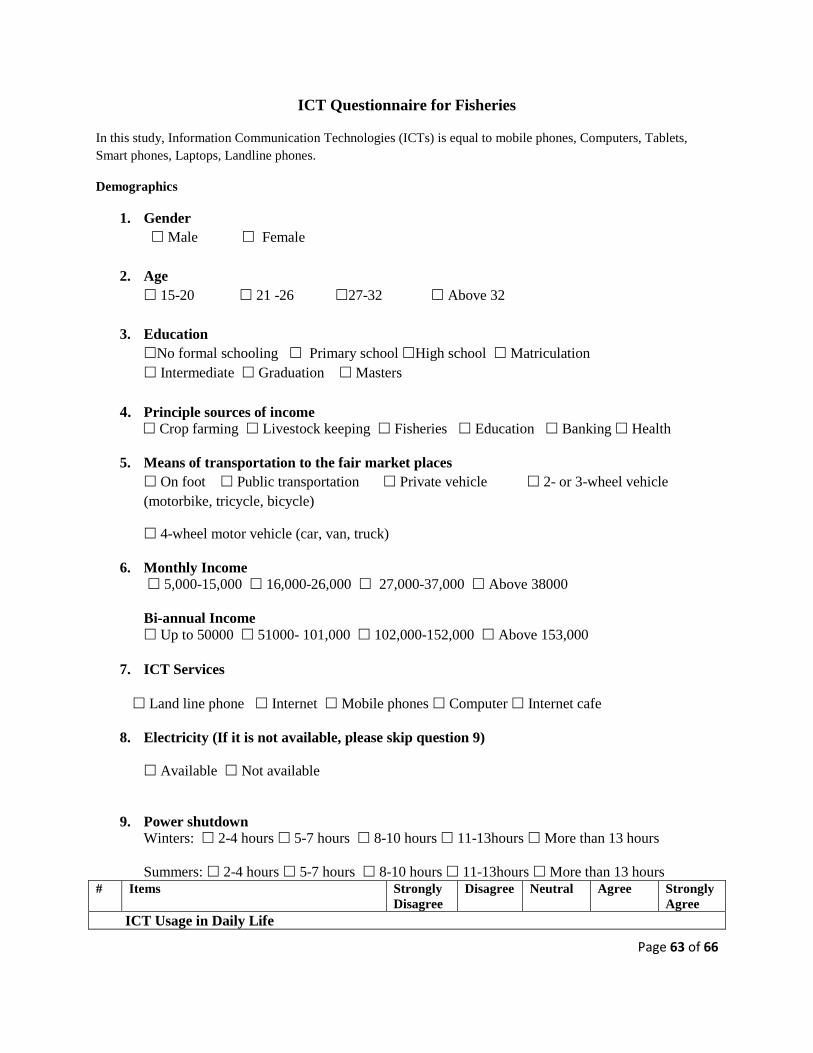
Page 63 of 66
ICT Questionnaire for Fisheries
In this study, Information Communication Technologies (ICTs) is equal to mobile phones, Computers, Tablets,
Smart phones, Laptops, Landline phones.
Demographics
1. Gender
Male Female
2. Age
15-20 21 -26 27-32 Above 32
3. Education
No formal schooling Primary school High school Matriculation
Intermediate Graduation Masters
4. Principle sources of income Crop farming Livestock keeping Fisheries Education Banking Health
5. Means of transportation to the fair market places
On foot Public transportation Private vehicle 2- or 3-wheel vehicle
(motorbike, tricycle, bicycle)
4-wheel motor vehicle (car, van, truck)
6. Monthly Income
5,000-15,000 16,000-26,000 27,000-37,000 Above 38000
Bi-annual Income
Up to 50000 51000- 101,000 102,000-152,000 Above 153,000
7. ICT Services
Land line phone Internet Mobile phones Computer Internet cafe
8. Electricity (If it is not available, please skip question 9)
Available Not available
9. Power shutdown
Winters: 2-4 hours 5-7 hours 8-10 hours 11-13hours More than 13 hours
Summers: 2-4 hours 5-7 hours 8-10 hours 11-13hours More than 13 hours # Items Strongly
Disagree
Disagree Neutral Agree Strongly
Agree
ICT Usage in Daily Life

Page 64 of 66
1 I use ICT for interaction with community
members
2 I use ICT for interaction with friends and
relatives.
3 ICT has enhanced general security in the
neighborhood
4 ICT allows me to conduct cash transfers.
5 ICT allows access to political and
entertainment news.
6 Access to ICT helpline for the villagers to
consult with experts such as doctors,
agriculturists, lawyers, etc. will reduce
vulnerability.
7 Availability of forms and applications online
will be helpful.
8 Submission of form and applications to the
relevant offices online will be helpful.
Health
9 Information on good health practices e.g.
AIDS, Malaria, diahorrea etc through ICT will
improve villagers health.
10 Access to a ICT helpline for the villagers to
consult with doctors will reduce vulnerability.
11 Information about availability of qualified
doctors through ICT will be helpful.
12 Information about availability of qualified
nurses through ICTs will improve health
services.
13 Information about the nearest available health
centers through ICT will be helpful.
14 Information about availability of medicine
through ICT will be useful.
15 Reminder about doctor appointment on ICT
will improve patient care.
16 ICT based reminders will help the patients to
come in for vaccinations timely (Polio, AIDS
etc).
17 ICT based medication reminders will help to
improve health.
18 Being able to call ambulance in case of
emergency is helpful.
Fisheries
19 It will be very useful to obtain information on
fishery inputs like fuel, nets, bait, ice blocks
etc through ICTs.
20 ICT will allow fishermen to get the best price
of their catch from the dealer even before they
dock.
# Items Strongly
Disagree Disagree Neutral Agree Strongly
Agree
21 It will be very useful to receive

Page 65 of 66
information about weather, high waves,
tsunami etc in advance through ICT.
22 ICT will enhance the safety aspects of
fishermen in the sea.
23 ICT will help fishermen to
Communicate with their colleague in
instant information regarding fish
location.
24 Access to ICT based fishery helpline for
fish breeds and fishing season will reduce
vulnerability.
25 Access to ICT based fishery helpline for
fishing techniques will improve
fishermen output.
26 Information on fishery markets and new
procurement avenue for acquiring tools
bait, fuel, nets etc through ICTs will be
helpful.
27 It will be useful to receive information on
Government schemes launched for
fishermen through ICT.
28 ICTs will help to enhance link between
traders, buyers and sellers.
29 Support and help through ICT in case of
natural disasters (flood, fire and
earthquake) will reduce vulnerability
30 Acquiring timely information through
ICT will reduce the business risk.
31 ICT will help to reduce the cost of
travelling by providing timely
information.
ICT & Employment
32 ICT will provide employment related
opportunities in rural areas.
33 ICT will provide short term employment
opportunities in urban areas (cities) for
rural residents.
34 ICT will provide e-entrepreneurship
opportunities.
Behavior Intention
35 I intend to use ICT services for elevating
fishery output when it becomes available.
36 If I were asked to express my opinion of
ICT for improving fishery output, I intend
to say something favorable.
37 In the future, I intend to use ICT services
routinely for enhancing fishery output.