Embed Size (px)
Citation preview

http://genomebiology.com/2002/3/12/research/0088.1
com
ment
reviews
reports
deposited research
interactions
inform
ation
refereed research
ResearchSystematic determination of patterns of gene expression duringDrosophila embryogenesisPavel Tomancak*, Amy Beaton*, Richard Weiszmann†, Elaine Kwan*,ShengQiang Shu†, Suzanna E Lewis†, Stephen Richards†‡, MichaelAshburner§, Volker Hartenstein¶, Susan E Celniker†‡ and Gerald M Rubin*†
Addresses: *Howard Hughes Medical Institute, Department of Molecular and Cell Biology, University of California at Berkeley, 539 LifeSciences Addition, Berkeley, CA 94720-3200, USA. †Berkeley Drosophila Genome Project, ‡Genome Sciences Department, LawrenceBerkeley National Laboratory, Berkeley, CA 94720, USA. §Department of Genetics, University of Cambridge, Cambridge CB2 3EH, UK.¶Department of Molecular Cell and Developmental Biology, University of California Los Angeles, Los Angeles, CA 90095, USA.
Correspondence: Gerald M Rubin. E-mail: [email protected]
Abstract
Background: Cell-fate specification and tissue differentiation during development are largelyachieved by the regulation of gene transcription.
Results: As a first step to creating a comprehensive atlas of gene-expression patterns duringDrosophila embryogenesis, we examined 2,179 genes by in situ hybridization to fixed Drosophilaembryos. Of the genes assayed, 63.7% displayed dynamic expression patterns that weredocumented with 25,690 digital photomicrographs of individual embryos. The photomicrographswere annotated using controlled vocabularies for anatomical structures that are organized into adevelopmental hierarchy. We also generated a detailed time course of gene expression duringembryogenesis using microarrays to provide an independent corroboration of the in situhybridization results. All image, annotation and microarray data are stored in publicly availabledatabase. We found that the RNA transcripts of about 1% of genes show clear subcellularlocalization. Nearly all the annotated expression patterns are distinct. We present an approachfor organizing the data by hierarchical clustering of annotation terms that allows us to grouptissues that express similar sets of genes as well as genes displaying similar expression patterns.
Conclusions: Analyzing gene-expression patterns by in situ hybridization to whole-mountembryos provides an extremely rich dataset that can be used to identify genes involved indevelopmental processes that have been missed by traditional genetic analysis. Systematic analysisof rigorously annotated patterns of gene expression will complement and extend the types ofanalyses carried out using expression microarrays.
Published: 23 December 2002
Genome Biology 2002, 3(12):research0088.1–0088.14
The electronic version of this article is the complete one and can befound online at http://genomebiology.com/2002/3/12/research/0088
© 2002 Tomancak et al., licensee BioMed Central Ltd (Print ISSN 1465-6906; Online ISSN 1465-6914)
Received: 3 October 2002Revised: 18 November 2002Accepted: 19 November 2002
Background Cell-fate changes that occur during development are almost
always accompanied by changes in gene expression. Thus
detailed knowledge of the spatial and temporal expression
patterns for all genes will be an important step in deciphering
the complex regulatory networks governing development.
2 Genome Biology Vol 3 No 12 Tomancak et al.
Two methods have been used successfully to determine
gene-expression patterns on a large scale - RNA in situ
hybridization [1] and DNA microarrays [2-4]. Whole-mount
RNA in situ hybridization is a well-established approach for
determining precise spatial gene-expression patterns [5,6],
and can be done in high-throughput fashion [7,8]. Although
RNA in situ hybridization is carried out on fixed tissues,
examining a large number of differently staged specimens
provides an overview of the dynamic changes in gene-
expression patterns that occur during development. Expres-
sion patterns can be documented by microscopy coupled to
digital photography and distributed on the web as a valuable
resource to the research community.
Approaches using DNA microarrays have been successful in
studying genome-wide transcriptional regulation during
animal development [9-11], but suffer from several limita-
tions. In multicellular organisms, cell division and differenti-
ation leads to an increase in tissue complexity throughout
development, but whole-animal microarray analysis cannot
document this spatial information. One can attempt to isolate
mRNA from every tissue at different developmental stages,
measure gene expression, and assign expression indexes to
every tissue at every time for every gene, in order to recreate
the entire developmental expression pattern. This is a formi-
dable task. Moreover, the quantitative comparison of expres-
sion levels for a given gene, or among different genes,
in multiple experiments is complicated by differential
hybridization kinetics and cross-hybridization properties of
each target-probe pair [12,13]. On the other hand, microarray
profiles do provide a quantitative overview of the relative
changes in each gene’s expression level across time.
We used high-throughput RNA in situ hybridization to
assemble a database of gene-expression patterns during
embryonic development of Drosophila melanogaster.
cDNA clones are available for 70% of all Drosophila genes
[14-16], providing a convenient source of templates for gen-
erating specific hybridization probes for the majority of
genes. Drosophila embryogenesis has been studied exten-
sively, providing a strong foundation of knowledge for our
project [17]. Moreover, studies of a large number of individ-
ual genes have documented the diversity of gene-expression
patterns that occur during Drosophila embryogenesis and
established the importance of tissue-specific gene expres-
sion for development.
Here we describe the molecular, microscopic, and computa-
tional methods we used to produce a database of Drosophila
embryonic expression patterns that integrates results
obtained by in situ hybridization to whole-mount embryos
and by expression microarrays. Expression patterns are doc-
umented by assembling digital photographs of individual
staged embryos that are ordered to visualize time-dependent
changes. To facilitate computational analysis, these patterns
are annotated using a controlled vocabulary that captures
developmental and spatial relationships between embryonic
tissues. We used hierarchical clustering of the annotation
terms to group together genes with similar expression pat-
terns as well as tissues with similar sets of expressed genes.
We report several noteworthy observations based on our
initial data, which provide a glimpse of the diversity of gene
expression and the utility that will derive from a complete
atlas of gene-expression patterns during Drosophila devel-
opment. All production, image and annotation data are
stored in a relational database and presented in searchable
form on the web [18].
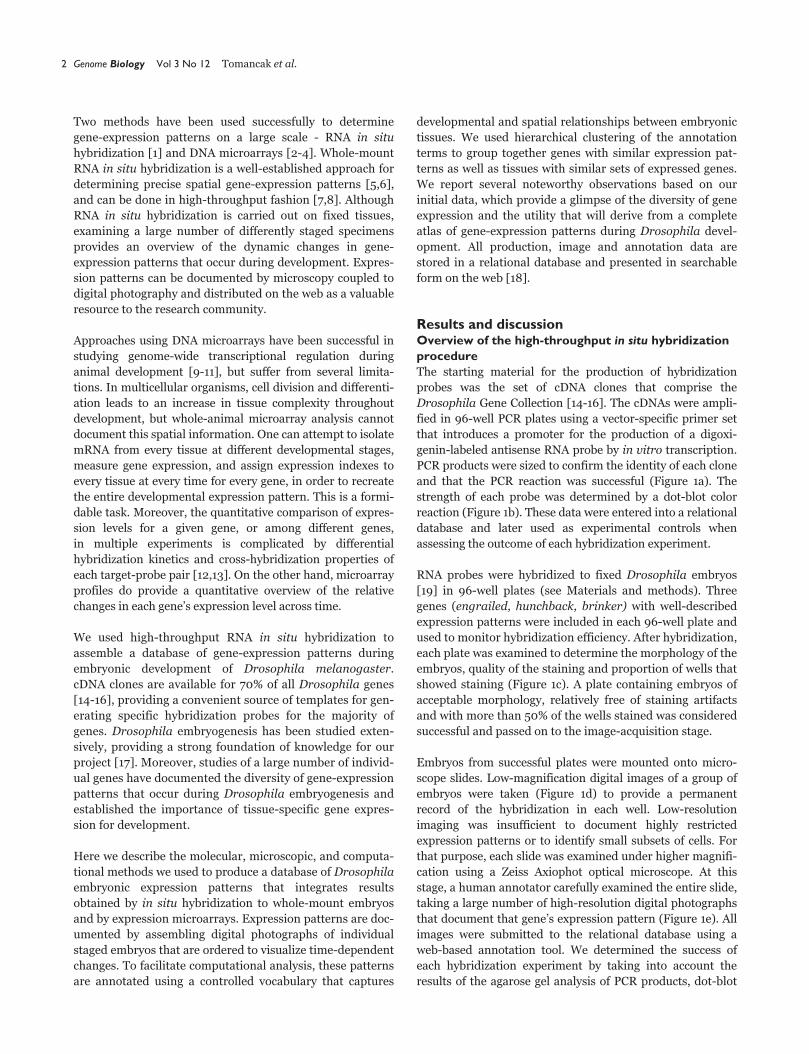
Results and discussion Overview of the high-throughput in situ hybridizationprocedure The starting material for the production of hybridization
probes was the set of cDNA clones that comprise the
Drosophila Gene Collection [14-16]. The cDNAs were ampli-
fied in 96-well PCR plates using a vector-specific primer set
that introduces a promoter for the production of a digoxi-
genin-labeled antisense RNA probe by in vitro transcription.
PCR products were sized to confirm the identity of each clone
and that the PCR reaction was successful (Figure 1a). The
strength of each probe was determined by a dot-blot color
reaction (Figure 1b). These data were entered into a relational
database and later used as experimental controls when
assessing the outcome of each hybridization experiment.
RNA probes were hybridized to fixed Drosophila embryos
[19] in 96-well plates (see Materials and methods). Three
genes (engrailed, hunchback, brinker) with well-described
expression patterns were included in each 96-well plate and
used to monitor hybridization efficiency. After hybridization,
each plate was examined to determine the morphology of the
embryos, quality of the staining and proportion of wells that
showed staining (Figure 1c). A plate containing embryos of
acceptable morphology, relatively free of staining artifacts
and with more than 50% of the wells stained was considered
successful and passed on to the image-acquisition stage.
Embryos from successful plates were mounted onto micro-
scope slides. Low-magnification digital images of a group of
embryos were taken (Figure 1d) to provide a permanent
record of the hybridization in each well. Low-resolution
imaging was insufficient to document highly restricted
expression patterns or to identify small subsets of cells. For
that purpose, each slide was examined under higher magnifi-
cation using a Zeiss Axiophot optical microscope. At this
stage, a human annotator carefully examined the entire slide,
taking a large number of high-resolution digital photographs
that document that gene’s expression pattern (Figure 1e). All
images were submitted to the relational database using a
web-based annotation tool. We determined the success of
each hybridization experiment by taking into account the
results of the agarose gel analysis of PCR products, dot-blot
com
ment
reviews
reports
deposited research
interactions
inform
ation
refereed research
http://genomebiology.com/2002/3/12/research/0088.3
analysis of probes, microarray data (described below), avail-
able information from public databases, and the quality of
the captured images. Each experiment had two possible out-
comes: either the observed expression pattern or the
absence thereof was consistent with the available data, or
there was a discrepancy indicating failure at some point and
that the experiment needs to be repeated. About 13% of the
in situ experiments failed, as a result of either the absence of
a PCR product (9.2%) or a poor probe-labeling reaction
(3.4%), which resulted in no detectable staining. Addition-
ally, probes that generated expression patterns inconsistent
with previously published data (0.3%) or the microarray
expression profile (7%) were rejected as being possibly mis-
labeled or cross-contaminated. Overall, we obtained useful
expression data for 2,179 out of 2,721 (80%) of the genes
whose transcript distribution we analyzed.
Documenting expression patterns by digitalphotography We captured high-resolution photographs of the 1,388 genes
(63.7% of the 2,179 successfully asssayed genes) that exhib-
ited some level of tissue-specific gene expression. The cap-
tured images were ordered according to the developmental
stage of the embryos in order to visualize the change of the
expression pattern over time. Embryogenesis is traditionally
divided into a series of consecutive stages distinguished by
morphological markers [20]. The duration of developmental
stages range from 15 minutes to more than 2 hours; there-
fore the stages of development were differentially repre-
sented in our embryo collections (see Materials and
methods). Some consecutive stages, although morphologi-
cally distinguishable, differ very little in terms of changes in
gene expression, whereas other stage transitions, such as the
onset of zygotic transcription or organogenesis, are accom-
panied by massive changes in gene expression. We divided
the first 16 stages of embryogenesis into six convenient stage
ranges (stages 1-3, 4-6, 7-8, 9-10, 11-12 and 13-16). Each cap-
tured image is assigned to a stage range, and for each stage
range a number of images are taken so that all stages within
the range are represented. The groups of images assigned to
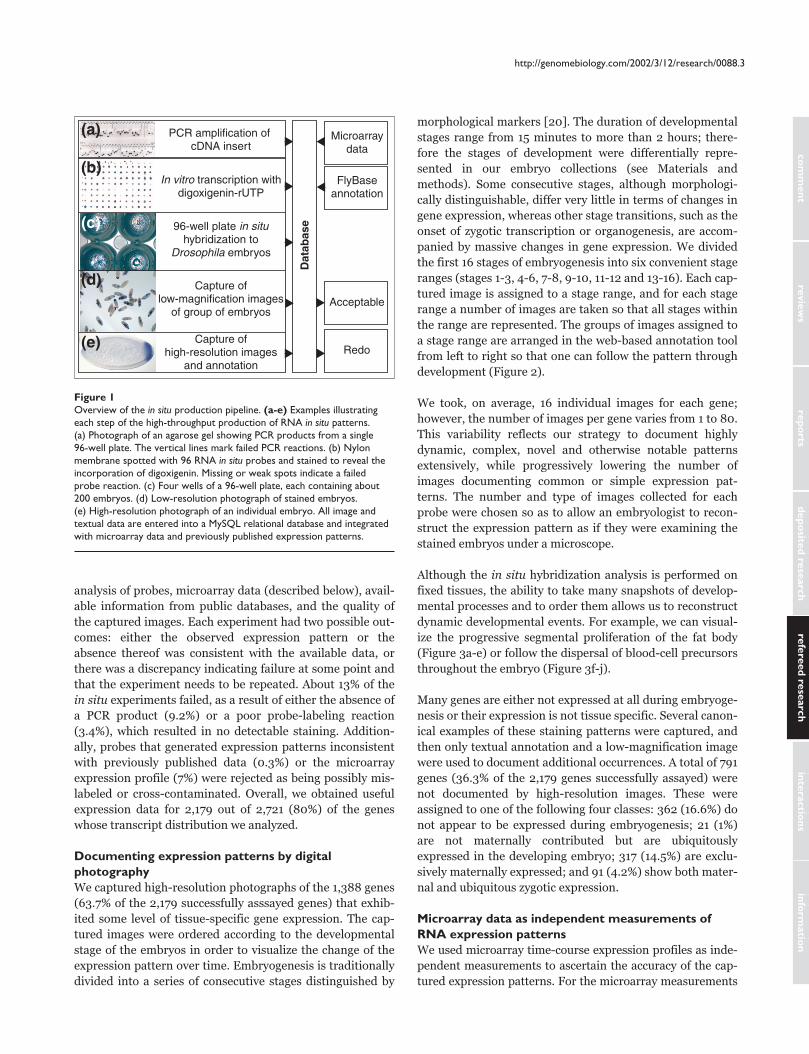
a stage range are arranged in the web-based annotation tool
from left to right so that one can follow the pattern through
development (Figure 2).
We took, on average, 16 individual images for each gene;
however, the number of images per gene varies from 1 to 80.
This variability reflects our strategy to document highly
dynamic, complex, novel and otherwise notable patterns
extensively, while progressively lowering the number of
images documenting common or simple expression pat-
terns. The number and type of images collected for each
probe were chosen so as to allow an embryologist to recon-
struct the expression pattern as if they were examining the
stained embryos under a microscope.
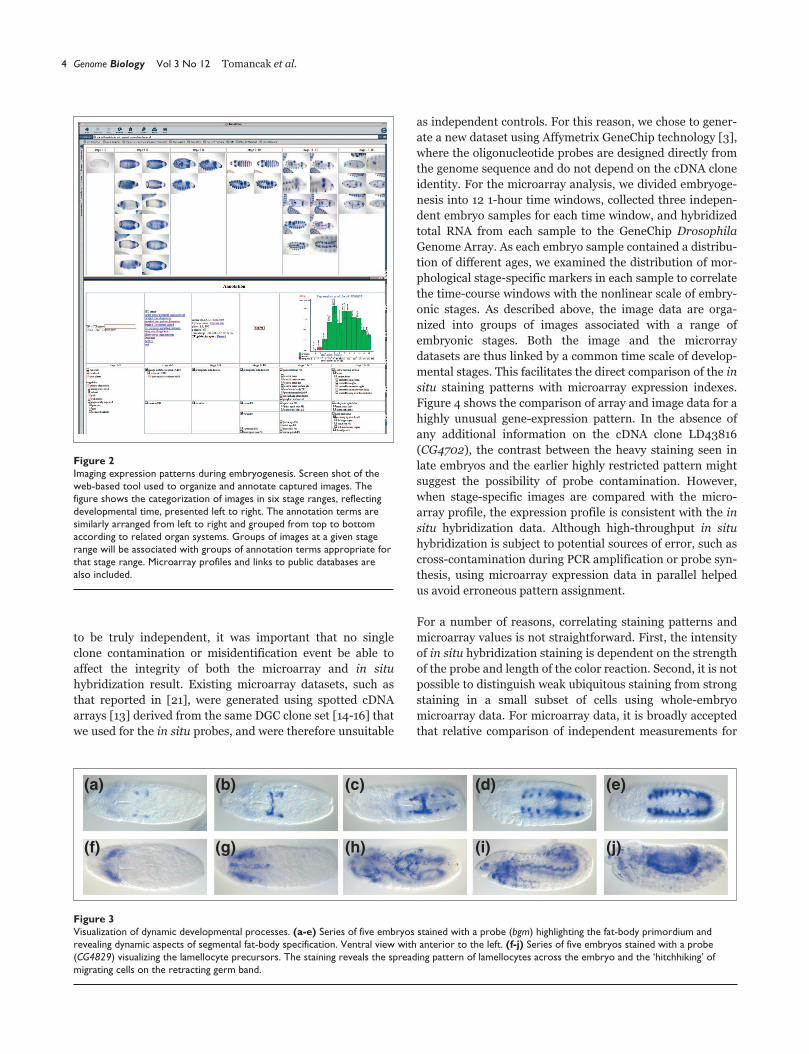
Although the in situ hybridization analysis is performed on
fixed tissues, the ability to take many snapshots of develop-
mental processes and to order them allows us to reconstruct
dynamic developmental events. For example, we can visual-
ize the progressive segmental proliferation of the fat body
(Figure 3a-e) or follow the dispersal of blood-cell precursors
throughout the embryo (Figure 3f-j).
Many genes are either not expressed at all during embryoge-
nesis or their expression is not tissue specific. Several canon-
ical examples of these staining patterns were captured, and
then only textual annotation and a low-magnification image
were used to document additional occurrences. A total of 791
genes (36.3% of the 2,179 genes successfully assayed) were
not documented by high-resolution images. These were
assigned to one of the following four classes: 362 (16.6%) do
not appear to be expressed during embryogenesis; 21 (1%)
are not maternally contributed but are ubiquitously
expressed in the developing embryo; 317 (14.5%) are exclu-
sively maternally expressed; and 91 (4.2%) show both mater-
nal and ubiquitous zygotic expression.
Microarray data as independent measurements ofRNA expression patterns We used microarray time-course expression profiles as inde-
pendent measurements to ascertain the accuracy of the cap-
tured expression patterns. For the microarray measurements
Figure 1Overview of the in situ production pipeline. (a-e) Examples illustratingeach step of the high-throughput production of RNA in situ patterns.(a) Photograph of an agarose gel showing PCR products from a single96-well plate. The vertical lines mark failed PCR reactions. (b) Nylonmembrane spotted with 96 RNA in situ probes and stained to reveal theincorporation of digoxigenin. Missing or weak spots indicate a failedprobe reaction. (c) Four wells of a 96-well plate, each containing about200 embryos. (d) Low-resolution photograph of stained embryos.(e) High-resolution photograph of an individual embryo. All image andtextual data are entered into a MySQL relational database and integratedwith microarray data and previously published expression patterns.
Capture ofhigh-resolution images
and annotation
Capture oflow-magnification images
of group of embryos
96-well plate in situhybridization to
Drosophila embryos
In vitro transcription withdigoxigenin-rUTP
PCR amplification of cDNA insert
Microarraydata
Acceptable
Redo
FlyBaseannotation
Dat
abas
e
(a)
(b)
(c)
(d)
(e)
to be truly independent, it was important that no single
clone contamination or misidentification event be able to
affect the integrity of both the microarray and in situ
hybridization result. Existing microarray datasets, such as
that reported in [21], were generated using spotted cDNA
arrays [13] derived from the same DGC clone set [14-16] that
we used for the in situ probes, and were therefore unsuitable
as independent controls. For this reason, we chose to gener-
ate a new dataset using Affymetrix GeneChip technology [3],
where the oligonucleotide probes are designed directly from
the genome sequence and do not depend on the cDNA clone
identity. For the microarray analysis, we divided embryoge-
nesis into 12 1-hour time windows, collected three indepen-
dent embryo samples for each time window, and hybridized
total RNA from each sample to the GeneChip Drosophila
Genome Array. As each embryo sample contained a distribu-
tion of different ages, we examined the distribution of mor-
phological stage-specific markers in each sample to correlate
the time-course windows with the nonlinear scale of embry-
onic stages. As described above, the image data are orga-
nized into groups of images associated with a range of
embryonic stages. Both the image and the microrray
datasets are thus linked by a common time scale of develop-
mental stages. This facilitates the direct comparison of the in
situ staining patterns with microarray expression indexes.
Figure 4 shows the comparison of array and image data for a
highly unusual gene-expression pattern. In the absence of
any additional information on the cDNA clone LD43816
(CG4702), the contrast between the heavy staining seen in
late embryos and the earlier highly restricted pattern might
suggest the possibility of probe contamination. However,
when stage-specific images are compared with the micro-
array profile, the expression profile is consistent with the in
situ hybridization data. Although high-throughput in situ
hybridization is subject to potential sources of error, such as
cross-contamination during PCR amplification or probe syn-
thesis, using microarray expression data in parallel helped
us avoid erroneous pattern assignment.
For a number of reasons, correlating staining patterns and
microarray values is not straightforward. First, the intensity
of in situ hybridization staining is dependent on the strength
of the probe and length of the color reaction. Second, it is not
possible to distinguish weak ubiquitous staining from strong
staining in a small subset of cells using whole-embryo
microarray data. For microarray data, it is broadly accepted
that relative comparison of independent measurements for
4 Genome Biology Vol 3 No 12 Tomancak et al.
Figure 2Imaging expression patterns during embryogenesis. Screen shot of theweb-based tool used to organize and annotate captured images. Thefigure shows the categorization of images in six stage ranges, reflectingdevelopmental time, presented left to right. The annotation terms aresimilarly arranged from left to right and grouped from top to bottomaccording to related organ systems. Groups of images at a given stagerange will be associated with groups of annotation terms appropriate forthat stage range. Microarray profiles and links to public databases arealso included.
Figure 3Visualization of dynamic developmental processes. (a-e) Series of five embryos stained with a probe (bgm) highlighting the fat-body primordium andrevealing dynamic aspects of segmental fat-body specification. Ventral view with anterior to the left. (f-j) Series of five embryos stained with a probe(CG4829) visualizing the lamellocyte precursors. The staining reveals the spreading pattern of lamellocytes across the embryo and the ‘hitchhiking’ ofmigrating cells on the retracting germ band.
(a) (b) (c) (d) (e)
(f) (g) (h) (i) (j)

the same gene are reliable, whereas absolute intensities
across different genes are not, especially for low expression
values [12]. For all these reasons, the most useful factor in
correlating microarray and image data is the relative fluctua-
tion of signal intensity over the course of development.
Figure 5 shows 14 examples of distinct expression profiles
that exhibit strong correlations between microarray and
image data. The expression patterns of all these genes (except
CG8782) have been previously described, providing indepen-
dent confirmation that each profile is correct. Clear-cut
correlations between microarray and in situ hybridization
data as seen in Figure 5 are possible when the expression
pattern exhibits changes over time. For monotonically
expressed genes, the correlation is rather subjective and
relies on absolute intensities of both microrarray and in situ
hybridization signals. In 7% of the experiments, we rejected
the observed expression pattern because of an obvious mis-
match with the microarray expression profile; such cases
account for approximately one third of the genes whose
analysis will need to be repeated.
Large-scale production of RNA in situ data is prone occa-
sionally to produce false-negative results due to failures in
probe production and hybridization. Microarray data are
useful to identify experiments where the RNA in situ
hybridization failed but the given gene is highly expressed.
High absolute microarray-derived gene-expression values,
coupled with either a continuous profile across the time
course or distinct on/off periods during the time course, is a
reliable indication that a gene is expressed. Low expression
values, and a lack of consistency among replicate experi-
ments, may indicate that a gene is not transcribed during
embryogenesis. However, if a given gene is active in only a
very small subset of cells, the microarray results from a
whole-animal experiment may not be sensitive enough to
detect its expression. Therefore, even with the microarray
data at hand, it is not possible to avoid completely false neg-
atives for low-abundance transcripts.
Textual annotation of gene-expression patterns andassembly of a public database To provide searching capability beyond queries for a specific
gene, we rigorously annotated the gene-expression profiles
using a controlled vocabulary. We used human annotation,
rather than automated approaches based on pattern-
recognition algorithms, because of the overwhelming
complexity of annotation. Variation in morphology and
incomplete knowledge of the shape and position of various
embryonic structures make computational approaches
impracticable at present. Moreover, a human annotator does
not only take into account the image data, but also integrates
other information such as the microarray profile and previ-
ously published data into the final assessment of the expres-
sion pattern. In our project, a single person carried out the
initial annotation, resulting in a highly consistent dataset.
Annotation of gene-expression patterns that change dynami-
cally over time poses a significant challenge. There is a need
to have a specific name not only for the final developed
embryonic structures but also for all the developmental inter-
mediates that precede them. Every terminally differentiated
structure of the embryo descends from a group of cells within
the cellular blastoderm epithelium [17]. We used this embry-
ological concept to define a set of embryonic structure names
that depict a ‘path’ describing the development of each organ.
Four basic categories of developmental structures, called
com
ment
reviews
reports
deposited research
interactions
inform
ation
refereed research
http://genomebiology.com/2002/3/12/research/0088.5
Figure 4Comparison of image and microarray data for gene CG4702. (a) Amicroarray expression profile of the gene CG4702, represented by ESTclone LD43816. Consecutive time points representing RNA samples fromdifferentially aged 1-h embryo collections are presented on the x-axis,while the y-axis represents the scale of absolute expression indexes asanalyzed by dChip analysis software [37]. Error bars represent standarderror of the measurements, which were carried out independently onthree separate embryo collections; the number next to each bar is themean of the three measurements. The color of the bar reflects thecategorization of each measurement on the basis of a statistical analysisperformed by the Affymetrix Microarray Suite software package. Greenrepresents present; red, absent. Because of the sensitivity limitations ofthe GeneChip measurements and the conservative nature of thesoftware, absent calls do not necessarily imply lack of gene expression.The secondary x-axis correlates the microarray sample time points withstages of embryogenesis. (b) Images of six staged embryos illustratingexpression during development of the same gene characterized above bymicroarray analysis. Each image comes from a different stage range (stages1-3, 4-6, 7-8, 9-10, 11-12, and 14-16). Lateral view, anterior to the left.
Stage 1 Stage 4
Stage 9 Stage 11 Stage 15
Stage 7
(a)
(b)
exp value
11212
8409
5606
2603
01
1 2 3 4 5 67 8 9 10 11e 11l 12e 12l 13e 13l14e 14l
2 3 4 5 6Time point (h)
Development stage
7 8 9 10 11 12
Expression profile of LD43816
PresentAbsentMarginal
795.
3
928.
6
2759
.2
2568
.7
981.
4
651.
9
465.
8
446.
3
411.
3 1516
.4
6622
.4
1293
2.8

6 Genome Biology Vol 3 No 12 Tomancak et al.
Figure 5 (see the legend on the next page)
bgm
ken
hkb
CG8782
zfh1
ush
rib
l(1)sc
eya
Mef2
CrebA
Ptx1
gt
lmd
(a)
(b)
(g)
(n)
(j)
(h)
(i)
(d)
(f)
(k)
(l)
(m)
(c)
(e)

anlage in statu nascendi, anlage, primordium and organ,
are distinguished.
At the end of embryogenesis, organs can be distinguished by
their unique morphology and function (for examples, see
Figure 6a). Traditionally, two types of developmental inter-
mediates that precede the terminally differentiated organ
have been defined: anlage and primordium (for examples,
see Figure 6a). An anlage is defined as a morphologically
indistinct group of contiguous cells, established by lineage
tracing, that gives rise to an individual organ. Anlagen for
most organs can be distinguished at the late cellular blasto-
derm or gastrula stage (stages 5-9). A primordium can be
recognized on the basis of its distinct morphology. A pri-
mordium will give rise to one or more differentiated organs.
We have included the germ layers in the primordium cate-
gory. Primordia develop from anlagen but an anlage - for
example, a group of cells defined by gene expression that will
give rise to a subset of an organ - can also be part of a pri-
mordium. Individual names are connected by relationships
that define the way the respective tissues develop from one
another or encompass one another.
Many genes whose expression is ultimately restricted to, and
required for the determination of, a specific anlage initially
appear in a larger area. This dynamic expression may reflect
the working of an underlying molecular network of activat-
ing and inhibitory factors which only gradually succeed in
directing expression of a given gene to a specific subset of
cells which thereby become defined as a distinct anlage. We
propose the term ‘anlage in statu nascendi’ (in statu
nascendi can be loosely translated as ‘in the process of being
formed’) for the larger domain from which a specific anlage
originates. Anlagen in statu nascendi can only be visualized
by gene-expression analysis. They typically appear at the cel-
lular blastoderm stage and resolve into specific anlagen
towards the beginning of gastrulation (examples are given in
Figure 6a).
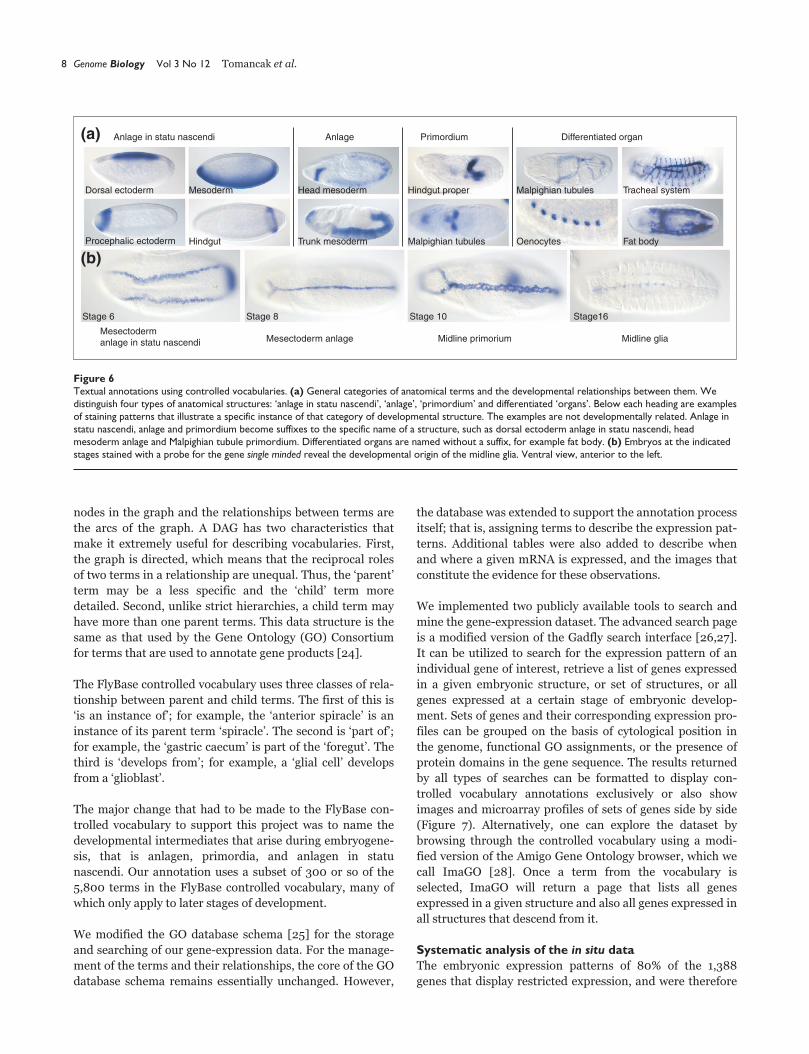
Using this naming scheme we are able to describe the devel-
opment of embryonic structures starting from anlage in
statu nascendi at the cellular blastoderm stage through a
series of developmental intermediates - anlage and primor-
dia - to a differentiated embryonic structure. For example,
the transcription factor single minded is expressed in the
glial cells of the mature embryo [22]. The origin of this
expression pattern can be traced from the mesectoderm
anlage in statu nascendi, to the mesectoderm anlage, to the
mesectoderm (or midline primordium ) and, finally, to the
mature midline glial cells (Figure 6b).
In the annotation tool (Figure 2), only those annotation
terms that describe structures present within a specific stage
range are displayed beneath the images of embryos from
that stage. Annotation terms are organized into a hierarchy
according to the developmental relationship between them.
Using the annotation tool, one can follow and describe the
development of each structure through its intermediates by
observing the development of the staining pattern and
selecting the appropriate annotation terms. Integration of
image data with the predefined developmental hierarchy is
one of the prime goals of our annotation effort.
One advantage of storing the data in a database is the ability
to query the data and compare results in a rigorous manner.
However, this is only possible if the data that are entered
into the database are themselves rigorously controlled. Com-
parisons of biological data are complicated by the lack of
standards in both reagents and nomenclature. We provide a
standardized set of in situ expression images prepared using
the same hybridization probes, laboratory protocols, and
descriptive nomenclature. For the nomenclature we needed
an agreed vocabulary of terms to describe the different
anatomical features of the Drosophila embryo and the dif-
ferent stages of embryonic development. This was provided
to us by the controlled vocabularies of anatomy and develop-
ment that have been constructed by FlyBase [23] over the
past few years. A further advantage in using these vocabular-
ies is that our data will be recorded in a way that is wholly
consistent with that used by the FlyBase curators, who
record gene-expression data from the scientific literature.
The FlyBase controlled vocabularies are organized as a
directed acyclic graph (DAG). In a DAG the terms are the
com
ment
reviews
reports
deposited research
interactions
inform
ation
refereed research
http://genomebiology.com/2002/3/12/research/0088.7
Figure 5 (see the figure on the previous page)Correlation of image and microarray data. (a-n) Fourteen examples of correlations between microarray and image data for genes with knownexpression patterns. Microarray expression profiles are shown on the left. Red is absent, green is present, and vertical lines on bars represent error barsof triplicate measurements. On the right are six representative images, one for each stage range specified in Figure 4, ordered according todevelopmental time to allow visual correlation with the corresponding array profile. Anterior to the left. The most straightforward comparisons occurwhen gene expression comes on (e,n) or is turned off abruptly (a,b), corresponding to the absence or presence of in situ staining respectively. In manycases, the absent/present call misses the expression of genes confined to a small subset of tissues (c,m). (l) Gene-expression levels increase, followed byan increase in staining intensity that occupies approximately the same proportion of the embryo. (f) The increase in microarray intensity reflects anincrease in the number of cells in the embryo showing gene expression across time. (c) Fading expression is indicative of the restriction of geneexpression to a smaller subset of cells as development proceeds. Frequently, a microarray profile will show both types of fluctuations, and in that casethe visual correlation is rather subjective (g,h), unless accompanied by a clear-cut qualitative change (d,e,i). (k) Genes transcribed both maternally andzygotically have no ‘off’ period during our developmental time course. (j) The decrease in abundance of maternal transcript often overlaps withemergence of zygotic transcript, leading to the flattening of the early portion of the microarray profile.
nodes in the graph and the relationships between terms are
the arcs of the graph. A DAG has two characteristics that
make it extremely useful for describing vocabularies. First,
the graph is directed, which means that the reciprocal roles
of two terms in a relationship are unequal. Thus, the ‘parent’
term may be a less specific and the ‘child’ term more
detailed. Second, unlike strict hierarchies, a child term may
have more than one parent terms. This data structure is the
same as that used by the Gene Ontology (GO) Consortium
for terms that are used to annotate gene products [24].
The FlyBase controlled vocabulary uses three classes of rela-
tionship between parent and child terms. The first of this is
‘is an instance of’; for example, the ‘anterior spiracle’ is an
instance of its parent term ‘spiracle’. The second is ‘part of’;
for example, the ‘gastric caecum’ is part of the ‘foregut’. The
third is ‘develops from’; for example, a ‘glial cell’ develops
from a ‘glioblast’.
The major change that had to be made to the FlyBase con-
trolled vocabulary to support this project was to name the
developmental intermediates that arise during embryogene-
sis, that is anlagen, primordia, and anlagen in statu
nascendi. Our annotation uses a subset of 300 or so of the
5,800 terms in the FlyBase controlled vocabulary, many of
which only apply to later stages of development.
We modified the GO database schema [25] for the storage
and searching of our gene-expression data. For the manage-
ment of the terms and their relationships, the core of the GO
database schema remains essentially unchanged. However,
the database was extended to support the annotation process
itself; that is, assigning terms to describe the expression pat-
terns. Additional tables were also added to describe when
and where a given mRNA is expressed, and the images that
constitute the evidence for these observations.
We implemented two publicly available tools to search and
mine the gene-expression dataset. The advanced search page
is a modified version of the Gadfly search interface [26,27].
It can be utilized to search for the expression pattern of an
individual gene of interest, retrieve a list of genes expressed
in a given embryonic structure, or set of structures, or all
genes expressed at a certain stage of embryonic develop-
ment. Sets of genes and their corresponding expression pro-
files can be grouped on the basis of cytological position in
the genome, functional GO assignments, or the presence of
protein domains in the gene sequence. The results returned
by all types of searches can be formatted to display con-
trolled vocabulary annotations exclusively or also show
images and microarray profiles of sets of genes side by side
(Figure 7). Alternatively, one can explore the dataset by
browsing through the controlled vocabulary using a modi-
fied version of the Amigo Gene Ontology browser, which we
call ImaGO [28]. Once a term from the vocabulary is
selected, ImaGO will return a page that lists all genes
expressed in a given structure and also all genes expressed in
all structures that descend from it.
Systematic analysis of the in situ data The embryonic expression patterns of 80% of the 1,388
genes that display restricted expression, and were therefore
8 Genome Biology Vol 3 No 12 Tomancak et al.
Figure 6Textual annotations using controlled vocabularies. (a) General categories of anatomical terms and the developmental relationships between them. Wedistinguish four types of anatomical structures: ‘anlage in statu nascendi’, ‘anlage’, ‘primordium’ and differentiated ‘organs’. Below each heading are examplesof staining patterns that illustrate a specific instance of that category of developmental structure. The examples are not developmentally related. Anlage instatu nascendi, anlage and primordium become suffixes to the specific name of a structure, such as dorsal ectoderm anlage in statu nascendi, headmesoderm anlage and Malpighian tubule primordium. Differentiated organs are named without a suffix, for example fat body. (b) Embryos at the indicatedstages stained with a probe for the gene single minded reveal the developmental origin of the midline glia. Ventral view, anterior to the left.
Anlage in statu nascendi Anlage Primordium Differentiated organ
Dorsal ectoderm Mesoderm
HindgutProcephalic ectoderm
Head mesoderm
Trunk mesoderm Malpighian tubules
Hindgut proper Malpighian tubules
Oenocytes
Tracheal system
Fat body
Mesectoderm anlage in statu nascendi Mesectoderm anlage Midline primorium Midline glia
Stage 6 Stage 8 Stage 10 Stage16
(a)
(b)
annotated in our database, are described by a unique set of
annotation terms. This observation illustrates the tremen-
dous diversity of gene-expression patterns during embryoge-
nesis, which range from expression in a single embryonic
structure to expression in 36 distinct tissues. Although
expression patterns of genes are rarely identical, there is a
noticeable similarity among patterns of expression of many
genes. Therefore we sought to order these genes on the basis
of the similarity of their expression patterns. Furthermore,
gene-expression data can be used to quantify the relatedness
of the various embryonic structures in terms of similarity in
gene expression between them [29]. We carried out hierar-
chical clustering of genes and tissues using a method based
on binary similarity metrics ([30]; for details see Materials
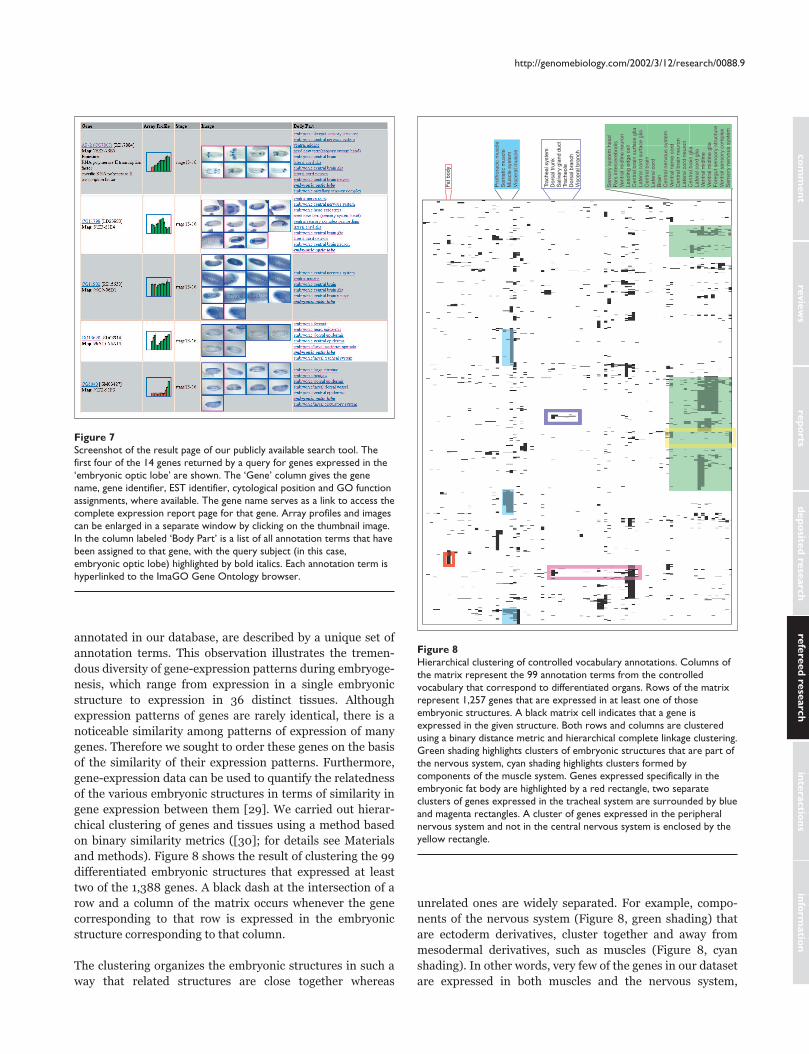
and methods). Figure 8 shows the result of clustering the 99
differentiated embryonic structures that expressed at least
two of the 1,388 genes. A black dash at the intersection of a
row and a column of the matrix occurs whenever the gene
corresponding to that row is expressed in the embryonic
structure corresponding to that column.
The clustering organizes the embryonic structures in such a
way that related structures are close together whereas
unrelated ones are widely separated. For example, compo-
nents of the nervous system (Figure 8, green shading) that
are ectoderm derivatives, cluster together and away from
mesodermal derivatives, such as muscles (Figure 8, cyan
shading). In other words, very few of the genes in our dataset
are expressed in both muscles and the nervous system,
com
ment
reviews
reports
deposited research
interactions
inform
ation
refereed research
http://genomebiology.com/2002/3/12/research/0088.9
Figure 7Screenshot of the result page of our publicly available search tool. Thefirst four of the 14 genes returned by a query for genes expressed in the‘embryonic optic lobe’ are shown. The ‘Gene’ column gives the genename, gene identifier, EST identifier, cytological position and GO functionassignments, where available. The gene name serves as a link to access thecomplete expression report page for that gene. Array profiles and imagescan be enlarged in a separate window by clicking on the thumbnail image.In the column labeled ‘Body Part’ is a list of all annotation terms that havebeen assigned to that gene, with the query subject (in this case,embryonic optic lobe) highlighted by bold italics. Each annotation term ishyperlinked to the ImaGO Gene Ontology browser.
Figure 8Hierarchical clustering of controlled vocabulary annotations. Columns ofthe matrix represent the 99 annotation terms from the controlledvocabulary that correspond to differentiated organs. Rows of the matrixrepresent 1,257 genes that are expressed in at least one of thoseembryonic structures. A black matrix cell indicates that a gene isexpressed in the given structure. Both rows and columns are clusteredusing a binary distance metric and hierarchical complete linkage clustering.Green shading highlights clusters of embryonic structures that are part ofthe nervous system, cyan shading highlights clusters formed bycomponents of the muscle system. Genes expressed specifically in theembryonic fat body are highlighted by a red rectangle, two separateclusters of genes expressed in the tracheal system are surrounded by blueand magenta rectangles. A cluster of genes expressed in the peripheralnervous system and not in the central nervous system is enclosed by theyellow rectangle.
reflecting the physiological separation and different develop-
mental origins of these two tissues.
By analogy, the genes are organized by the hierarchical clus-
tering so that those with the most similar expression patterns
are close together and those with highly divergent patterns
are widely separated. The distribution of clusters in the
matrix can be used to identify genes that are expressed in a
tissue or set of tissues. For example, the red rectangle in
Figure 8 highlights a cluster of genes that are expressed
exclusively in the embryonic fat body. Genes expressed in the
tracheal system are split into at least two clusters; genes
expressed exclusively in the trachea form a cluster in the
middle of the matrix (Figure 8, blue rectangle), and a second
cluster includes genes expressed in the trachea and variety of
epidermal structures (Figure 8, magenta rectangle). Interest-
ingly, no genes are expressed in both trachea and the CNS
(note the gap in CNS clusters at the level of the tracheal
cluster). Genes expressed in the nervous system form the
most prominent clusters. The annotation vocabulary subdi-
vides the nervous system into specific subsets based on tissue
types (neurons, glia) and anatomical position (brain, ventral
nerve cord, lateral cord, sensory nervous system). A cluster of
genes that are expressed specifically in the components of the
peripheral nervous system and absent from CNS can be iden-
tified (Figure 8, yellow rectangle). An increase in the depth of
annotation will be required to subdivide the large clusters
that correspond to complex organ systems.
Figure 8 represents one possible outcome of the clustering
analysis of the annotation dataset. Filtering of the genes and
anatomical structures, the type of clustering algorithm and
the distance metric are variables that need to be optimized to
address specific questions about the variations in patterns of
gene expression. We used a relatively simple metric to define
similarity among the annotation data. In the future it will be
interesting to explore more complex similarity metrics that
incorporate the distance between annotation terms within
the ontology. Clustering of the annotation data and other
data-mining approaches will establish sets of co-regulated
genes that will provide a starting point for investigating cis-
regulatory sequences that may elucidate novel regulatory
relationships in development. Interactive web pages with a
complete clustering matrix can be accessed at [31].
Systematic RNA in situ hybridization is an alternative to
mutagenesis screens [32] to uncover genes involved in
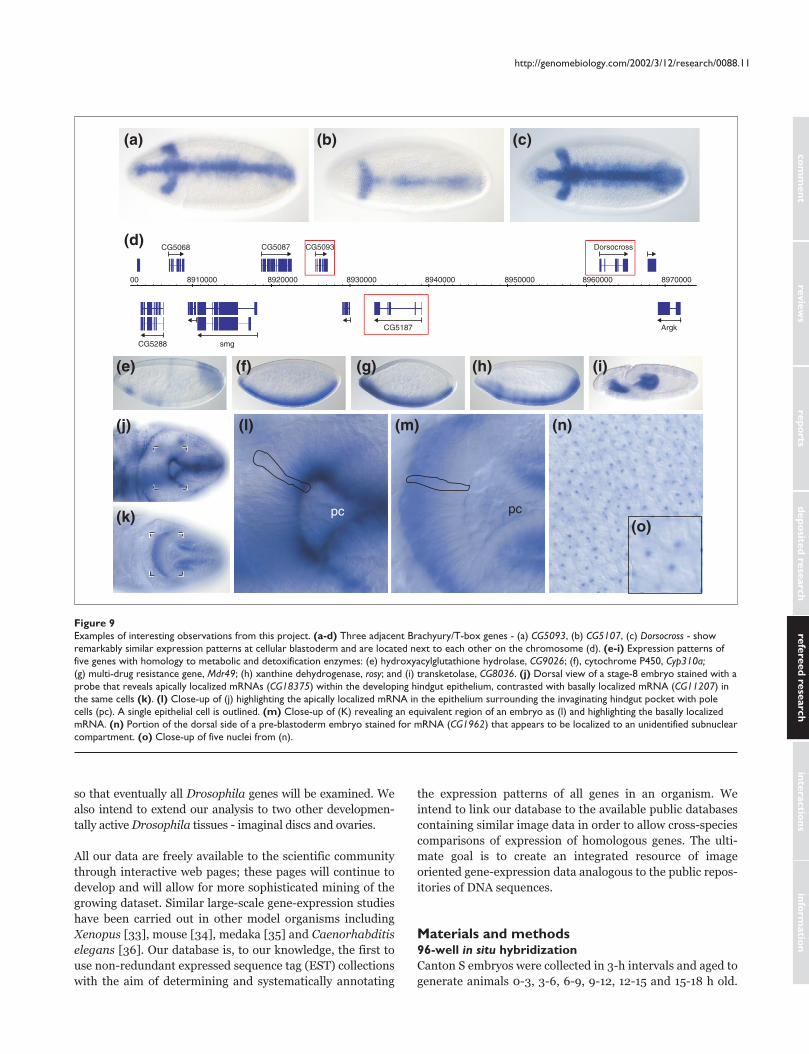
embryonic patterning. Figure 9a-d illustrates one case where
conventional mutagenesis failed to identify genes with
highly specific expression patterns at the cellular blastoderm
stage, most probably because of genetic redundancy. At map
position 66E4, three adjacent and highly homologous genes
for Brachyury/T-box-containing transcription factors are
expressed with strikingly similar expression patterns. Thus
disruption of any one of these genes might not be sufficient
to produce an embryonic phenotype. Conversely, in many
cases the expression patterns of duplicated genes have
diverged and are largely non-overlapping. Expression data
can provide a guide as to which multiple gene knockouts are
likely to yield specific phenotypes.
A systematic screening approach also reduces bias in the
selection of the types of genes chosen for study. Figure 9e-i
shows five examples of metabolic genes that, contrary to
naive expectation, are expressed at cellular blastoderm in
domains suggestive of roles in embryonic patterning. A
similar observation was recently reported for the expression
of genes isolated specifically from blastoderm-specific cDNA
libraries [7]. Tight regulation of expression of these genes
could be explained by a preferential requirement for certain
metabolic pathways in specialized embryonic tissues. That
argument may not be plausible for genes expressed within
limited regions of the cellular blastoderm embryo. It is possi-
ble that these gene products are not translated, are otherwise
inactive in the tissues where the transcripts appear abundant,
or that their restricted expression is simply the result of their
proximity to a transcriptional control element of a neighbor-
ing gene. A more interesting possibility is that this expression
may reflect yet unknown functions of these genes.
A major advantage of RNA in situ hybridization is that this
method has sufficient spatial resolution to uncover subcellu-
lar localization of mRNAs. Figure 9j,l shows an apically
localized mRNA in the columnar epithelium of the develop-
ing hindgut surrounding the migrating pole cells (Figure 9l).
This staining is strikingly complementary to that of a basally
localized mRNA from a different gene that is expressed in
the same cells (Figure 9k,m). The transcript of yet another
gene, whose expression is shown at high magnification at the
pre-cellular blastoderm stage, appears to be localized to a
sub-compartment of the nucleus (Figure 9n,o). We also
found novel mRNAs localized asymmetrically along the
anterior-posterior axis of the early pre-blastoderm embryo
(data not shown). Overall, we find that about 1% of genes
exhibit easily discernible subcellular localization, and thus
our dataset can also be useful in identifying aspects of RNA
localization and trafficking.
Conclusions The dataset we present here comprises embryonic expression
patterns for about one-sixth of all Drosophila genes, docu-
mented with extensive digital images, controlled vocabulary
annotations and microarray profiles. Our ultimate goal is to
determine the expression patterns of all genes in the genome.
Considering our current production rate, we should be able to
finish the first pass through the existing cDNA collections that
represent about 70% of all Drosophila genes in about a year.
We will then repeat our analysis of the 20% or so of genes for
which we did not obtain reliable data. Probes for genes that
lack a suitable cDNA clone, but that show significant expres-
sion by microarray analysis, will be generated by genomic PCR
10 Genome Biology Vol 3 No 12 Tomancak et al.
so that eventually all Drosophila genes will be examined. We
also intend to extend our analysis to two other developmen-
tally active Drosophila tissues - imaginal discs and ovaries.
All our data are freely available to the scientific community
through interactive web pages; these pages will continue to
develop and will allow for more sophisticated mining of the
growing dataset. Similar large-scale gene-expression studies
have been carried out in other model organisms including
Xenopus [33], mouse [34], medaka [35] and Caenorhabditis
elegans [36]. Our database is, to our knowledge, the first to
use non-redundant expressed sequence tag (EST) collections
with the aim of determining and systematically annotating
the expression patterns of all genes in an organism. We
intend to link our database to the available public databases
containing similar image data in order to allow cross-species
comparisons of expression of homologous genes. The ulti-
mate goal is to create an integrated resource of image
oriented gene-expression data analogous to the public repos-
itories of DNA sequences.
Materials and methods 96-well in situ hybridization Canton S embryos were collected in 3-h intervals and aged to
generate animals 0-3, 3-6, 6-9, 9-12, 12-15 and 15-18 h old.
com
ment
reviews
reports
deposited research
interactions
inform
ation
refereed research
http://genomebiology.com/2002/3/12/research/0088.11
Figure 9Examples of interesting observations from this project. (a-d) Three adjacent Brachyury/T-box genes - (a) CG5093, (b) CG5107, (c) Dorsocross - showremarkably similar expression patterns at cellular blastoderm and are located next to each other on the chromosome (d). (e-i) Expression patterns offive genes with homology to metabolic and detoxification enzymes: (e) hydroxyacylglutathione hydrolase, CG9026; (f), cytochrome P450, Cyp310a;(g) multi-drug resistance gene, Mdr49; (h) xanthine dehydrogenase, rosy; and (i) transketolase, CG8036. (j) Dorsal view of a stage-8 embryo stained with aprobe that reveals apically localized mRNAs (CG18375) within the developing hindgut epithelium, contrasted with basally localized mRNA (CG11207) inthe same cells (k). (l) Close-up of (j) highlighting the apically localized mRNA in the epithelium surrounding the invaginating hindgut pocket with polecells (pc). A single epithelial cell is outlined. (m) Close-up of (K) revealing an equivalent region of an embryo as (l) and highlighting the basally localizedmRNA. (n) Portion of the dorsal side of a pre-blastoderm embryo stained for mRNA (CG1962) that appears to be localized to an unidentified subnuclearcompartment. (o) Close-up of five nuclei from (n).
pc pc
(a)
(d)
(e)
(j)
(k)
(l) (m) (n)
(o)
(f) (g) (h) (i)
(b) (c)
00
CG5068 CG5087 CG5093
CG5187
8910000
CG5288 smg
8920000 8930000 8940000 8950000 8960000
Dorsocross
8970000
Argk
The embryos were then dechorionated, devitelinized, and
stored in methanol at -20°C. The six 3-h embryo collections
were mixed in equal proportions to yield a balanced popula-
tion of embryos representing the first 18 h of embryogenesis.
DNA templates were generated by PCR using primers
homologous to the vector and purified by G50 column chro-
matography in 96-well format. The purified PCR product
(5 �l) was transcribed in 96-well format by incubation for
2 h at 37°C after the addition of 5 �l of a polymerase reaction
cocktail consisting of 2 U T7 RNA polymerase, 4.6 U RNase
inhibitor, 10 mM NTPs, 3.5 mM digoxigenin-11-UTP, 40 mM
Tris pH 8.0, 6 mM MgCl2, 10 mM DTT and 2 mM spermi-
dine. After treatment with DNase I and Na2CO3 pH 10.2,
ethanol precipitation was carried out. Pellets were resus-
pended in 50 �l of 50% formamide, 5 mM Tris-HCl pH 7.5,
0.5 mM EDTA and 0.01% Tween 20.
The digoxigenin-labeled RNA probe was quantified by
immunological detection using a modified digoxigenin quan-
tification protocol (Roche). A sample of 0.8 �l of a 1:300 dilu-
tion of the probe was spotted on a positively charged nylon
membrane (Roche) with a 96-well pin tool (V&P Scientific)
and then cross-linked to the membrane by UV irradiation.
The membranes were then treated with anti-digoxigenin-AP
Fab fragments and the color substrates NBT/BCIP. The
quality of each probe was determined by comparing the
intensity of individual probe spots to spots containing 3, 10,
30, 100 or 300 pg of control probes.
Re-hydrated and post-fixed embryos were incubated for 1 h
in hybridization buffer (50% formamide, 4x SSC, and 0.01%
Tween 20). Twenty microliters of these embryos were gently
placed in each well of a 96-well filter plate (Millipore MADV
N65) with a multi-channel pipette (Brand Transferpette-12)
using wide-orifice 250 �l pre-sterilized tips (Rainin). Digoxi-
genin-labeled RNA probe (200 �l of a 1:100 dilution in
hybridization buffer with 5% dextran sulfate) was added and
the embryos were incubated overnight at 55°C. Gentle
vacuum was used to remove the hybridization solution and
the embryos were subjected to eight 30-min washes in wash
buffer (50% formamide, 2x SSC and 0.01% Tween 20). The
embryos were treated for 2 h with 5% goat serum (Roche)
and anti-digoxigenin-AP Fab fragments (Roche). Following
nine 10-min washes in 0.1% Tween 20 in PBS and two rinses
in AP buffer (50 mM MgCl2, 100 mM NaCl, 100 mM Tris pH
9.5, 0.01% Tween 20) the NBT/BCIP color substrates were
used to detect the hybridized probes. Embryos were washed
six times with ethanol to enhance contrast and stored in 70%
glycerol in PBS. The quality of the hybridization signal, the
morphology of the embryos and the number of patterns were
assessed under a low-power microscope.
Digital imaging Low-magnification images were taken using a dissecting
microscope (Leica Wild M10) equipped with a ProgRes 3012
digital camera. Usually two images at different magnifications
were captured. High-resolution images were captured with a
Spot RT digital camera mounted onto a Zeiss Axiophot
equipped with Nomarski optics. The majority of images were
taken with either a 20x or 40x objective. All images were
saved as JPEG files.
Often several focal planes of the same embryo were captured
to fully document the spatial distribution of the staining
pattern. In many cases embryos were manually repositioned
to provide a more favorable angle for documenting the
expression pattern. When a whole embryo view was insuffi-
cient to visualize the fine aspects of the staining pattern, we
captured a higher-magnification image focused on a small
part of the embryo. Such higher-resolution images were gen-
erally accompanied by corresponding lower-magnification
images for orientation purposes. Most images show the
embryo with anterior to the left and dorsal side up; however,
the orientation of images captured in the early stages of the
project do not consistently follow this rule.
Microarray analysis Canton S flies were seeded into 12 population cages and aged
in the collection cages for three days with fresh food pro-
vided every 12 h. In the morning of the fourth day, the flies
were allowed to pre-lay retained embryos. Fresh plates were
then introduced simultaneously into all 12 cages and
embryos were collected for 1 h. The embryos were then
transferred into a 25°C incubator and aged. At appropriate
time points, embryos were dechorionated and quick-frozen
in liquid nitrogen. This procedure yielded 12 samples of non-
overlapping 1-h collections starting from 30 to 90 min and
ending at 11.5 h to 12.5 h post egg laying. This procedure was
carried out for 3 days, yielding three replicates of each time
window. A sampling of each collection was set aside,
devitelinized, and stored in methanol at -20°C. These
embryos were used to determine the distribution of stages in
each collection sample by examination of morphological
markers. These data were then used to construct an approxi-
mate time line correlating the embryo collections and
embryonic stages (see Figure 4).
Total RNA was isolated from the 12 embryo samples
described above by homogenization with a motorized
plastic pellet pestle in Ambion RNAwiz solution, followed
by chloroform extraction and ethanol precipitation. Eight
micrograms of total RNA were used to generate digoxi-
genin-labeled fragmented cRNA using a standard
Affymetrix amplification and labeling protocol. cRNA was
hybridized to a GeneChip Drosophila Genome Array using
standard Affymetrix equipment and protocols. The
scanned array images were analyzed using Affymetrix
Microarray Suite and dChip software [37]. We collected 36
GeneChip array scans and the success of the experiments
was determined by the reproducibility of the three inde-
pendent replicates. Two of the 36 experiments were
12 Genome Biology Vol 3 No 12 Tomancak et al.
repeated to gain higher-quality data. Microarray data are
being submitted to Array Express as E-RUBN-2.
Signals from all replicate experiments were averaged and the
standard error of the three measurements was calculated.
Data were entered into a custom-designed MySQL database
and graphs of the microarray time-course for all 14,000
genes were generated using custom Perl scripts and a GD
graphics library. The absent/present calls generated by
Affymetrix Microarray Suite were color-coded (present =
green, absent = red, marginal = blue) and incorporated into
graphs based on dChip-derived data. The array-based
expression profiles were incorporated into the annotation,
report, and analysis web pages described below.
Image data annotation and presentationWe built a multi-platform network consisting of two
Microsoft Windows workstations connected to digital
cameras on microscope equipment and a Suse Linux server
running an Apache HTTP server and MySQL database.
Image data and annotations were submitted to the produc-
tion MySQL database through a Perl-based annotation tool
(Figure 2). The annotation tool displays microarray data
linked to the cDNA under investigation as well as a compila-
tion of available information about that gene in the form of
external database links, protein domains and GO terms
(from FlyBase [38]). The annotation tool permits the enter-
ing of production-level assessments about the quality and
identity of the captured images. Several other web-based
tools were developed that support the entering of additional
data (Figure 1a-d) as well as report scripts that summarize
the captured data.
Periodically, the data from the production database were
transferred into a second MySQL database that uses a
schema modified from that of the GO database. In conjunc-
tion with the Gadfly database and Application Programming
Interface (see [27]), this database allows gene-based and
anatomy-based searches of the dataset [26].
The controlled vocabulary used to annotate the gene-expres-
sion profiles is a subset of the FlyBase controlled vocabulary
for anatomy and development [39]. Most annotation terms
can be found under the ‘developing embryonic structure’
branch of this ontology. We developed a modified version of
the Amigo Gene Ontology Browser, ImaGO [28], which
incorporates the anatomy ontologies and the image data.
ImaGO can be used to browse through and search the data
by anatomical structures. A more concise version of the
annotation hierarchy containing only the terms found in the
annotation tool can be accessed at [40].
Clustering of annotation data Annotation data were converted into a binary matrix, the
rows representing the genes and the columns representing
the anatomical structures. When a given gene was expressed
in a given anatomical structure the intersection in the matrix
was 1; otherwise it was 0. The matrix was loaded into an R
statistics package and dissimilarity matrices were calculated
for each two rows and each two columns of the dataset. The
distance measure was (b + c)/(a + b + c), where a is the fre-
quency of 11 columns in two rows of binary data, b is the fre-
quency of 10 columns and c is the frequency of 01 columns.
Using the dissimilarity matrices, anatomical structures and
genes were clustered sequentially using hierarchical cluster-
ing with a complete linkage agglomeration method. Clus-
tered matrices were exported from R and converted into
interactive web pages using a custom Perl script. The binary
data were color-coded; black indicates that the gene is on in
a structure, white indicates that expression of the gene is not
detected in that structure.
Acknowledgements We thank Audrey Huang for helpful comments on the manuscript, TerrySpeed (University of California, Berkeley) for valuable advice on clusteringof binary data, Bradley Marshall for modification of the AmiGO interfaceand Ben Berman for useful discussions. Trina Agbayani and Joseph Nunooprovided technical assistance in the early stages of this project. This workwas supported by the Howard Hughes Medical Institute and by NIHGrants P50 HG00750 (to G.R.) and P41 HG00739 (to W. Gelbart).
References1. Pollet N, Niehrs C: Expression profiling by systematic high-
throughput in situ hybridization to whole-mount embryos.Methods Mol Biol 2001, 175:309-321.
2. Lipshutz RJ, Fodor SP, Gingeras TR, Lockhart DJ: High density syn-thetic oligonucleotide arrays. Nat Genet 1999, 21(Suppl):20-24.
3. Lockhart DJ, Dong H, Byrne MC, Follettie MT, Gallo MV, Chee MS,Mittmann M, Wang C, Kobayashi M, Horton H, et al.: Expressionmonitoring by hybridization to high-density oligonucleotidearrays. Nat Biotechnol 1996, 14:1675-1680.
4. Brown PO and Botstein D: Exploring the new world of thegenome with DNA microarrays. Nat Genet 1999,21(Suppl):33-37.
5. Jones KW, Robertson FW: Localisation of reiteratednucleotide sequences in Drosophila and mouse by in situhybridisation of complementary RNA. Chromosoma 1970,31:331-345.
6. Harrison PR, Conkie D, Paul J, Jones K: Localisation of cellularglobin messenger RNA by in situ hybridisation to comple-mentary DNA. FEBS Lett 1973, 32:109-112.
7. Simin K, Scuderi A, Reamey J, Dunn D, Weiss R, Metherall JE, LetsouA: Profiling patterned transcripts in Drosophila embryos.Genome Res 2002, 12:1040-1047.
8. Kopczynski CC, Noordermeer JN, Serano TL, Chen WY, PendletonJD, Lewis S, Goodman CS, Rubin GM: A high throughput screento identify secreted and transmembrane proteins involvedin Drosophila embryogenesis. Proc Natl Acad Sci USA 1998,95:9973-9978.
9. Furlong EE, Andersen EC, Null B, White KP, Scott MP: Patterns ofgene expression during Drosophila mesoderm development.Science 2001, 293:1629-1633.
10. Kim SK, Lund J, Kiraly M, Duke K, Jiang M, Stuart JM, Eizinger A,Wylie BN, Davidson GS: A gene expression map forCaenorhabditis elegans. Science 2001, 293:2087-2092.
11. Spellman PT, Sherlock G, Zhang MQ, Iyer VR, Anders K, Eisen MB,Brown PO, Botstein D, Futcher B: Comprehensive identificationof cell cycle-regulated genes of the yeast Saccharomycescerevisiae by microarray hybridization. Mol Biol Cell 1998,9:3273-3297.
12. Chudin E, Walker R, Kosaka A, Wu SX, Rabert D, Chang TK,Kreder DE: Assessment of the relationship between signal
com
ment
reviews
reports
deposited research
interactions
inform
ation
refereed research
http://genomebiology.com/2002/3/12/research/0088.13

intensities and transcript concentration for AffymetrixGeneChip arrays. Genome Biol 2001, 3:research0005.1-0005.10
13. Schena M, Shalon D, Davis RW, Brown PO: Quantitative moni-toring of gene expression patterns with a complementaryDNA microarray. Science 1995, 270:467-470.
14. Rubin GM, Hong L, Brokstein P, Evans-Holm M, Frise E, Stapleton M,Harvey DA: A Drosophila complementary DNA resource.Science 2000, 287:2222-2224.
15. Stapleton M, Liao G, Brokstein P, Hong L, Carninci P, Shiraki T,Hayashizaki Y, Champe M, Pacleb J, Wan K, et al.: The Drosophilagene collection: identification of putative full-length cDNAsfor 70% of D. melanogaster genes. Genome Res 2002, 12:1294-1300.
16. Stapleton M, Carlson J, Brokstein P, Yu C, Champe M, George R,Guarin H, Pacleb J, Park S, Wan K, et al.: A Drosophila full-lengthcDNA resource. Genome Biol 2002, 3:research0080.1-0080.8
17. Hartenstein V, Campos-Ortega JA: The Embryonic Development ofDrosophila melanogaster, 2nd edn. Heidelberg: Springer-Verlag;1997.
18. Patterns of gene expression in Drosophila embryogenesis[http://www.fruitfly.org/cgi-bin/ex/insitu.pl]
19. Tautz D, Pfeifle C: A non-radioactive in situ hybridizationmethod for the localization of specific RNAs in Drosophilaembryos reveals translational control of the segmentationgene hunchback. Chromosoma 1989, 98:81-85.
20. Bownes M: A photographic study of development in the livingembryo of Drosophila melanogaster. J Embryol Exp Morphol 1975,33:789-801.
21. Arbeitman MN, Furlong EE, Imam F, Johnson E, Null BH, Baker BS,Krasnow MA, Scott MP, Davis RW, White KP: Gene expressionduring the life cycle of Drosophila melanogaster. Science 2002,297:2270-2275.
22. Crews ST, Thomas JB, Goodman CS: The Drosophila single-minded gene encodes a nuclear protein with sequence simi-larity to the per gene product. Cell 1988, 52:143-151.
23. The FlyBase Consortium: The FlyBase database of theDrosophila genome projects and community literature.Nucleic Acids Res 2002, 30:106-108.
24. Ashburner M, Ball CA, Blake JA, Botstein D, Butler H, Cherry JM,Davis AP, Dolinski K, Dwight SS, Eppig JT, et al.: Gene ontology:tool for the unification of biology. The Gene Ontology Con-sortium. Nat Genet 2000, 25:25-29.
25. Gene Ontology database - GO database schema[http://www.godatabase.org/dev/database]
26. BDGP gene expression query interface[http://www.fruitfly.org/cgi-bin/ex/basic.pl]
27. Mungall CJ, Misra S, Berman BP, Carlson J, Frise E, Harris N, MarshallB, Shu S, Kaminker JS, Prochnik SE, et al.: An integrated computa-tional pipeline and database to support whole genomesequence annotation. Genome Biol 2002, 3:research0081.1-0081.11
28. ImaGO [http://www.fruitfly.org/cgi-bin/ex/go.cgi]29. Pollet N, Schmidt HA, Gawantka V, Niehrs C, Vingron M: In silico
analysis of gene expression patterns during early develop-ment of Xenopus laevis. Pac Symp Biocomput 2000:443-454.
30. Eisen MB, Spellman PT, Brown PO, Botstein D: Cluster analysisand display of genome-wide expression patterns. Proc NatlAcad Sci USA 1998, 95:14863-14868.
31. Annotation clustering[http://www.fruitfly.org/ex/annotation_clustering.html]
32. Nusslein-Volhard C, Wieschaus E: Mutations affecting segmentnumber and polarity in Drosophila. Nature 1980, 287:795-801.
33. Gawantka V, Pollet N, Delius H, Vingron M, Pfister R, Nitsch R, Blu-menstock C, Niehrs C: Gene expression screening in Xenopusidentifies molecular pathways, predicts gene function andprovides a global view of embryonic patterning. Mech Dev1998, 77:95-141.
34. Neidhardt L, Gasca S, Wertz K, Obermayr F, Worpenberg S,Lehrach H, Herrmann BG: Large-scale screen for genes con-trolling mammalian embryogenesis, using high-throughputgene expression analysis in mouse embryos. Mech Dev 2000,98:77-94.
35. Henrich T, Wittbrodt J: An in situ hybridization screen for therapid isolation of differentially expressed genes. Dev GenesEvol 2000, 210:28-33.
36. NEXTDB: the nematode expression pattern database[http://nematode.lab.nig.ac.jp/index.html]
37. Li C, Hung Wong W: Model-based analysis of oligonucleotidearrays: model validation, design issues and standard errorapplication. Genome Biol 2001, 2:research0032.1-0032.11.
38. FlyBase [http:www.flybase.org]39. FlyBase controlled vocabulary for anatomy
[http://flybase.bio.indiana.edu/docs/lk/bodyparts-cv.txt]40. Annotation hierarchy
[http://www.fruitfly.org/cgi-bin/ex/insitu_hierarchy.pl]
14 Genome Biology Vol 3 No 12 Tomancak et al.