Embed Size (px)
Citation preview

Research Strategies to Test Behavioral/Psychotherapy Treatments for Substance Use Disorders: Several Examples
Richard A. Rawson, Ph.DUCLA ISAP
Cairo, Egypt Sept 27, 2004

Research on Behavioral/Psychotherapy Treatments: Considerations
Many of the research design principles described for medication research apply
We want to compare our experimental treatment with a standardized comparison condition.
The comparison condition has to be minimal, but defensible from an ethical point of view.
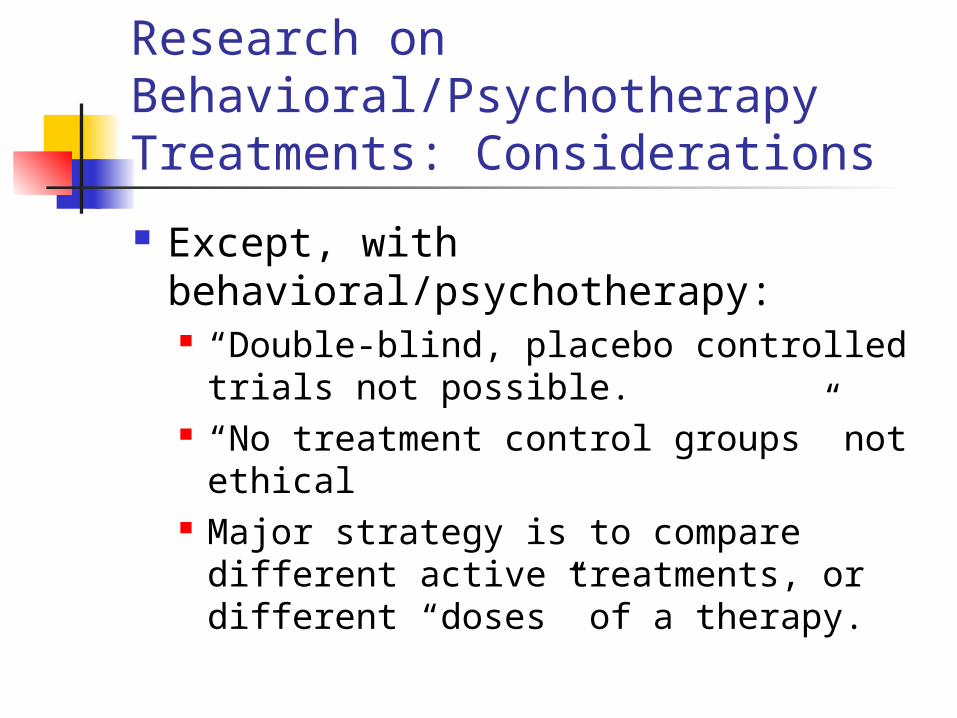
Research on Behavioral/Psychotherapy Treatments: Considerations
Except, with behavioral/psychotherapy: “Double-blind, placebo controlled trials
not possible. “No treatment control groups” not
ethical Major strategy is to compare different
active treatments, or different “doses” of a therapy.
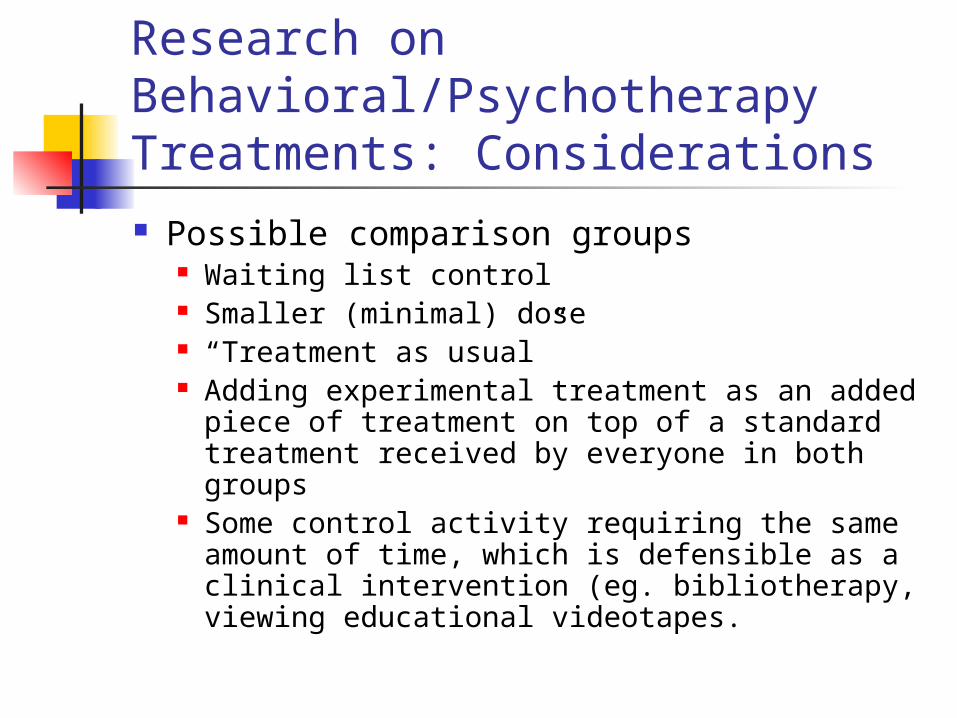
Research on Behavioral/Psychotherapy Treatments: Considerations Possible comparison groups
Waiting list control Smaller (minimal) dose “Treatment as usual” Adding experimental treatment as an added
piece of treatment on top of a standard treatment received by everyone in both groups
Some control activity requiring the same amount of time, which is defensible as a clinical intervention (eg. bibliotherapy, viewing educational videotapes.

Research on Behavioral/Psychotherapy Treatments: Considerations
Fidelity measures are critical (are they getting the therapy we want to test)
Specific therapist effects How much of the “dose” do they
actually receive? (as opposed to what they receive ideally)
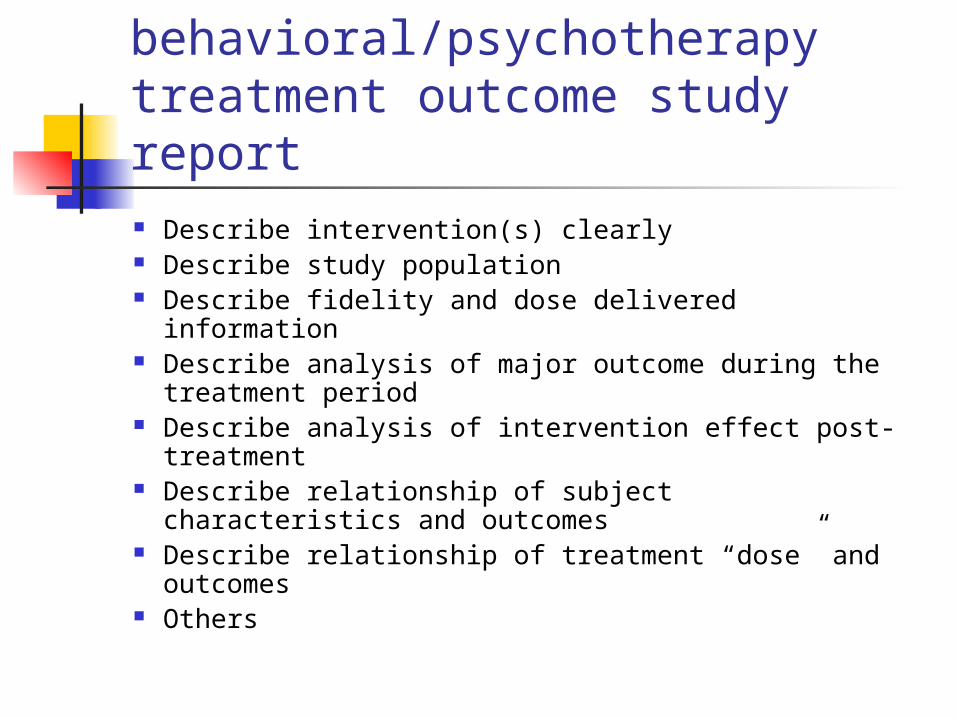
Elements in a successful behavioral/psychotherapy treatment outcome study report Describe intervention(s) clearly Describe study population Describe fidelity and dose delivered information Describe analysis of major outcome during the
treatment period Describe analysis of intervention effect post-
treatment Describe relationship of subject characteristics and
outcomes Describe relationship of treatment “dose” and
outcomes Others
A Multi-Site Comparison of Psychosocial Approaches for the Treatment of Methamphetamine Dependence Richard A. Rawson, Ph.D.and The Methamphetamine Treatment Project Corporate Authors*
Addiction (2004, June)
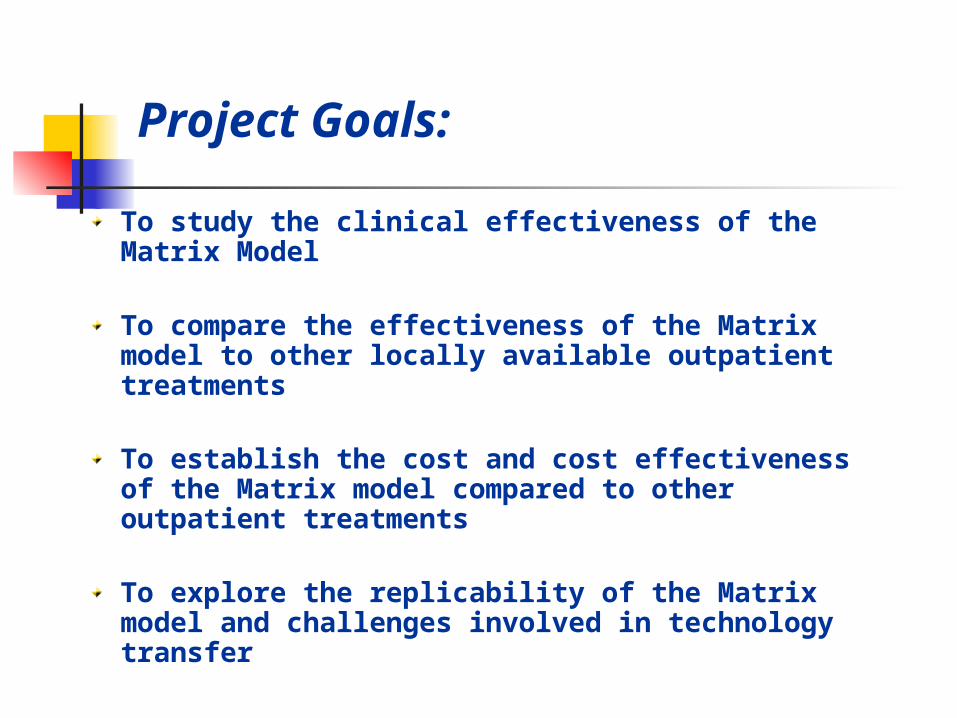
Project Goals:
To study the clinical effectiveness of the Matrix Model
To compare the effectiveness of the Matrix model to other locally available outpatient treatments
To establish the cost and cost effectiveness of the Matrix model compared to other outpatient treatments
To explore the replicability of the Matrix model and challenges involved in technology transfer
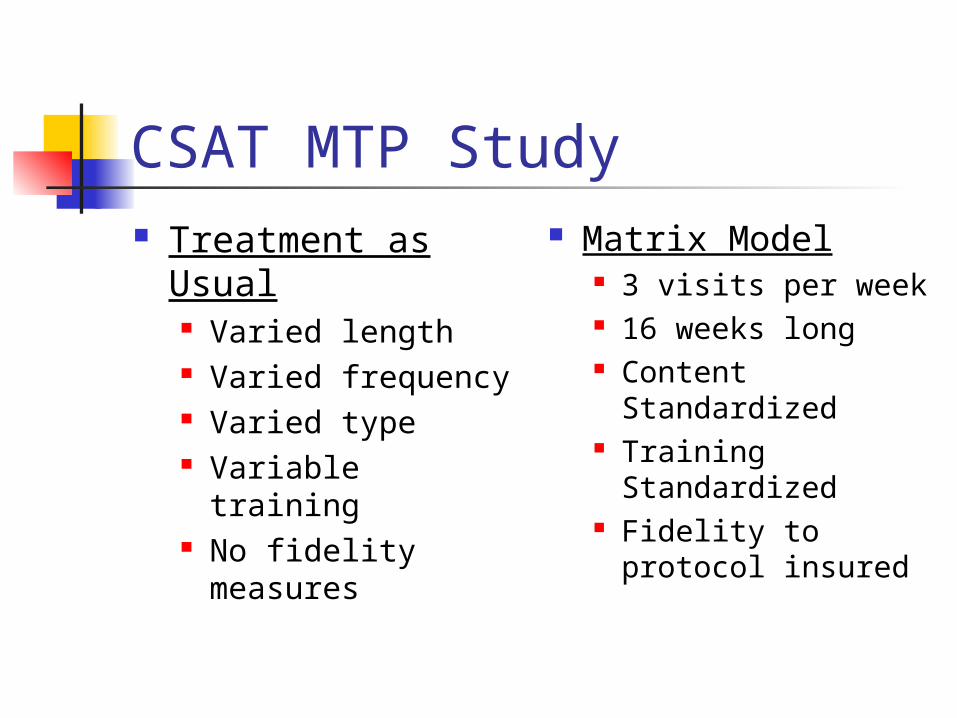
CSAT MTP Study Treatment as
Usual Varied length Varied frequency Varied type Variable training No fidelity
measures
Matrix Model 3 visits per week 16 weeks long Content
Standardized Training
Standardized Fidelity to protocol
insured
Sample Description
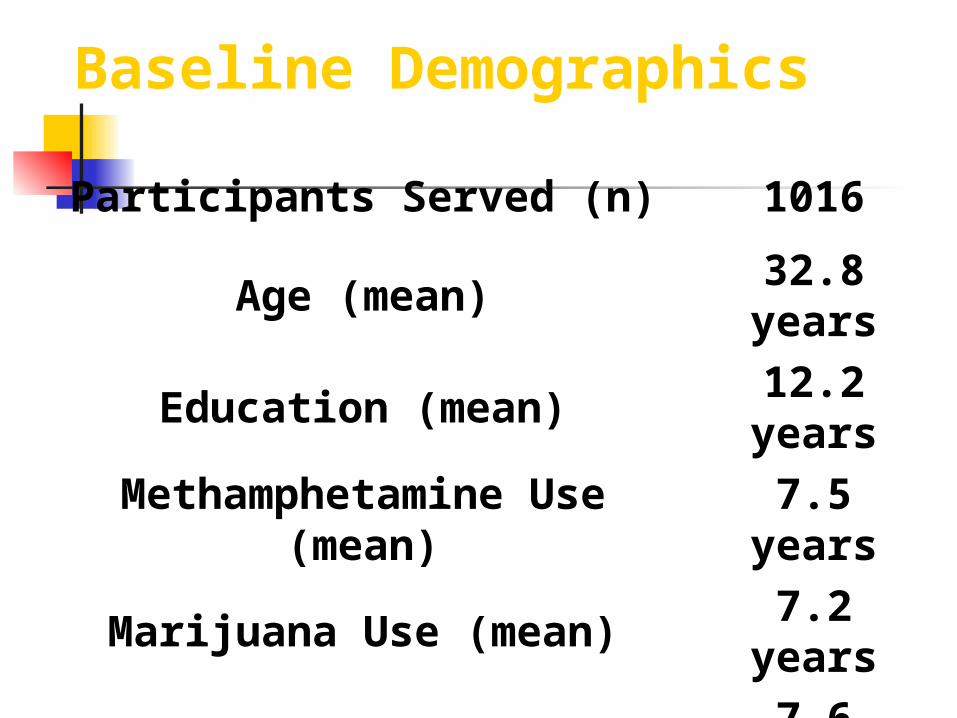
Baseline Demographics
Participants Served (n) 1016
Age (mean)32.8 years
Education (mean)12.2 years
Methamphetamine Use (mean)
7.5 years
Marijuana Use (mean)7.2
years
Alcohol Use (mean)7.6
years
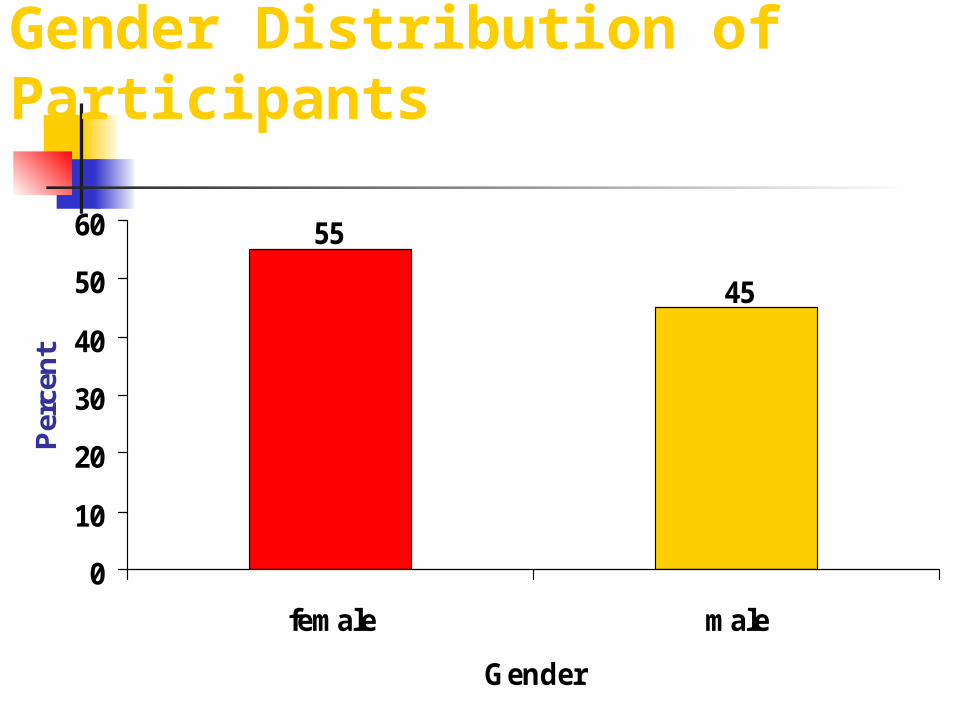
Gender Distribution of Participants
45
55
0
10
20
30
40
50
60
female male
Gender
Per
cen
t
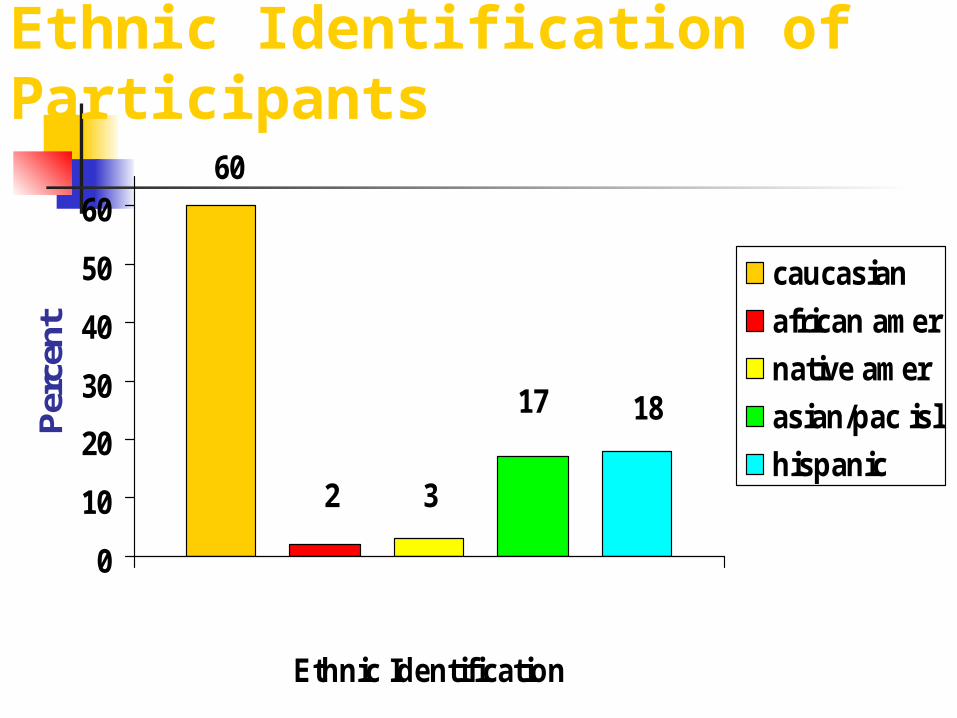
Ethnic Identification of Participants
60
2 3
17 18
0
10
20
30
40
50
60
Ethnic Identification
Per
cent
caucasian
african amer
native amer
asian/pac isl
hispanic
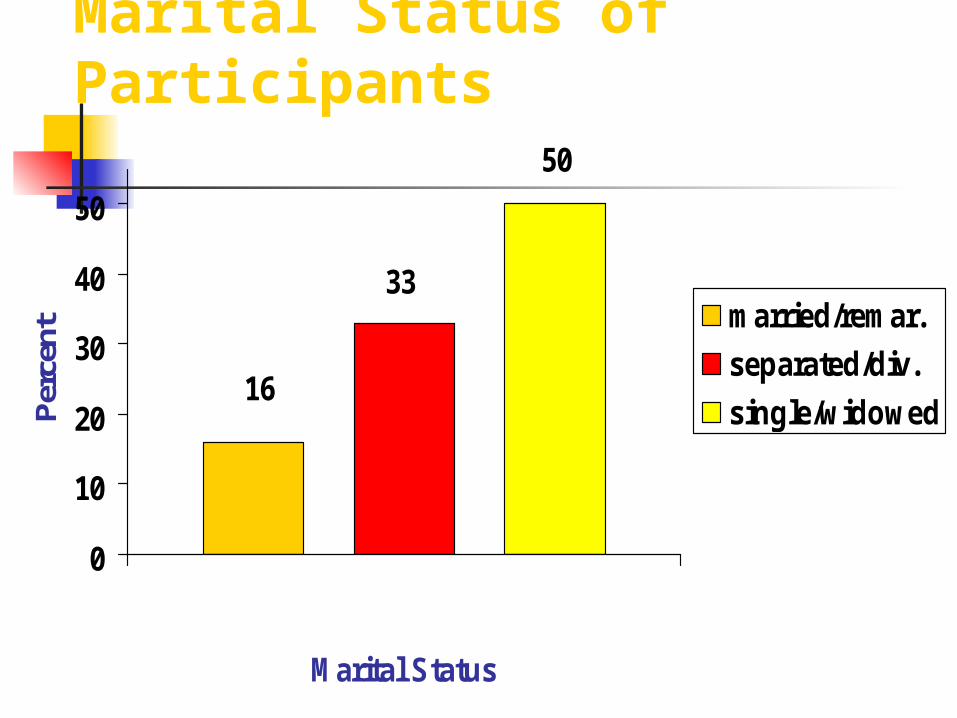
Marital Status of Participants
16
33
50
0
10
20
30
40
50
Marital Status
Per
cent
married/remar.
separated/div.
single/widowed
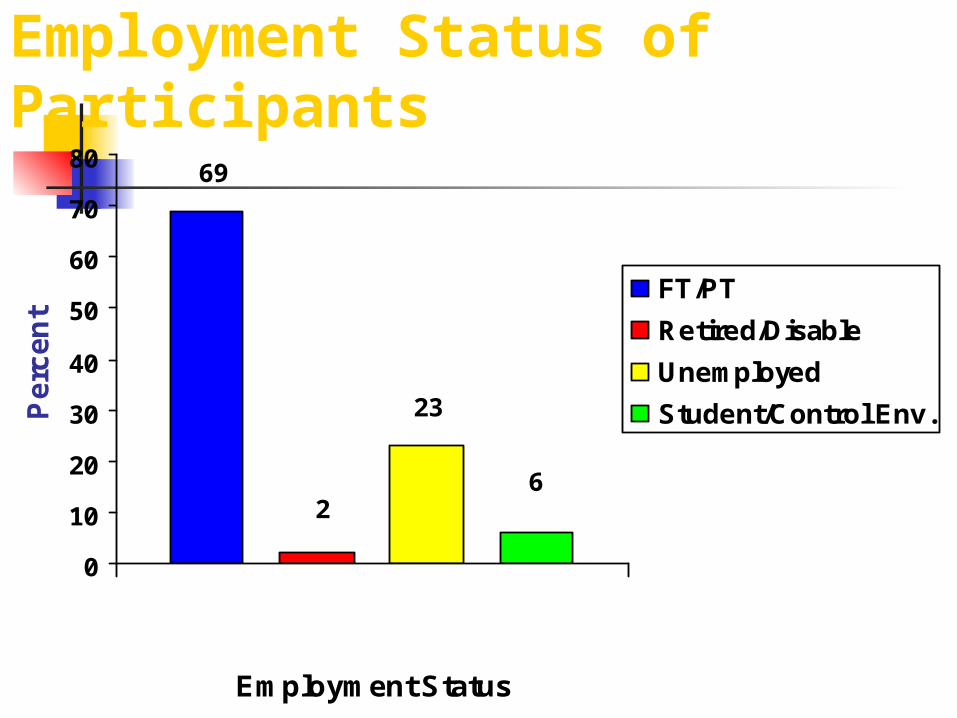
Employment Status of Participants
69
2
23
6
0
10
20
30
40
50
60
70
80
Employment Status
Pe
rce
nt
FT/PT
Retired/Disable
Unemployed
Student/Control Env.
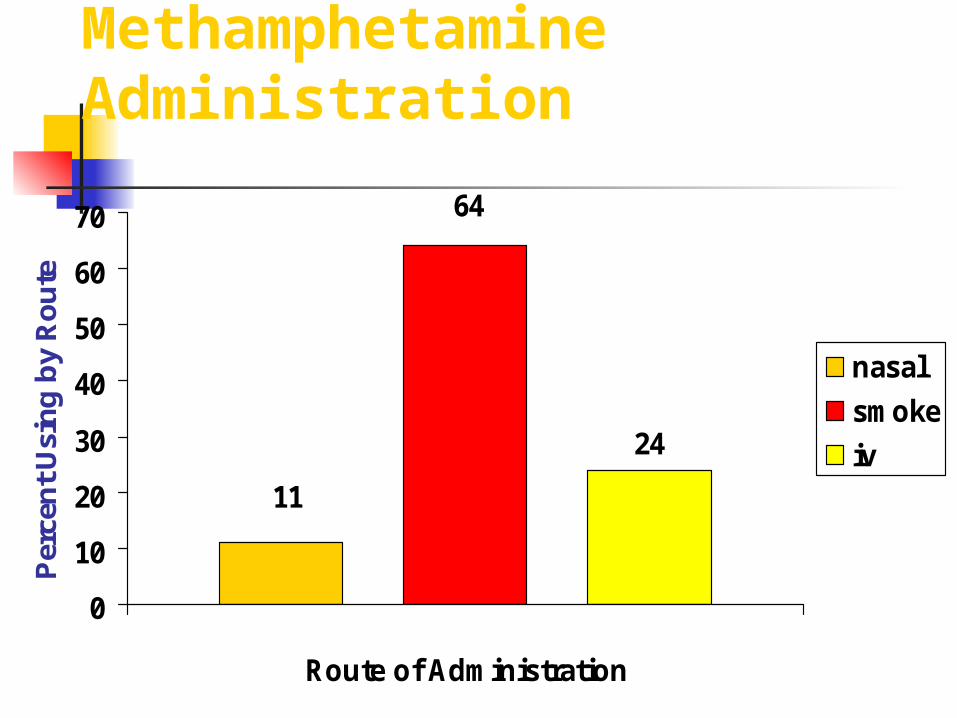
Route of Methamphetamine Administration
24
11
64
0
10
20
30
40
50
60
70
Route of Administration
Per
cen
t U
sin
g b
y R
ou
te
nasal
smoke
iv
Changes from Baseline to Treatment-end
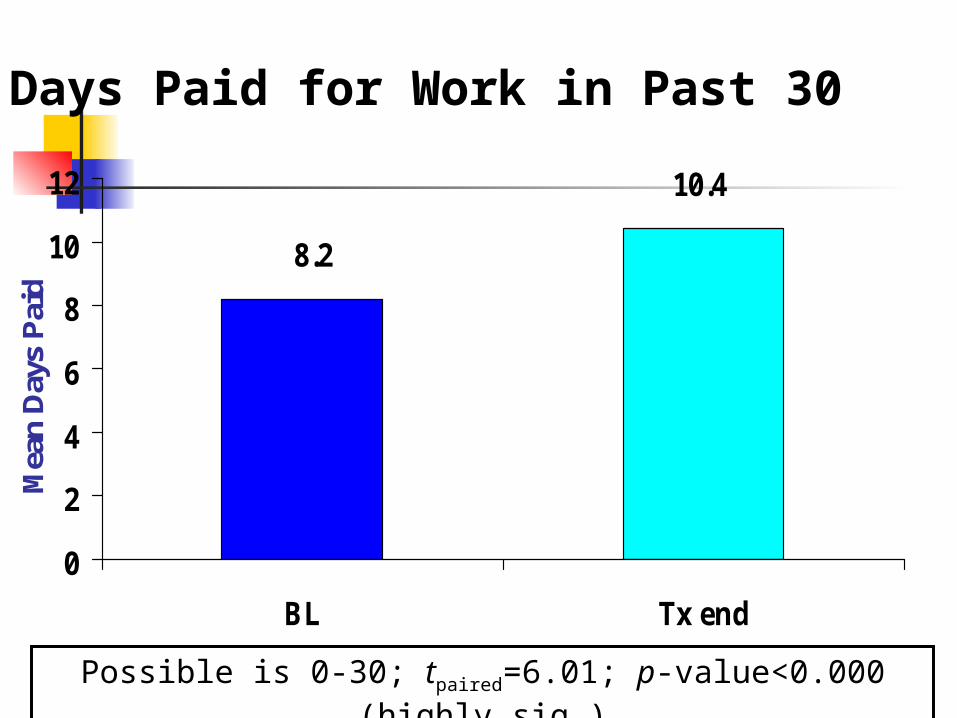
Days Paid for Work in Past 30
10.4
8.2
0
2
4
6
8
10
12
BL Tx end
Mea
n D
ays
Pai
d
Possible is 0-30; tpaired=6.01; p-value<0.000 (highly sig.)
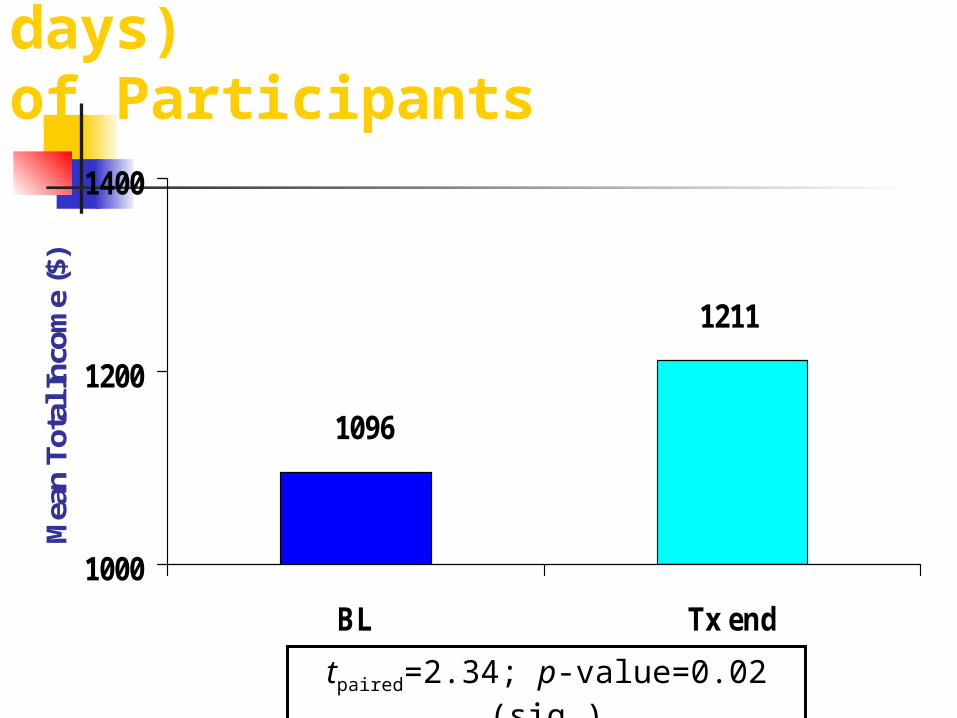
Total Income (Past 30 days)of Participants
1211
1096
1000
1200
1400
BL Tx end
Mea
n To
tal I
ncom
e ($
)
tpaired=2.34; p-value=0.02 (sig.)
0.53
0.230.260.24
0.21
0.11
0.21 0.220.19
0.10
0.15
0.08
0.49
0.21
0.0
0.1
0.2
0.3
0.4
0.5
0.6
Me
an
Co
mp
os
ite
Sc
ore
BL
Tx end
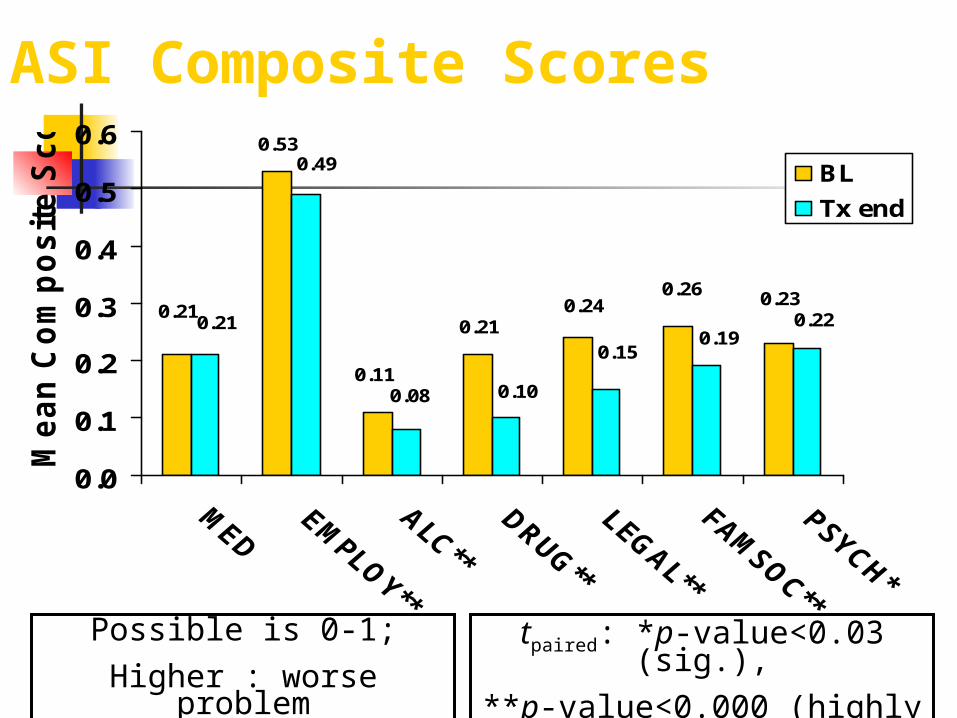
ASI Composite Scores
Possible is 0-1;
Higher : worse problemtpaired: *p-value<0.03 (sig.),
**p-value<0.000 (highly sig.)
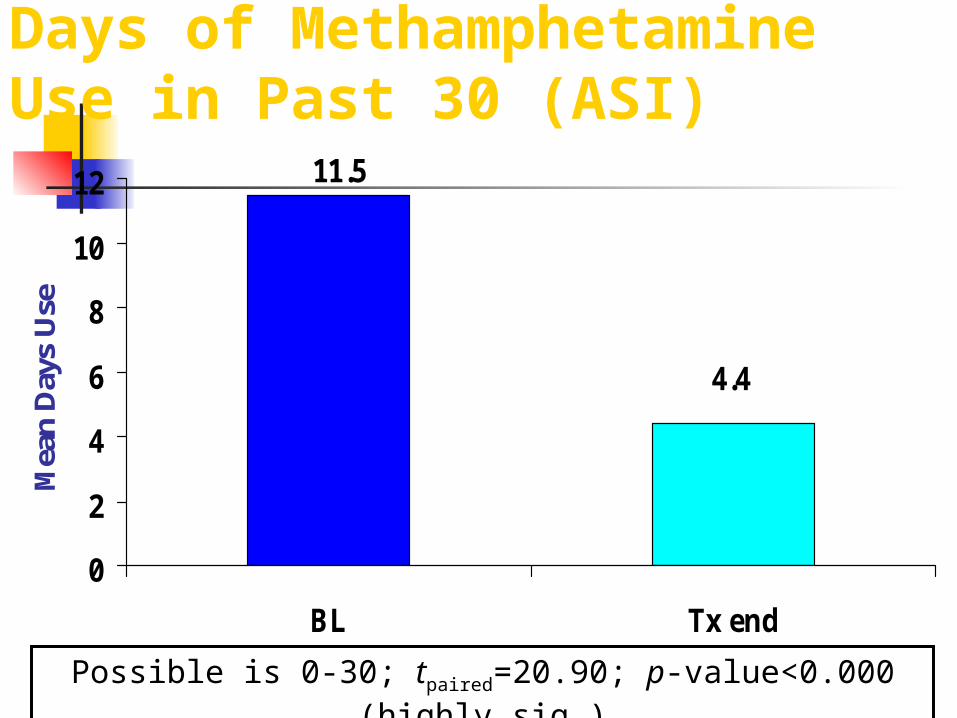
Days of Methamphetamine Use in Past 30 (ASI)
4.4
11.5
0
2
4
6
8
10
12
BL Tx end
Mea
n D
ays
Use
Possible is 0-30; tpaired=20.90; p-value<0.000 (highly sig.)
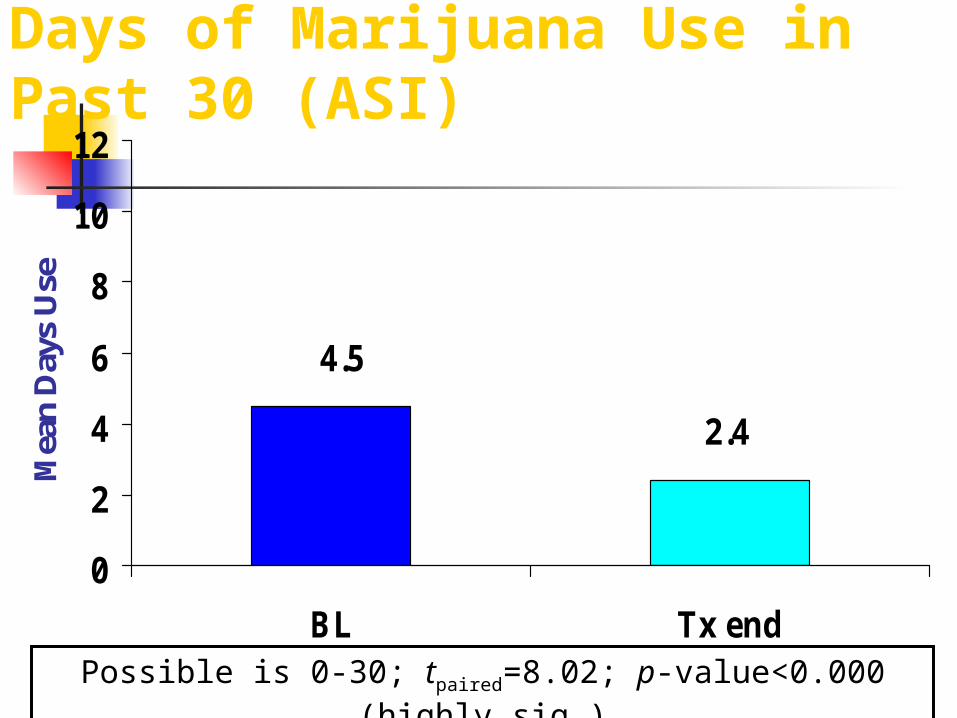
Days of Marijuana Use in Past 30 (ASI)
2.4
4.5
0
2
4
6
8
10
12
BL Tx end
Mea
n D
ays
Use
Possible is 0-30; tpaired=8.02; p-value<0.000 (highly sig.)
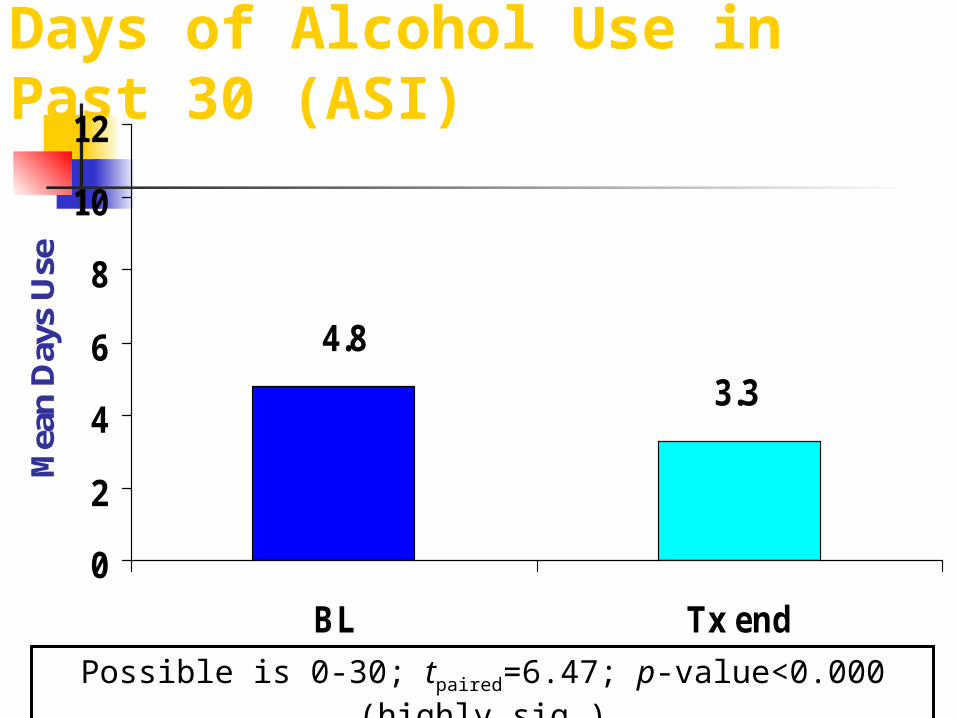
Days of Alcohol Use in Past 30 (ASI)
3.3
4.8
0
2
4
6
8
10
12
BL Tx end
Mea
n D
ays
Use
Possible is 0-30; tpaired=6.47; p-value<0.000 (highly sig.)
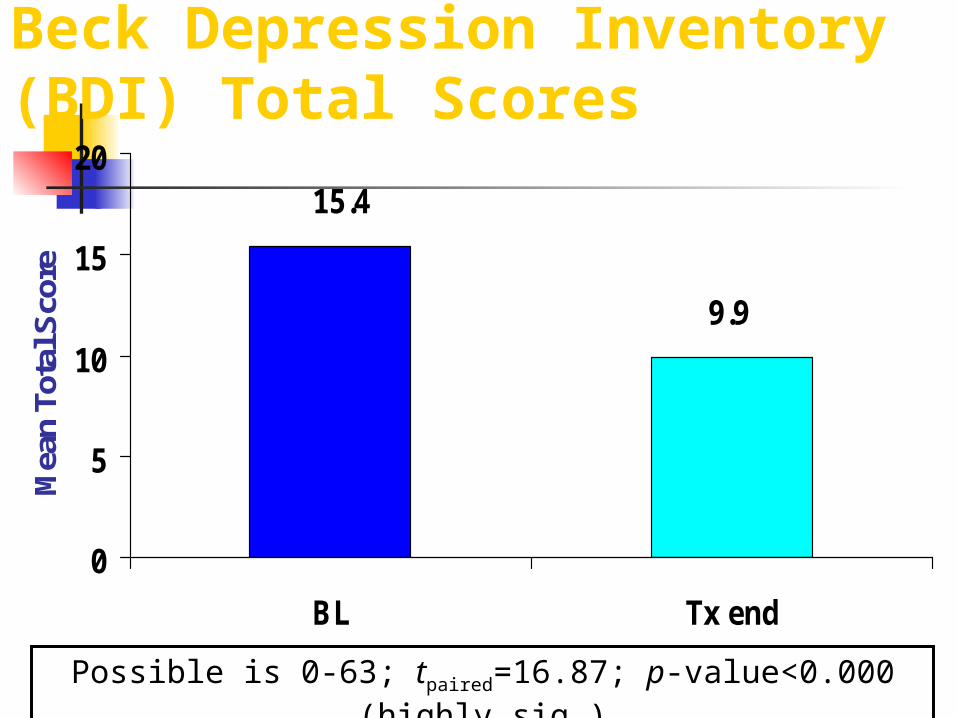
Beck Depression Inventory (BDI) Total Scores
9.9
15.4
0
5
10
15
20
BL Tx end
Mea
n To
tal S
core
Possible is 0-63; tpaired=16.87; p-value<0.000 (highly sig.)
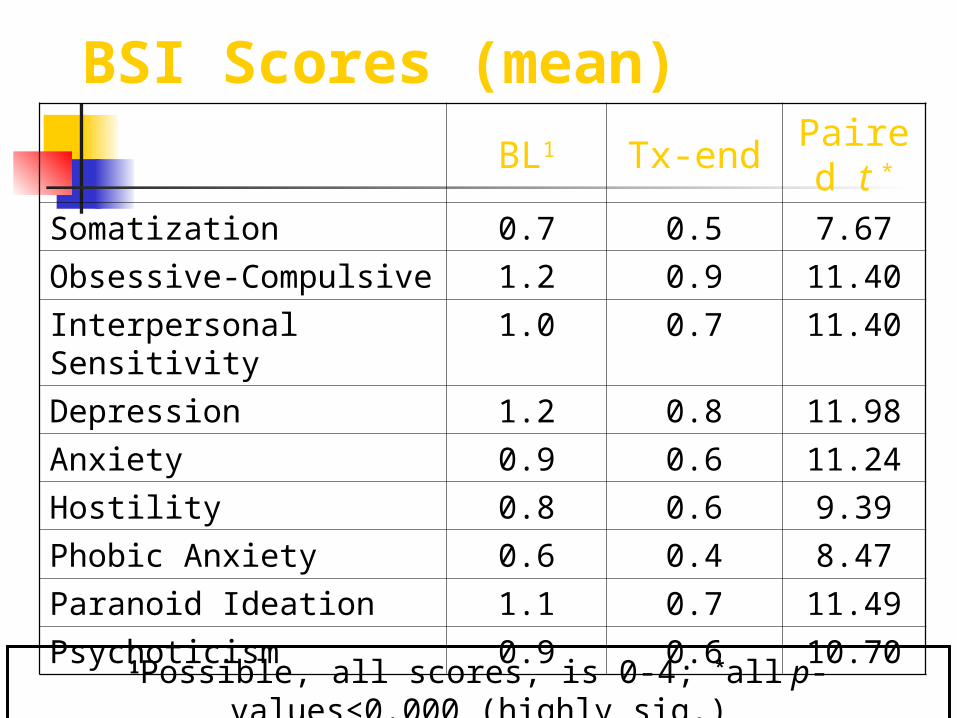
BSI Scores (mean)BL1 Tx-end
Paired t *
Somatization 0.7 0.5 7.67
Obsessive-Compulsive 1.2 0.9 11.40
Interpersonal Sensitivity
1.0 0.7 11.40
Depression 1.2 0.8 11.98
Anxiety 0.9 0.6 11.24
Hostility 0.8 0.6 9.39
Phobic Anxiety 0.6 0.4 8.47
Paranoid Ideation 1.1 0.7 11.49
Psychoticism 0.9 0.6 10.701Possible, all scores, is 0-4; *all p-values<0.000 (highly sig.)

Positive Symptom Total (PST) from Brief Symptom Inventory (BSI)
18
26
0
10
20
30
BL Tx end
Mea
n #
sym
ptom
s
Possible is 0-53; tpaired=14.33; p-value<0.000 (highly sig.)
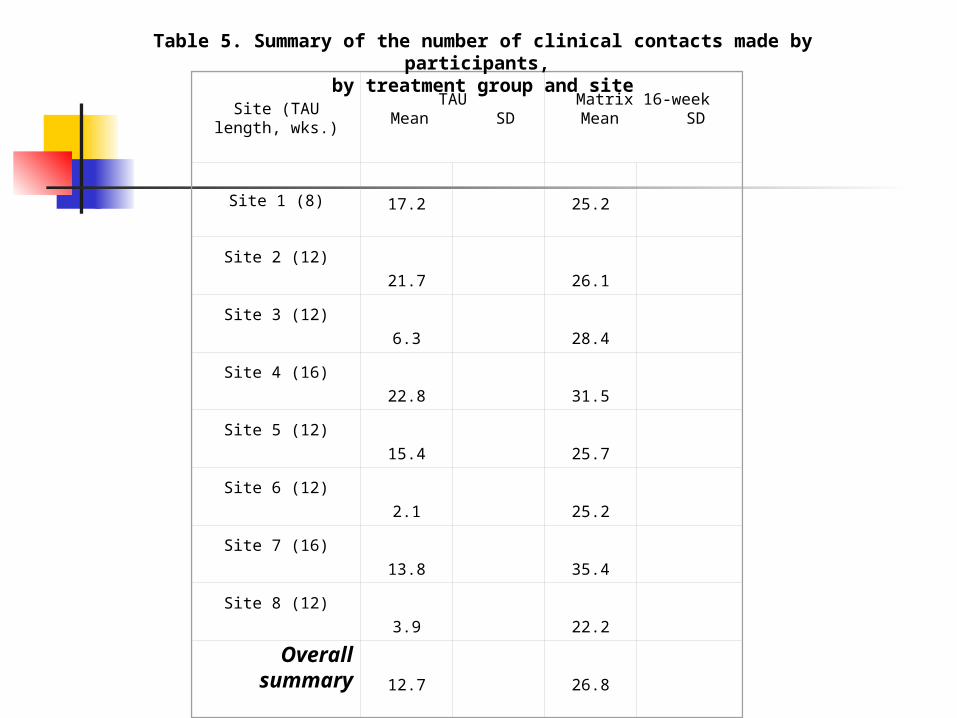
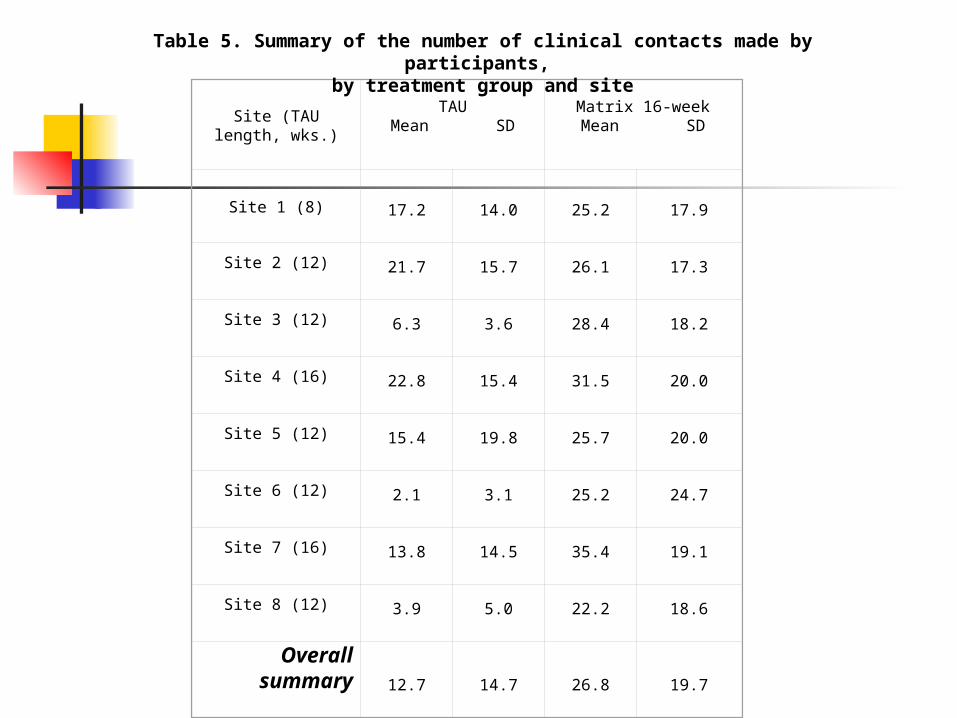
Site (TAU length,
wks.)
TAUMean SD
Matrix 16-weekMean SD
Site 1 (8) 17.2 25.2
Site 2 (12)
21.7 26.1
Site 3 (12)
6.3 28.4
Site 4 (16)
22.8 31.5
Site 5 (12)
15.4 25.7
Site 6 (12)
2.1 25.2
Site 7 (16)
13.8 35.4
Site 8 (12)
3.9 22.2
Overall summary 12.7 26.8
Table 5. Summary of the number of clinical contacts made by participants, by treatment group and site
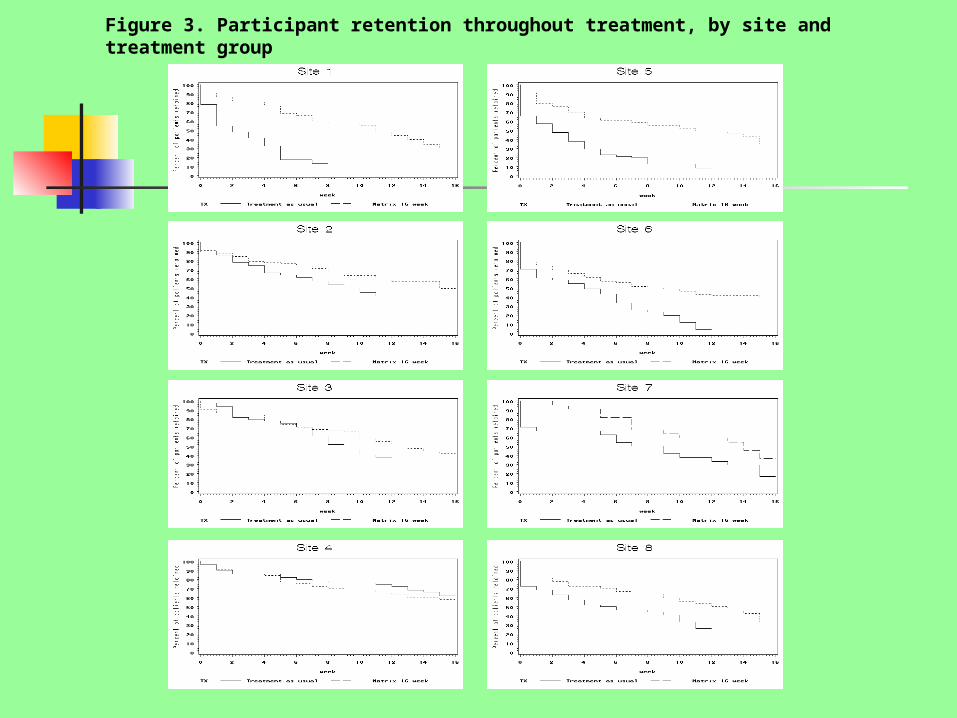
Figure 3. Participant retention throughout treatment, by site and treatment group

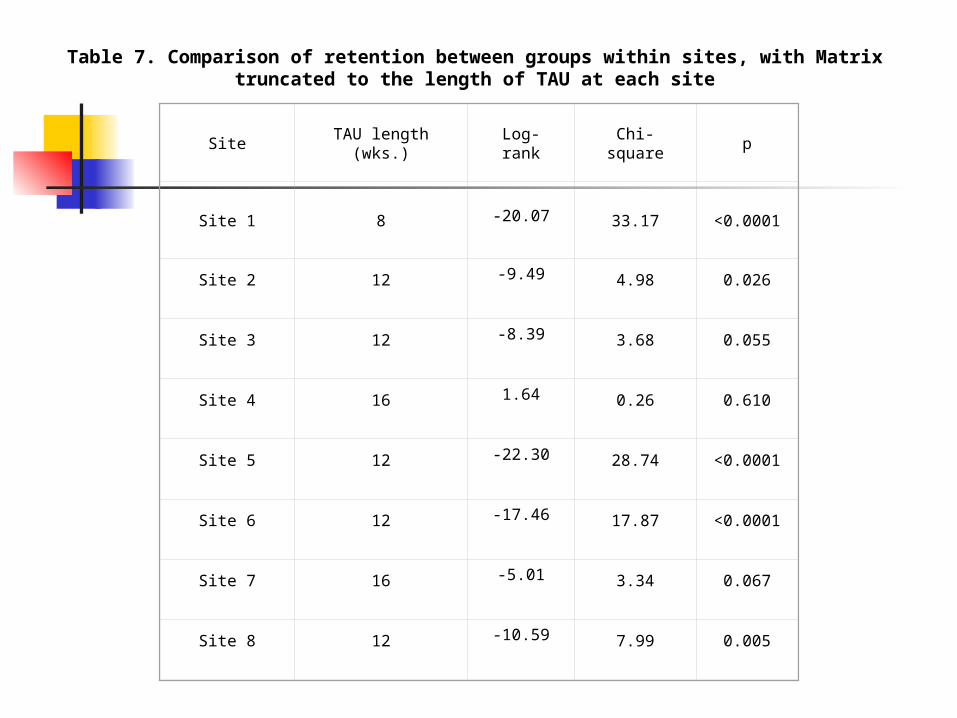
Site
TAU length (wks.)
Log-rank
Chi-square
p
Site 1
8
-20.07
33.17
<0.0001
Site 2 12 -9.49 4.98 0.026
Site 3 12 -8.39 3.68 0.055
Site 4 16 1.64 0.26 0.610
Site 5 12 -22.30 28.74 <0.0001
Site 6 12 -17.46 17.87 <0.0001
Site 7 16 -5.01 3.34 0.067
Site 8 12 -10.59 7.99 0.005
Table 7. Comparison of retention between groups within sites, with Matrix truncated to the length of TAU at each site

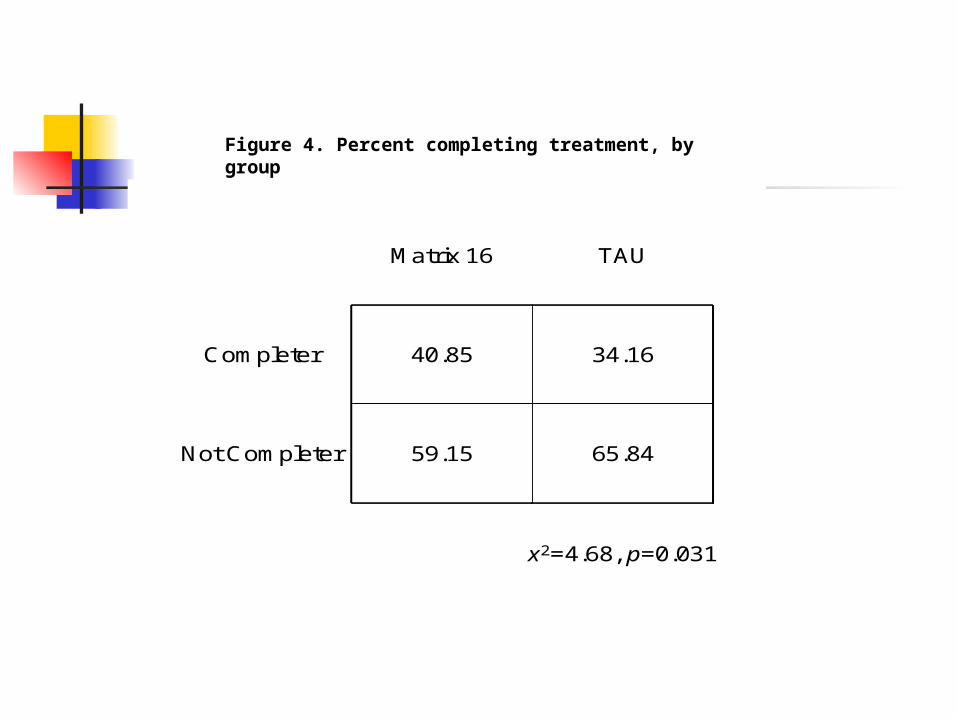
65.8459.15Not Completer
34.1640.85Completer
TAUMatrix 16
x2=4.68, p=0.031
Figure 4. Percent completing treatment, by group
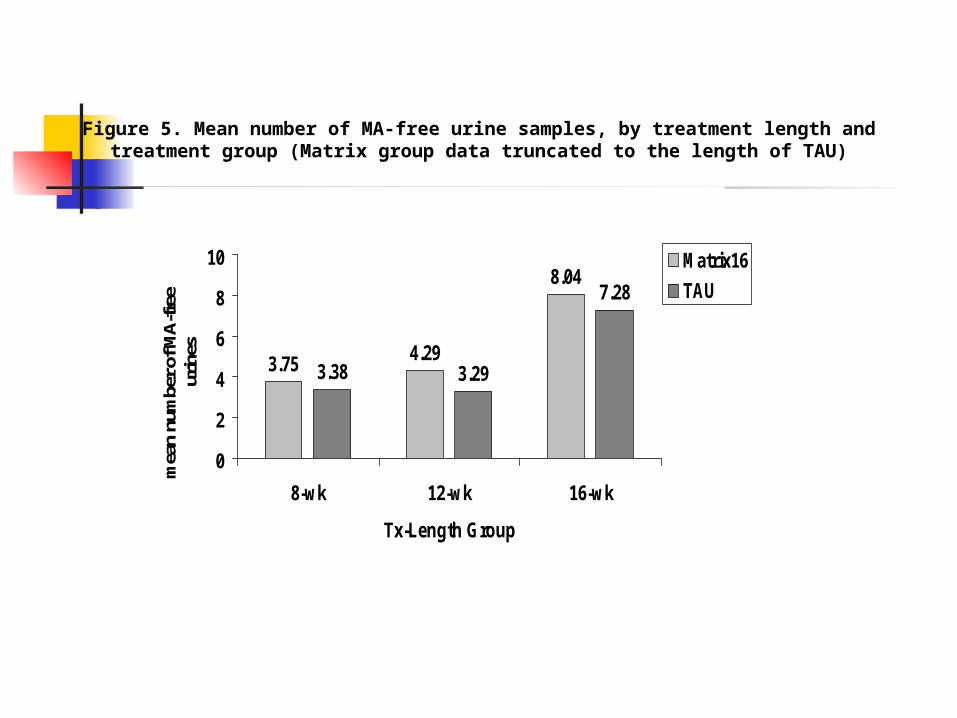
3.75 4.29
8.04
3.38 3.29
7.28
0
2
4
6
8
10
8-wk 12-wk 16-wk
Tx-Length Group
mea
n nu
mbe
r of M
A-fre
e ur
ines
Matrix16
TAU
Figure 5. Mean number of MA-free urine samples, by treatment length and treatment group (Matrix group data truncated to the length of TAU)
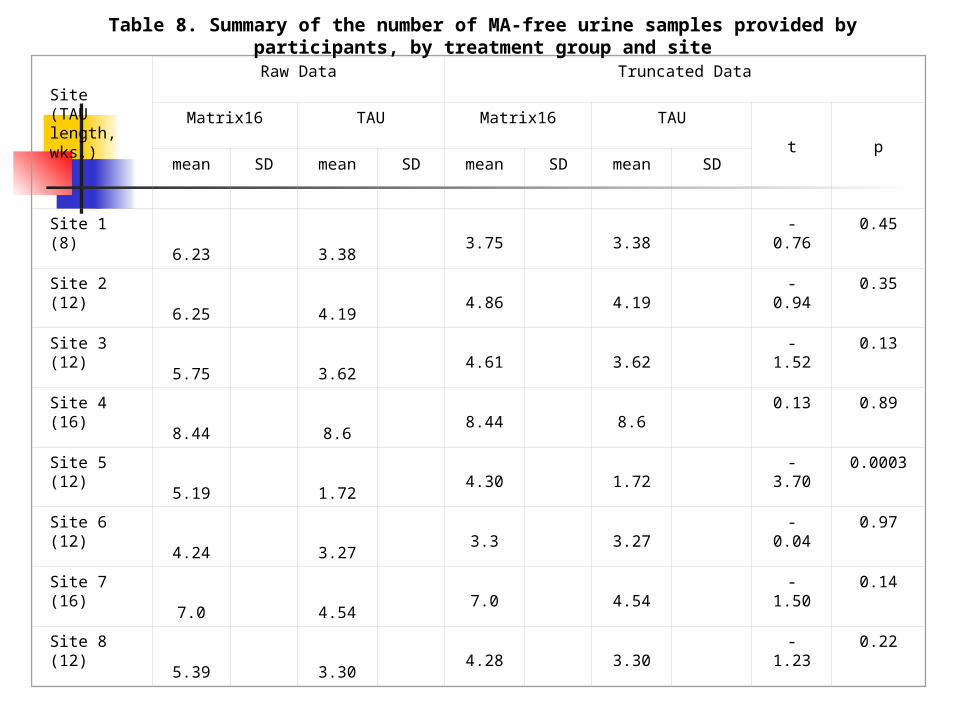
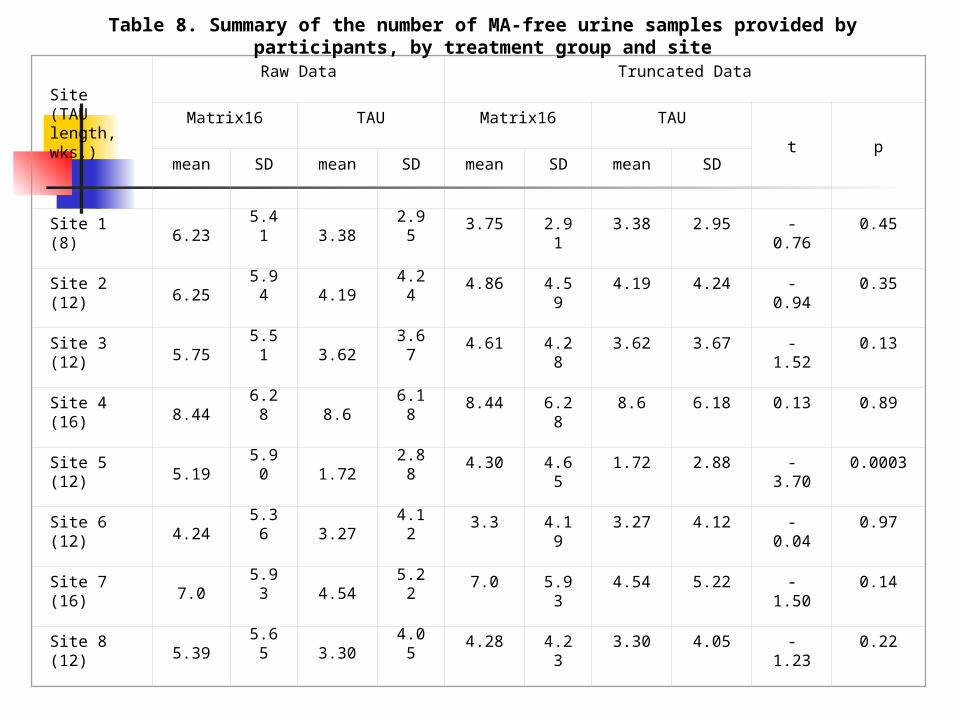
Site (TAU length, wks.)
Raw Data Truncated Data
Matrix16 TAU Matrix16 TAU
t pmean SD mean SD mean SD mean SD
Site 1 (8)
6.23 3.383.75 3.38
-0.76 0.45
Site 2 (12)
6.25 4.194.86 4.19
-0.94 0.35
Site 3 (12)
5.75 3.624.61 3.62
-1.52 0.13
Site 4 (16)
8.44 8.68.44 8.6
0.13 0.89
Site 5 (12)
5.19 1.724.30 1.72
-3.70 0.0003
Site 6 (12)
4.24 3.273.3 3.27
-0.04 0.97
Site 7 (16)
7.0 4.547.0 4.54
-1.50 0.14
Site 8 (12)
5.39 3.304.28 3.30
-1.23 0.22
Table 8. Summary of the number of MA-free urine samples provided by participants, by treatment group and site
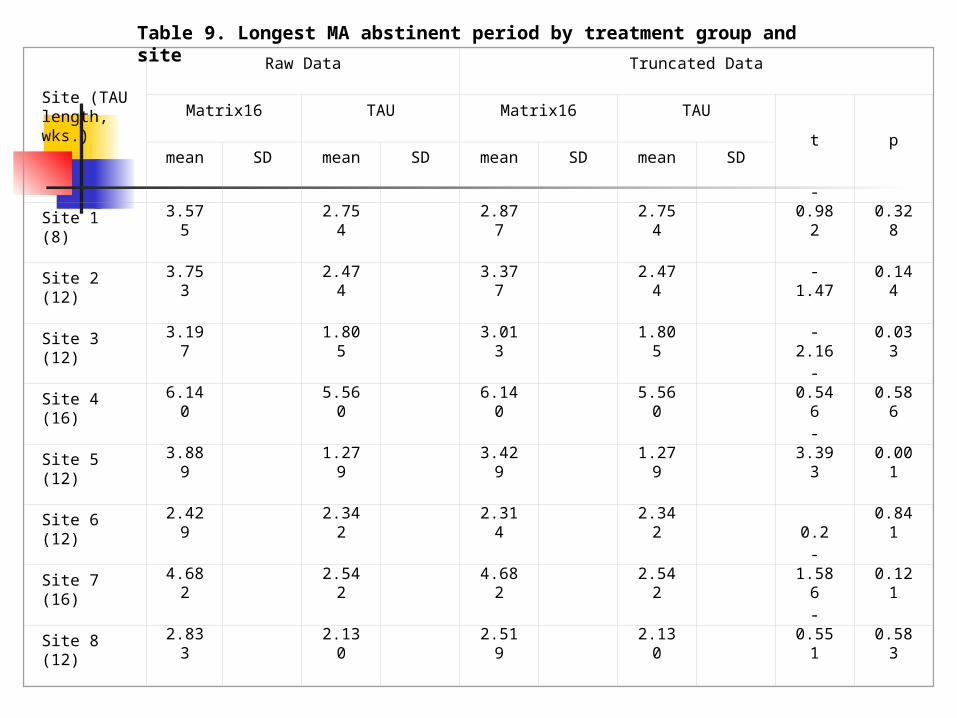
Site (TAU length, wks.)
Raw Data Truncated Data
Matrix16 TAU Matrix16 TAU
t pmean SD mean SD mean SD mean SD
Site 1 (8)3.575 2.754 2.877 2.754
-0.982 0.328
Site 2 (12)3.753 2.474 3.377 2.474 -1.47 0.144
Site 3 (12)3.197 1.805 3.013 1.805 -2.16 0.033
Site 4 (16)6.140 5.560 6.140 5.560
-0.546 0.586
Site 5 (12)3.889 1.279 3.429 1.279
-3.393 0.001
Site 6 (12)2.429 2.342 2.314 2.342 0.2 0.841
Site 7 (16) 4.682 2.542 4.682 2.542
-1.586 0.121
Site 8 (12) 2.833 2.130 2.519 2.130
-0.551 0.583
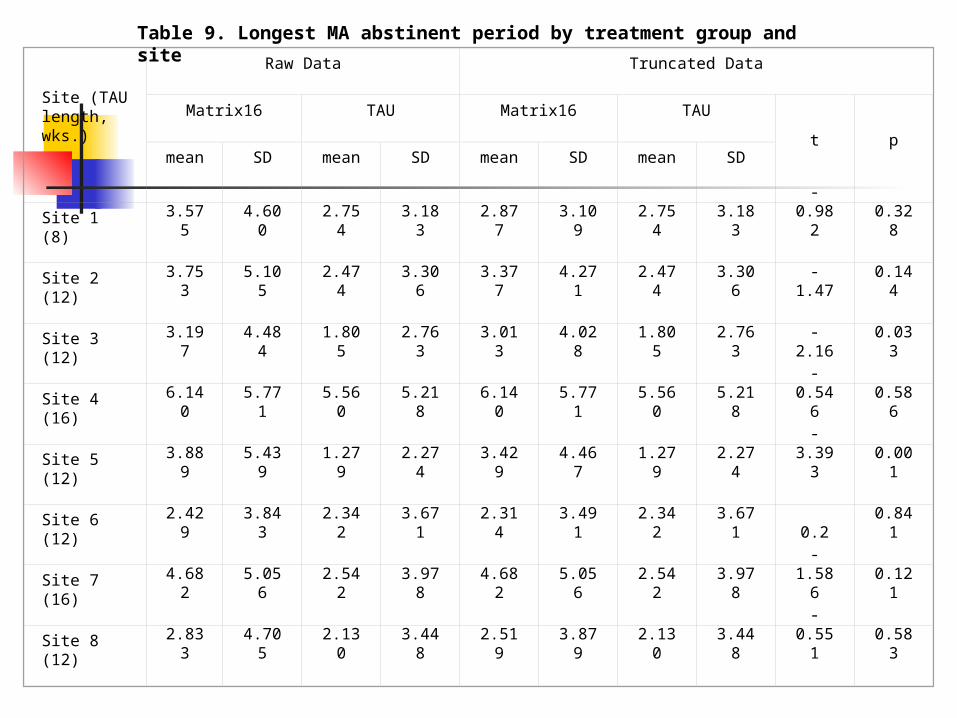
Table 9. Longest MA abstinent period by treatment group and site

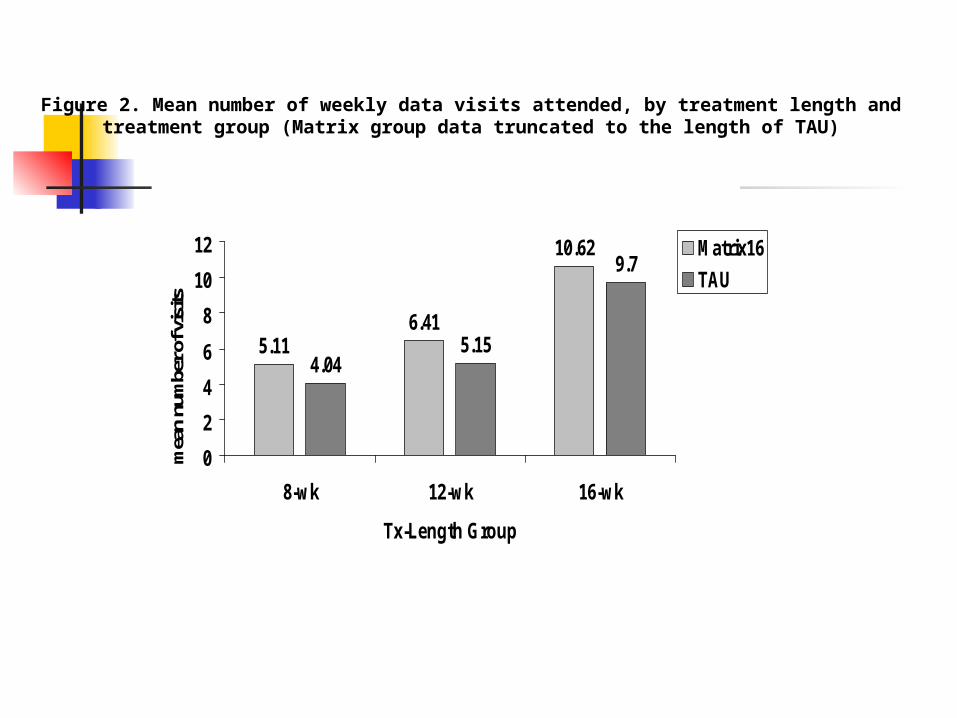
5.116.41
10.62
4.045.15
9.7
0
2
4
6
8
10
12
8-wk 12-wk 16-wk
Tx-Length Group
mea
n nu
mbe
r of v
isits
Matrix16
TAU
Figure 2. Mean number of weekly data visits attended, by treatment length and treatment group (Matrix group data truncated to the length of TAU)
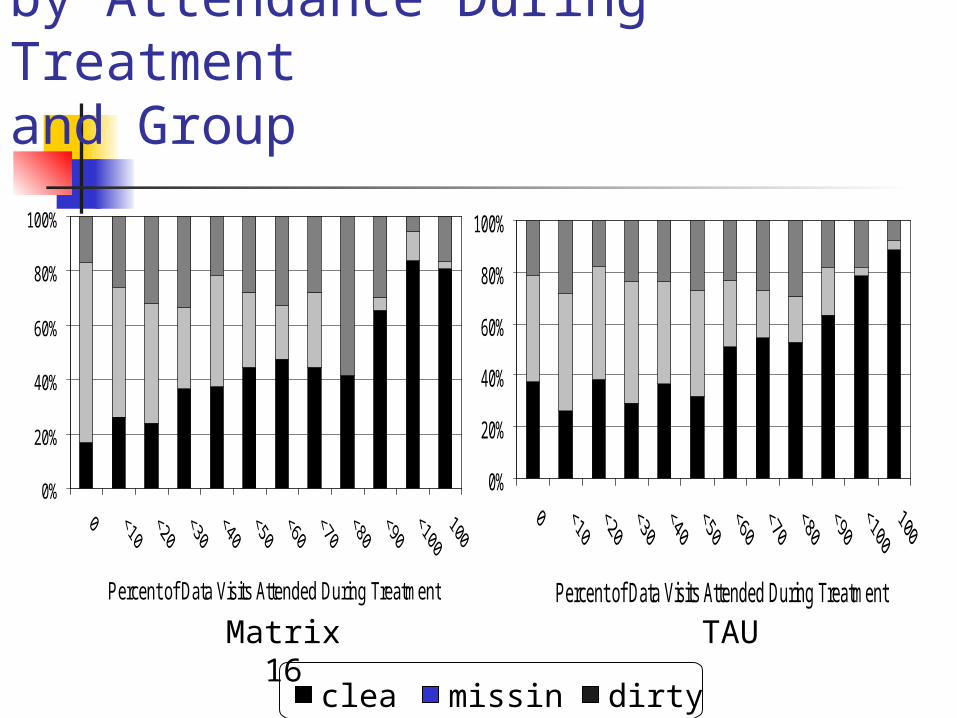
Discharge UA Resultby Attendance During Treatmentand Group
0%
20%
40%
60%
80%
100%
Percent of Data Visits Attended During Treatment
0%
20%
40%
60%
80%
100%
Percent of Data Visits Attended During Treatment
Matrix 16 TAU
clean missing dirty
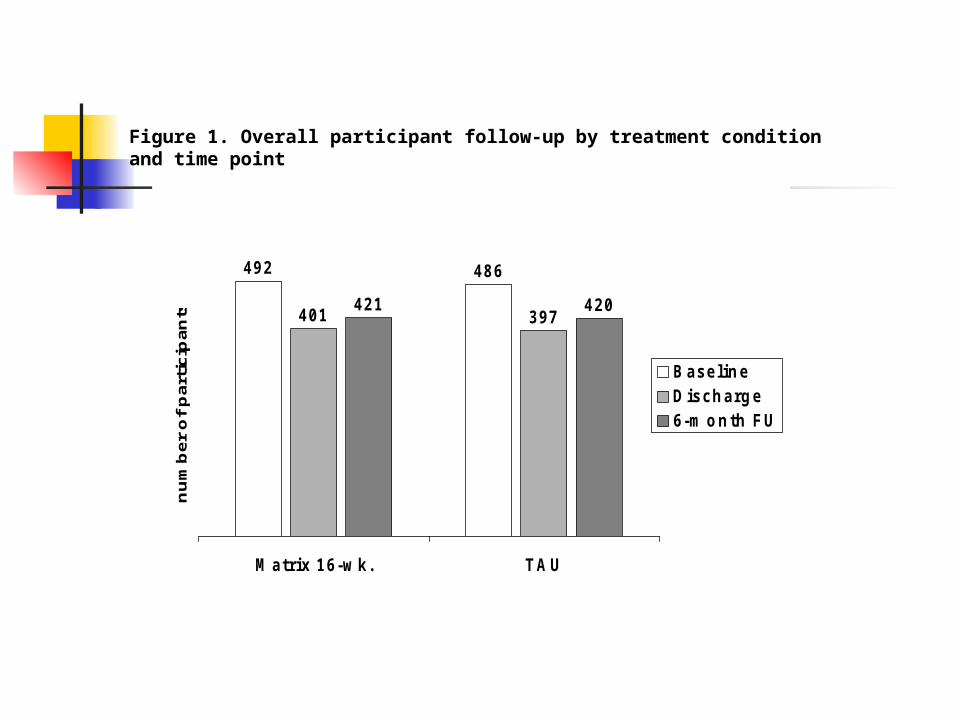
4 9 2 4 8 6
4 0 1 3 9 74 2 1 4 2 0
M a tr ix 1 6 -w k . T A U
nu
mb
er
of
pa
rtic
ipa
nts
B a s e l in eD is c h a rg e6 -m o n th F U
Figure 1. Overall participant follow-up by treatment condition and time point
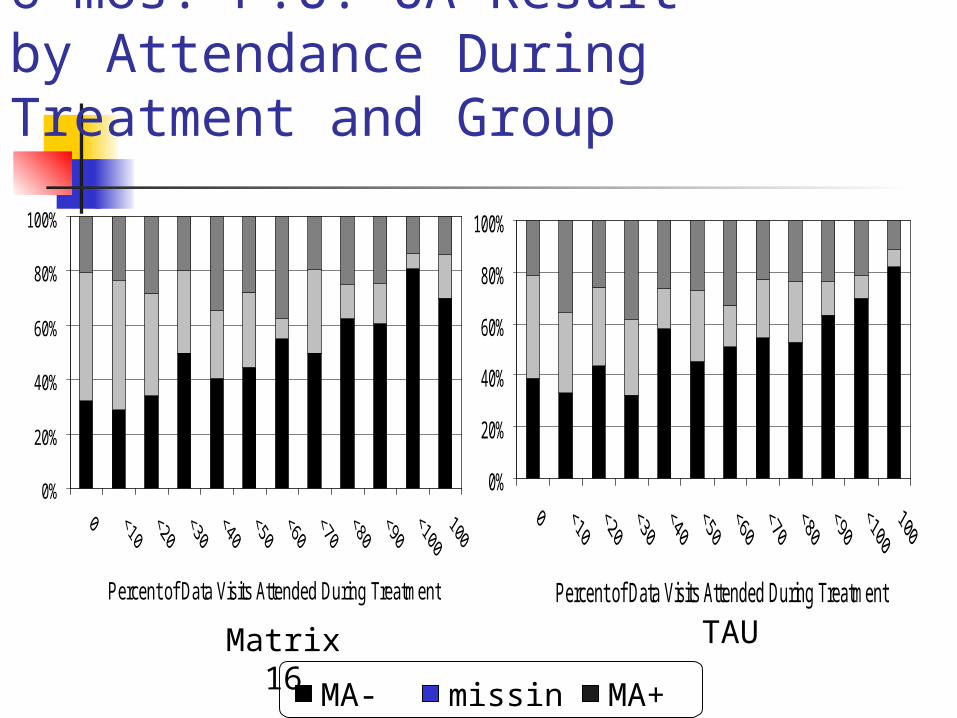
6-mos. F.U. UA Resultby Attendance During Treatment and Group
0%
20%
40%
60%
80%
100%
Percent of Data Visits Attended During Treatment
0%
20%
40%
60%
80%
100%
Percent of Data Visits Attended During Treatment
Matrix 16 TAU
MA- missing MA+
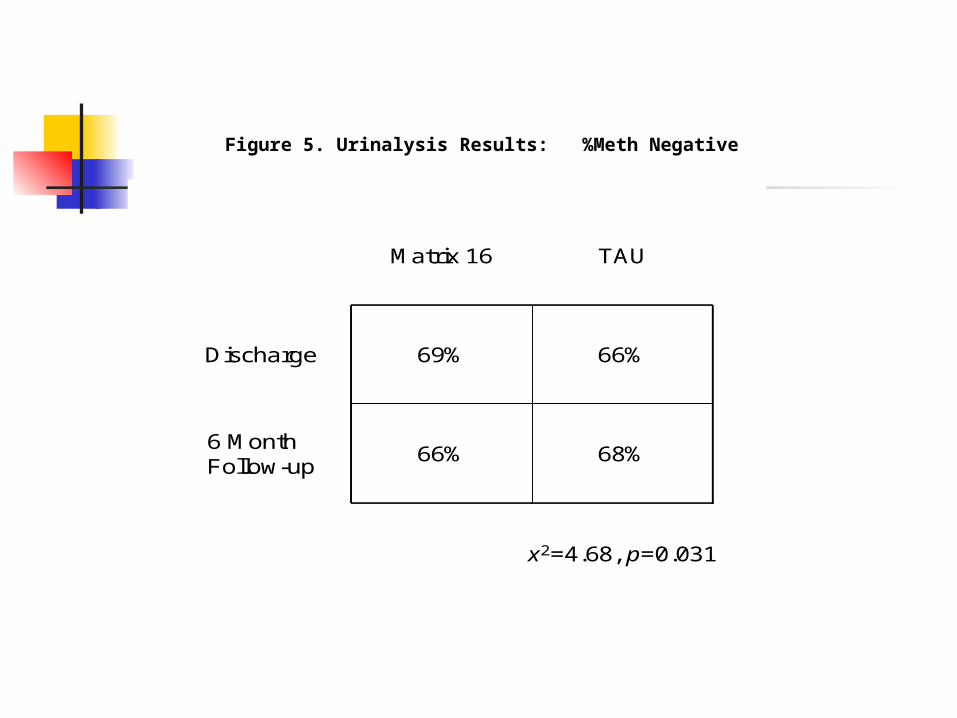
68%66%6 Month Follow-up
66%69%Discharge
TAUMatrix 16
x2=4.68, p=0.031
Figure 5. Urinalysis Results: %Meth Negative
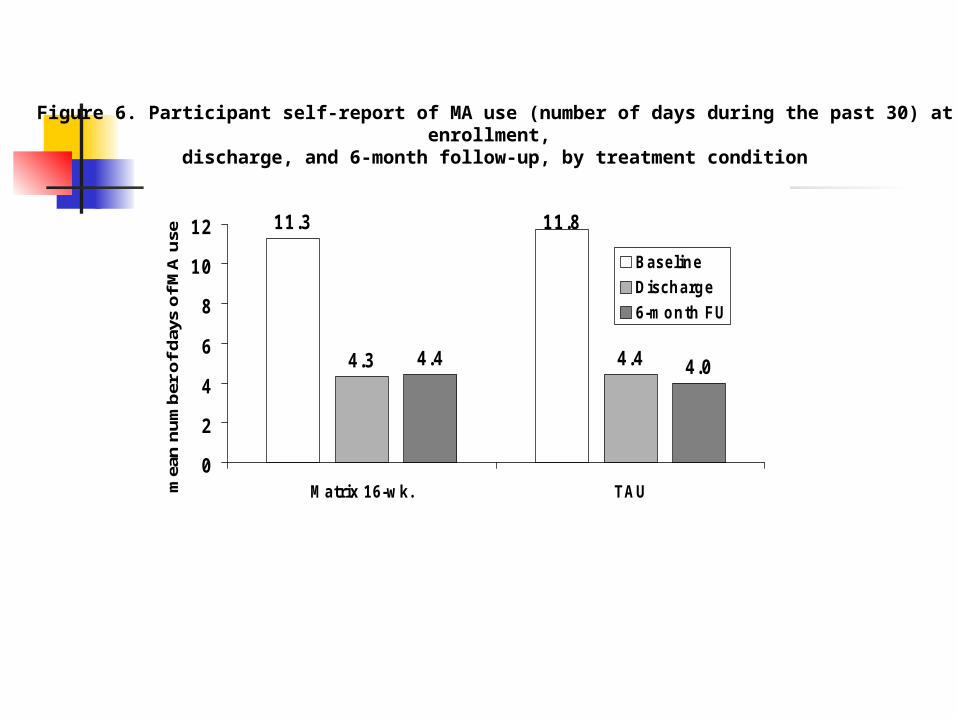
11.3 11.8
4 .3 4 .44 .4 4 .0
0
2
4
6
8
10
12
M atrix 16-w k. TAUmea
n n
um
ber
of
day
s o
f M
A u
se
Baseline
Discharge
6-m onth FU
Figure 6. Participant self-report of MA use (number of days during the past 30) at enrollment, discharge, and 6-month follow-up, by treatment condition
MTP Study Conclusions A multisite evaluation of a research-based
intervention can be conducted in community sites during a 3 year period.
Six research-naïve sites and 2 experienced sites successfully were trained and conducted all necessary research activities for a complex clinical trial.
A complex psychosocial treatment protocol was successfully replicated at 8 sites over a 3 year period.
Over 1000 MA-Users received free treatment.
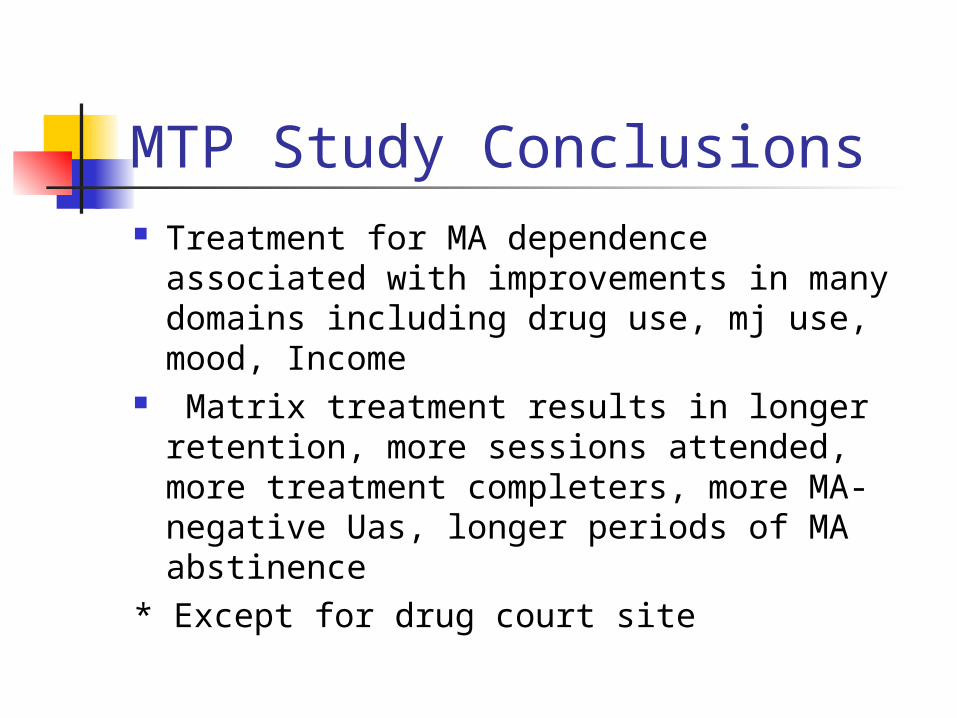
MTP Study Conclusions Treatment for MA dependence associated
with improvements in many domains including drug use, mj use, mood, Income
Matrix treatment results in longer retention, more sessions attended, more treatment completers, more MA-negative Uas, longer periods of MA abstinence
* Except for drug court site
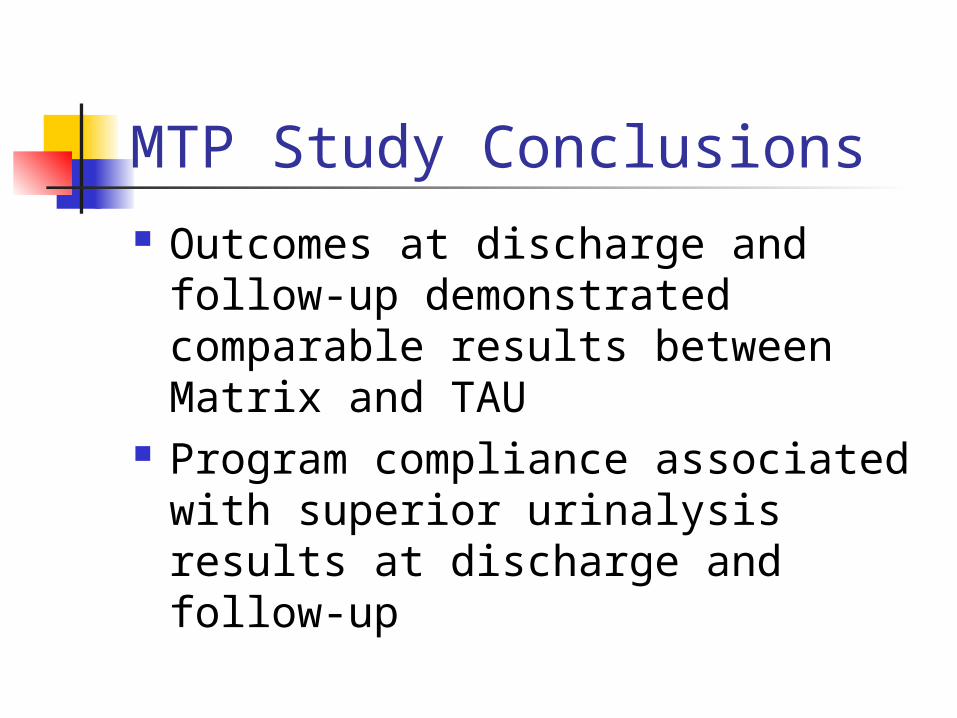
MTP Study Conclusions Outcomes at discharge and follow-
up demonstrated comparable results between Matrix and TAU
Program compliance associated with superior urinalysis results at discharge and follow-up

MTP Study Conclusions The design of multi-site studies has
to carefully consider priorities among the following issues: Priority of testing the null hypothesis
of the primary study outcomes Flexibility to accommodate all
investigators individual site priorities and site program variability
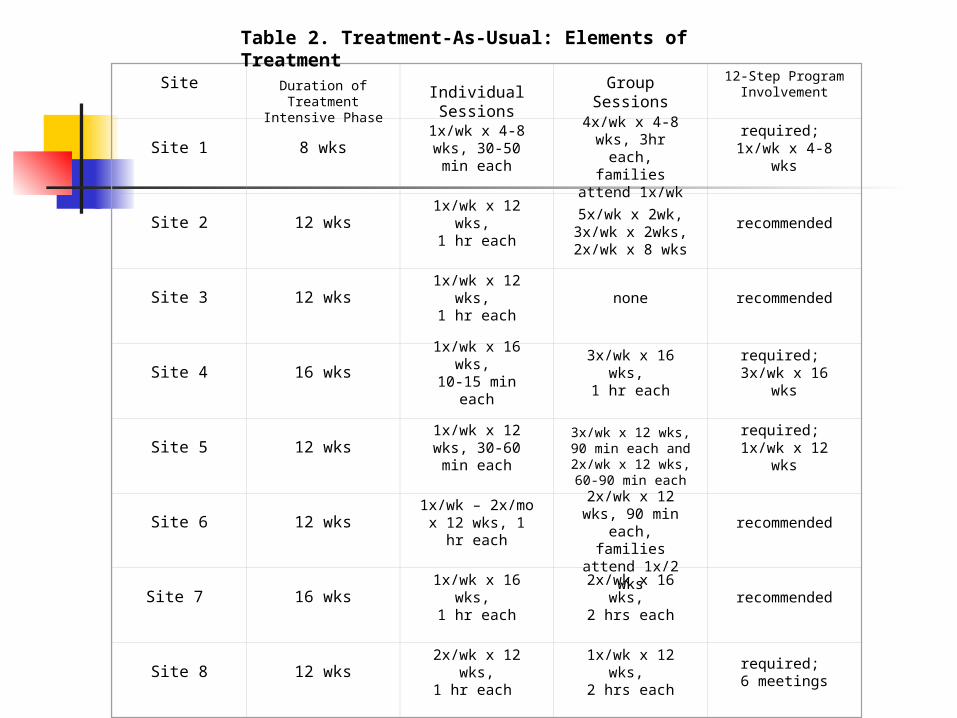
Site Duration of Treatment Intensive
Phase
Individual Sessions
Group Sessions12-Step Program
Involvement
Site 1
8 wks 1x/wk x 4-8 wks, 30-50 min each
4x/wk x 4-8 wks, 3hr each, families
attend 1x/wk
required; 1x/wk x 4-8 wks
Site 2
12 wks 1x/wk x 12 wks, 1 hr each
5x/wk x 2wk,3x/wk x 2wks, 2x/wk x 8 wks
recommended
Site 3
12 wks 1x/wk x 12 wks, 1 hr each
none recommended
Site 4
16 wks 1x/wk x 16 wks, 10-15 min each
3x/wk x 16 wks, 1 hr each
required; 3x/wk x 16 wks
Site 5
12 wks 1x/wk x 12 wks, 30-60 min each
3x/wk x 12 wks, 90 min each and
2x/wk x 12 wks, 60-90 min each
required; 1x/wk x 12 wks
Site 6
12 wks 1x/wk – 2x/mo x 12 wks, 1 hr each
2x/wk x 12 wks, 90 min each,
families attend 1x/2 wks
recommended
Site 7
16 wks 1x/wk x 16 wks, 1 hr each
2x/wk x 16 wks, 2 hrs each
recommended
Site 8
12 wks 2x/wk x 12 wks,1 hr each
1x/wk x 12 wks, 2 hrs each
required; 6 meetings
Table 2. Treatment-As-Usual: Elements of Treatment
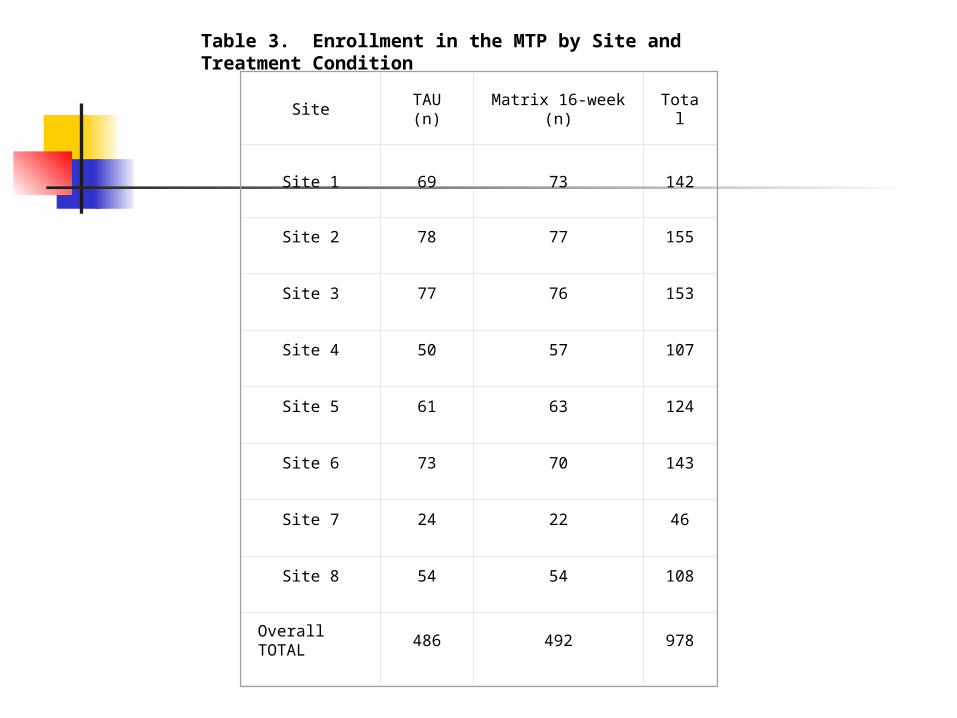
Site
TAU (n)
Matrix 16-week (n)
Total
Site 1
69
73
142
Site 2 78 77 155
Site 3 77 76 153
Site 4 50 57 107
Site 5 61 63 124
Site 6 73 70 143
Site 7 24 22 46
Site 8 54 54 108
Overall TOTAL
486 492 978
Table 3. Enrollment in the MTP by Site and Treatment Condition
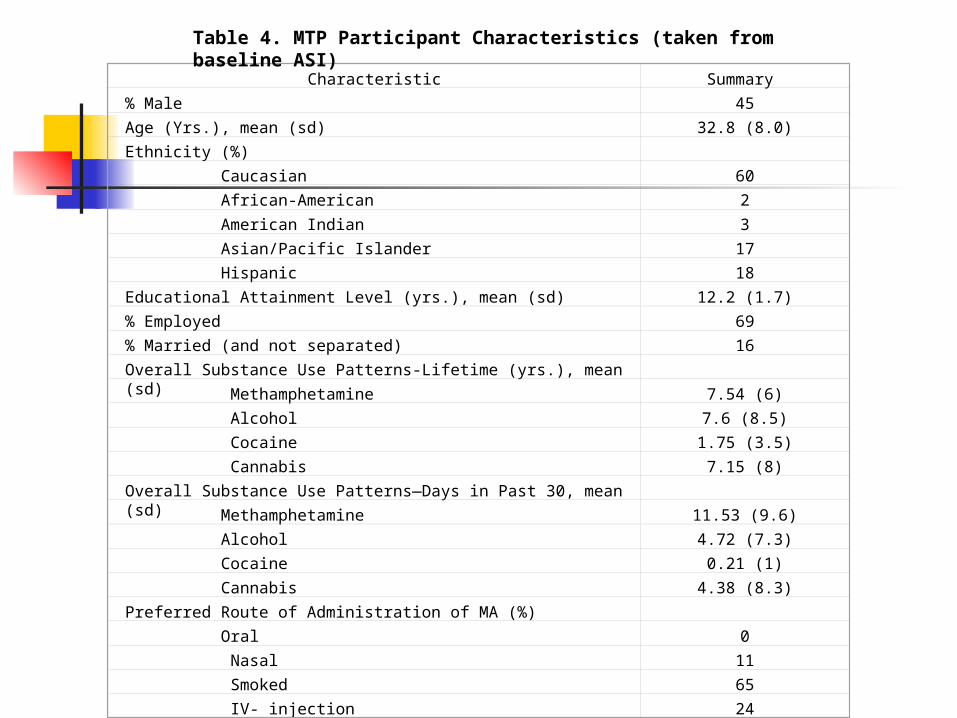
Characteristic Summary
% Male 45
Age (Yrs.), mean (sd) 32.8 (8.0)
Ethnicity (%)
Caucasian 60
African-American 2
American Indian 3
Asian/Pacific Islander 17
Hispanic 18
Educational Attainment Level (yrs.), mean (sd) 12.2 (1.7)
% Employed 69
% Married (and not separated) 16
Overall Substance Use Patterns-Lifetime (yrs.), mean (sd)
Methamphetamine 7.54 (6)
Alcohol 7.6 (8.5)
Cocaine 1.75 (3.5)
Cannabis 7.15 (8)
Overall Substance Use Patterns—Days in Past 30, mean (sd)
Methamphetamine 11.53 (9.6)
Alcohol 4.72 (7.3)
Cocaine 0.21 (1)
Cannabis 4.38 (8.3)
Preferred Route of Administration of MA (%)
Oral 0
Nasal 11
Smoked 65
IV- injection 24
Table 4. MTP Participant Characteristics (taken from baseline ASI)
Site (TAU length,
wks.)
TAUMean SD
Matrix 16-weekMean SD
Site 1 (8) 17.2 14.0 25.2 17.9
Site 2 (12) 21.7 15.7 26.1 17.3
Site 3 (12) 6.3 3.6 28.4 18.2
Site 4 (16) 22.8 15.4 31.5 20.0
Site 5 (12) 15.4 19.8 25.7 20.0
Site 6 (12) 2.1 3.1 25.2 24.7
Site 7 (16) 13.8 14.5 35.4 19.1
Site 8 (12) 3.9 5.0 22.2 18.6
Overall summary 12.7 14.7 26.8 19.7
Table 5. Summary of the number of clinical contacts made by participants, by treatment group and site
Site
TAU length (wks.)
Log-rank
Chi-square
p
Site 1
8
-20.07
33.17
<0.0001
Site 2 12 -9.49 4.98 0.026
Site 3 12 -8.39 3.68 0.055
Site 4 16 1.64 0.26 0.610
Site 5 12 -22.30 28.74 <0.0001
Site 6 12 -17.46 17.87 <0.0001
Site 7 16 -5.01 3.34 0.067
Site 8 12 -10.59 7.99 0.005
Table 7. Comparison of retention between groups within sites, with Matrix truncated to the length of TAU at each site
Site (TAU length, wks.)
Raw Data Truncated Data
Matrix16 TAU Matrix16 TAU
t pmean SD mean SD mean SD mean SD
Site 1 (8)6.23 5.41 3.38 2.95
3.75 2.91 3.38 2.95 -0.76 0.45
Site 2 (12)6.25 5.94 4.19 4.24
4.86 4.59 4.19 4.24 -0.94 0.35
Site 3 (12)5.75 5.51 3.62 3.67
4.61 4.28 3.62 3.67 -1.52 0.13
Site 4 (16)8.44 6.28 8.6 6.18
8.44 6.28 8.6 6.18 0.13 0.89
Site 5 (12)5.19 5.90 1.72 2.88
4.30 4.65 1.72 2.88 -3.70 0.0003
Site 6 (12)4.24 5.36 3.27 4.12
3.3 4.19 3.27 4.12 -0.04 0.97
Site 7 (16) 7.0 5.93 4.54 5.22
7.0 5.93 4.54 5.22 -1.50 0.14
Site 8 (12) 5.39 5.65 3.30 4.05
4.28 4.23 3.30 4.05 -1.23 0.22
Table 8. Summary of the number of MA-free urine samples provided by participants, by treatment group and site
Site (TAU length, wks.)
Raw Data Truncated Data
Matrix16 TAU Matrix16 TAU
t pmean SD mean SD mean SD mean SD
Site 1 (8)3.575 4.600 2.754 3.183 2.877 3.109 2.754 3.183
-0.982 0.328
Site 2 (12)3.753 5.105 2.474 3.306 3.377 4.271 2.474 3.306 -1.47 0.144
Site 3 (12)3.197 4.484 1.805 2.763 3.013 4.028 1.805 2.763 -2.16 0.033
Site 4 (16)6.140 5.771 5.560 5.218 6.140 5.771 5.560 5.218
-0.546 0.586
Site 5 (12)3.889 5.439 1.279 2.274 3.429 4.467 1.279 2.274
-3.393 0.001
Site 6 (12)2.429 3.843 2.342 3.671 2.314 3.491 2.342 3.671 0.2 0.841
Site 7 (16) 4.682 5.056 2.542 3.978 4.682 5.056 2.542 3.978
-1.586 0.121
Site 8 (12) 2.833 4.705 2.130 3.448 2.519 3.879 2.130 3.448
-0.551 0.583
Table 9. Longest MA abstinent period by treatment group and site

4 9 2 4 8 6
4 0 1 3 9 74 2 1 4 2 0
M a tr ix 1 6 -w k . T A U
nu
mb
er
of
pa
rtic
ipa
nts
B a s e l in eD is c h a rg e6 -m o n th F U
Figure 1. Overall participant follow-up by treatment condition and time point
5.116.41
10.62
4.045.15
9.7
0
2
4
6
8
10
12
8-wk 12-wk 16-wk
Tx-Length Group
mea
n nu
mbe
r of v
isits
Matrix16
TAU
Figure 2. Mean number of weekly data visits attended, by treatment length and treatment group (Matrix group data truncated to the length of TAU)
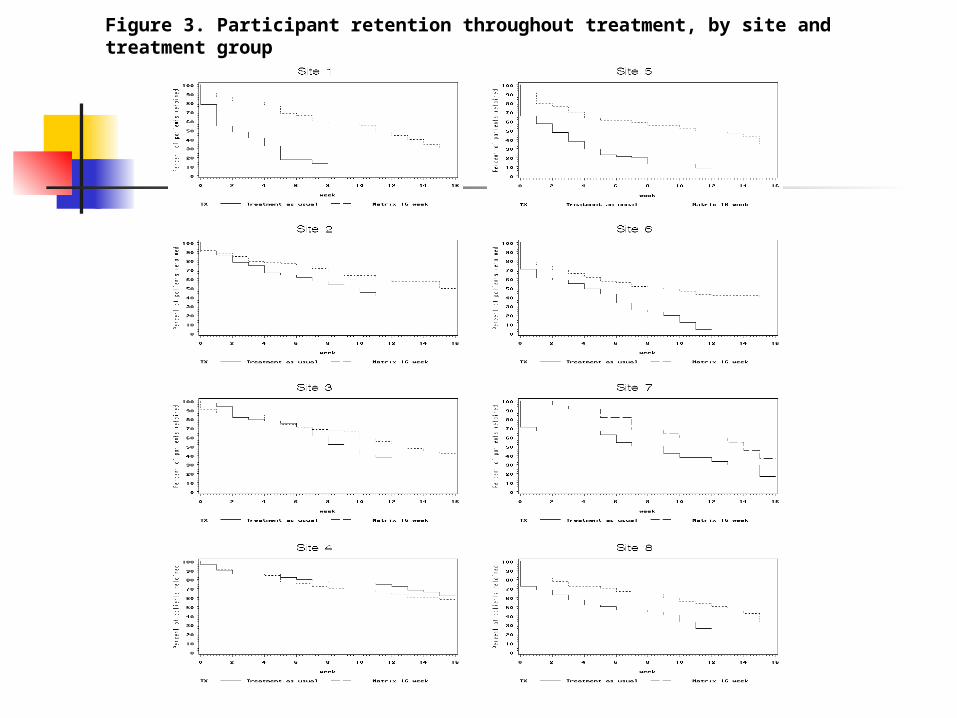
Figure 3. Participant retention throughout treatment, by site and treatment group
65.8459.15Not Completer
34.1640.85Completer
TAUMatrix 16
x2=4.68, p=0.031
Figure 4. Percent completing treatment, by group

3.75 4.29
8.04
3.38 3.29
7.28
0
2
4
6
8
10
8-wk 12-wk 16-wk
Tx-Length Group
mea
n nu
mbe
r of M
A-fre
e ur
ines
Matrix16
TAU
Figure 5. Mean number of MA-free urine samples, by treatment length and treatment group (Matrix group data truncated to the length of TAU)

11.3 11.8
4 .3 4 .44 .4 4 .0
0
2
4
6
8
10
12
M atrix 16-w k. TAUmea
n n
um
ber
of
day
s o
f M
A u
se
Baseline
Discharge
6-m onth FU
Figure 6. Participant self-report of MA use (number of days during the past 30) at enrollment, discharge, and 6-month follow-up, by treatment condition