Embed Size (px)
Citation preview
DEMOGRAPHY AND SOCIOLOGY PROGRAM
RESEARCH SCHOOL OF SOCIAL SCIENCES
SOCIO-ECONOMIC AND DEMOGRAPHIC SETTING OF
MUSLIM POPULATIONS
Mohammad Jalal Abbasi-Shavazi
Gavin W. Jones
Working Papers inDemography
No. 86
September 2001
ABSTRACT
This paper explores population dynamics and characteristics of Muslim populations to aid deeperunderstanding of the Muslim world. Having defined Muslim-majority countries and countries withlarge Muslim populations, the paper will first, explain demographic, social and economiccharacteristics of Muslim populations, and second, analyze demographic transition in the Muslimworld. Population policies in Muslim-majority countries will then be examined.
The analysis shows that Muslim populations are characterized by great ethnic and culturaldiversity. Although on the whole, Muslim populations rank below the world’s average in levels ofsocio-economic development, there is a wide range of socio-economic conditions. Fertilitytransition has begun in most of these countries at some time over the past two decades, and insome, it has moved very rapidly. Because of the rapid population growth in many of the Muslim-majority countries, Muslims are expected to be climbing towards a quarter of the world’spopulation by the year 2025. Therefore, their demographic trends will have an important bearingon those of the world as a whole, and their political and cultural influence on the world stage islikely to increase.
SOCIO-ECONOMIC AND DEMOGRAPHIC SETTINGOF MUSLIM POPULATIONS1
Mohammad Jalal Abbasi-Shavazi 2 and Gavin W. Jones3
September 2001
Population of Muslim countries
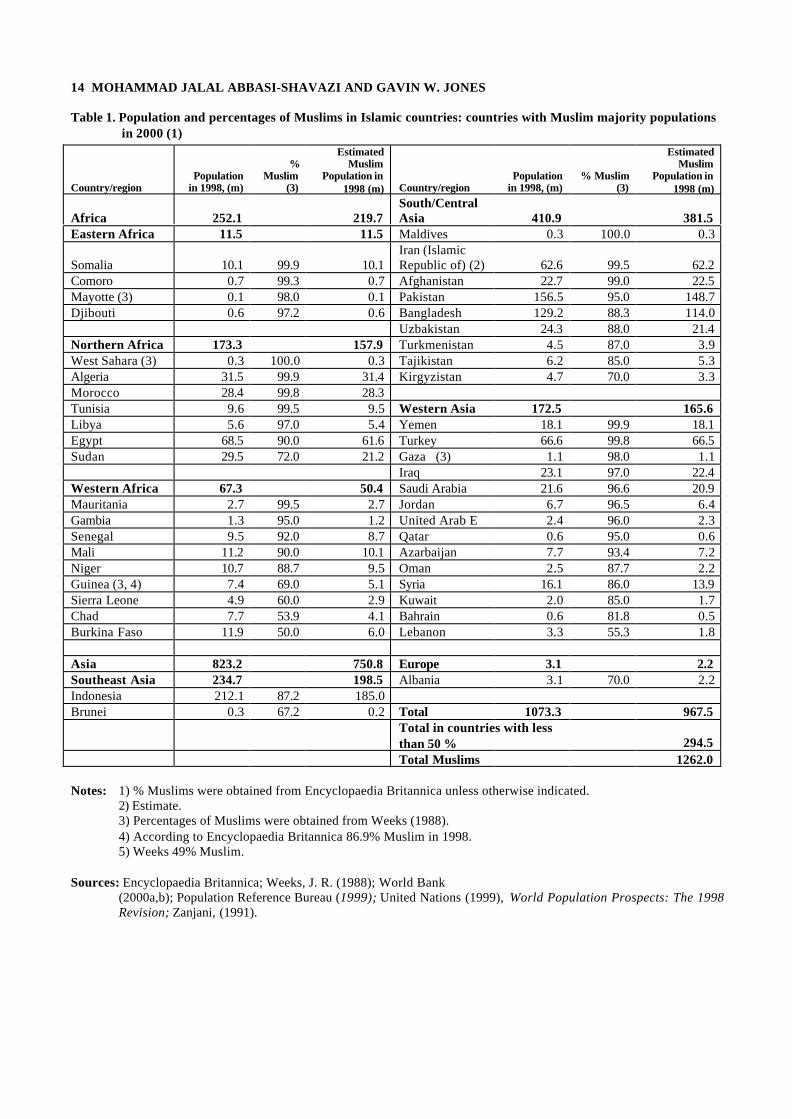
Islam is one of the world’s great monotheistic religions. The followers of Islam, called Muslims,believe in one God (Allah in Arabic) and that Mohammad is His Prophet. Today, the worldwidecommunity of Muslims, which embraces the people of many races and cultures, constitute a verysubstantial part of the world’s population. At the end of the 20th century, shown in Table 1, there are47 countries in the world where more than 50 per cent of the population are Muslims, with a totalpopulation of 1.01 billion and a Muslim population of 967 million. 4 If we add to this the additional295 million Muslims living in countries where Muslims are numerous though not in a majority, thenumber of Muslims in the world in 2000 exceeded 1.2 billion. This amounts to just 20 per cent of theworld’s population. Muslim populations are expected to swell to about 1.8 billion by 2025, or about23 per cent of the world’s population at that time (not allowing for any conversion of people into orout of the Islamic faith).
Muslim-majority countries
In this chapter, Muslim-majority countries refer to countries in which Muslims constitute more than50 per cent of the total population. As shown in Table 1, the largest Muslim-majority countries are(in order), Indonesia, Pakistan, Bangladesh, Iran, Turkey and Egypt. The size of predominantlyMuslim countries ranges all the way from these very large countries to tiny countries such as Qatar,Djibouti and the Maldives, with total populations of well under half a million. Of the Muslim-majority countries listed in Table 1, most (57 per cent) have populations that are more than 90 percent Muslim. Only seven of them have less than 70 per cent Muslim. Similarly, among the countriesin Table 2 with large Muslim populations but not a Muslim majority, only nine have more than 30 percent Muslim. In other words, there are relatively few countries in the world with a fairly even balancebetween Muslim and non-Muslim populations: ie those in which Muslims are between 30 per centand 70 per cent of the total population.
1 The authors wish to acknowledge the assistance of Jenny White and Vanessa McGrath in preparing this paper.Comments from Terence Hull, Mehtab Karim and Maziar Mozaffari are gratefully acknowledged. This paper will bepublished in Jones G. and and M. Karim (eds), forthcoming, Islam, the State and Population Policy, C. Hurst & Co.(Publishers), London.
2 Assistant Professor, Department of Demography, Faculty of Social Sciences, University of Tehran, Tehran, Iran, &Associate, Research School of Social Sciences, Australian National University (ANU).
3 Professor and Convenor, Graduate Program in Demography, Demography and Sociology Program, Research School ofSocial Sciences, ANU, Canberra, ACT 0200, Australia.
4 The main data sources for the figures presented in this chapter are the United Nations Demographic Yearbooks,International Labour Organization publications, the World Bank Indicators as well as the Population Reference BureauData Sheets for recent years. Although these are the standard sources of data for basic demographic measures, it has longbeen accepted that the indicators expressed in these publications may not always be accurate. Wherever the data presentedin the tables differ from data from national sources, the latter will be given in footnotes.
2 MOHAMMAD JALAL ABBASI-SHAVAZI AND GAVIN W. JONES
Countries with large Muslim populations
Table 2 shows population and percentages of Muslims in countries with large Muslim populations.The largest Muslim populations in countries where Muslims are in a minority are in India, wherealthough the Muslim population is only 12 per cent, it nevertheless numbers 122 million; and Russia,where there are 14.7 million Muslims. The total population of the ten Muslim minorities in China(Hui, Uygur, Kazak, Ozbek, Tajik, Tatar, Kirgiz, Salar, Dongxiang and Bonan) stands at around 19million, mostly in the Xinjiang, Ningxia, Ansu, and Qinghai regions (Pictorial China 1997; Attane1999). In Ethiopia there are 18.8 million Muslims. Nigeria is actually a Muslim-minority country, butonly just. Population figures for Nigeria are questionable, as are the proportions Christian andMuslim.
For the sake of convenience, hereafter more attention will be given to the Muslim majority countries(countries with more than 50 per cent Muslims). We exclude Mayotte, a country with only around 0.1million population, where Muslims constitute 98 per cent of the population. The reason for thisexclusion is the lack of data for most of the demographic, socio-economic and health characteristicsfor this country.
Sects in Islam: Sunni, Shiite
The two main divisions in Islam are between the Sunni and the Shiite. After the death of ProphetMohammad (632 AD), those who believed that he had not appointed a successor and accepted theselection of a successor by his senior companions became the Sunni, whereas those who believed thatProphet Mohammad had rightfully designated Ali, his cousin and son-in-law, formed the Shiite.These sects are further divided into subgroups and have also given birth to a number of new religions.The Sunni’s are believed to constitute about 85-90 per cent of all Muslims while the Shiite make upabout 10 to 12 per cent of Muslims.
Shiite takes its name from the Arabic word shi’ah meaning ‘party of’ or ‘supporter of’ and refersspecifically to the supporters of Ali. Besides the differences between Sunni and Shiites over thesuccession of Prophet Mohammad, Shiites believe in the spiritual authority and infallibility (maasum)of their Imams through the divine line of descent from Prophet Muhammad (through his daughterFatima and son in law Ali). A consequence and characteristic of this belief is an emotional devotionto the cause and persons of the ahl al-bayt (the household of the Prophet) (Schubel 1993). TheSunni’s on the other hand emphasise the traditions (Sunna) of Prophet Muhammad as authoritativeand approve the historic order of Mohammad's first four successors (that of Abu Bakr, Umar,Uthman, and Ali).
Over the years Shiite became subdivided into different groups, many of which proved short-lived(Daftary 1995). The largest group amongst the Shiite are the Twelvers (Ithna Athari or Jafaari)followed by the Ismaili’s and the Zaydi’s. Overall Shiites constitute a majority in Iran, Azerbaijan,Iraq, Yemen and Bahrain. They are also the largest Muslim minority in Lebanon. However in placessuch as Iraq and Bahrain the majority of the Muslim populations are Shiite, yet the minority Sunnicontrol the state. Meanwhile, the Shiite Alawi Nusayri’s rules Syria with its majority Sunnipopulation. Other countries with significant Shiite minorities are Qatar, Kuwait, Afghanistan,Pakistan, India, United Arab Emirates, and Oman. It is difficult to estimate the number of Shiitesaround the world (Yann 1995; Schimmel 1980; Momeni 1985).
DEMOGRAPHY OF MUSLIM POPULATIONS 3
The term Sunni Islam is a shortened form of ahl al-sunnah wa-l jamaah (the people of the custom andthe community). Differences in ritual and law divide the Sunni into adherents of the four orthodoxand traditionalist schools of thoughts: Hanafi, Maliki, Shafites and Hanbali. Of course, there are manyother features which distinguish one Muslim group from others, even within the predominant Sunnigroup. For example, which school of law is followed (Hanafi, Maliki, Hanbali, etc), the degree ofattention given to mysticism (sufism), and where different groups lie along a continuum from ‘liberal’to more ‘fundamentalist’, or from ‘modernist’ to ‘traditionalist’.5
The Hanafi school is the first of the four orthodox Sunni schools of jurisprudence, and was foundedby a Persian named Nu'man Abu Hanifah (d.767) in Kufa, Iraq. Hanifah is also said to have beenattending lectures and conversing with the 6th Shia Imam (Imam Jafaar Sadiq). The Hanafi School isfollowed by the majority of the Muslim population of Turkey, Albania, the Balkans, Central Asia,Afghanistan, Pakistan, China, India and Iraq. Currently the Maliki doctrine and practice remainswidespread throughout North Africa, and regions of West and Central Africa.
The Shafei School is recognised as the second largest of the Sunni branch of Islam in number ofadherents. Its founder Muhammad ibn Idris al-Shafi'i (767-819) was one of the pupil of Malik ibnAnas (d.795), the founder of Maliki school. It is considered to be the largest school amongst theMuslims of South India, Indonesia, Malaysia, Brunei, Singapore, Thailand, Vietnam, Philippines,Lower Egypt, Sri Lanka, Maldives, and South Yemen (particularly Hadhramaut region). There are asignificant number of Shafei followers in Syria, Palestine, Jordan former Soviet Republics, amongstthe Kurds (particularly most Kurds in Iran) and a number of coastal regions of East Africa.
The Hanbali School is the fourth orthodox school of jurisprudence within Sunni Islam. The namedenotes to the school which was established by Ahmad b. Hanbal (d.855). Hanbal studied underdifferent masters, including Imam Shafi'i (the founder of his own school). However, his doctrines areobserved to be of orthodox and very strict nature. The emergence of the Wahabi in the nineteenthcentury and its challenge to Ottoman authority enabled the school of Hanbal to enjoy a period ofrevival. Currently it is well placed amongst the tribes of Saudi Arabia and praised by orthodox groupssuch as the Talibans of Afghanistan. Groups derived from these are Wahhabi and Ahmadiyya.
The uneven distribution of Muslim populations
The ‘heartland’ of the Muslim world is in the Middle East and North Africa; in other words, the Arabworld. But Islam has spread widely from this heartland to other parts of Africa and to South andSoutheast Asia. Muslims constitute approximately 43 per cent of the population in Africa andapproximately 26 per cent in Asia (Tables 1 and 2). These two continents contain 98 per cent of theworld’s Muslims. The regions of the world where there are few Muslims are North and SouthAmerica, Europe, East Asia and Oceania, though even in these regions there are small concentrationsof Muslims, for example in Albania in Europe, in western parts of China and in Fiji in Oceania.Tables 1 and 2 show the number of Muslims by continent and region. It is noteworthy that in Northand South America, Europe and Oceania combined, there are only 24.6 million Muslims.
5 In Indonesia at least, the term ‘traditionalist’ is not synonymous with ‘fundamentalist’, nor is the term ‘modernist’synonymous with ‘liberal’. Indeed, leadership of the main traditionalist grouping, the Nahdlatul Ulama, is consideredmore liberal in many theological interpretations than is leadership of the main modernist grouping, the Muhammadiyah.
4 MOHAMMAD JALAL ABBASI-SHAVAZI AND GAVIN W. JONES
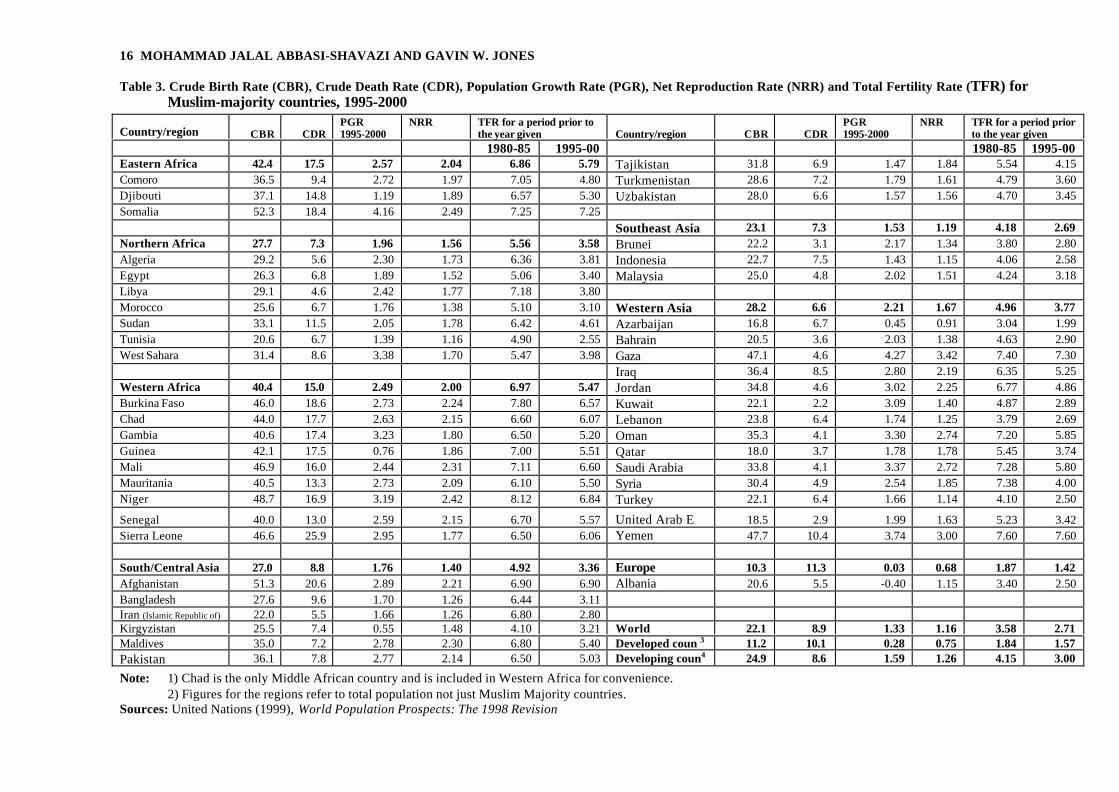
Population growth rates
Table 3 presents the population growth rates of Muslim-majority countries. Because net migrationis not high in most Muslim majority countries, the main components of population growth arecrude birth rate and crude death rate, shown in the first two columns of the table. However, netmigration does make quite a difference to population growth in Guinea in Western Africa, andsome of the countries of Western Asia, in particular, and refugee flows have made a major impactin countries including Pakistan, Afghanistan, and Iran.
The population growth rate in the world as a whole in the 1995-2000 period was 1.33 per cent. Itwas higher than this in 41 of the 46 Muslim-majority countries listed in Table 3. In all developingcountries of the world, the population growth rate over the same period was 1.59 per cent. It washigher than this in 38 of the 46 Muslim-majority countries. Clearly, in terms of these broadcomparisons, the Muslim-majority-countries have population growth rates well above the average.If, on the other hand, the comparisons of population growth rates are population-weighted, theexcess growth rate is less apparent, because population growth rates are relatively low in some ofthe most populous Muslim-majority countries. Indonesia, the largest of these countries, had apopulation growth rate of only 1.43 per cent, and Iran and Turkey, each 1.66 per cent. Weightedby population, the population growth rate in the Muslim-majority countries between 1995 and2000 was 2.0 per cent.
Crude birth rates are universally high (above 40 per 1,000) in all the Muslim-majority countries ofWestern Africa, and in some countries of Eastern Africa, South-Central Asia and Western Asia.But the median birth rate is much lower than this: 33 per 1,000. This is well above the averagefigure for developing countries: 24.9 per thousand. But again, if population-weighted figures areused, the figure for the Muslim-majority countries falls to 29.5 per thousand, because of theinfluence of the most populous countries, where the average birth rate is considerably lower.
Death rates were horrendously high in Sierra Leone and Afghanistan (above 20 per 1,000), as aresult of civil war and very poor living conditions. But most crude death rates were much lowerthan this, with a median figure of 7.2. The crude death rate does not very adequately reflect theunderlying mortality conditions, being held to relatively low levels in Muslim-majority countriesby the concentration of the population in age groups where mortality is relatively low. However, itis true that, irrespective of the bias exerted on the crude death rate by the age structure, it is thecrude death rate that directly determines the population growth rate.
Both birth and death rates have been tending to decline in recent years in the Muslim-majoritycountries, but the net outcome is that population growth rates have been tending to decline. This ispartly because birth rates are much higher than death rates, so that an equal percentage decline ineach will lower the population growth rate. The decline in the crude birth rates reflects a decline inunderlying fertility, as shown by the comparison of total fertility rates between the 1980-85 periodand the 1995-2000 period. In almost all Muslim-majority countries, TFRs fell between these twoperiods, in some cases quite sharply. Only in Somalia, Afghanistan and Yemen was there(expected to be) no downward trend in TFR. Levels and trends of TFRs will be discussed in moredetailed later in the paper.
DEMOGRAPHY OF MUSLIM POPULATIONS 5
The composition of Muslim populations
Ethnic composition
While there is a tendency to define the Muslim world as a unique ummah nation with similar culturaland socio-economic characteristics, Islamic countries represent a wide range of experience. Muslimsaround the world have much in common, but they are not as homogenous as some may think. Today,Muslims speak dozens of languages and exhibit many cultures through the 300 or so ethnic groups towhich they belong (Roudi 1988). In Indonesia alone, Muslims are divided into dozens of ethnicgroups speaking mutually unintelligible languages (though united through use of a national language,Bahasa Indonesia). In the Middle East, where the Arabic language and ethnicity provides a commonthread, Kurds form important minorities in Iraq and Syria, as well as in the non-Arabic countries ofTurkey and Iran. Iran is an ethnically diverse country, where Persians make up about half of thepopulation, Turks and Kurds another third, and a number of smaller ethnic groups, including Gilaki,Mazandarani, Lur, and Baluch, make up the remaining one-sixth (Omran and Roudi 1993: 17).Pakistan, too, has about half a dozen of ethnic groups each having its own language.
The outside world’s reaction to “Islam” is often a reaction to the cultural characteristics of particularethnic groups which follow the Islamic faith. It is important that the diversity of those groups, and therich tapestry of cultures which have embraced Islam, be recognised.
Demographic and socio-economic composition
Tables 3-8 provide detailed information on demographic, educational and economic characteristics ofMuslim-majority countries. This is different from saying that it provides data about the Muslimpopulation in those countries, because separate information is normally not available for the Muslimand non-Muslim populations. However, in those countries where a high proportion of the populationis Muslim, the characteristics shown for the population as a whole would apply with littlemodification to the Muslim population.
a) Age structure
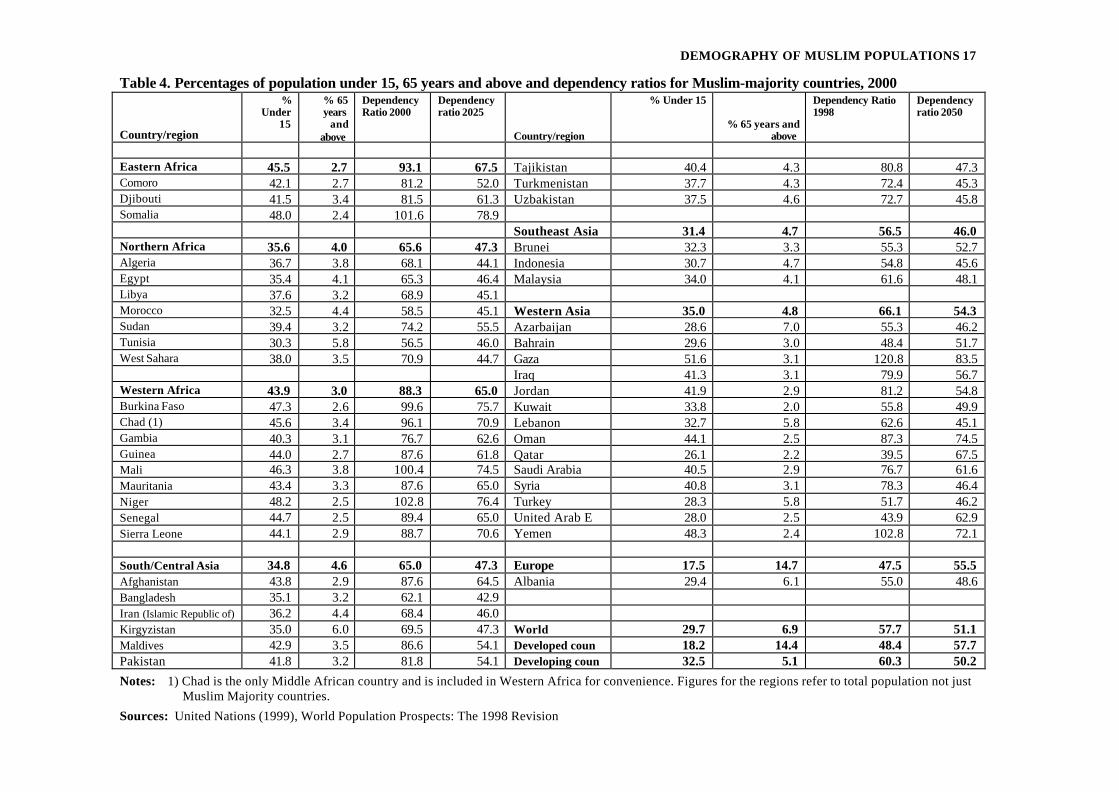
Muslim populations are generally characterized by a young age structure. Exactly half of the46 Muslim-majority countries had more than 40 per cent of the population under age 15, seven ofwhich had 45 per cent or more under 15. The figures were different, though, from one country toanother. For example, Gaza Strip, followed by Niger, had the youngest age structure (51 per cent and48 per cent under age 15, respectively), while Qatar (26 per cent under age 15) and Turkey, theUnited Arab Emirates and Azerbaijan (all 28 per cent) had much lower proportions of children.However, in some of these countries the age structure was much affected by labour migration. A highpercentage of population aged 65 and above can be taken as an indicator of an old populationstructure. In the world as a whole, 7 per cent of the population is aged 65 and above, and in developedcountries 14 per cent. By contrast, 30 of the Muslim-majority countries had 4 per cent or less ofpopulation aged 65 years and above, and only seven of them had more than 5 per cent of populationaged 65 and above.
The dependency ratio is a shorthand indicator of the proportion of the population in the main workingages – 15 to 64. It shows the ratio of the combined total of young (0-14) and old (over 64) populationto the population in the working ages, times 100. In the world as a whole, this ratio is 57.7, and indeveloping countries, somewhat higher – 60.3. As shown in Table 4, most Muslim countries havedependency ratios well above these levels, in a few cases rising above 100.
6 MOHAMMAD JALAL ABBASI-SHAVAZI AND GAVIN W. JONES
These high ratios reflect the generally high fertility rates and hence young age structure. Althoughelderly dependents are a lower proportion in these countries, the higher proportion of children morethan outweighs this, in its effect on overall dependency ratios.
The generally young age structure in Muslim majority countries has many implications for socialpolicy and for reproductive health programs in these countries. It adds to the task of achievinguniversal basic education, and of providing basic public health services to all the population. It alsoimplies a very high built-in potential for further population growth, as a result of what demographerscall ‘demographic momentum’ – ie the high proportion of the population in the peak reproductiveages, leading to higher numbers of births than in a population with an older age structure, andsuccessively larger cohorts moving into the peak reproductive ages.
Looking ahead, though, there is a good prospect that the dependency burden will lessen over quite alengthy period, provided that lower fertility levels are achieved. Using the United Nations mediumpopulation projections, Table 4 shows the expected dependency ratios in 2025. If the assumptions onwhich these projections are based are fulfilled, the proportion of children in these populations willdecline considerably, the proportion of elderly will rise considerably (though to levels still well belowthose of the world’s population as a whole) and the dependency ratio will fall substantially. (There isof course considerable variability between countries). These expected trends are very favourable foreconomic and social development.
(b) Urbanization
As for their urban-rural distribution, as a broad generalization, Muslims have been more likely to livein rural areas than the world population as a whole (Table 5), mainly because the countries in whichthey are concentrated have below-average levels of urbanization. 6 However, overall the populationsof Muslim-majority countries are slightly more urbanized than the developing countries as a whole.Urbanization in such countries as Burkina Faso, Niger, Bangladesh and Afghanistan wasexceptionally low (around 20 per cent). However, the urbanization levels in most of these countriesare rising, and therefore an increasing proportion of Muslims are living in urban areas.
It is worth noting that the percentages of population living in urban areas in some countries in theArab region were very high as compared as to other Muslim-majority countries, and even higher thanthe percentages for the developed world (76 per cent). For example, the percentage of populationliving in urban areas was high in such countries as Kuwait (98), Qatar (93), Bahrain (92), Lebanon(90), Libya (88), United Arab Emirates (86), Saudi Arabia (86) and Oman (84). Of the countrieshighlighted in this book, the percentages of urban population in Turkey was higher than others (75)followed by Iran (62), while less than 50 per cent of populations in Egypt (46), Indonesia (40) andPakistan (37) were living in urban areas.
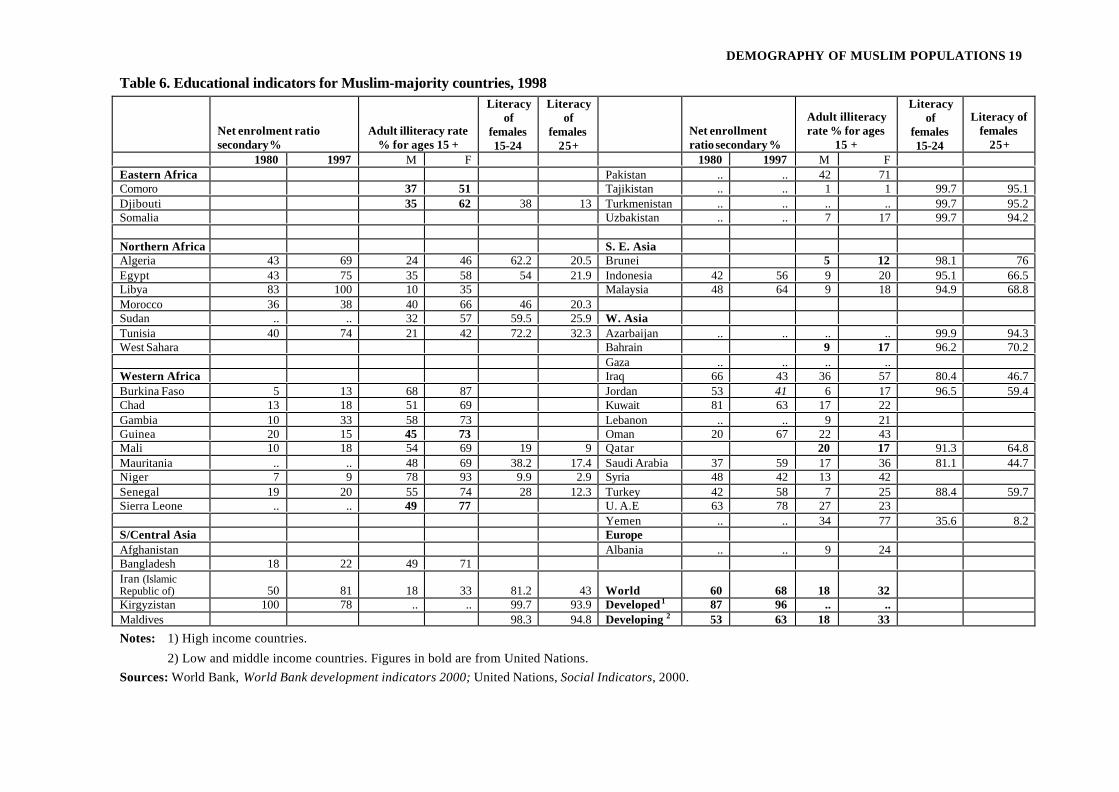
c) Literacy and education
Literacy, the ability to read and write, is an important indicator of wellbeing and of ability to operateeffectively in the modern world. As an indicator of educational activity in a country, however, it issubject to some drawbacks. Literacy reflects the impact of the schooling received by the adultpopulation. For some (the younger adults), this refers to schooling in quite recent times, but for others(older adults), it can refer to schooling received as much as 30, 40 or 50 years ago.
6 Whether there is a tendency for Muslims to be more or less concentrated in rural areas than non-Muslims living in thesame countries could be answered through further research. However, in India Muslims are found more concentrated inurban areas than the Hindus (Karim 1999).
DEMOGRAPHY OF MUSLIM POPULATIONS 7
If overall adult literacy is low, this reflects inadequate provision of schooling over the past 50 years.However, schooling may have improved sharply in recent years, and if so, this will not be reflected toany great extent in the adult literacy statistic.
Bearing this in mind, columns 4 and 5 of Table 6 showing the adult illiteracy rate for males andfemales are nevertheless of considerable interest. In 1980, a substantial proportion of Muslimcountries had high levels of illiteracy, both among males and even more among females (figures for1980 not shown in the table). Illiteracy was above 50 per cent in many cases. By 1998, there had beensubstantial improvement in these levels, in all countries, though there is still clearly a long way to go.There are relatively few Muslim countries where male illiteracy still exceeds 50 per cent, but stillmany where female illiteracy exceeds 50 per cent.
A useful indicator of the extent of improvement in literacy over time is the ratio of the literacy atolder adult ages to that of young people recently in the school-going ages. In the case of femaleliteracy, columns 6 and 7 of Table 6 show the literacy rate of females aged 15-24 and 25+respectively. In some cases (eg in the Central Asian republics and to a lesser extent in Malaysia andIndonesia) both are high, indicating a long history of high literacy, but it is more common to find lowlevels for females aged 25+ but much higher levels for females aged 15-24, suggesting a sharpimprovement in schooling of girls in more recent years. In those countries where literacy rates remainrelatively low for females aged 15-24 (eg in Mali, Niger, Senegal and Yemen), these is clearly a longway to go before satisfactory levels of female schooling are reached.
Another good indicator of educational availability and the interest of parents in schooling theirchildren is the net enrollment ratio at the secondary school level. In 1980, the majority of Muslimcountries had less than 50 per cent of their secondary school-aged young people in secondary school.The rates were lowest in West African countries. By 1997, these rates had generally improvedconsiderably, although they had actually declined in Guinea, as well as in Iraq, Jordan and Syria.
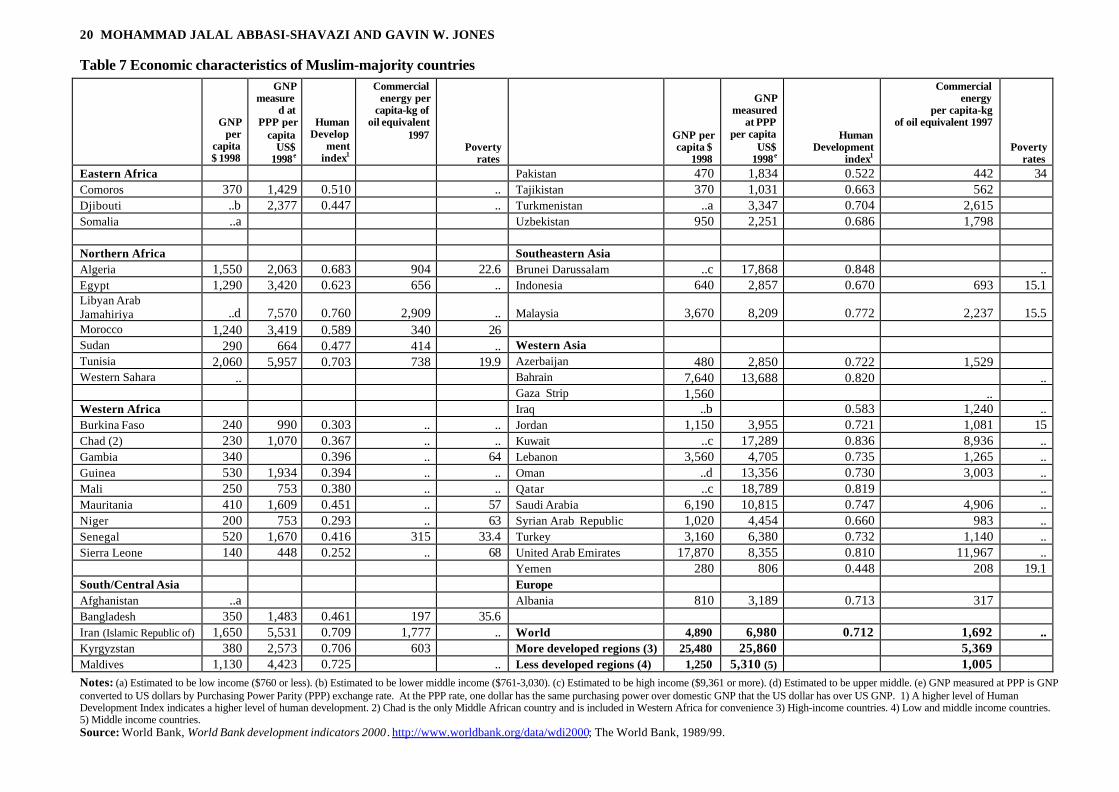
d) Income and wellbeing
The GNP per capita figures in Table 7 give a rough indication of the level of economic wellbeing ofthe populations of the Muslim-majority countries listed. If a figure of US$1,000 per annum is taken asan indicator that a country has escaped from dire poverty, over half of the countries in the list remainpoor, as they fall well under this line. This is true, for example, of all the West African countries, andall the South/Central Asian countries except Iran and the Maldives. At the other extreme, the oil-producing Middle Eastern countries boast some of the highest per capita incomes in the world; yetpoverty is endemic in their petroleum-poor neighbors (Omran and Roudi 1993: 4). There are,however, some prosperous middle-income Muslim-majority countries that are not major oil exporters.These include Malaysia, Turkey and Lebanon.
Another column in Table 7 shows per capita GNP figures adjusted for purchasing power parity. Thesegive a better indication of individuals’ real control over resources than do the unadjusted per capitaGNP figures. According to these figures, only the very poorest countries fall below the $1,000 level.Countries such as Tunisia, Iran, Malaysia and Turkey do relatively better according to this measurethan do some of the other countries – for example, Algeria, Lebanon and United Arab Emirates.
It is frequently argued that the UN’s Human Development Index gives a better indication of acountry’s level of development than GNP per capita figures. However, there are many difficultiesassociated with this measure (Castles, 1998; Castles (ed), 2000). For the most part, there is a fairdegree of correspondence in rankings of countries according to the two measures. But at the extremes,
8 MOHAMMAD JALAL ABBASI-SHAVAZI AND GAVIN W. JONES
the rankings diverge considerably. Countries ranking poorly on the GDP per capita measure whichscore much higher on the Human Development Index include Sri Lanka, Costa Rica and Cuba, whichhave all stressed equitable access to education and health services. At the other end of the spectrum,some of the oil-rich countries (and this includes a number of Muslim-majority countries) rank high onthe GDP per capita index but score more poorly on the Human Development Index, presumablybecause the oil wealth takes time to be translated into improved health and education, given culturalobstacles that take time to remove.
Two other indicators are shown in Table 7: commercial energy per capita and poverty rates.Unfortunately, the data are available for only a small proportion of the countries. In the case ofpoverty rates, inter-country comparisons are difficult, because the definition of poverty is up to eachcountry. Both measures show wide variation between countries.
e) Labour force participation and employment
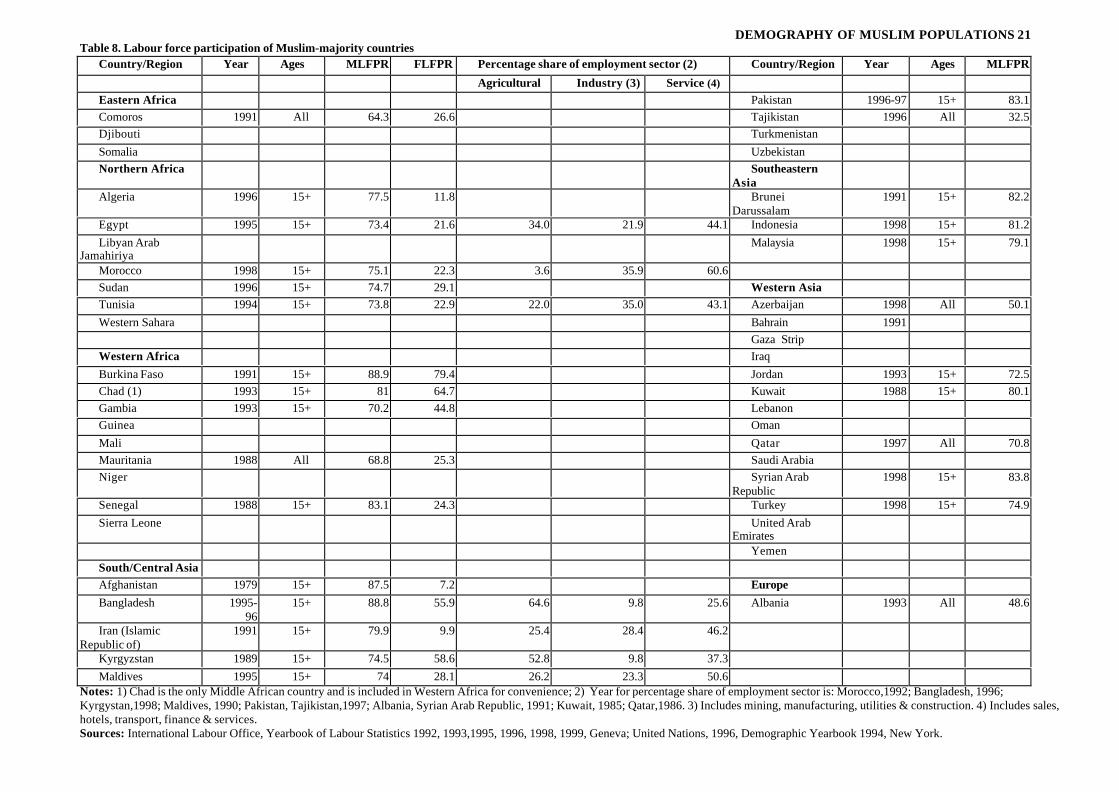
The percentage of adult males who are economically active varies much less than the percentage ofadult females. As shown in Table 8, in most Muslim majority countries for which data are available,the male labour force participation rate (LFPR) at ages above 15 ranges between 70 per cent and85 per cent. The rate among females varies much more widely – from only 10 per cent in Iran, 12 percent in Algeria and 15 per cent in Pakistan to 50 per cent or more in Indonesia, Bangladesh, Chad andKyrgistan. The differences may be partly the result of the content and sequence of questions oneconomic activity in censuses and surveys, and who provides the information in the household; thereis often a tendency for male respondents in the household to understate the extent of participation offemales in the workforce (Anker and Anker, 1989). In quite a few of these countries, female LFPRhas been tending to rise over time. Such countries are harnessing their human resources moreeffectively for economic development, because very low female LFPRs imply considerableunderutilization of the productive potential of their female population, especially where (as in Iran)the average levels of female education are now quite high.
Table 8 also shows the division of the employed population between three broad sectors – agriculture,industry and services. The distribution of workers across these sectors reflects the degree ofurbanization and industrialization, as well as the extent to which countries have entered the ‘post-industrial era’, with a high proportion of employment in services. Muslim-majority countries coverthe whole gamut. Some are highly agricultural (Bangladesh, Niger, and certainly other West Africancountries if data were available), with well over 60 per cent of employment in agriculture). Others aremuch more industrialized (eg Morocco, Tunisia, Malaysia). Services provide more than 60 per cent ofemployment in countries such as Morocco, and oil rich states in the Middle East and Brunei.
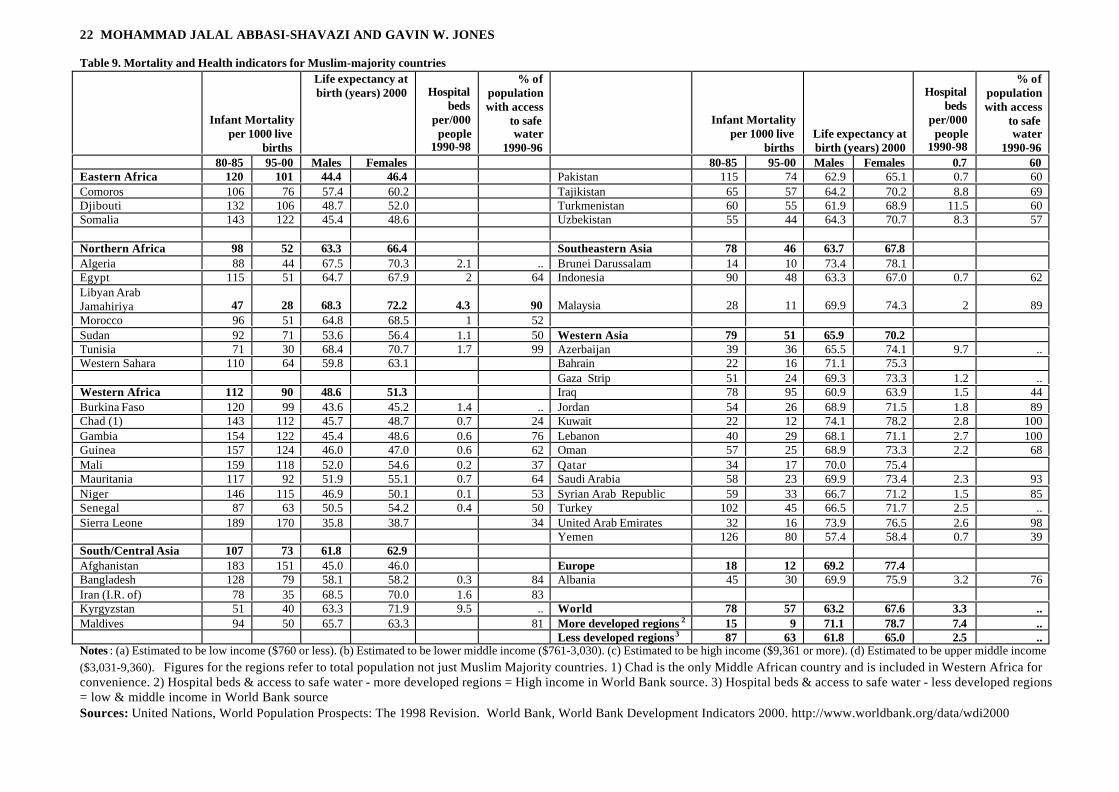
f) Mortality and health indicators
Mortality and health indicators in Table 9 are the infant mortality rate, the life expectancy at birth,hospital beds per 1000 people and percentages of population with access to safe water. Suchindicators are closely correlated with the income levels, so it is not surprising that high IMRs arerecorded in most of the African countries (particularly in Western Africa), as well as in countries suchas Afghanistan, Iraq and Pakistan. During 1980-85, there was an extraordinarily wide range of IMRvalues among Muslim countries. IMR was exceptionally high in Sierra Leone (189), Afghanistan(183) followed by such countries as Mali (159), Guinea and Niger (157 and 154 respectively). On theother hand, some Asian countries, particularly in Southeast and Western Asia, recorded very low IMRas compared to other Muslim-majority countries. For example, in the period 1980-85, the lowestIMR was recorded in Brunei (14), followed by Bahrain and Kuwait (22), and Malaysia (28).
DEMOGRAPHY OF MUSLIM POPULATIONS 9
In general, in the period 1980-85, 23 of the 46 Muslim-majority countries recorded higher IMR thanthe world as a whole (78), and 22 of them had higher IMR than that for less developed countries. Itwas interesting, however, that the figure for Brunei (14) was even lower than that for the developedcountries as a whole (15).
As shown in Table 9, there has been a substantial decline in IMR over time in most Muslim-majoritycountries, although it remains high in most Western African countries. Similar to the earlier period,the highest IMR in 1995-2000 was recorded for such countries as Sierra Leone (170), Afghanistan(151), Guinea (124), Gambia (122) and Mali (118). The lowest IMRs in Muslim-majority countieswere recorded in Brunei (10), Malaysia (11), Kuwait (12), United Arab Emirates and Qatar (allaround 15-20 per thousand live births).
As for life expectancy at birth, since this is heavily influenced by the level of IMR and of earlychildhood mortality, it is not surprising that the same general trends indicating lowered mortality canbe observed using this indicator. Countries with high IMR had lower life expectancies for both malesand females in the year 2000. The lowest life expectancy was recorded for Sierra Leone for bothmales (36) and females (39). The figures for males and females were lower than 50 for such countriesas Guinea, Afghanistan and Mali. Closely connected with their high living standards and low infantmortality rate, some Western Asian countries had higher life expectancy at birth than other Muslim-Majority countries.
A number of factors have led to these improvements in mortality. One is the rise in levels of living,which facilitate better nutrition, better quality housing, and greater affordability of health care.Another set of factors relate to improved public health and environmental sanitation, including thewidely implemented WHO-sponsored disease control and sanitation programs. The introduction ofantibiotics, childhood immunization, and access to maternal and child health programs were allassociated with rapid decline in infant mortality (Omran and Roudi 1993). Increased child spacingresulting partly from family planning programs also contributed.
Table 9 also shows two other health indicators for Muslim-majority countries: hospital per 1000population and percentage of population with access to safe water. The information is not availablefor all countries listed. However, it is clear that those countries with higher level of mortality andlower life expectancy had a poorer showing on health indicators. The higher number of hospital bedsper 1000 in such Central Asian countries as Turkmenistan, Azarbaijan, Tajikistan and Uzbakistan isworth noting.
Despite the improvements noted above in indicators of morbidity and mortality, the levels ofmortality remain unacceptably high in a great many Muslim-majority countries. This may be relatednot merely to the low levels of income in these countries. Caldwell (1986) has shown that whenmortality levels in countries are related to income levels, Islamic countries dominate the group of‘poor health achievers’ (countries where mortality is higher than would be expected on the basis ofincome levels). For example, the oil-rich countries have higher levels of mortality, on average, thanother countries with comparable income levels. Similarly, among less wealthy Islamic countries, onaverage mortality levels are higher than would be expected on the basis of their levels of income.Caldwell argues that this is related to the distinctive position of women in Islamic societies, operatingthrough more limited access to education and in other ways, which serves to militate against effectivehealth care.
10 MOHAMMAD JALAL ABBASI-SHAVAZI AND GAVIN W. JONES
g) Fertility measures
Weeks (1988) noted that, as a group, Muslim countries are still in the early stages of demographictransition, and that their fertility is universally high. High Muslim fertility has led some scholars tobelieve that religion and fertility were more closely correlated for Muslims than for any otherreligious groups (Lucas and Meyer 1994: 65). Substantial religious differentials in fertility have beenempirically documented in a large number of countries. For example, Mahmoudian and Carmichael(1998) found that in 1991 the fertility of Muslim women was much higher than that of non-Muslimwomen in Australia. Albania, with its large Muslim population, has the highest fertility in Europe(Omran and Roudi 1993). However, there have been puzzling exceptions to this pattern. For example,fertility was lower among Muslims than among Buddhists before the onset of Thailand’s fertilitytransition, although the reverse is clearly the case today (Knodel et al., 1999).
Total Fertility Rate (TFR), defined as the average number of children who would be born per womanduring her reproductive life if she followed current age-specific fertility levels, is the most widelyused single-figure of fertility. Table 3 presents TFRs for the Muslim-majority countries for the 1980-85 and 1995-2000 periods. In 1980-85, of 46 countries where TFRs were available, total fertility ratewas high in most of the Muslim-majority countries; 12 countries had TFR of 7 or more, in 15countries TFR was six to seven, 15 countries experienced TFRs of 4-6, and only four countries had anaverage of less than 4 children per woman. Out of the 46 Muslim countries, women in 33 countrieshad more than five children. The highest TFR was recorded for women in Niger with 8.1, followed bywomen in Burkina Faso with 7.8 children, and Yemen with 7.6. On the other hand, Azarbaijan hadthe lowest TFR (3.0), followed by Albania (3.4). Generally speaking, Muslims in Central Asianrepublics and in South-East Asia had lower fertility than Muslims in other countries.
By 1995-2000, according to United Nations estimates, the distribution of TFRs had moved down acouple of notches. Of the 46 countries, only three countries now had a TFR of 7 or more, six had aTFR of 6 to 7, 15 countries four to six, and as many as 22 countries less than four. Whereas in1989-85, women in 33 of the countries had more than five children, by 1995-2000 this had fallen toonly 19 countries.
A number of studies have confirmed that the demographic transition has been underway in manyMuslim countries for some time. For example, Rashad (2000) demonstrated that fertility transitionhas begun in many Arab countries. Interestingly, most of the Muslim countries experienced fertilitytransition between 1980 and 1996. The decline of fertility in Muslim countries was also evidenced byKarim (1997: 2), who found that, between the 1960s and mid-1990s, many Muslim countries haveexperienced fertility declines of more than 40 per cent, though declines of this magnitude were notexperienced in East and West Africa. As revealed in the table, fertility fell substantially in Muslim-majority countries. The fertility decline in such countries as Iran (62 per cent), Algeria (49 per cent),Tunisia and Syrian Arab Republic (46 per cent), and Bangladesh (44 per cent) was significant. Somecountries witnessed around 20-40 per cent decline, while the decline in other countries was modest.
In sum, fertility was high among Muslim countries in the 1980s, but it had declined significantly inmost of these countries by the late 1990s. This contradicts the widely held view that fertility transitionhas not started in Muslim countries. Nevertheless, the level of fertility is still high among some of theMuslim countries, particularly in Africa. The reduction of infant mortality discussed earlier mighthave contributed to the fertility decline by reducing the demand for more children. Karim (1997:29)concluded that ‘while socio-economic factors may have played an important role in early fertilityreductions in Muslim countries, effective family planning programs seem to have become the moreimportant factor in achieving fertility transition’.
DEMOGRAPHY OF MUSLIM POPULATIONS 11
Population policies in Muslim countries
Official population policies are important in indicating the attitude of the top leadership to populationissues. But there is a long step between official endorsement at the top and enthusiastic support at alllevels of government and within civil society. Pakistan was one of the first developing countries inthe world to acknowledge the need to lower fertility rates, and to develop a family planning programto help achieve this end. It adopted a population policy in 1960, followed by other large Muslimcountries – Egypt (1964), Turkey (1965) and Iran (1967). Though receiving top-level support,however, the history of family planning in Pakistan has been a chequered one, largely because theissue has been caught up in politics, and because it has never received strong support from thereligious leaders (Robinson, Shah and Shah, 1981; Rukanuddin and Hardee-Cleaveland, 1992).Similarly, in Egypt, although population policy has been strongly endorsed by the nation’s topleaders, the story further down the line is different. For example, of 36 imams interviewed, fourspontaneously mentioned population on the list of major problems/challenges, and another three didso after probing. “The rest (29) were adamant in denying the existence of a population problem. Forthem, it is all western propaganda. They all indicated that they preach in mosques and advise inprivate against birth control of any kind”. (Rashad and Eltigani, 2000:11).
Immediately after the Islamic Revolution in Iran, the family planning program introduced in 1967was officially dismantled. In addition, the new government adopted a pro-natalist approachencouraging younger age of marriage, and universality of marriage in the society. However, thegovernment population policy was reversed and a new antinatalist family planning program wasofficially inaugurated in December 1989. The Family Planning Bill was ratified by the Parliament inMay 1993, and there is evidence of considerable success in controlling fertility (Mehryar et al. 2001).
At an official level, if a recent UN publication (United Nations, 2000) is to be believed, most Muslim-majority countries seek to ‘maintain fertility’. But then that study is not to be believed, because for atleast three countries (Indonesia, Iran and Bangladesh) the UN’s categorization into the ‘maintainfertility’ instead of ‘lower fertility’ group is clearly wrong. 7 These are countries whose goals includereduction of fertility. What does seem clear from the United Nations study is that most Islamiccountries give direct support for contraceptive use, and others give indirect support.
In the Middle East, the small oil-rich countries of the Gulf welcome high rates of natural increaseamong their domestic populations, both to fuel socio-economic development and to boost theproportion of ‘natives’ in their countries. These countries are heavily reliant on labour migrants fromother countries to staff many sectors of the economy. Kuwait and Iraq follow explicitly pro-natalistpolicies (Omran and Roudi, 1993: 32-3). For such countries, labour migration policies are a keyelement of their population policies. The Gulf States rely increasingly on Asian rather than Arabworkers, in part because Asians are less likely to become permanent residents (Omran and Roudi,1993: 34).
The six selected countries under investigation
The combined population of the six countries included in this study (700 million) represents 65 percent of the total population of Muslim-majority countries. The six countries differ markedly from oneanother in their socio-economic indicators. In terms of per capita income levels, Turkey ranks thehighest ($3,160), followed by Iran ($1,650) and Egypt ($1,290). Indonesia, Pakistan and Bangladeshare far poorer than the other three countries, with $640, $470 and $350, respectively. Turkey’s per
7 Government officials designated to answer United Nations questionnaires such as this one are sometimes from aninappropriate department, or for other reasons lack knowledge of official policy.
12 MOHAMMAD JALAL ABBASI-SHAVAZI AND GAVIN W. JONES
capita income is nine times higher than that of Bangladesh. Approximately one third of thepopulations of both Pakistan and Bangladesh are officially living in poverty. But as evident in the percapita GNP figures given in Table 7, Pakistan and Bangladesh are by no means the poorest countriesin the Muslim world.
Educationally, Iran and Turkey are the most advanced according to the measures used in Table 6. In1997, the net enrollment ratio at the secondary school level in Iran (81) was higher than othercountries, followed by Egypt (75), Turkey and Indonesia (56), with Pakistan and Bangladesh muchlower. Although Egypt has higher illiteracy than Indonesia, it also has higher secondary schoolenrollment ratios, suggesting a sharper improvement in education in Egypt. Pakistan and Bangladeshare at the bottom of the list according to both educational indicators. Thus for these six countries,there is a fair degree of correspondence between income levels and advancement of education. Butthis is less true for mortality indicators. Turkey had an infant mortality rate of 45 in 1995-2000,compared with Iran’s 35, Egypt’s 51, Indonesia’s 48, Pakistan’s 74 and Bangladesh’s 79. Iran’smortality appears lower than expected, while Egypt’s appears higher than expected.
In 1980, fertility was high in all six countries, although the level differed from one country to another.TFRs in Pakistan (6.5), Iran (6.8) and Bangladesh (6.4) were higher than other countries, while Egypt(5.1) was midway between these and Turkey and Indonesia (4.1). However, all countries experienceda fertility transition between 1980 and the late 1990s, as a result of which TFR dropped substantiallyin Turkey, Iran and Indonesia (to between 2.5 and 2.8) as well as in Bangladesh (to 3.1) and in Egypt(to 3.4). The spectacular fertility decline in Iran (59 per cent) is worth noting. Despite the moderatedecline of fertility in Pakistan, TFR was still high (5.0) in 1995-2000 (Table 3).
This is consistent with contraceptive prevalence rate in these countries. In four countries, thecontraceptive prevalence rate in 1995 was higher than 50 per cent. The highest rate was in Iran (73per cent), followed by Turkey (64 per cent), Indonesia (57 per cent), and Egypt (55 per cent). InBangladesh it was 49 per cent and was much lower in Pakistan (18 per cent).
Conclusions
Most of the world’s Muslims (77 per cent) live in countries where more than 50 per cent of thepopulation (and in most cases, a much higher proportion) are Muslim. These are mostly located inAfrica, the Middle East and Asia, though small numbers of Muslims can be found in almost everycountry. From the estimated 1.3 billion Muslims in 2000, the numbers are expected to increasethrough natural increase to about 1.8 billion in 2025. From whatever perspective they are viewed,Muslim populations are characterized by great diversity. This is certainly true of their ethnic andcultural backgrounds, as well as their socio-economic conditions. Although on the whole, Muslimpopulations rank below the world’s average in levels of socio-economic development, there is a widerange of socio-economic conditions. Some of the oil-rich states are extremely wealthy, and some ofthe larger countries included in the detailed chapters in this book (eg Turkey, Iran and Egypt) are inthe upper ranks of developing countries. Mass education and development of mass communications inmost of these countries is weakening the traditional values and norms and leading to inroads byWestern culture, although in many cases there is strong resistance to these influences.
Fertility transition has begun in most of these countries at some time over the past two decades, and insome, it has moved very rapidly. Elsewhere, however, particularly in the West African countries,there is little evidence of the onset of fertility decline. Therefore, these countries have youthfulpopulations and because of population momentum are facing high growth rates, even if fertilitydeclines quite rapidly.

DEMOGRAPHY OF MUSLIM POPULATIONS 13
Some of the key issues their governments face are the expansion of education systems to providebasic education to all their young people, and provision of adequate employment and jobopportunities. There are also many pressing reproductive health needs, which require considerableinvestment in upgrading basic health services and revising health strategies, and coming to terms withdifficult issues related to adolescent sexuality.
Because of the rapid population growth in many of the Muslim-majority countries, Muslims areexpected to be climbing towards a quarter of the world’s population by the year 2025. Therefore, theirdemographic trends will have an important bearing on those of the world as a whole, and theirpolitical and cultural influence on the world stage is likely to increase.
14 MOHAMMAD JALAL ABBASI-SHAVAZI AND GAVIN W. JONES
Table 1. Population and percentages of Muslims in Islamic countries: countries with Muslim majority populations in 2000 (1)
Country/regionPopulation
in 1998, (m)
%Muslim
(3)
EstimatedMuslim
Population in1998 (m) Country/region
Populationin 1998, (m)
% Muslim(3)
EstimatedMuslim
Population in1998 (m)
Africa 252.1 219.7South/CentralAsia 410.9 381.5
Eastern Africa 11.5 11.5 Maldives 0.3 100.0 0.3
Somalia 10.1 99.9 10.1Iran (IslamicRepublic of) (2) 62.6 99.5 62.2
Comoro 0.7 99.3 0.7 Afghanistan 22.7 99.0 22.5Mayotte (3) 0.1 98.0 0.1 Pakistan 156.5 95.0 148.7Djibouti 0.6 97.2 0.6 Bangladesh 129.2 88.3 114.0
Uzbakistan 24.3 88.0 21.4Northern Africa 173.3 157.9 Turkmenistan 4.5 87.0 3.9West Sahara (3) 0.3 100.0 0.3 Tajikistan 6.2 85.0 5.3Algeria 31.5 99.9 31.4 Kirgyzistan 4.7 70.0 3.3Morocco 28.4 99.8 28.3Tunisia 9.6 99.5 9.5 Western Asia 172.5 165.6Libya 5.6 97.0 5.4 Yemen 18.1 99.9 18.1Egypt 68.5 90.0 61.6 Turkey 66.6 99.8 66.5Sudan 29.5 72.0 21.2 Gaza (3) 1.1 98.0 1.1
Iraq 23.1 97.0 22.4Western Africa 67.3 50.4 Saudi Arabia 21.6 96.6 20.9Mauritania 2.7 99.5 2.7 Jordan 6.7 96.5 6.4Gambia 1.3 95.0 1.2 United Arab E 2.4 96.0 2.3Senegal 9.5 92.0 8.7 Qatar 0.6 95.0 0.6Mali 11.2 90.0 10.1 Azarbaijan 7.7 93.4 7.2Niger 10.7 88.7 9.5 Oman 2.5 87.7 2.2Guinea (3, 4) 7.4 69.0 5.1 Syria 16.1 86.0 13.9Sierra Leone 4.9 60.0 2.9 Kuwait 2.0 85.0 1.7Chad 7.7 53.9 4.1 Bahrain 0.6 81.8 0.5Burkina Faso 11.9 50.0 6.0 Lebanon 3.3 55.3 1.8
Asia 823.2 750.8 Europe 3.1 2.2Southeast Asia 234.7 198.5 Albania 3.1 70.0 2.2Indonesia 212.1 87.2 185.0Brunei 0.3 67.2 0.2 Total 1073.3 967.5
Total in countries with lessthan 50 % 294.5Total Muslims 1262.0
Notes: 1) % Muslims were obtained from Encyclopaedia Britannica unless otherwise indicated. 2) Estimate.3) Percentages of Muslims were obtained from Weeks (1988).4) According to Encyclopaedia Britannica 86.9% Muslim in 1998.5) Weeks 49% Muslim.
Sources: Encyclopaedia Britannica; Weeks, J. R. (1988); World Bank(2000a,b); Population Reference Bureau (1999); United Nations (1999), World Population Prospects: The 1998Revision; Zanjani, (1991).

DEMOGRAPHY OF MUSLIM POPULATIONS 15
Table 2. Population and percentages of Muslims in Islamic countries with less than 50 per cent ofpopulation Muslim in 1998 (1)
Country/regionPopulation in
1998, (m)
%Muslim
(3)
EstimatedMuslim
Population in1998 (m) Country/region
Population in
1998, (m)
%Muslim
(3)
EstimatedMuslim
Population in1998 (m)
Africa 508.3 110.8 Asia 2,668.8 161.4
Eastern Africa 235.5 47.1South/CentralAsia 1,074.8 131.7
Eritrea 3.9 48.0 1.8 Kazakhstan 16.2 47.0 7.6Tanzania 33.5 35.0 11.7 India 1,013.7 12.0 121.6Ethiopia 62.6 30.1 18.8 Sri Lanka (2) 18.8 8.0 1.5Mozambique 19.7 28.2 5.5 Bhutan (2, 3) 2.1 5.0 0.1Malawi 10.9 20.0 2.2 Nepal 23.9 3.5 0.8Mauritius 1.2 16.3 0.2 Southeast Asia 277.5 9.2Uganda 21.8 16.0 3.5 Singapore 3.6 14.9 0.5Madagascar 15.9 7.0 1.1 Philippines 76.0 4.6 3.5Kenya 30.1 6.0 1.8 Thailand 61.4 4.0 2.5Reunion (2) 0.7 2.4 0.0 Myanmar (Burma) 45.6 3.8 1.7
Burundi 6.7 1.6 0.1Cambodia(Kampuchea) 11.2 2.0 0.2
Rwanda 7.7 1.0 0.1 Viet Nam (2) 79.8 1.0 0.8Zambia 9.2 1.0 0.1 Western Asia 7.0 1.1Zimbabwe (2) 11.7 0.9 0.1 Cyprus (2) 0.8 18.5 0.1Middle Africa 70.9 4.3 Israel 6.2 14.6 0.9Cameroon 15.1 21.8 3.3 East Asia 1,309.4 19.4Central African Republic(2) 3.6 8.0 0.3 Mongolia 2.7 4.0 0.1Zaire 50.5 1.4 0.7 China (2) 1,277.6 1.5 19.2Gabon 1.2 1.0 0.0 Hong Kong (2) 6.9 0.5 0.0Equitorial Guinea (2) 0.5 0.7 0.0 Taiwan (2, 4) 22.3 0.5 0.1Western Africa 161.6 58.9 Europe 322.2 19.8Nigeria 111.5 43.0 47.9 Eastern Europe 177.5 15.8Cote d'Ivoire 14.8 38.7 5.7 Bulgaria 8.2 13.1 1.1Guinea Bissau 1.2 30.0 0.4 Russia (USSR) 146.9 10.0 14.7Liberia 3.2 16.0 0.5 Romania 22.3 0.2 0.0Togo 4.6 15.0 0.7 Southern Europe 16.6 2.3
Ghana 20.2 14.4 2.9Bosnia &Herzegovina 4.0 40.0 1.6
Benin 6.1 12.0 0.7 Macedonia 2.0 30.0 0.6Southern Africa 40.4 0.4 Greece 10.6 1.3 0.1South Africa 40.4 1.1 0.4 Western Europe 69.2 0.8North America 309.5 2.0 Belgium 10.2 2.5 0.3Canada 31.1 0.9 0.3 France (2) 59.1 1.0 0.6United States (2) 278.4 0.6 1.7 Northern Europe 58.8 0.8Latin America &Caribbean 5.4 0.4
United Kingdom(2) 58.8 1.4 0.8
Central America 2.9 0.1 Oceania 19.7 0.2Panama (2) 2.9 4.5 0.1 Fiji 0.8 7.8 0.1Caribbean 1.3 0.1 Australia 18.9 0.9 0.2Trinidad & Tobago 1.3 5.9 0.1South America 1.3 0.2 Total 3,833.9 294.5Suriname 0.4 19.6 0.1Guyana 0.9 9.0 0.1
Notes: 1) % Muslims were obtained from Encyclopaedia Britannica unless otherwise indicated. 2) % Muslim were obtained from Weeks (1988).3) According to Encyclopedia Britannica 0% Muslim in 1998.
Sources: See Table 1.
16 MOHAMMAD JALAL ABBASI-SHAVAZI AND GAVIN W. JONES
Table 3. Crude Birth Rate (CBR), Crude Death Rate (CDR), Population Growth Rate (PGR), Net Reproduction Rate (NRR) and Total Fertility Rate (TFR) forMuslim-majority countries, 1995-2000
Country/region CBR CDRPGR1995-2000
NRR TFR for a period prior tothe year given Country/region CBR CDR
PGR1995-2000
NRR TFR for a period priorto the year given
1980-85 1995-00 1980-85 1995-00Eastern Africa 42.4 17.5 2.57 2.04 6.86 5.79 Tajikistan 31.8 6.9 1.47 1.84 5.54 4.15Comoro 36.5 9.4 2.72 1.97 7.05 4.80 Turkmenistan 28.6 7.2 1.79 1.61 4.79 3.60Djibouti 37.1 14.8 1.19 1.89 6.57 5.30 Uzbakistan 28.0 6.6 1.57 1.56 4.70 3.45Somalia 52.3 18.4 4.16 2.49 7.25 7.25
Southeast Asia 23.1 7.3 1.53 1.19 4.18 2.69Northern Africa 27.7 7.3 1.96 1.56 5.56 3.58 Brunei 22.2 3.1 2.17 1.34 3.80 2.80Algeria 29.2 5.6 2.30 1.73 6.36 3.81 Indonesia 22.7 7.5 1.43 1.15 4.06 2.58Egypt 26.3 6.8 1.89 1.52 5.06 3.40 Malaysia 25.0 4.8 2.02 1.51 4.24 3.18Libya 29.1 4.6 2.42 1.77 7.18 3.80Morocco 25.6 6.7 1.76 1.38 5.10 3.10 Western Asia 28.2 6.6 2.21 1.67 4.96 3.77Sudan 33.1 11.5 2.05 1.78 6.42 4.61 Azarbaijan 16.8 6.7 0.45 0.91 3.04 1.99Tunisia 20.6 6.7 1.39 1.16 4.90 2.55 Bahrain 20.5 3.6 2.03 1.38 4.63 2.90West Sahara 31.4 8.6 3.38 1.70 5.47 3.98 Gaza 47.1 4.6 4.27 3.42 7.40 7.30
Iraq 36.4 8.5 2.80 2.19 6.35 5.25Western Africa 40.4 15.0 2.49 2.00 6.97 5.47 Jordan 34.8 4.6 3.02 2.25 6.77 4.86Burkina Faso 46.0 18.6 2.73 2.24 7.80 6.57 Kuwait 22.1 2.2 3.09 1.40 4.87 2.89Chad 44.0 17.7 2.63 2.15 6.60 6.07 Lebanon 23.8 6.4 1.74 1.25 3.79 2.69Gambia 40.6 17.4 3.23 1.80 6.50 5.20 Oman 35.3 4.1 3.30 2.74 7.20 5.85Guinea 42.1 17.5 0.76 1.86 7.00 5.51 Qatar 18.0 3.7 1.78 1.78 5.45 3.74Mali 46.9 16.0 2.44 2.31 7.11 6.60 Saudi Arabia 33.8 4.1 3.37 2.72 7.28 5.80Mauritania 40.5 13.3 2.73 2.09 6.10 5.50 Syria 30.4 4.9 2.54 1.85 7.38 4.00Niger 48.7 16.9 3.19 2.42 8.12 6.84 Turkey 22.1 6.4 1.66 1.14 4.10 2.50
Senegal 40.0 13.0 2.59 2.15 6.70 5.57 United Arab E 18.5 2.9 1.99 1.63 5.23 3.42Sierra Leone 46.6 25.9 2.95 1.77 6.50 6.06 Yemen 47.7 10.4 3.74 3.00 7.60 7.60
South/Central Asia 27.0 8.8 1.76 1.40 4.92 3.36 Europe 10.3 11.3 0.03 0.68 1.87 1.42Afghanistan 51.3 20.6 2.89 2.21 6.90 6.90 Albania 20.6 5.5 -0.40 1.15 3.40 2.50Bangladesh 27.6 9.6 1.70 1.26 6.44 3.11Iran (Islamic Republic of) 22.0 5.5 1.66 1.26 6.80 2.80Kirgyzistan 25.5 7.4 0.55 1.48 4.10 3.21 World 22.1 8.9 1.33 1.16 3.58 2.71Maldives 35.0 7.2 2.78 2.30 6.80 5.40 Developed coun 3 11.2 10.1 0.28 0.75 1.84 1.57Pakistan 36.1 7.8 2.77 2.14 6.50 5.03 Developing coun4 24.9 8.6 1.59 1.26 4.15 3.00
Note: 1) Chad is the only Middle African country and is included in Western Africa for convenience.2) Figures for the regions refer to total population not just Muslim Majority countries.
Sources: United Nations (1999), World Population Prospects: The 1998 Revision
DEMOGRAPHY OF MUSLIM POPULATIONS 17
Table 4. Percentages of population under 15, 65 years and above and dependency ratios for Muslim-majority countries, 2000
Country/region
%Under
15
% 65years
andabove
DependencyRatio 2000
Dependencyratio 2025
Country/region
% Under 15
% 65 years andabove
Dependency Ratio1998
Dependencyratio 2050
Eastern Africa 45.5 2.7 93.1 67.5 Tajikistan 40.4 4.3 80.8 47.3Comoro 42.1 2.7 81.2 52.0 Turkmenistan 37.7 4.3 72.4 45.3Djibouti 41.5 3.4 81.5 61.3 Uzbakistan 37.5 4.6 72.7 45.8Somalia 48.0 2.4 101.6 78.9
Southeast Asia 31.4 4.7 56.5 46.0Northern Africa 35.6 4.0 65.6 47.3 Brunei 32.3 3.3 55.3 52.7Algeria 36.7 3.8 68.1 44.1 Indonesia 30.7 4.7 54.8 45.6Egypt 35.4 4.1 65.3 46.4 Malaysia 34.0 4.1 61.6 48.1Libya 37.6 3.2 68.9 45.1Morocco 32.5 4.4 58.5 45.1 Western Asia 35.0 4.8 66.1 54.3Sudan 39.4 3.2 74.2 55.5 Azarbaijan 28.6 7.0 55.3 46.2Tunisia 30.3 5.8 56.5 46.0 Bahrain 29.6 3.0 48.4 51.7West Sahara 38.0 3.5 70.9 44.7 Gaza 51.6 3.1 120.8 83.5
Iraq 41.3 3.1 79.9 56.7Western Africa 43.9 3.0 88.3 65.0 Jordan 41.9 2.9 81.2 54.8Burkina Faso 47.3 2.6 99.6 75.7 Kuwait 33.8 2.0 55.8 49.9Chad (1) 45.6 3.4 96.1 70.9 Lebanon 32.7 5.8 62.6 45.1Gambia 40.3 3.1 76.7 62.6 Oman 44.1 2.5 87.3 74.5Guinea 44.0 2.7 87.6 61.8 Qatar 26.1 2.2 39.5 67.5Mali 46.3 3.8 100.4 74.5 Saudi Arabia 40.5 2.9 76.7 61.6Mauritania 43.4 3.3 87.6 65.0 Syria 40.8 3.1 78.3 46.4Niger 48.2 2.5 102.8 76.4 Turkey 28.3 5.8 51.7 46.2Senegal 44.7 2.5 89.4 65.0 United Arab E 28.0 2.5 43.9 62.9Sierra Leone 44.1 2.9 88.7 70.6 Yemen 48.3 2.4 102.8 72.1
South/Central Asia 34.8 4.6 65.0 47.3 Europe 17.5 14.7 47.5 55.5Afghanistan 43.8 2.9 87.6 64.5 Albania 29.4 6.1 55.0 48.6Bangladesh 35.1 3.2 62.1 42.9Iran (Islamic Republic of) 36.2 4.4 68.4 46.0Kirgyzistan 35.0 6.0 69.5 47.3 World 29.7 6.9 57.7 51.1Maldives 42.9 3.5 86.6 54.1 Developed coun 18.2 14.4 48.4 57.7Pakistan 41.8 3.2 81.8 54.1 Developing coun 32.5 5.1 60.3 50.2
Notes: 1) Chad is the only Middle African country and is included in Western Africa for convenience. Figures for the regions refer to total population not justMuslim Majority countries.
Sources: United Nations (1999), World Population Prospects: The 1998 Revision

18 MOHAMMAD JALAL ABBASI-SHAVAZI AND GAVIN W. JONES
Table 5. Percentage of population living in urban areas for 1970, 2000, and 2030, Muslim-majoritycountries
Country/region 1970 2000 2030 Country/region 1950 2000 2050
Eastern Africa 10.4 25.1 42.5 Tajikistan 36.9 32.9 49.9Comoro 19.4 33.2 52.2 Turkmenistan 47.8 45.5 60.9Djibouti 62.0 83.3 88.8 Uzbakistan 36.7 42.4 58.9Somalia 20.4 27.5 45.8
Southeast Asia 20.4 36.9 55.0Northern Africa 36.4 50.9 67.2 Brunei 61.7 72.2 82.6Algeria 39.5 59.3 73.6 Indonesia 17.1 40.2 61.0Egypt 42.2 45.9 61.8 Malaysia 33.5 57.3 72.5Libya 45.3 87.6 92.0Morocco 34.5 55.3 70.9 Western Asia 44.4 71.4 81.5Sudan 16.4 36.1 57.7 Azarbaijan 49.9 57.3 70.7Tunisia 44.5 65.5 78.4 Bahrain 78.7 92.2 95.8West Sahara 43.3 95.4 98.2 Gaza 82.1 94.6 96.2
Iraq 56.2 76.8 85.0Western Africa 19.6 40.1 58.8 Jordan 50.5 74.2 83.5Burkina Faso 5.7 18.5 37.0 Kuwait 77.8 97.6 98.5Chad 11.8 23.8 40.8 Lebanon 59.4 89.7 93.9Gambia 15.0 32.5 52.1 Oman 11.4 84.0 94.0Guinea 13.8 32.8 52.5 Qatar 79.9 92.5 95.2Mali 14.3 30.0 49.8 Saudi Arabia 48.7 85.7 91.5Mauritania 13.7 57.7 74.4 Syria 43.3 54.5 69.1Niger 8.5 20.6 38.9 Turkey 38.4 75.3 87.3Senegal 33.4 47.0 64.5 United Arab E 57.2 85.9 90.8Sierra Leone 17.5 36.6 55.9 Yemen 13.3 38.0 58.1
South/Central Asia 20.6 30.7 48.5 Europe 64.5 74.9 82.9Afghanistan 11.0 21.9 39.9 Albania 31.8 39.1 56.7Bangladesh 7.6 21.2 40.6Iran (Islamic Republic of) 41.9 61.6 74.6Kirgyzistan 37.4 40.1 57.0 World 36.7 47.4 61.1Maldives 13.5 28.3 46.2 Developed coun 67.6 76.1 83.7Pakistan 24.9 37.0 55.9 Developing coun 25.1 40.5 57.3
Notes: 1) Chad is the only Middle African country and is included in Western Africa for convenience. Figures for the regions refer to total population not just Muslim Majority countries.
Sources: United Nations (1997), World Urbanization Prospects: the 1996 Revision
DEMOGRAPHY OF MUSLIM POPULATIONS 19
Table 6. Educational indicators for Muslim-majority countries, 1998
Net enrolment ratiosecondary %
Adult illiteracy rate% for ages 15 +
Literacyof
females15-24
Literacyof
females25+
Net enrollmentratio secondary %
Adult illiteracyrate % for ages
15 +
Literacyof
females15-24
Literacy offemales
25+1980 1997 M F 1980 1997 M F
Eastern Africa Pakistan .. .. 42 71Comoro 37 51 Tajikistan .. .. 1 1 99.7 95.1Djibouti 35 62 38 13 Turkmenistan .. .. .. .. 99.7 95.2Somalia Uzbakistan .. .. 7 17 99.7 94.2
Northern Africa S. E. AsiaAlgeria 43 69 24 46 62.2 20.5 Brunei 5 12 98.1 76Egypt 43 75 35 58 54 21.9 Indonesia 42 56 9 20 95.1 66.5Libya 83 100 10 35 Malaysia 48 64 9 18 94.9 68.8Morocco 36 38 40 66 46 20.3Sudan .. .. 32 57 59.5 25.9 W. AsiaTunisia 40 74 21 42 72.2 32.3 Azarbaijan .. .. .. .. 99.9 94.3West Sahara Bahrain 9 17 96.2 70.2
Gaza .. .. .. ..Western Africa Iraq 66 43 36 57 80.4 46.7Burkina Faso 5 13 68 87 Jordan 53 41 6 17 96.5 59.4Chad 13 18 51 69 Kuwait 81 63 17 22Gambia 10 33 58 73 Lebanon .. .. 9 21Guinea 20 15 45 73 Oman 20 67 22 43Mali 10 18 54 69 19 9 Qatar 20 17 91.3 64.8Mauritania .. .. 48 69 38.2 17.4 Saudi Arabia 37 59 17 36 81.1 44.7Niger 7 9 78 93 9.9 2.9 Syria 48 42 13 42Senegal 19 20 55 74 28 12.3 Turkey 42 58 7 25 88.4 59.7Sierra Leone .. .. 49 77 U. A.E 63 78 27 23
Yemen .. .. 34 77 35.6 8.2S/Central Asia EuropeAfghanistan Albania .. .. 9 24Bangladesh 18 22 49 71Iran (IslamicRepublic of) 50 81 18 33 81.2 43 World 60 68 18 32Kirgyzistan 100 78 .. .. 99.7 93.9 Developed 1 87 96 .. ..Maldives 98.3 94.8 Developing 2 53 63 18 33
Notes: 1) High income countries.
2) Low and middle income countries. Figures in bold are from United Nations.Sources: World Bank, World Bank development indicators 2000; United Nations, Social Indicators, 2000.
20 MOHAMMAD JALAL ABBASI-SHAVAZI AND GAVIN W. JONES
Table 7 Economic characteristics of Muslim-majority countries
GNPper
capita$ 1998
GNPmeasure
d atPPP per
capitaUS$
1998e
HumanDevelop
mentindex1
Commercialenergy per
capita-kg ofoil equivalent
1997Poverty
rates
GNP percapita $
1998
GNPmeasured
at PPPper capita
US$1998e
HumanDevelopment
index1
Commercial energy
per capita-kg of oil equivalent 1997
Povertyrates
Eastern Africa Pakistan 470 1,834 0.522 442 34Comoros 370 1,429 0.510 .. Tajikistan 370 1,031 0.663 562Djibouti ..b 2,377 0.447 .. Turkmenistan ..a 3,347 0.704 2,615Somalia ..a Uzbekistan 950 2,251 0.686 1,798
Northern Africa Southeastern AsiaAlgeria 1,550 2,063 0.683 904 22.6 Brunei Darussalam ..c 17,868 0.848 ..Egypt 1,290 3,420 0.623 656 .. Indonesia 640 2,857 0.670 693 15.1Libyan ArabJamahiriya ..d 7,570 0.760 2,909 .. Malaysia 3,670 8,209 0.772 2,237 15.5Morocco 1,240 3,419 0.589 340 26Sudan 290 664 0.477 414 .. Western AsiaTunisia 2,060 5,957 0.703 738 19.9 Azerbaijan 480 2,850 0.722 1,529Western Sahara .. Bahrain 7,640 13,688 0.820 ..
Gaza Strip 1,560 ..Western Africa Iraq ..b 0.583 1,240 ..Burkina Faso 240 990 0.303 .. .. Jordan 1,150 3,955 0.721 1,081 15Chad (2) 230 1,070 0.367 .. .. Kuwait ..c 17,289 0.836 8,936 ..Gambia 340 0.396 .. 64 Lebanon 3,560 4,705 0.735 1,265 ..Guinea 530 1,934 0.394 .. .. Oman ..d 13,356 0.730 3,003 ..Mali 250 753 0.380 .. .. Qatar ..c 18,789 0.819 ..Mauritania 410 1,609 0.451 .. 57 Saudi Arabia 6,190 10,815 0.747 4,906 ..Niger 200 753 0.293 .. 63 Syrian Arab Republic 1,020 4,454 0.660 983 ..Senegal 520 1,670 0.416 315 33.4 Turkey 3,160 6,380 0.732 1,140 ..Sierra Leone 140 448 0.252 .. 68 United Arab Emirates 17,870 8,355 0.810 11,967 ..
Yemen 280 806 0.448 208 19.1South/Central Asia EuropeAfghanistan ..a Albania 810 3,189 0.713 317Bangladesh 350 1,483 0.461 197 35.6Iran (Islamic Republic of) 1,650 5,531 0.709 1,777 .. World 4,890 6,980 0.712 1,692 ..Kyrgyzstan 380 2,573 0.706 603 More developed regions (3) 25,480 25,860 5,369Maldives 1,130 4,423 0.725 .. Less developed regions (4) 1,250 5,310 (5) 1,005Notes: (a) Estimated to be low income ($760 or less). (b) Estimated to be lower middle income ($761-3,030). (c) Estimated to be high income ($9,361 or more). (d) Estimated to be upper middle. (e) GNP measured at PPP is GNPconverted to US dollars by Purchasing Power Parity (PPP) exchange rate. At the PPP rate, one dollar has the same purchasing power over domestic GNP that the US dollar has over US GNP. 1) A higher level of HumanDevelopment Index indicates a higher level of human development. 2) Chad is the only Middle African country and is included in Western Africa for convenience 3) High-income countries. 4) Low and middle income countries.5) Middle income countries.Source: World Bank, World Bank development indicators 2000 . http://www.worldbank.org/data/wdi2000; The World Bank, 1989/99.
DEMOGRAPHY OF MUSLIM POPULATIONS 21Table 8. Labour force participation of Muslim-majority countries
Country/Region Year Ages MLFPR FLFPR Percentage share of employment sector (2) Country/Region Year Ages MLFPR
Agricultural Industry (3) Service (4)
Eastern Africa Pakistan 1996-97 15+ 83.1Comoros 1991 All 64.3 26.6 Tajikistan 1996 All 32.5Djibouti Turkmenistan
Somalia UzbekistanNorthern Africa Southeastern
AsiaAlgeria 1996 15+ 77.5 11.8 Brunei
Darussalam1991 15+ 82.2
Egypt 1995 15+ 73.4 21.6 34.0 21.9 44.1 Indonesia 1998 15+ 81.2
Libyan ArabJamahiriya
Malaysia 1998 15+ 79.1
Morocco 1998 15+ 75.1 22.3 3.6 35.9 60.6Sudan 1996 15+ 74.7 29.1 Western AsiaTunisia 1994 15+ 73.8 22.9 22.0 35.0 43.1 Azerbaijan 1998 All 50.1
Western Sahara Bahrain 1991Gaza Strip
Western Africa Iraq
Burkina Faso 1991 15+ 88.9 79.4 Jordan 1993 15+ 72.5Chad (1) 1993 15+ 81 64.7 Kuwait 1988 15+ 80.1Gambia 1993 15+ 70.2 44.8 LebanonGuinea Oman
Mali Qatar 1997 All 70.8Mauritania 1988 All 68.8 25.3 Saudi ArabiaNiger Syrian Arab
Republic1998 15+ 83.8
Senegal 1988 15+ 83.1 24.3 Turkey 1998 15+ 74.9
Sierra Leone United ArabEmirates
YemenSouth/Central AsiaAfghanistan 1979 15+ 87.5 7.2 Europe
Bangladesh 1995-96
15+ 88.8 55.9 64.6 9.8 25.6 Albania 1993 All 48.6
Iran (IslamicRepublic of)
1991 15+ 79.9 9.9 25.4 28.4 46.2
Kyrgyzstan 1989 15+ 74.5 58.6 52.8 9.8 37.3
Maldives 1995 15+ 74 28.1 26.2 23.3 50.6Notes: 1) Chad is the only Middle African country and is included in Western Africa for convenience; 2) Year for percentage share of employment sector is: Morocco,1992; Bangladesh, 1996;Kyrgystan,1998; Maldives, 1990; Pakistan, Tajikistan,1997; Albania, Syrian Arab Republic, 1991; Kuwait, 1985; Qatar,1986. 3) Includes mining, manufacturing, utilities & construction. 4) Includes sales,hotels, transport, finance & services.Sources: International Labour Office, Yearbook of Labour Statistics 1992, 1993,1995, 1996, 1998, 1999, Geneva; United Nations, 1996, Demographic Yearbook 1994, New York.
22 MOHAMMAD JALAL ABBASI-SHAVAZI AND GAVIN W. JONES
Table 9. Mortality and Health indicators for Muslim-majority countries
Infant Mortalityper 1000 live
births
Life expectancy atbirth (years) 2000 Hospital
bedsper/000people
1990-98
% ofpopulationwith access
to safewater
1990-96
Infant Mortalityper 1000 live
birthsLife expectancy atbirth (years) 2000
Hospitalbeds
per/000people
1990-98
% ofpopulationwith access
to safewater
1990-9680-85 95-00 Males Females 80-85 95-00 Males Females 0.7 60
Eastern Africa 120 101 44.4 46.4 Pakistan 115 74 62.9 65.1 0.7 60Comoros 106 76 57.4 60.2 Tajikistan 65 57 64.2 70.2 8.8 69Djibouti 132 106 48.7 52.0 Turkmenistan 60 55 61.9 68.9 11.5 60Somalia 143 122 45.4 48.6 Uzbekistan 55 44 64.3 70.7 8.3 57
Northern Africa 98 52 63.3 66.4 Southeastern Asia 78 46 63.7 67.8Algeria 88 44 67.5 70.3 2.1 .. Brunei Darussalam 14 10 73.4 78.1Egypt 115 51 64.7 67.9 2 64 Indonesia 90 48 63.3 67.0 0.7 62Libyan ArabJamahiriya 47 28 68.3 72.2 4.3 90 Malaysia 28 11 69.9 74.3 2 89Morocco 96 51 64.8 68.5 1 52Sudan 92 71 53.6 56.4 1.1 50 Western Asia 79 51 65.9 70.2Tunisia 71 30 68.4 70.7 1.7 99 Azerbaijan 39 36 65.5 74.1 9.7 ..Western Sahara 110 64 59.8 63.1 Bahrain 22 16 71.1 75.3
Gaza Strip 51 24 69.3 73.3 1.2 ..Western Africa 112 90 48.6 51.3 Iraq 78 95 60.9 63.9 1.5 44Burkina Faso 120 99 43.6 45.2 1.4 .. Jordan 54 26 68.9 71.5 1.8 89Chad (1) 143 112 45.7 48.7 0.7 24 Kuwait 22 12 74.1 78.2 2.8 100Gambia 154 122 45.4 48.6 0.6 76 Lebanon 40 29 68.1 71.1 2.7 100Guinea 157 124 46.0 47.0 0.6 62 Oman 57 25 68.9 73.3 2.2 68Mali 159 118 52.0 54.6 0.2 37 Qatar 34 17 70.0 75.4Mauritania 117 92 51.9 55.1 0.7 64 Saudi Arabia 58 23 69.9 73.4 2.3 93Niger 146 115 46.9 50.1 0.1 53 Syrian Arab Republic 59 33 66.7 71.2 1.5 85Senegal 87 63 50.5 54.2 0.4 50 Turkey 102 45 66.5 71.7 2.5 ..Sierra Leone 189 170 35.8 38.7 34 United Arab Emirates 32 16 73.9 76.5 2.6 98
Yemen 126 80 57.4 58.4 0.7 39South/Central Asia 107 73 61.8 62.9Afghanistan 183 151 45.0 46.0 Europe 18 12 69.2 77.4Bangladesh 128 79 58.1 58.2 0.3 84 Albania 45 30 69.9 75.9 3.2 76Iran (I.R. of) 78 35 68.5 70.0 1.6 83Kyrgyzstan 51 40 63.3 71.9 9.5 .. World 78 57 63.2 67.6 3.3 ..Maldives 94 50 65.7 63.3 81 More developed regions 2 15 9 71.1 78.7 7.4 ..
Less developed regions3 87 63 61.8 65.0 2.5 ..Notes : (a) Estimated to be low income ($760 or less). (b) Estimated to be lower middle income ($761-3,030). (c) Estimated to be high income ($9,361 or more). (d) Estimated to be upper middle income($3,031-9,360). Figures for the regions refer to total population not just Muslim Majority countries. 1) Chad is the only Middle African country and is included in Western Africa forconvenience. 2) Hospital beds & access to safe water - more developed regions = High income in World Bank source. 3) Hospital beds & access to safe water - less developed regions= low & middle income in World Bank sourceSources: United Nations, World Population Prospects: The 1998 Revision. World Bank, World Bank Development Indicators 2000. http://www.worldbank.org/data/wdi2000

DEMOGRAPHY OF MUSLIM POPULATIONS 23
REFERENCES
Abbasi-Shavazi, M.J. 2000a, National trends and social inclusion: fertility trends anddifferentials in the Islamic Republic of Iran, 1972-1996, Paper presented at theIUSSP conference on Family Planning in the 21st Century, Dhaka, 16-21January.
Abbasi-Shavazi, M.J. 2000b, Effects of marital fertility and nuptiality on fertilitytransition in the Islamic Republic of Iran, 1976-1996, Working Papers inDemography, No. 84, Canberra, Australian National University.
Anker, R. and Anker, M. 1989, “Measuring the female labour force in Egypt”,International Labour Review, 128(4): 511-520.
Attane, E. 1999, Fertility and identity: Muslims in Xinjiang, ISIM Newsletter, 4:11-12.
Caldwell, J. C., 1986, “Routes to low mortality in poor countries”, Population andDevelopment Review, 12(1): 171-220.
Castles, I., 1998, “The mismeasure of nations: A review essay on the HumanDevelopment Report 1998”, Population and Development Review, 24(4).
Castles, I. (ed), 2000, Facts and Fancies of Human Development, Occasional PaperSeries 1/2000, Academy of the Social Sciences in Australia, Canberra.
Daftary, F. 1995, The Isma'ilis: Their History and Doctrines. Cambridge: CambridgeUniversity Press.
Encyclopedia Britannica. http://www.britannica.com
Givens B. P. and Hirschman, C. 1994, ‘Modernization and consanguineous marriagein Iran’, Journal of Marriage and the Family, 56 (November): 820-834.
International Labour Office, Various years, Yearbook of Labour Statistics, Geneva.
Karim, M. 1999. Migration, socio-economic development and reproductive behaviouramong Muslims in India and Pakistan, Discussion Paper, Asia ResearchCentre, London School of Economics.
Karim, M. 1997, Reproductive Behavior in Muslim Countries, DHS Working Papers,No. 23, Macro International Inc. and United Nation Population Fund, NewYork.
Kirk, D. 1966, “Factors affecting Moslem natality” in B. Berelson et al. (eds.), FamilyPlanning and Population Programs, University of Chicago Press, Chicago:561-79.
24 MOHAMMAD JALAL ABBASI-SHAVAZI AND GAVIN W. JONES
Knodel, John, Gray, R. S., Sriwatcharin, P. and Peracca, S. 1999, “Religion andreproduction: Muslims in Buddhist Thailand”, Population Studies, 53:149-164.
Lucas, D., and Meyer, P. 1994. 'The background to fertility.' In D. Lucas and P.Meyer (eds.), Beginning Population Studies. Canberra: Australian NationalUniversity, pp. 56-68
Mahmoudian, H. and Carmichael, G. (1998), An analysis of Muslim fertility inAustralia using the own-children method, Journal of Muslim minority Affairs,18(2): 251-269.
Mehryar, A.H. Roudi, N. Aghajanian, A. and Tajdini, F. (1998) 'Evaluation andattainments of the family planning program in the Islamic Republic of Iran'.Working paper, Tehran: Institute for Research on Planning and development.
Momeni, M. 1985, An Introduction to Shi'i Islam: The History and Doctrines ofTwelver Shi'ism. New haven: Yale University Press.
Omran, A. R. and Roudi, F. 1993, The Middle East Population Puzzle, PopulationBulletin Vol. 48, No. 1, Washington D.C., Population Reference Bureau.
Pictorial China, 1997, Islam in China, Beijing, New Star Publisher.
Population Reference Bureau. 1999, World Population Data Sheet.
Rashad, H. (2000), Demographic Transition in Arab Countries: a new perspective,Journal of Population Research, 17(1): 83-101.
Rashad, H., and Eltigani, E. E. 2000, Population policy, cultural dynamics,development and fertility decline in Egypt, Paper prepared for the workshopon: Islam, the State and Population Policy, Canberra, 6-8 July.
Robinson, W. C., Shah, M.A. and Shah, N. 1981, “The family planning program inPakistan: What went wrong?”, International Family Planning Perspectives,7:85.
Roudi, N. 1988, The demography of Islam, Population Today, 16(3): 6-9.
Rukanuddin, A. R. and K. Hardee-Cleveland, 1992, “Can family planning succeed inPakistan?” International Family Planning Perspectives, 18(3): 109-115.
Schimmel, A. 1980, Islam in the Indian Subcontinent, E. J. Brill, Leiden.
Schubel, V. J. 1993, Religious performance in contemporary Islam, University ofSouth Carolina Press.

DEMOGRAPHY OF MUSLIM POPULATIONS 25
The World Bank, 1998/99, World Development Report: Knowledge for Development,Oxford University Press, New York.
United Nations, 1999, World Population Prospects: The 1998 Revision, New York.
United Nations, 1997, World Urbanization Prospects: the 1996 Revision, New York.
United Nations, 2000a, Global Population Policy: Database, 1999, New York.
United Nations, 2000, Social Indicators. http://www.un.org./Depts/unsd/social/literac.htm
United Nations, 1996, Demographic Yearbooks, New York.
Weeks, J. R. 1988, The demography of Islamic nations, Population Bulletin No. 43,Washington, D.C., Population Reference Bureau.
World Bank, Development Indicators 2000. http://www.worldbank.org/data/wdi2000
World Bank, 2000, World Development Report: Knowledge for Development1998/1999.
Yann, R. 1995, Shi'ite Islam, Oxford University Press.
Zanjani, H. (1991), Population and Urbanization in Iran [in Persian], Urban Planningand Architecture Research Centre, Ministry of Housing and Urban Planning.