Embed Size (px)
Citation preview
790 New York Avenue, Huntington, N.Y. 11743
(800) 383-8464 Fax (631) 757-1333
Research Report – Update Investors should consider this report as only a single factor in making their investment decision.
Perion Network Ltd. Speculative Buy
John Nobile
PERI $5.18 — (NASDAQ) November 8, 2019
2017A 2018A 2019E 2020E
Revenues (millions) $274.0 $252.8 $257.2 $268.0
Earnings (loss) per share $(2.81)* $0.31 $0.39 $0.55
52-Week range $7.06 – $2.47 Fiscal year ends: December
Common shares out as of 11/6/19 26.9 million Revenue per share (TTM) $9.67
Approximate float 16.1 million Price/Sales (TTM) 0.5X
Market capitalization $139 million Price/Sales (2020)E 0.5X
Tangible book value/share $1.06 Price/Earnings (TTM) 14.4X
Price/tangible book value 4.9X Price/Earnings (2020)E 9.4X
* Includes $85.7 million or $(3.31) per share of impairment charges.
Perion Network Ltd., headquartered in Holon, Israel, is a global provider of online advertising and search technology to brands and
publishers. The company provides data-driven execution, from high impact ad formats to branded search and a unified social and
mobile programmatic platform.
Key investment considerations:
Reiterating Speculative Buy rating and increasing twelve-month price target to $7.00 per share (from $6.50 per
share) based on our 2020 EBITDA estimate and an increased sector valuation.
The company’s transition from selling standard advertising formats to its integrated Synchronized Digital
Branding advertising solution appears to be gaining traction. The rate of decline in advertising revenue narrowed
in 3Q19 and we project a further narrowing in 4Q19 with a return to growth in 2020 as agencies increasingly
adopt Perion’s new high impact ads.
In September 2019, Perion launched its Synchromatic Marketplace which will enable programmatic access to all
of Undertone’s high-impact digital advertising formats, such as its Synchronized Digital Branding platform.
In August 2019, Perion announced the appointment of Dan Aks as president of Undertone effective September 16,
2019.
Perion reported (11/6/19) 3Q19 revenues increased 15% to $65.8 million and EPS of $0.11 compared to $0.08 in
the year ago period. We projected 3Q19 revenue of $64 million and EPS of $0.08.
For 2019, we project a 1.7% increase in revenue to $257.2 million and EPS of $0.39. We previously projected
revenue of $258.4 million and EPS of $0.40. Our revised estimates primarily reflect a slight reduction in
advertising sales than previously anticipated, partly offset by lower customer acquisition costs.
For 2020, we project a 4.2% increase in revenue to $268 million and EPS of $0.55. We previously projected
revenue of $271 million and EPS of $0.58. Our revised forecast primarily reflects a slight reduction in our
advertising sales forecast than previously anticipated, partly offset by lower customer acquisition costs.
*Please view our disclosures on pages 14 - 16.
Perion Network Ltd.
Taglich Brothers, Inc.
2
Recommendation and Valuation
Reiterating Speculative Buy rating on Perion and increasing our twelve-month price target to $7.00 per
share (from $6.50 per share) based on our 2020 EBITDA estimate and an increased sector valuation.
The company’s transition from selling standard advertising formats to its integrated Synchronized Digital
Branding advertising solution appears to be gaining traction. The rate of decline in advertising revenue narrowed
in 3Q19 and we project a further narrowing in 4Q19 with a return to growth in 2020 as agencies increasingly
adopt Perion’s new high impact ads.
Perion has been optimizing its cost structure through cuts in SG&A spending to focus on profitability while
increasing its R&D spending in an effort to accelerate growth in its advertising operations. Over the past two-
and-three-quarter years, PERI’s strong cash flow allowed it to pay down debt while maintaining a relatively high
cash position ($1.98 per share as of September 30, 2019 - includes short-term bank deposits). Our forecast
through 2020 anticipates strong cash earnings that should enable PERI to further strengthen its balance sheet. At
the end of 2020, we project Perion to have over $45 million cash and debt of $8.3 million, down from debt of
$77.7 million in 2016.
PERI trades at a forward EV/EBITDA multiple of approximately 4.3X (3.8X previously). Industry peers trade at
a forward EV/EBITDA multiple of 12.7X (previously 12.5X, source: Thomson Reuters). We anticipate investors
according PERI a multiple approaching that of the industry with solid cash earnings forecasted through 2020.
Applying an EV/EBITDA multiple of 5.7X (up from 5.5X previously based on a higher sector valuation) to our
2020 EBITDA/share projection of $1.08, discounted for execution risk, implies a year-ahead value of
approximately $7.00 per share.
Significant Developments
Synchromatic Marketplace Launched – In September 2019, Perion announced that its Undertone division
launched its Synchromatic Marketplace. The launch enables programmatic (typically refers to the use of software
to purchase digital advertising as opposed to the traditional process that involves human negotiations) access to all
of Undertone’s high-impact digital advertising formats, such as its Synchronized Digital Branding platform.
Daniel Aks Appointed President of Undertone – In August 2019, Perion announced the appointment of Dan Aks
as president of Undertone starting on September 16, 2019. Aks has stepped down from the board of directors of
Perion, effective August 26, 2019.
Aks’ management experience includes CEO of Antenna Audio Inc., and COO/Chief of Staff at McGraw
Education. Aks also served as COO for PRIMEDIA Consumer Magazines.
BS degree in Manufacturing/Industrial Engineering. BA degree in Business Administration from Rutgers
University. MBA from Harvard Business School.
Organizational History
The company was incorporated in the State of Israel in November 1999 under the name Verticon Ltd. and
changed its name to IncrediMail Ltd. in November 2000. In November 2011, the company changed its name to
Perion Network Ltd. Since 2011, Perion completed several acquisitions, including the acquisitions of
ClientConnect Ltd. in 2014 and Interactive Holding Corp. in 2015, collectively referred to as Undertone.
The company completed its initial public offering of ordinary shares in the US in February 2006. Since
November 2007, the company’s ordinary shares also trade on the Tel-Aviv Stock Exchange (TASE).
Perion Network Ltd.
Taglich Brothers, Inc.
3
Source: Perion Presentation
Business
Perion Network Ltd., headquartered in Holon, Israel, is a global provider of online advertising and search
technology to brands and publishers. The company provides data-driven execution, from high impact ad formats
to branded search and a unified social and mobile programmatic platform. Programmatic advertising refers to the
buying of digital advertising space automatically, with computers using data to decide which ads to buy and how
much to pay for them.
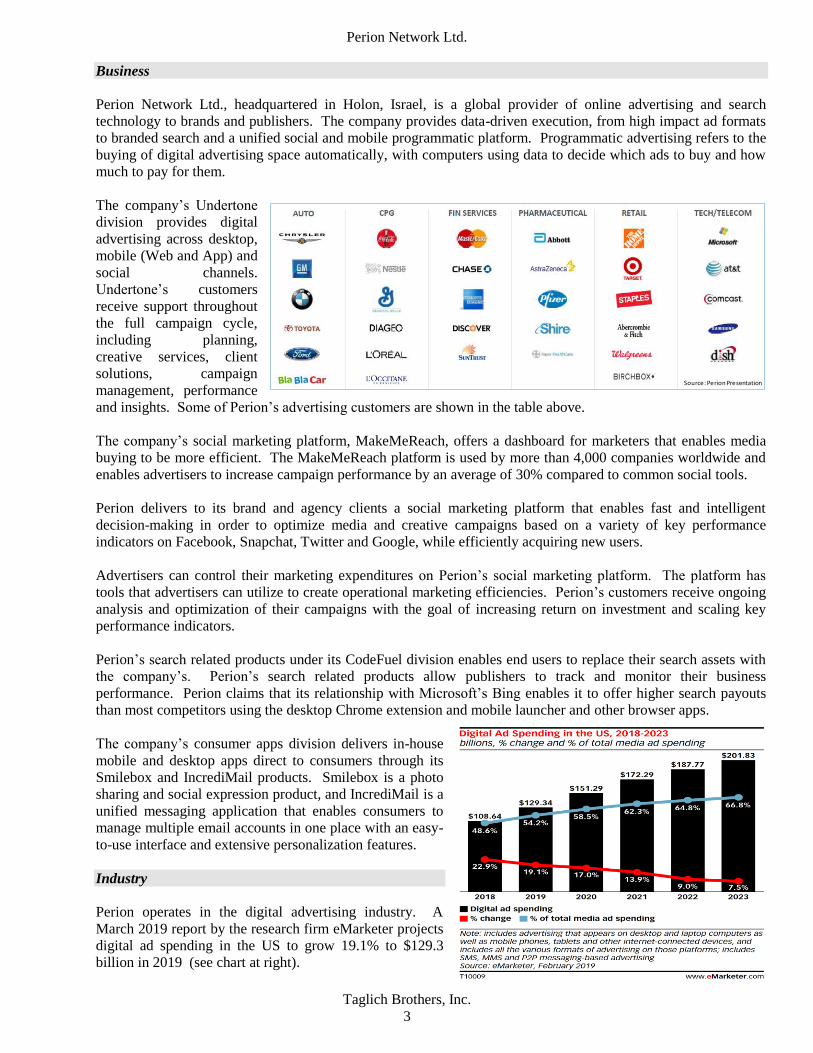
The company’s Undertone
division provides digital
advertising across desktop,
mobile (Web and App) and
social channels.
Undertone’s customers
receive support throughout
the full campaign cycle,
including planning,
creative services, client
solutions, campaign
management, performance
and insights. Some of Perion’s advertising customers are shown in the table above.
The company’s social marketing platform, MakeMeReach, offers a dashboard for marketers that enables media
buying to be more efficient. The MakeMeReach platform is used by more than 4,000 companies worldwide and
enables advertisers to increase campaign performance by an average of 30% compared to common social tools.
Perion delivers to its brand and agency clients a social marketing platform that enables fast and intelligent
decision-making in order to optimize media and creative campaigns based on a variety of key performance
indicators on Facebook, Snapchat, Twitter and Google, while efficiently acquiring new users.
Advertisers can control their marketing expenditures on Perion’s social marketing platform. The platform has
tools that advertisers can utilize to create operational marketing efficiencies. Perion’s customers receive ongoing
analysis and optimization of their campaigns with the goal of increasing return on investment and scaling key
performance indicators.
Perion’s search related products under its CodeFuel division enables end users to replace their search assets with
the company’s. Perion’s search related products allow publishers to track and monitor their business
performance. Perion claims that its relationship with Microsoft’s Bing enables it to offer higher search payouts
than most competitors using the desktop Chrome extension and mobile launcher and other browser apps.
The company’s consumer apps division delivers in-house
mobile and desktop apps direct to consumers through its
Smilebox and IncrediMail products. Smilebox is a photo
sharing and social expression product, and IncrediMail is a
unified messaging application that enables consumers to
manage multiple email accounts in one place with an easy-
to-use interface and extensive personalization features.
Industry
Perion operates in the digital advertising industry. A
March 2019 report by the research firm eMarketer projects
digital ad spending in the US to grow 19.1% to $129.3
billion in 2019 (see chart at right).
Perion Network Ltd.
Taglich Brothers, Inc.
4
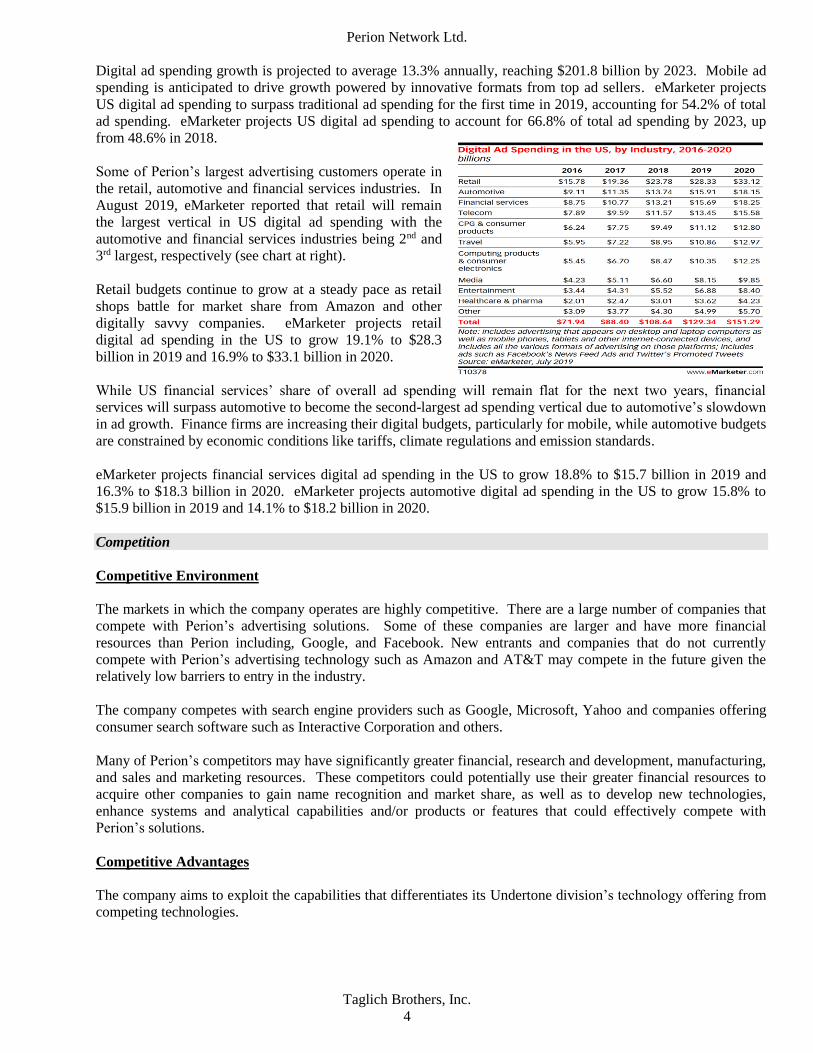
Digital ad spending growth is projected to average 13.3% annually, reaching $201.8 billion by 2023. Mobile ad
spending is anticipated to drive growth powered by innovative formats from top ad sellers. eMarketer projects
US digital ad spending to surpass traditional ad spending for the first time in 2019, accounting for 54.2% of total
ad spending. eMarketer projects US digital ad spending to account for 66.8% of total ad spending by 2023, up
from 48.6% in 2018.
Some of Perion’s largest advertising customers operate in
the retail, automotive and financial services industries. In
August 2019, eMarketer reported that retail will remain
the largest vertical in US digital ad spending with the
automotive and financial services industries being 2nd and
3rd largest, respectively (see chart at right).
Retail budgets continue to grow at a steady pace as retail
shops battle for market share from Amazon and other
digitally savvy companies. eMarketer projects retail
digital ad spending in the US to grow 19.1% to $28.3
billion in 2019 and 16.9% to $33.1 billion in 2020.
While US financial services’ share of overall ad spending will remain flat for the next two years, financial
services will surpass automotive to become the second-largest ad spending vertical due to automotive’s slowdown
in ad growth. Finance firms are increasing their digital budgets, particularly for mobile, while automotive budgets
are constrained by economic conditions like tariffs, climate regulations and emission standards.
eMarketer projects financial services digital ad spending in the US to grow 18.8% to $15.7 billion in 2019 and
16.3% to $18.3 billion in 2020. eMarketer projects automotive digital ad spending in the US to grow 15.8% to
$15.9 billion in 2019 and 14.1% to $18.2 billion in 2020.
Competition
Competitive Environment
The markets in which the company operates are highly competitive. There are a large number of companies that
compete with Perion’s advertising solutions. Some of these companies are larger and have more financial
resources than Perion including, Google, and Facebook. New entrants and companies that do not currently
compete with Perion’s advertising technology such as Amazon and AT&T may compete in the future given the
relatively low barriers to entry in the industry.
The company competes with search engine providers such as Google, Microsoft, Yahoo and companies offering
consumer search software such as Interactive Corporation and others.
Many of Perion’s competitors may have significantly greater financial, research and development, manufacturing,
and sales and marketing resources. These competitors could potentially use their greater financial resources to
acquire other companies to gain name recognition and market share, as well as to develop new technologies,
enhance systems and analytical capabilities and/or products or features that could effectively compete with
Perion’s solutions.
Competitive Advantages
The company aims to exploit the capabilities that differentiates its Undertone division’s technology offering from
competing technologies.
Perion Network Ltd.
Taglich Brothers, Inc.
5
Source: August 2019 Presentation
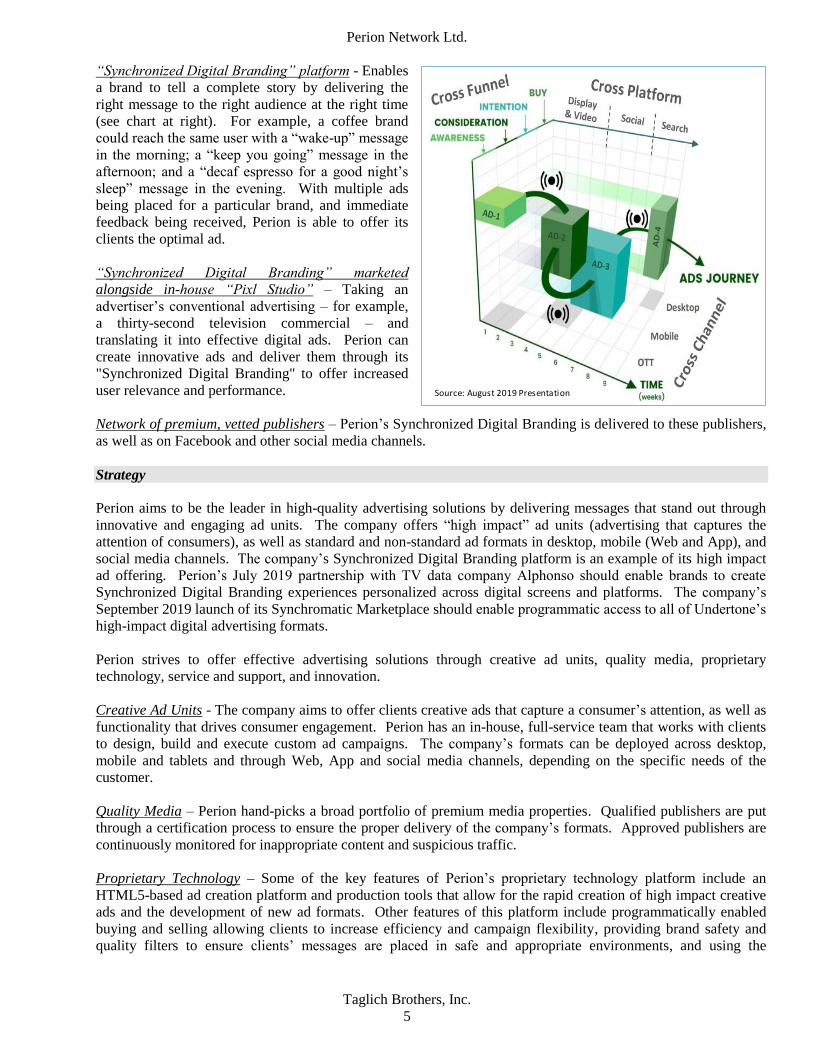
“Synchronized Digital Branding” platform - Enables
a brand to tell a complete story by delivering the
right message to the right audience at the right time
(see chart at right). For example, a coffee brand
could reach the same user with a “wake-up” message
in the morning; a “keep you going” message in the
afternoon; and a “decaf espresso for a good night’s
sleep” message in the evening. With multiple ads
being placed for a particular brand, and immediate
feedback being received, Perion is able to offer its
clients the optimal ad.
“Synchronized Digital Branding” marketed
alongside in-house “Pixl Studio” – Taking an
advertiser’s conventional advertising – for example,
a thirty-second television commercial – and
translating it into effective digital ads. Perion can
create innovative ads and deliver them through its
"Synchronized Digital Branding" to offer increased
user relevance and performance.
Network of premium, vetted publishers – Perion’s Synchronized Digital Branding is delivered to these publishers,
as well as on Facebook and other social media channels.
Strategy
Perion aims to be the leader in high-quality advertising solutions by delivering messages that stand out through
innovative and engaging ad units. The company offers “high impact” ad units (advertising that captures the
attention of consumers), as well as standard and non-standard ad formats in desktop, mobile (Web and App), and
social media channels. The company’s Synchronized Digital Branding platform is an example of its high impact
ad offering. Perion’s July 2019 partnership with TV data company Alphonso should enable brands to create
Synchronized Digital Branding experiences personalized across digital screens and platforms. The company’s
September 2019 launch of its Synchromatic Marketplace should enable programmatic access to all of Undertone’s
high-impact digital advertising formats.
Perion strives to offer effective advertising solutions through creative ad units, quality media, proprietary
technology, service and support, and innovation.
Creative Ad Units - The company aims to offer clients creative ads that capture a consumer’s attention, as well as
functionality that drives consumer engagement. Perion has an in-house, full-service team that works with clients
to design, build and execute custom ad campaigns. The company’s formats can be deployed across desktop,
mobile and tablets and through Web, App and social media channels, depending on the specific needs of the
customer.
Quality Media – Perion hand-picks a broad portfolio of premium media properties. Qualified publishers are put
through a certification process to ensure the proper delivery of the company’s formats. Approved publishers are
continuously monitored for inappropriate content and suspicious traffic.
Proprietary Technology – Some of the key features of Perion’s proprietary technology platform include an
HTML5-based ad creation platform and production tools that allow for the rapid creation of high impact creative
ads and the development of new ad formats. Other features of this platform include programmatically enabled
buying and selling allowing clients to increase efficiency and campaign flexibility, providing brand safety and
quality filters to ensure clients’ messages are placed in safe and appropriate environments, and using the
Perion Network Ltd.
Taglich Brothers, Inc.
6
Undertone Data Management System which enables the company to capture, process and analyze data associated
with ad campaigns in order to deliver better results to clients.
Service and Support – Perion provides its clients with service and support before, during and after the campaign
cycle. The company utilizes a consultative approach to develop the appropriate campaign strategy. Perion then
oversees all aspects of a client’s campaign to ensure it meets the clients’ objectives and provides clients with
campaign results, key performance metrics and critical analysis.
Innovation – In order to remain competitive, Perion must continue to develop new solutions and services. To
accomplish this, the company relies on its in-house research and development team that researches, prototypes
and tests emerging technology in order to determine how best to reach and influence consumers. The team also
conducts research on consumer interactions with ad formats, features and functionalities to determine preferences
and usage behavior. We project R&D spending will increase to $22.6 million in 2020 from $18.9 million in 2018.
Economic Outlook
In October 2018, the International Monetary Fund (IMF) lowered its global economic growth estimates to 3% for
2019 and 3.4% for 2020, down from its July 2019 estimates of 3.2% for 2019 and 3.5% for 2020. The IMF said
that after slowing sharply in the last three quarters of 2018, the pace of global economic activity remains weak.
Momentum in manufacturing activity has weakened substantially to levels not seen since the global financial
crisis.
The IMF lowered its economic growth estimate for the US to 2.4% for 2019 but raised it to 2.1% for 2020. In
July 2019, the IMF projected US growth of 2.6% for 2019 and 1.9% for 2020. The IMF said that trade tensions
have resulted in tariff increases between the US and China and have hurt business sentiment and confidence
globally. While financial market sentiment has been undermined by these developments, a shift toward increased
monetary policy accommodation in the US has been a counterbalancing force.
The advance estimate of US GDP growth (released on October 30, 2019) showed the US economy grew at an
annual rate of 1.9% in 3Q19, down from 2% in 2Q19. The 3Q19 US GDP growth estimate primarily reflects
increases in consumer and government spending, housing investment, and exports, while business and inventory
investment decreased.
Projections
2019 Forecast - We project a 1.7% increase in revenue to $257.2 million and net income of $10.4 million or
$0.39 per share. We previously projected revenue of $258.4 million and net income of $10.4 million or $0.40 per
share. Our revised estimates primarily reflect 3Q19 results and a slower ramp in advertising sales than previously
anticipated.
We project gross margins of 89.9%. Customer acquisition costs and media buy expenses are projected to increase
4.4% to $134 million as payments to publishers and developers increase. R&D should increase 19.9% to $22.6
million as the company continues to enhance its technology platforms. Selling and marketing expenses should
decrease by 7.9% to $35.8 million and general and administrative expenses should decrease by 16.5% to $13.7
million reflecting the company’s cost optimization efforts.
We project a 2.2% increase in operating income to $15 million due primarily to higher sales. Financial expenses
should decrease 14.8% to $3.2 million from $3.8 million due to a projected reduction in debt. We project the
company paying $1.4 million in taxes for a 12.1% tax rate.
In 2019, we project $33.3 million cash from operations on cash earnings of $21.4 million and an $11.9 million
decrease in working capital. The decrease in working capital reflects a reduction in receivables. Cash from
operations is unlikely to cover capital expenditures and the pay down of debt, decreasing cash by $7.5 million to
$33.3 million at the end of 2019.
Perion Network Ltd.
Taglich Brothers, Inc.
7
2020 Forecast - We project a 4.2% increase in revenue to $268 million and net income of $14.8 million or $0.55
per share. We previously projected revenue of $271 million and net income of $15.1 million or $0.58 per share.
Our revised estimates primarily reflect a slight reduction in advertising sales than previously anticipated partly
offset by lower customer acquisition costs.
We project gross margins of 90.5%. Customer acquisition costs and media buy expenses are projected to increase
6% to $142 million as payments to publishers and developers increase. R&D should remain relatively flat at
$22.6 million. Selling and marketing expenses should increase slightly to $36.2 million as the company promotes
its enhanced advertising product while we project a 6.8% decrease in general and administrative expenses to
$12.8 million as the company continues to control costs.
We project a 33.3% increase in operating income to $20 million as the company’s significant investments in R&D
begin to pay off. We project the company paying $3.7 million in taxes for a 20% tax rate.
In 2020, we project $23.8 million cash from operations on cash earnings of $25.9 million and a $2 million
increase in working capital. The increase in working capital primarily reflects an increase in receivables. Cash
from operations should cover capital expenditures and the pay down of debt, increasing cash by $11.8 million to
$45.1 million at the end of 2020.
3Q and Nine-month Financial Results
3Q19
Perion reported net income of $2.9 million or $0.11 per share on a 15% increase in total revenue to $65.8 million.
We projected 3Q19 revenue of $64 million and net income of $2 million or $0.08 per share. In the year ago
period, EPS was $0.08 on revenue of $57.2 million.
Advertising revenues decreased 17.8% to $21.6 million. Search and other revenues increased 42.9% to $44.2
million. The decrease in advertising revenue was primarily due to the company’s transition from selling standard
format advertising to an integrated solution (Synchronized Digital Branding – a sequence of ads that align with
the consumer from awareness, to consideration, to intent, to a purchase). The increase in search and other
revenues was primarily due to the addition of new publishers, higher revenue-per-mille (estimated earnings that
accrue for every 1,000 impressions received) and an increased number of searches.
Gross profit increased 14% to $59 million from $51.7 million while gross margins decreased to 89.6% from
90.4%. Customer acquisition costs and media buy expenses increased 18.6% to $34.2 million from $28.8 million.
Research and development costs increased by 37.7% to $6 million from $4.3 million. Selling and marketing
expenses remained flat at $8.6 million. General and administrative expenses decreased 8.3% to $3.6 million from
$3.9 million. Depreciation and amortization expenses increased by 4% to $2.6 million from $2.5 million.
Financial expenses decreased 66.1% to $419,000 from $1.2 million. Perion paid $680,000 in taxes versus
$84,000 in 3Q18.
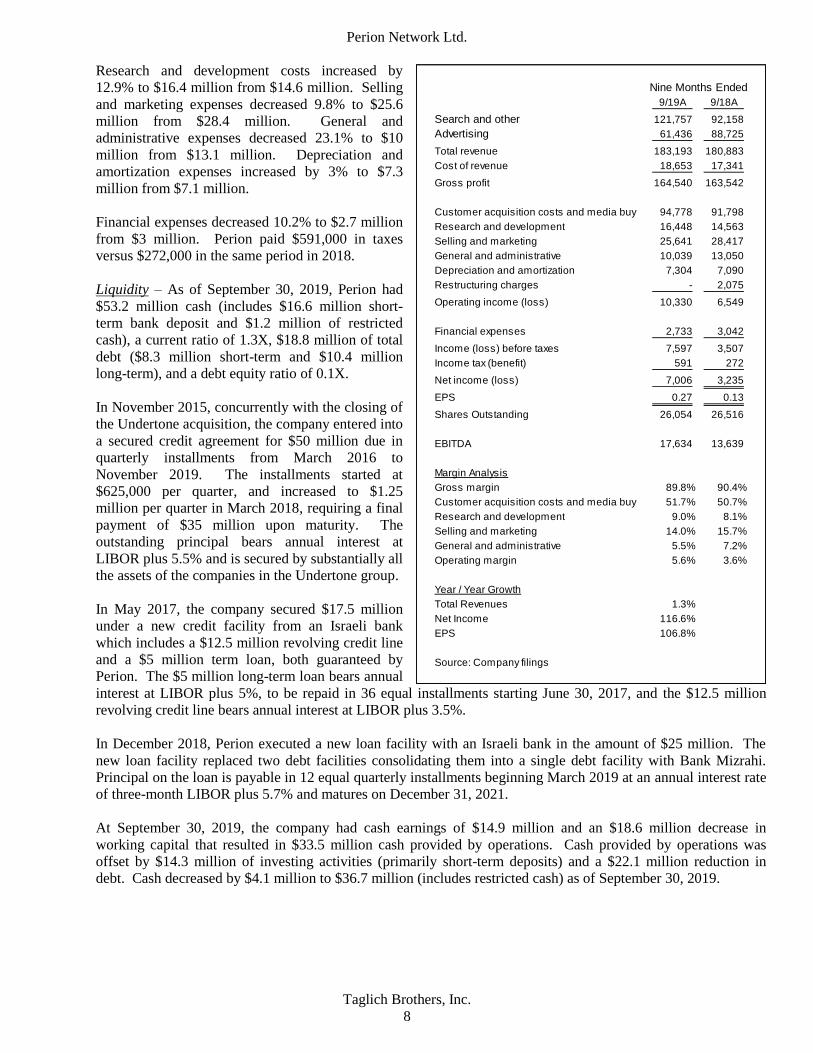
Nine-months 2019
Total revenues increased 1.3% to $183.2 million from $180.9 million and net income was $7 million or $0.27 per
share versus net income of $3.2 million or $0.13 per share in the year-ago period.
Advertising revenues decreased 30.8% to $61.4 million. Search and other revenues increased 32.1% to $121.8
million.
Gross profit increased less than 1% to $164.5 million while gross margins decreased to 89.8% from 90.4%.
Customer acquisition costs and media buy expenses increased 3.2% to $94.8 million from $91.8 million.
Perion Network Ltd.
Taglich Brothers, Inc.
8
9/19A 9/18A
Search and other 121,757 92,158
Advertising 61,436 88,725
Total revenue 183,193 180,883
Cost of revenue 18,653 17,341
Gross profit 164,540 163,542
Customer acquisition costs and media buy 94,778 91,798
Research and development 16,448 14,563
Selling and marketing 25,641 28,417
General and administrative 10,039 13,050
Depreciation and amortization 7,304 7,090
Restructuring charges - 2,075
Operating income (loss) 10,330 6,549
Financial expenses 2,733 3,042
Income (loss) before taxes 7,597 3,507
Income tax (benefit) 591 272
Net income (loss) 7,006 3,235
EPS 0.27 0.13
Shares Outstanding 26,054 26,516
EBITDA 17,634 13,639
Margin Analysis
Gross margin 89.8% 90.4%
Customer acquisition costs and media buy 51.7% 50.7%
Research and development 9.0% 8.1%
Selling and marketing 14.0% 15.7%
General and administrative 5.5% 7.2%
Operating margin 5.6% 3.6%
Year / Year Growth
Total Revenues 1.3%
Net Income 116.6%
EPS 106.8%
Source: Company filings
Nine Months Ended
Research and development costs increased by
12.9% to $16.4 million from $14.6 million. Selling
and marketing expenses decreased 9.8% to $25.6
million from $28.4 million. General and
administrative expenses decreased 23.1% to $10
million from $13.1 million. Depreciation and
amortization expenses increased by 3% to $7.3
million from $7.1 million.
Financial expenses decreased 10.2% to $2.7 million
from $3 million. Perion paid $591,000 in taxes
versus $272,000 in the same period in 2018.
Liquidity – As of September 30, 2019, Perion had
$53.2 million cash (includes $16.6 million short-
term bank deposit and $1.2 million of restricted
cash), a current ratio of 1.3X, $18.8 million of total
debt ($8.3 million short-term and $10.4 million
long-term), and a debt equity ratio of 0.1X.
In November 2015, concurrently with the closing of
the Undertone acquisition, the company entered into
a secured credit agreement for $50 million due in
quarterly installments from March 2016 to
November 2019. The installments started at
$625,000 per quarter, and increased to $1.25
million per quarter in March 2018, requiring a final
payment of $35 million upon maturity. The
outstanding principal bears annual interest at
LIBOR plus 5.5% and is secured by substantially all
the assets of the companies in the Undertone group.
In May 2017, the company secured $17.5 million
under a new credit facility from an Israeli bank
which includes a $12.5 million revolving credit line
and a $5 million term loan, both guaranteed by
Perion. The $5 million long-term loan bears annual
interest at LIBOR plus 5%, to be repaid in 36 equal installments starting June 30, 2017, and the $12.5 million
revolving credit line bears annual interest at LIBOR plus 3.5%.
In December 2018, Perion executed a new loan facility with an Israeli bank in the amount of $25 million. The
new loan facility replaced two debt facilities consolidating them into a single debt facility with Bank Mizrahi.
Principal on the loan is payable in 12 equal quarterly installments beginning March 2019 at an annual interest rate
of three-month LIBOR plus 5.7% and matures on December 31, 2021.
At September 30, 2019, the company had cash earnings of $14.9 million and an $18.6 million decrease in
working capital that resulted in $33.5 million cash provided by operations. Cash provided by operations was
offset by $14.3 million of investing activities (primarily short-term deposits) and a $22.1 million reduction in
debt. Cash decreased by $4.1 million to $36.7 million (includes restricted cash) as of September 30, 2019.
Perion Network Ltd.
Taglich Brothers, Inc.
9
Risks
In our view, these are the principal risks underlying the stock.
Lack of long-term contracts – Perion generally does not enter into long-term contracts with its advertising
customers, and such customers do business on a non-exclusive basis with no minimum spending guarantees.
Perion’s advertising customers may reduce or terminate their business relationship with the company at any time
which could have a material adverse effect on Perion’s business, results of operations, and financial condition.
Technological obsolescence – Google, as an advertising publisher, accounts for most US online search-generated
revenues while Microsoft and Yahoo account for substantially all of the rest. A small number of social network
companies, such as Facebook, account for a large portion of digital advertising budgets.
These companies, along with other large and established Internet and technology companies, may also leverage
their power to make changes to their Web browsers, operating systems, platforms, networks or other products or
services in a way that impacts the entire digital advertising marketplace. If Perion is unable to adjust to those
changes, the company’s revenues and performance could be adversely impacted.
Demand for digital advertising – A substantial portion of the company’s revenues is derived from the sale of
digital advertising solutions. If the demand for digital advertising does not continue to grow or customers do not
chose Perion’s solutions, it could restrain the company’s operations.
Competition - The advertising industry is highly competitive. There are a large number of digital media
companies and advertising technology companies that offer services similar to Perion’s that compete for finite
advertising budgets and for limited inventory from publishers. Some of the company’s competitors are better
established have significantly more financial, technical, sales and marketing resources than Perion. Given that the
barriers to entering the digital advertising market are relatively low, the number of competitors may increase. If
Perion cannot compete effectively in this market, its revenues are likely to decline.
Desktop computer search services - The market related to desktop computers has accounted for substantially all
of Perion’s search revenues. Recently, the number of individuals who access the Internet through devices other
than desktop computers, such as mobile phones, tablets, etc., has increased dramatically. If this trend towards
using the Internet on non-desktop devices accelerates, some of Perion’s services will become less relevant and
may fail to attract advertisers and Web traffic.
Exchange rates - A significant portion of Perion’s costs are incurred in new Israeli shekels (NIS). Exchange rate
fluctuations may have an adverse effect on the company’s earnings and asset base if it not able to effectively
hedge against currency exchange risks.
Regulatory changes – Perion’s business is conducted through the Internet and is subject to the laws and
regulations that apply to e-commerce and online businesses around the world. These laws and regulations are
becoming more prevalent in the US, Europe, Israel, Canada, and elsewhere and may impede the growth of the
Internet and consequently the company’s services.
Reliance on North American market – Perion’s revenues have been concentrated within the North American
market, accounting for approximately 78% of 2018 revenues. A significant reduction in the revenues generated in
North America could have a material adverse effect on the company’s results of operations.
Political, economic and military risks – Prion’s principal executive offices are located in Israel. Accordingly,
political, economic and military conditions in the Middle East may directly affect the company’s business.
Perion Network Ltd.
Taglich Brothers, Inc.
10
Liquidity risk - Shares of Perion have risks common to those of the microcap segment of the market. Often these
risks cause microcap stocks to trade at discounts to their peers. The most common of these risks is liquidity risk,
which is typically caused by small trading floats and very low trading volume and can lead to large spreads and
high volatility in stock price. There are 16.1 million shares in the float and the average daily volume is
approximately 379,000 shares.
Miscellaneous risk - The company's financial results and equity values are subject to other risks and uncertainties
including competition, operations, financial markets, regulatory risk, and/or other events. These risks may cause
actual results to differ from expected results.
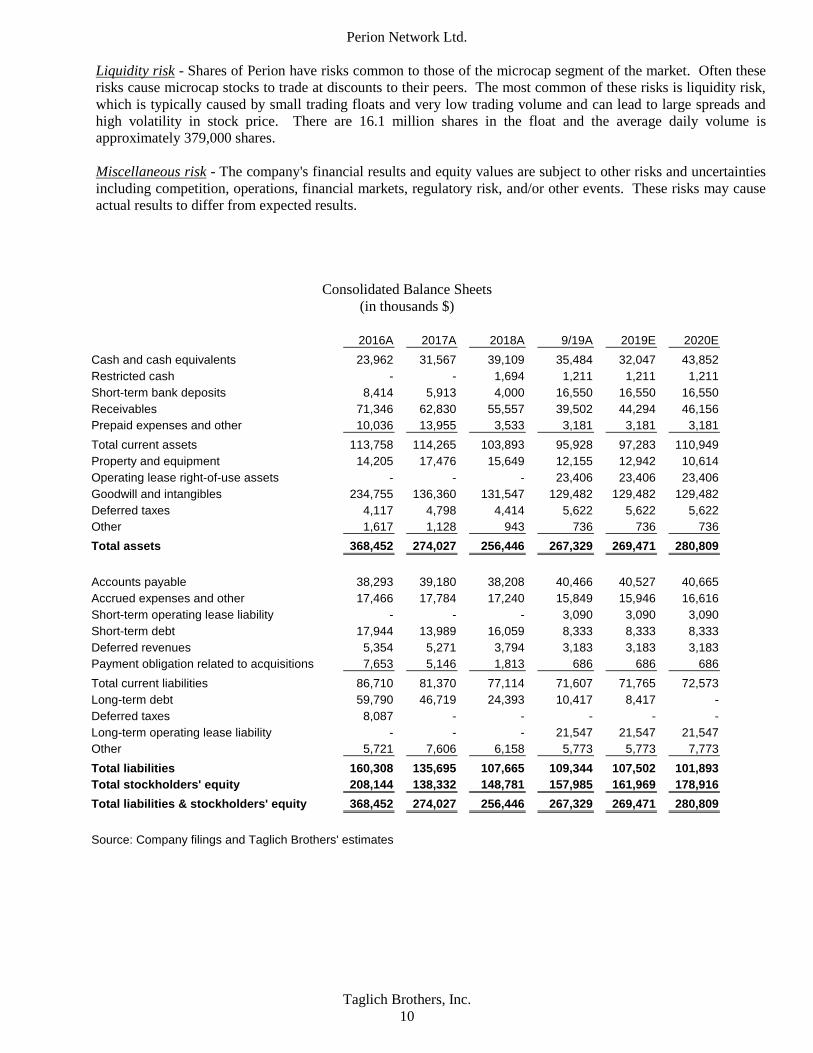
Consolidated Balance Sheets
(in thousands $)
2016A 2017A 2018A 9/19A 2019E 2020E
Cash and cash equivalents 23,962 31,567 39,109 35,484 32,047 43,852
Restricted cash - - 1,694 1,211 1,211 1,211
Short-term bank deposits 8,414 5,913 4,000 16,550 16,550 16,550
Receivables 71,346 62,830 55,557 39,502 44,294 46,156
Prepaid expenses and other 10,036 13,955 3,533 3,181 3,181 3,181
Total current assets 113,758 114,265 103,893 95,928 97,283 110,949
Property and equipment 14,205 17,476 15,649 12,155 12,942 10,614
Operating lease right-of-use assets - - - 23,406 23,406 23,406
Goodwill and intangibles 234,755 136,360 131,547 129,482 129,482 129,482
Deferred taxes 4,117 4,798 4,414 5,622 5,622 5,622
Other 1,617 1,128 943 736 736 736
Total assets 368,452 274,027 256,446 267,329 269,471 280,809
Accounts payable 38,293 39,180 38,208 40,466 40,527 40,665
Accrued expenses and other 17,466 17,784 17,240 15,849 15,946 16,616
Short-term operating lease liability - - - 3,090 3,090 3,090
Short-term debt 17,944 13,989 16,059 8,333 8,333 8,333
Deferred revenues 5,354 5,271 3,794 3,183 3,183 3,183
Payment obligation related to acquisitions 7,653 5,146 1,813 686 686 686
Total current liabilities 86,710 81,370 77,114 71,607 71,765 72,573
Long-term debt 59,790 46,719 24,393 10,417 8,417 -
Deferred taxes 8,087 - - - - -
Long-term operating lease liability - - - 21,547 21,547 21,547
Other 5,721 7,606 6,158 5,773 5,773 7,773
Total liabilities 160,308 135,695 107,665 109,344 107,502 101,893
Total stockholders' equity 208,144 138,332 148,781 157,985 161,969 178,916
Total liabilities & stockholders' equity 368,452 274,027 256,446 267,329 269,471 280,809
Source: Company filings and Taglich Brothers' estimates
Perion Network Ltd.
Taglich Brothers, Inc.
11
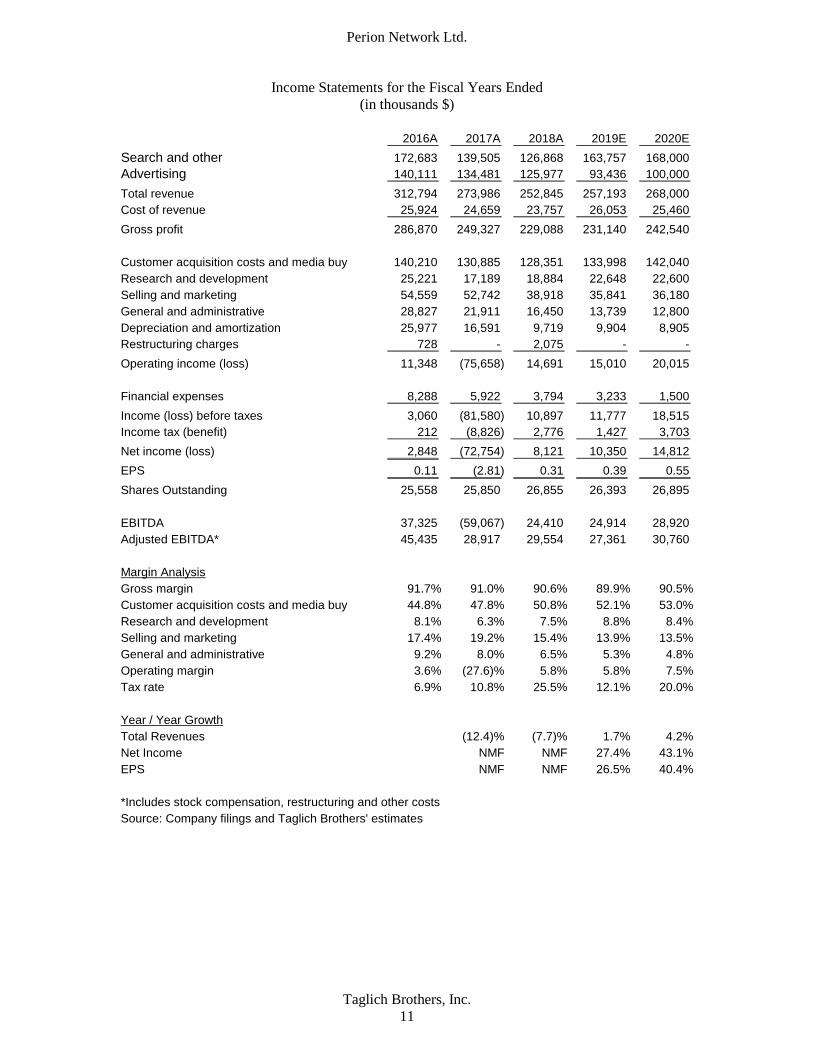
Income Statements for the Fiscal Years Ended
(in thousands $)
2016A 2017A 2018A 2019E 2020E
Search and other 172,683 139,505 126,868 163,757 168,000
Advertising 140,111 134,481 125,977 93,436 100,000
Total revenue 312,794 273,986 252,845 257,193 268,000
Cost of revenue 25,924 24,659 23,757 26,053 25,460
Gross profit 286,870 249,327 229,088 231,140 242,540
Customer acquisition costs and media buy 140,210 130,885 128,351 133,998 142,040
Research and development 25,221 17,189 18,884 22,648 22,600
Selling and marketing 54,559 52,742 38,918 35,841 36,180
General and administrative 28,827 21,911 16,450 13,739 12,800
Depreciation and amortization 25,977 16,591 9,719 9,904 8,905
Restructuring charges 728 - 2,075 - -
Operating income (loss) 11,348 (75,658) 14,691 15,010 20,015
Financial expenses 8,288 5,922 3,794 3,233 1,500
Income (loss) before taxes 3,060 (81,580) 10,897 11,777 18,515
Income tax (benefit) 212 (8,826) 2,776 1,427 3,703
Net income (loss) 2,848 (72,754) 8,121 10,350 14,812
EPS 0.11 (2.81) 0.31 0.39 0.55
Shares Outstanding 25,558 25,850 26,855 26,393 26,895
EBITDA 37,325 (59,067) 24,410 24,914 28,920
Adjusted EBITDA* 45,435 28,917 29,554 27,361 30,760
Margin Analysis
Gross margin 91.7% 91.0% 90.6% 89.9% 90.5%
Customer acquisition costs and media buy 44.8% 47.8% 50.8% 52.1% 53.0%
Research and development 8.1% 6.3% 7.5% 8.8% 8.4%
Selling and marketing 17.4% 19.2% 15.4% 13.9% 13.5%
General and administrative 9.2% 8.0% 6.5% 5.3% 4.8%
Operating margin 3.6% (27.6)% 5.8% 5.8% 7.5%
Tax rate 6.9% 10.8% 25.5% 12.1% 20.0%
Year / Year Growth
Total Revenues (12.4)% (7.7)% 1.7% 4.2%
Net Income NMF NMF 27.4% 43.1%
EPS NMF NMF 26.5% 40.4%
*Includes stock compensation, restructuring and other costs
Source: Company filings and Taglich Brothers' estimates
Perion Network Ltd.
Taglich Brothers, Inc.
12
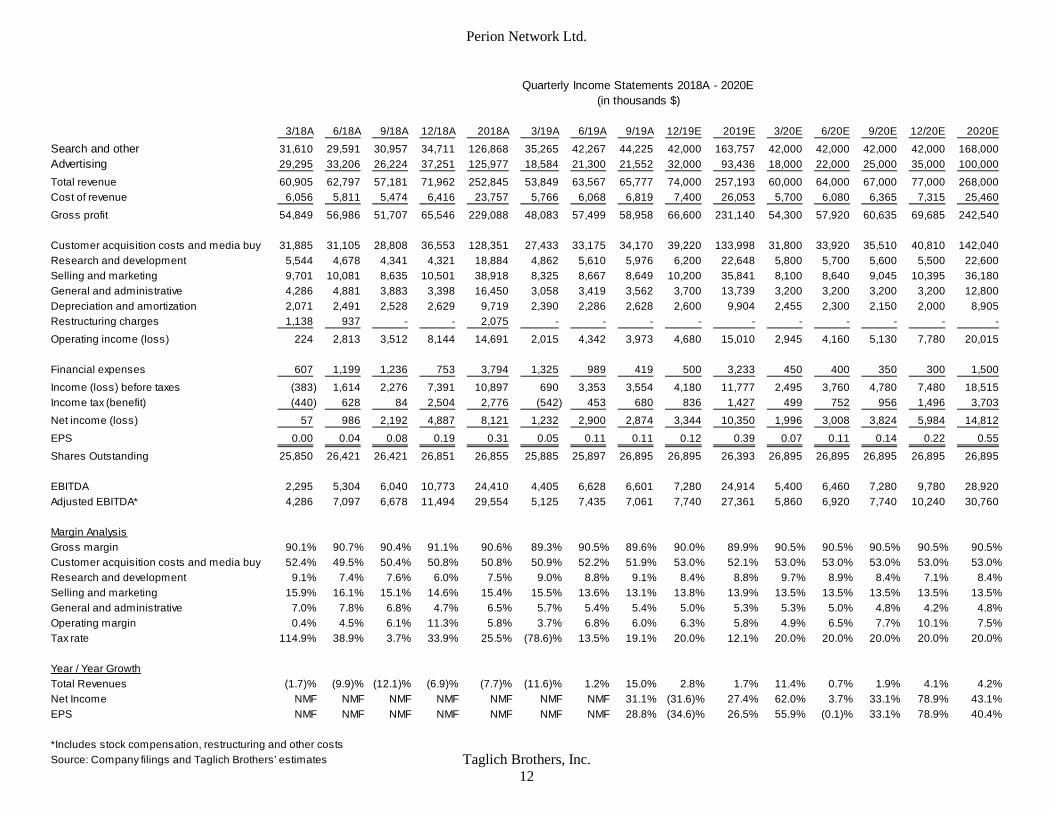
3/18A 6/18A 9/18A 12/18A 2018A 3/19A 6/19A 9/19A 12/19E 2019E 3/20E 6/20E 9/20E 12/20E 2020E
Search and other 31,610 29,591 30,957 34,711 126,868 35,265 42,267 44,225 42,000 163,757 42,000 42,000 42,000 42,000 168,000
Advertising 29,295 33,206 26,224 37,251 125,977 18,584 21,300 21,552 32,000 93,436 18,000 22,000 25,000 35,000 100,000
Total revenue 60,905 62,797 57,181 71,962 252,845 53,849 63,567 65,777 74,000 257,193 60,000 64,000 67,000 77,000 268,000
Cost of revenue 6,056 5,811 5,474 6,416 23,757 5,766 6,068 6,819 7,400 26,053 5,700 6,080 6,365 7,315 25,460
Gross profit 54,849 56,986 51,707 65,546 229,088 48,083 57,499 58,958 66,600 231,140 54,300 57,920 60,635 69,685 242,540
Customer acquisition costs and media buy 31,885 31,105 28,808 36,553 128,351 27,433 33,175 34,170 39,220 133,998 31,800 33,920 35,510 40,810 142,040
Research and development 5,544 4,678 4,341 4,321 18,884 4,862 5,610 5,976 6,200 22,648 5,800 5,700 5,600 5,500 22,600
Selling and marketing 9,701 10,081 8,635 10,501 38,918 8,325 8,667 8,649 10,200 35,841 8,100 8,640 9,045 10,395 36,180
General and administrative 4,286 4,881 3,883 3,398 16,450 3,058 3,419 3,562 3,700 13,739 3,200 3,200 3,200 3,200 12,800
Depreciation and amortization 2,071 2,491 2,528 2,629 9,719 2,390 2,286 2,628 2,600 9,904 2,455 2,300 2,150 2,000 8,905
Restructuring charges 1,138 937 - - 2,075 - - - - - - - - - -
Operating income (loss) 224 2,813 3,512 8,144 14,691 2,015 4,342 3,973 4,680 15,010 2,945 4,160 5,130 7,780 20,015
Financial expenses 607 1,199 1,236 753 3,794 1,325 989 419 500 3,233 450 400 350 300 1,500
Income (loss) before taxes (383) 1,614 2,276 7,391 10,897 690 3,353 3,554 4,180 11,777 2,495 3,760 4,780 7,480 18,515
Income tax (benefit) (440) 628 84 2,504 2,776 (542) 453 680 836 1,427 499 752 956 1,496 3,703
Net income (loss) 57 986 2,192 4,887 8,121 1,232 2,900 2,874 3,344 10,350 1,996 3,008 3,824 5,984 14,812
EPS 0.00 0.04 0.08 0.19 0.31 0.05 0.11 0.11 0.12 0.39 0.07 0.11 0.14 0.22 0.55
Shares Outstanding 25,850 26,421 26,421 26,851 26,855 25,885 25,897 26,895 26,895 26,393 26,895 26,895 26,895 26,895 26,895
EBITDA 2,295 5,304 6,040 10,773 24,410 4,405 6,628 6,601 7,280 24,914 5,400 6,460 7,280 9,780 28,920
Adjusted EBITDA* 4,286 7,097 6,678 11,494 29,554 5,125 7,435 7,061 7,740 27,361 5,860 6,920 7,740 10,240 30,760
Margin Analysis
Gross margin 90.1% 90.7% 90.4% 91.1% 90.6% 89.3% 90.5% 89.6% 90.0% 89.9% 90.5% 90.5% 90.5% 90.5% 90.5%
Customer acquisition costs and media buy 52.4% 49.5% 50.4% 50.8% 50.8% 50.9% 52.2% 51.9% 53.0% 52.1% 53.0% 53.0% 53.0% 53.0% 53.0%
Research and development 9.1% 7.4% 7.6% 6.0% 7.5% 9.0% 8.8% 9.1% 8.4% 8.8% 9.7% 8.9% 8.4% 7.1% 8.4%
Selling and marketing 15.9% 16.1% 15.1% 14.6% 15.4% 15.5% 13.6% 13.1% 13.8% 13.9% 13.5% 13.5% 13.5% 13.5% 13.5%
General and administrative 7.0% 7.8% 6.8% 4.7% 6.5% 5.7% 5.4% 5.4% 5.0% 5.3% 5.3% 5.0% 4.8% 4.2% 4.8%
Operating margin 0.4% 4.5% 6.1% 11.3% 5.8% 3.7% 6.8% 6.0% 6.3% 5.8% 4.9% 6.5% 7.7% 10.1% 7.5%
Tax rate 114.9% 38.9% 3.7% 33.9% 25.5% (78.6)% 13.5% 19.1% 20.0% 12.1% 20.0% 20.0% 20.0% 20.0% 20.0%
Year / Year Growth
Total Revenues (1.7)% (9.9)% (12.1)% (6.9)% (7.7)% (11.6)% 1.2% 15.0% 2.8% 1.7% 11.4% 0.7% 1.9% 4.1% 4.2%
Net Income NMF NMF NMF NMF NMF NMF NMF 31.1% (31.6)% 27.4% 62.0% 3.7% 33.1% 78.9% 43.1%
EPS NMF NMF NMF NMF NMF NMF NMF 28.8% (34.6)% 26.5% 55.9% (0.1)% 33.1% 78.9% 40.4%
*Includes stock compensation, restructuring and other costs
Source: Company filings and Taglich Brothers' estimates
Quarterly Income Statements 2018A - 2020E
(in thousands $)
Perion Network Ltd.
Taglich Brothers, Inc.
13
Statement of Cash Flows for the Periods Ended
(in thousands $)
2016A 2017A 2018A 9M19A 2019E 2020E
Net income (loss) 2,848 (72,754) 8,121 7,006 10,350 14,812
Depreciation & amortization 25,977 16,591 9,719 7,304 9,904 8,905
Impairment - 85,667 - - - -
Restructuring costs 254 - 462 - - -
Stock-based compensation 6,844 2,112 2,718 1,601 2,135 2,135
Foreign currency translation 980 83 3 (109) (109) -
Accretion of payment obligation related to acquisition 320 43 - - - -
Accrued interest 406 475 1,005 (203) (203)
Deferred taxes (3,268) (8,877) 335 (1,223) (1,223) -
Accrued severance pay 214 801 (783) (39) (39) -
Change in payment obligation related to acquisitions 983 - - - - -
Fair value revaluation - convertible debt 1,350 3,785 (1,585) 600 600 -
Loss from sale of property and equipment 149 - - - - -
Cash earnings (loss) 37,057 27,926 19,995 14,937 21,415 25,852
Changes in assets and liabilities
Receivables (5,333) 8,888 7,423 16,055 11,263 (1,861)
Prepaid expenses and other 8,613 (3,241) 9,451 352 352 -
Accounts payable (1,702) 1,106 (1,066) 2,258 2,319 138
Accrued expenses and other (2,486) 1,429 (1,524) (746) (1,427) (294)
Deferred revenue (2,365) (95) (1,478) (611) (611) -
(Increase) decrease in working capital (3,273) 8,087 12,806 18,600 11,896 (2,017)
Net cash provided by (used in) operations 33,784 36,013 32,801 33,537 33,311 23,835
Purchase of property and equipment (1,504) (1,606) (2,038) (589) (1,800) (1,800)
Proceeds from sale of property and equipment 151 10 59 - - -
Capitalization of development costs (4,591) (5,756) (1,756) - - -
Change in restricted cash 647 - - - - -
Cash paid for acquisitions - - - (1,200) (1,200)
Short-term deposits 34,028 2,501 1,913 (12,550) (12,550) -
Net cash provided by (used in) investing 28,731 (4,851) (1,822) (14,339) (15,550) (1,800)
Exercise of options and restricted shares 2 1 - 703 703 -
Payments made in connection with acquisition (29,537) (2,551) (3,333) (1,813) (1,813) (1,813)
Proceeds from debt 40,000 5,000 25,000 - - -
Repayment of debt (63,072) (26,290) (44,676) (22,099) (24,099) (8,417)
Net cash provided by (used in) financing (52,607) (23,840) (23,009) (23,209) (25,209) (10,230)
Effect of currency exchange rates (136) 283 78 (97) (97) -
Effect from discontinued operations on cash (3,329) - - - - -
Net change in cash 6,443 7,605 8,048 (4,108) (7,545) 11,805
Cash - beginning of period 17,519 23,962 32,755 40,803 40,803 33,258
Cash - end of period 23,962 31,567 40,803 36,695 33,258 45,063
Source: Company filings and Taglich Brothers' estimates
Perion Network Ltd.
Taglich Brothers, Inc.
14
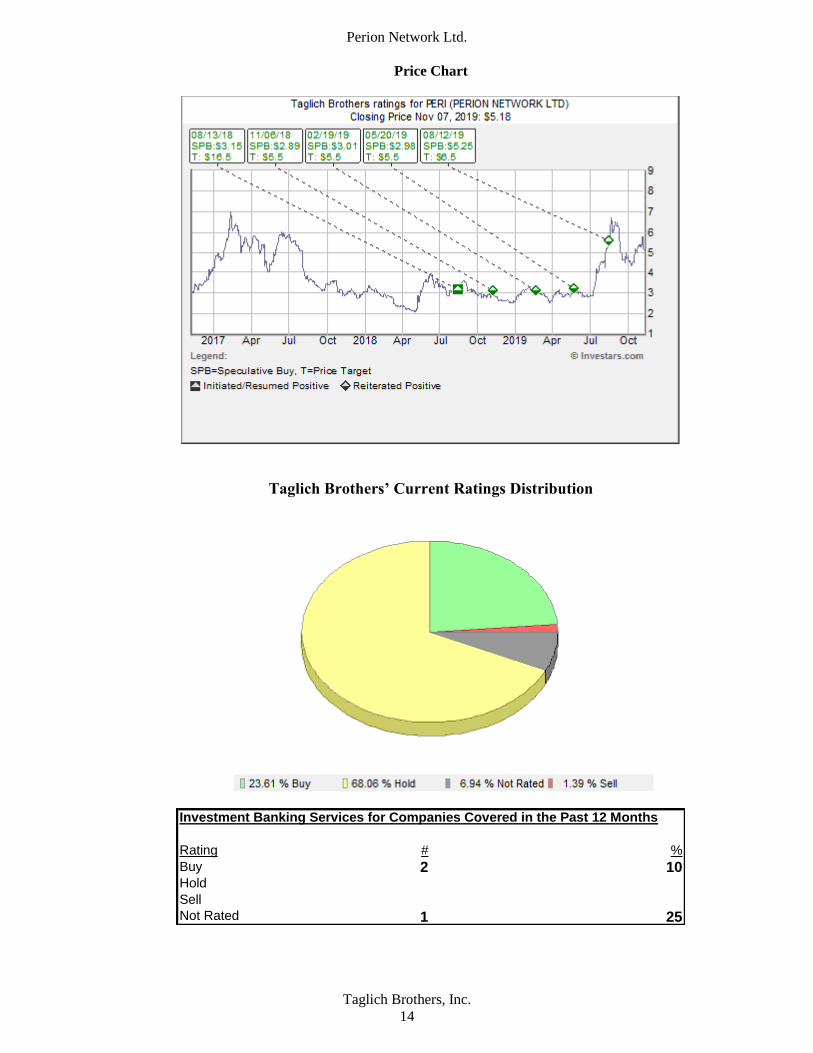
Price Chart
Taglich Brothers’ Current Ratings Distribution
Investment Banking Services for Companies Covered in the Past 12 Months
Rating # %
Buy 2 10Hold
Sell
Not Rated 1 25
Perion Network Ltd.
Taglich Brothers, Inc.
15
Important Disclosures
As of the date of this report, we, our affiliates, any officer, director or stockholder, or any member of
their families do not have a position in the stock of the company mentioned in this report. Taglich
Brothers, Inc. does not currently have an Investment Banking relationship with the company mentioned
in this report and was not a manager or co-manager of any offering for the company within the last three
years.
All research issued by Taglich Brothers, Inc. is based on public information. The company paid a
monetary fee of $6,000 (USD) in July 2018 for the creation and dissemination of research reports for the
first three months. After the first three months from initial publication, the company pays a monthly
monetary fee of $2,000 (USD) to Taglich Brothers, Inc., for a minimum of six months for the creation
and dissemination of research reports.
General Disclosures
The information and statistical data contained herein have been obtained from sources, which we believe
to be reliable but in no way are warranted by us as to accuracy or completeness. We do not undertake to
advise you as to changes in figures or our views. This is not a solicitation of any order to buy or sell.
Taglich Brothers, Inc. is fully disclosed with its clearing firm, Pershing, LLC, is not a market maker and
does not sell to or buy from customers on a principal basis. The above statement is the opinion of
Taglich Brothers, Inc. and is not a guarantee that the target price for the stock will be met or that
predicted business results for the company will occur. There may be instances when fundamental,
technical and quantitative opinions contained in this report are not in concert. We, our affiliates, any
officer, director or stockholder or any member of their families may from time to time purchase or sell
any of the above-mentioned or related securities. Analysts and members of the Research Department are
prohibited from buying or selling securities issued by the companies that Taglich Brothers, Inc. has a
research relationship with, except if ownership of such securities was prior to the start of such
relationship, then an Analyst or member of the Research Department may sell such securities after
obtaining expressed written permission from Compliance.
Analyst Certification
I, John Nobile, the research analyst of this report, hereby certify that the views expressed in this report
accurately reflect my personal views about the subject securities and issuers; and that no part of my
compensation was, is, or will be, directly, or indirectly, related to the specific recommendations or views
contained in this report.
Public companies mentioned in this report:
Allot Communications (NASDAQ: ALLT)
Facebook (NASDAQ: FB)
Google (NASDAQ: GOOG)
Microsoft (NASDAQ: MSFT)
Stratasys (NASDAQ: SSYS)
Twitter (NYSE: TWTR)
Yahoo (NASDAQ: ABAA)
Perion Network Ltd.
Taglich Brothers, Inc.
16
Meaning of Ratings
Buy – The growth prospects, degree of investment risk, and valuation make the stock attractive relative to the
general market or comparable stocks.
Speculative Buy – Long term prospects of the company are promising but investment risk is significantly higher
than it is in our BUY-rated stocks. Risk-reward considerations justify purchase mainly by high risk-tolerant
accounts. In the short run, the stock may be subject to high volatility and could continue to trade at a discount to
its market.
Neutral – Based on our outlook the stock is adequately valued. If investment risks are within acceptable
parameters, this equity could remain a holding if already owned.
Sell – Based on our outlook the stock is significantly overvalued. A weak company or sector outlook and a high
degree of investment risk make it likely that the stock will underperform relative to the general market.
Dropping Coverage – Research coverage discontinued due to the acquisition of the company, termination of
research services, non-payment for such services, diminished investor interest, or departure of the analyst.
Some notable Risks within the Microcap Market
Stocks in the Microcap segment of the market have many risks that are not as prevalent in Large-cap, Blue
Chips or even Small-cap stocks. Often it is these risks that cause Microcap stocks to trade at discounts to
their peers. The most common of these risks is liquidity risk, which is typically caused by small trading
floats and very low trading volume which can lead to large spreads and high volatility in stock price. In
addition, Microcaps tend to have significant company specific risks that contribute to lower valuations.
Investors need to be aware of the higher probability of financial default and higher degree of financial
distress inherent in the microcap segment of the market.
From time to time our analysts may choose to withhold or suspend a rating on a company. We continue to publish
informational reports on such companies; however, they have no ratings or price targets. In general, we will not
rate any company that has too much business or financial uncertainty for our analysts to form an investment
conclusion, or that is currently in the process of being acquired.