Embed Size (px)
Citation preview
Gender and political participation
Gender andpolitical participation
The Electoral CommissionTrevelyan HouseGreat Peter StreetLondon SW1P 2HW
Tel 020 7271 0500Fax 020 7271 0505info@electoralcommission.org.ukwww.electoralcommission.org.uk
We are an independent body that wasset up by the UK Parliament. We aim togain public confidence and encourage people to take part in the democraticprocess within the UK by modernisingthe electoral process, promoting publicawareness of electoral matters, andregulating political parties.
© The Electoral Commission 2004ISBN: 1-904363-41-5
4121/RP
/04.04
Research report, April 2004
Contents
4 Explaining the activism gap 33Potential explanations 33Analysis of the evidence 34Structural resources 36Cultural attitudes 41Mobilising agencies 44Institutional context 47
5 Case studies 53Political parties 53Trade union and other organisations 56
6 Implications 61Summary 61Implications 62Research priorities 65
Notes 67
Appendix 1: Data sources, measures and scales 75
European Social Survey 2002 75The Electoral Commission surveys 75British Election Study 1964-2001 75Notes 77
Appendix 2: Tables 79
1
Preface 3Terms of reference 5
Research steering committee 5Acknowledgements 6
Executive summary 7
1 The activism gap 11Literature review 11Social trends and women and men’s political participation 12Contemporary patterns of political participation among men and women 12Does the activism gap matter? 13
2 Defining and measuring political participation 15Defining types of participation 15Voting turnout 17Campaign-oriented participation 17Cause-oriented participation 18Civic-oriented participation 18Measuring the activism gap 19
3 The extent of the activism gap in the UK 21Main findings 21Comparative benchmark evidence 23An audit of political engagement 25The British Election Study 2001 27Trends in general election turnout 1964-2001 27Turnout in regional and local elections 30Young people’s participation 31
Preface
This report presents the findings of a research study, funded by The Electoral Commission, looking at the extent and nature of men and women’s political participation in the UK and examining theexistence of any political activism‘gap’ by gender.
This research was conducted by Pippa Norris of Harvard University, and by JoniLovenduski and Rosie Campbell of BirkbeckCollege, University of London. It should benoted that the conclusions and suggestionscontained within are those of the authors and not of The Electoral Commission.
This is the third Electoral Commission researchreport of its kind. In 2002 the Commissionpublished Voter Engagement Among YoungPeople and Voter Engagement Among Blackand Minority Ethnic Communities. Like theseprevious reports this research has beendesigned to inform campaigns and initiatives, by the Commission and other stakeholders,aimed at increasing political participation.
Whereas most UK studies have focused primarily on comparing men and women’spolitical interest and awareness, this researchconsiders the extent and nature of theirparticipation in politics. As well as providing areview of literature on this subject, it alsopresents the findings of recent survey datarelating to gender and political participation.
Topics covered in this report include men and women’s propensity to vote in local andnational elections, to contact a politician andjoin a political party; as well as their propensity to participate in cause-orientated activities suchas demonstrating or signing a petition, andcivic-orientated activities such as joining avoluntary association.
Gender and political participation: preface
3

The Electoral Commission would like to thank the authors of this report and also the Fawcett Society and the Equal OpportunitiesCommission for their advice and supportthroughout this project.
I hope this research, and the suggestions and research priorities outlined in this report,will stimulate discussion and facilitate initiatives to encourage greater political participationamong both women and men in the UK.
Joan Jones
Deputy Commissioner, The Electoral CommissionApril 2004
Gender and political participation: preface
4

Terms of reference
The Electoral Commission retainedacademics from Harvard Universityand Birkbeck College, University of London, to undertake a reviewof existing research and an analysis of survey data on gender andpolitical participation in the UK.
The research team comprised of Pippa Norris (theMcGuire Lecturer in Comparative Politics at theJohn F. Kennedy School of Government, HarvardUniversity), Joni Lovenduski (Professor of Politicsat Birkbeck College, University of London) andRosie Campbell (Lecturer in Research Methodsat Birkbeck College, University of London).
The project had three key aims:
1. To provide a literature review of research ongender and political participation.
2. To analyse and interpret evidence relating togender and political participation, includingrecent surveys conducted on behalf of The Electoral Commission.
3.To identify key priorities and makerecommendations to inform the ongoingresearch and public awareness programmesof The Electoral Commission and the policiesof other organisations.
Research steering committeeThe project was supervised by a steeringcommittee convened by The ElectoralCommission. This included:
• Joan Jones, Deputy Commissioner, The Electoral Commission;
• Ben Marshall, Research Manager, The Electoral Commission;
• Laura Richards, Research Officer, The Electoral Commission;
• Beccy Earnshaw, Outreach Manager, The Electoral Commission;
• Laura Turquet, Policy Officer, Fawcett Society;• Sam Smethers, Parliamentary and Public Affairs
Manager, Equal Opportunities Commission.
Gender and political participation: terms of reference
5

AcknowledgementsThe research team would like to thank the following for their assistance with thecompletion of this report: Claudie Baudino,Marila Guadagnini, Rainbow Murray, JantineOldersma, Janine Parry, Mariette Sineau, Patrick Seyd, Marion Sawer, David Marsh, Trish Morris at Conservative Central Office,Peter Smith at LGA, Francesca Marlow atLiberal Democrats GBTF, Diane Holland at TGWU, Debbie Enever at Women LiberalDemocrats and Alex Borthwick at GoodHousekeeping Magazine.
Gender and political participation: terms of reference
6
Executive summary
This study, conducted on behalf ofthe Commission by academics atHarvard University and BirkbeckCollege, University of London, looksat the extent and nature of men andwomen’s political participation. Inaddition, it examines the existenceof any political activism gap bygender in the UK today.
The activism gapThe level of men and women’s activism in the UK differs according to the type of politicalactivity. There is no gender gap in voter turnout at national, regional or local elections andwomen are more likely to be involved in cause-orientated activities such as signing a petition or boycotting products for ethical reasons.Nevertheless, women are significantly less likelythan men to participate in campaign-orientatedactivities, such as contacting a politician anddonating money to, working for, or being amember of, a political party. Women are also lesslikely than men to join voluntary organisations.
Overall, a statistically significant activism gap by gender exists in the UK. Comparison with the activism gap in other countries alsoshows that if European countries are ranked,the UK is located within the top third. Thissuggests that although some progress hasbeen made in the UK, there remains furtherscope for eliminating disparities.
TurnoutBefore 1979 fewer women than men voted inmost UK elections. Since then the voting gap at general, regional and local elections haslessened and may have reversed. Forexample, in 1997 an estimated 80.1% of women voted compared with around 76.9% of men. However, the gap between men andwomen’s turnout at the 2001 general election was not statistically significant.
In regional and local elections the traditionalvoting gap may also have lessened andpossibly reversed. For example in the May
Gender and political participation: executive summary
7

2003 contests for the Scottish Parliament, 57%of women reported voting compared to 56% of men.
Despite this reduction in the overall voting gapbetween men and women, reported turnout atthe 2001 general election suggests that womenfrom ethnic minorities were significantly lesslikely to vote than their male counterparts. Also,while at the 1997 general election there was nosignificant voting gap between men and womenamong Asian populations, turnout among blackwomen was a significant 8% less than amongblack men.
Pilot schemes so far also suggest that men and women’s propensity to turn out is affected in different ways by the introduction of newmethods of voting. In areas piloting all-postalvoting in May 2003, reported turnout amongwomen was 13% higher than among men(compared to 8% overall), whereas in thoseareas piloting electronic voting it was 5% lessthan men. In areas where both methods werepiloted, women’s reported turnout was 24%higher than men’s.
Other forms of political participationWomen are equally or more likely to participate in cause-oriented activities such as signingpetitions and boycotting or buying products for political or ethical reasons. Yet in relation to other activities, such as participating in ademonstration or protesting illegally, no genderdifferences are evident.
In campaign politics, however, men aresignificantly more active than women.
This gender gap is not large in size but it is bothstatistically significant and consistent across all activities such as party membership, party donations, party work, and contactingpoliticians. Men are also generally more likely tobe involved in forms of civic-orientated activity,such as belonging to a voluntary associationand being a member of a hobby, consumer orprofessional group, as well as a sports or socialclub. The only exception among voluntaryassociations concerns church groups, whichhave more women members due to long-standing patterns of greater female religiosity.
Explaining the activism gapAccess to social and economic resourcesimpacts upon levels and types of politicalparticipation. In general, those in paidemployment are more likely to be politically active, although the direct effect of the totalhours worked per week (including overtime) is unrelated to levels of political participation.
The activism gap is smaller among better offhouseholds and those who have attendeduniversity, and larger among those with thelowest levels of educational qualifications. Marital status is also a predictor of activism, with married men significantly more likely toparticipate than married women. Also, the gap issignificant among those with children, but closesamong those without children living at home.
Age and ethnicity also have different effects onmen and women’s levels of activism. Propensityto be politically active varies across the life cycle,however men are consistently more active thanwomen across all age groups. Also, while there
Gender and political participation: executive summary
8

is no significant difference in the participationrates of those men belonging to ethnic minoritiesand those not, women from ethnic minoritiesproved less active than other women.
The attitudes that draw people into publicaffairs have a significant impact on men andwomen’s political participation. For example,women have a weaker sense of political efficacy than men; they have lower confidencethat they can influence the political processthrough their own actions. Women also expressless interest in politics than men, are less likelyto regard politics as important and less likelyto trust a range of political institutions.
Mobilising organisations also play a key role in encouraging people to participate in publicaffairs. Women in the UK are less likely thanmen to be a member of many kinds ofassociations. This may also influence patternsof men and women’s participation moregenerally, for example, in the case ofassociations that engage in campaign activitiessuch as trade unions that provide volunteersand activists to help in election canvassing.
Lastly institutional factors, such as the presence of women in representative institutions, and byextension the candidate recruitment processes,also have an important effect on women’spolitical activism. For example, in 2001 in seatswhere a woman MP was elected to Parliament,women’s turnout was 4% higher than men’s, amodest but statistically significantly difference.Similarly, women were far less interested in the election campaign, and less likely to say theywould volunteer to work for a candidate or party,in seats where a male MP was elected.
Also, when people were asked whether they agreed or disagreed with the statement‘Government benefits people like me’, inconstituencies represented by a female MP,women were far more likely than men to concurwith this statement (49% compared to 38%).Alternatively, where a man represented the seat,this gap reversed and men were far more likelythan women to agree (45% compared to 38%).
ImplicationsThe persistence of a significant gender gap in political participation poses a problem for government, parties and other mobilisingagencies in the UK today. This report considers a number of case studies providing details ofstrategies and initiatives which could contributeto closing the gender activism gap, as well as raising levels of political participation more generally.
It is suggested that more women representativesmay encourage participation among womenmore generally. Therefore, strategies toincrease the number of women being selectedand standing for election may be necessary to address this issue. Successful measuresadopted by some political parties have includedequal opportunity strategies and positive action.
In the UK and elsewhere, initiatives have alsobeen taken to encourage women as activistsand as members of political parties and otherorganisations. Successful examples of suchstrategies include: training, internships, mentoring,monitoring, women-targeted membershipdrives and the use of financial incentives toencourage organisational innovation.
Gender and political participation: executive summary
9
Measures taken by political parties to modernisethe culture and practices of their organisationsmay also assist the inclusion of women asmembers and activists. Women may bediscouraged from becoming involved withpolitical organisations because of the perceived‘male-dominated’ nature of politics. Women’ssupport networks, groups and offices mayhelp overcome this barrier. Attention could also be paid to the timing and location ofmeetings and the provision of childcare.
As the evidence suggests that women are more interested in local rather than nationalpolitics, government, parties and othermobilising agencies could use local campaignsto motive women to become more politicallyinvolved generally. Also, the use of innovativecommunication formats could also be effective.
Making voting more accessible – for examplethrough the expansion of all-postal voting, theprovision of more conveniently located pollingstations, such as those in shopping malls andhomes for the elderly, and the simplification of the registration process – could also facilitategreater levels of participation, particularlyamong women.
Further researchThis report highlights various priorities for futureresearch including:
• Further explanation of the link betweenwomen in office and women’s mobilisationas citizens, for example through surveys andfocus groups monitoring public perceptions of elected representatives.
• Survey research with sample sizes largeenough to permit analysis of racial, ethnicand youth sub-groups.
• Further research into political participation at intermediate levels, for example withinvoluntary associations, parties and non-government organisations.
Gender and political participation: executive summary
10
1 The activism gap
The received wisdom suggests thatwomen are generally less politicallyactive than men. However, changingsocial trends, including the breakingdown of traditional sex roles and theexpansion of equal opportunities ineducation and the work place, havemeant that men and women’s liveshave been transforming during recent decades. In light of thesechanges, it is important to re-examine the evidence forpatterns of men and women’sparticipation in the UK today.
Literature review1.1 A series of seminal studies of politicalparticipation have reported that women havebeen less politically engaged than men in manyestablished democracies. The earliest studies ofelectoral behaviour in Western Europe and NorthAmerica, conducted during the 1920s and 1930sshortly after the female franchise was granted inmany countries, commonly observed that menwere more likely to vote than women.1
1.2 Two decades later, a UNESCO reportpublished in 1955 by the French politicalscientist Maurice Duverger, demonstrated that gender was one of the standard factorspredicting levels of electoral turnout and party membership in Western Europe.2
1.3 During the 1960s and early 1970s, the classicsurvey by Verba, Nie and Kim compared votingturnout, party membership, contact activity andcommunity organising, all ‘conventional’ forms ofpolitical participation, in seven nations includingBritain. The study concluded: ‘In all societies forwhich we have data, sex is related to politicalactivity; men are more active than women’.3
The activism gap persisted, even after controlling for differences between women and men intheir education, trade union membership andpsychological involvement in politics.
1.4 During the early 1970s, Barnes and Kaaseexpanded the scope of activity in their study of ‘protest politics’, comparing eight post-industrial nations (including Britain). They established that women were usually less engaged in demonstrations, occupationsand illegal strikes than men.4
Gender and political participation: the activism gap
11

1.5 In the mid-1980s, trends were updated byan extensive survey of political participation inBritain, conducted by Parry, Moyser and Day.They confirmed that gender differences invoting participation had become insignificant by this decade, yet men continued to provemore engaged in contacting public officials, collective action and direct action.5
Social trends and women and men’s political participation1.6 Despite the accumulated weight of evidencefrom previous studies, it is important to re-examine the evidence for patterns of politicalparticipation in the UK today.
1.7 We might expect the public sphere to reflect important social trends that have beentransforming women and men’s lives duringrecent decades. This includes changes intraditional sex roles in the home and family, the expansion of equal opportunities forwomen in higher education and the paidworkforce, and rising numbers of womenentering the professions and management.Expanding opportunities for self-expressionand financial autonomy mean that women are less restricted to attaining status andfulfilment solely through the traditional route of family, marriage and children.
1.8 Cultural attitudes towards women have also shifted radically since the mid-twentiethcentury, with a rising tide of support for genderequality found in most post-industrial societies.6
Changing attitudes have brought wideracceptance of sex role equality in the home, workforce and public sphere.
1.9 A series of landmark legal reforms havebeen designed to achieve equal opportunitiesand women’s rights. During the last decade,women have also made dramatic gains inelected and appointed office in the UK, notably in the House of Commons and in ministerialoffice, as well as in the National Assembly for Wales, the Scottish Parliament and theEuropean Parliament.7
Contemporary patterns of politicalparticipation among women and men1.10 In the light of these developments, the keyquestion for this research is how far social andcultural developments have altered traditionalpatterns of men and women’s participation inthe UK.
1.11 Comparative evidence has shown that thetraditional voting gap has often diminished, oreven reversed, in other established democracies,with women now regularly casting ballots insignificantly higher proportions than men.8 In theUnited States, for example, in every presidentialelection since 1980, turnout among women hasbeen higher than among men, and the samephenomenon is found in non-presidential mid-term elections since 1986.9
1.12 What is less clearly established from thecontemporary literature is whether the traditionalactivism gap persists today in the UK, whether it has now disappeared, or whether it may evenhave reversed. Although there are many studiespublished in the United States and elsewhere,10
the evidence derived from recent studies of the UK remains scattered and inconclusive.
Gender and political participation: the activism gap
12
Most of these studies have focused primarily on comparing women and men’s attitudes, such as in their political interest, their politicalawareness or their attention to media campaigns,rather than their behaviour or activism per se.11
1.13 The most detailed study of British politicalactivism in recent years, the Citizen Audit, was conducted by Pattie, Seyd and Whiteley.12
The study compared three main types ofactivism, using a typology distinguishingamong ‘individual’ acts, ‘contact’ acts and‘collective’ acts, as well as summarising allforms of political participation.13
1.14 This study reports that gender is notsignificantly related to the overall summary of the total number of political actions taken by citizens. Women, however, were found to be slightly more engaged in individual acts(such as boycotting a product). At the same time, women were found to be marginally less involved in collective acts (such as party membership). These sex differences are statistically significant (due to the largesample size) but also extremely modest in size (men and women only differ in thesemeasures by 1–2%).14 The audit also reported that more substantial gender differences can be found in cultural attitudes, with women proving less politically knowledgeable,interested and engaged in political discussions.These patterns are explored in more detail, andlargely confirmed, later in this report.
Does the activism gap matter?1.15 If there continues to exist inequalities in political participation by men and women inthe UK this may matter for both instrumentaland symbolic reasons. If one sex is lesspolitically involved than the other, it is possiblethat their concerns, needs and interests will failto be reflected in the public policy-makingprocess. Citizens who do not articulate theirpreferences risk being ignored. If women andmen were identical in their political views, thenthis consideration might not matter for thepublic policy process, however, opinion pollsfrequently suggest that the attitudes of womenand men commonly differ on many issues, suchas in their policy priorities on the appropriatelevels of public spending on health care, theimportance of educational services, or theappropriate deployment of military force.15
The legitimacy of democratic political systemsassumes that the views of all citizens should be taken into account equally in politicaldecision-making, especially in the formation of government.
1.16 Similarly, if one sex is not equally activewithin political parties, as the primary channel of political recruitment, they may fail to acquirethe civic skills, social networks and politicalexperiences that are invaluable for gaining higherlevels of elected and appointed office in the UK.
1.17 Membership of voluntary associations, acentral aspect of social capital, is also thoughtto generate both collective benefits (facilitatingco-operation in solving community problems)and individual benefits (such as generatingsocial and employment opportunities).
Gender and political participation: the activism gap
13
Any disparities in membership may therefore beto the disadvantage of those participating less,both as a group and as individuals.
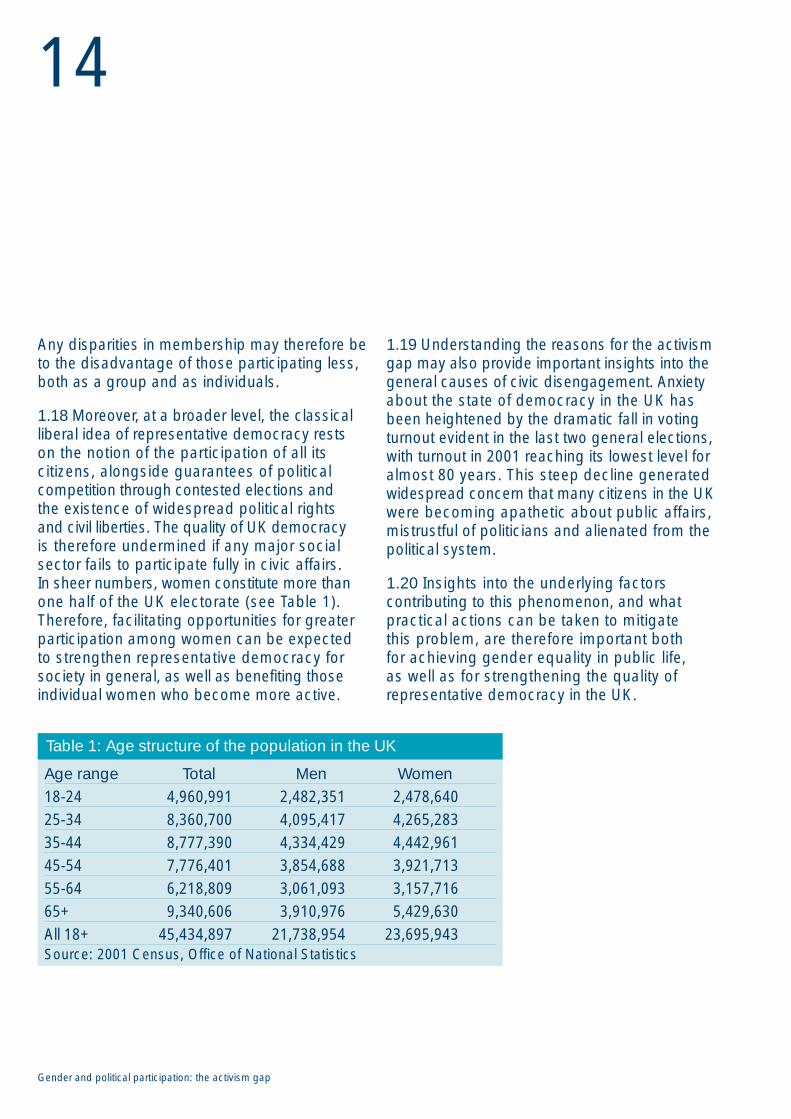
1.18 Moreover, at a broader level, the classicalliberal idea of representative democracy restson the notion of the participation of all itscitizens, alongside guarantees of politicalcompetition through contested elections and the existence of widespread political rights and civil liberties. The quality of UK democracy is therefore undermined if any major socialsector fails to participate fully in civic affairs. In sheer numbers, women constitute more thanone half of the UK electorate (see Table 1).Therefore, facilitating opportunities for greaterparticipation among women can be expectedto strengthen representative democracy forsociety in general, as well as benefiting thoseindividual women who become more active.
Gender and political participation: the activism gap
14
1.19 Understanding the reasons for the activismgap may also provide important insights into thegeneral causes of civic disengagement. Anxietyabout the state of democracy in the UK hasbeen heightened by the dramatic fall in votingturnout evident in the last two general elections,with turnout in 2001 reaching its lowest level foralmost 80 years. This steep decline generatedwidespread concern that many citizens in the UKwere becoming apathetic about public affairs,mistrustful of politicians and alienated from thepolitical system.
1.20 Insights into the underlying factorscontributing to this phenomenon, and whatpractical actions can be taken to mitigate this problem, are therefore important both for achieving gender equality in public life, as well as for strengthening the quality ofrepresentative democracy in the UK.
Age range Total Men Women18-24 4,960,991 2,482,351 2,478,64025-34 8,360,700 4,095,417 4,265,28335-44 8,777,390 4,334,429 4,442,96145-54 7,776,401 3,854,688 3,921,71355-64 6,218,809 3,061,093 3,157,71665+ 9,340,606 3,910,976 5,429,630All 18+ 45,434,897 21,738,954 23,695,943Source: 2001 Census, Office of National Statistics
Table 1: Age structure of the population in the UK
Before we can considercontemporary patterns ofparticipation among men andwomen we first need to clarify our key concepts and measures and define what we mean whenreferring to political participation.
Defining types of participation2.1 Political participation used to be commonlyunderstood as citizen activity aiming to influencegovernment and the public policy process.‘Participation’ refers to the mass level, ratherthan recruitment into elected or appointed office among elites. It was usually measured by indicators such as voting turnout and partymembership. For example, Verba, Nie and Kimfocused on this approach when they definedpolitical participation as ‘...those legal activities by private citizens that are more or less directlyaimed at influencing the selection of governmentalpersonnel and/or the actions they take’.16
2.2 Yet this conventional approach often failed to capture important areas of contemporarypolitical activity. Recognising this limitation,modern definitions have sought to incorporateinformal political activity, including protests,social movements and, increasingly, voluntaryactivities in pressure groups, civic associations,charities and other associations.17
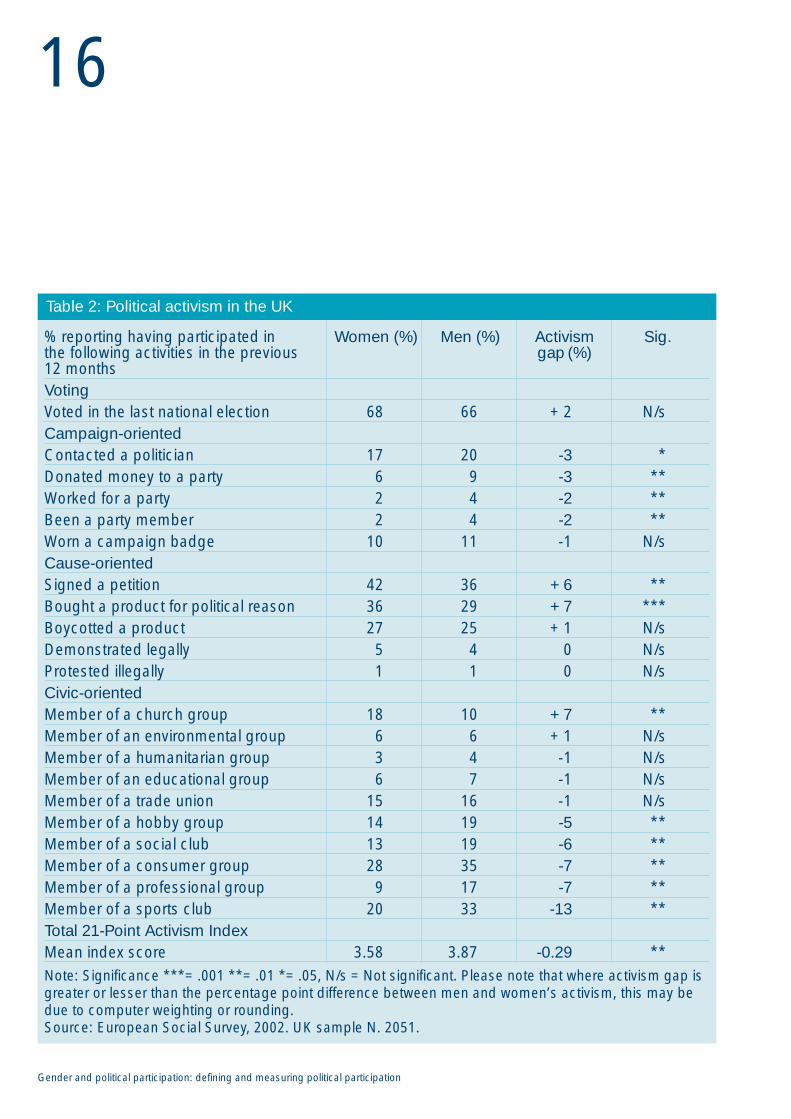
2.3 To explore contemporary patterns ofpolitical activism, this report recognises thatmass involvement in public affairs can takemany different forms, each associated withdiffering costs and benefits.18 We distinguishfour main dimensions of political participation:voting, campaign-oriented, cause-oriented andcivic-oriented activism. These are summarisedinto a 21-point Political Activism Index combiningall dimensions.19 The basic items used todevelop this index are listed in Table 2 andreported fully in Appendix 1.
Gender and political participation: defining and measuring political participation
152 Defining andmeasuring politicalparticipation
Gender and political participation: defining and measuring political participation
16
% reporting having participated in Women (%) Men (%) Activism Sig.the following activities in the previous gap (%)12 monthsVotingVoted in the last national election 68 66 +2 N/sCampaign-orientedContacted a politician 17 20 -3 *Donated money to a party 6 9 -3 **Worked for a party 2 4 -2 **Been a party member 2 4 -2 **Worn a campaign badge 10 11 -1 N/sCause-orientedSigned a petition 42 36 +6 **Bought a product for political reason 36 29 +7 ***Boycotted a product 27 25 +1 N/sDemonstrated legally 5 4 0 N/sProtested illegally 1 1 0 N/sCivic-orientedMember of a church group 18 10 +7 **Member of an environmental group 6 6 +1 N/sMember of a humanitarian group 3 4 -1 N/sMember of an educational group 6 7 -1 N/sMember of a trade union 15 16 -1 N/sMember of a hobby group 14 19 -5 **Member of a social club 13 19 -6 **Member of a consumer group 28 35 -7 **Member of a professional group 9 17 -7 **Member of a sports club 20 33 -13 **Total 21-Point Activism IndexMean index score 3.58 3.87 -0.29 **Note: Significance ***=.001 **=.01 *=.05, N/s =Not significant. Please note that where activism gap isgreater or lesser than the percentage point difference between men and women’s activism, this may bedue to computer weighting or rounding.Source: European Social Survey, 2002. UK sample N. 2051.
Table 2: Political activism in the UK

2.4 The ‘activism gap’ is measured as thepercentage of women minus the percentage of men who have engaged in each activity. Apositive gap indicates that women are moreactive than men, whereas a negative gapindicates that women are less active than men.The Political Activism Index counts participationin each form of activity as one and sums theactivism gap for each of the 21 individual acts.
2.5 Certain important exclusions from the scopeof this study should be noted. This reportfocuses upon understanding mass politicalactivity. We are therefore concerned with doingpolitics, hence we do not explore the causes of any gender differences in psychologicalattitudes, such as trust in Parliament, politicalinterest, civic duty, partisanship or politicalefficacy, which are thought conducive to civicparticipation.20 Along similar lines, the reportdoes not regard exposure or attention to masscommunications, including following campaignevents in newspapers or watching party politicalbroadcasts during the election, as indicators ofpolitical activism per se. Nor do we look directlyat gender differences in political awareness,knowledge or information.
2.6 These factors may indeed all plausiblycontribute towards mass participation, and maythereby help explain this phenomenon. Theyare also intrinsically interesting in their own rightand deserve further detailed analysis. Howeverthey are not, in themselves, channels whichcitizens can use for expressing political concernsor mobilising group interests. Activism concernsmass political behaviour, not prior attitudes orpredispositions. Moreover the explanation of the
origin of any gender differences in politicalknowledge or awareness is a very complexissue which requires comparison of how citizenslearn many dimensions of political information,beyond simple ‘civics’, which would take us far beyond the scope of this report.21
Voting turnout2.7 Voting in regular elections is one of themost common forms of citizen-orientedparticipation. Voting requires some initiative and awareness for an informed choice butmakes fairly minimal demands of time,knowledge and effort. Through the ballot box,voting influences parties and elected officials,and the outcome affects all citizens.
2.8 Voting is central to citizenship in representativedemocracy but, due to its relatively low costs interms of the effort, time and resources it requires,it is usually regarded as atypical of other moredemanding forms of participation. In this reportwe examine participation in general elections, aswell as in local and regional elections in the UK.
Campaign-oriented participation2.9 Campaign-oriented forms of participationconcern acts designed to influence Parliamentand government, primarily through politicalparties and elections. This category is typified in this study by work for parties or candidates, party membership, election leafleting, financialdonations to parties or candidates, attendinglocal party meetings and get-the-vote-out drives.
2.10 Participation through parties is important asthese organisations serve multiple functions inUK politics: simplifying and structuring electoral
Gender and political participation: defining and measuring political participation
17
Gender and political participation: defining and measuring political participation
18
choices, organising and mobilising campaigns,articulating and aggregating disparate interests,channelling communication, consultation and debate, training, recruiting and selectingcandidates, structuring parliamentary divisions,acting as policy think-tanks, and organisinggovernment. Not only are parties one of the main conduits of political participation, they alsoserve to boost and strengthen electoral turnout. If mass party membership is under threat, as many indicators suggest, this could haveserious implications for democracy in the UK.22
2.11 Campaigning typically generates collectivebenefits and requires greater initiative, time,and effort (and sometimes expenditure) thanmerely voting. Experience of campaign-orientedactivism is gauged in this study by a five-itemscale including whether people are members of a party and whether they have donated money to a party, worked for a party, contacted apolitician, or worn a campaign badge during the previous 12 months.
Cause-oriented participation2.12 Cause-oriented activities are focused uponinfluencing specific issues and policies outsideof the electoral arena. These acts are exemplifiedby consumer politics (buying or boycottingcertain products for political or ethical reasons),taking part in demonstrations and protests, andorganising or signing petitions.
2.13 Perhaps the most distinctive aspect ofthese activities is that these are most commonlyused to pursue specific issues and policyconcerns among diverse targets, includingorganisations in the non-profit or private
sectors. These actions can have diverse aims, whether to shape public opinion and ‘life-styles’, to publicise certain issues through the news media, to mobilise a networkedcoalition with other groups or non-profitagencies, or to influence the practices andpolicies of international bodies such as theWorld Trade Organisation, the EU or theUnited Nations.
2.14 Experience of cause-oriented activism is measured in this report by a five-item scale,including whether people have signed a petition,bought or boycotted products for a politicalreason, demonstrated legally or protestedillegally during the previous 12 months.
Civic-oriented participation2.15 Civic-oriented activities involve membershipand working with others in a voluntaryassociation, as well as collaborating withcommunity groups to solve a local problem.
2.16 Theories of social capital claim that typical face-to-face deliberative activities andparticipation within voluntary organisationsremoved from the political sphere – exemplifiedby trade unions, social clubs, and philanthropicgroups – promote interpersonal trust, socialtolerance and cooperative behaviour.23
2.17 In turn, these norms are regarded ascementing the bonds of social life, creating thefoundation for building local communities, civilsociety and democratic governance. In a ‘win-win’ situation, participation in associational lifeis thought to generate individual rewards, suchas career opportunities and personal support

networks, as well as facilitating communitygoods, by fostering the capacity of people to work together on local problems.
2.18 Putnam24 suggests that civic organisationssuch as unions, churches and communitygroups, play a vital role in the production of ‘bridging’ social capital. He claims theysucceed in overcoming divisive socialcleavages; integrating people from diversebackgrounds and values; promoting ‘habits ofthe heart’ such as tolerance, cooperation andreciprocity; and thereby contribute towards adense, rich and vibrant social infrastructure.
2.19 Civic activism involves direct action withinlocal communities, such as raising funds for alocal hospital or school, where the precise dividingline between the ‘social’ and ‘political’ breaksdown.25 Trade unions and churches, in particular,have long been regarded as central pillars of civicsociety that have traditionally served the functionof drawing citizens into public life. For a varietyof reasons – including the way that voluntaryassociations can strengthen social networks,foster leadership skills, heighten politicalawareness, create party linkages and facilitatecampaign work – people affiliated with church-based or union organisations can be expected to participate more fully in public life.26 It followsthat any gender disparities in the massmembership of voluntary associations areimportant in themselves and may plausibly beexpected to influence propensity to participatein other forms of political participation.
2.20 Experience of civic activism is measuredhere by a 10-point scale summarising
membership in a series of different types of voluntary organisations, including bothtraditional sectors such as trade unions,church groups and social clubs, as well as‘new’ social movements exemplified by groupsconcerned about the environment and abouthumanitarian issues.
Measuring the activism gap2.21 To sum up the overall patterns of politicalparticipation, we have constructed the 21-pointPolitical Activism Index. This is composed verysimply by adding together the activism gap for each of the 21 separate acts.
2.22 To establish the extent and significance of the activism gap in the UK, the report usesseveral sources of survey data. This includesthe European Social Survey (ESS) 2002, severalsurveys conducted on behalf of The ElectoralCommission and the British Election Study1964-2001. Full details of these sources areprovided in Appendix 1.
2.23 The empirical analysis focuses upon sexdifferences in mass political activism. In thesocial sciences, the terms sex and gender havedistinct meanings. Sex refers to simple biologicaldifference. It separates the categories of maleand female.27 In social surveys, sex is normallyincluded as a background variable. The conceptof gender takes account of differences amongwomen and men, as well as those betweengroups of women and men. Instead of dividingthe population into two halves, genderincorporates the social differences that arisefrom cultural expectations of the division oflabour between boys and girls, and between
Gender and political participation: defining and measuring political participation
19

men and women. In this regard, biological sex is only one source of individual identity. Anotherway of conceptualising gender is to think of it asa scale of attributes ranging from masculinity tofemininity. Women are more likely than men topossess feminine attributes, but such attributesdo not belong exclusively to women. The samepoint may be made about men and masculinity.Although we focus upon sex differences in thisreport, one way of capturing gender effects is to look at differences between women and menin various social categories or sub-groups.Where significant differences exist between thebehaviour of women and men, we identify theexistence of an ‘activism gap’.
Gender and political participation: defining and measuring political participation
20
3 The extent of theactivism gap in the UKUsing the European Social Survey(ESS) 2002, we can measure men and women’s propensity to participate in different types of political activity. Our 21-pointPolitical Activism Index summarisesthe gap between men and women’sparticipation in each act. Thisprovides an overall measure of the activism gap by gender in the UK today.
Main findings3.1 To summarise the contemporary picture inthe UK, the European Social Survey (ESS) 2002indicates the following five key findings:
• There is no gender gap in voting participation.This pattern is evident in UK generalelections, in local elections and in regionalcontests, confirming this pattern acrosssuccessive contexts.
• Women are equally or more engaged incause-oriented activism. In particular, morewomen sign petitions and engage in consumerpolitics, although no gender differences were evident in relation to participation indemonstrations and protest politics. Thisevidence broadly confirms other recent studies,including the results of the Citizen Audit.28
• Men remain significantly more active incampaign politics. This gender gap is notlarge in size but it is statistically significant andis consistent across all the indicators of partymembership, party donations and party work,as well as experience of contacting politicians.This pattern is also reported in many otherstudies, notably detailed surveys of partymembership and the Citizen Audit.29
• Men are generally more likely to belong to voluntary associations. This pattern ispartly dependent upon the type of groupsmonitored by different studies,30 however, inthe ESS survey, more men than women werefound to join hobby groups, social clubs,consumer groups, professional groups and sports clubs. The World Values Studyshows similar patterns in other post-industrialcountries.31 The only exception among
Gender and political participation: the extent of the activism gap in the UK
21
voluntary associations is church groups,which have more women members, due to long-standing patterns of greater female religiosity.32
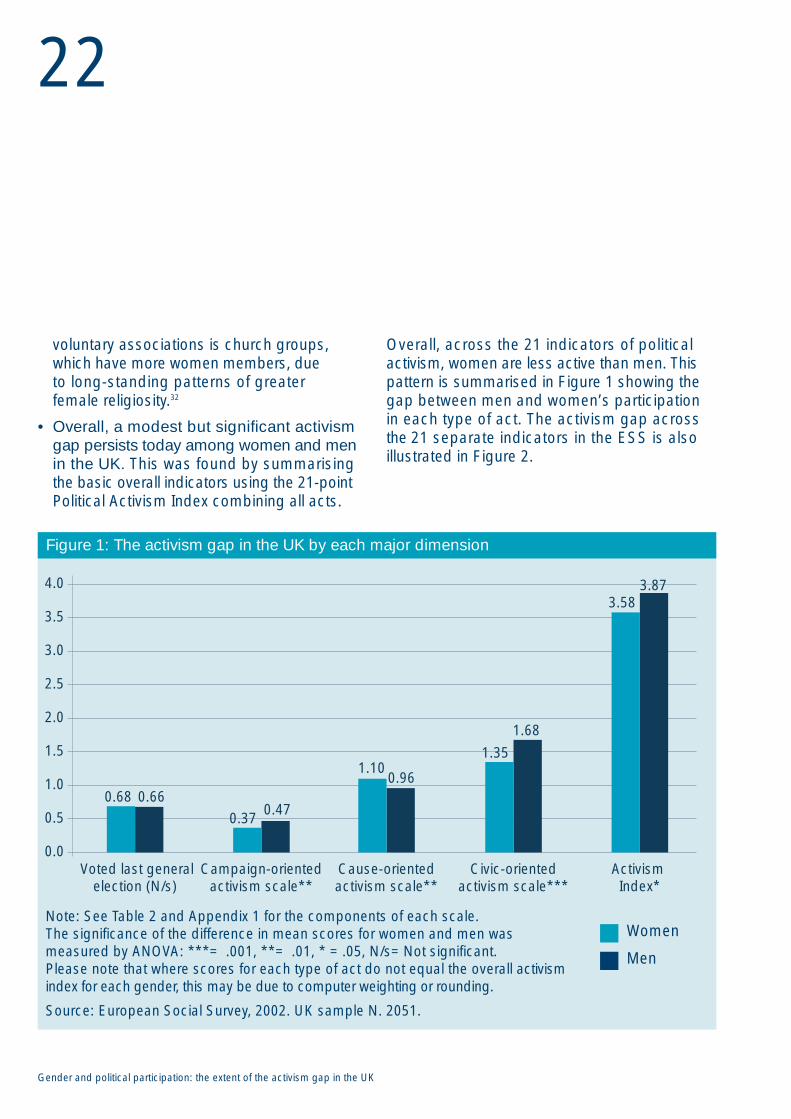
• Overall, a modest but significant activismgap persists today among women and menin the UK. This was found by summarisingthe basic overall indicators using the 21-pointPolitical Activism Index combining all acts.
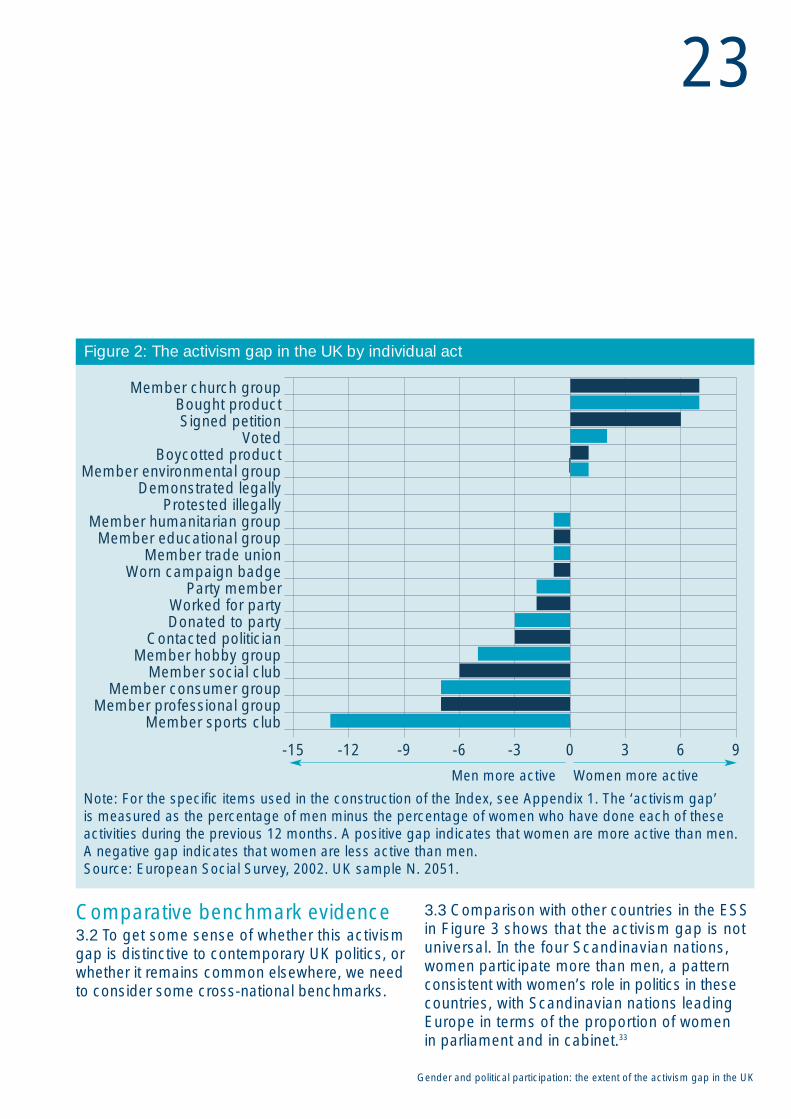
Overall, across the 21 indicators of politicalactivism, women are less active than men. Thispattern is summarised in Figure 1 showing thegap between men and women’s participationin each type of act. The activism gap across the 21 separate indicators in the ESS is alsoillustrated in Figure 2.
Gender and political participation: the extent of the activism gap in the UK
22
0.0
0.5
1.0
1.5
2.0
2.5
3.0
3.5
4.0
Cause-oriented activism scale**
Civic-oriented activism scale***
Activism Index*
1.100.96
Voted last general election (N/s)
Campaign-oriented activism scale**
0.68 0.660.37 0.47
1.35
1.68
3.583.87
Figure 1: The activism gap in the UK by each major dimension
Note: See Table 2 and Appendix 1 for the components of each scale. The significance of the difference in mean scores for women and men wasmeasured by ANOVA: ***= .001, **= .01, * =.05, N/s=Not significant. Please note that where scores for each type of act do not equal the overall activismindex for each gender, this may be due to computer weighting or rounding.
Source: European Social Survey, 2002. UK sample N. 2051.
Women
Men
Comparative benchmark evidence3.2 To get some sense of whether this activismgap is distinctive to contemporary UK politics, orwhether it remains common elsewhere, we needto consider some cross-national benchmarks.
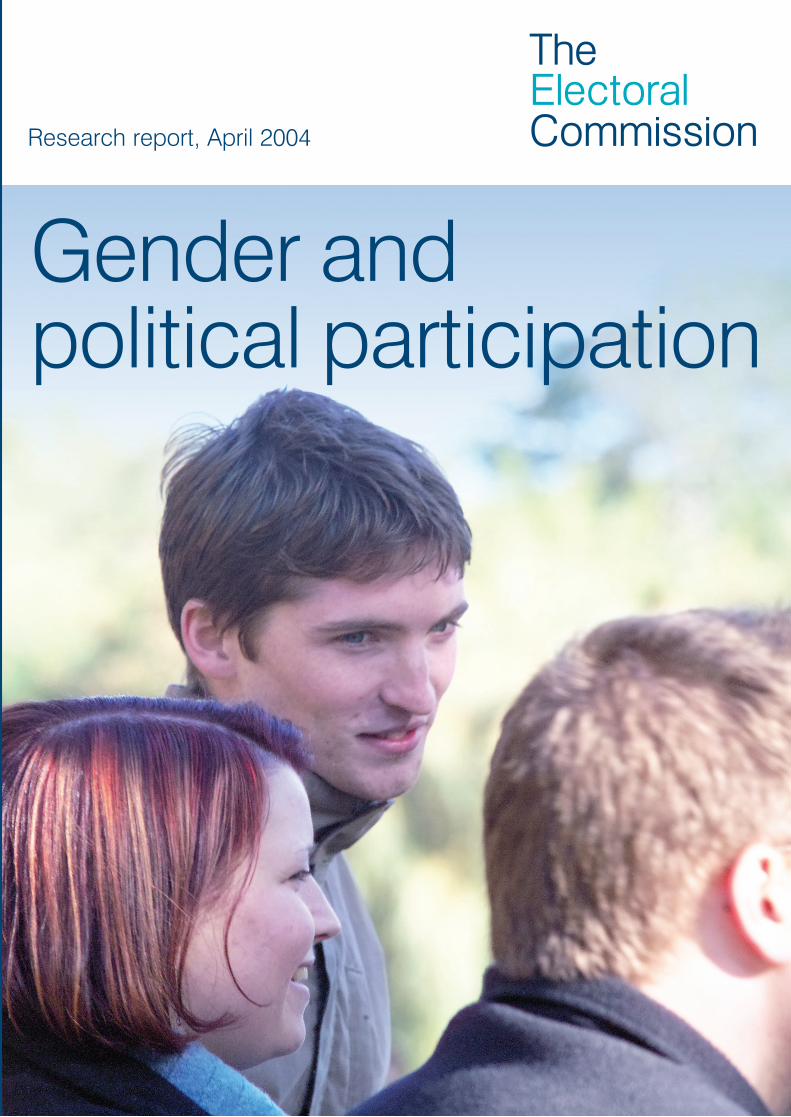
3.3 Comparison with other countries in the ESSin Figure 3 shows that the activism gap is notuniversal. In the four Scandinavian nations,women participate more than men, a patternconsistent with women’s role in politics in thesecountries, with Scandinavian nations leadingEurope in terms of the proportion of women in parliament and in cabinet.33
Gender and political participation: the extent of the activism gap in the UK
23
-15 -12 -9 -6 -3 0 3 6 9
Member church groupBought productSigned petition
VotedBoycotted product
Member environmental groupDemonstrated legally
Protested illegallyMember humanitarian group
Member educational groupMember trade union
Worn campaign badgeParty member
Worked for partyDonated to party
Contacted politicianMember hobby group
Member social clubMember consumer group
Member professional groupMember sports club
Figure 2: The activism gap in the UK by individual act
Note: For the specific items used in the construction of the Index, see Appendix 1. The ‘activism gap’ is measured as the percentage of men minus the percentage of women who have done each of theseactivities during the previous 12 months. A positive gap indicates that women are more active than men.A negative gap indicates that women are less active than men. Source: European Social Survey, 2002. UK sample N. 2051.
Men more active Women more active

Gender and political participation: the extent of the activism gap in the UK
24
FinlandSweden
DenmarkNorway
SwitzerlandHungary
PolandUK
IsraelAverage
GermanyGreece
NetherlandsSloveniaPortugal
ItalySpain
Czech RepublicIreland
Luxembourg
-1.00 -0.80 -0.60 -0.40 -0.20 0.00 0.20 0.40
Figure 3: The activism gap in other countries
Note: See Table 2 and Appendix 1 for the components of the Political Activism Index. A positivegap indicates that women are more active than men. A negative gap indicates that women areless active than men.Source: European Social Survey, 2002. Pooled sample N. 36,701.
Men more active Women more active
3.4 Similarly, across all the 19 nations, included inthe survey, the size of the activism gap is stronglycorrelated (R=60***) with the proportion ofwomen in the lower house of parliament.
3.5 In the other European societies, according to this index, women are less active than men at mass level. The gender gap is largest innations such as Luxembourg, Ireland, theCzech Republic and Spain. This is possibly dueto the predominantly Catholic religious culturein each society which is closely associated withpublic attitudes towards gender equality. Thereis considerable evidence that the culture inCatholic societies remains more sympathetic totraditional division of sex roles for women andmen, whereas more egalitarian attitudes arenow common in many Protestant nations.34
3.6 Overall, if European countries are ranked interms of their activism gap, the UK is locatedwithin the top third of nations. This suggeststhat although there has been considerableprogress towards gender equality in politicalparticipation in the UK, there remains furtherscope for eliminating disparities.
An audit of political engagement3.7 To cross check the reliability of these findings,and to see whether this is a consistent patternfrom alternative sources of survey evidence, thefindings from the European Social Survey (ESS)2002 can be compared against those from theaudit of political engagement. This was a projectconducted by The Electoral Commission andthe Hansard Society in 2003, using a PoliticalEngagement Poll by MORI.35
Gender and political participation: the extent of the activism gap in the UK
25
3.8 The questions in this study are not identicalto those in the ESS, in particular the ESS asksabout activities undertaken ‘during the last 12months’ whereas the audit asks about activitiesundertaken ‘during the last two or three years’.Also, the audit does not monitor membership of voluntary associations, although it does ask in more detail about contact activity, adistinct dimension of political participation.Technical differences in sampling and fieldworkprocedures, the year of the study, survey design,sample size and other methodological mattersmay also produce different estimates from thosemonitored by the ESS. Nevertheless, there areenough similarities to make some comparisonsand to crosscheck whether the findingsestablished so far are robust and consistent.
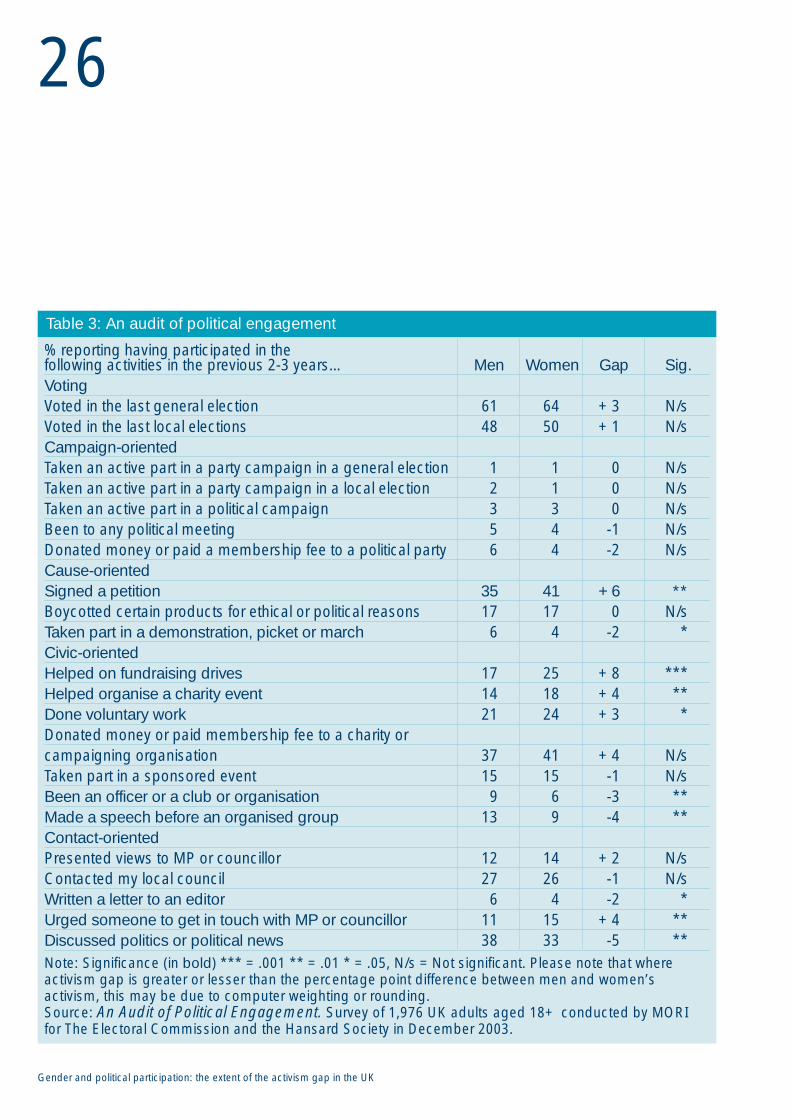
3.9 Table 3 shows the results of the audit’ssurvey. No significant gender differences werefound in the indicators of voting turnout in thelast general election and local elections, asalready noted by the ESS.
3.10 In contrast to the ESS, however, the auditfound no significant gender differences in the fiveitems used to monitor activism through campaignwork. The differences between the ESS and theaudit findings on campaign activism can wellbe explained by the alternative questions andindicators used in each survey, as well as thefact that so few people (less than 5%) reportedtaking an active part in party campaigns.
Gender and political participation: the extent of the activism gap in the UK
26
% reporting having participated in the following activities in the previous 2-3 years… Men Women Gap Sig.VotingVoted in the last general election 61 64 +3 N/sVoted in the last local elections 48 50 +1 N/sCampaign-orientedTaken an active part in a party campaign in a general election 1 1 0 N/sTaken an active part in a party campaign in a local election 2 1 0 N/sTaken an active part in a political campaign 3 3 0 N/sBeen to any political meeting 5 4 -1 N/sDonated money or paid a membership fee to a political party 6 4 -2 N/sCause-orientedSigned a petition 35 41 +6 **Boycotted certain products for ethical or political reasons 17 17 0 N/sTaken part in a demonstration, picket or march 6 4 -2 *Civic-orientedHelped on fundraising drives 17 25 +8 ***Helped organise a charity event 14 18 +4 **Done voluntary work 21 24 +3 *Donated money or paid membership fee to a charity or campaigning organisation 37 41 +4 N/sTaken part in a sponsored event 15 15 -1 N/sBeen an officer or a club or organisation 9 6 -3 **Made a speech before an organised group 13 9 -4 **Contact-orientedPresented views to MP or councillor 12 14 +2 N/sContacted my local council 27 26 -1 N/sWritten a letter to an editor 6 4 -2 *Urged someone to get in touch with MP or councillor 11 15 +4 **Discussed politics or political news 38 33 -5 **Note: Significance (in bold) *** =.001 ** =.01 * =.05, N/s =Not significant. Please note that whereactivism gap is greater or lesser than the percentage point difference between men and women’sactivism, this may be due to computer weighting or rounding.Source: An Audit of Political Engagement. Survey of 1,976 UK adults aged 18+ conducted by MORI for The Electoral Commission and the Hansard Society in December 2003.
Table 3: An audit of political engagement
3.11 In the cause-oriented category, morewomen signed a petition (as found in the ESS),but more men reported taking part in a‘demonstration, picket, or march’. On the civicacts, more women participated in a support role,such as helping to fundraise or to organise acharitable event, while men proved slightly moreactive in leadership roles, for example being anofficer or making speeches. Lastly, on contactactivity men proved slightly more likely to write aletter to newspapers as well as to discuss politics.
The British Election Study 20013.12 The results of the European Social Survey(ESS) 2002 can also be compared with a similarrange of indicators provided in the 2001 BritishElection Study (BES) (see Table 4 overleaf).
3.13 The main distinction is that the ESS andthe Audit monitored retrospective activism byasking about actual experience of engaging invarious acts (‘have you done...’), whereas the2001 BES monitored prospective activism(‘would you do...’).36
3.14 Despite these methodological differences,Table 4 confirms a broadly similar picture to thatestablished in the ESS, increasing confidencein the reliability of the main findings.
3.15 The results in the 2001 BES confirm nosignificant gender differences in likelihood tovote at the 2001 general election and in localelections. Women reported, however, that they would be less likely to vote in the nextEuropean Parliamentary elections, which canprobably be attributed to their lower interest in European affairs, as found in repeatedEurobarometer surveys.
3.16 Women were also persistently less likelythan men to engage in campaigns, especially to convince others how to vote and to discusspolitics, as well as to join and donate funds topolitical parties. These gender differences weresmall in size but statistically significant.
3.17 The BES found no gender gap in the twocause-oriented acts included in its survey (as in the ESS). The study also confirmed menwere more likely to join voluntary associations,such as a community association, charity groupor sports club (as found in the ESS).
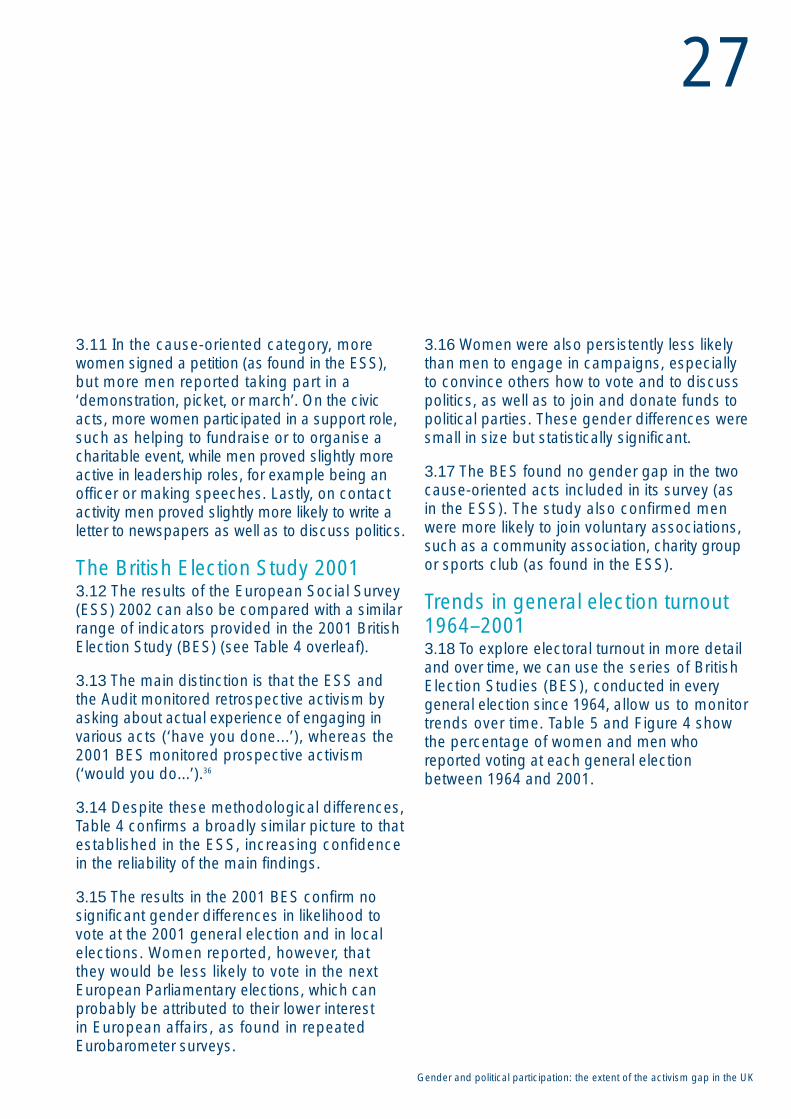
Trends in general election turnout1964–20013.18 To explore electoral turnout in more detailand over time, we can use the series of BritishElection Studies (BES), conducted in everygeneral election since 1964, allow us to monitortrends over time. Table 5 and Figure 4 showthe percentage of women and men whoreported voting at each general electionbetween 1964 and 2001.
Gender and political participation: the extent of the activism gap in the UK
27

Gender and political participation: the extent of the activism gap in the UK
28
% reporting that they were… Women Men Gap Sig.Voting-oriented‘Very likely’ to vote in the May 2001 UK general election 73 72 +1 N/s‘Very likely’ to vote in the next local election 57 56 +1 N/s‘Very likely’ to vote in the next European elections 33 41 -8 **Campaign-oriented‘Likely’ to work for a party or a candidate in an election campaign 10 11 -1 N/s‘Likely’ to give money to a political party 10 12 -2 *‘Likely’ to become a party member 4 6 -2 *‘Likely’ to try to convince someone else how to vote 13 19 -6 ***‘Likely’ to discuss politics with family or friends 50 59 -9 ***Cause-oriented‘Likely’ to participate in a protest, like a rally or a demonstration 28 28 0 N/s‘Likely’ to join a consumer boycott 51 53 -2 N/sCivic-oriented‘Likely’ to work actively with a group of people to solve a problem 38 39 -1 N/s‘Likely’ to be active in a voluntary organisation 49 53 -4 *Note: Respondents were asked to rate their likelihood to participate in each act on a scale of 0 -10, 0meaning ‘very unlikely’ and 10 meaning ‘very likely’. The 10-point scales for each item were categorisedinto the percentage ‘unlikely’ (0-4) and ‘likely’ (5-10). The significance of the mean difference betweengroups was measured by ANOVA and Chi-Square tests. *** =.001 ** =.01 * =.05, N/s =not significant.Source: British Election Study 2001. Weighted for gender. N.3219
Table 4: Propensity to participate in Britain
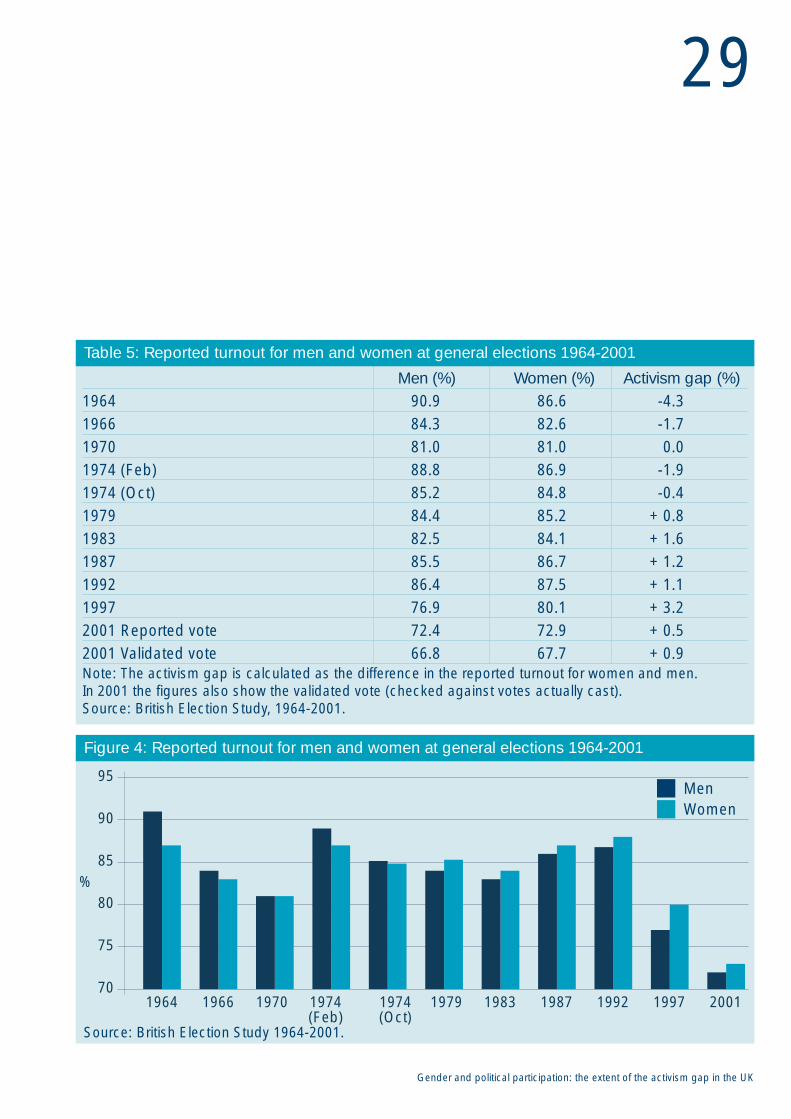
Men (%) Women (%) Activism gap (%)1964 90.9 86.6 -4.31966 84.3 82.6 -1.71970 81.0 81.0 0.01974 (Feb) 88.8 86.9 -1.91974 (Oct) 85.2 84.8 -0.41979 84.4 85.2 +0.81983 82.5 84.1 +1.61987 85.5 86.7 +1.21992 86.4 87.5 +1.11997 76.9 80.1 +3.22001 Reported vote 72.4 72.9 +0.52001 Validated vote 66.8 67.7 +0.9Note: The activism gap is calculated as the difference in the reported turnout for women and men. In 2001 the figures also show the validated vote (checked against votes actually cast). Source: British Election Study, 1964-2001.
1964 1966 1970 1974(Feb)
1974(Oct)
1979 1983 1987 1992 1997 200170
75
80%
85
90
95
Figure 4: Reported turnout for men and women at general elections 1964-2001
Source: British Election Study 1964-2001.
MenWomen
Gender and political participation: the extent of the activism gap in the UK
29
Table 5: Reported turnout for men and women at general elections 1964-2001
3.19 The gradual closure of the gender gap invoting, found in other countries, is also evidentin these surveys. The traditional pattern wasapparent in most general elections during themid-1960s and early 1970s, when women wereless likely to vote. In 1979, however, this patternreversed and in every general election sincethen women have proved slightly more likely to vote than men. This process peaked in 1997,where an estimated 80.1% of women votedcompared with around 76.9% of men, as a result of the activism gap combined with age-related patterns of turnout and greaterfemale longevity.37 The gender difference thendiminished again in the 2001 general election,with 72% of men and 73% of women reportingvoting at that election according to the BES.
3.20 In most surveys the proportion ofrespondents who report that they voted isconsistently inflated compared with the actualvotes cast.38 To provide a more accurateestimate, reported turnout in the BES 2001survey were matched and validated against the official votes cast at each respondent’saddress, according to the electoral register.
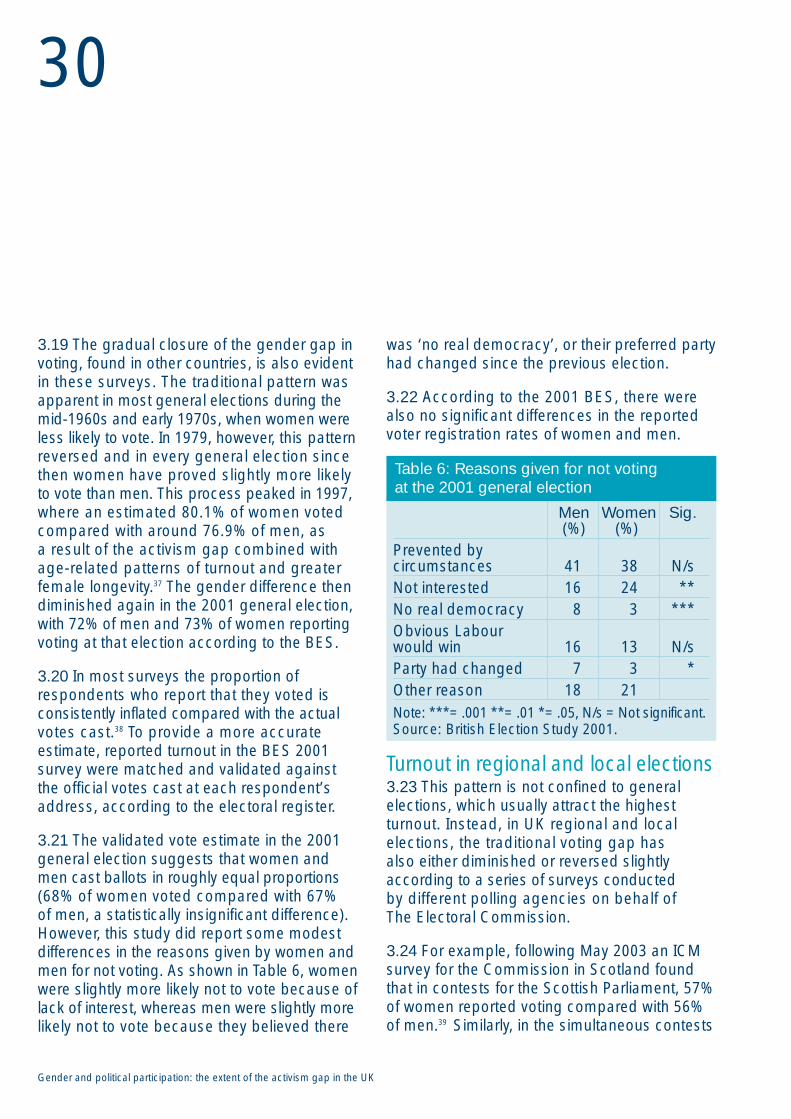
3.21 The validated vote estimate in the 2001general election suggests that women and men cast ballots in roughly equal proportions(68% of women voted compared with 67% of men, a statistically insignificant difference).However, this study did report some modestdifferences in the reasons given by women andmen for not voting. As shown in Table 6, womenwere slightly more likely not to vote because oflack of interest, whereas men were slightly morelikely not to vote because they believed there
was ‘no real democracy’, or their preferred partyhad changed since the previous election.
3.22 According to the 2001 BES, there werealso no significant differences in the reportedvoter registration rates of women and men.
Turnout in regional and local elections3.23 This pattern is not confined to generalelections, which usually attract the highestturnout. Instead, in UK regional and localelections, the traditional voting gap has also either diminished or reversed slightlyaccording to a series of surveys conducted by different polling agencies on behalf of The Electoral Commission.
3.24 For example, following May 2003 an ICMsurvey for the Commission in Scotland foundthat in contests for the Scottish Parliament, 57%of women reported voting compared with 56%of men.39 Similarly, in the simultaneous contests
Gender and political participation: the extent of the activism gap in the UK
30
Men Women Sig.(%) (%)
Prevented by circumstances 41 38 N/sNot interested 16 24 **No real democracy 8 3 ***Obvious Labour would win 16 13 N/sParty had changed 7 3 *Other reason 18 21Note: ***=.001 **=.01 *=.05, N/s =Not significant.Source: British Election Study 2001.
Table 6: Reasons given for not voting at the 2001 general election
for the National Assembly for Wales, a NOPpost-election survey for the Commission inWales found that 40% of women reportedvoting compared with 35% of men.40
3.25 A MORI survey for the Commission followingthe English local council elections in May 2003,found that 38% of women and 31% of menreported voting, producing a seven percentagepoint gender gap.41 Also in those areasconducting electoral pilots schemes, 47% of women reported voting compared with 39% of men, signifying a substantial gender gap, for reasons explored fully later.42
Young people’s participation3.26 Considerable concern has been expressedabout activism among the young, and whether
this group is particularly disenchanted withWestminster politics and apathetic aboutelections. Comparisons can be made using thestandard surveys such as the BES but the limitedsample size means that it is often difficult toanalyse the attitudes and behaviour of theyoungest cohort (typically taken to be 18–24 year olds) with any degree of reliability.
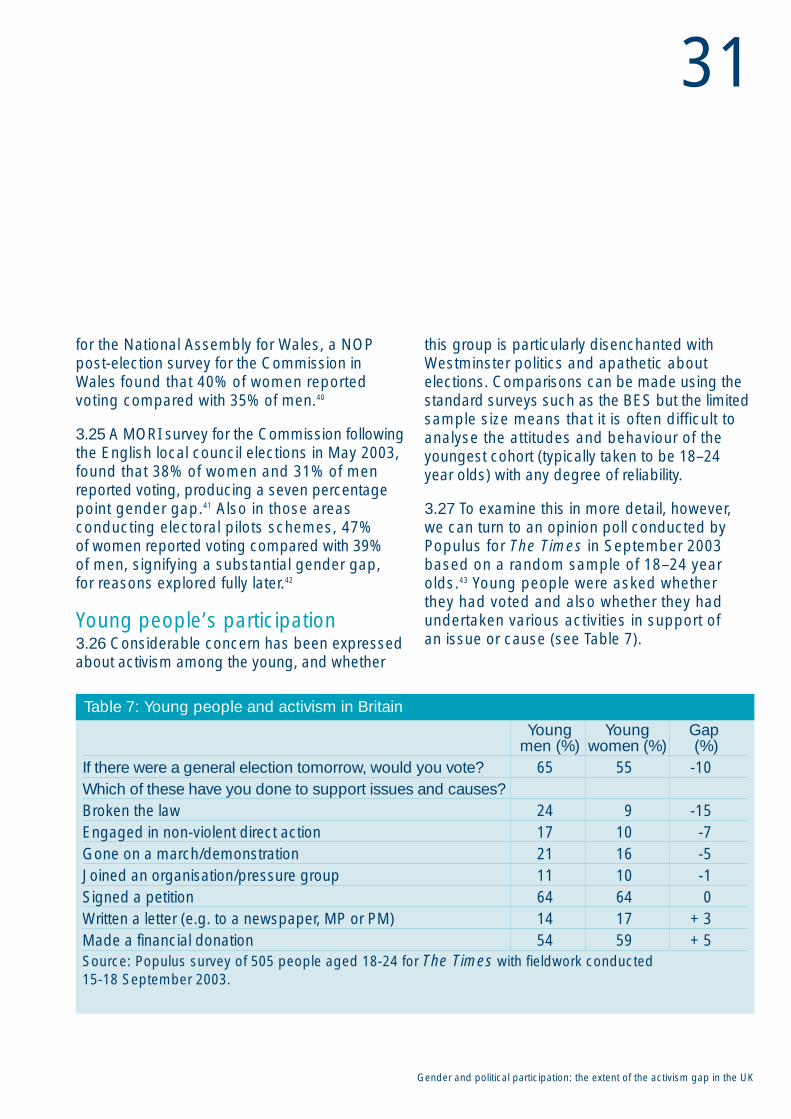
3.27 To examine this in more detail, however,we can turn to an opinion poll conducted byPopulus for The Times in September 2003based on a random sample of 18–24 yearolds.43 Young people were asked whether they had voted and also whether they hadundertaken various activities in support of an issue or cause (see Table 7).
Gender and political participation: the extent of the activism gap in the UK
31
Young Young Gapmen (%) women (%) (%)
If there were a general election tomorrow, would you vote? 65 55 -10Which of these have you done to support issues and causes?Broken the law 24 9 -15Engaged in non-violent direct action 17 10 -7Gone on a march/demonstration 21 16 -5Joined an organisation/pressure group 11 10 -1Signed a petition 64 64 0Written a letter (e.g. to a newspaper, MP or PM) 14 17 +3Made a financial donation 54 59 +5Source: Populus survey of 505 people aged 18-24 for The Times with fieldwork conducted 15-18 September 2003.
Table 7: Young people and activism in Britain

3.28 The results in Table 7 show that the gendergap in activism was particularly clear in protestpolitics: young men were more likely to reporthaving broken the law, as well as havingengaged in non-violent direct action anddemonstrations. Yet the evidence suggests that young women were not less active across all indicators, since women concerned about a cause or issue had more commonly made a financial donation or written a letter to anewspaper or a politician.
3.29 However, young men were more likely than young women to say that they would vote ‘if there were a general election tomorrow’ (65%compared to 55 %).44 How far the gender gap in voting turnout among the young represents anenduring generational pattern, or instead can beregarded as a life-cycle effect, will be consideredin depth in subsequent sections of this report.
Gender and political participation: the extent of the activism gap in the UK
32

4 Explaining theactivism gapMany decades after achieving full citizenship, women todayparticipate equally at the ballot box,or even more than men. Women do however continue to lag behindmen in terms of membership ofparties and voluntary associations,both vital channels of participationin civic society.
Potential explanations4.1 Most explanations of why there continues to be an activism gap by gender in the UKemphasise that women often have fewerresources of time, money and civic skills thanmen as well as lower psychological engagement in politics. Through juggling their dual roles inthe home and workplace, many working womenwith children and family responsibilities facecompeting demands on their time. Some,particularly the older generation of women,often lack the educational background, financialassets and occupational experiences closelyassociated with political participation. Yet, iftrue, these sorts of factors should depresswomen’s participation uniformly across themost demanding forms of political activism, not just certain types of activity.
4.2 More satisfactory explanations need to relatespecifically to what distinguishes membership ofpolitical parties and voluntary associations fromcause-oriented activities. For example, due to thesocialisation process, women and men may differin their attitudes towards the relevance andimportance of party politics in their lives. Also theprocess of partisan de-alignment may potentiallyhave gone further and faster in eroding loyaltiesamong women than among men. Genderdifferences common in informal social networksand lifestyles may also lead women and men to differ in their interests and thus in theirmembership of different types of communitygroups and associations.
4.3 Moreover, women may experience greaterpractical barriers to activism, especially thosewith home responsibilities for care of dependents.
Gender and political participation: explaining the activism gap
33

Such barriers may include having sufficient timeto attend party meetings in the evenings, or theirunwillingness to canvass voters in unsafeareas during elections.
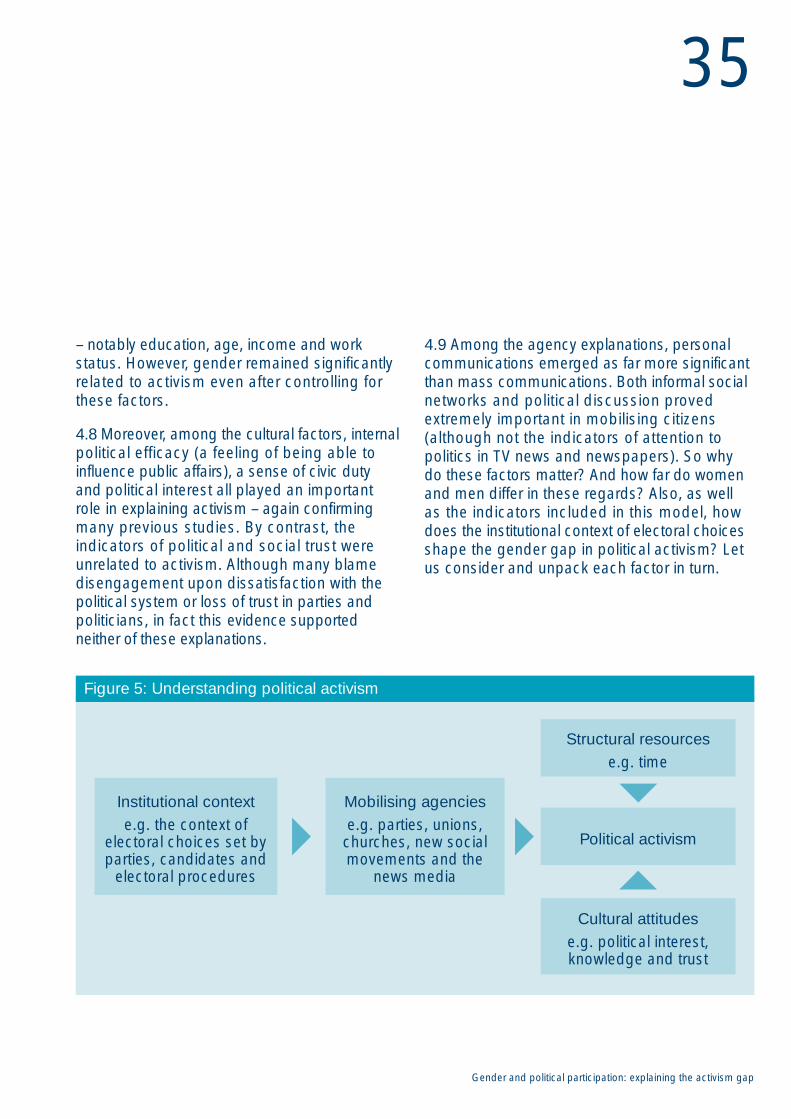
4.4 Although all sorts of explanations come tomind, solid and systematic evidence is oftenlacking to evaluate these alternative accounts.Still less is known about the potential impact ofpractical policy reforms designed to boost citizenparticipation in party politics and withinvoluntary associations. Many arguments arepossible but the main explanations can becategorised into the four groups illustrated inFigure 5, namely:
• Structural explanations emphasising theresources that facilitate civic participation –notably time, education and income – which are closely associated with politicalknowledge, skills and interest.
• Cultural accounts focusing upon themotivational attitudes that draw people into public affairs – such as a sense ofpolitical efficacy, institutional confidenceand citizenship duty.
• Agency explanations prioritising the role ofmobilising organisations such as churchesand unions, as well as the role of the newsmedia and informal social networks, whichbring people into public affairs.
• Institutional explanations suggesting that thestructure matters by setting the practical ‘rulesof the game’ – notably the context of electoralchoices set by the parties, candidates andelectoral procedures.
4.5 In short, these explanations suggest that women participate less in parties andassociational life either because they can’t (they lack resources); because they won’t(they’re not interested); because nobody asks them (lack of networks); or because the context or rules deters them. Of course, we are not assuming that any single mono-causal explanation lies at the heart of thisphenomenon; instead, we are trying todisentangle the relative importance of each of these factors on political activism.
Analysis of the evidence4.6 A two-step process was used to explore the evidence in the European Social Survey2002, the richest source of survey analysiscurrently available on this topic. We theorisethat two conditions are necessary in order toaccount satisfactorily for gender differences in political activism:
• Firstly, we need to identify what causespolitical activism. For example, is activismmost strongly related to a sense of civic duty,strong links with social networks or higherlevels of education? This study uses a multi-variate regression model to assess therelative importance of the main causes ofpolitical activism in the UK.45
• Secondly, we need to identify whetherwomen and men differ on these factors – i.e.whether men have stronger social networksor a greater sense of civic duty than women.
4.7 Table 14 in Appendix 2 shows an analysis ofthe main causes of political activism in the UK.As many previous studies have found, socialbackground is an important predictor of activism
Gender and political participation: explaining the activism gap
34
– notably education, age, income and workstatus. However, gender remained significantlyrelated to activism even after controlling forthese factors.
4.8 Moreover, among the cultural factors, internalpolitical efficacy (a feeling of being able toinfluence public affairs), a sense of civic duty and political interest all played an important role in explaining activism – again confirmingmany previous studies. By contrast, theindicators of political and social trust wereunrelated to activism. Although many blamedisengagement upon dissatisfaction with thepolitical system or loss of trust in parties andpoliticians, in fact this evidence supportedneither of these explanations.
4.9 Among the agency explanations, personalcommunications emerged as far more significantthan mass communications. Both informal socialnetworks and political discussion provedextremely important in mobilising citizens(although not the indicators of attention topolitics in TV news and newspapers). So why do these factors matter? And how far do womenand men differ in these regards? Also, as well as the indicators included in this model, howdoes the institutional context of electoral choicesshape the gender gap in political activism? Letus consider and unpack each factor in turn.
Gender and political participation: explaining the activism gap
35
Institutional contexte.g. the context of
electoral choices set byparties, candidates and
electoral procedures
Mobilising agenciese.g. parties, unions,
churches, new socialmovements and the
news media
Structural resourcese.g. time
Cultural attitudese.g. political interest,knowledge and trust
Political activism
Figure 5: Understanding political activism
Structural resources4.10 Explanations based on structural resourcesemphasise how the social background of acitizen accounts for their civic participation.These accounts emphasise that educationalqualifications, social-economic status andincome lead to inequalities in other civic assets –such as skills, knowledge, experience, time and money. Possession of these assets makes some better placed than others to takeadvantage of the opportunities for participation.Resources are perhaps most obviously usefulin fostering more demanding forms of activism –such as social networks in philanthropic fund-raising for local schools and hospitals; the needfor leisure time to volunteer in a communityassociation or serve on a parish council; theassets of flexible careers for the pursuit ofelected office; the advantages of writing andcommunication skills to produce the local partynewsletter; and the organisational abilities thathelp mobilise grassroots social movements.
4.11 In this regard, the activism gap amongwomen and men may vary due to many othercontrasts in their lifestyles and circumstances.For example, Burns, Schlozman and Verba foundthat in the United States women are, on average,disadvantaged with respect to education, incomeand occupational status, attributes long knownto be associated with political activism.46 Asmany others have found, the results in Table 14(Appendix 2) confirm the strong impact of age,education and income on civic participation.
Education and socio-economic status
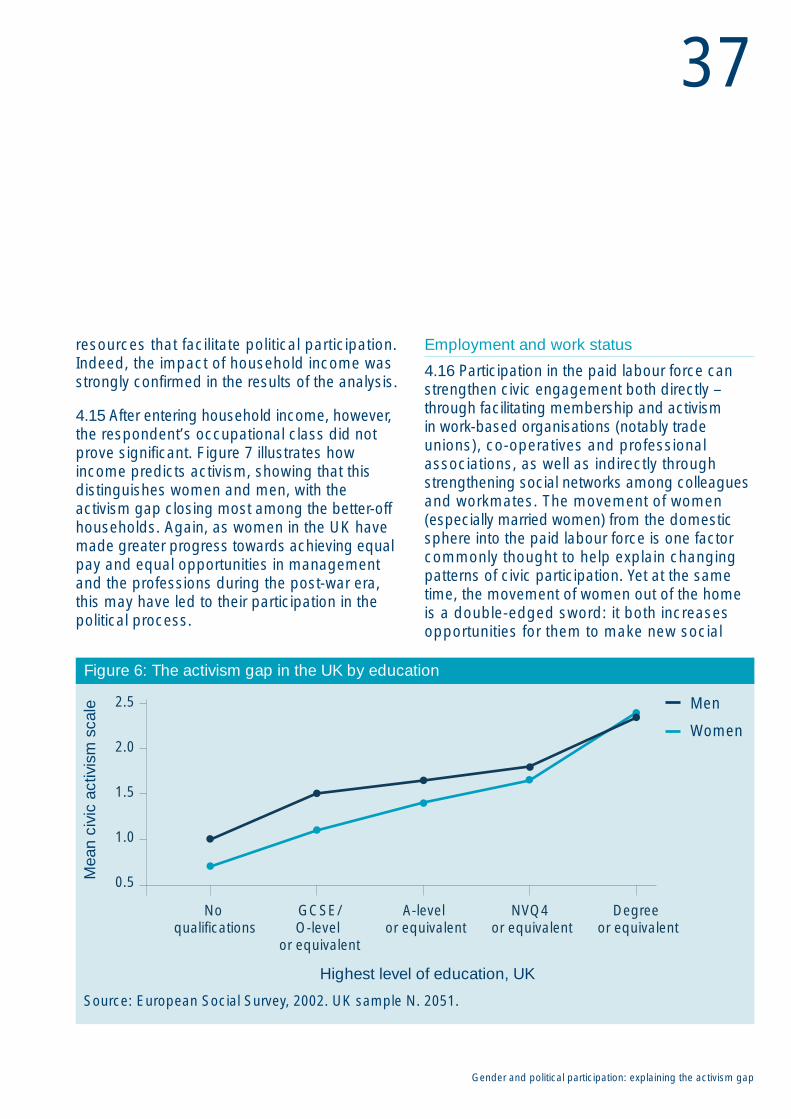
4.12 Education has commonly been found to provide one of the best predictors ofparticipation: formal schooling fosters the civicand cognitive skills useful to make sense ofcomplex issues and political controversies, togather relevant information about party policiesand leaders from the mass media, and to engagein political debates. Becoming a member, activist,or office-holder in parties, community or voluntarygroups typically makes multiple demands in the ability to gather and process information, to communicate, to organise events and meetings,and to manage people, all of which are facilitatedby the skills and confidence provided by education.
4.13 Figure 6 illustrates the activism gap bygender and educational qualifications, showingthat differences in political participation amongwomen and men are greatest among those withthe lowest levels of educational achievementsand smallest among those who have attendeduniversity. Given this pattern, steadily growinglevels of equal educational opportunities in theUK during the post-war era, especially in highereducation, is one factor that has probablycontributed most to the gradual closure of the gender gap in voting turnout.47
4.14 Closely related factors, based on thestandard social-economic status (SES) model,suggest that income differentials and social classwill also shape patterns of participation.48 Both of these attributes are strongly associated witheducational qualifications and achievements,with greater affluence and more flexible white-collar professional and managerial jobsproviding the leisure, time-flexibility and financial
Gender and political participation: explaining the activism gap
36
resources that facilitate political participation.Indeed, the impact of household income wasstrongly confirmed in the results of the analysis.
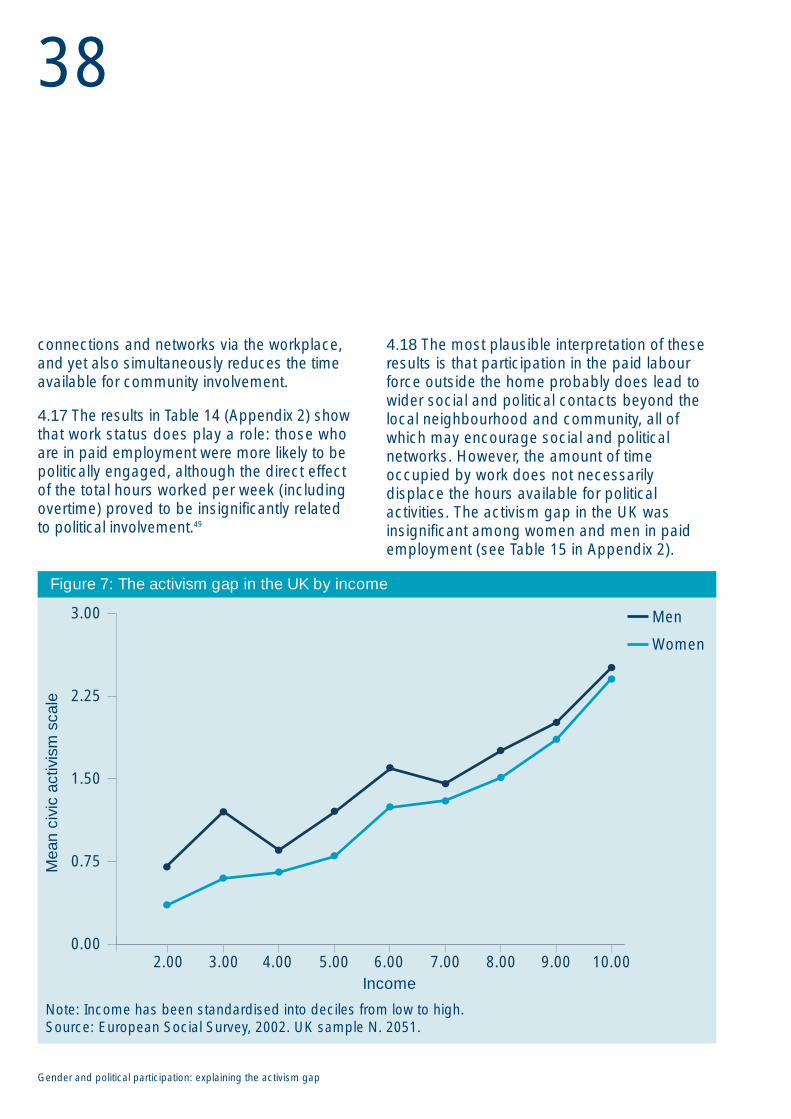
4.15 After entering household income, however,the respondent’s occupational class did notprove significant. Figure 7 illustrates howincome predicts activism, showing that thisdistinguishes women and men, with theactivism gap closing most among the better-offhouseholds. Again, as women in the UK havemade greater progress towards achieving equalpay and equal opportunities in managementand the professions during the post-war era,this may have led to their participation in thepolitical process.
Employment and work status
4.16 Participation in the paid labour force canstrengthen civic engagement both directly –through facilitating membership and activism in work-based organisations (notably tradeunions), co-operatives and professionalassociations, as well as indirectly throughstrengthening social networks among colleaguesand workmates. The movement of women(especially married women) from the domesticsphere into the paid labour force is one factorcommonly thought to help explain changingpatterns of civic participation. Yet at the sametime, the movement of women out of the home is a double-edged sword: it both increasesopportunities for them to make new social
Gender and political participation: explaining the activism gap
37
No qualifications
GCSE/ O-level
or equivalent
A-level or equivalent
NVQ4 or equivalent
Degree or equivalent
0.5
1.0
1.5
2.0
2.5
Figure 6: The activism gap in the UK by education
Source: European Social Survey, 2002. UK sample N. 2051.
Highest level of education, UK
Mea
n ci
vic
activ
ism
sca
le Men
Women
connections and networks via the workplace,and yet also simultaneously reduces the timeavailable for community involvement.
4.17 The results in Table 14 (Appendix 2) showthat work status does play a role: those who are in paid employment were more likely to bepolitically engaged, although the direct effect of the total hours worked per week (includingovertime) proved to be insignificantly related to political involvement.49
4.18 The most plausible interpretation of theseresults is that participation in the paid labourforce outside the home probably does lead towider social and political contacts beyond thelocal neighbourhood and community, all ofwhich may encourage social and politicalnetworks. However, the amount of timeoccupied by work does not necessarilydisplace the hours available for politicalactivities. The activism gap in the UK wasinsignificant among women and men in paidemployment (see Table 15 in Appendix 2).
Gender and political participation: explaining the activism gap
38
2.00 3.00 4.00 5.00 6.00 7.00 9.008.00 10.000.00
0.75
1.50
2.25
3.00
Figure 7: The activism gap in the UK by income
Note: Income has been standardised into deciles from low to high.Source: European Social Survey, 2002. UK sample N. 2051.
Income
Mea
n ci
vic
activ
ism
sca
le
Men
Women
Religiosity, marital status, family and children
4.19 By contrast to the role of education, incomeand work status, many other structural factors,which observers often believe may be important,proved less strongly related to overall levels ofpolitical activism (see Table 14 in Appendix 2).
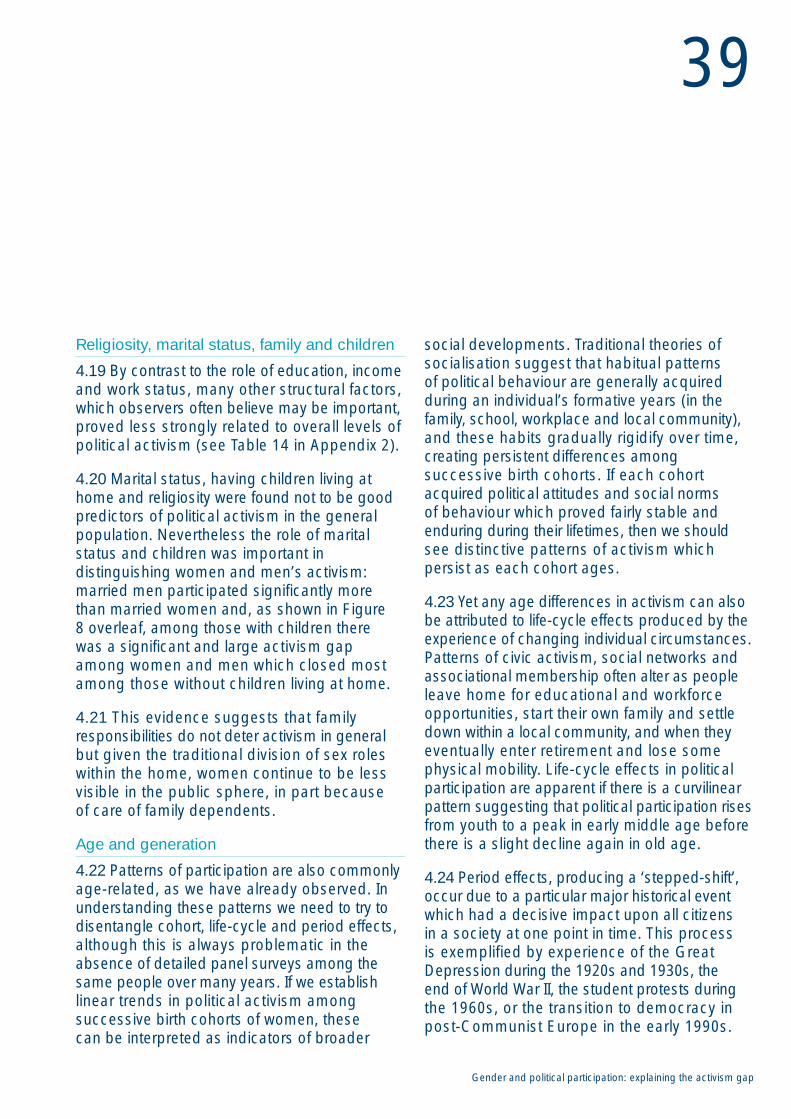
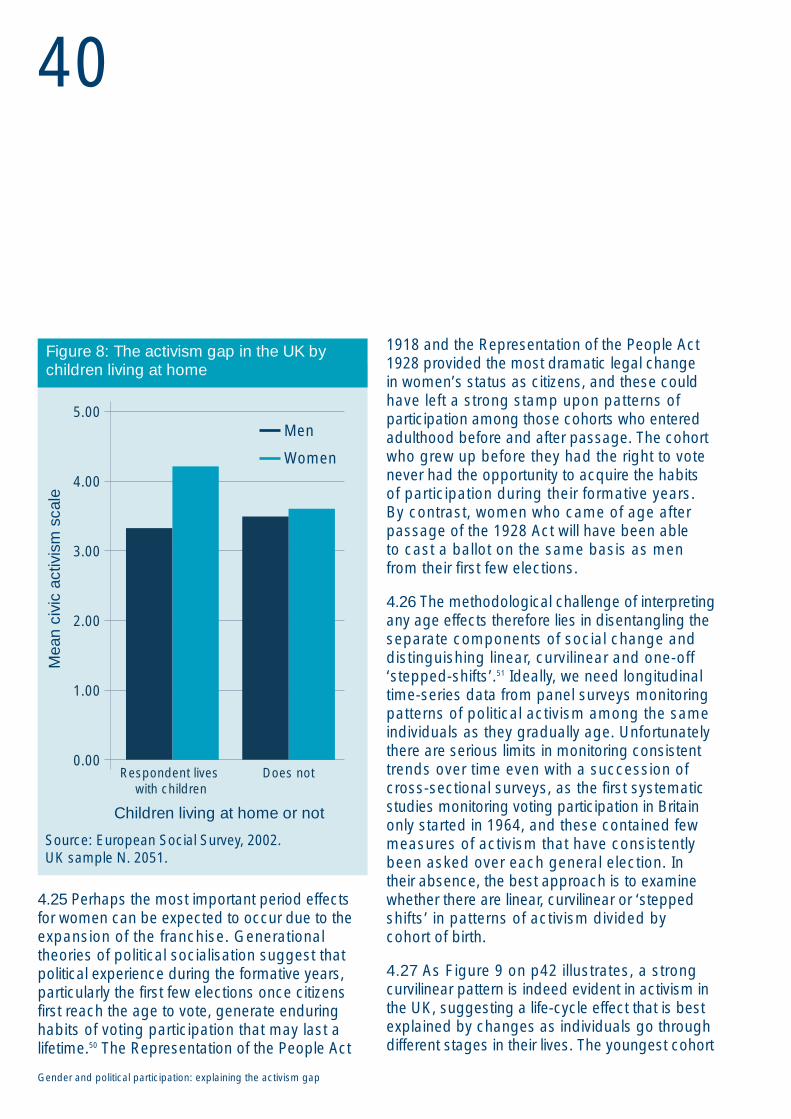
4.20 Marital status, having children living athome and religiosity were found not to be goodpredictors of political activism in the generalpopulation. Nevertheless the role of maritalstatus and children was important indistinguishing women and men’s activism:married men participated significantly morethan married women and, as shown in Figure 8 overleaf, among those with children there was a significant and large activism gapamong women and men which closed mostamong those without children living at home.
4.21 This evidence suggests that familyresponsibilities do not deter activism in generalbut given the traditional division of sex roleswithin the home, women continue to be lessvisible in the public sphere, in part because of care of family dependents.
Age and generation
4.22 Patterns of participation are also commonlyage-related, as we have already observed. Inunderstanding these patterns we need to try todisentangle cohort, life-cycle and period effects,although this is always problematic in theabsence of detailed panel surveys among thesame people over many years. If we establishlinear trends in political activism amongsuccessive birth cohorts of women, these can be interpreted as indicators of broader
social developments. Traditional theories ofsocialisation suggest that habitual patterns of political behaviour are generally acquiredduring an individual’s formative years (in thefamily, school, workplace and local community),and these habits gradually rigidify over time,creating persistent differences amongsuccessive birth cohorts. If each cohortacquired political attitudes and social norms of behaviour which proved fairly stable andenduring during their lifetimes, then we shouldsee distinctive patterns of activism which persist as each cohort ages.
4.23 Yet any age differences in activism can alsobe attributed to life-cycle effects produced by theexperience of changing individual circumstances.Patterns of civic activism, social networks andassociational membership often alter as peopleleave home for educational and workforceopportunities, start their own family and settledown within a local community, and when theyeventually enter retirement and lose somephysical mobility. Life-cycle effects in politicalparticipation are apparent if there is a curvilinearpattern suggesting that political participation risesfrom youth to a peak in early middle age beforethere is a slight decline again in old age.
4.24 Period effects, producing a ‘stepped-shift’,occur due to a particular major historical eventwhich had a decisive impact upon all citizens in a society at one point in time. This process is exemplified by experience of the GreatDepression during the 1920s and 1930s, the end of World War II, the student protests duringthe 1960s, or the transition to democracy inpost-Communist Europe in the early 1990s.
Gender and political participation: explaining the activism gap
39
4.25 Perhaps the most important period effectsfor women can be expected to occur due to theexpansion of the franchise. Generationaltheories of political socialisation suggest thatpolitical experience during the formative years,particularly the first few elections once citizensfirst reach the age to vote, generate enduringhabits of voting participation that may last alifetime.50 The Representation of the People Act
1918 and the Representation of the People Act1928 provided the most dramatic legal change in women’s status as citizens, and these couldhave left a strong stamp upon patterns ofparticipation among those cohorts who enteredadulthood before and after passage. The cohortwho grew up before they had the right to votenever had the opportunity to acquire the habitsof participation during their formative years. By contrast, women who came of age afterpassage of the 1928 Act will have been able to cast a ballot on the same basis as men from their first few elections.
4.26 The methodological challenge of interpretingany age effects therefore lies in disentangling theseparate components of social change anddistinguishing linear, curvilinear and one-off‘stepped-shifts’.51 Ideally, we need longitudinaltime-series data from panel surveys monitoringpatterns of political activism among the sameindividuals as they gradually age. Unfortunatelythere are serious limits in monitoring consistenttrends over time even with a succession ofcross-sectional surveys, as the first systematicstudies monitoring voting participation in Britainonly started in 1964, and these contained fewmeasures of activism that have consistentlybeen asked over each general election. In their absence, the best approach is to examinewhether there are linear, curvilinear or ‘steppedshifts’ in patterns of activism divided by cohort of birth.
4.27 As Figure 9 on p42 illustrates, a strongcurvilinear pattern is indeed evident in activism inthe UK, suggesting a life-cycle effect that is bestexplained by changes as individuals go throughdifferent stages in their lives. The youngest cohort
Gender and political participation: explaining the activism gap
40
Respondent lives with children
Does not0.00
1.00
2.00
3.00
4.00
5.00
Figure 8: The activism gap in the UK bychildren living at home
Source: European Social Survey, 2002. UK sample N. 2051.
Children living at home or not
Mea
n ci
vic
activ
ism
sca
le
Men
Women

in their early twenties are often little rooted in localcommunities, as students and younger workersoften need to be geographically mobile, usuallyrenting flats in the private sector rather than being owner occupiers or council house tenants,and often without children to link them to localschools. As people age they commonly start to settle down within particular areas, buyingproperty, taking out a mortgage or rentingcouncil houses, building families and developingsocial networks in the local community. In theirsixties and early seventies, ‘empty-nesters’entering retirement may lose some of their localties if they re-settle into smaller properties orretirement communities, as well as losing someof the physical mobility necessary for getting outto local meetings or political events. Moreover,the figure shows how women remain less activethan men in every cohort, suggesting that thegap persists throughout the life cycle.
Race and ethnicity
4.28 It is difficult to determine the influence ofrace and ethnicity on activism in the UK, due to the limited sample size and number of ethnicminority respondents contained in the ESS 2002.However, it is well known that ethnic minoritiesare usually marginalised in many forms ofpolitical participation, especially those groupslacking full citizenship rights or with particularlanguage barriers. The ESS asked a number of questions to monitor ethnicity, race andcitizenship, but the measure selected for thisreport concerned subjective ethnic identities,measured by whether the respondent said thatthey belonged to an ethnic minority group.
4.29 The results showed that belonging to an ethnic minority in the UK did not predictoverall levels of political activism. Nevertheless,when levels of activism were compared byethnicity and gender, among men there was no significant difference in participation butethnic minority women proved far less activethan other women.
Cultural attitudes4.30 Certain cultural attitudes may play animportant role in explaining activism, including a sense of psychological involvement and civicorientations which allow citizens to play a fullpart in representative democracy. These factorsinfluence whether people care about politicsand whether they feel capable of influencingpolitical processes. Previous studies, includingthose conducted on behalf of The ElectoralCommission, have commonly found that womenexpress less interest in politics than men.52
4.31 As many other studies have found, themost important cultural attitudes influencingactivism in the model in Table 14 (Appendix 2),after introducing the structural controls, provedto be patterns of political interest, a sense of civicduty and feelings of internal political efficacy.What seems to have the biggest influence onparticipation is the sense that citizens couldaffect the political process, that they had a dutyto become engaged and had an interest infollowing current affairs and keeping up withevents at Westminster (we will return to theseissues later in this report when we consider howfar the electoral choices, particularly therecruitment of women and men in elected office,can impact upon political attitudes in the mass
Gender and political participation: explaining the activism gap
41

Gender and political participation: explaining the activism gap
42
1920-29 1930-39 1940-49 1950-59 1960-69 1970-79 1980-89
0.60
0.80
1.00
1.20
1.40
1.60
1.70
1.80
2.00
Figure 9: The activism gap in the UK by birth cohort
Source: European Social Survey, 2002. UK sample N. 2051.
Cohort
Mea
n ci
vic
activ
ism
sca
le
Men
Women
electorate). By contrast, after entering thestructural controls, other cultural attitudes did notprove significant in predicting activism, includinginstitutional confidence and social trust.53
4.32 Many believe that non-participationindicates the public’s mistrust of parties andpoliticians, their lack of confidence in coreinstitutions such as Parliament and the legalsystem, or their lack of interpersonal or socialtrust. Yet the evidence in this analysis providesno support for these common assumptions; as others have found, levels of social trust and institutional confidence were unrelated to participation.54 A reason for this may be that mistrust is a sword that cuts both ways. If people feel that politicians are corrupt,Parliament is unaccountable and thatdemocracy in the UK is ineffective, they maydecide to opt out of the political system or,alternatively, they may seek to bring aboutpolitical reforms or vote politicians out of office.The phenomenon of ‘critical citizens’ or‘disenchanted democrats’ has been widelyobserved in many advanced industrialisedsocieties, representing those people with high ideals for democracy who at the sametime express minimal confidence in parties,Parliament and politicians.55
4.33 But do women and men differ in theirlevels of political interest, civic duty and feelingsof internal political efficacy? Table 8 overleafcompares gender differences in civic attitudesusing a range of cultural indicators. Thepatterns show that women do indeed have a weaker sense of internal efficacy, meaningthat they have lower confidence that they can
influence the political process through their own actions. Also, as many studies have found,compared with men, women also expressedless interest in politics. Men were also morelikely to regard politics as important and to trust a range of political institutions, although we have already observed that these attitudes are poor predictors of activism. On the remaining indicators, there were nosignificant differences between the sexes.
4.34 Whether there is also a gap betweenwomen and men’s level of political knowledge is widely debated, largely because there is littleagreement in the literature about what formssuitable benchmarks for measuring this. Threedifferent perspectives on this problem can be identified from the literature. The ‘civics’approach assumes a single narrow type of‘ideal’ information about government andpublic policy that all citizens need to know. Alternatively, the ‘relativist’ stance acknowledgesthat people have a limited reservoir of politicalinformation but suggests that this is sufficient for people to cast a meaningful ballot.
4.35 A third way of approaching the problem of measuring political knowledge is to definethe ‘practical’ knowledge citizens need to makeinformed judgments about the consequencesof their actions in multiple roles, for example as claimants of welfare benefits, as consumers of genetically modified food or as activistsconcerned about global warming, as well as in their role as electors.56
Gender and political participation: explaining the activism gap
43

4.36 Evidence from a series of Eurobarometersurveys suggests that, after applying a series ofprior social controls, women usually know lessthan men about certain dimensions of politicalinformation – particularly about EU institutions,EU rights as citizens and about the issue of theeuro. By contrast women often knew more thanmen about social issues.57
Mobilising agencies4.37 Mobilising agencies include organisationssuch as parties, churches and unions that areboth a direct form of political activism and alsoan important indirect influence upon otherforms of participation.58
4.38 The process of political communication,through the news media and through informalpersonal discussions with friends, neighboursand colleagues are also thought capable of
activating and mobilising citizens. As Rosenstoneand Hanson argue: ‘Citizens participate inelections and government both because theygo to politics and because politics goes to them’.59
4.39 We have already established that men and women in the UK differ in their formalmembership of political parties and voluntaryassociations. These provide connections thatcan recruit people into other forms of politicalparticipation – for example Verba found thatchurches and voluntary organisations providenetworks of recruitment, with those drawn into the political process through theseassociations developing the organisational and communication skills that facilitate further activity.60 Inglehart and Norris havealso documented marked gender differences in membership of parties and in various typesof voluntary associations in many post-industrial
Gender and political participation: explaining the activism gap
44
Women Men Gap Sig.Internal political efficacy (10-point scale) 5.01 5.82 -0.81 ***Interest in politics (4-point scale) 1.32 1.62 -0.30 ***Importance of politics (10-point scale) 3.48 4.04 -0.56 ***Trust in national political institutions (20-point) 9.41 9.99 -0.58 ***Civic duty scale (60-point scale) 39.58 38.67 +0.91 N/sExternal political efficacy (10-point scale) 4.78 4.72 -0.06 N/sSocial trust (30-point scale) 15.99 16.16 -0.17 N/sTrust in international political institutions (20-point) 8.95 8.80 -0.15 N/sNote: The figures represent the mean score for women and men on civic attitude scales. A positive gapindicates that women have stronger civic attitudes than men. A negative gap indicates that women haveweaker civic attitudes than men. Significance measured by ANOVA *** =.001 ** =.01 * =.05, N/s =Not significant. Source: European Social Survey, 2002. UK sample N. 2051.
Table 8: Gender gaps in civic attitudes in the UK
societies, finding similar patterns to thoseevident in the UK. Evidence from the WorldValues Surveys show that women today remainless likely than men to belong to sports orrecreational clubs, the peace movement,professional associations, trade unions andlocal community action groups, as well aspolitical parties; although at the same time theywere also more likely to belong to religiousorganisations and welfare groups.61 Thesedifferences are likely to influence patterns ofelectoral turnout where these groups engage in campaign activities, for example where trade unions provide volunteers and activists to help in election canvassing.
4.40 The news media may also be capable ofinfluencing political activism. On the positiveside, it may act as a mobilising agency bystrengthening civic participation, providinginformation about current affairs, expandingawareness of political issues and increasingknowledge about electoral choices, therebyreducing the hurdles to activism. Yet theories of ‘media malaise’ commonly suggest that it is often to blame for problems of civicengagement by nurturing apathy and distrust.62
4.41 The results of the model in Table 14(Appendix 2) suggests that in the context of the UK, after controlling for social and culturalfactors, neither the amount of attention paid topolitics on the TV or in newspapers had either apositive or negative direct effect on patterns ofactivism. However, there was modest butstatistically significant impact produced byattention to politics in radio news. Thus, while it is often fashionable to claim the media
is responsible for civic woes, the evidenceexamined here does not support this assertion.
4.42 On the other hand, even after controllingfor interest, personal communications throughsocial networks and informal politicaldiscussions do seem critical for mobilisation,although there could be a reciprocal effect atwork here. Both of these factors provedsignificantly related to activism.
4.43 Do women and men differ in theirconnections to mobilising agencies? Table 9overleaf looks at the evidence for this. There are many reasons to believe that women andmen may differ in their social networks. Womenworking in the home, particularly those withheavy family responsibilities arising from care of children or the elderly, may become sociallyisolated beyond their immediate family andcommunity, while women in employmentoutside the home often have more socialopportunities to mix with co-workers, advisorsand friends.63 Entry into the paid workforceshould expand social networks outside thehousehold and local community, as well asencouraging membership in unions andprofessional associations.64 Yet the comparison of the strength of male and female informalsocial networks in the UK shows that nosignificant difference is apparent.
4.44 The gender gap in media use is clearerand more consistent: women are less exposedto politics through television news, radio newsand newspapers. The ‘uses and gratifications’approach emphasises that patterns of priorinterest drive media use and attention, and it
Gender and political participation: explaining the activism gap
45

seems likely that women’s lower interest in politicsmeans that they are less attentive in followingcurrent affairs and events in the news media.Nevertheless, as observed earlier, exposure tonews appears unrelated to patterns of activism.
Patterns of electoral turnout
4.45 Are similar factors to those influencingoverall levels of political activism also affectingvoting turnout? We might expect considerabledifferences, given the nature of voting as a lowcost, less demanding act than other forms ofparticipation. To investigate this question, similarprocedures were followed as before (summarisedin Tables 16 and 17 in Appendix 2).
4.46 The results in Table 16 (Appendix 2) showthat the factors best predicting electoral turnoutoverall were a range of social structural factorsthat many others have emphasised, notablyage, income, class status, work status and
marital status. In addition, certain culturalattitudes also proved important, including civicduty and political interest. By contrast, the roleof mobilising agencies proved insignificant, as did many of the other cultural factors often thought important, such as efficacy and political trust.
4.47 We have already established that there isno overall gender gap in voting turnout. Table 17 (see Appendix 2) confirms further thatthere were few significant and consistentgender differences in voting among sub-groups of women and men beyond incomeand education. Ethnicity, however, does seemto be important with ethnic minority women far less likely to vote than ethnic minority men.
4.48 To check the reliability of these findings onethnicity given the limited sample size in the ESS,we can compare the validated voting turnout
Gender and political participation: explaining the activism gap
46
Women Men Gap Sig.Social networks, meet with friends etc (7-pt scale) 5.16 5.09 +0.07 N/sDiscuss politics, how often (7-point scale) 2.56 3.05 -0.49 ***Exposure to politics in TV news (7-point scale) 2.09 2.33 -0.24 ***Exposure to politics in radio news (7-point scale) 1.53 1.87 -0.34 ***Exposure to politics in newspapers (7-point scale) 1.03 1.26 -0.23 ***Church membership 0.17 0.10 +0.07 ***Trade union membership 0.15 0.15 0.00 N/sNote: The figures represent the mean score for women and men in exposure to mobilising agencies. A positive gap indicates that women have stronger exposure to mobilising agencies than men. A negativegap indicates that women have weaker exposure to mobilising agencies than men. Significance measured by ANOVA *** =.001 **= .01 * =.05, N/s =Not significant. Source: European Social Survey, 2002. UK sample N. 2051.
Table 9: Gender gaps in relation to mobilising agencies in the UK

monitored by the 1997 BES that contained abooster sample among ethnic minorities. Table10 shows that, while there was a significant 8% voting gap among black women and blackmen, there were no significant differences bygender among white and Asian populations.
Institutional context4.49 There are many reasons why institutionalcontext could create opportunities and barriers inrelation to women and men’s political activism.Here we will focus on two distinct aspects: thenumber of women in visible leadership positionsand the registration and electoral process.
Women in office
4.50 The candidate recruitment process, inparticular whether candidates and Members ofParliament reflect the society from which they aredrawn, could play an important role in dampeningor encouraging turnout. Burns, Schlozman andVerba found that women seeking or holdingelected office in American politics have an impactupon the political participation of women at the mass level – boosting women’s politicalinterest, knowledge of candidates and sense of political efficacy.65 They reason that more
visible women in politics may act as rolemodels sending signals to women citizens thatpolitics is an arena open to them. Alternatively,the presence of women in public office mightsuggest to women that their interests will bereflected in the policy-making process.
4.51 One way to explore whether similarprocesses are at work in the UK is to examinecommon indicators of civic engagement – suchas levels of voter turnout, campaign interestand voluntary campaign work – among womenand men in the electorate. We have done thisusing 2001 BES survey data, subdividing thoseconstituencies where a male or female MP waselected to Parliament.
4.52 The results in Table 11 confirm that inseats where a woman MP was elected toParliament, female turnout was 4% higher than male turnout – a modest but statisticallysignificantly difference. By contrast, in seatswhere a male MP was elected to Parliament there was no gender gap in turnout.
Gender and political participation: explaining the activism gap
47
% Validated voting turnout in the 1997 general election… Women Men Gap Sig.White 75 74 +1 N/sAsian 83 85 -2 N/sBlack 72 80 -8 **Note: Significance **=0.1, N/s=Not significant.Source: The British Election Study, 1997.
Table 10: The turnout gap in Britain by race and ethnicity

4.53 Of course, the pattern could always be spurious if something else, such as themarginality of the seats held by women MPs, was generating these results. But in fact thispattern was confirmed in regression models(not shown here) – even after introducingvarious controls, for example for the marginality of the seat.
4.54 In addition, it was not just turnout wherethe sex of the MP mattered as more generalpatterns of civic participation were also affected.Women proved far less interested in theelection campaign in seats where a male MP was elected, whereas this gender gapdisappeared where a woman MP was elected(see Table 11). Also, when asked whether theywould be likely to work for a candidate or party,women were less likely to volunteer in seatswith a male MP. In seats with a woman MP,however, the gender gap disappeared. Evenmore striking patterns were revealed whenpeople were asked whether they agreed ordisagreed with the statement ‘Governmentbenefits people like me’. In constituenciesrepresented by a female MP, women were far more likely than men to concur with thisstatement (49% compared to 38%). Where aman represented the seat, the gap reversed,and men were far more likely than women toagree (45% compared to 38%).
4.55 This consistent pattern across the differentindicators suggests that the election of womento office is important – not just symbolically forthe legitimacy of governing bodies nor evensubstantively for their impact on public policy –but also for encouraging participation by
women as citizens in democratic processes.Confirming patterns found in the United States, in those instances where women were elected to the Westminster Parliament this helped tomobilise and activate women in the electorate.
4.56 To see if this relationship held moregenerally, the activism gap, as measured by theESS 2002, was compared against the proportionof women in the lower house of parliament ineach country in the 19 nations included in thesurvey. Given the number of other factors thatcould explain both variations in political activismamong the general public as well as the election of women to office, we would expect not to find a very strong relationship between these factors.However, in fact, the results in Figure 10 on p50confirm a fairly strong relationship66 between the activism gap and the proportion of women in office.
4.57 The Scandinavian countries wereremarkably high on both scales, as observedearlier, and countries such as Ireland and theCzech Republic were characterised by a largeparticipation gap between women and men aswell as having few women parliamentarians.
4.58 The fit is far from perfect, given many otherpotential causes of these phenomena. Thepattern could also be spurious, if something else such as an egalitarian political culture isdriving both the success of women in office as well as their participation at mass level.Nevertheless, the fact that the cross-nationalpattern points in a similar direction to theconstituency-level analysis in the UK lends further confidence to this relationship.
Gender and political participation: explaining the activism gap
48

Electoral administration
4.59 Detailed aspects of electoral administrationmay also have a differential effect upon men andwomen’s participation,67 for example the locationof special polling stations in shopping malls,homes for the elderly or community centres; the use of proxy, transfer and advance voting;opportunities for remote electronic or all-postalvoting; whether polling is held on a work-day or rest day; registration procedures such as a rolling register; or the hours that polling stationsare open. The impact of these arrangements onmen and women’s participation has often beenneglected in previous studies. Nevertheless,surveys conducted on behalf of The ElectoralCommission allow us to investigate their impact.
4.60 Electoral pilot schemes trailling newmethods of voting and other administrative
Gender and political participation: explaining the activism gap
49
% Who Men Women Gap Sig.Reported having voted Male MP 74 74 0 N/s
Female MP 79 83 +4 *Very interested in 2001 general election Male MP 27 20 -7 ***
Female MP 19 22 +3 *Very unlikely to work for candidate/party Male MP 65 70 -5 *
Female MP 66 66 0 N/sVery likely to discuss politics Male MP 17 13 -4 *
Female MP 12 13 +1 N/sStrongly agree/agree with statement ‘Government benefits people like me’ Male MP 45 38 -7 ***
Female MP 38 49 +11 ***Note: Significance measured by ANOVA *** =.001 **= .01 * =.05, N/s =Not significant. Source: British Election Study 2001. Weighted for gender.
Table 11: Men and women’s political engagement by gender of the MP
innovations provide evidence to evaluatewhether current electoral arrangements posebarriers to men and women’s participation.Local elections are characteristically low-salience events where only a third of theelectorate usually cast a ballot. Pilot schemesprovide an exceptionally good test of the effectsof modernising electoral administration andvoting facilities on levels of participation.
4.61 During the English local elections in May2003, 59 local government areas conductedpilots. These experimented with alternativeways of facilitating remote electronic voting,including the use of the internet from home andpublic access sites, interactive digital television,SMS text messaging and touch-tone telephones.Other innovations were also piloted including all-postal ballot voting and extended voting periods.

Gender and political participation: explaining the activism gap
50
Low % Of women in the lower house high50403020100
.3
.2
.1
.0
1
.2
.3
.4
.5
.6
-
-
-
-
-
-
-
.7
-.8-.9
Slov
Greece
Low
P
oliti
cal a
ctiv
ism
gap
h
igh
Isr
UKPol
Hung
Czech
Por
Ire
Sp
Ger Neth
Swi
Den
Nor
SweFin
Lux
Religious culture
Jewish
Orthodox
Protestant
Roman Catholic
Italy
.
Figure 10: The activism gap and women’s representation – the comparative perspective
Note: See Table 1 and Appendix 1 for the components of the Political Activism Index. Apositive gap indicates that women are more active than men. A negative gap indicatesthat women are less active than men. The proportion of women elected to the lowerhouse of parliament is derived from the Inter-Parliamentary Union, 2002. Rsq=0.3632Source: European Social Survey, 2002. Pooled sample N.36,701. Rsq=0.3632

All-postal schemes remove the need for citizensto apply for a mail ballot – instead, localauthorities provided all citizens on the electoralregister in an area with the automatic ability tocast a postal ballot during an extended periodof about two weeks prior to close of poll.
4.62 Outside the pilot areas the public voted in the traditional way by marking a cross onstandard paper ballots in local polling stations.Among other things, it was hoped that the use of new voting facilities in the pilot areas wouldstrengthen turnout by making voting moreconvenient for citizens. By using a telephone,computer, or digital television to cast a ballot from home or the workplace, citizens couldreduce the time and effort traditionally required to participate in person at the polling station.This may help overcome problems of socialexclusion, especially for those with limitedmobility such as the elderly, caregivers confinedto the home by dependent relatives, or employeesand shift-workers with little flexibility in their workhours, as well as for those who are travelingaway from home or are resident overseas.
4.63 The effect of these pilot schemes is evidentfrom levels of turnout in the May 2003 localelections and from a MORI post-election survey conducted on behalf of The ElectoralCommission.68 Figures confirm that the use ofall-postal voting facilities had a significant andstrong impact on turnout, increasing it byapproximately 15% on average from theprevious comparable election in each area.
4.64 Further analysis of the MORI survey datasuggests that the introduction of electronic and all-postal voting in selected areas had adifferential effect upon young and old.69 Due to patterns of greater female longevity, the use of different ways of casting a ballot alsohad a significant indirect impact upon men andwomen’s voting participation. As mentionedearlier, in the May 2003 local elections, overallvoting turnout was about 8% higher for womenthan for men.
4.65 Table 12 overleaf shows that the resultsvaried a great deal by the type of pilot schemethat was used in each area. In all postal-votingareas, where citizens automatically received apostal ballot, women’s turnout was 13% higherthan men’s, while women’s turnout was aremarkable 24% higher in areas using bothremote electronic voting and postal ballots. By contrast, in areas using only remoteelectronic voting facilities, such as textmessaging and internet voting, women’sturnout was 5% less than men.
4.66 This pattern illustrates how apparentlysimple changes in electoral administration maypossibly generate differential effects uponwomen and men’s voting turnout.
Gender and political participation: explaining the activism gap
51
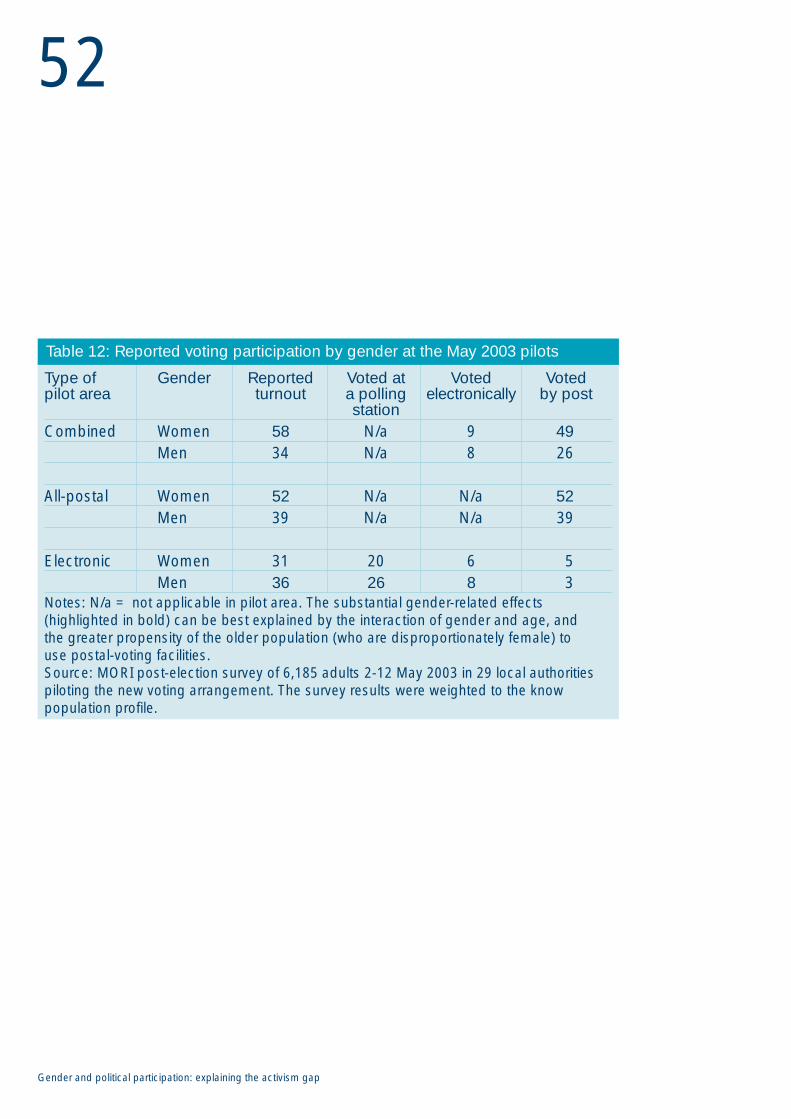
Gender and political participation: explaining the activism gap
52
Type of Gender Reported Voted at Voted Votedpilot area turnout a polling electronically by post
stationCombined Women 58 N/a 9 49
Men 34 N/a 8 26
All-postal Women 52 N/a N/a 52Men 39 N/a N/a 39
Electronic Women 31 20 6 5Men 36 26 8 3
Notes: N/a = not applicable in pilot area. The substantial gender-related effects(highlighted in bold) can be best explained by the interaction of gender and age, and the greater propensity of the older population (who are disproportionately female) to use postal-voting facilities.Source: MORI post-election survey of 6,185 adults 2-12 May 2003 in 29 local authoritiespiloting the new voting arrangement. The survey results were weighted to the knowpopulation profile.
Table 12: Reported voting participation by gender at the May 2003 pilots

5 Case studies
The findings of this report havehighlighted that women remain lessactive in formal politics than men,as well as being less interested innational politics. The following casestudies are presented as examplesof attempts in the UK to mobilisewomen’s political participation.
5.1 This chapter does not aim to provide anexhaustive critique of current activity but only tohighlight examples of initiatives undertaken bypolitical parties, trade unions, women’s groupsand other organisations to promote women’spolitical activity at both grassroots and atleadership level. These practices are interrelated,since we have demonstrated that the number ofwomen visible in political leadership roles helpsmobilise women more generally.
Political parties5.2 The main UK political parties make targetedappeals to women as electors, members andcandidates. Party organisations usually haveoffices and committees with briefs to servicewomen members, to promote women’srepresentation and to identify and respond to the interests of women voters. Party initiativesare mainly aimed at women who are alreadymembers, however some initiatives arespecifically designed to encourage interestamong those currently less engaged inpolitics and to recruit new women members.
5.3 Table 13 summarises the number of womennominated and elected by the three majorparties in recent UK general elections.
The Conservative Party
5.4 After the 2001 general election there were a total of 166 Conservative Party MPs atWestminster. Of these, 14 were women (8.4%),representing a numerical decline since 1987.Equal opportunity policies are emphasised in the Conservative Party’s selection process, suchas equal access for candidate training.
Gender and political participation: case studies
53
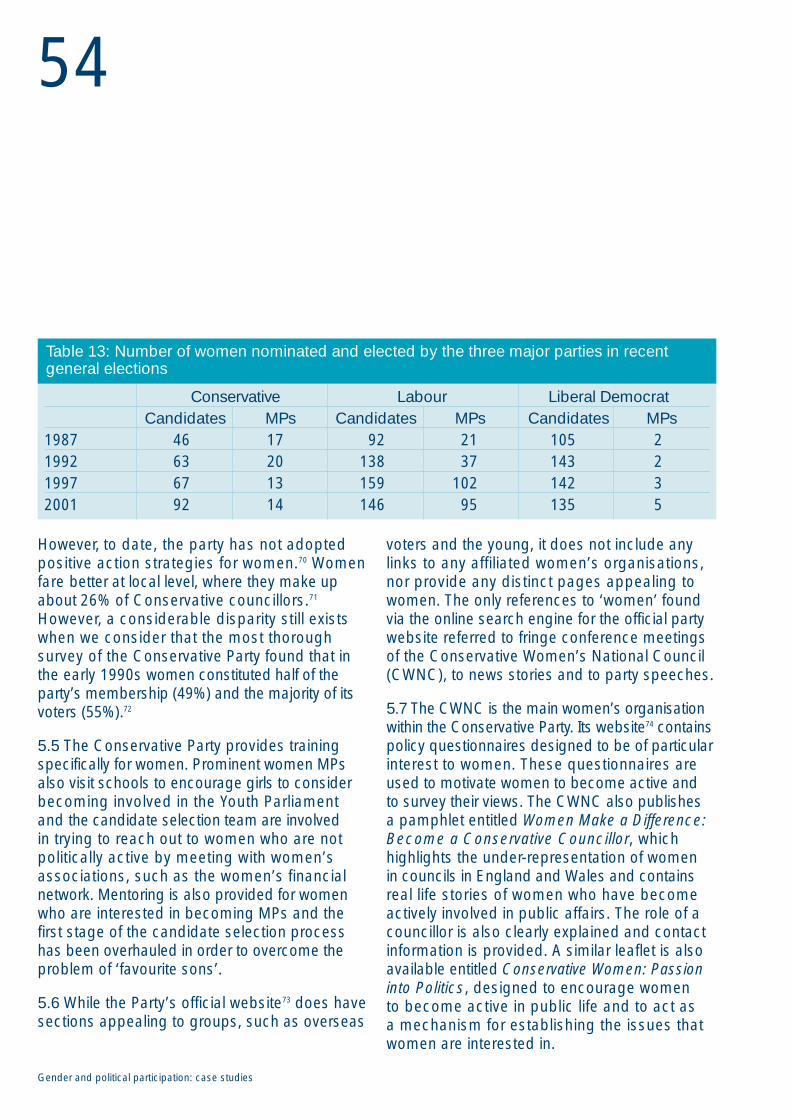
However, to date, the party has not adoptedpositive action strategies for women.70 Womenfare better at local level, where they make upabout 26% of Conservative councillors.71
However, a considerable disparity still existswhen we consider that the most thoroughsurvey of the Conservative Party found that inthe early 1990s women constituted half of theparty’s membership (49%) and the majority of itsvoters (55%).72
5.5 The Conservative Party provides trainingspecifically for women. Prominent women MPsalso visit schools to encourage girls to considerbecoming involved in the Youth Parliament and the candidate selection team are involved in trying to reach out to women who are notpolitically active by meeting with women’sassociations, such as the women’s financialnetwork. Mentoring is also provided for womenwho are interested in becoming MPs and thefirst stage of the candidate selection processhas been overhauled in order to overcome theproblem of ‘favourite sons’.
5.6 While the Party’s official website73 does havesections appealing to groups, such as overseas
voters and the young, it does not include anylinks to any affiliated women’s organisations,nor provide any distinct pages appealing towomen. The only references to ‘women’ foundvia the online search engine for the official partywebsite referred to fringe conference meetingsof the Conservative Women’s National Council(CWNC), to news stories and to party speeches.
5.7 The CWNC is the main women’s organisationwithin the Conservative Party. Its website74 containspolicy questionnaires designed to be of particularinterest to women. These questionnaires areused to motivate women to become active and to survey their views. The CWNC also publishesa pamphlet entitled Women Make a Difference:Become a Conservative Councillor, whichhighlights the under-representation of women in councils in England and Wales and containsreal life stories of women who have becomeactively involved in public affairs. The role of acouncillor is also clearly explained and contactinformation is provided. A similar leaflet is alsoavailable entitled Conservative Women: Passioninto Politics, designed to encourage women to become active in public life and to act as a mechanism for establishing the issues thatwomen are interested in.
Gender and political participation: case studies
54
Conservative Labour Liberal DemocratCandidates MPs Candidates MPs Candidates MPs
1987 46 17 92 21 105 21992 63 20 138 37 143 21997 67 13 159 102 142 32001 92 14 146 95 135 5
Table 13: Number of women nominated and elected by the three major parties in recentgeneral elections

The Labour Party
5.8 At present, women make up roughly 40% of Labour party members, 25% of itscouncillors, and 23% the Party’s MPs.75
Although the use of positive action strategies hasproved controversial in the party, the adoptionof all-women shortlists in the selection processfor parliamentary candidates in the run up to the 1997 general election (subsequentlydiscontinued) did help to generate a recordnumber of Labour women MPs (102). However,the 2001 general election saw a slight retreatfrom this number rather than further gains.76
5.9 The current Labour Party policy, applying to the run up to the next general election, is tointroduce all-women candidate shortlists in aminimum of 50% of the seats in England andWales where Labour MPs retire.77 Labour is alsoextending positive action to the selection of localcouncillors, especially in strong Labour wards.
5.10 The Labour Women’s Organisation worksacross the Party, encouraging the establishmentof women’s forums within local communities.78 Inaddition, the Labour Women’s Network providestraining, seminars and publications targeted atwomen. Publications, including Women’s Placeis in the House and Women’s Place is on theCouncil, explain the roles of MPs and councillorsand give advice about how to gain elected office.
5.11 As well as developing policies to increaseand maintain women’s representation throughoutits internal organisation and in elected office,the Labour Party has also undertaken initiativestargeted at women voters. In the mid-1990s, theShadow Women’s Minister toured the country to
speak at meetings organised by local non-partisan women’s organisations such as theWomen’s Institute. The results were publishedby the Party in the document Listening toWomen. In 2001 a special manifesto was alsoproduced for women, as part of an effort by theParty to attract their votes.
The Liberal Democrats
5.12 After the 2001 general election, there were five women MPs in the Liberal DemocratParty (constituting 9.6% of the total). Despitegrowing support inside the Party, the LiberalDemocrats stopped short of positive action inthe selection of women candidates in all contestsexcept the 1999 European elections. For theelections to the Scottish Parliament, the NationalAssembly for Wales and to Westminster in 1997and 2001, action to equalise representation waslimited to voluntary measures. However, thenumber of women selected by the party to standfor seats at the next general election currentlystands at 12% higher than that at the lastgeneral election. Also, the Liberal Democratsrecord is stronger at local government level,where women are one-third (34%) of all theirlocal councillors, the highest level currentlyamong the major parties.79
5.13 For the 2001 general election, the LiberalDemocrats produced a separate manifestotargeted specifically at women. This documentfocused on issues such as health, employment,education, poverty, crime, civil liberties, pensions,long-term care costs, the strengthening anti-discrimination legislation and the reforming ofthe tax system for people on low incomes. This manifesto was targeted at the interests of
Gender and political participation: case studies
55

women of all ages, with analysis of the BritishElection Study demonstrating that in 2001pensions were a priority for older women,whereas equal opportunities were most importantin influencing the vote choice of younger women.
5.14 Following the September 2001 partyconference, the Liberal Democrats also initiated a Gender Balance Task Force (GBTF) to achieve the party’s targets for women’srepresentation. The GBTF provides trainingand mentoring for women who are interested inseeking elected office, providing them with theskills and knowledge of the rules of the system so that they can fight effective selectioncampaigns. Also, to encourage more womenmembers to consider standing for elected officethe GBTF has stalls at regional and nationalconferences, and also runs fringe meetings.
5.15 Working within the Party is Women LiberalDemocrats (WLD), an organisation aimed atpromoting women’s issues onto the policyagenda and encouraging women members to become more active within the Party.80
WLD provide training events, networkingopportunities and literature for their womenmembers, as well running a support campaign,‘Women in Target Seats’.
5.16 Recent initiatives to encourage women toget involved at all levels include a mailing to allwomen members from Party Leader CharlesKennedy and the development of extensivesupport networks for women candidates. Trainingis also available for potential women candidatescovering all aspects of campaigning, as well asinterpersonal, presentation and ‘technical’ skills,including understanding how the party works.
Trade unions and other organisations5.17 Various initiatives and strategies havebeen introduced by trade unions and otherorganisations to address gender balanceissues and to encourage participation morewidely. Examples of such are outlined below.
The Fawcett Society
5.18 The Fawcett Society is one of the mainlobbying groups in Britain that has longcampaigned for equality between the sexes.81
At the time of writing it was undertaking anumber of initiatives to encourage women,particularly young women, to become moreinterested in politics. One of these is the EqualCitizen website,82 which is designed to assistcitizenship education in secondary schools.This website is informative, accessible and hasa magazine format. Students are led throughthe different ways they can become politicallyactive, from signing a petition to making aspeech, and it attempts to promote a sense of political efficacy by aiding students to identifyissues that are important to them and the stepsthey can take to have their say.
5.19 The Fawcett Society has also securedfinance through The Electoral Commission’sNew Initiatives Fund for a project working withthe Women’s Library, a cultural resource centreon women’s history. This project will include thedevelopment of a website and the staging ofevents designed to encourage women in Londonto ‘Value their vote’.
Gender and political participation: case studies
56

The Equal Opportunities Commission
5.20 The Equal Opportunities Commission(EOC) is a statutory body working to eliminatesex discrimination in Britain. It takes landmarklegal cases under the Sex Discrimination Act andthe Equal Pay Act, as well as commissioningresearch across a range of policy areas. As anorganisation the EOC works with all of the mainpolitical parties towards achieving balancedrepresentation of women and men in political life.
5.21 In 2001 the EOC produced a literaturereview of women’s representation in nationallegislative bodies.83 This report called for politicalparties to give public support to, and to adopt,both affirmative action and positive actionmeasures to achieve balanced representation.
5.22 Subsequently, in 2002 the EOC publishedMan Enough for the Job? providing a detailedanalysis of results from qualitative andquantitative research conducted amongparliamentary candidates and newly elected MPs.This research examined potential discriminationin party selection procedures and measuredlevels of support for positive action.
5.23 In 2003 EOC Wales also producedChoose a Winner: Selecting Political Candidatesand EOC Scotland published An Equal Chance:Your Guide to Promotion, Selection and Electionof Women Candidates. Both guides make thecase for gender balance in public and politicalrepresentation and suggest practical steps thatboth political parties and individuals can take toachieve this.
The Women’s National Commission
5.24 The WNC publishes Women in Public LifeToday: A Guide.84 This provides a reference pointdesigned to encourage more women to becomeinvolved in public life. A comprehensive list ofpublic bodies is supplied and practical adviceabout filling out application forms is given. A section is devoted to real life stories ofwomen who have become involved in publiclife and the particular contribution women canmake to public life is emphasised.
The Women and Equality Unit
5.25 The Women and Equality Unit, an officialgovernment body working under the Ministersfor Women, has produced a pack of lesson-plans for teachers to use in class to celebrateInternational Women’s Day. One of the lessonplans outlines the unequal representation of the sexes in public life and in elected office. It also provides information on how youngpeople can become active in politics through the UK Youth Parliament.85
The Local Government Association
5.26 The Local Government Association (LGA)has published a report entitled Representingthe People: Democracy and Diversity examining the lack of diversity in council chambers andidentifying a series of recommendations, whichare currently being implemented by the LGA.
5.27 The report highlights that although thepercentage of women councillors in England and Wales has been gradually rising over time (now standing at 27%), there existsconsiderable variation across different councils
Gender and political participation: case studies
57

in terms of the proportions of men and womenrepresentatives, with councils continuing to suffer from a high turnover of womencouncillors. A possible explanation for this canbe found in the results of qualitative researchundertaken by the LGA, suggesting that manywomen councillors were unhappy with theattitudes of male colleagues towards them, as well as the work-life balance the role offers,the timing of meetings, and the aggressiveculture of many councils.
5.28 The LGA report recommends that councilsand local parties should introduce a series of measures to increase participation amongwomen and minorities, including: developingmore transparent recruitment and selectionprocedures, providing opportunities for interestedmembers of the public to shadow councillors,developing mentoring schemes, monitoring any positive action or positive discriminationstrategies, introducing specific training budgetsfor councillors, improving childcare allowances,and reviewing meeting times.
The Transport and General Worker’s Union
5.29 The TGWU has introduced a number ofinitiatives designed to encourage womenmembers to become politically active.86 Mencurrently dominate the organisation, representingover three-quarters of the membership.However, structures have been put in place to facilitate women gaining access to decision-making and leadership positions. The newconstitutional rules, agreed in 1998, specifythat women must make up at least the sameproportion of committees and conferencedelegates as there are in relevant industries.
The Union has also expressed the desire towork towards a membership that is made upof equal numbers of men and women, not leastbecause the areas of work that they represent are becoming less male dominated. Currentinitiatives on the part of the Union includedrives to recruit more members from low-paidjobs in cleaning and catering, the food industry,pharmaceuticals, child-care organisations andresidential care homes, as well as campaignsdefending the rights of part-time workers.
5.30 Current TGWU policies also include thoseaimed at changing its organisational culture andimage. The Union wants to be identifiable as a‘union for women like me.’ They have undertakenqualitative research to establish why so manypart-time workers (mainly women) are not Unionmembers and how women react to theirpublications and general image. They found thatwomen want positive reasons for joining unions,such as information about the support that isavailable. In reaction to this and other findingsfrom this research, a women’s leaflet andmagazine have been designed. Whereasprevious Union publications took a tabloid paperstyle, the new magazine is specifically designedto appeal to women (although men also read it)and contains real-life stories about womenplaying an active role in the Union.
5.31 Although their research showed that womendo not necessarily see union membership as apolitical act, joining does make them more likelyto participate in politics. Being a member of theUnion also gives women an organised voicethrough the Women and Politics Committee. Also,within the industries represented by the Union,
Gender and political participation: case studies
58
the TGWU has helped women raise politicalconcerns with politicians, such as the Ministerfor Transport. Women officers are also availableto facilitate communication between the Unionand its women members.
5.32 In addition, the Union also providestraining courses for women both at local and national level. This training is advertised is several different ways, including via thewomen’s TGWU magazine and direct mailings to new members. Other resources are alsoprovided for women through Equalities Officers,based at both national and regional level. In the past these have arranged talks for womenmembers by women MPs and councillors,explaining how they got involved in politics and how they manage the balance betweentheir work and domestic lives. The Union alsoconducts ‘listening to women’ exercises withthe participation of women’s organisations,women’s aid and childcare campaigning groups.
The National Assembly for Wales
5.33 The Government of Wales Act 1998 places the National Assembly under a uniquestatutory duty to ensure that its functions areexercised with regard to equality of opportunityfor all people. The Assembly could be subjectto judicial review if it failed to comply.
5.34 The Equality of Opportunity Committee of the Assembly has sought to ensure that the Assembly sets an example of best practice in the way it ‘mainstreams’ equal opportunity in the conduct of its business and procedures.The Committee also oversaw the Assembly’sequal pay audits. Mandatory equality
awareness training has also been introduced forall civil servants, along with an opening up ofthe appointment process to attract candidatesfrom a wider range of backgrounds. TheAssembly has also launched a voluntary codeof equality practice for outsourced work.
5.35 In addition, a commitment to family-friendly working hours means that plenarybusiness is not scheduled beyond 5.30pmand recesses generally coincide with schoolholidays, including half terms.
5.36 It is also noteable that the NationalAssembly for Wales leads the world in terms of representation of women in nationallegislatures – exactly half of Assembly Membersare women, as are five out of nine WelshAssembly Government Ministers.
The Scottish Parliament
5.37 Many parliaments have established childcare facilities for members and officers, but the Scottish Parliament crèche facility hasgone one step further by providing childcarefacilities that are also available to members of the public who are visiting Holyrood.
5.38 As noted by Duncan McNeil MSP the crècheis ‘an important part of Parliament being open andaccessible to people in Scotland. For parents withyoung children, this service could be the crucialdifference between making your views known toParliament in person and being excluded from thedemocratic process’. This initiative will benefitparents who wish to visit their MSPs and maybe of particular value to women who generallybear the bulk of childcare responsibilities.
Gender and political participation: case studies
59

The news media
5.39 As has already been observed, womenreceive less civic information than men aboutpolitics and elections from the traditional newsmedia, as well as from the internet.87 Evidencefrom the 2001 British Election Study also confirmsthat women are less likely to read a dailynewspaper than men and report paying slightlyless attention to political news in the press and on television during election campaigns.88
5.40 Women’s magazines do not usually focuson overtly political news, but there are examplesof stories that seek to make politics relevant towomen. One such feature was published inGood Housekeeping Magazine in 2001, framedas ‘Why women hold the key to the election’.The article was based on a survey of women’svoting intentions and attitudes to politics. Thetone of the feature was positive and upbeat.Women were informed that ‘they have the power’to decide the election because more womenturnout to vote than men. The feature containedcriticism of mainstream news media, claiming‘Politicians and newspapers appear to thinkwe’re obsessed with taxation, petrol prices andthe Euro, but they need to reconsider. Almosttwo-thirds of women (60%) put health as theirnumber one priority, and even the youngestvoters agree’.89 This is an example of a storythat focused on how politics and elections are relevant to women and the important rolethey can play.
Gender and political participation: case studies
60

6 Implications
The persistent activism gap in theUK has significant consequences.This chapter explores some of theimplications and raises issues forthe future.
Summary6.1 In the UK, as in other countries, it used tobe thought that women were less politicallyactive than men. A series of studies from the1920s until at least the mid-1980s confirmedthis perception.
6.2 This report demonstrates that today, contraryto the received wisdom, women commonly castballots at equal, or even slightly higher levelsthan men in UK general, regional and localelections. Women are also equally or more activein many forms of cause-oriented activity, suchas signing petitions and consumer politics.
6.3 Nevertheless, 75 years after the granting of equal franchise, an overall and persistentactivism gap remains between levels of menand women’s political participation in the UK. For example, it has been shown that womencontinue to lag behind men in their levels ofinvolvement with political parties and in theirmembership of voluntary associations.
6.4 To place this in context, if the 19 Europeancountries included in the ESS 2002 are rankedaccording to their activism gender gap, the UKis located within the top third of these nations.This suggests that although progress has beenmade there remains further scope for eliminatingdisparities between men and women’s levels of political participation in the UK.
6.5 The persistent activism gap in the UK hassignificant consequences, since parties andvoluntary associations are important dimensionsof civil society. Membership of voluntaryassociations represents a central aspect of
Gender and political participation: implications
61

‘social capital’. Those who are less engaged in voluntary organisations and professionalassociations have weaker social networks andfewer opportunities.
6.6 This report has considered a number ofcase studies detailing initiatives undertaken by political parties, trade unions and otherorganisations in the UK designed to promotepolitical participation. We have focusedspecifically on initiatives designed to boostpolitical participation as defined in this report(see chapter 2), and in particular upon activitiesthat encourage women’s participation.
Implications 6.7 The persistence of a significant gender gap on political participation poses a problemfor government, parties and other mobilisingagencies in in the UK today. The followingparagraphs outline some policy implications ofthe research findings and make suggestions asto how organisations may go about tackling thisproblem. These are based on a considerationof the case studies outlined in this report andother initiatives and strategies by women’spolicy agencies and other organisations in theUK, Western Europe and the USA aimed atincreasing women’s participation.
Increasing the number of women representatives
6.8 The evidence suggests that the inclusion ofmore women at Westminster may be important,not just for symbolic legitimacy and substantivepolicy representation, but also for encouragingparticipation among women more generally.Therefore, strategies to increase the number
of women being selected and standing forelection may be necessary to address this issue.
6.9 Research has shown that the use of positiveaction policies in other countries has had asignificant effect on the proportion of womenelected to office and, in turn encourages widerparticipation among women as citizens.90
Positive action strategies include a range ofinitiatives that are designed to benefit women,usually as a temporary measure until such timeas gender parity is reached in legislative andappointed bodies. There are three mainstrategies: the use of reserved seats for womenestablished in electoral law (used, for example,in Pakistan); the use of statutory gender quotascontrolling the composition of candidate lists forall parties in a country (used, for example, inBelgium); and voluntary gender quotas used in the regulations and rules governing thecandidate selection process within specificparties (used by many European parties).
6.10 In the UK, only the latter has been tried, withsome success. Detailed analysis of the effects ofthese strategies were discussed in chapter 5 andare considered elsewhere.91 Here we note that,where implemented effectively, these strategiesmay lead to more women entering elected office.
6.11 Party initiatives to operate more transparentcandidate selection procedures, such as raising awareness of selection processes andpublicising application deadlines, to encouragethe participation and selection of under-represented groups, could also be effective in this regard. Additionally, the formalisation of job descriptions and the skills that the
Gender and political participation: implications
62
successful candidates need to meet, may helpto make the selection criteria more transparent.
Encouraging women as members and activists
6.12 In the UK and elsewhere initiatives havebeen taken to encourage women as activistsand as members of political parties and otherorganisations. In particular, strategies designed to raise awareness of women’s stake in politicsand to identify and highlight the politicaldimensions of women’s activism could besuccessful in this respect.
Successful strategies adopted by some partiesand voluntary associations to date include:
• Training programmes designed to providerelevant skills and experience to women whowish to enter elected and appointed office and to become more politically active. Forexample, useful skills for elected office includepublic speaking, media management, financialbudgeting, awareness of political institutionsand public policy processes, and substantiveknowledge of major policy issues. Suchtraining activities are found in all of the major political parties, with some trainingprogrammes being gender-neutral and somedesigned specifically for women. For example,the Conservative Party’s officials in charge ofcandidate selection have contacted women’sfinancial networks and given speechesencouraging women to become involved. The TGWU also provides political training forfemale members and Engender in Scotlandprovides training for women who are active in women’s groups but not in politics.
Examples of training initiatives by politicalparties, women’s policy agencies andwomen’s advocacy organisations abroadinclude Emily in Italia and programmeselsewhere in Italy and the Netherlands to trainwomen in politics and policy. Also, in theUnited States a range of training programmesare offered for women and men enteringlocal, state and Congressional elected office –for example the New Members of Congressprogramme offered every two years by theInstitute of Politics and the John F. KennedySchool of Government at Harvard University.The provision of women-only trainingprogrammes is beneficial in allowing women tofind their own political voice and can be usefulin the development of women’s networks.
• Internships allow young people to gain direct experience of working for Members ofParliament for a short period, as well as inparty research offices, the news media, publicbodies, election campaign headquarters,government departments and policy researchthink-tanks. Such experience can providedirect awareness of the work of theseorganisations, as well as furnishing contactnetworks and providing relevant research and communication skills. Compared with the situation in the United States, the UK has further scope for expanding opportunities for such internships and targeting thesemore specifically at young women, includingschool-leavers and university undergraduates.
• Mentoring schemes are offered by all of the UK political parties for women who areinterested in becoming MPs. These linkwomen who are interested in becoming
Gender and political participation: implications
63
involved with elected officials who can provideadvice and guidance. In the Netherlands,some parties provide opportunities for womenwho are considering running for office to ‘sitnext to’ a local or regional councillor for aweek, so that they become familiar with allaspects of the work.
• Monitoring and information campaigns run byorganisations such as the Equal OpportunitiesCommission, the International Institute forDemocratic and Electoral Assistance (IDEA)and Inter-Parliamentary Union highlightwomen’s stake in politics and the progress that has been made. Their research is madeavailable on the internet and is a resource fororganisations working for women’s politicalmobilisation. In France, the Observatoire de la parité monitors the presence of women inassemblies and commissions research onwomen’s political representation.
• Financial incentives build the inclusion ofwomen into any financial public subsidies givento parties. For example, in the Netherlandsduring the 1980s the central Women’s PolicyAgency, the Emancipatieraad, offered subsidiesto political parties to employ staff to devisestrategies to enhance women’s politicalparticipation. The subsidy was offered to allparliamentary parties thus avoiding difficultiesof partisan bias. Parties used the subsidy toestablish programmes to increase women’smembership and to encourage women to register to vote independently of theirhusbands. The initiative made parties aware of their relevance to women voters.
Modernising the culture and practices ofpolitical organisations
6.13 Alternative strategies have focused uponchanging the culture and practices of politicalorganisations, in order to encourage theinclusion of more women as members andactivists. Women’s support networks and groups may help overcome the perceived ‘male dominated’ nature of politics, as well as the maintenance of well-resourced women’ssections and offices.
6.14 Studies also suggest that women havemore limited time for political activity due to their dual roles of caring for children andelderly dependents, and their involvement in the paid workforce. In order to overcome thisproblem, some party branches, trade unionsand other community organisations haveintroduced crèches and childcare, or havevaried the timing and location of meetings.
6.15 Dutch political parties, for example, haveformulated positive action plans designed tofacilitate the participation of women members at branch level. Party meetings are set atsuitable times and locations, and childcarefacilities are provided. Some Dutch parties have also offered special membership fees for women without independent incomes.92
6.16 A commitment by UK political parties andother mobilising agencies to review theirmembership and participation strategies maytherefore be necessary to ensure that there areno barriers to women’s participation.
Gender and political participation: implications
64

Targeting and communication strategies
6.17 It can be difficult to identify women whomay be interested in participating in politics. Toensure that publicity materials and notificationof meetings reach these target groups someorganisations have targeted sectors wherewomen predominate, such as in part-time work,in the caring professions and lower down thepolitical hierarchy, as well as through women’snetworks and websites. The purpose of this has been to target women who are alreadyactive in public life but may not consider politics to be relevant to them.
6.18 Because women are more interested inlocal rather than national politics, using localcampaigns may motivate women to becomemore involved generally. Also, the sponsoring of get-the-vote-out campaigns prior to eachelection, targeted specifically at women andyounger voters, could be effective in makingelections more relevant to these groups and inturn may encourage their participation. Anycampaigns of this sort however should besensitive to differences in the political interestand efficacy of young men and women.
6.19 Strategies adopted by some organisationsto raise awareness of elections and encourageparticipation more generally have included theuse of magazine-style format publications andthe highlighting of issues that may be ofparticular interest to women.
Electoral modernisation
6.20 Making voting more accessible – forexample through the expansion of all-postalvoting, the provision of more conveniently
located polling stations, such as those inshopping malls and homes for the elderly –could encourage greater levels of participation,particularly among women.
6.21 In addition, efforts to simplify the registrationprocess could also be useful in raisingparticipation levels generally and in particularamong women. In 1995 the Chirac governmentin France altered voter registration law for youngpeople. Since then young people have no longerbeen required to register to vote on reachingthe age of 18 and people are able to vote uponpresentation of their identity cards. While thereis no systematic evidence on the effect of thischange, it is thought to have enfranchised more young women than young men.
6.22 Similarly, in the USA the 1993 NationalVoter Registration Act made voter registration easier. This legislation was predominantlyaimed at encouraging participation among the ‘poor and less educated’, women being a disproportionate section of both. Research on the effects of changes to voter registrationrequirements in the USA shows that women,especially younger and older women, are amongthe groups most advantaged by this legislation.
Research priorities 6.23 Further research expanding the approachescontained in this study, would be a valuablecontribution to the current evidence-base on the relationship between gender and politicalparticipation. Existing research focuses on the relationship between sex and participation,however we know far less about the relationshipbetween gender and political participation.
Gender and political participation: implications
65
Such analysis entails close attention to sub-groups where differences among womenand men may be as important as any foundbetween women and men. Moreover, similaritiesin aggregate data on women and men mayconceal sex differences in sub-groups thatcancel each other out and therefore create a false impression of similarity.
6.24 This research has also begun to explorethe reasons for the link between women inoffice and women’s mobilisation as citizens.This topic promises to be a very fruitful avenue for future research, for example through surveys and focus groups monitoring publicperceptions of elected representatives.
6.25 Future research in this area would ideallyinvolve survey sample sizes large enough topermit gender analysis and to enable racial,ethnic and youth sub-group analysis. One ofthe most effective techniques involves surveysemploying very large scale (10,000+) randomsamples of the population. An initial researchwave designed to identify activists, followed by in-depth survey interviews with the randomsub-sample of activists could be employed.Other valuable techniques include extendedmulti-wave panel surveys and also targetedresearch among demonstrators engaged inprotest events.
6.26 More multi-method observational, time-budget ‘diary’ and quasi-experimental researchin this area could also be beneficial. This wouldallow the examination of what people do, ratherthan what they say they do. Existing researchrelies heavily upon reported activity, which is
often systematically exaggerated due to socialbiases, or on claims about ‘potential’ activity.Experimental research techniques and the useconcrete examples embedded within surveysare some of the most powerful methodsavailable to develop more reliable indicators of political behaviour.
6.27 Also, existing research on politicalparticipation is concentrated on voting behaviourand the presence, and increasingly the activities,of representatives. Future research into activistsat intermediate levels of participation, includingwithin parties, voluntary organisations and non-government organisations, would be a valuablecontribution to the evidence base in this area.
6.28 In addition, The Electoral Commission’sresearch has indicated that registration levelsmay differ by age, class, race and sex. Furtherresearch is needed that provides reliableinformation about patterns of voter registration.Further research is also needed to provideinformation on women’s patterns of communityactivity and its connection to mainstreampolitical activity. Lastly, further experimental and focus group studies are needed to evaluatethe effect of publicity campaigns by variousmobilising agencies, such as those designed to raise turnout.
Gender and political participation: implications
66
Notes
1 Charles Edward Merriam. 1924. Non-Voting:Causes and Methods of Control. Chicago, Ill: The University of Chicago Press; Harold FooteGosnell. 1930. Why Europe Votes. Chicago, Ill: The University of Chicago Press; Herbert Tingsten.1937. Political Behavior: Studies in ElectionStatistics. Reprinted Totowa, NJ: Bedminster Press(1963); Kristi Andersen. 1996. After Suffrage.Chicago: University of Chicago Press.
2 Maurice Duverger. 1955. The Political Role of Women. Paris: UNESCO.
3 Sidney Verba, Norman Nie and Jae-on Kim.1978. Participation and Political Equality: A Seven-Nation Comparison New York:Cambridge University Press.
4 Samuel Barnes and Max Kaase. 1979.Political Action: Mass Participation in FiveWestern Democracies. Beverley Hills, CA: Sage.See also Alan Marsh. 1990. Political Action in Europe and the USA. London: Macmillan.
5 Geraint Parry, George Moyser and Neil Day.1992. Political Participation and Democracy in Britain. Cambridge: Cambridge UniversityPress. Pp.145-151.
6 Ronald Inglehart and Pippa Norris. 2003.Rising Tide: Gender Equality and CulturalChange Around the World. New York:Cambridge University Press.
7 For details see Joni Lovenduski. 2004.Feminising Politics. Oxford: Polity Press.
8 Carol Christy. 1987. Sex Differences in PoliticalParticipation: Processes of Change in FourteenNations. New York: Praeger; Margaret Conway,Gertrude A. Steuernagel and David Ahern.1997. Women and Political Participation.Washington, DC: CQ Press.
9 Center for American Women and Politics(CAWP) 2000. ‘Sex differences in votingturnout’. M. Margaret Conway, Gertrude A.Steuernagel and David W. Ahern. 1997. Womenand Political Participation. CQ Press. P.79.
10 For a summary of this literature and thecomparative evidence, see Ronald Inglehart and Pippa Norris. 2003. Rising Tide: GenderEquality and Cultural Change Around the World.New York: Cambridge University Press. For a discussion of the activism gap in the US seeNancy Burns, Kay Schlozman and Sidney Verba. 2001. The Private Roots of Public Action.Cambridge, NA: Harvard University Press.
11 See, for example, The Electoral Commission.2003. Attitudes to Voting and the Political Processin 2003. London: The Electoral Commission.
12 Charles Pattie, Patrick Seyd and PaulWhiteley. 2004. Citizens and Politics: Democracyand Participation in Twenty-First Century Britain.Cambridge: Cambridge University Press. See also Charles Pattie, Patrick Seyd and Paul Whiteley. 2003. ‘Citizenship and civicengagement.’ Political Studies 51 (3): 443-468.
13 It should be noted that the typology used bythe Citizen Audit has some overlap to the oneemployed in this study, although using differenttheoretical concepts. The Audit approachfocuses upon the type of act rather than itsbroader political objective. Hence, ‘individual’acts in the Audit are classified here as ‘cause-oriented’ and ‘collective acts’ in the Audit areclassified here as ‘campaign-oriented’ acts.
14 For example, the Citizen Audit reports that in Britain, 29% of women and 27% of men hadtaken part in an individual act (such as boycotting
Gender and political participation: notes
67
a product), while 4% of women and 6% of men had taken part in a collective act (suchas joining a party). These gender differenceswere modest in size but statistically significantat the .05 level, without any prior controls. Formore information see Charles Pattie, PatrickSeyd and Paul Whiteley. 2004. Citizens andPolitics: Democracy and Participation in Twenty-First Century Britain. Cambridge: CambridgeUniversity Press. Tables 3.5 and 3.18. See alsoCharles Pattie, Patrick Seyd and Paul Whiteley.2003. ‘Citizenship and civic engagement.’Political Studies 51 (3): 443-468.
15 Keith T. Poole and L. Harmon Zeigler. 1985.Women, Public Opinion, and Politics: TheChanging Political Attitudes of American Women.New York: Longman; Robert Shapiro andHarpreet Mahajan. 1986. ‘Gender Differences in Policy Preferences.’ Public Opinion Quarterly50:42-61; L. Jarvis et al. 2000. Women’s SocialAttitudes: 1983 to 1998. London: Cabinet Office.
16 Sidney Verba, Norman Nie and Jae-on Kim.1978. Participation and Political Equality: ASeven-Nation Comparison New York:Cambridge University Press.
17 See, for example, the conceptualisationsoffered in Pippa Norris. 2003. DemocraticPhoenix. Cambridge: Cambridge UniversityPress; Charles Pattie, Patrick Seyd and PaulWhiteley. 2004. Citizens and Politics: Democracyand Participation in Twenty-First Century Britain.Cambridge: Cambridge University Press.
18 ‘Costs’ in this report refers to the investment of money, time or other resources on the part of the individual, necessary to participate in acertain political activity.
19 Since the dimensions are theoreticallydefined and constructed, based on ourunderstanding of the role of different forms of participation in representative democracy, the study did not use factor analysis togenerate the classification or measurement.
20 For a discussion of patterns of politicalinterest, see Jan Willem van Deth.2000.‘Political interest and apathy: the decline of a gender gap?’ Acta Politica 35( 2): 247-274.
21 See, for example, Michael X. Delli-Carpiniand Scott Keeter. 1996. What Americans KnowAbout Politics and Why It Matters. New Haven,CT: Yale University Press; Pippa Norris. 2000. A Virtuous Circle. Cambridge: CambridgeUniversity Press. Chapter 10.
22 See in particular Peter Mair and Ingrid vanBiezen. 2001. ‘Party membership in twentyEuropean democracies 1980-2000.’ PartyPolitics. 7(1): 7-22; Susan Scarrow. 2001.‘Parties without Members?’ In Parties withoutPartisans. Eds. Russell J. Dalton and MartinWattenberg. New York: Oxford University Press.
23 Seminal works on this subject are: Robert D.Putnam. 1993. Making Democracy Work: CivicTraditions in Modern Italy. Princeton, NJ:Princeton University Press; Robert D. Putnam.1996. ‘The Strange Disappearance of CivicAmerica.’ The American Prospect, 24; Robert D.Putnam. 2000. Bowling Alone: The Collapse andRevival of American Community. NY: Simon andSchuster. More recent comparative research ispresented in: Susan Pharr and Robert Putnam.Eds. 2000. Disaffected Democracies: What’sTroubling the Trilateral Countries? Princeton, NJ:Princeton University Press; Robert D. Putnam.
Gender and political participation: notes
68

Ed. 2002. Democracies in Flux. Oxford: OxfordUniversity Press.
24 Robert D. Putnam is a Professor of PublicPolicy at Harvard University and has writtenextensively on the topic of civic engagement.
25 See Pippa Norris. 2002. ‘Women’s power at the ballot box.’ In Voter Turnout Since 1945.International IDEA: Stockholm; Pippa Norris.2002. Democratic Phoenix: Reinventing PoliticalActivism. NY: Cambridge University Press; PeterHall. 2000. ‘Social Capital in Britain’. In TheDynamics of Social Capital. Ed. Robert D.Putnam. Oxford: Oxford University Press.
26 C.A. Cassel. 1999. ‘Voluntary associations,churches, and social participation theories of turnout.’ Social Science Quarterly. 80(3): 504-517; B. Radcliff and P. Davis. 2000. ‘Labor organisation and electoral participation in industrial democracies.’ American Journal of Political Science. 44(1): 132-141.
27 Such separation may be rather arbitrary. An important debate turns on the argument that biological sex differences are not alsosocially constructed. For a discussion of theimplications of this debate for political science,see Joni Lovenduski. 1998. ‘Gendering researchin political science.’ Annual Review of PoliticalScience. 1:333-56.
28 These results are confirmed in a larger surveyof demonstrators. See Pippa Norris, StefaanWalgrave and Peter Van Aelst. 2004. ‘WhoDemonstrates? Anti-state Rebels, ConventionalParticipants, or Everyone?’ Comparative Politics(forthcoming). Similar findings are established in
Charles Pattie, Patrick Seyd and Paul Whiteley.2004. Citizens and Politics: Democracy andParticipation in Twenty-First Century Britain.Cambridge: Cambridge University Press.
29 Patrick Seyd and Paul Whiteley. 1992. Labour’sGrass Roots. Oxford: Oxford University Press;Joni Lovenduski and Pippa Norris. 1993. Genderand Party Politics. Thousand Oaks, Sage; R.Ward. 2002. ‘Invisible women: The political rolesof unionist and loyalist women in contemporaryNorthern Ireland.’ Parliamentary Affairs 55 (1):167+; Charles Pattie, Patrick Seyd and PaulWhiteley. 2004. Citizens and Politics: Democracyand Participation in Twenty-First Century Britain.Cambridge: Cambridge University Press.
30 Measures about sex differences in voluntaryassociations are heavily dependent upon thetype of organisations under comparison in eachsurvey. See Vivien Lowndes. 2004. ‘Getting onor getting by.’ British Journal of Politics andInternational Relations. Forthcoming.
31 For broader confirmation of these patternssee Ronald Inglehart and Pippa Norris. 2003.Rising Tide: Gender Equality and CulturalChange Around the World. New York:Cambridge University Press.
32 Pippa Norris and Ronald Inglehart. 2004.Sacred and Secular. New York: CambridgeUniversity Press.
33 Elina Haavio-Mannila et al.1985. Eds.Unfinished Democracy: Women in NordicPolitics. Oxford: Pergamon Press; LauriKarvonen and Per Selle. 1995. Women in Nordic Politics. Aldershot: Dartmouth; ChristinaBergqvist. et al. 1999. Equal Democracies?
Gender and political participation: notes
69

Gender and Politics in the Nordic Countries.Oslo: Scandinavian University Press.
34 Pippa Norris and Ronald Inglehart. 2004.Sacred and Secular. Cambridge: CambridgeUniversity Press.
35 The Electoral Commission and HansardSociety. 2004. An Audit of PoliticalEngagement. London. Available at:www.electoralcommission.org.uk. MORIinterviewed 1976 adults aged 18+ across the UK between 11 and 17 December 2003.Questions related to respondent’s knowledge,interest and participation in politics, as well as their sense of satisfaction and efficacy in relation aspects of the political process.
36 Unfortunately the type of hypotheticalquestions used in the BES (‘might you everdemonstrate, discuss politics, or join a consumerboycott?’) often prove to be poor predictors of real behaviour. These items often promptanswers that are regarded as socially acceptable,or just tap a more general orientation towards the political system, such as feelings of civic dutyor tolerance of protest politics. For a fullerdiscussion of this point see Samuel Barnes and Max Kaase. 1979. Political Action: MassParticipation in Five Western Democracies.Beverley Hills, CA: Sage; Christopher A. Rootes.1981. ‘On the future of protest politics in Westerndemocracies: A critique of Barnes, Kaase et al.,Political Action.’ European Journal of PoliticalResearch 9: 421-432.
37 Pippa Norris. 1999. ‘A gender-generationgap?’ In Critical Elections: British Parties andVoters in Long-term Perspective. Eds. GeoffreyEvans and Pippa Norris. London: Sage.
38 Kevin Swaddle and Anthony Heath. 1989.‘Official and reported turnout in the Britishgeneral election of 1987.’ British Journal ofPolitical Science 19(4): 537-551.
39 ICM post-election survey. See The ElectoralCommission. 2002. Scotland Votes? PublicAttitudes Towards Scottish Parliament Elections.
40 NOP post-election survey in Wales in May2003. See also The Electoral Commission.2002. Wales Votes? Public Attitudes TowardsAssembly Elections.
41 MORI Social Research Institute for TheElectoral Commission. 2003. Attitudes to Votingand the Political Process in 2003. London: TheElectoral Commission. P.18.
42 MORI interviewed a representative sample of approximately 200 adults aged 18+ in 29 of the 59 authorities which were piloting newvoting arrangements at the May 2003 elections.See The Electoral Commission. 2003. PublicOpinion and the 2003 Electoral Pilot Schemes.London: The Electoral Commission.
43 Telephone interviews were conductedbetween 15 and 18 September 2003 with 505respondents aged 18-24 across Britain (formore information see www.populuslimited.com).
44 Alternatively, a survey of 914 11-18 year oldsconducted by MORI on behalf of the The NestléFamily Monitor in 2003 found that boys wereless inclined to vote than girls. Of the boyssurveyed, 10% said that there were certain thatthey would not vote if there were a generalelection tomorrow, compared with 4% of girls.Young People’s Attitudes Towards Politics: TheNestle Family Monitor. Volume 16, July 2003.
Gender and political participation: notes
70
45 Firstly an ordinary least squares regressionmodel was developed with the Political ActivismIndex as the dependent variable. The model inTable 14 (Appendix 2) entered the most commonstructural, cultural and agency variables oftenthought to predict activism. Demographic factorsare entered first (gender, age and ethnicity). Thensocial-economic variables (education, income,class, work status, marital and family status andreligiosity) are entered as the standard variablesshaping the socialisation process during theformative years of childhood and adolescence.Cultural attitudes are then entered into the modelbefore agency factors. Due to the nature of theevidence, the impact of the institutional contextis evaluated separately later in this report,requiring different analytical procedures. The most important factors explaining politicalactivism are judged by the strength of thestandardised beta coefficients and theirstatistical significance.
46 Nancy Burns, Kay Schlozman and SidneyVerba. 2001. The Private Roots of Public Action.Cambridge, NA: Harvard University Press. P.359.
47 Nancy Burns, Kay Schlozman and SidneyVerba. 2001. The Private Roots of Public Action.Cambridge, NA: Harvard University Press.
48 Kay L. Schlozman, Nancy Burns and Sidney Verba. 1994. ‘Gender and Pathways to Participation: The Role of Resources.’Journal of Politics. 56: 963-990; Gill Steel. 2003.‘Class and Gender in British General Elections.’Paper prepared for the presentation at theMidwest Political Science Association AnnualMeeting. Chicago.
49 At the conventional .05 significance level.
50 See Mark N. Franklin. 2004. Voter Turnout and the Dynamics of Electoral Competition in Established Democracies since 1945.Cambridge: Cambridge University Press.
51 See discussions in W. M. Mason and S. E.Fienberg. 1985. Cohort Analysis in SocialResearch. New York: Springer-Verlag; D. F. Alwinand J. A. Krosnick. 1991. ‘Aging, cohorts, andthe stability of social-political orientations overthe life-span.’ American Journal of Sociology.97: 169-195.
52 See, for example, The Electoral Commission.2003. Attitudes to Voting and the Political Processin 2003. London: The Electoral Commission. Seealso The Electoral Commission. 2003. ScotlandVotes 2003. London: The Electoral Commission.
53 R. L. Miller, R. Wilford and F. Donoghue. 1999.‘Personal dynamics as political participation.’Political Research Quarterly 52 (2): 269-292.
54 Pippa Norris. Ed. Critical Citizens. Oxford:Oxford University Press.
55 Susan Pharr and Robert Putnam. Eds. 2000.Disaffected Democracies: What’s Troubling theTrilateral Countries? Princeton, NJ: PrincetonUniversity Press.
56 For a more detailed discussion of politicalknowledge by gender see Pippa Norris. 1999.A Virtuous Circle. New York: Cambridge UniversityPress. Chapter 10. Pippa Norris, John CurticeDavid Sanders, Margaret Scanmmell and HolliSemetko. 1999. On Message. London: Sage:Table 7.3. For a recent study based on the ‘civic’approach see Elizabeth Frazer and KennethMacDonald. 2003. ‘Sex differences in political
Gender and political participation: notes
71
knowledge.’ Political Studies. 51:67-83. For adiscussion about concepts and measures of knowledge see Michael Delli Carpini andScott Keeter. 1996. What Americans Know aboutPolitics and Why it Matters. New Haven, CT: YaleUniversity Press.
57 Similarly, patterns of a knowledge gap among women and men on civic items arereported by Frazer and MacDonald, by Norris et al. (1999) and in the Political Engagement Pollconducted by MORI for The Electoral Commissionand the Hansard Society in December 2003.See An Audit of Political Engagement. London:The Electoral Commission.
58 Steven J. Rosenstone, Steven J. and JohnMark Hansen.1993. Mobilisation, Participationand Democracy in America. NY: Macmillan; JoniLovenduski and Pippa Norris. 1993. Genderand Party Politics. Thousand Oaks, Sage.
59 Steven J. Rosenstone and John MarkHansen.1993. Mobilisation, Participation and Democracy in America. NY: Macmillan.
60 Sidney Verba, Kay Lehman Schlozman andHenry Brady. 1995. Voice and Equality: CivicVoluntarism in American Politics. Cambridge,MA: Harvard University Press; Nancy Burns,Kay Schlozman and Sidney Verba. 2001. ThePrivate Roots of Public Action. Cambridge,NA: Harvard University Press.
61 Ronald Inglehart and Pippa Norris. 2003.Rising Tide: Gender Equality and CulturalChange Around the World. New York:Cambridge University Press. Pp.101-126.
62 Pippa Norris. 2000. A Virtuous Circle.Cambridge: Cambridge University Press.
63 Gwen Moore. 1990. ‘Structural determinantsof men’s and women’s personal networks.’American Sociological Review 55: 726-35.
64 Kay L. Schlozman, Nancy Burns and SidneyVerba. 1999. “What happened at work today?” A multistage model of gender, employment, andpolitical participation.’ Journal of Politics 61 (1):29-53.
65 Nancy Burns, Kay Schlozman and SidneyVerba. 2001. The Private Roots of Public Action.Cambridge, NA: Harvard University Press.Chapter 13.
66 (R2 =.36)
67 Pippa Norris. 2004. Electoral Engineering.NY: Cambridge University Press; Mark N.Franklin. 2004. Voter Turnout and the Dynamics of Electoral Competition in EstablishedDemocracies Since 1945. Cambridge:Cambridge University Press.
68 MORI interviewed a representative sampleof approximately 200 adults aged 18+ in 29 ofthe 59 authorities which were piloting new votingarrangements at the May 2003 elections. Atotal of 6,185 interviews were conducted. Quotaswere set by age, gender and work status withc.100 voters and 100 non-voters interviewed ineach authority. Data are weighted by age, sex,working status to the known population profileand by turnout on 1 May 2003. Aggregate dataare also weighted by the population size ofeach pilot authority. Fieldwork took placebetween 2 -12 May, 2003.
69 Pippa Norris. 2003. ‘Will new technologyboost turnout? Evaluating experiments in e-voting v. all-postal voting facilities in UK local
Gender and political participation: notes
72
elections.’ Paper presented at the AnnualMeeting of the American Political ScienceAssociation, August 2003, Philadelphia. Anedited version of this paper is forthcoming inInternational IDEA. Voter Turnout Since 1945.Stockholm: International IDEA.
70 Joni Lovenduski. 2001. ‘Women and Politics:Minority Representation or Critical Mass?’Parliamentary Affairs. 54(1): 179-194; T. Keswick,R. Pockley and A. Guillaume. 1999. ConservativeWomen. London: Centre for Policy Studies.
71 Estimate provided by the Fawcett Society,www.fawcettsociety.org.uk
72 Paul Whiteley, Patrick Seyd and JeremyRichardson. 1994. True Blues: The Politics ofConservative Party Membership. Oxford: OxfordUniversity Press. Table 3.5 p.50.
73 www.conservatives.com
74 www.conservativewomen.co.uk
75 These estimates are derived from the LabourParty official website: www.labour.org.uk/labourwomen. The figures of the proportion of women members confirm earlier estimateswhere women were found to be 39% of Labourparty members: Patrick Seyd and Paul Whiteley.1992. Labour’s Grassroots. Oxford: Clarendon.Table 3.5 p39.
76 Pippa Norris. 2001. ‘Breaking the Barriers:British Labour Party Quotas for Women’. In HasLiberalism Failed Women? Assuring EqualRepresentation in Europe and the United States.Eds. Jyette Klausen and Charles S. Maier. NY: Palgrave. Pp.89-110.
77 The Labour party will use a different set ofselection procedures in Scotland because of a constituency boundary review and thesubsequent decrease in parliamentary seats.
78 Labour Women’s Organisation,www.labour.org.uk/labourwomen/
79 Estimate provided by the Fawcett Society,www.fawcettsociety.org.uk
80 Women Liberal Democrats,www.womenlibdems.org.uk
81 The Fawcett Society,www.fawcettsociety.org.uk
82 Equal Citizen website,www.equalcitizen.org.uk
83 Equal Opportunities Commission,www.eoc.org.uk
84 The Women’s National Commission,www.thewnc.org.uk
85 The UK Youth Parliament, www.ukyp.org.uk
86 The Transport and General Worker’s Union,www.tgwu.org.uk
87 For a further discussion see Pippa Norris.Ed. 1998. Women, Media and Politics. NewYork: Oxford University Press.
88 For further discussion in relation to the 1997general election, see M. Stephenson. 1998.The Glass Trapdoor: Women, Politics and theMedia During the 1997 General Election.London: Fawcett.
Gender and political participation: notes
73

89 This claim is supported by analysis of the2001 British Election Study, which indicates that,when asked about the most important problemfacing the country, women were more likely toprioritise the issue of the NHS and educationalstandards. By contrast, men were more likely toprioritise the issue of relations with the EuropeanUnion, the euro and the economy.
90 For details see Pippa Norris. 2003. ElectoralEngineering. Cambridge: Cambridge UniversityPress. Chapter 8; International IDEA. GlobalDatabase of Quotas for Women. Seewww.idea.int/quota
91 International IDEA Global Database ofQuotas for Women. See www.idea.int/quota
92 Hella van de Velde. 1994. Vrouwen van dePartij, De integratie van vrouwen in politiekepartijen in Nederland, 1919-1990. Leiden:DSWO-Press.
Gender and political participation: notes
74
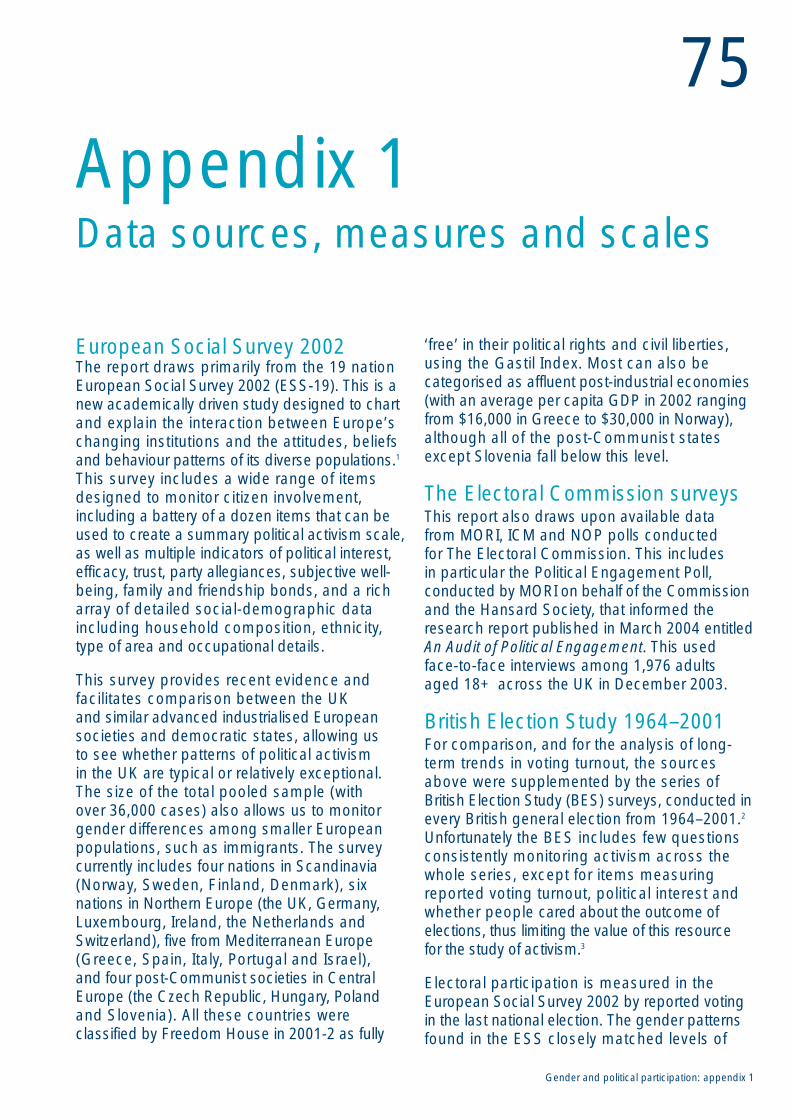
Gender and political participation: appendix 1
75Appendix 1 Data sources, measures and scales
European Social Survey 2002The report draws primarily from the 19 nationEuropean Social Survey 2002 (ESS-19). This is anew academically driven study designed to chartand explain the interaction between Europe’schanging institutions and the attitudes, beliefsand behaviour patterns of its diverse populations.1
This survey includes a wide range of itemsdesigned to monitor citizen involvement,including a battery of a dozen items that can beused to create a summary political activism scale,as well as multiple indicators of political interest,efficacy, trust, party allegiances, subjective well-being, family and friendship bonds, and a richarray of detailed social-demographic dataincluding household composition, ethnicity, type of area and occupational details.
This survey provides recent evidence andfacilitates comparison between the UK and similar advanced industrialised Europeansocieties and democratic states, allowing us to see whether patterns of political activism in the UK are typical or relatively exceptional. The size of the total pooled sample (with over 36,000 cases) also allows us to monitorgender differences among smaller Europeanpopulations, such as immigrants. The surveycurrently includes four nations in Scandinavia(Norway, Sweden, Finland, Denmark), sixnations in Northern Europe (the UK, Germany,Luxembourg, Ireland, the Netherlands andSwitzerland), five from Mediterranean Europe(Greece, Spain, Italy, Portugal and Israel), and four post-Communist societies in CentralEurope (the Czech Republic, Hungary, Polandand Slovenia). All these countries wereclassified by Freedom House in 2001-2 as fully
‘free’ in their political rights and civil liberties,using the Gastil Index. Most can also becategorised as affluent post-industrial economies(with an average per capita GDP in 2002 rangingfrom $16,000 in Greece to $30,000 in Norway),although all of the post-Communist statesexcept Slovenia fall below this level.
The Electoral Commission surveys This report also draws upon available data from MORI, ICM and NOP polls conducted for The Electoral Commission. This includes in particular the Political Engagement Poll,conducted by MORI on behalf of the Commissionand the Hansard Society, that informed theresearch report published in March 2004 entitledAn Audit of Political Engagement. This usedface-to-face interviews among 1,976 adultsaged 18+ across the UK in December 2003.
British Election Study 1964–2001For comparison, and for the analysis of long-term trends in voting turnout, the sourcesabove were supplemented by the series ofBritish Election Study (BES) surveys, conducted inevery British general election from 1964–2001.2
Unfortunately the BES includes few questionsconsistently monitoring activism across thewhole series, except for items measuringreported voting turnout, political interest andwhether people cared about the outcome ofelections, thus limiting the value of this resource for the study of activism.3
Electoral participation is measured in theEuropean Social Survey 2002 by reported votingin the last national election. The gender patternsfound in the ESS closely matched levels of

Gender and political participation: appendix 1
76
reported voting in the 2001 BES, increasingconfidence in the reliability of these independentestimates. The BES also monitored validatedvote, with reported participation at the ballot box checked against the official records.
The main measures used in the Europeanelection study 2002 are given below and asummary of the research findings from each ofthe studies described above, and from the 2001Citizen Audit, is shown in Figure 11 on p78.
Variable Item Coding
Political ‘There are different ways of trying to improve things in activism [country] or help prevent things from going wrong.
During the last 12 months, have you done any of the following?’ a) Contacted a politician, government or local government officialb) Worked in a political party or action groupc) Worked in another organisation or associationd) Worn or displayed a campaign badge/stickere) Signed a petitionf) Taken part in a lawful public demonstrationg) Boycotted certain productsh) Deliberately bought certain products for political,
ethical or environmental reasonsi) Donated money to a political organisation or group Yes (1),j) Participated in illegal protest activities.’ No (0).
Civic-oriented membership
Participation ‘For each of the voluntary organisations I will now mention, in voluntary please use this card to tell me whether any of these things [Code all organisations apply to you now or in the last 12 months, and if so, which?’ that apply
‘A sports club; an organisation for cultural or hobby activities; within this a trade union; a business, professional or farmers’ organisation; organisation.]a consumer or automobile organisation; an organisation for None (0),humanitarian aid, human rights, minorities or immigrants, member (1), an organisation for environmental protection, peace or animal participated rights; a religious or church organisation; a political party; an (2), donatedorganisation for science, education, or teachers and parents; money (2),a social club for the young, the retired/elderly, women or did voluntaryfriendly societies; any other voluntary organisations?’ work (3).

Gender and political participation: appendix 1
77
Variable Item Coding
Social trust
Careful ‘Using this card, generally speaking, would you say that most people can be trusted, or that you can’t be too careful in dealing withpeople? Please tell me on a score of 0 to 10, where 0 means youcan’t be too careful and 10 means that most people can be trusted.’ 10-pt scale
Fair ‘Using this card, do you think that most people would try to take advantage of you if they got the chance, or would they try to be fair?’ 10-pt scale
Helpful ‘Would you say that most of the time people try to be helpful or that they are mostly looking out for themselves? Please use this card.’ 10-pt scale
Social trust Summary scale of careful + fair + helpful 30-pt scalescale
Informal social networks
Informal ‘Using this card, how often do you meet socially with friends, Never (1) tosocial ties relatives or work colleagues?’ Every day (7)
Notes1 For more details of the European Social Survey,including the questionnaire and methodology,see http://naticent02.uuhost.uk.uu.net/index.htm.Data for an initial 19 countries, along withcomprehensive documentation, is accessible atess.nsd.uib.no. It is anticipated that subsequentreleases will include data from four othercountries which participated in round I, namelyAustria, France, Belgium and Turkey. The surveyis funded via the European Commission’s 5thFramework Program, with supplementary fundsfrom the European Science Foundation whichalso sponsored the development of the studyover a number of years. We are most grateful tothe European Commission and the ESF for theirsupport for this project and to the work of theESS Central Coordinating Team, led by RogerJowell, for making this survey data available.
2 Further details of the fieldwork and researchdesign are available at www.essex.ac.uk/bes.The specific items, measuring prospectiveactivism (the propensity to do these things) ratherthan retrospective activism (actual experienceof these acts), are all listed in Table 4.
3 For the problems of consistency and continuityin the BES series see Appendix D and E in Ivor Crewe, Anthony Fox and Neil Day. 1995. The British Electorate, 1963-1992. Cambridge:Cambridge University Press. The onlycontinuous time-series throughout the wholeseries (1964-2001) concerns reported votingparticipation and interest in politics (althoughthe latter item has been revised on a number ofoccasions); the series concerning caring aboutthe election result was dropped in 2001.

Gender and political participation: appendix 1
78
Type of The European An Audit of The British The Citizenactivism Social Survey Political Election Study Audit
2002 Engagement 2003 2001 2001UK sample British sample British sample British sample
2,051 1,976 3,219 3,135Voting-oriented None None Mixed NoneCampaign-oriented Men + None (i) Men + Men +Cause-oriented Women + Mixed None Women +Civic-oriented Men + Mixed Men + Men +
Note: This summarises the presence of significant differences, where found, among women and men’slevels of political activism for the four major dimensions covered in this report. ‘Women +’ denotes thatwomen were found to be significantly more engaged. ‘Men +’ denotes that men were found to besignificantly more engaged. ‘None’ means that across most indicators no significant gender differenceswere evident. ‘Mixed’ indicates different patterns within particular indicators in each category. (i) Indicates thedirection of the gap was similar but the results were not statistically significant in this survey. Source: ESS 2002, An audit of Political Engagement, BES 2001. For details of the Citizen Audit see Pattie,Seyd and Whiteley. 2004. Citizens and Politics: Democracy and Participation in Twenty-First Century Britain.Cambridge: Cambridge University Press.
Figure 11: Summary of major findings by survey
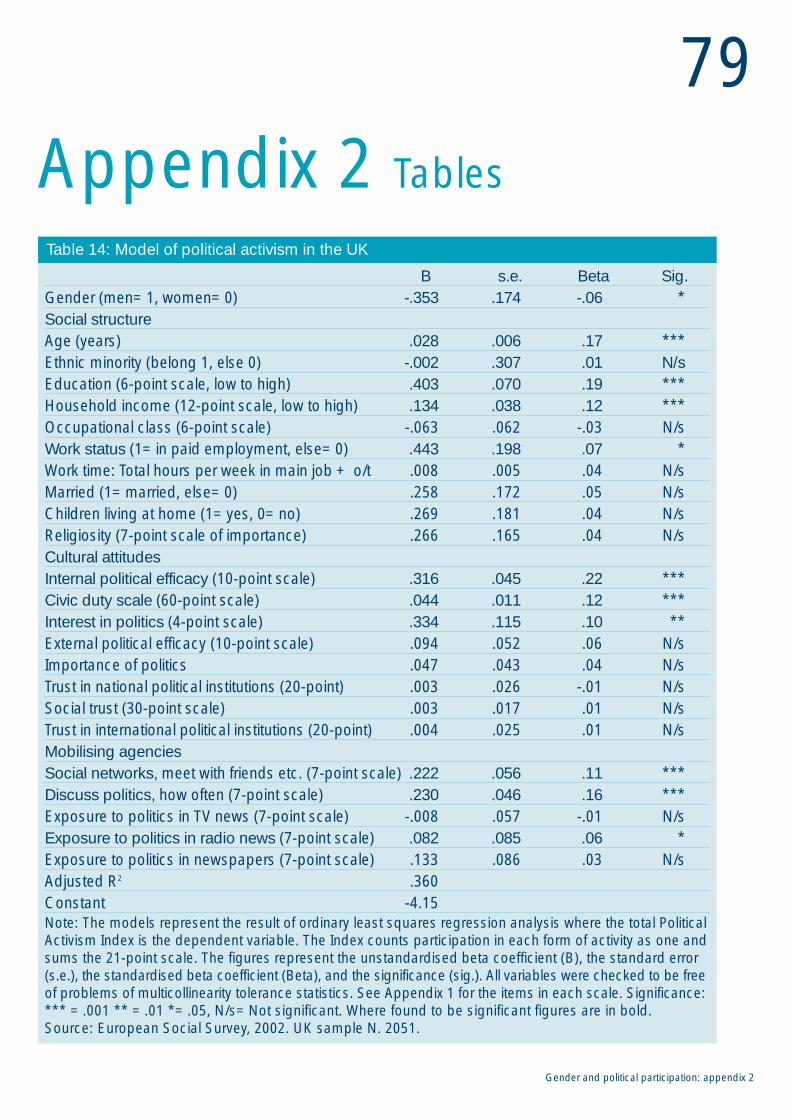
Gender and political participation: appendix 2
79Appendix 2 Tables
B s.e. Beta Sig.Gender (men=1, women=0) -.353 .174 -.06 *Social structureAge (years) .028 .006 .17 ***Ethnic minority (belong 1, else 0) -.002 .307 .01 N/sEducation (6-point scale, low to high) .403 .070 .19 ***Household income (12-point scale, low to high) .134 .038 .12 ***Occupational class (6-point scale) -.063 .062 -.03 N/sWork status (1=in paid employment, else=0) .443 .198 .07 *Work time: Total hours per week in main job + o/t .008 .005 .04 N/sMarried (1=married, else=0) .258 .172 .05 N/sChildren living at home (1=yes, 0=no) .269 .181 .04 N/sReligiosity (7-point scale of importance) .266 .165 .04 N/sCultural attitudesInternal political efficacy (10-point scale) .316 .045 .22 ***Civic duty scale (60-point scale) .044 .011 .12 ***Interest in politics (4-point scale) .334 .115 .10 **External political efficacy (10-point scale) .094 .052 .06 N/sImportance of politics .047 .043 .04 N/sTrust in national political institutions (20-point) .003 .026 -.01 N/sSocial trust (30-point scale) .003 .017 .01 N/sTrust in international political institutions (20-point) .004 .025 .01 N/sMobilising agenciesSocial networks, meet with friends etc. (7-point scale) .222 .056 .11 ***Discuss politics, how often (7-point scale) .230 .046 .16 ***Exposure to politics in TV news (7-point scale) -.008 .057 -.01 N/sExposure to politics in radio news (7-point scale) .082 .085 .06 *Exposure to politics in newspapers (7-point scale) .133 .086 .03 N/sAdjusted R2 .360Constant -4.15Note: The models represent the result of ordinary least squares regression analysis where the total PoliticalActivism Index is the dependent variable. The Index counts participation in each form of activity as one andsums the 21-point scale. The figures represent the unstandardised beta coefficient (B), the standard error(s.e.), the standardised beta coefficient (Beta), and the significance (sig.). All variables were checked to be freeof problems of multicollinearity tolerance statistics. See Appendix 1 for the items in each scale. Significance:*** =.001 ** =.01 *=.05, N/s=Not significant. Where found to be significant figures are in bold.Source: European Social Survey, 2002. UK sample N. 2051.
Table 14: Model of political activism in the UK

Gender and political participation: appendix 2
80
Women Men Activism Sig.gap
All 3.57 3.87 -.30 *Older (+60) 3.49 3.89 -.40 **Middle-aged (30-59) 3.96 4.18 -.22 N/sYounger (under 30) 2.49 2.76 -.27 N/sIn paid employment 4.03 4.13 -.10 N/sMarried 4.00 4.33 -.33 *With children living at home 3.44 4.19 -.75 **Education: Degree or equivalent 5.49 5.48 +.01 N/sEducation: NVQ4 or equivalent 4.45 4.11 +.34 N/s Education: A level or equivalent 3.85 4.19 -.34 N/sEducation: GCSE/O/or equivalent 3.11 3.29 -.18 *Education: no qualifications 2.36 2.50 -.14 N/sHousehold income: low 2.45 2.60 -.15 N/sHousehold income: medium 3.23 3.47 -.24 *Household income: high 4.65 4.69 -.04 N/sReligiosity high (very important) 4.13 4.65 -.52 *Religiosity low (not very important) 3.16 3.56 -.40 **Managerial and professional 5.13 5.19 -.06 N/sLower managerial 4.33 4.55 -.22 N/sOther white collar/clerical 2.80 3.41 -.61 N/sSkilled manual 3.12 2.87 +.25 N/sUnskilled manual 2.32 2.86 -.54 **Belong to ethnic minority 3.83 4.61 -.78 N/sDo not belong to ethnic minority 3.56 3.81 -.25 *England 3.60 3.90 -.30 **Wales 3.70 4.37 -.67 N/sScotland 3.64 3.69 -.05 N/sNorthern Ireland 2.07 2.48 -.30 N/sNote: The figures represent the mean score for women and men on the Political Activism Index, theactivism gap, and the significance of the gender difference. A positive gap indicates that women aremore active than men. A negative gap indicates that women are less active than men. Significancemeasured by Chi-square *** =.001 **=.01 *=.05, N/s=Not significant. Where found to be significantfigures are in bold.Source: European Social Survey, 2002. UK sample N. 2051.
Table 15: The activism gap in the UK by major social sectors
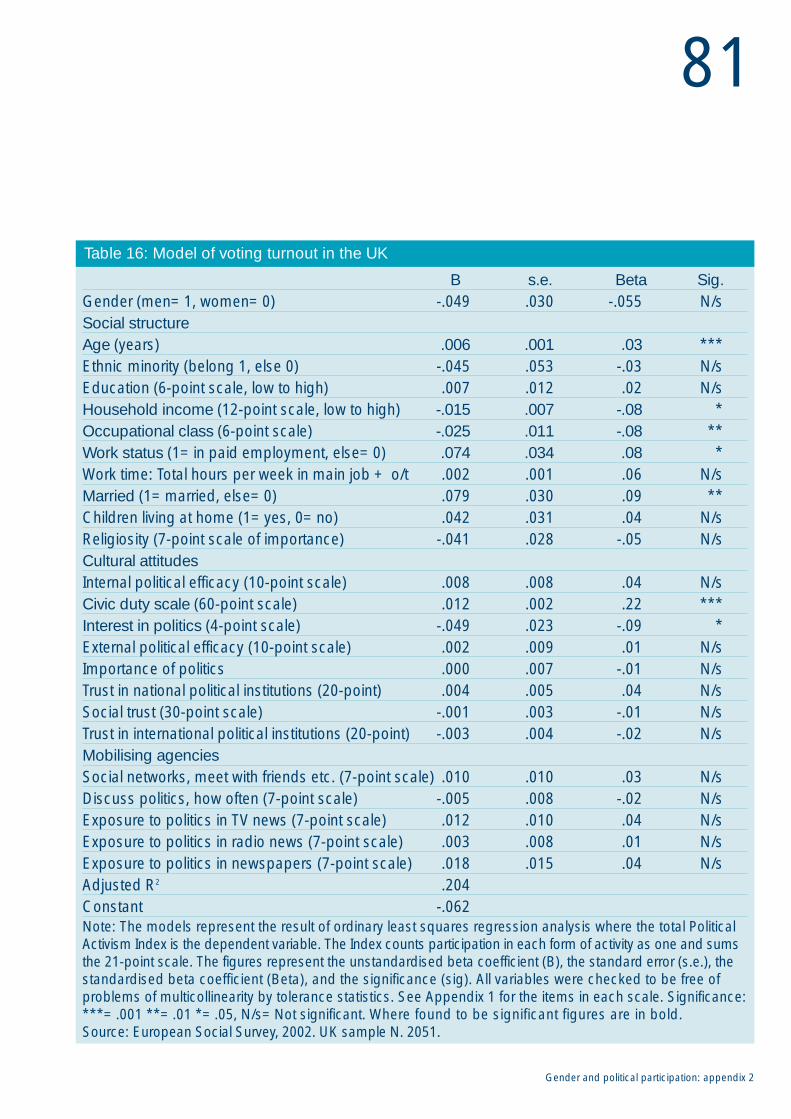
Gender and political participation: appendix 2
81
B s.e. Beta Sig.Gender (men=1, women=0) -.049 .030 -.055 N/sSocial structureAge (years) .006 .001 .03 ***Ethnic minority (belong 1, else 0) -.045 .053 -.03 N/sEducation (6-point scale, low to high) .007 .012 .02 N/sHousehold income (12-point scale, low to high) -.015 .007 -.08 *Occupational class (6-point scale) -.025 .011 -.08 **Work status (1=in paid employment, else=0) .074 .034 .08 *Work time: Total hours per week in main job + o/t .002 .001 .06 N/sMarried (1=married, else=0) .079 .030 .09 **Children living at home (1=yes, 0=no) .042 .031 .04 N/sReligiosity (7-point scale of importance) -.041 .028 -.05 N/sCultural attitudesInternal political efficacy (10-point scale) .008 .008 .04 N/sCivic duty scale (60-point scale) .012 .002 .22 ***Interest in politics (4-point scale) -.049 .023 -.09 *External political efficacy (10-point scale) .002 .009 .01 N/sImportance of politics .000 .007 -.01 N/sTrust in national political institutions (20-point) .004 .005 .04 N/sSocial trust (30-point scale) -.001 .003 -.01 N/sTrust in international political institutions (20-point) -.003 .004 -.02 N/sMobilising agenciesSocial networks, meet with friends etc. (7-point scale) .010 .010 .03 N/sDiscuss politics, how often (7-point scale) -.005 .008 -.02 N/sExposure to politics in TV news (7-point scale) .012 .010 .04 N/sExposure to politics in radio news (7-point scale) .003 .008 .01 N/sExposure to politics in newspapers (7-point scale) .018 .015 .04 N/sAdjusted R2 .204Constant -.062Note: The models represent the result of ordinary least squares regression analysis where the total PoliticalActivism Index is the dependent variable. The Index counts participation in each form of activity as one and sumsthe 21-point scale. The figures represent the unstandardised beta coefficient (B), the standard error (s.e.), thestandardised beta coefficient (Beta), and the significance (sig). All variables were checked to be free ofproblems of multicollinearity by tolerance statistics. See Appendix 1 for the items in each scale. Significance:***=.001 **=.01 *=.05, N/s=Not significant. Where found to be significant figures are in bold.Source: European Social Survey, 2002. UK sample N. 2051.
Table 16: Model of voting turnout in the UK
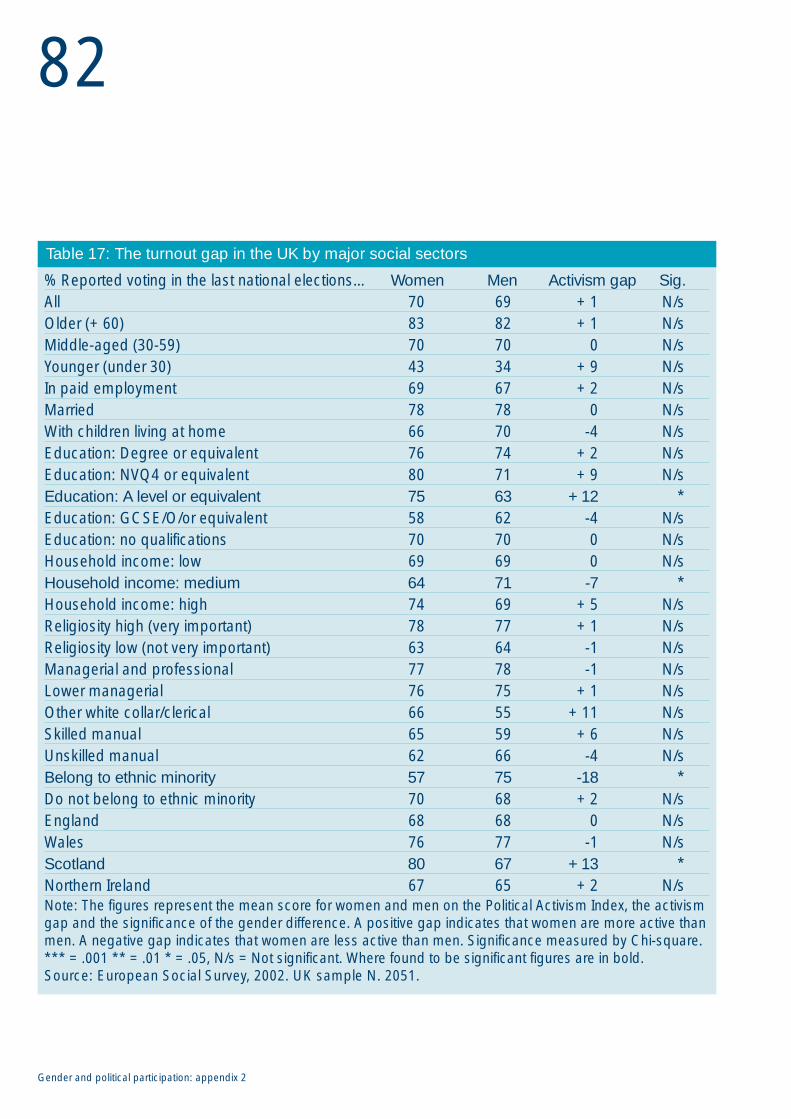
Gender and political participation: appendix 2
82
% Reported voting in the last national elections… Women Men Activism gap Sig.All 70 69 +1 N/sOlder (+60) 83 82 +1 N/sMiddle-aged (30-59) 70 70 0 N/sYounger (under 30) 43 34 +9 N/sIn paid employment 69 67 +2 N/sMarried 78 78 0 N/sWith children living at home 66 70 -4 N/sEducation: Degree or equivalent 76 74 +2 N/sEducation: NVQ4 or equivalent 80 71 +9 N/sEducation: A level or equivalent 75 63 +12 *Education: GCSE/O/or equivalent 58 62 -4 N/sEducation: no qualifications 70 70 0 N/sHousehold income: low 69 69 0 N/sHousehold income: medium 64 71 -7 *Household income: high 74 69 +5 N/sReligiosity high (very important) 78 77 +1 N/sReligiosity low (not very important) 63 64 -1 N/sManagerial and professional 77 78 -1 N/sLower managerial 76 75 +1 N/sOther white collar/clerical 66 55 +11 N/sSkilled manual 65 59 +6 N/sUnskilled manual 62 66 -4 N/sBelong to ethnic minority 57 75 -18 *Do not belong to ethnic minority 70 68 +2 N/sEngland 68 68 0 N/sWales 76 77 -1 N/sScotland 80 67 +13 *Northern Ireland 67 65 +2 N/sNote: The figures represent the mean score for women and men on the Political Activism Index, the activismgap and the significance of the gender difference. A positive gap indicates that women are more active thanmen. A negative gap indicates that women are less active than men. Significance measured by Chi-square.*** =.001 ** =.01 * =.05, N/s =Not significant. Where found to be significant figures are in bold.Source: European Social Survey, 2002. UK sample N. 2051.
Table 17: The turnout gap in the UK by major social sectors

Gender and political participation
Gender andpolitical participation
The Electoral CommissionTrevelyan HouseGreat Peter StreetLondon SW1P 2HW
Tel 020 7271 0500Fax 020 7271 0505info@electoralcommission.org.ukwww.electoralcommission.org.uk
We are an independent body that wasset up by the UK Parliament. We aim togain public confidence and encourage people to take part in the democraticprocess within the UK by modernisingthe electoral process, promoting publicawareness of electoral matters, andregulating political parties.
© The Electoral Commission 2004ISBN: 1-904363-41-5
4121/RP
/04.04
Research report, April 2004