Embed Size (px)
Citation preview
Company cars and fringe benefit tax – understanding the impacts on strategic transport targets
February 2012 RA Scott, GV Currie and KJ Tivendale Booz & Company NZ Transport Agency research report 474
ISBN 978-0-478-39409-2 (print)
ISBN 978-0-478-39210-8 (electronic)
ISSN 1173-3756 (print)
ISSN 1173-3764 (electronic)
NZ Transport Agency
Private Bag 6995, Wellington 6141, New Zealand
Telephone 64 4 894 5400; facsimile 64 4 894 6100
www.nzta.govt.nz
Scott, RA, GV Currie and KJ Tivendale (2012) Company cars and fringe benefit tax – understanding the
impacts on strategic transport targets. NZ Transport Agency research report 474. 82pp.
Booz & Company – attn Knowles Tivendale +61 4 1221 3770 +61 3 9221 1913 [email protected]
This publication is copyright © NZ Transport Agency 2012. Material in it may be reproduced for personal
or in-house use without formal permission or charge, provided suitable acknowledgement is made to this
publication and the NZ Transport Agency as the source. Requests and enquiries about the reproduction of
material in this publication for any other purpose should be made to the Research Programme Manager,
Programmes, Funding and Assessment, National Office, NZ Transport Agency, Private Bag 6995,
Wellington 6141.
Keywords: car parking, company cars, employer-provided car parks, fringe benefit tax, travel plans, work-
related vehicle
An important note for the reader
The NZ Transport Agency is a Crown entity established under the Land Transport Management Act 2003.
The objective of the Agency is to undertake its functions in a way that contributes to an affordable,
integrated, safe, responsive and sustainable land transport system. Each year, the NZ Transport Agency
funds innovative and relevant research that contributes to this objective.
The views expressed in research reports are the outcomes of the independent research, and should not be
regarded as being the opinion or responsibility of the NZ Transport Agency. The material contained in the
reports should not be construed in any way as policy adopted by the NZ Transport Agency or indeed any
agency of the New Zealand Government. The reports may, however, be used by New Zealand Government
agencies as a reference in the development of policy.
While research reports are believed to be correct at the time of their preparation, the NZ Transport Agency
and agents involved in their preparation and publication do not accept any liability for use of the research.
People using the research, whether directly or indirectly, should apply and rely on their own skill and
judgement. They should not rely on the contents of the research reports in isolation from other sources of
advice and information. If necessary, they should seek appropriate legal or other expert advice.
Acknowledgements
We would like to thank the steering committee members for their guidance. Raian Isaac and Kim Ollivier
for their mapping work. Anna Percy and Damien Johansen for their assistance with travel plan data. Jim
Fraser from ARC for his parking insights. Graeme Morrison for his insights into Inland Revenue
Department perspectives, Ulrike Neumann for providing advice on travel demand management, Jeanine
Benson for her knowledge, support and advice. Todd Litman, Galit Cohen Blankshtain and Lynley Povey for
their peer review. Juliette Allport for last minute editing assistance, and Richard’s wife, Lynley Scott, for
letting him take photos of public transport and company cars while on holiday.
Abbreviations and acronyms
ABS anti-lock braking system
ACC Accident Compensation Corporation
ANCAP Australasian New Car Assessment Program
ARTA Auckland Regional Transport Authority (now Auckland Transport)
CBD central business district
ESC electronic stability control
EU European Union
FBT fringe benefit tax
IRD Inland Revenue Department
JTW journey to work
MoT Ministry of Transport
NZTA New Zealand Transport Agency
PAYE pay-as-you-earn (income tax)
TDM travel demand management (also known as mobility management or transportation demand
management)
UK United Kingdom
5
Contents
Executive summary ................................................................................................................................................................. 7 Abstract .......................................................................................................................................................................................... 9 1 Introduction ................................................................................................................................................................ 11
1.1 Research aim ................................................................................................................ 11 1.2 Background and context .............................................................................................. 11 1.3 Approach ...................................................................................................................... 12 1.4 Report structure ........................................................................................................... 12
2 Company cars – international perspectives ........................................................................................... 14 2.1 Company car characteristics ........................................................................................ 14
2.1.1 The fleet .......................................................................................................... 14 2.1.2 Vehicle size and engine capacity ................................................................... 15 2.1.3 Vehicles per household .................................................................................. 17 2.1.4 Kilometres travelled ........................................................................................ 17 2.1.5 Safety ............................................................................................................... 19 2.1.6 Energy and emissions ..................................................................................... 20
2.2 Company car policy in economies similar to New Zealand ........................................ 21 2.2.1 Australian company car tax policy ................................................................. 21 2.2.2 UK company car tax policy ............................................................................. 23 2.2.3 Company car and FBT reform in Ireland ........................................................ 25 2.2.4 The US experience of tax-free public transport benefits, cash out and Eco passes ....................................................................................................... 25 2.2.5 Comparison of FBT policies ............................................................................ 26
3 The company car in New Zealand ................................................................................................................. 28 3.1 Current tax policy......................................................................................................... 28
3.1.1 FBT revenue trends ......................................................................................... 28 3.2 Fleet characteristics ..................................................................................................... 29
3.2.1 Engine capacity ............................................................................................... 30 3.3 Impacts on employee transport behaviour ................................................................. 31
3.3.1 Transport elasticities ...................................................................................... 32 3.4 Journey to work by company car in New Zealand ....................................................... 33
3.4.1 Mapping of journey to work by company car users ...................................... 34 3.4.2 Journey to work by company car in Auckland ............................................... 34 3.4.3 Journey to work by company car in Christchurch ......................................... 38 3.4.4 Journey to work by company car in Wellington ............................................. 41 3.4.5 Analysis of workplace travel plans ................................................................. 43
3.5 Magnitude of incentive for employees ........................................................................ 46 4 Understanding employer-provided parking ........................................................................................... 48
4.1 Current tax policy and parking .................................................................................... 48 4.2 Impact of policy on employer and employee behaviour ............................................ 48 4.3 Equity, vehicle travel, commute mode share, energy and emissions impacts .......... 48 4.4 Quantifying the untaxed value of car parking ............................................................ 49
4.4.1 Comparison of parking and public transport charges .................................. 50
6
4.4.2 Annual cost of employer-provided parking or public transport ................... 51 4.5 Benefits of addressing parking distortions ................................................................. 52
5 FBT and transport ................................................................................................................................................... 53 5.1 FBT and horizontal equity ............................................................................................ 53 5.2 Tax neutrality and environmental taxes ..................................................................... 53
5.2.1 Tax neutrality .................................................................................................. 53 5.2.2 Externality taxes ............................................................................................. 54 5.2.3 Tax policy dilemma ........................................................................................ 55
5.3 Transport efficiency ..................................................................................................... 55 5.4 Land-use development efficiency ................................................................................ 55 5.5 Assessment................................................................................................................... 56 5.6 Tax reform and revenue neutrality .............................................................................. 56 5.7 Inland Revenue perspective ......................................................................................... 56
6 Options, constraints and opinions ............................................................................................................... 58 6.1 Potential company car tax reforms ............................................................................. 58
6.1.1 Addressing safety issues ................................................................................ 58 6.1.2 Differentiated fringe benefit tax rate based on emissions ........................... 60 6.1.3 Taxing private use using commute distance................................................. 60 6.1.4 Recommendations .......................................................................................... 60
6.2 Barriers to company car tax reforms ........................................................................... 61 6.3 Observations on changing business culture ............................................................... 61 6.4 The fleet providers’ perspective .................................................................................. 62 6.5 Corporate responsibility .............................................................................................. 64
6.5.1 Workplace safety and company vehicles ....................................................... 64 6.5.2 Environmental performance ........................................................................... 65
6.6 Potential policies to address employer-provided parking .......................................... 66 6.6.1 Local parking levies ........................................................................................ 67
6.7 Barriers to parking policy changes .............................................................................. 68 7 Conclusions ................................................................................................................................................................ 69
7.1 Overview of key findings ............................................................................................. 69 8 Recommendations .................................................................................................................................................. 71
8.1 Policy alternatives for New Zealand ............................................................................. 71 8.1.1 Mitigating the externality impacts of company cars ..................................... 71 8.1.2 Income tax thresholds and company cars ..................................................... 72 8.1.3 Alternatives to FBT reform ............................................................................. 72 8.1.4 Regulation as an effective policy instrument ................................................ 73
9 Bibliography ............................................................................................................................................................... 75 Appendix A: Glossary ........................................................................................................................................................ 81
7
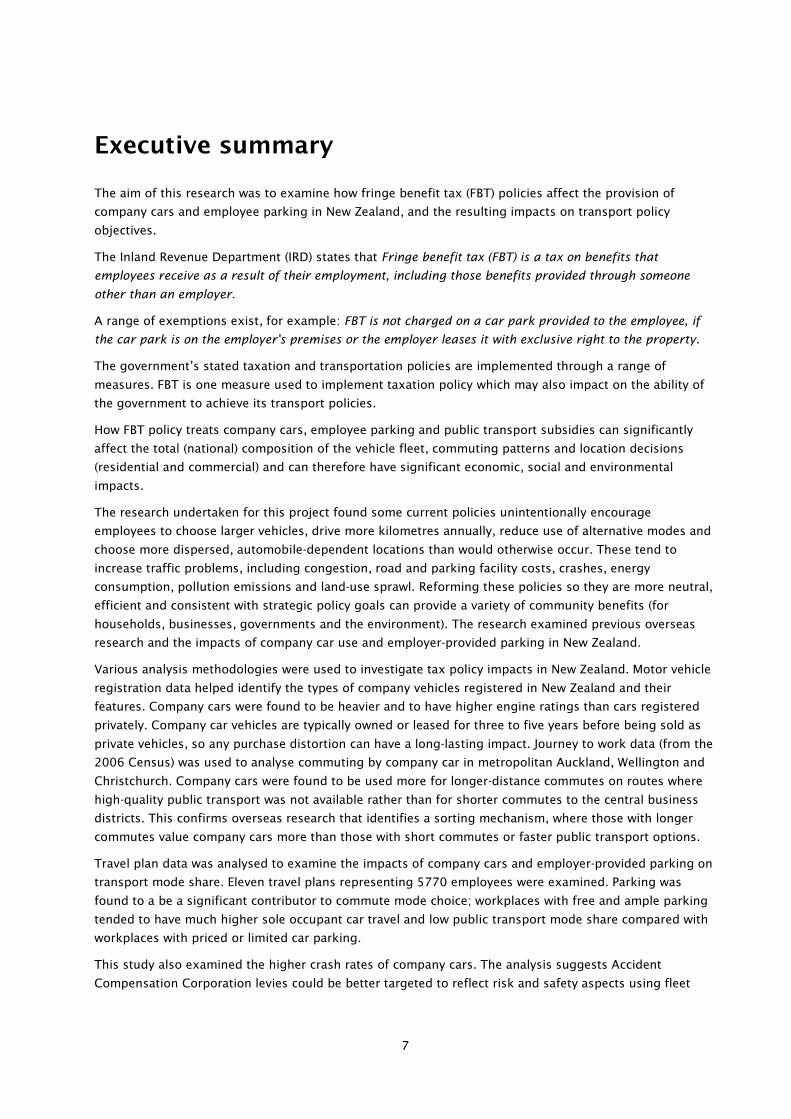
Executive summary
The aim of this research was to examine how fringe benefit tax (FBT) policies affect the provision of
company cars and employee parking in New Zealand, and the resulting impacts on transport policy
objectives.
The Inland Revenue Department (IRD) states that Fringe benefit tax (FBT) is a tax on benefits that
employees receive as a result of their employment, including those benefits provided through someone
other than an employer.
A range of exemptions exist, for example: FBT is not charged on a car park provided to the employee, if
the car park is on the employer's premises or the employer leases it with exclusive right to the property.
The government’s stated taxation and transportation policies are implemented through a range of
measures. FBT is one measure used to implement taxation policy which may also impact on the ability of
the government to achieve its transport policies.
How FBT policy treats company cars, employee parking and public transport subsidies can significantly
affect the total (national) composition of the vehicle fleet, commuting patterns and location decisions
(residential and commercial) and can therefore have significant economic, social and environmental
impacts.
The research undertaken for this project found some current policies unintentionally encourage
employees to choose larger vehicles, drive more kilometres annually, reduce use of alternative modes and
choose more dispersed, automobile-dependent locations than would otherwise occur. These tend to
increase traffic problems, including congestion, road and parking facility costs, crashes, energy
consumption, pollution emissions and land-use sprawl. Reforming these policies so they are more neutral,
efficient and consistent with strategic policy goals can provide a variety of community benefits (for
households, businesses, governments and the environment). The research examined previous overseas
research and the impacts of company car use and employer-provided parking in New Zealand.
Various analysis methodologies were used to investigate tax policy impacts in New Zealand. Motor vehicle
registration data helped identify the types of company vehicles registered in New Zealand and their
features. Company cars were found to be heavier and to have higher engine ratings than cars registered
privately. Company car vehicles are typically owned or leased for three to five years before being sold as
private vehicles, so any purchase distortion can have a long-lasting impact. Journey to work data (from the
2006 Census) was used to analyse commuting by company car in metropolitan Auckland, Wellington and
Christchurch. Company cars were found to be used more for longer-distance commutes on routes where
high-quality public transport was not available rather than for shorter commutes to the central business
districts. This confirms overseas research that identifies a sorting mechanism, where those with longer
commutes value company cars more than those with short commutes or faster public transport options.
Travel plan data was analysed to examine the impacts of company cars and employer-provided parking on
transport mode share. Eleven travel plans representing 5770 employees were examined. Parking was
found to a be a significant contributor to commute mode choice; workplaces with free and ample parking
tended to have much higher sole occupant car travel and low public transport mode share compared with
workplaces with priced or limited car parking.
This study also examined the higher crash rates of company cars. The analysis suggests Accident
Compensation Corporation levies could be better targeted to reflect risk and safety aspects using fleet
Company cars and fringe benefit tax – understanding the impacts on strategic transport targets
8
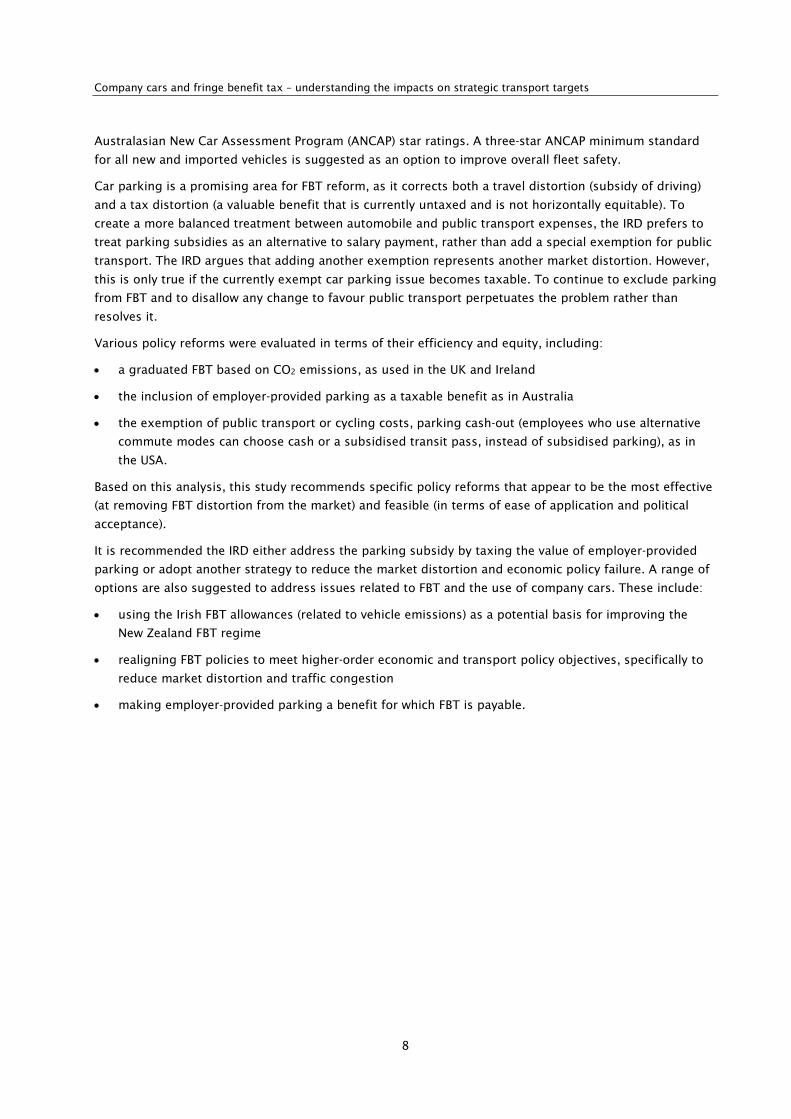
Australasian New Car Assessment Program (ANCAP) star ratings. A three-star ANCAP minimum standard
for all new and imported vehicles is suggested as an option to improve overall fleet safety.
Car parking is a promising area for FBT reform, as it corrects both a travel distortion (subsidy of driving)
and a tax distortion (a valuable benefit that is currently untaxed and is not horizontally equitable). To
create a more balanced treatment between automobile and public transport expenses, the IRD prefers to
treat parking subsidies as an alternative to salary payment, rather than add a special exemption for public
transport. The IRD argues that adding another exemption represents another market distortion. However,
this is only true if the currently exempt car parking issue becomes taxable. To continue to exclude parking
from FBT and to disallow any change to favour public transport perpetuates the problem rather than
resolves it.
Various policy reforms were evaluated in terms of their efficiency and equity, including:
• a graduated FBT based on CO2 emissions, as used in the UK and Ireland
• the inclusion of employer-provided parking as a taxable benefit as in Australia
• the exemption of public transport or cycling costs, parking cash-out (employees who use alternative
commute modes can choose cash or a subsidised transit pass, instead of subsidised parking), as in
the USA.
Based on this analysis, this study recommends specific policy reforms that appear to be the most effective
(at removing FBT distortion from the market) and feasible (in terms of ease of application and political
acceptance).
It is recommended the IRD either address the parking subsidy by taxing the value of employer-provided
parking or adopt another strategy to reduce the market distortion and economic policy failure. A range of
options are also suggested to address issues related to FBT and the use of company cars. These include:
• using the Irish FBT allowances (related to vehicle emissions) as a potential basis for improving the
New Zealand FBT regime
• realigning FBT policies to meet higher-order economic and transport policy objectives, specifically to
reduce market distortion and traffic congestion
• making employer-provided parking a benefit for which FBT is payable.
Abstract
9
Abstract
This report investigates the degree to which current tax polices influence travel behaviour (perhaps
unintentionally) in ways that contradict strategic policy objectives. It also evaluates potential tax policy
reforms that could help increase efficiency and equity.
Current New Zealand fringe benefit tax (FBT) policies encourage employers to offer company cars
(including associated expenses such as insurance, fuel, tolls and parking), and employee parking
subsidies, since as untaxed benefits they are worth more to employees than their cash wage value.
Analysis of New Zealand data concerning vehicle purchase and ownership patterns, commute travel
patterns and crash rates, and international research, indicates company cars tend to be larger and less
fuel efficient. Employees who receive company cars tend to drive more annual kilometres, are more likely
to live in more dispersed, automobile-dependent locations, and have higher crash rates than motorists
who own their vehicles. The larger size of company cars appears to increase the overall average size and
reduce the fuel efficiency of the future New Zealand vehicle fleet. This research also indicates that
employees who receive significant parking subsidies (through FBT exemptions) are more likely to drive
than use alternative modes of transport.

Company cars and fringe benefit tax – understanding the impacts on strategic transport targets
10
1 Introduction
11
1 Introduction
The overall aim of this research was to examine the use of company cars in New Zealand and to identify
how this impacts on other transport policy areas.
1.1 Research aim
The goals of the research were to:
• identify how current tax policies affect vehicle purchase and transport patterns in New Zealand
• evaluate the negative impact of these tax policies on local, regional and national policy objectives
• using New Zealand data, quantify impacts such as larger and less fuel-efficient vehicle purchases,
increased vehicle travel, higher rates of car commuting, and higher traffic crash rates by employees
offered company cars and subsidised employee parking
• consider obstacles to employers providing alternative transport benefits such as public transport
passes
• assess whether employers provide other transport inducements and, if so, what type (eg cycling
facilities)
• identify policy changes that have been used outside New Zealand to reduce the negative influences of
company car use
• based on this analysis, provide specific recommendations for tax policy reforms to increase efficiency
and equity, and to be more consistent with strategic policy objectives.
1.2 Background and context
In New Zealand prior to 1985 the top marginal tax rate was 66%. A marginal tax rate of 66% meant there
was a large incentive to pay employees in ways other than salary and wages given the high tax rate and a
lack of fringe benefit tax (FBT). Businesses found, due to tax policy, a dollar spent to subsidise vehicles
and parking was worth more than the same money provided as wages. FBT was introduced in 1985 to
counter a growing trend in employment packages to provide untaxed benefits instead of taxable income.
The top marginal tax rate was reduced to 33% in line with company tax. This reduction and the tightening
of FBT resulted in fewer incentives to provide company cars than in the past.
Historically, New Zealand has been reducing personal income tax rates (in favour of consumption taxes).
There is an opportunity to avoid increased consumption of high-polluting consumer goods by applying
environmental taxes to the worst or least efficient products. Variable registration fees or variable company
car tax rates could be part of this change. As petrol prices rise, company cars will become increasingly
attractive to employees. Unless something is done to influence the purchase of company cars with better
energy and emissions efficiency, they will continue to be higher engine-capacity vehicles instead of the
more efficient vehicles the rest of the population tends to purchase.
New Zealand tax law makes a distinction between ‘work-related vehicles’, which are vehicles used for
business purposes, such as delivery vans, tradesperson trucks and sales vehicles, and ‘company cars’,
which are provided to employees as part of their compensation package, and so are driven for personal
travel, including commuting, in addition to purely business travel. FBT law has not addressed employer-
provided parking which has remained an untaxed benefit.
Company cars and fringe benefit tax – understanding the impacts on strategic transport targets
12
This research was undertaken in New Zealand in 2009 and 2010 and examined company car use in
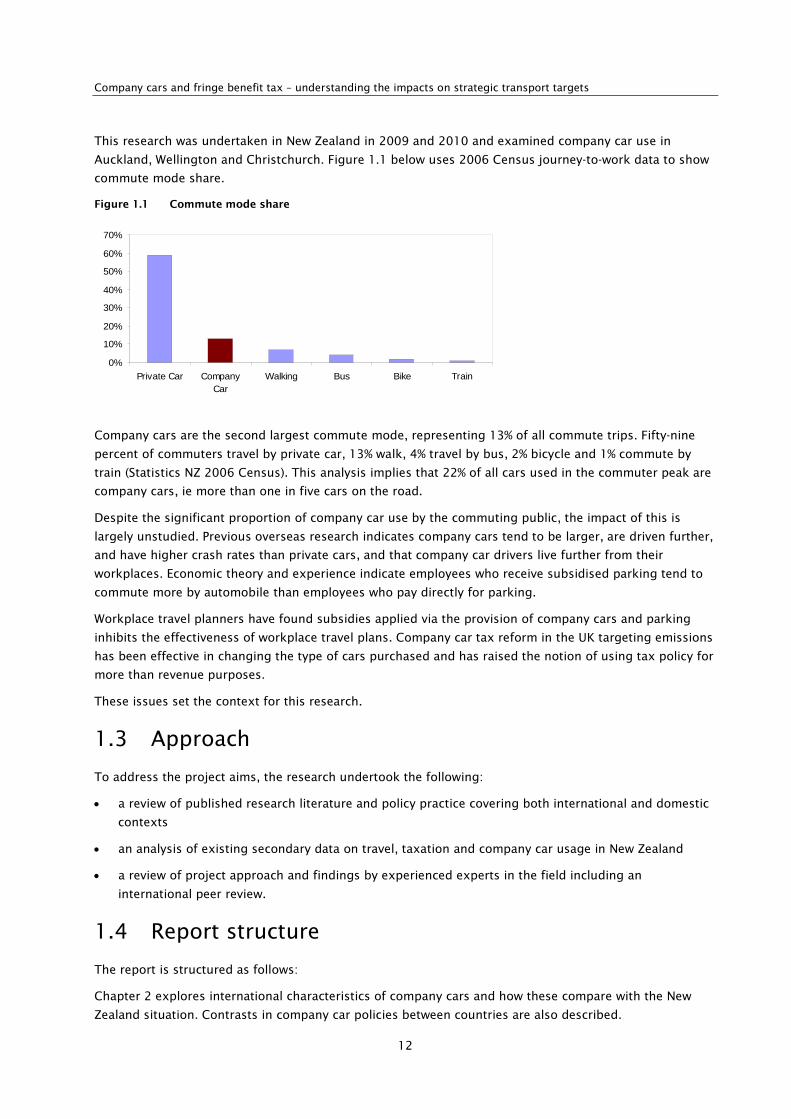
Auckland, Wellington and Christchurch. Figure 1.1 below uses 2006 Census journey-to-work data to show
commute mode share.
Figure 1.1 Commute mode share
Company cars are the second largest commute mode, representing 13% of all commute trips. Fifty-nine
percent of commuters travel by private car, 13% walk, 4% travel by bus, 2% bicycle and 1% commute by
train (Statistics NZ 2006 Census). This analysis implies that 22% of all cars used in the commuter peak are
company cars, ie more than one in five cars on the road.
Despite the significant proportion of company car use by the commuting public, the impact of this is
largely unstudied. Previous overseas research indicates company cars tend to be larger, are driven further,
and have higher crash rates than private cars, and that company car drivers live further from their
workplaces. Economic theory and experience indicate employees who receive subsidised parking tend to
commute more by automobile than employees who pay directly for parking.
Workplace travel planners have found subsidies applied via the provision of company cars and parking
inhibits the effectiveness of workplace travel plans. Company car tax reform in the UK targeting emissions
has been effective in changing the type of cars purchased and has raised the notion of using tax policy for
more than revenue purposes.
These issues set the context for this research.
1.3 Approach
To address the project aims, the research undertook the following:
• a review of published research literature and policy practice covering both international and domestic
contexts
• an analysis of existing secondary data on travel, taxation and company car usage in New Zealand
• a review of project approach and findings by experienced experts in the field including an
international peer review.
1.4 Report structure
The report is structured as follows:
Chapter 2 explores international characteristics of company cars and how these compare with the New
Zealand situation. Contrasts in company car policies between countries are also described.
0%
10%
20%
30%
40%
50%
60%
70%
Private Car CompanyCar
Walking Bus Bike Train
1 Introduction
13
Chapter 3 describes current tax policy, fleet characteristics and the impact of company cars on employee
travel behaviour in New Zealand. The relative magnitude of incentives which company cars represent for
employees is also explored.
Chapter 4 considers existing tax policy with regards to employer-provided parking, its impacts, the
untaxed value of car parking, barriers to changing parking policies and options to address this issue.
Chapter 5 discusses the key principals of taxation policy and how this relates to broad transport and land-
use policy objectives. A critique of current practices is presented followed by a perspective on these issues
from discussions with the IRD.
Chapter 6 presents a discussion of the options for both company car policy and parking policy in
New Zealand. Barriers to reform are presented and opinions from various stakeholders on the issues
identified are outlined.
Chapter 7 presents a summary of the key findings of the review.
Chapter 8 presents a summary of the recommendations and preferred policy alternatives to address the
issues identified.
Company cars and fringe benefit tax – understanding the impacts on strategic transport targets
14
2 Company cars – international perspectives
This chapter explores international characteristics of company cars and how these compare with the
situation in New Zealand. Company car policy contrasts between countries are also described.
2.1 Company car characteristics
This section explores company car fleet characteristics, usage, safety, and energy and emission impacts.
2.1.1 The fleet
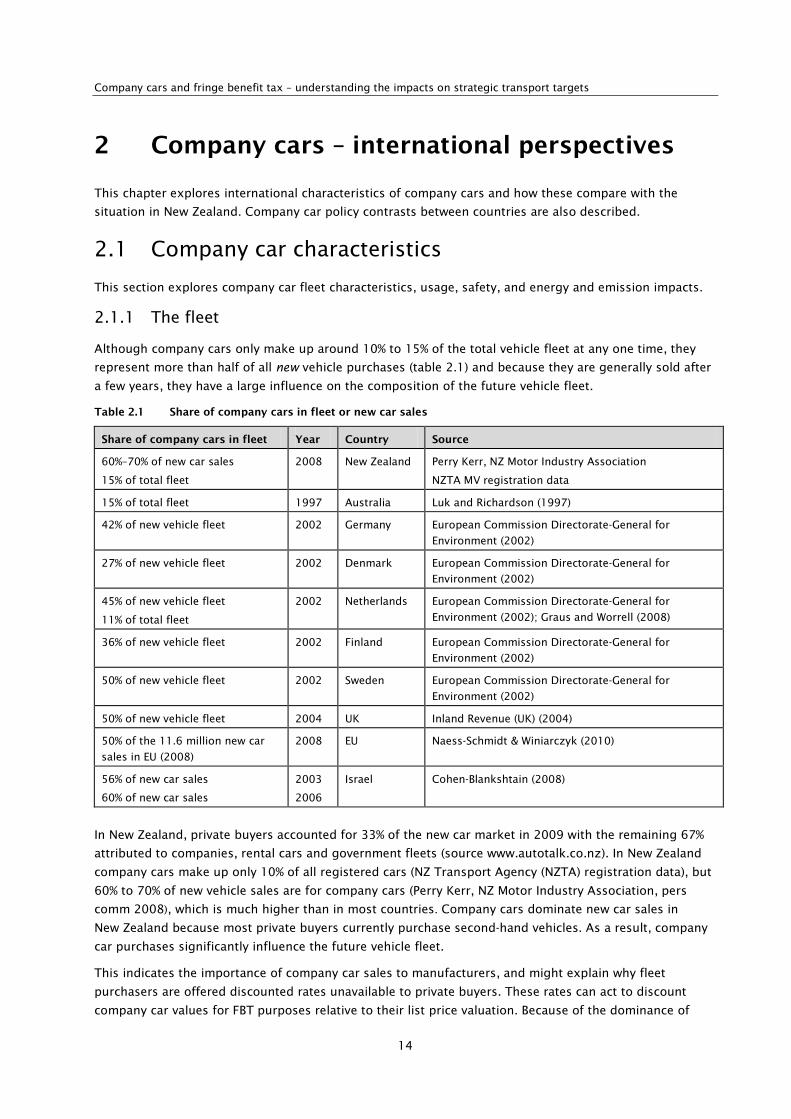
Although company cars only make up around 10% to 15% of the total vehicle fleet at any one time, they
represent more than half of all new vehicle purchases (table 2.1) and because they are generally sold after
a few years, they have a large influence on the composition of the future vehicle fleet.
Table 2.1 Share of company cars in fleet or new car sales
Share of company cars in fleet Year Country Source
60%–70% of new car sales
15% of total fleet
2008 New Zealand Perry Kerr, NZ Motor Industry Association
NZTA MV registration data
15% of total fleet 1997 Australia Luk and Richardson (1997)
42% of new vehicle fleet 2002 Germany European Commission Directorate-General for
Environment (2002)
27% of new vehicle fleet 2002 Denmark European Commission Directorate-General for
Environment (2002)
45% of new vehicle fleet
11% of total fleet
2002 Netherlands European Commission Directorate-General for
Environment (2002); Graus and Worrell (2008)
36% of new vehicle fleet 2002 Finland European Commission Directorate-General for
Environment (2002)
50% of new vehicle fleet 2002 Sweden European Commission Directorate-General for
Environment (2002)
50% of new vehicle fleet 2004 UK Inland Revenue (UK) (2004)
50% of the 11.6 million new car
sales in EU (2008)
2008 EU Naess-Schmidt & Winiarczyk (2010)
56% of new car sales
60% of new car sales
2003
2006
Israel Cohen-Blankshtain (2008)
In New Zealand, private buyers accounted for 33% of the new car market in 2009 with the remaining 67%
attributed to companies, rental cars and government fleets (source www.autotalk.co.nz). In New Zealand
company cars make up only 10% of all registered cars (NZ Transport Agency (NZTA) registration data), but
60% to 70% of new vehicle sales are for company cars (Perry Kerr, NZ Motor Industry Association, pers
comm 2008), which is much higher than in most countries. Company cars dominate new car sales in
New Zealand because most private buyers currently purchase second-hand vehicles. As a result, company
car purchases significantly influence the future vehicle fleet.
This indicates the importance of company car sales to manufacturers, and might explain why fleet
purchasers are offered discounted rates unavailable to private buyers. These rates can act to discount
company car values for FBT purposes relative to their list price valuation. Because of the dominance of
2 Company cars – international perspectives
15
company cars in new vehicle sales, it would be in the interest of the New Zealand motor vehicle industry to
support FBT policies that encourage purchases of high-value company cars.
Similar patterns exist in other countries. For example, in 1997, Ford and Holden Australia sold 72% of
their new vehicles to fleets (Haworth et al 2000). In the UK, 53% of new cars are company owned or
financed (Broughton et al 2003). Given the bulk purchasing power of fleet leasing companies and firms
with large vehicle fleets, the taxation of purchase price as a basis for establishing the market value is an
imperfect approach; it can generate significant ‘horizontal inequity’ in the application of taxes between
those who buy their own car compared with those who have one provided in their employment package.
2.1.2 Vehicle size and engine capacity
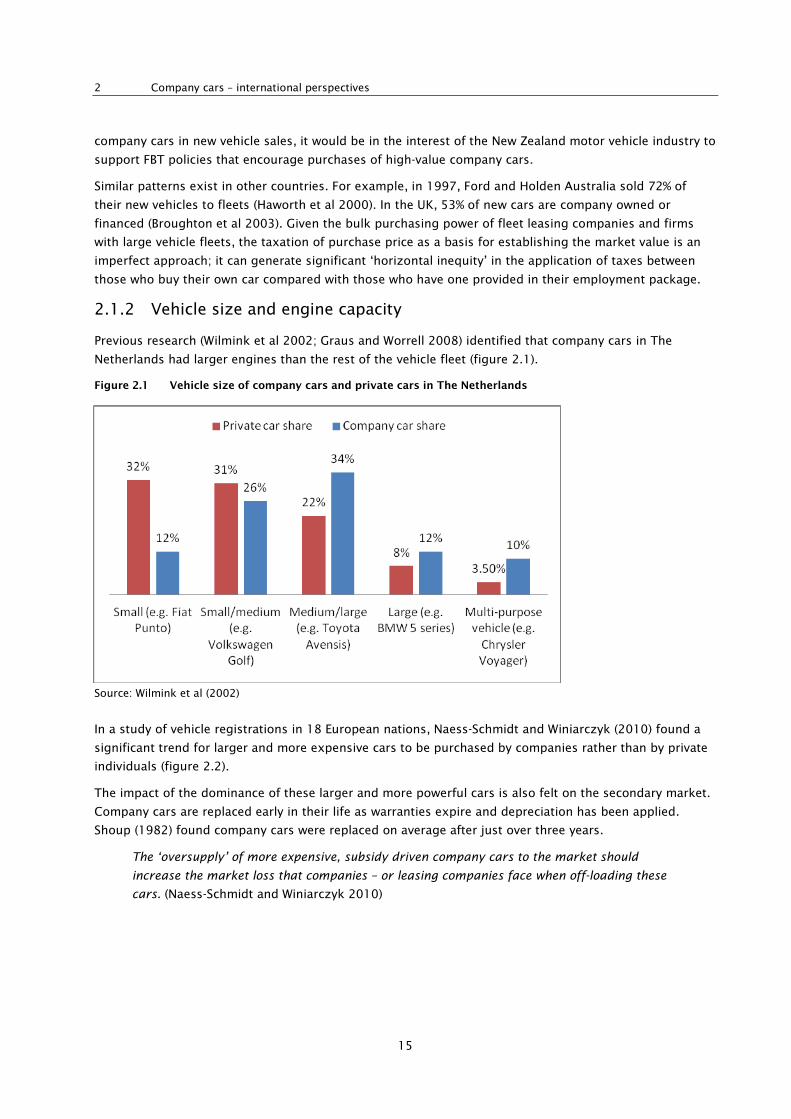
Previous research (Wilmink et al 2002; Graus and Worrell 2008) identified that company cars in The
Netherlands had larger engines than the rest of the vehicle fleet (figure 2.1).
Figure 2.1 Vehicle size of company cars and private cars in The Netherlands
Source: Wilmink et al (2002)
In a study of vehicle registrations in 18 European nations, Naess-Schmidt and Winiarczyk (2010) found a
significant trend for larger and more expensive cars to be purchased by companies rather than by private
individuals (figure 2.2).
The impact of the dominance of these larger and more powerful cars is also felt on the secondary market.
Company cars are replaced early in their life as warranties expire and depreciation has been applied.
Shoup (1982) found company cars were replaced on average after just over three years.
The ‘oversupply’ of more expensive, subsidy driven company cars to the market should
increase the market loss that companies – or leasing companies face when off-loading these
cars. (Naess-Schmidt and Winiarczyk 2010)
Company cars and fringe benefit tax – understanding the impacts on strategic transport targets
16
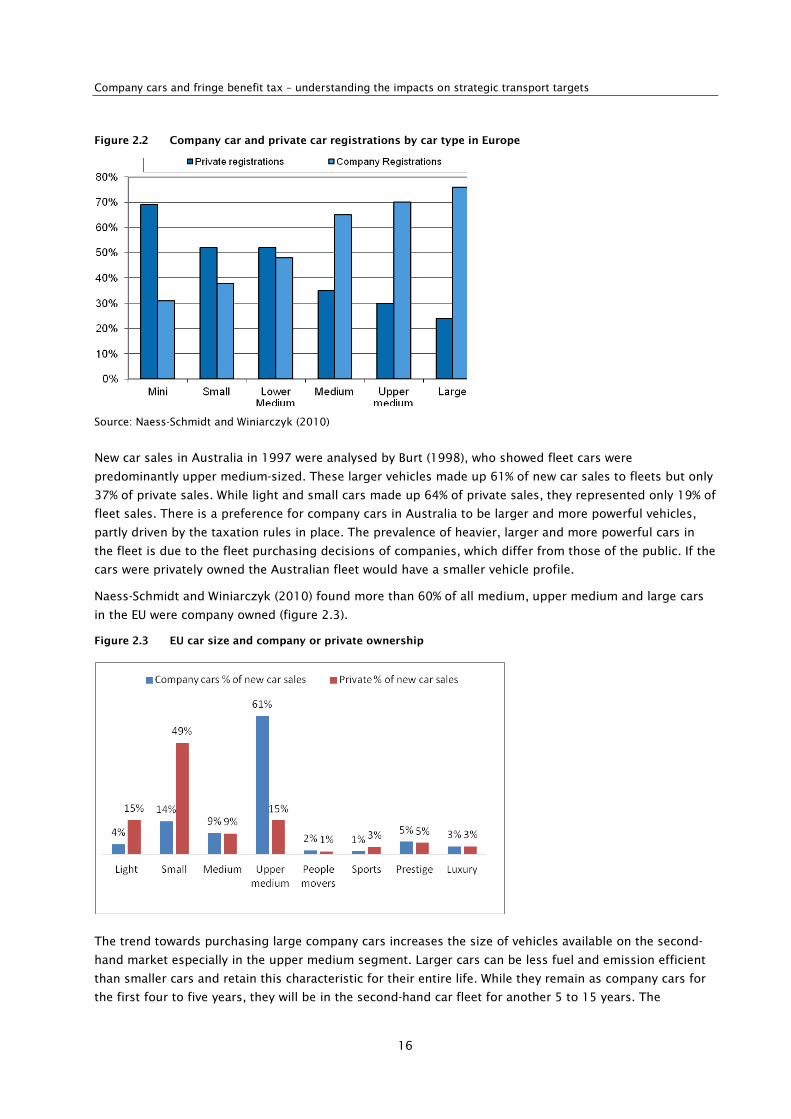
Figure 2.2 Company car and private car registrations by car type in Europe
Source: Naess-Schmidt and Winiarczyk (2010)
New car sales in Australia in 1997 were analysed by Burt (1998), who showed fleet cars were
predominantly upper medium-sized. These larger vehicles made up 61% of new car sales to fleets but only
37% of private sales. While light and small cars made up 64% of private sales, they represented only 19% of
fleet sales. There is a preference for company cars in Australia to be larger and more powerful vehicles,
partly driven by the taxation rules in place. The prevalence of heavier, larger and more powerful cars in
the fleet is due to the fleet purchasing decisions of companies, which differ from those of the public. If the
cars were privately owned the Australian fleet would have a smaller vehicle profile.
Naess-Schmidt and Winiarczyk (2010) found more than 60% of all medium, upper medium and large cars
in the EU were company owned (figure 2.3).
Figure 2.3 EU car size and company or private ownership
The trend towards purchasing large company cars increases the size of vehicles available on the second-
hand market especially in the upper medium segment. Larger cars can be less fuel and emission efficient
than smaller cars and retain this characteristic for their entire life. While they remain as company cars for
the first four to five years, they will be in the second-hand car fleet for another 5 to 15 years. The
2 Company cars – international perspectives
17
additional fuel consumption associated with larger company cars has been estimated in other studies at
8% (Naess-Schmidt and Winiarczyk (2010).
The value of these cars is also higher causing the fringe benefit to be higher as the individual gains access
to a vehicle they would not necessarily buy if they had to pay for it. Fleet companies are aware of declining
residual values and have begun to push smaller economical vehicles so they are not left with difficult-to-
sell larger cars.
While historical studies of company cars identified they were larger, heavier and used more fuel, very
recent trends (in the last few years) show a change in this pattern (in both New Zealand and Australia),
particularly as government and corporate fleet managers seek to achieve sustainability and efficiency
targets.
From a dominant 24 percent share of new car sales in 2004, now, after the first four months
of 2010, large cars account for just 14 percent of new cars sales. Small cars (1.3 – 1.5 litre)
have grown in popularity from 23 percent in 2004 to around 28 percent today, the largest of
all segments. Light cars (1.6 – 2.0 litre) have shown good growth, up from 11 percent in
2004 through to 18 percent today. (Motor Trade Association 2010)
2.1.3 Vehicles per household
If there are restrictions on the private use of the company car, a household may retain their existing
vehicle. A 2009 study examined the effect of company cars on household car ownership and found a
correlation between company cars and household car ownership in the range of 0.29 to 0.68 (Gutiérrez-i-
Puigarnau and van Ommeren 2009). The increase in the total vehicle fleet has been estimated at 9%
(Naess-Schmidt and Winiarczyk 2010).
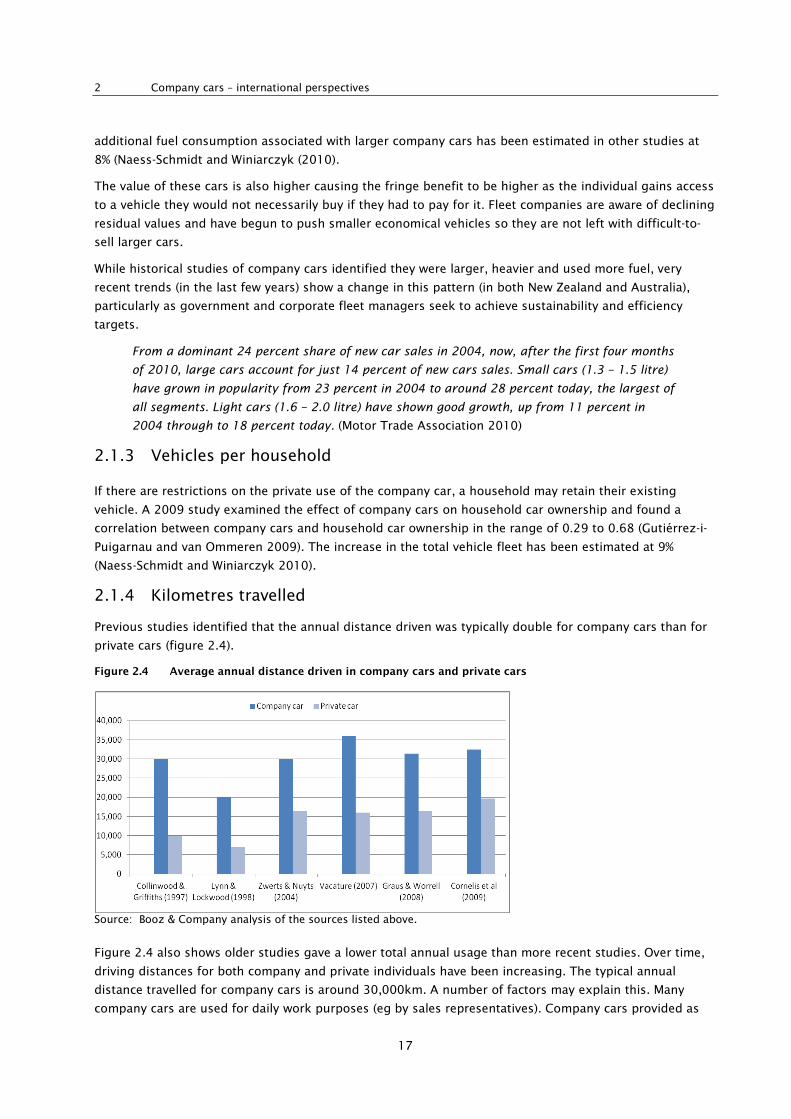
2.1.4 Kilometres travelled
Previous studies identified that the annual distance driven was typically double for company cars than for
private cars (figure 2.4).
Figure 2.4 Average annual distance driven in company cars and private cars
Source: Booz & Company analysis of the sources listed above.
Figure 2.4 also shows older studies gave a lower total annual usage than more recent studies. Over time,
driving distances for both company and private individuals have been increasing. The typical annual
distance travelled for company cars is around 30,000km. A number of factors may explain this. Many
company cars are used for daily work purposes (eg by sales representatives). Company cars provided as
Company cars and fringe benefit tax – understanding the impacts on strategic transport targets
18
fringe benefits may be the preferred choice of employees who live far from work while those who live
close to work may prefer a cash equivalent instead. In The Netherlands, the average commuting distance
for company car owners is nearly 66% higher than the average distance for private car owners (Graus and
Worrell 2008).
Gutiérrez-i-Puigarnau and van Ommeren (2009) stress that:
The purchase price of the company car is taxed but not the use so this provides an incentive
for the employer to subsidise private travel.
The use of fuel cards and employer subsidy of all fuel costs effectively means company cars have no
marginal cost for the users; hence, there is an incentive to use the company car as much as possible even
for private trips. Cohen-Blankshtain (2008) also found tax policy can cause a distortion in use:
Current taxation policies result in increasing numbers of company cars and growing numbers
of transport users who are not sensitive to the marginal cost of car use and make excessive
use of the car. As a result a significant portion of travel demand management (TDM)
measures cannot affect this group.
If employers offer employees a choice between a company car or cash, this creates a distortion towards
long-distance commuters with few public transport options favouring company cars, and those with good
public transport or walking and cycling options choosing cash. While this situation is an improvement on a
no-choice option for those who can walk, cycle or use public transport, it still leaves the employer paying
the running costs of those who live the furthest from their employment. In households with two full-time
workers, there can be a strong incentive for the person who works the furthest from home to have a
company car. In addition, some people with company cars let their spouse use the company car while they
walk or take public transport to work. Thus, the employee bases the use of the company car on who is
driving the longest distance. Alternatively, the choice about where to live in relation to work can be
influenced by the transport options available. Company car users have little or no commuting costs and so
are more likely to choose a longer commute.
Providing subsidies to company cars on a scale such as is suggested in this study represents
serious distortions of consumer choice: in essence making it artificially attractive for consumers
to take home their remuneration in the form of cars. (Naess-Schmidt and Winiarczyk 2010)
Research suggests employees with company cars can pay nothing for petrol or car maintenance as these
costs are usually paid with a fleet or fuel card and billed directly to the company. With no marginal costs to
pay, there is no incentive for company car drivers to reduce distances travelled, drive economically, or select
an efficient vehicle. This market failure leads to the types of distortions found in other research:
In 2001 the average annual commuting distance for company cars in the Netherlands was
12,700 km in comparison to 5,600 km for driver owned cars. (Graus and Worrell 2008)
Dargay (2005) found having a company car in the household increased commuting by car for both
genders, but more so for men (coefficient 0.57) than for women (coefficient 0.31). Having a company car
also reduced the chances of changing commuting mode (coefficient -0.24).
A study of company travel subsidies in London found 50% of all cars entering central London during the
survey period 7am to 1pm were company cars (Kompfner et al 1991). Over 50% of commuters in both
company and private cars had a parking space provided. Most public transport passengers received no
transport subsidy, while those who did predominantly received a loan to pay for the annual ticket. Knight
et al (2000) found 80% of all cars entering central London during the day received some form of transport
subsidy, with 44% being company cars. In other research, Kompfner et al (1991) found one in five
2 Company cars – international perspectives
19
individuals who had a company car chose to travel by public transport instead. This indicated around 20%
of company cars provided in London were not used for commuting to work; thus, their use was almost
entirely for recreation in the weekends.
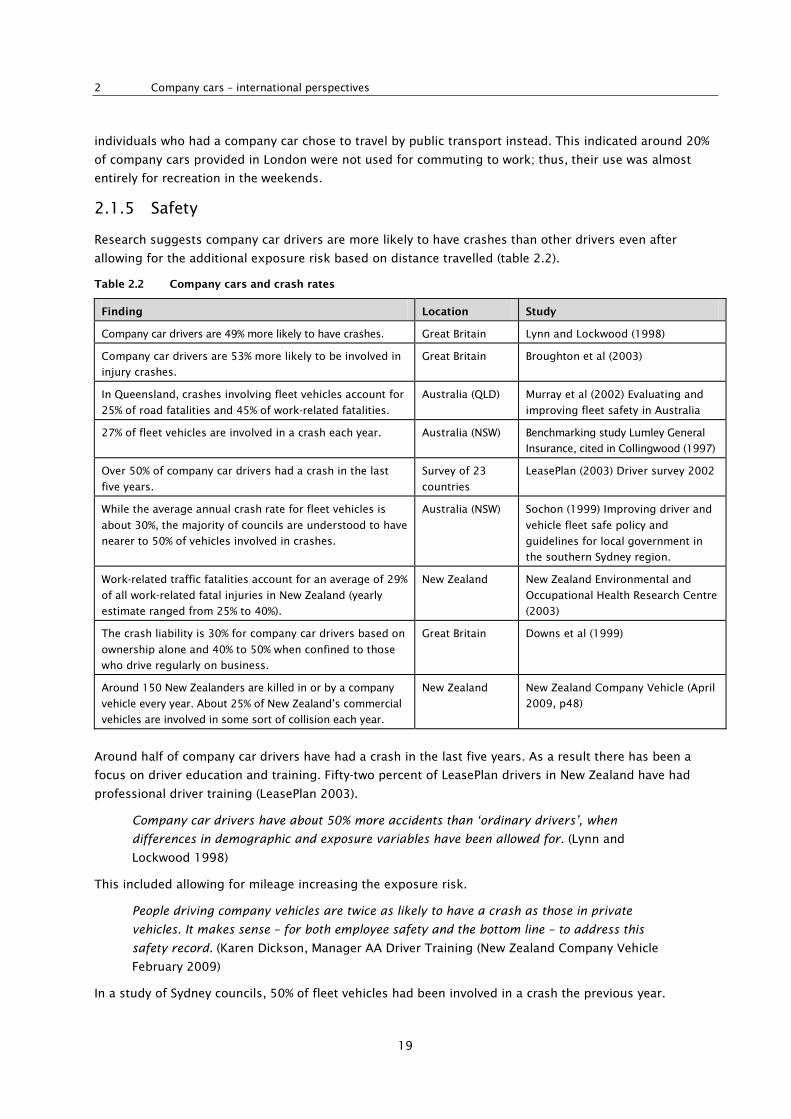
2.1.5 Safety
Research suggests company car drivers are more likely to have crashes than other drivers even after
allowing for the additional exposure risk based on distance travelled (table 2.2).
Table 2.2 Company cars and crash rates
Finding Location Study
Company car drivers are 49% more likely to have crashes. Great Britain Lynn and Lockwood (1998)
Company car drivers are 53% more likely to be involved in
injury crashes.
Great Britain Broughton et al (2003)
In Queensland, crashes involving fleet vehicles account for
25% of road fatalities and 45% of work-related fatalities.
Australia (QLD) Murray et al (2002) Evaluating and
improving fleet safety in Australia
27% of fleet vehicles are involved in a crash each year. Australia (NSW) Benchmarking study Lumley General
Insurance, cited in Collingwood (1997)
Over 50% of company car drivers had a crash in the last
five years.
Survey of 23
countries
LeasePlan (2003) Driver survey 2002
While the average annual crash rate for fleet vehicles is
about 30%, the majority of councils are understood to have
nearer to 50% of vehicles involved in crashes.
Australia (NSW) Sochon (1999) Improving driver and
vehicle fleet safe policy and
guidelines for local government in
the southern Sydney region.
Work-related traffic fatalities account for an average of 29%
of all work-related fatal injuries in New Zealand (yearly
estimate ranged from 25% to 40%).
New Zealand New Zealand Environmental and
Occupational Health Research Centre
(2003)
The crash liability is 30% for company car drivers based on
ownership alone and 40% to 50% when confined to those
who drive regularly on business.
Great Britain Downs et al (1999)
Around 150 New Zealanders are killed in or by a company
vehicle every year. About 25% of New Zealand’s commercial
vehicles are involved in some sort of collision each year.
New Zealand New Zealand Company Vehicle (April
2009, p48)
Around half of company car drivers have had a crash in the last five years. As a result there has been a
focus on driver education and training. Fifty-two percent of LeasePlan drivers in New Zealand have had
professional driver training (LeasePlan 2003).
Company car drivers have about 50% more accidents than ‘ordinary drivers’, when
differences in demographic and exposure variables have been allowed for. (Lynn and
Lockwood 1998)
This included allowing for mileage increasing the exposure risk.
People driving company vehicles are twice as likely to have a crash as those in private
vehicles. It makes sense – for both employee safety and the bottom line – to address this
safety record. (Karen Dickson, Manager AA Driver Training (New Zealand Company Vehicle
February 2009)
In a study of Sydney councils, 50% of fleet vehicles had been involved in a crash the previous year.
Company cars and fringe benefit tax – understanding the impacts on strategic transport targets
20
Whilst the average crash rate for fleet vehicles is about 30%, (that is a third of the fleet will
be involved in some sort of accident in each year), the majority of Councils are understood to
have nearer to 50% of vehicles involved in crashes. The bulk of these accidents are in the
light fleet, with about 60% of the accidents having the Council driver at least partially at
fault. (Sochon 1999)
Increased crash rates in company cars may be explained by the fact that drivers do not own the vehicle, and
do not have to pay for the damage to the vehicle or pay for insurance or importantly the insurance excess.
The absence of this price – or cost-based incentive – to drive safely may have an overly strong influence on
the way these vehicles are driven. While these factors are not related to their FBT status, they can be
important in relation to road safety outcomes, fatal injury and workplace crash reduction strategies.
Other factors that may contribute to increased crash rates in company cars include high annual vehicle
kilometres, the time of day, fatigue issues and some increased risk of drink-driving, speeding and other
driver-related factors. Pool vehicles can be more powerful than an employee’s private vehicle, indicators
may be on the opposite side and braking may be more or less sensitive than the driver is accustomed to.
There is a potential attitudinal risk associated with driving vehicles that are not directly owned by the
driver. While company car drivers may not ‘drive it like it’s a rental’ or ‘drive it like you stole it’, there is a
potential for a ‘diminished responsibility effect’ that needs to be addressed through a mix of driver
training and effective employer, lease company and insurance policy. Insurers could give discounts for
companies with driver training programmes and the Accident Compensation Corporation (ACC) could add
more accurate risk assessment to the motor vehicle and employer partnership accounts.
The Manslaughter and Corporate Homicide Act 2007 in the UK has refocused attention on the duty of care
that employers have towards those who drive as part of their employment. The education and training of
drivers and use of cars with high safety ratings is expected to increase because of this Act. However, at the
time of writing this report, no research into the effectiveness of the Act appeared to have been published.
Company cars are considered workplaces for employees who drive as part of their work duties. These
workplace vehicles are more likely to have advanced safety features. Each manufacturer has different
names for their innovations due to patents and trademarks. Safety features such as electronic stability
programmes (ESP®), roll over mitigation, roll movement intervention, load adaptive control, enhanced
under-steering control, anti-slip regulation, front, side and curtain airbags, electronic brake force
distribution, anti-lock braking system (ABS), emergency brake assist, brake assist system, dynamic
stability control, vehicle stability control and traction control are all common features of company cars.
More advanced technologies such as a pre-collision system are emerging. While airbags and ABS are
common in second-hand imported vehicles, the more advanced features are further away. Five-star
Australasian New Car Assessment Program (ANCAP) ratings are also common features of fleet cars.
In this day and age the more ANCAP stars you have on a fleet vehicle the better it will fare in
the market. (New Zealand Company Vehicle April 2009, p38)
The introduction of safety features can give a false sense of security, which leads to increased risk taking
that offsets safety benefits to some extent (Chirinko and Harper 1993).
2.1.6 Energy and emissions
Energy and emissions have become an increasingly important part of government policy.
It is not an exaggeration to claim that the future of human prosperity depends on how
successfully we tackle the two central energy challenges facing us today: securing the supply of
reliable and affordable energy: and effecting a rapid transformation to a low-carbon, efficient
2 Company cars – international perspectives
21
and environmentally benign system of energy supply. The world’s energy system is at a
crossroads. Current global trends in energy supply and consumption are patently unsustainable –
environmentally, economically, and socially. (International Energy Agency 2008)
The transport sector makes up a large section of total emissions and of total energy consumption; as a result,
many countries have targeted the transport sector in order to address their overall energy and emissions.
Emissions from road transport account for the largest share of national transport emissions at 90%. This
represents 38% of the total energy carbon dioxide equivalent emissions for New Zealand (MED 2009).
Emissions from national transport continue to account for the largest share of total energy
emissions. National transport emissions have grown by 64% since 1990 at an average growth
rate of 2.8% per annum. (MED 2009)
The road transport sector has to dramatically change the emissions profile of the fleet or it will end up
paying in some manner for the emissions created. Some changes have already been noted. Prior to the
high oil prices of 2007, the trends were towards larger vehicles and cars had become heavier and more
powerful, reducing efficiency gains. The recent increase in fuel prices driven by demand has been the
predominant reason for the trend towards vehicles that are more fuel efficient. Manufacturers have
responded by making cars and engines lighter by using more aluminium and plastics.
The problem is exemplified in The Netherlands:
Of all passenger cars in the Netherlands, 11% are classified as company cars, which consume
21% of the total energy consumption by passenger cars. (Graus et al 2008)
2.2 Company car policy in economies similar to New Zealand
New Zealand has high levels of household car ownership; it is in the top five in the world on a car per
1000 population basis. The New Zealand transport, economy and employment context are most similar to
Australia, the UK and other western democracies.
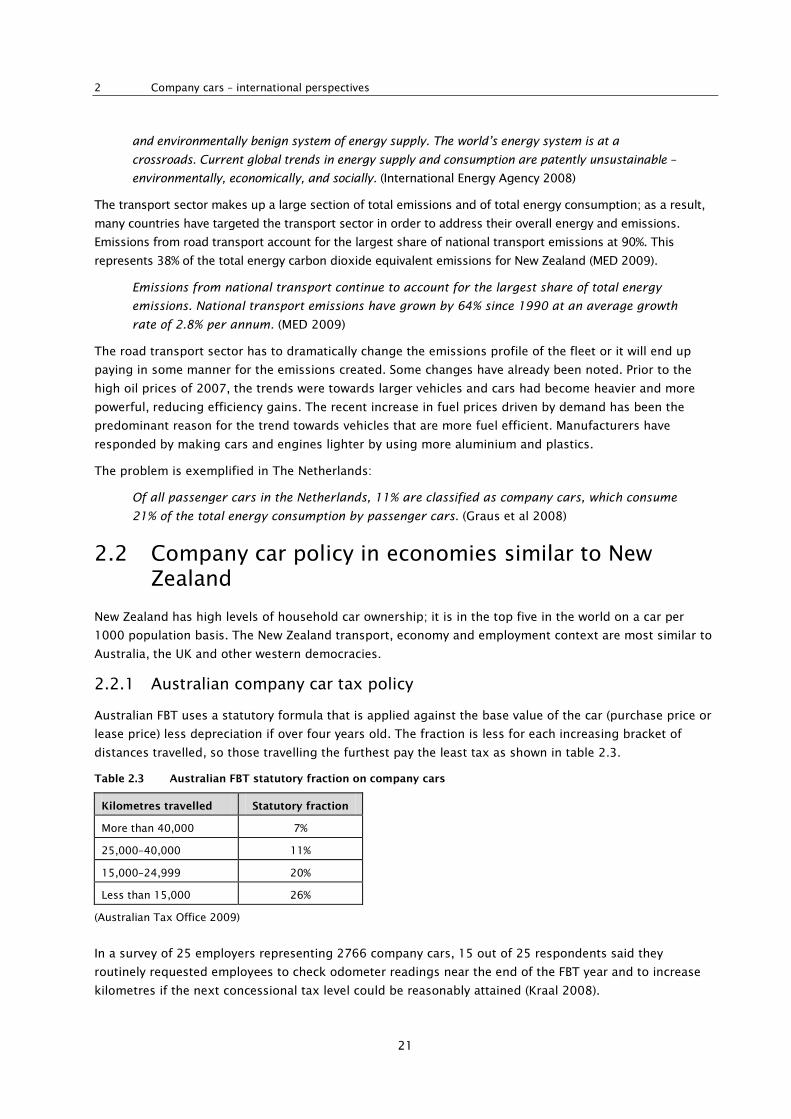
2.2.1 Australian company car tax policy
Australian FBT uses a statutory formula that is applied against the base value of the car (purchase price or
lease price) less depreciation if over four years old. The fraction is less for each increasing bracket of
distances travelled, so those travelling the furthest pay the least tax as shown in table 2.3.
Table 2.3 Australian FBT statutory fraction on company cars
Kilometres travelled Statutory fraction
More than 40,000 7%
25,000–40,000 11%
15,000–24,999 20%
Less than 15,000 26%
(Australian Tax Office 2009)
In a survey of 25 employers representing 2766 company cars, 15 out of 25 respondents said they
routinely requested employees to check odometer readings near the end of the FBT year and to increase
kilometres if the next concessional tax level could be reasonably attained (Kraal 2008).
Company cars and fringe benefit tax – understanding the impacts on strategic transport targets
22
Warren (2006) noted ‘If the ultimate objective of taxing fringe benefits is to make employees and
employers indifferent as to whether fringe benefits or wage income is provided, then Australia’s approach
does not achieve this goal’.
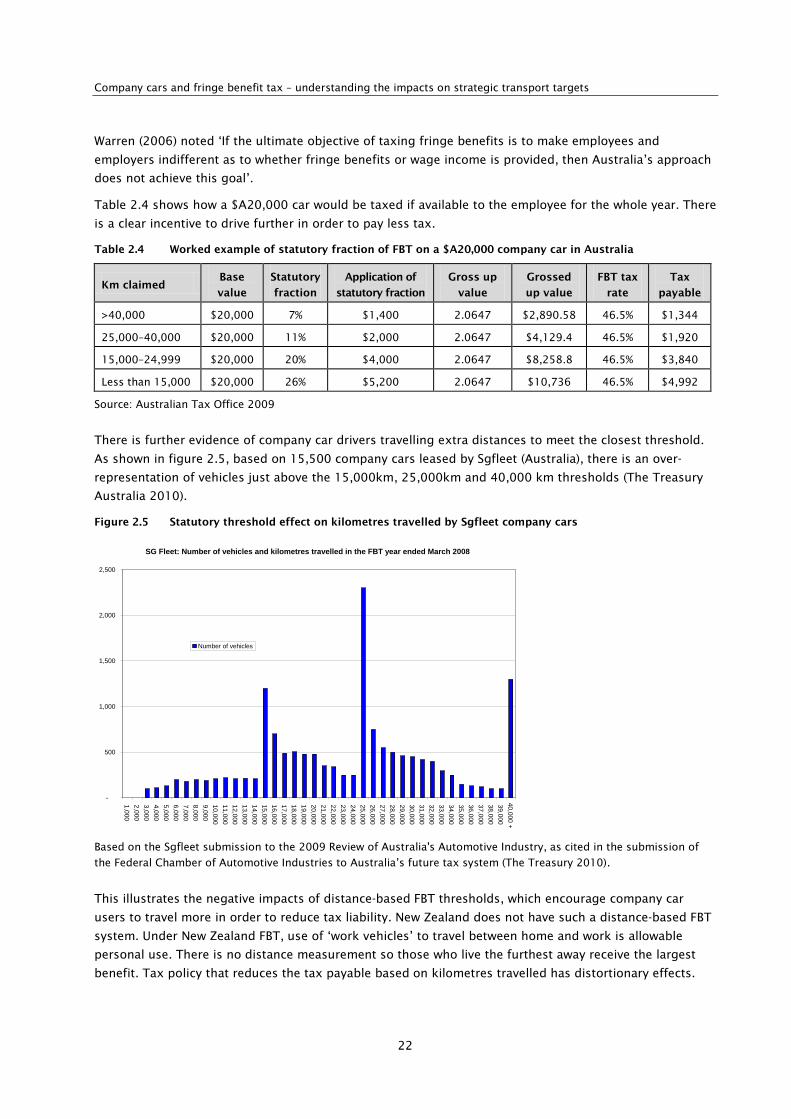
Table 2.4 shows how a $A20,000 car would be taxed if available to the employee for the whole year. There
is a clear incentive to drive further in order to pay less tax.
Table 2.4 Worked example of statutory fraction of FBT on a $A20,000 company car in Australia
Km claimed Base
value
Statutory
fraction
Application of
statutory fraction
Gross up
value
Grossed
up value
FBT tax
rate
Tax
payable
>40,000 $20,000 7% $1,400 2.0647 $2,890.58 46.5% $1,344
25,000–40,000 $20,000 11% $2,000 2.0647 $4,129.4 46.5% $1,920
15,000–24,999 $20,000 20% $4,000 2.0647 $8,258.8 46.5% $3,840
Less than 15,000 $20,000 26% $5,200 2.0647 $10,736 46.5% $4,992
Source: Australian Tax Office 2009
There is further evidence of company car drivers travelling extra distances to meet the closest threshold.
As shown in figure 2.5, based on 15,500 company cars leased by Sgfleet (Australia), there is an over-
representation of vehicles just above the 15,000km, 25,000km and 40,000 km thresholds (The Treasury
Australia 2010).
Figure 2.5 Statutory threshold effect on kilometres travelled by Sgfleet company cars
Based on the Sgfleet submission to the 2009 Review of Australia's Automotive Industry, as cited in the submission of
the Federal Chamber of Automotive Industries to Australia’s future tax system (The Treasury 2010).
This illustrates the negative impacts of distance-based FBT thresholds, which encourage company car
users to travel more in order to reduce tax liability. New Zealand does not have such a distance-based FBT
system. Under New Zealand FBT, use of ‘work vehicles’ to travel between home and work is allowable
personal use. There is no distance measurement so those who live the furthest away receive the largest
benefit. Tax policy that reduces the tax payable based on kilometres travelled has distortionary effects.
SG Fleet: Number of vehicles and kilometres travelled in the FBT year ended March 2008
-
500
1,000
1,500
2,000
2,500
1,000 2,000 3,000 4,000 5,000 6,000 7,000 8,000 9,000 10,000 11,000 12,000 13,000 14,000 15,000 16,000 17,000 18,000 19,000 20,000 21,000 22,000 23,000 24,000 25,000 26,000 27,000 28,000 29,000 30,000 31,000 32,000 33,000 34,000 35,000 36,000 37,000 38,000 39,000 40,000 +
Number of vehicles
2 Company cars – international perspectives
23
2.2.2 UK company car tax policy
The UK changed its tax treatment of company cars in 2002 to encourage the purchase and use of
environmentally friendly cars to target a reduction in carbon emissions (see the website of Her Majesty’s
Revenue and Customs www.hmrc.gov.uk). Prior to the changes there was a fixed charge for fuel used for
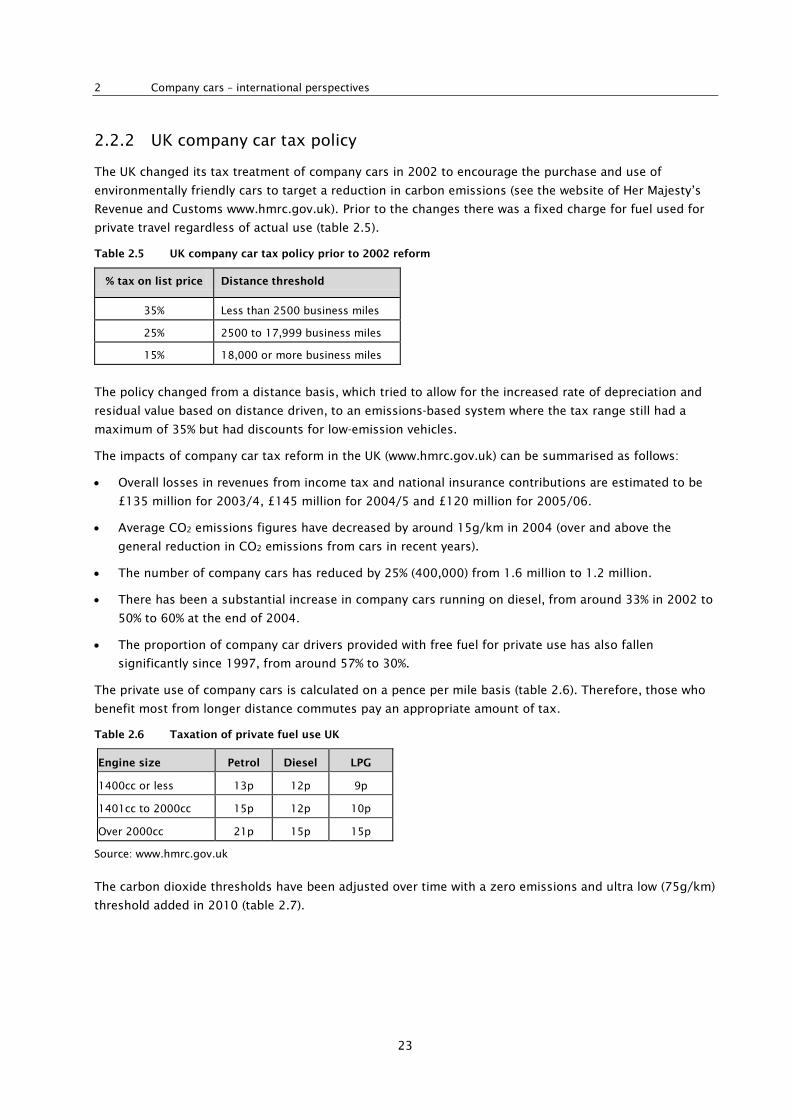
private travel regardless of actual use (table 2.5). Table 2.5 UK company car tax policy prior to 2002 reform
% tax on list price Distance threshold
35% Less than 2500 business miles
25% 2500 to 17,999 business miles
15% 18,000 or more business miles
The policy changed from a distance basis, which tried to allow for the increased rate of depreciation and
residual value based on distance driven, to an emissions-based system where the tax range still had a
maximum of 35% but had discounts for low-emission vehicles.
The impacts of company car tax reform in the UK (www.hmrc.gov.uk) can be summarised as follows:
• Overall losses in revenues from income tax and national insurance contributions are estimated to be
£135 million for 2003/4, £145 million for 2004/5 and £120 million for 2005/06.
• Average CO2 emissions figures have decreased by around 15g/km in 2004 (over and above the
general reduction in CO2 emissions from cars in recent years).
• The number of company cars has reduced by 25% (400,000) from 1.6 million to 1.2 million.
• There has been a substantial increase in company cars running on diesel, from around 33% in 2002 to
50% to 60% at the end of 2004.
• The proportion of company car drivers provided with free fuel for private use has also fallen
significantly since 1997, from around 57% to 30%.
The private use of company cars is calculated on a pence per mile basis (table 2.6). Therefore, those who
benefit most from longer distance commutes pay an appropriate amount of tax.
Table 2.6 Taxation of private fuel use UK
Engine size Petrol Diesel LPG
1400cc or less 13p 12p 9p
1401cc to 2000cc 15p 12p 10p
Over 2000cc 21p 15p 15p
Source: www.hmrc.gov.uk
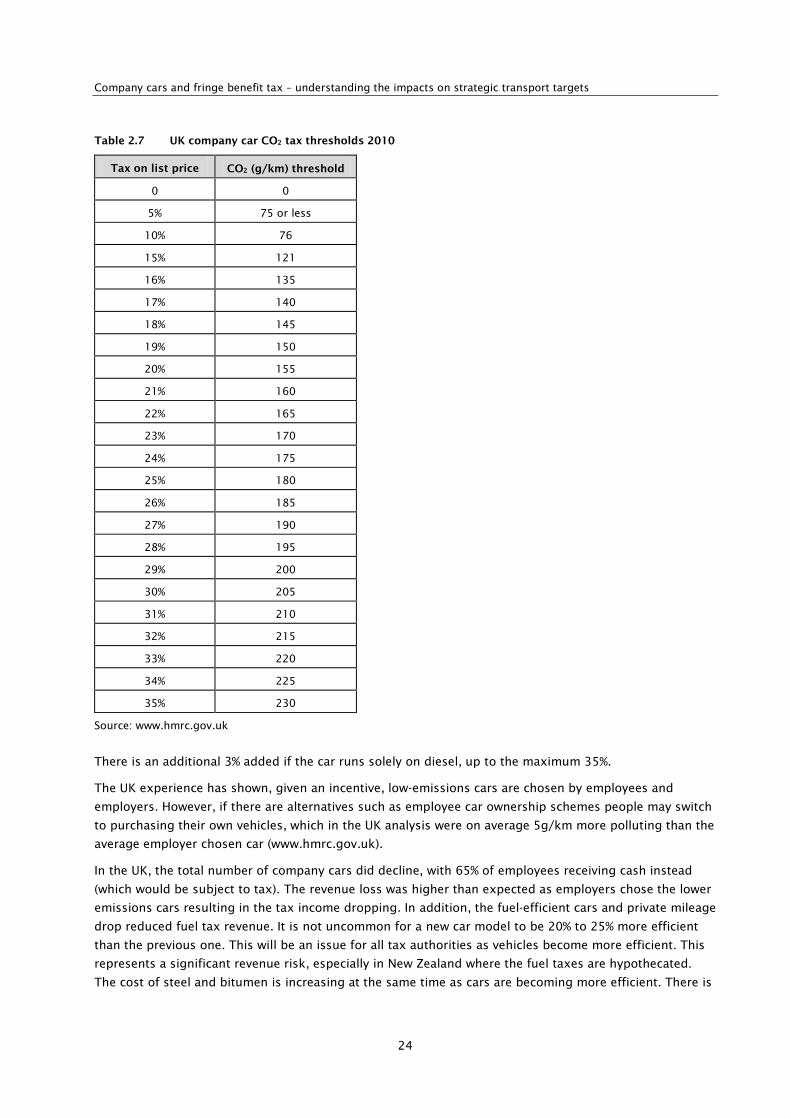
The carbon dioxide thresholds have been adjusted over time with a zero emissions and ultra low (75g/km)
threshold added in 2010 (table 2.7).
Company cars and fringe benefit tax – understanding the impacts on strategic transport targets
24
Table 2.7 UK company car CO2 tax thresholds 2010
Tax on list price CO2 (g/km) threshold
0 0
5% 75 or less
10% 76
15% 121
16% 135
17% 140
18% 145
19% 150
20% 155
21% 160
22% 165
23% 170
24% 175
25% 180
26% 185
27% 190
28% 195
29% 200
30% 205
31% 210
32% 215
33% 220
34% 225
35% 230
Source: www.hmrc.gov.uk
There is an additional 3% added if the car runs solely on diesel, up to the maximum 35%.
The UK experience has shown, given an incentive, low-emissions cars are chosen by employees and
employers. However, if there are alternatives such as employee car ownership schemes people may switch
to purchasing their own vehicles, which in the UK analysis were on average 5g/km more polluting than the
average employer chosen car (www.hmrc.gov.uk).
In the UK, the total number of company cars did decline, with 65% of employees receiving cash instead
(which would be subject to tax). The revenue loss was higher than expected as employers chose the lower
emissions cars resulting in the tax income dropping. In addition, the fuel-efficient cars and private mileage
drop reduced fuel tax revenue. It is not uncommon for a new car model to be 20% to 25% more efficient
than the previous one. This will be an issue for all tax authorities as vehicles become more efficient. This
represents a significant revenue risk, especially in New Zealand where the fuel taxes are hypothecated.
The cost of steel and bitumen is increasing at the same time as cars are becoming more efficient. There is
2 Company cars – international perspectives
25
some suppression of transport demand which reduces the petrol tax revenue while road building is
becoming more expensive.
2.2.3 Company car and FBT reform in Ireland
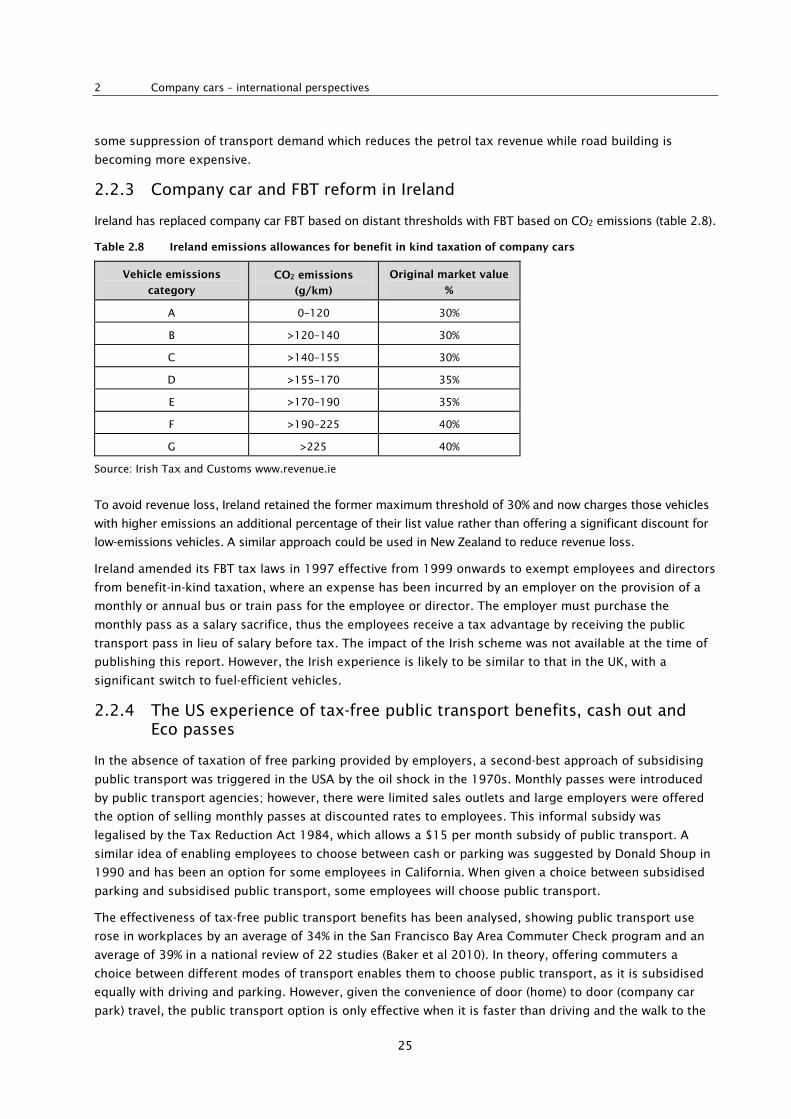
Ireland has replaced company car FBT based on distant thresholds with FBT based on CO2 emissions (table 2.8).
Table 2.8 Ireland emissions allowances for benefit in kind taxation of company cars
Vehicle emissions
category
CO2 emissions
(g/km)
Original market value
%
A 0–120 30%
B >120–140 30%
C >140–155 30%
D >155–170 35%
E >170–190 35%
F >190–225 40%
G >225 40%
Source: Irish Tax and Customs www.revenue.ie
To avoid revenue loss, Ireland retained the former maximum threshold of 30% and now charges those vehicles
with higher emissions an additional percentage of their list value rather than offering a significant discount for
low-emissions vehicles. A similar approach could be used in New Zealand to reduce revenue loss.
Ireland amended its FBT tax laws in 1997 effective from 1999 onwards to exempt employees and directors
from benefit-in-kind taxation, where an expense has been incurred by an employer on the provision of a
monthly or annual bus or train pass for the employee or director. The employer must purchase the
monthly pass as a salary sacrifice, thus the employees receive a tax advantage by receiving the public
transport pass in lieu of salary before tax. The impact of the Irish scheme was not available at the time of
publishing this report. However, the Irish experience is likely to be similar to that in the UK, with a
significant switch to fuel-efficient vehicles.
2.2.4 The US experience of tax-free public transport benefits, cash out and Eco passes
In the absence of taxation of free parking provided by employers, a second-best approach of subsidising
public transport was triggered in the USA by the oil shock in the 1970s. Monthly passes were introduced
by public transport agencies; however, there were limited sales outlets and large employers were offered
the option of selling monthly passes at discounted rates to employees. This informal subsidy was
legalised by the Tax Reduction Act 1984, which allows a $15 per month subsidy of public transport. A
similar idea of enabling employees to choose between cash or parking was suggested by Donald Shoup in
1990 and has been an option for some employees in California. When given a choice between subsidised
parking and subsidised public transport, some employees will choose public transport.
The effectiveness of tax-free public transport benefits has been analysed, showing public transport use
rose in workplaces by an average of 34% in the San Francisco Bay Area Commuter Check program and an
average of 39% in a national review of 22 studies (Baker et al 2010). In theory, offering commuters a
choice between different modes of transport enables them to choose public transport, as it is subsidised
equally with driving and parking. However, given the convenience of door (home) to door (company car
park) travel, the public transport option is only effective when it is faster than driving and the walk to the
Company cars and fringe benefit tax – understanding the impacts on strategic transport targets
26
office is short. For this reason it is often successful in the congested CBDs of the USA. Forty-three percent
of San Francisco Bay Area Rapid Transit (BART) passengers work for employers offering a public transport
benefit programme (Oram 2008).
Employers can benefit from lower car parking demand especially in the CBD where land values make
parking spaces expensive to provide.
It is hard to underestimate the role of workplace parking policies in urban transportation.
Free parking is a potent market distortion with profound effects on transit demand, auto
ownership, land use patterns, and home ownership decisions, such as commuting distance or
the choice between an apartment or a single family residence. (Baker et al 2010)
Enabling a tax concession for public transport adds another subsidy of motorised transport, while those
who walk or bicycle receive no subsidy. Even if a bicycle subsidy is allowed, the relative value is low as a
bicycle may cost much less than a company car or annual public transport ticket. Subsidy of bicycles has
been part of tax reform in several countries. Bicycles have low running costs after the initial purchase. A
limited number of people live within cycling range of their work and others may not see cycling as a viable
option; therefore, in terms of total revenue loss a bicycling subsidy is a low-risk option.
The U-Pass program of the University of Washington reduced the percentage of employees driving alone to
the university from 33% to 23%. The price of parking at the university was increased by 50% and the
revenue was used to subsidise public transport. The success of the U-Pass resulted in the Seattle Metro
introducing a subsidised Flexpass for employers. In 2005, 130 workplaces and 118,000 commuters used
the Flexpass program (University of Washington 2005).
2.2.5 Comparison of FBT policies
The impact of company car tax policy varies from country to country and the scale of impact is linked to
the incidence of company cars in employment packages. In countries where company cars are available for
a larger proportion of the work force, the impact on the transport system is much greater. Over time,
company cars have diminished as a fringe benefit. If a large number of employers offer company cars, this
can become self-perpetuating as employees expect a company car as part of their employment package.
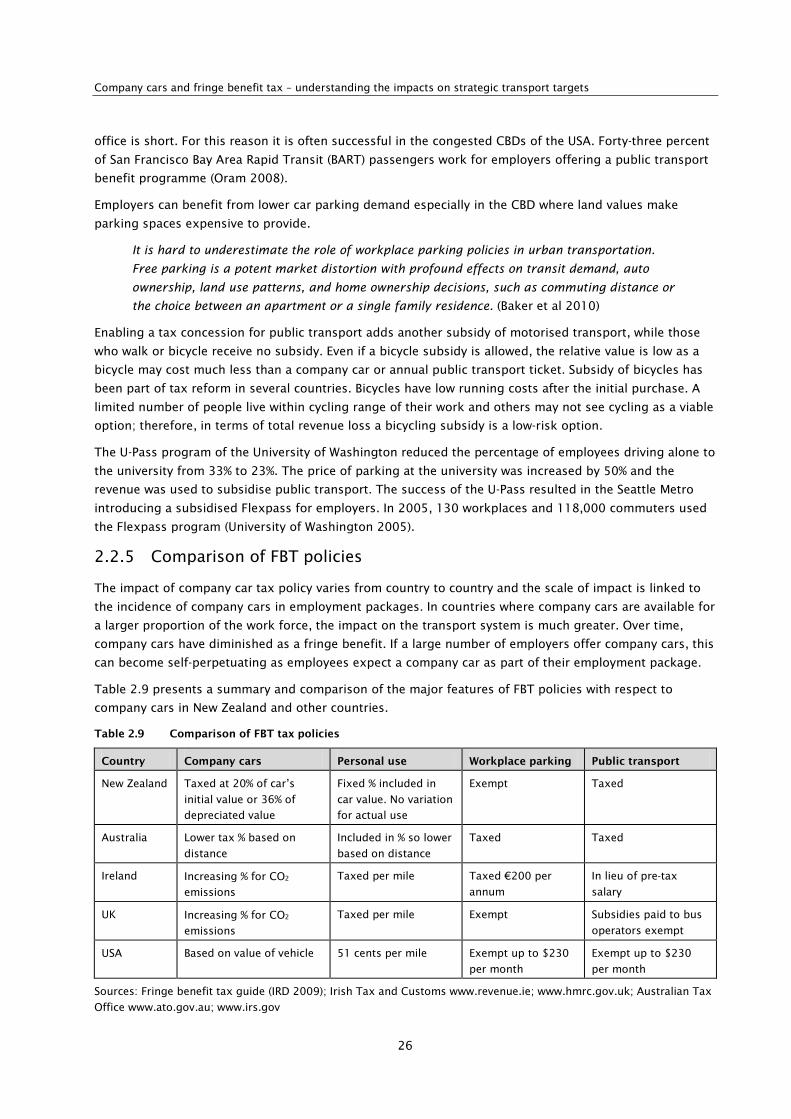
Table 2.9 presents a summary and comparison of the major features of FBT policies with respect to
company cars in New Zealand and other countries.
Table 2.9 Comparison of FBT tax policies
Country Company cars Personal use Workplace parking Public transport
New Zealand Taxed at 20% of car’s
initial value or 36% of
depreciated value
Fixed % included in
car value. No variation
for actual use
Exempt Taxed
Australia Lower tax % based on
distance
Included in % so lower
based on distance
Taxed Taxed
Ireland Increasing % for CO2
emissions
Taxed per mile Taxed €200 per
annum
In lieu of pre-tax
salary
UK Increasing % for CO2 emissions
Taxed per mile Exempt Subsidies paid to bus
operators exempt
USA Based on value of vehicle 51 cents per mile Exempt up to $230
per month
Exempt up to $230
per month
Sources: Fringe benefit tax guide (IRD 2009); Irish Tax and Customs www.revenue.ie; www.hmrc.gov.uk; Australian Tax
Office www.ato.gov.au; www.irs.gov

2 Company cars – international perspectives
27
Workplace parking is exempt in New Zealand (if provided on the employer’s own premises) but not in
Ireland or Australia.
Public transport is taxed in New Zealand (at the time of drafting the report). In the USA, public transport
tickets provided by employers are exempt from FBT.
Only New Zealand has a fixed personal use rate while all other countries require personal use to be
measured and tax paid on a per mile basis or equivalent.
The UK has been progressive in introducing emissions-based taxation, which has also been adopted by
Ireland and Belgium. Most European nations also consider emissions in vehicle registration fees.
Company cars and fringe benefit tax – understanding the impacts on strategic transport targets
28
3 The company car in New Zealand
This chapter describes current tax policy, fleet characteristics and the impact of company cars on
employee travel behaviour in New Zealand. The relative magnitude of incentives which company cars
represent for employees is also explored.
3.1 Current tax policy
The IRD allows two methods for identifying the value of the company car. This amount is added to the
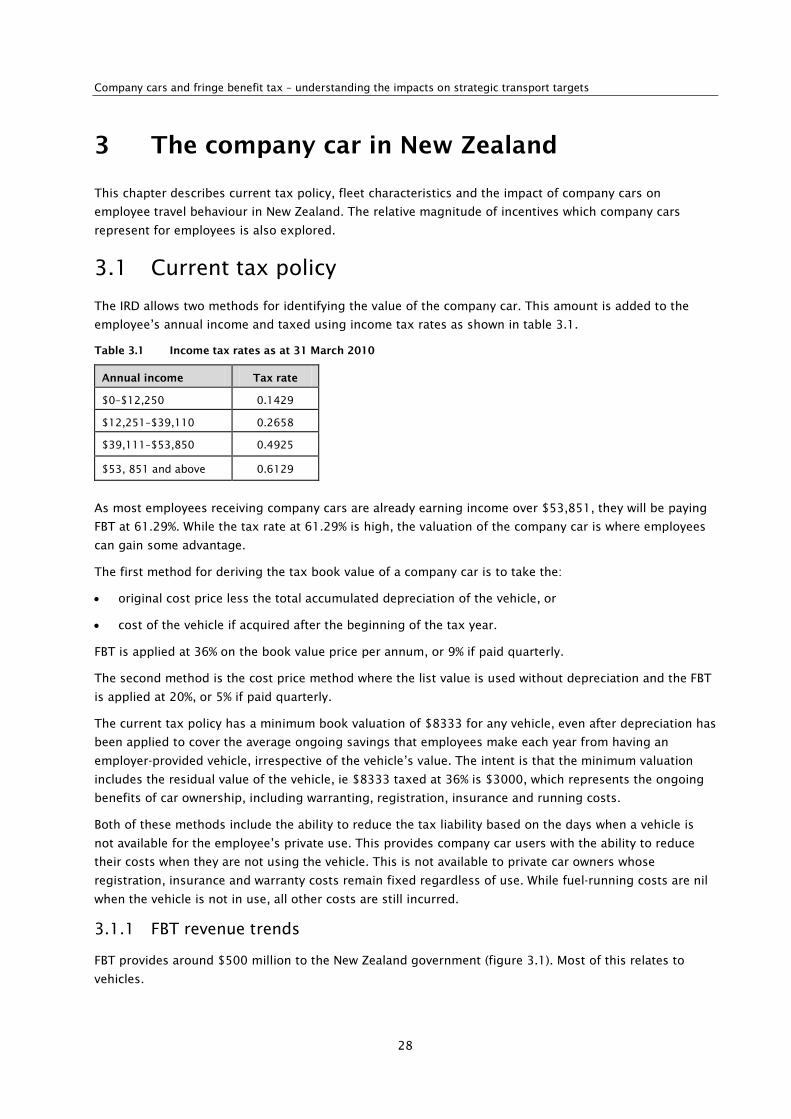
employee’s annual income and taxed using income tax rates as shown in table 3.1.
Table 3.1 Income tax rates as at 31 March 2010
Annual income Tax rate
$0–$12,250 0.1429
$12,251–$39,110 0.2658
$39,111–$53,850 0.4925
$53, 851 and above 0.6129
As most employees receiving company cars are already earning income over $53,851, they will be paying
FBT at 61.29%. While the tax rate at 61.29% is high, the valuation of the company car is where employees
can gain some advantage.
The first method for deriving the tax book value of a company car is to take the:
• original cost price less the total accumulated depreciation of the vehicle, or
• cost of the vehicle if acquired after the beginning of the tax year.
FBT is applied at 36% on the book value price per annum, or 9% if paid quarterly.
The second method is the cost price method where the list value is used without depreciation and the FBT
is applied at 20%, or 5% if paid quarterly.
The current tax policy has a minimum book valuation of $8333 for any vehicle, even after depreciation has
been applied to cover the average ongoing savings that employees make each year from having an
employer-provided vehicle, irrespective of the vehicle’s value. The intent is that the minimum valuation
includes the residual value of the vehicle, ie $8333 taxed at 36% is $3000, which represents the ongoing
benefits of car ownership, including warranting, registration, insurance and running costs.
Both of these methods include the ability to reduce the tax liability based on the days when a vehicle is
not available for the employee’s private use. This provides company car users with the ability to reduce
their costs when they are not using the vehicle. This is not available to private car owners whose
registration, insurance and warranty costs remain fixed regardless of use. While fuel-running costs are nil
when the vehicle is not in use, all other costs are still incurred.
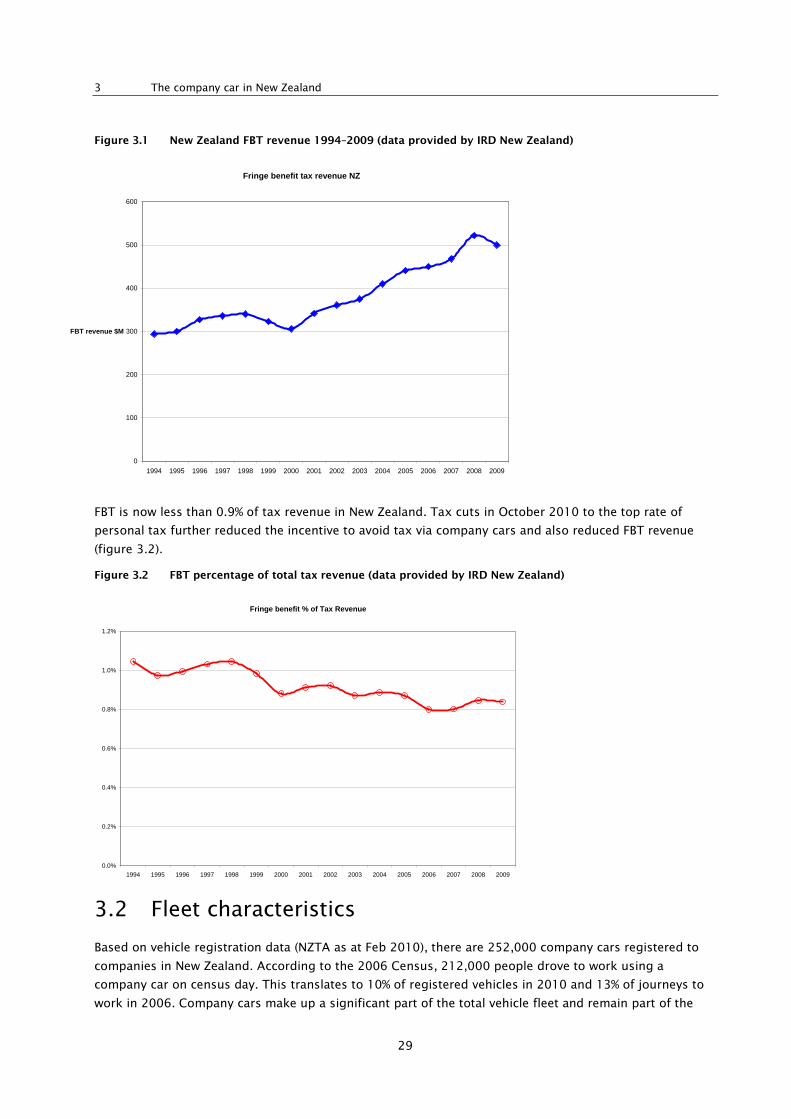
3.1.1 FBT revenue trends
FBT provides around $500 million to the New Zealand government (figure 3.1). Most of this relates to
vehicles.
3 The company car in New Zealand
29
Figure 3.1 New Zealand FBT revenue 1994–2009 (data provided by IRD New Zealand)
FBT is now less than 0.9% of tax revenue in New Zealand. Tax cuts in October 2010 to the top rate of
personal tax further reduced the incentive to avoid tax via company cars and also reduced FBT revenue
(figure 3.2).
Figure 3.2 FBT percentage of total tax revenue (data provided by IRD New Zealand)
3.2 Fleet characteristics
Based on vehicle registration data (NZTA as at Feb 2010), there are 252,000 company cars registered to
companies in New Zealand. According to the 2006 Census, 212,000 people drove to work using a
company car on census day. This translates to 10% of registered vehicles in 2010 and 13% of journeys to
work in 2006. Company cars make up a significant part of the total vehicle fleet and remain part of the
Fringe benefit tax revenue NZ
0
100
200
300
400
500
600
1994 1995 1996 1997 1998 1999 2000 2001 2002 2003 2004 2005 2006 2007 2008 2009
FBT revenue $M
Fringe benefit % of Tax Revenue
0.0%
0.2%
0.4%
0.6%
0.8%
1.0%
1.2%
1994 1995 1996 1997 1998 1999 2000 2001 2002 2003 2004 2005 2006 2007 2008 2009
Company cars and fringe benefit tax – understanding the impacts on strategic transport targets
30
fleet when they are sold after three to five years. The following analysis provides insight into the
differences between company cars and the rest of the fleet.
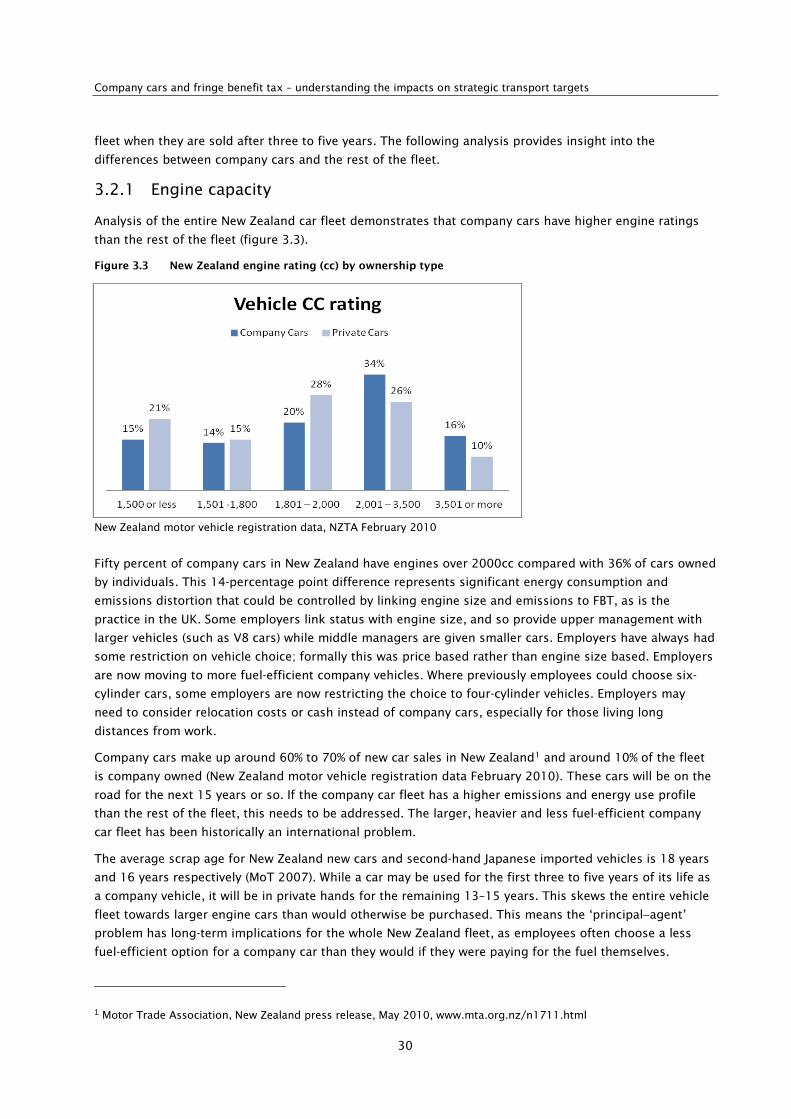
3.2.1 Engine capacity
Analysis of the entire New Zealand car fleet demonstrates that company cars have higher engine ratings
than the rest of the fleet (figure 3.3).
Figure 3.3 New Zealand engine rating (cc) by ownership type
New Zealand motor vehicle registration data, NZTA February 2010
Fifty percent of company cars in New Zealand have engines over 2000cc compared with 36% of cars owned
by individuals. This 14-percentage point difference represents significant energy consumption and
emissions distortion that could be controlled by linking engine size and emissions to FBT, as is the
practice in the UK. Some employers link status with engine size, and so provide upper management with
larger vehicles (such as V8 cars) while middle managers are given smaller cars. Employers have always had
some restriction on vehicle choice; formally this was price based rather than engine size based. Employers
are now moving to more fuel-efficient company vehicles. Where previously employees could choose six-
cylinder cars, some employers are now restricting the choice to four-cylinder vehicles. Employers may
need to consider relocation costs or cash instead of company cars, especially for those living long
distances from work.
Company cars make up around 60% to 70% of new car sales in New Zealand1 and around 10% of the fleet
is company owned (New Zealand motor vehicle registration data February 2010). These cars will be on the
road for the next 15 years or so. If the company car fleet has a higher emissions and energy use profile
than the rest of the fleet, this needs to be addressed. The larger, heavier and less fuel-efficient company
car fleet has been historically an international problem.
The average scrap age for New Zealand new cars and second-hand Japanese imported vehicles is 18 years
and 16 years respectively (MoT 2007). While a car may be used for the first three to five years of its life as
a company vehicle, it will be in private hands for the remaining 13–15 years. This skews the entire vehicle
fleet towards larger engine cars than would otherwise be purchased. This means the ‘principal−agent’
problem has long-term implications for the whole New Zealand fleet, as employees often choose a less
fuel-efficient option for a company car than they would if they were paying for the fuel themselves.
1 Motor Trade Association, New Zealand press release, May 2010, www.mta.org.nz/n1711.html
3 The company car in New Zealand
31
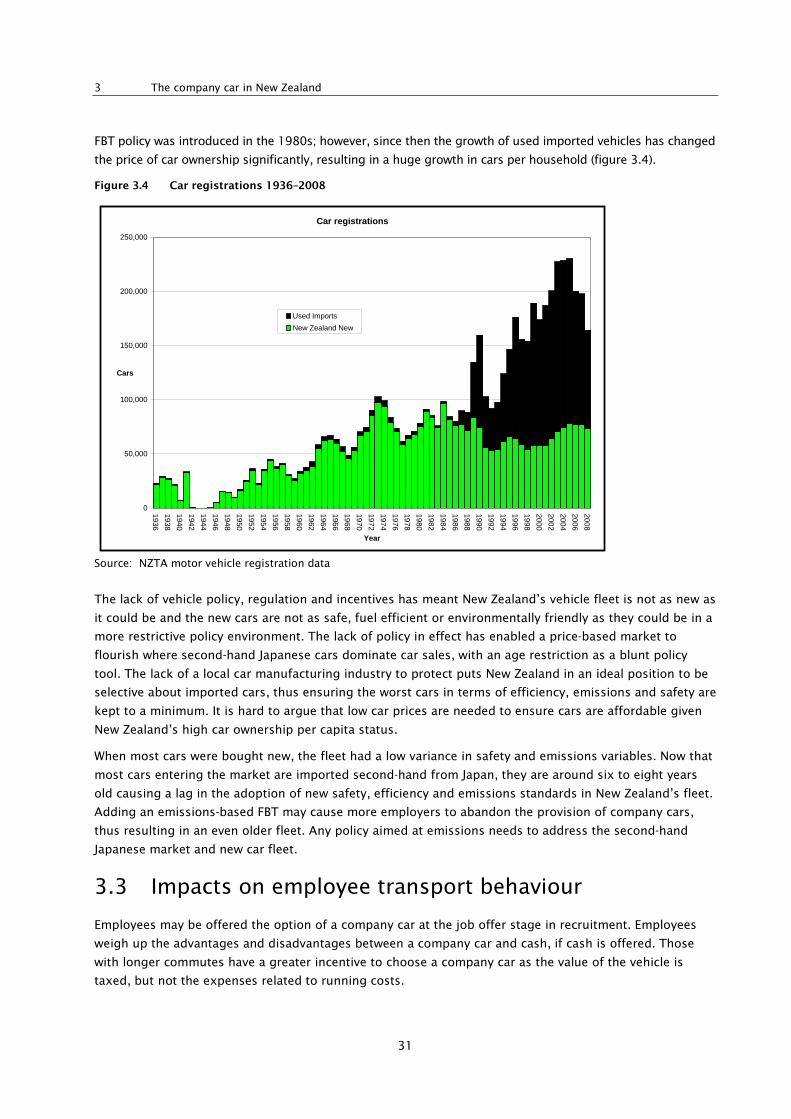
FBT policy was introduced in the 1980s; however, since then the growth of used imported vehicles has changed
the price of car ownership significantly, resulting in a huge growth in cars per household (figure 3.4).
Figure 3.4 Car registrations 1936–2008
Source: NZTA motor vehicle registration data
The lack of vehicle policy, regulation and incentives has meant New Zealand’s vehicle fleet is not as new as
it could be and the new cars are not as safe, fuel efficient or environmentally friendly as they could be in a
more restrictive policy environment. The lack of policy in effect has enabled a price-based market to
flourish where second-hand Japanese cars dominate car sales, with an age restriction as a blunt policy
tool. The lack of a local car manufacturing industry to protect puts New Zealand in an ideal position to be
selective about imported cars, thus ensuring the worst cars in terms of efficiency, emissions and safety are
kept to a minimum. It is hard to argue that low car prices are needed to ensure cars are affordable given
New Zealand’s high car ownership per capita status.
When most cars were bought new, the fleet had a low variance in safety and emissions variables. Now that
most cars entering the market are imported second-hand from Japan, they are around six to eight years
old causing a lag in the adoption of new safety, efficiency and emissions standards in New Zealand’s fleet.
Adding an emissions-based FBT may cause more employers to abandon the provision of company cars,
thus resulting in an even older fleet. Any policy aimed at emissions needs to address the second-hand
Japanese market and new car fleet.
3.3 Impacts on employee transport behaviour
Employees may be offered the option of a company car at the job offer stage in recruitment. Employees
weigh up the advantages and disadvantages between a company car and cash, if cash is offered. Those
with longer commutes have a greater incentive to choose a company car as the value of the vehicle is
taxed, but not the expenses related to running costs.
Car registrations
0
50,000
100,000
150,000
200,000
250,000
1936193819401942194419461948195019521954195619581960196219641966196819701972197419761978198019821984198619881990199219941996199820002002200420062008
Year
Cars
Used ImportsNew Zealand New
Company cars and fringe benefit tax – understanding the impacts on strategic transport targets
32
The effect of a company car on the logarithm of commuting distance is statistically significant and is
about 0.14 (Gutiérrez-i-Puigarnau and van Ommeren 2009).
There is not the same financial incentive for drivers to choose smaller cars if a third party is paying the fuel
bills. The addition of a carbon price to fuel has limited or no effect on company car drivers who are not
paying fuel costs. The distortion towards cars with larger engines is a classic principal–agent problem where
the individual who chooses and uses the vehicle does not pay for its costs. Fleet-leasing companies reacted
first to the issue of fuel efficiency, due to their exposure to residual values. While employers are now acutely
aware of fuel costs this has not been the case historically.
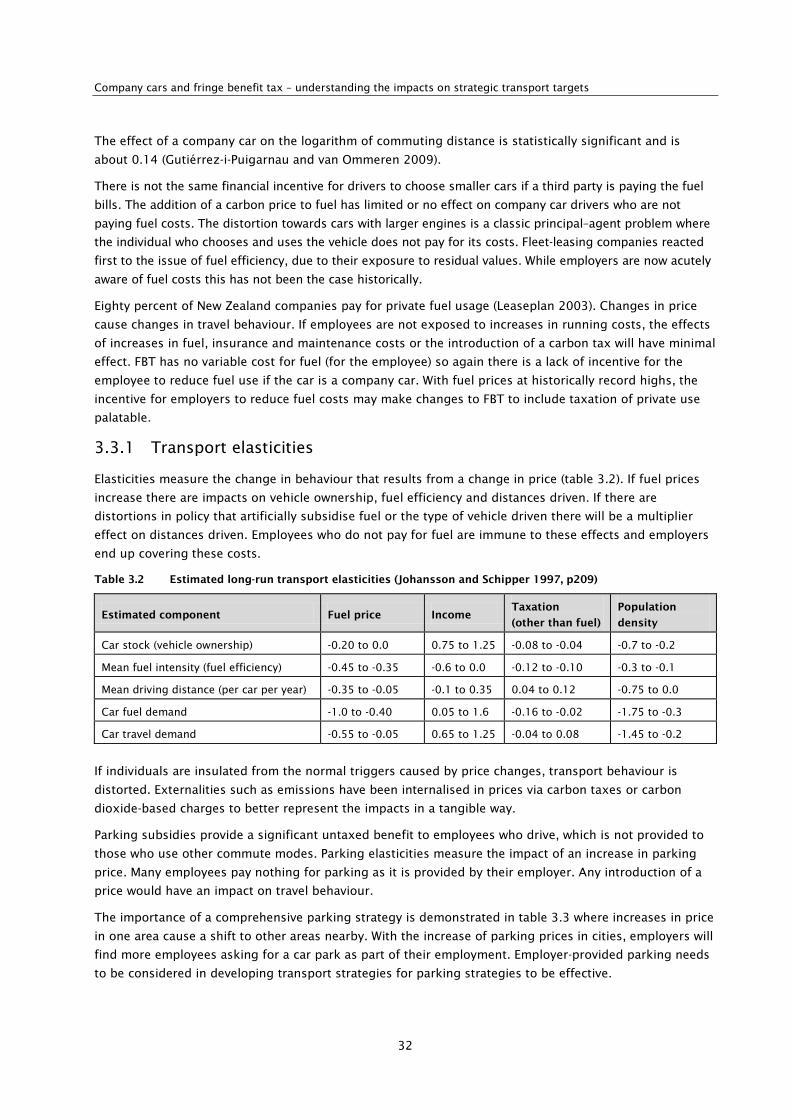
Eighty percent of New Zealand companies pay for private fuel usage (Leaseplan 2003). Changes in price
cause changes in travel behaviour. If employees are not exposed to increases in running costs, the effects
of increases in fuel, insurance and maintenance costs or the introduction of a carbon tax will have minimal
effect. FBT has no variable cost for fuel (for the employee) so again there is a lack of incentive for the
employee to reduce fuel use if the car is a company car. With fuel prices at historically record highs, the
incentive for employers to reduce fuel costs may make changes to FBT to include taxation of private use
palatable.
3.3.1 Transport elasticities
Elasticities measure the change in behaviour that results from a change in price (table 3.2). If fuel prices
increase there are impacts on vehicle ownership, fuel efficiency and distances driven. If there are
distortions in policy that artificially subsidise fuel or the type of vehicle driven there will be a multiplier
effect on distances driven. Employees who do not pay for fuel are immune to these effects and employers
end up covering these costs.
Table 3.2 Estimated long-run transport elasticities (Johansson and Schipper 1997, p209)
Estimated component Fuel price Income Taxation
(other than fuel)
Population
density
Car stock (vehicle ownership) -0.20 to 0.0 0.75 to 1.25 -0.08 to -0.04 -0.7 to -0.2
Mean fuel intensity (fuel efficiency) -0.45 to -0.35 -0.6 to 0.0 -0.12 to -0.10 -0.3 to -0.1
Mean driving distance (per car per year) -0.35 to -0.05 -0.1 to 0.35 0.04 to 0.12 -0.75 to 0.0
Car fuel demand -1.0 to -0.40 0.05 to 1.6 -0.16 to -0.02 -1.75 to -0.3
Car travel demand -0.55 to -0.05 0.65 to 1.25 -0.04 to 0.08 -1.45 to -0.2
If individuals are insulated from the normal triggers caused by price changes, transport behaviour is
distorted. Externalities such as emissions have been internalised in prices via carbon taxes or carbon
dioxide-based charges to better represent the impacts in a tangible way.
Parking subsidies provide a significant untaxed benefit to employees who drive, which is not provided to
those who use other commute modes. Parking elasticities measure the impact of an increase in parking
price. Many employees pay nothing for parking as it is provided by their employer. Any introduction of a
price would have an impact on travel behaviour.
The importance of a comprehensive parking strategy is demonstrated in table 3.3 where increases in price
in one area cause a shift to other areas nearby. With the increase of parking prices in cities, employers will
find more employees asking for a car park as part of their employment. Employer-provided parking needs
to be considered in developing transport strategies for parking strategies to be effective.
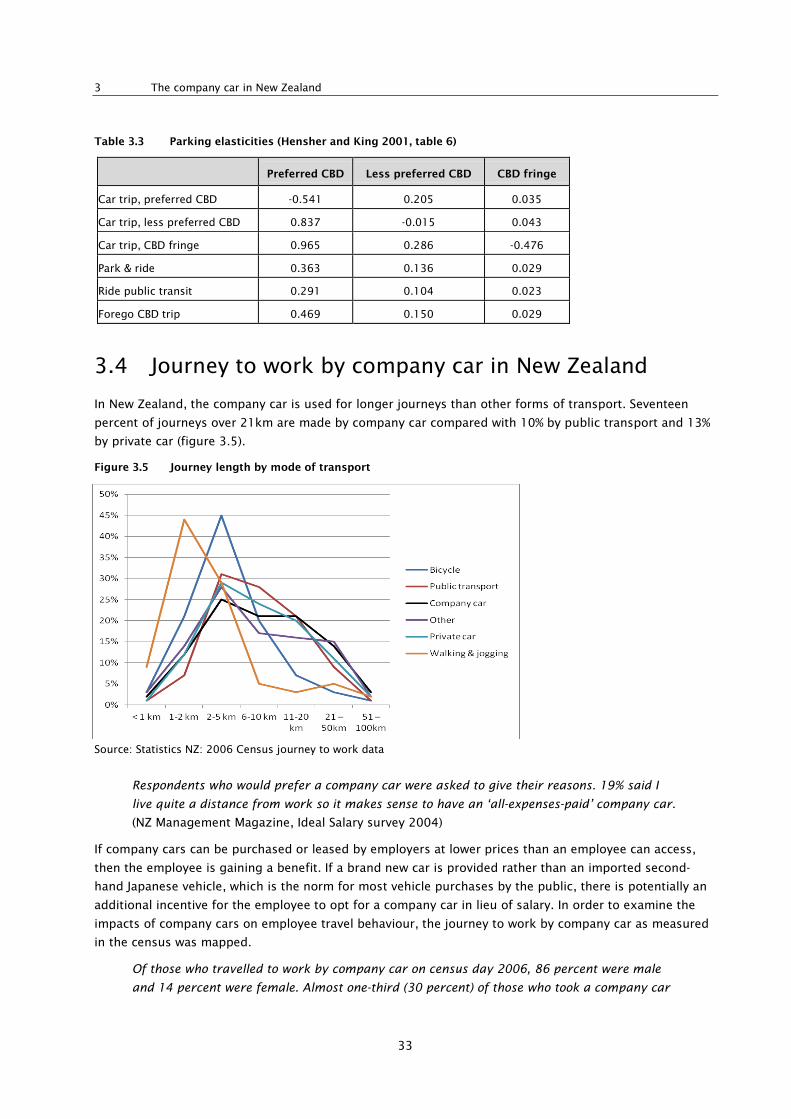
3 The company car in New Zealand
33
Table 3.3 Parking elasticities (Hensher and King 2001, table 6)
Preferred CBD Less preferred CBD CBD fringe
Car trip, preferred CBD -0.541 0.205 0.035
Car trip, less preferred CBD 0.837 -0.015 0.043
Car trip, CBD fringe 0.965 0.286 -0.476
Park & ride 0.363 0.136 0.029
Ride public transit 0.291 0.104 0.023
Forego CBD trip 0.469 0.150 0.029
3.4 Journey to work by company car in New Zealand
In New Zealand, the company car is used for longer journeys than other forms of transport. Seventeen
percent of journeys over 21km are made by company car compared with 10% by public transport and 13%
by private car (figure 3.5).
Figure 3.5 Journey length by mode of transport
Source: Statistics NZ: 2006 Census journey to work data
Respondents who would prefer a company car were asked to give their reasons. 19% said I
live quite a distance from work so it makes sense to have an ‘all-expenses-paid’ company car.
(NZ Management Magazine, Ideal Salary survey 2004)
If company cars can be purchased or leased by employers at lower prices than an employee can access,
then the employee is gaining a benefit. If a brand new car is provided rather than an imported second-
hand Japanese vehicle, which is the norm for most vehicle purchases by the public, there is potentially an
additional incentive for the employee to opt for a company car in lieu of salary. In order to examine the
impacts of company cars on employee travel behaviour, the journey to work by company car as measured
in the census was mapped.
Of those who travelled to work by company car on census day 2006, 86 percent were male
and 14 percent were female. Almost one-third (30 percent) of those who took a company car
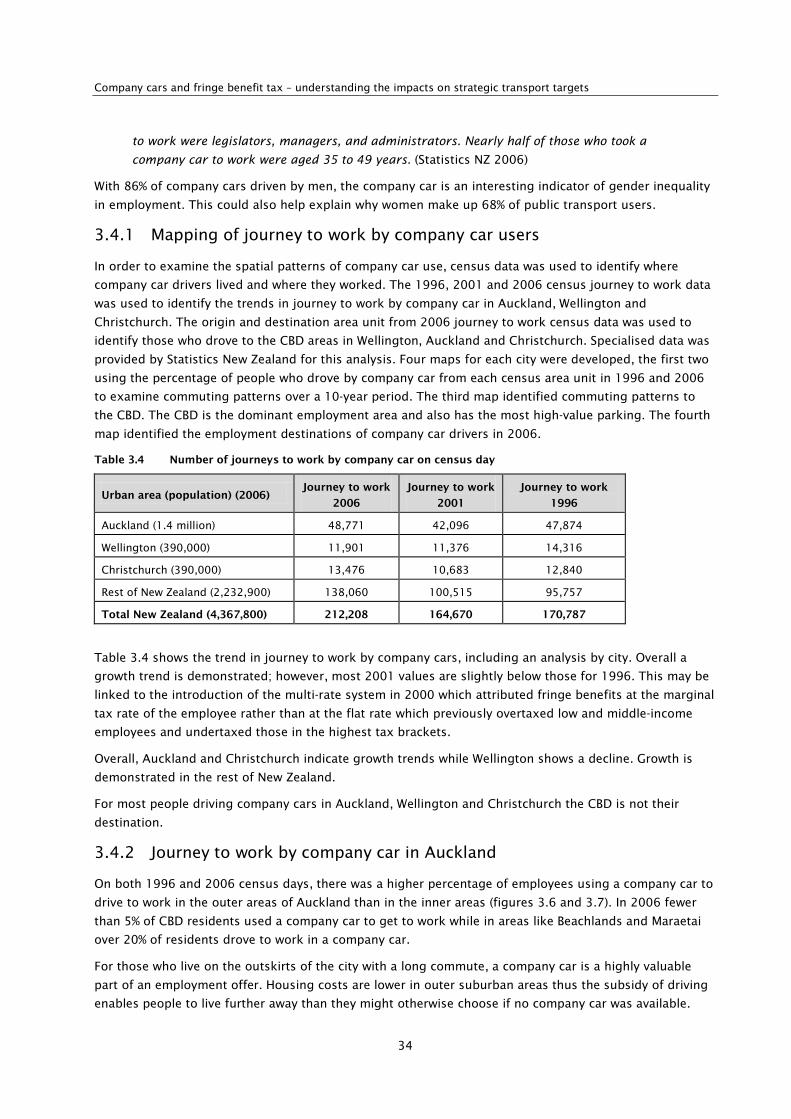
Company cars and fringe benefit tax – understanding the impacts on strategic transport targets
34
to work were legislators, managers, and administrators. Nearly half of those who took a
company car to work were aged 35 to 49 years. (Statistics NZ 2006)
With 86% of company cars driven by men, the company car is an interesting indicator of gender inequality
in employment. This could also help explain why women make up 68% of public transport users.
3.4.1 Mapping of journey to work by company car users
In order to examine the spatial patterns of company car use, census data was used to identify where
company car drivers lived and where they worked. The 1996, 2001 and 2006 census journey to work data
was used to identify the trends in journey to work by company car in Auckland, Wellington and
Christchurch. The origin and destination area unit from 2006 journey to work census data was used to
identify those who drove to the CBD areas in Wellington, Auckland and Christchurch. Specialised data was
provided by Statistics New Zealand for this analysis. Four maps for each city were developed, the first two
using the percentage of people who drove by company car from each census area unit in 1996 and 2006
to examine commuting patterns over a 10-year period. The third map identified commuting patterns to
the CBD. The CBD is the dominant employment area and also has the most high-value parking. The fourth
map identified the employment destinations of company car drivers in 2006.
Table 3.4 Number of journeys to work by company car on census day
Urban area (population) (2006) Journey to work
2006
Journey to work
2001
Journey to work
1996
Auckland (1.4 million) 48,771 42,096 47,874
Wellington (390,000) 11,901 11,376 14,316
Christchurch (390,000) 13,476 10,683 12,840
Rest of New Zealand (2,232,900) 138,060 100,515 95,757
Total New Zealand (4,367,800) 212,208 164,670 170,787
Table 3.4 shows the trend in journey to work by company cars, including an analysis by city. Overall a
growth trend is demonstrated; however, most 2001 values are slightly below those for 1996. This may be
linked to the introduction of the multi-rate system in 2000 which attributed fringe benefits at the marginal
tax rate of the employee rather than at the flat rate which previously overtaxed low and middle-income
employees and undertaxed those in the highest tax brackets.
Overall, Auckland and Christchurch indicate growth trends while Wellington shows a decline. Growth is
demonstrated in the rest of New Zealand.
For most people driving company cars in Auckland, Wellington and Christchurch the CBD is not their
destination.
3.4.2 Journey to work by company car in Auckland
On both 1996 and 2006 census days, there was a higher percentage of employees using a company car to
drive to work in the outer areas of Auckland than in the inner areas (figures 3.6 and 3.7). In 2006 fewer
than 5% of CBD residents used a company car to get to work while in areas like Beachlands and Maraetai
over 20% of residents drove to work in a company car.
For those who live on the outskirts of the city with a long commute, a company car is a highly valuable
part of an employment offer. Housing costs are lower in outer suburban areas thus the subsidy of driving
enables people to live further away than they might otherwise choose if no company car was available.
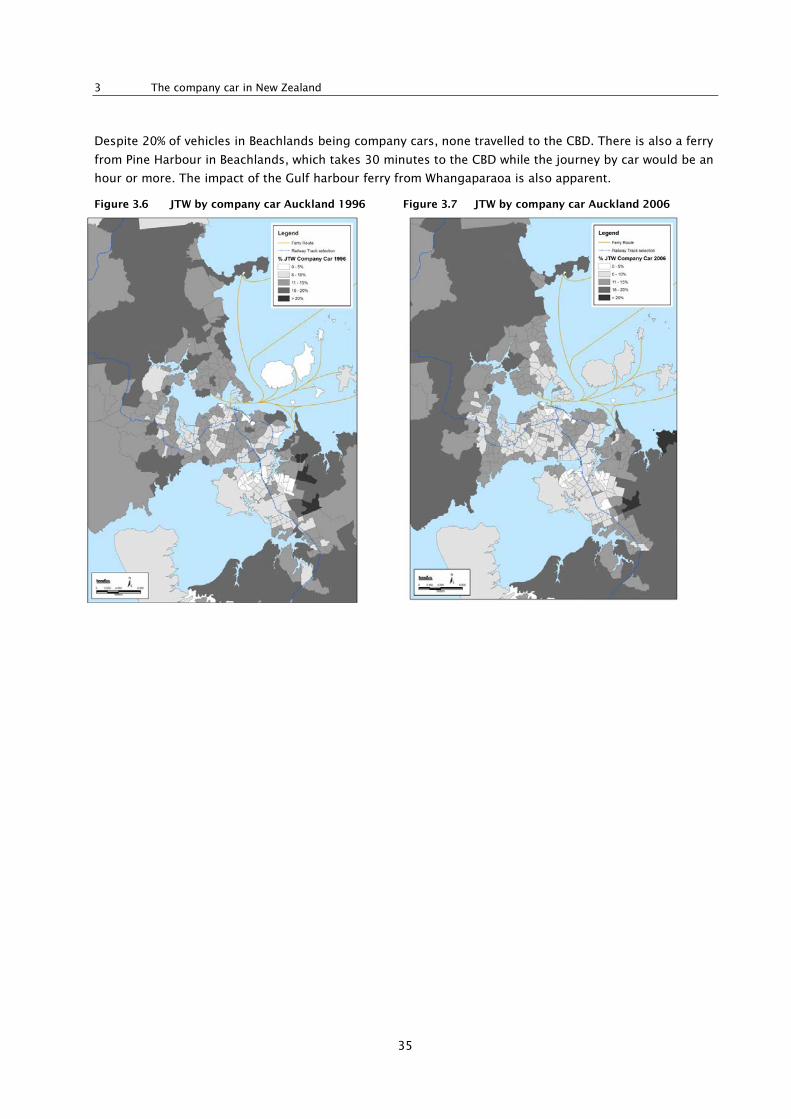
3 The company car in New Zealand
35
Despite 20% of vehicles in Beachlands being company cars, none travelled to the CBD. There is also a ferry
from Pine Harbour in Beachlands, which takes 30 minutes to the CBD while the journey by car would be an
hour or more. The impact of the Gulf harbour ferry from Whangaparaoa is also apparent.
Figure 3.6 JTW by company car Auckland 1996 Figure 3.7 JTW by company car Auckland 2006
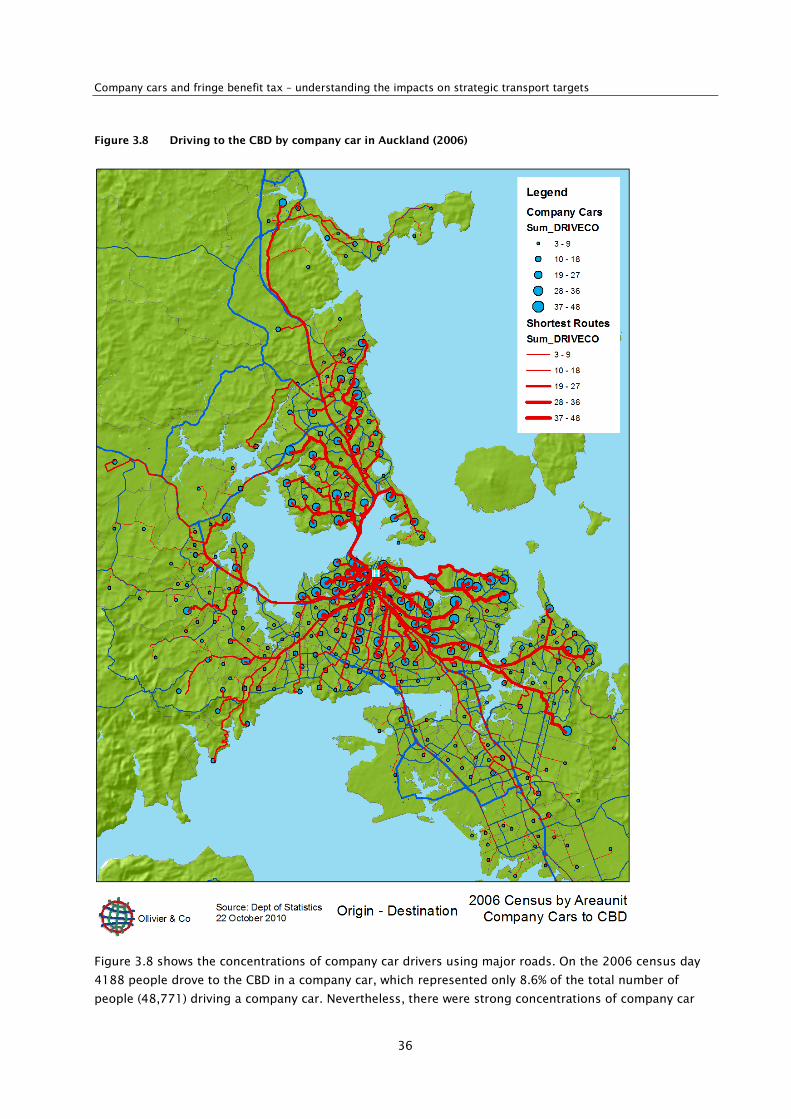
Company cars and fringe benefit tax – understanding the impacts on strategic transport targets
36
Figure 3.8 Driving to the CBD by company car in Auckland (2006)
Figure 3.8 shows the concentrations of company car drivers using major roads. On the 2006 census day
4188 people drove to the CBD in a company car, which represented only 8.6% of the total number of
people (48,771) driving a company car. Nevertheless, there were strong concentrations of company car
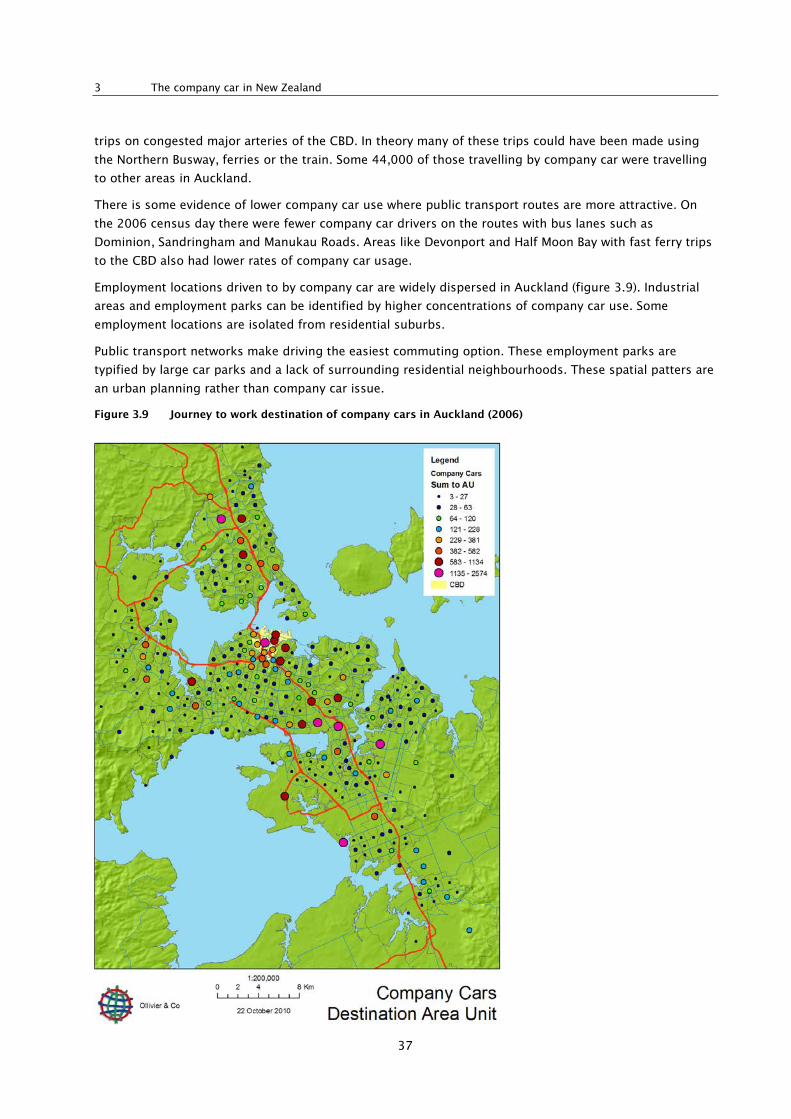
3 The company car in New Zealand
37
trips on congested major arteries of the CBD. In theory many of these trips could have been made using
the Northern Busway, ferries or the train. Some 44,000 of those travelling by company car were travelling
to other areas in Auckland.
There is some evidence of lower company car use where public transport routes are more attractive. On
the 2006 census day there were fewer company car drivers on the routes with bus lanes such as
Dominion, Sandringham and Manukau Roads. Areas like Devonport and Half Moon Bay with fast ferry trips
to the CBD also had lower rates of company car usage.
Employment locations driven to by company car are widely dispersed in Auckland (figure 3.9). Industrial
areas and employment parks can be identified by higher concentrations of company car use. Some
employment locations are isolated from residential suburbs.
Public transport networks make driving the easiest commuting option. These employment parks are
typified by large car parks and a lack of surrounding residential neighbourhoods. These spatial patters are
an urban planning rather than company car issue.
Figure 3.9 Journey to work destination of company cars in Auckland (2006)
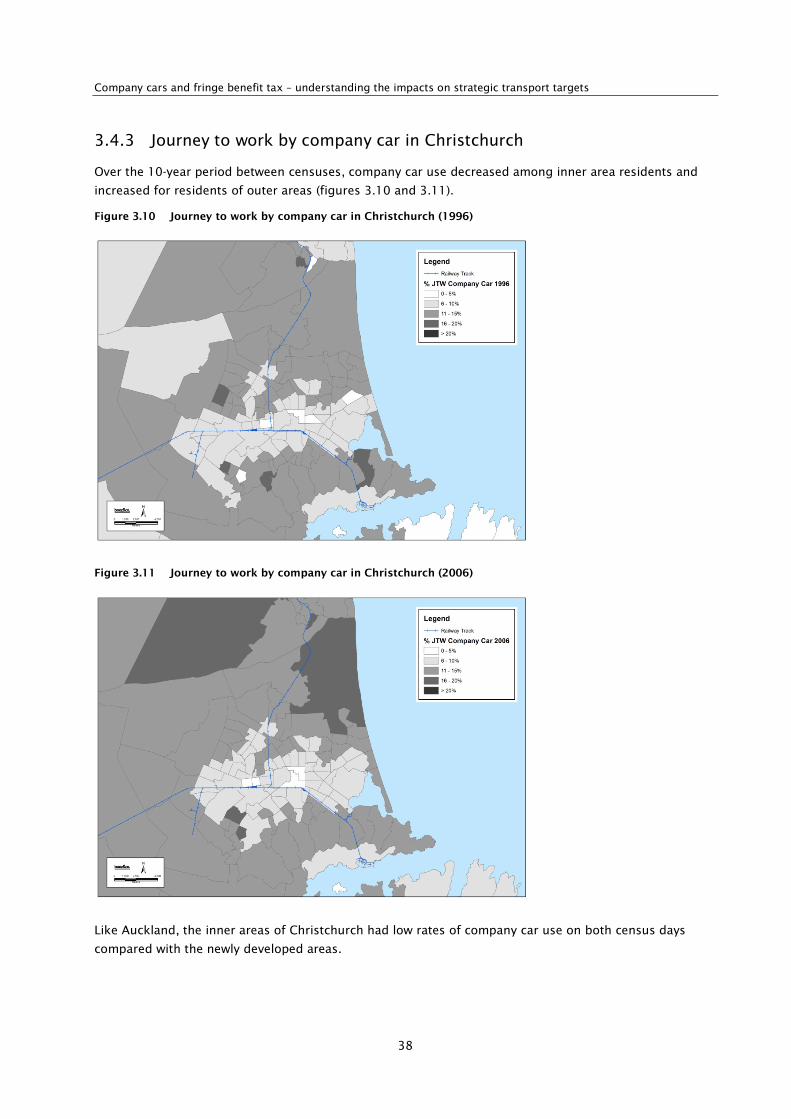
Company cars and fringe benefit tax – understanding the impacts on strategic transport targets
38
3.4.3 Journey to work by company car in Christchurch
Over the 10-year period between censuses, company car use decreased among inner area residents and
increased for residents of outer areas (figures 3.10 and 3.11).
Figure 3.10 Journey to work by company car in Christchurch (1996)
Figure 3.11 Journey to work by company car in Christchurch (2006)
Like Auckland, the inner areas of Christchurch had low rates of company car use on both census days
compared with the newly developed areas.
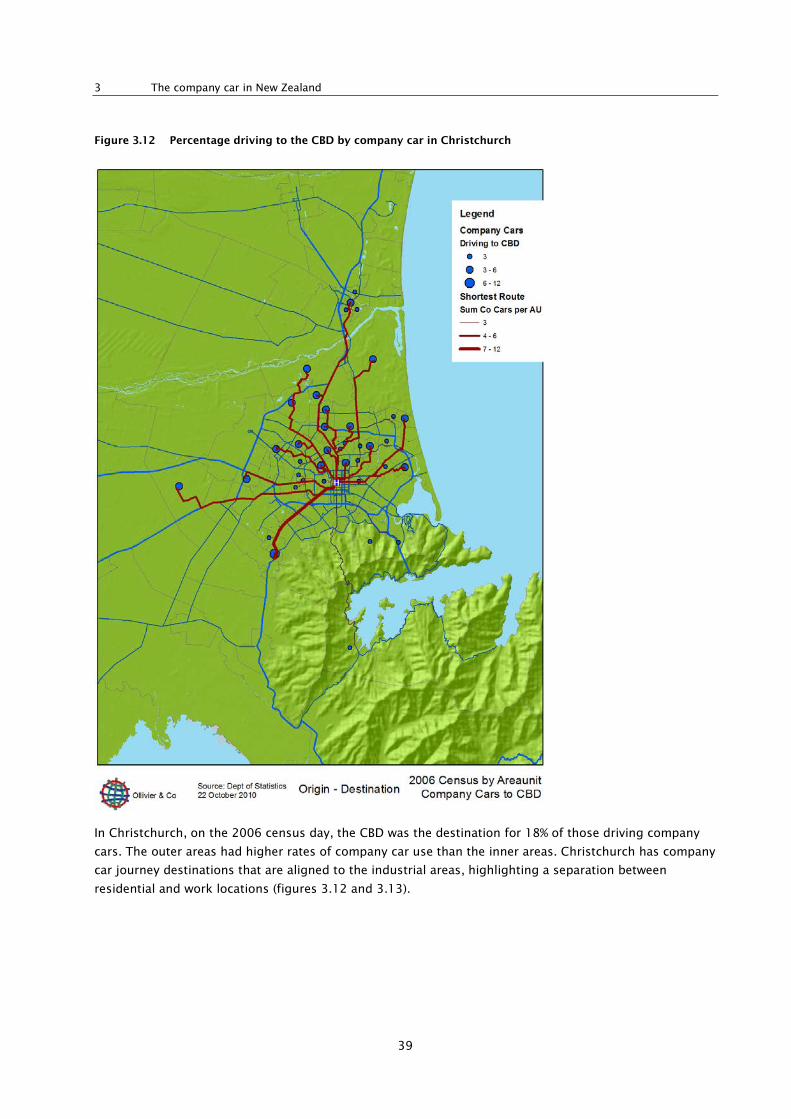
3 The company car in New Zealand
39
Figure 3.12 Percentage driving to the CBD by company car in Christchurch
In Christchurch, on the 2006 census day, the CBD was the destination for 18% of those driving company
cars. The outer areas had higher rates of company car use than the inner areas. Christchurch has company
car journey destinations that are aligned to the industrial areas, highlighting a separation between
residential and work locations (figures 3.12 and 3.13).
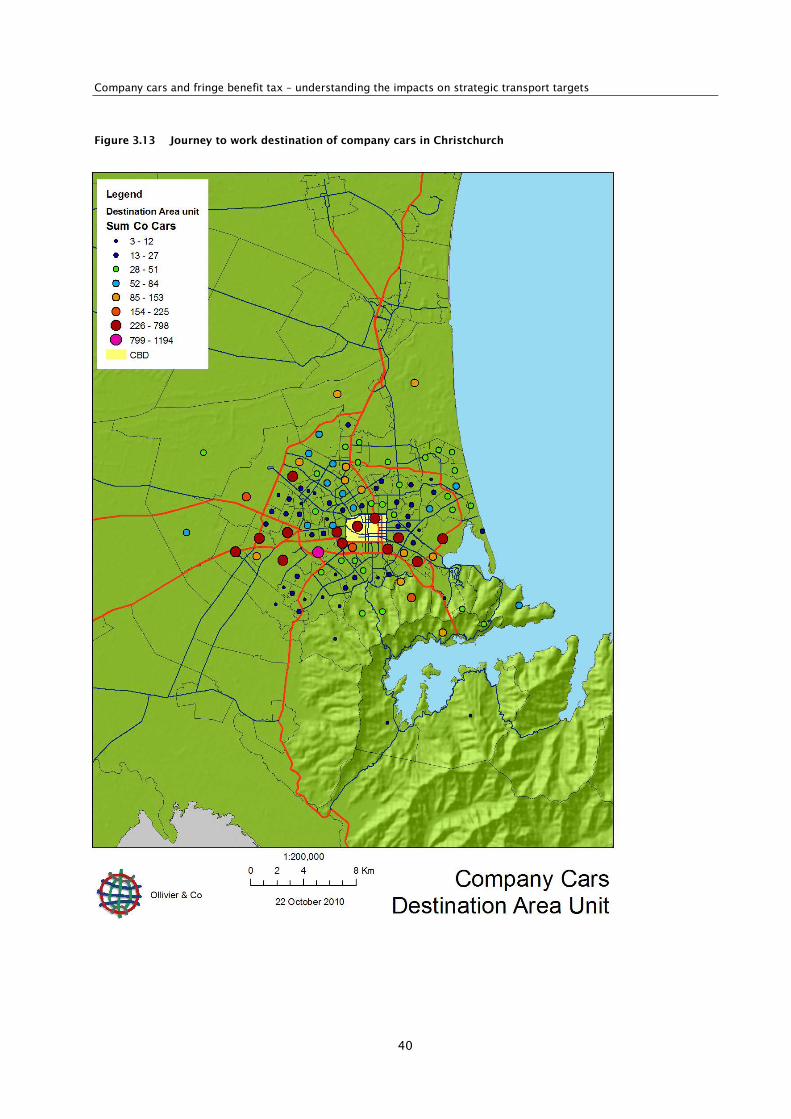
Company cars and fringe benefit tax – understanding the impacts on strategic transport targets
40
Figure 3.13 Journey to work destination of company cars in Christchurch
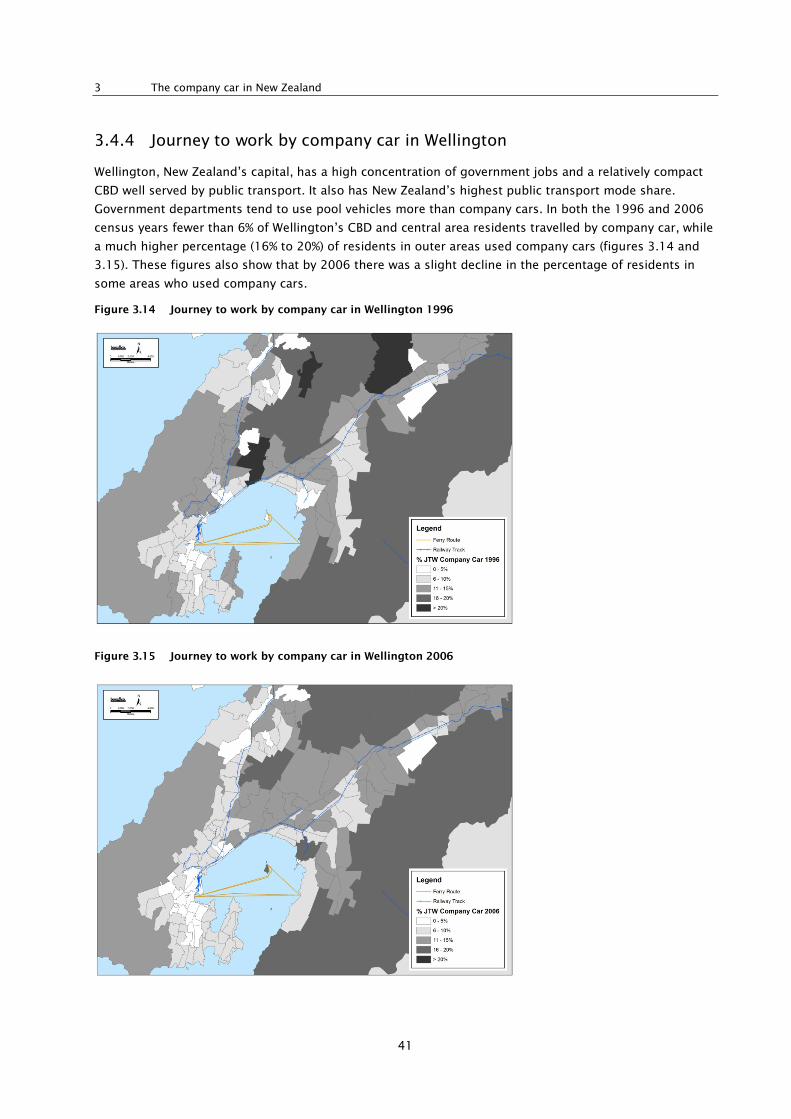
3 The company car in New Zealand
41
3.4.4 Journey to work by company car in Wellington
Wellington, New Zealand’s capital, has a high concentration of government jobs and a relatively compact
CBD well served by public transport. It also has New Zealand’s highest public transport mode share.
Government departments tend to use pool vehicles more than company cars. In both the 1996 and 2006
census years fewer than 6% of Wellington’s CBD and central area residents travelled by company car, while
a much higher percentage (16% to 20%) of residents in outer areas used company cars (figures 3.14 and
3.15). These figures also show that by 2006 there was a slight decline in the percentage of residents in
some areas who used company cars.
Figure 3.14 Journey to work by company car in Wellington 1996
Figure 3.15 Journey to work by company car in Wellington 2006
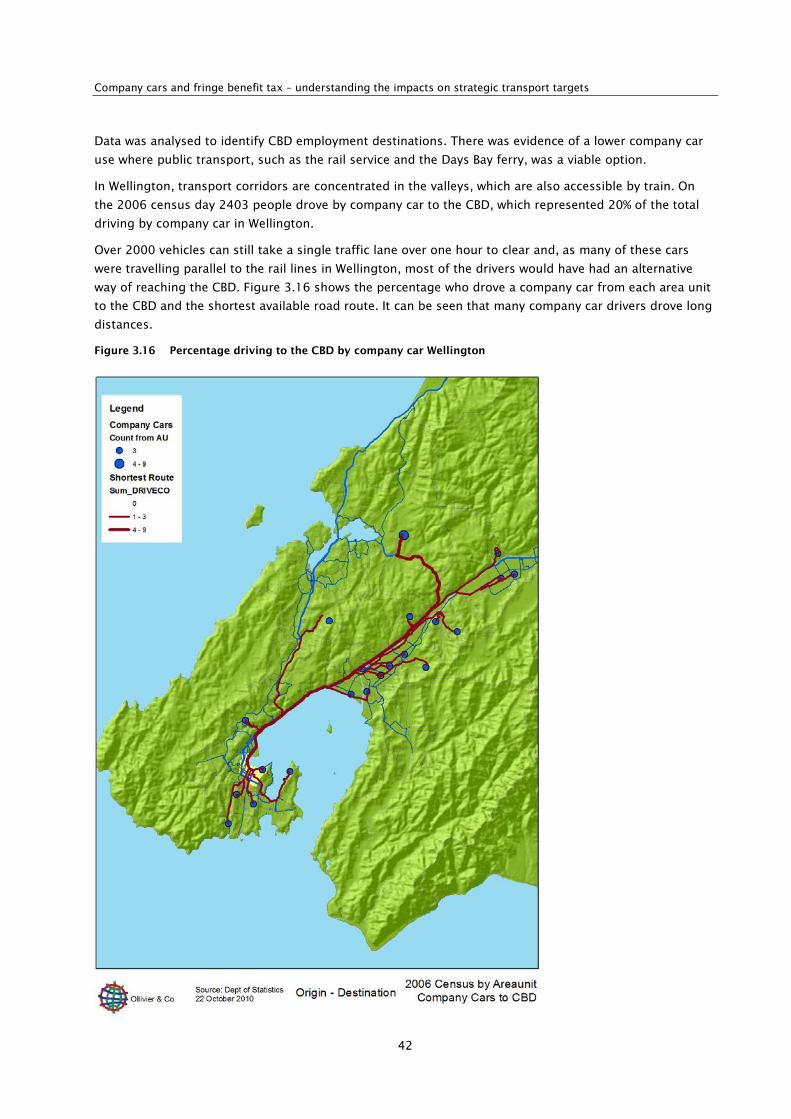
Company cars and fringe benefit tax – understanding the impacts on strategic transport targets
42
Data was analysed to identify CBD employment destinations. There was evidence of a lower company car
use where public transport, such as the rail service and the Days Bay ferry, was a viable option.
In Wellington, transport corridors are concentrated in the valleys, which are also accessible by train. On
the 2006 census day 2403 people drove by company car to the CBD, which represented 20% of the total
driving by company car in Wellington.
Over 2000 vehicles can still take a single traffic lane over one hour to clear and, as many of these cars
were travelling parallel to the rail lines in Wellington, most of the drivers would have had an alternative
way of reaching the CBD. Figure 3.16 shows the percentage who drove a company car from each area unit
to the CBD and the shortest available road route. It can be seen that many company car drivers drove long
distances.
Figure 3.16 Percentage driving to the CBD by company car Wellington
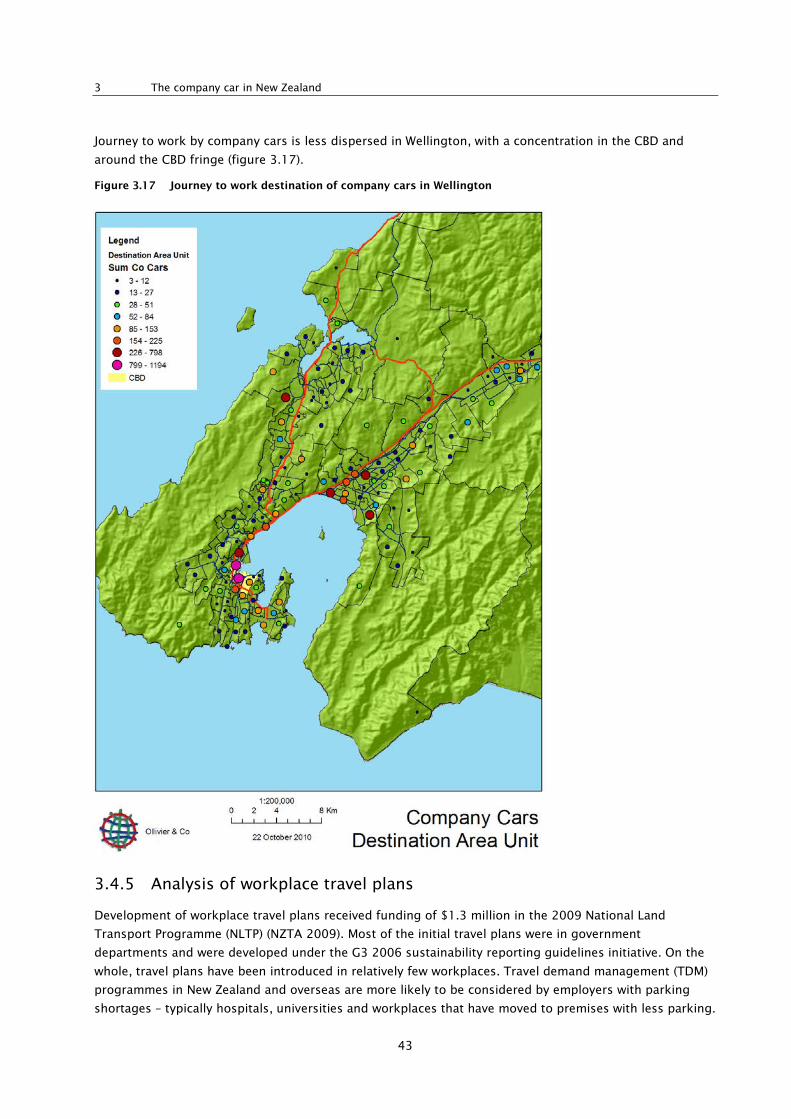
3 The company car in New Zealand
43
Journey to work by company cars is less dispersed in Wellington, with a concentration in the CBD and
around the CBD fringe (figure 3.17).
Figure 3.17 Journey to work destination of company cars in Wellington
3.4.5 Analysis of workplace travel plans
Development of workplace travel plans received funding of $1.3 million in the 2009 National Land
Transport Programme (NLTP) (NZTA 2009). Most of the initial travel plans were in government
departments and were developed under the G3 2006 sustainability reporting guidelines initiative. On the
whole, travel plans have been introduced in relatively few workplaces. Travel demand management (TDM)
programmes in New Zealand and overseas are more likely to be considered by employers with parking
shortages – typically hospitals, universities and workplaces that have moved to premises with less parking.
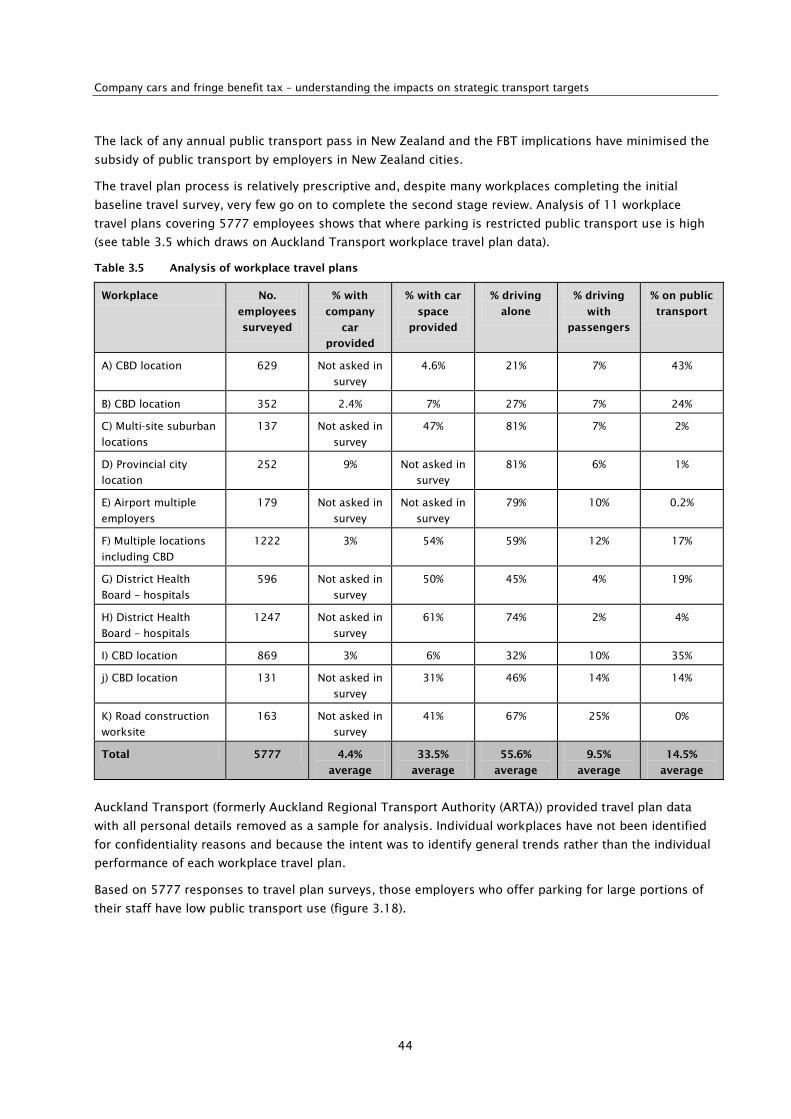
Company cars and fringe benefit tax – understanding the impacts on strategic transport targets
44
The lack of any annual public transport pass in New Zealand and the FBT implications have minimised the
subsidy of public transport by employers in New Zealand cities.
The travel plan process is relatively prescriptive and, despite many workplaces completing the initial
baseline travel survey, very few go on to complete the second stage review. Analysis of 11 workplace
travel plans covering 5777 employees shows that where parking is restricted public transport use is high
(see table 3.5 which draws on Auckland Transport workplace travel plan data).
Table 3.5 Analysis of workplace travel plans
Workplace No.
employees
surveyed
% with
company
car
provided
% with car
space
provided
% driving
alone
% driving
with
passengers
% on public
transport
A) CBD location 629 Not asked in
survey
4.6% 21% 7% 43%
B) CBD location 352 2.4% 7% 27% 7% 24%
C) Multi-site suburban
locations
137 Not asked in
survey
47% 81% 7% 2%
D) Provincial city
location
252 9% Not asked in
survey
81% 6% 1%
E) Airport multiple
employers
179 Not asked in
survey
Not asked in
survey
79% 10% 0.2%
F) Multiple locations
including CBD
1222 3% 54% 59% 12% 17%
G) District Health
Board – hospitals
596 Not asked in
survey
50% 45% 4% 19%
H) District Health
Board – hospitals
1247 Not asked in
survey
61% 74% 2% 4%
I) CBD location 869 3% 6% 32% 10% 35%
j) CBD location 131 Not asked in
survey
31% 46% 14% 14%
K) Road construction
worksite
163 Not asked in
survey
41% 67% 25% 0%
Total 5777 4.4%
average
33.5%
average
55.6%
average
9.5%
average
14.5%
average
Auckland Transport (formerly Auckland Regional Transport Authority (ARTA)) provided travel plan data
with all personal details removed as a sample for analysis. Individual workplaces have not been identified
for confidentiality reasons and because the intent was to identify general trends rather than the individual
performance of each workplace travel plan.
Based on 5777 responses to travel plan surveys, those employers who offer parking for large portions of
their staff have low public transport use (figure 3.18).
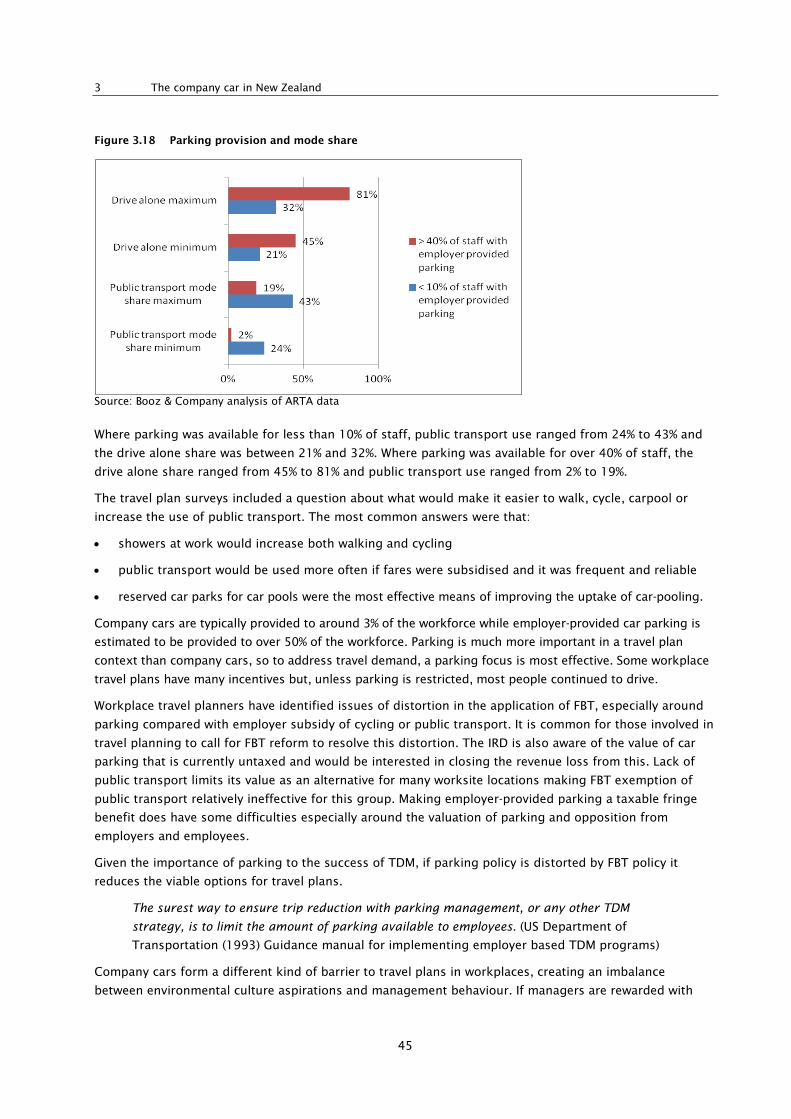
3 The company car in New Zealand
45
Figure 3.18 Parking provision and mode share
Source: Booz & Company analysis of ARTA data
Where parking was available for less than 10% of staff, public transport use ranged from 24% to 43% and
the drive alone share was between 21% and 32%. Where parking was available for over 40% of staff, the
drive alone share ranged from 45% to 81% and public transport use ranged from 2% to 19%.
The travel plan surveys included a question about what would make it easier to walk, cycle, carpool or
increase the use of public transport. The most common answers were that:
• showers at work would increase both walking and cycling
• public transport would be used more often if fares were subsidised and it was frequent and reliable
• reserved car parks for car pools were the most effective means of improving the uptake of car-pooling.
Company cars are typically provided to around 3% of the workforce while employer-provided car parking is
estimated to be provided to over 50% of the workforce. Parking is much more important in a travel plan
context than company cars, so to address travel demand, a parking focus is most effective. Some workplace
travel plans have many incentives but, unless parking is restricted, most people continued to drive.
Workplace travel planners have identified issues of distortion in the application of FBT, especially around
parking compared with employer subsidy of cycling or public transport. It is common for those involved in
travel planning to call for FBT reform to resolve this distortion. The IRD is also aware of the value of car
parking that is currently untaxed and would be interested in closing the revenue loss from this. Lack of
public transport limits its value as an alternative for many worksite locations making FBT exemption of
public transport relatively ineffective for this group. Making employer-provided parking a taxable fringe
benefit does have some difficulties especially around the valuation of parking and opposition from
employers and employees.
Given the importance of parking to the success of TDM, if parking policy is distorted by FBT policy it
reduces the viable options for travel plans.
The surest way to ensure trip reduction with parking management, or any other TDM
strategy, is to limit the amount of parking available to employees. (US Department of
Transportation (1993) Guidance manual for implementing employer based TDM programs)
Company cars form a different kind of barrier to travel plans in workplaces, creating an imbalance
between environmental culture aspirations and management behaviour. If managers are rewarded with
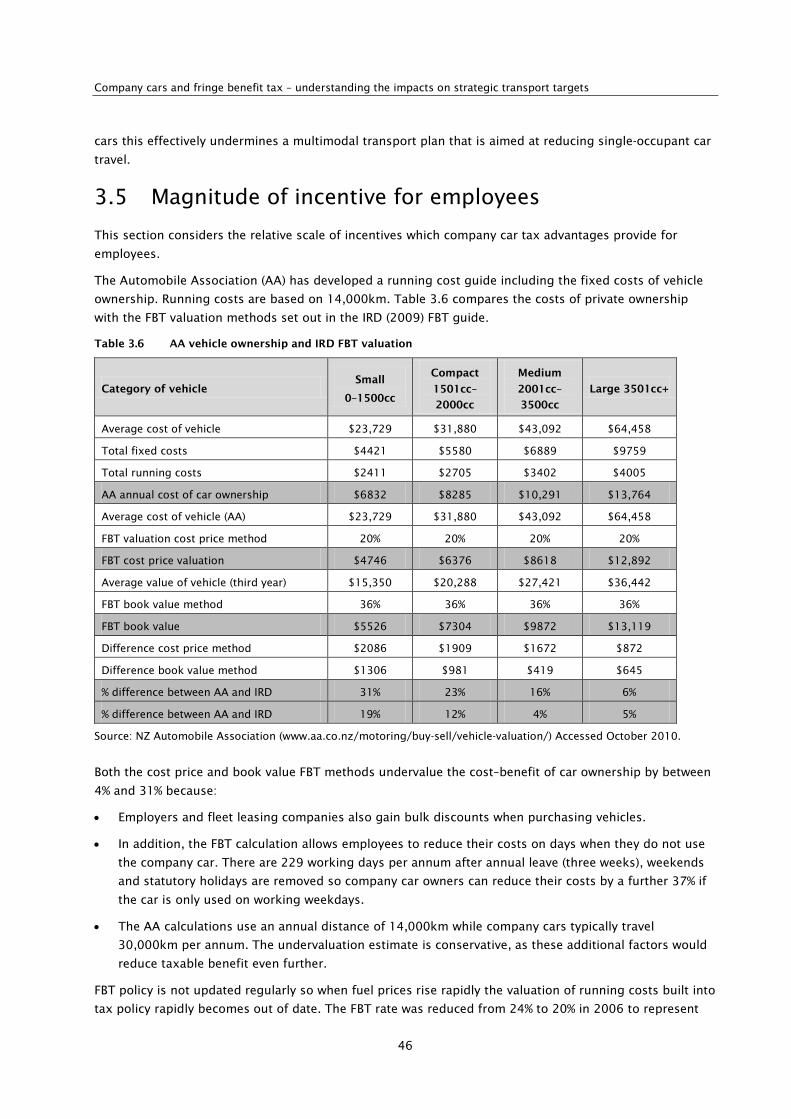
Company cars and fringe benefit tax – understanding the impacts on strategic transport targets
46
cars this effectively undermines a multimodal transport plan that is aimed at reducing single-occupant car
travel.
3.5 Magnitude of incentive for employees
This section considers the relative scale of incentives which company car tax advantages provide for
employees.
The Automobile Association (AA) has developed a running cost guide including the fixed costs of vehicle
ownership. Running costs are based on 14,000km. Table 3.6 compares the costs of private ownership
with the FBT valuation methods set out in the IRD (2009) FBT guide.
Table 3.6 AA vehicle ownership and IRD FBT valuation
Category of vehicle Small
0–1500cc
Compact
1501cc–
2000cc
Medium
2001cc–
3500cc
Large 3501cc+
Average cost of vehicle $23,729 $31,880 $43,092 $64,458
Total fixed costs $4421 $5580 $6889 $9759
Total running costs $2411 $2705 $3402 $4005
AA annual cost of car ownership $6832 $8285 $10,291 $13,764
Average cost of vehicle (AA) $23,729 $31,880 $43,092 $64,458
FBT valuation cost price method 20% 20% 20% 20%
FBT cost price valuation $4746 $6376 $8618 $12,892
Average value of vehicle (third year) $15,350 $20,288 $27,421 $36,442
FBT book value method 36% 36% 36% 36%
FBT book value $5526 $7304 $9872 $13,119
Difference cost price method $2086 $1909 $1672 $872
Difference book value method $1306 $981 $419 $645
% difference between AA and IRD 31% 23% 16% 6%
% difference between AA and IRD 19% 12% 4% 5%
Source: NZ Automobile Association (www.aa.co.nz/motoring/buy-sell/vehicle-valuation/) Accessed October 2010.
Both the cost price and book value FBT methods undervalue the cost–benefit of car ownership by between
4% and 31% because:
• Employers and fleet leasing companies also gain bulk discounts when purchasing vehicles.
• In addition, the FBT calculation allows employees to reduce their costs on days when they do not use
the company car. There are 229 working days per annum after annual leave (three weeks), weekends
and statutory holidays are removed so company car owners can reduce their costs by a further 37% if
the car is only used on working weekdays.
• The AA calculations use an annual distance of 14,000km while company cars typically travel
30,000km per annum. The undervaluation estimate is conservative, as these additional factors would
reduce taxable benefit even further.
FBT policy is not updated regularly so when fuel prices rise rapidly the valuation of running costs built into
tax policy rapidly becomes out of date. The FBT rate was reduced from 24% to 20% in 2006 to represent
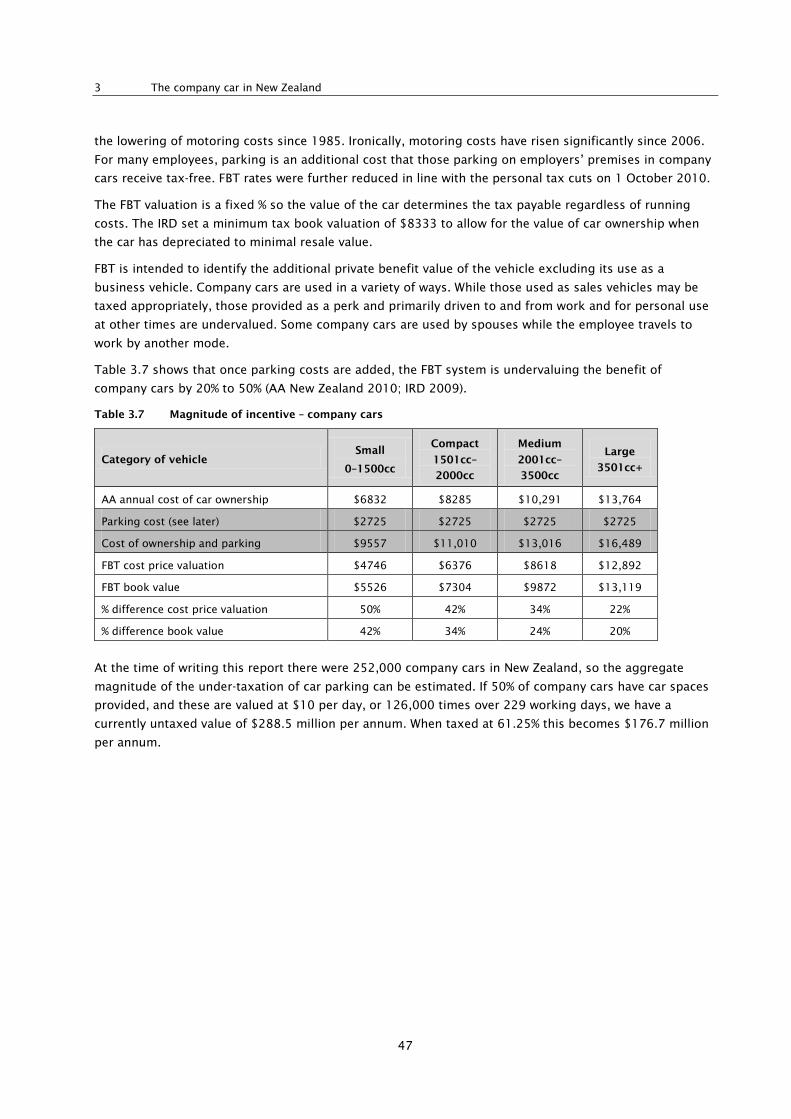
3 The company car in New Zealand
47
the lowering of motoring costs since 1985. Ironically, motoring costs have risen significantly since 2006.
For many employees, parking is an additional cost that those parking on employers’ premises in company
cars receive tax-free. FBT rates were further reduced in line with the personal tax cuts on 1 October 2010.
The FBT valuation is a fixed % so the value of the car determines the tax payable regardless of running
costs. The IRD set a minimum tax book valuation of $8333 to allow for the value of car ownership when
the car has depreciated to minimal resale value.
FBT is intended to identify the additional private benefit value of the vehicle excluding its use as a
business vehicle. Company cars are used in a variety of ways. While those used as sales vehicles may be
taxed appropriately, those provided as a perk and primarily driven to and from work and for personal use
at other times are undervalued. Some company cars are used by spouses while the employee travels to
work by another mode.
Table 3.7 shows that once parking costs are added, the FBT system is undervaluing the benefit of
company cars by 20% to 50% (AA New Zealand 2010; IRD 2009).
Table 3.7 Magnitude of incentive – company cars
Category of vehicle Small
0–1500cc
Compact
1501cc–
2000cc
Medium
2001cc–
3500cc
Large
3501cc+
AA annual cost of car ownership $6832 $8285 $10,291 $13,764
Parking cost (see later) $2725 $2725 $2725 $2725
Cost of ownership and parking $9557 $11,010 $13,016 $16,489
FBT cost price valuation $4746 $6376 $8618 $12,892
FBT book value $5526 $7304 $9872 $13,119
% difference cost price valuation 50% 42% 34% 22%
% difference book value 42% 34% 24% 20%
At the time of writing this report there were 252,000 company cars in New Zealand, so the aggregate
magnitude of the under-taxation of car parking can be estimated. If 50% of company cars have car spaces
provided, and these are valued at $10 per day, or 126,000 times over 229 working days, we have a
currently untaxed value of $288.5 million per annum. When taxed at 61.25% this becomes $176.7 million
per annum.
Company cars and fringe benefit tax – understanding the impacts on strategic transport targets
48
4 Understanding employer-provided parking
This chapter considers existing tax policy with regard to its impact on employer-provided parking, the
untaxed value of car parking, barriers to changing parking policies and options to address this issue.
4.1 Current tax policy and parking
In New Zealand, parking is currently exempt from FBT (IRD 2009):
• An employer who provides employees with car parks is not subject to FBT if the car park is on the
employer’s premises.
• This exemption extends to employers who lease car parks for their employees, provided the employer
has an exclusive right to occupy the property.
The extension to include leased parking spaces enables employers to provide parking in nearby
commercial parking buildings. Thus, it is common for employers who have run out of parking on their
premises to lease car parks in the surrounding neighbourhood for employees. These employees may or
may not be driving company cars. Local urban planning regulations also have an impact as minimum
parking standards may require a certain number of parking spaces to be provided. The employer has to
build these car spaces and can reduce wages by providing parking instead.
4.2 Impact of policy on employer and employee behaviour
Employer-provided parking is untaxed, causing a price distortion in transport choice. This represents a
problem for both the IRD and transport policy. Parking is a high-value untaxed benefit for many employees
and, as such, represents lost revenue from an IRD and Treasury perspective. Parking subsidies encourage
people to own more vehicles, drive more and use alternative modes less. This increase in demand tends to
result in more parking supply, which encourages automobile-dependent sprawl.
Commercial public transport becomes more viable when users pay directly for parking. This is the case in
Auckland and Wellington and to a lesser extent in Christchurch, Hamilton, Tauranga and Dunedin. The value
of the parking provided is highest in areas with the highest demand and restricted supply; this is directly
linked to congestion with high-price parking in areas subject to congestion. Availability of ‘free’ employer-
provided parking in the CBDs of New Zealand’s main cities provides a direct incentive to drive to the very
destination that is most congested and best served by public transport.
The cost of providing parking is generally embedded in rent costs and can be deducted as a business
expense. Employer-provided parking is a tax revenue loss and a failure of horizontal equity with car
drivers gaining a non-taxable benefit that is not available to those using all other transport modes to
travel to work. Parking is a more commonly provided benefit than company cars and can represent a
bigger challenge for FBT policy.
4.3 Equity, vehicle travel, commute mode share, energy and emissions impacts
Ommeren and Wentink (2010) examined minimum parking requirements and tax policies in the USA and
estimated a deadweight loss of about 30% of resource parking cost, about US$30 billion per year. This
excludes other welfare losses of these policies due to increased energy use, pollution, congestion and
4 Understanding employer-provided parking
49
reduced agglomeration. For Europe, the welfare loss is estimated to be about 12% of the resource parking
costs, approximately €5 billion per year.
Most employer-provided car parking is onsite so is highly valuable but unpriced. In high density areas,
nearby public parking establishes the market price for parking. Employer-provided parking is of more value
than the nearest public car park as it is onsite and involves only a short walk within the building. If parking
were included as a taxable fringe benefit, a wider group of commuters would consider these costs and a
regulatory distortion of the market would be removed.
Subsidised parking at workplaces in the CBD, encouraged by IRD tax policy, increases the subsidy
requirements for public transport and adds to traffic congestion.
In a study of 82 TDM programmes Kuzmyak et al (2010) found:
Parking fees (priced parking) together with restricted parking averages 27.6 percent vehicle
trip reduction, while restricted parking overall and priced parking overall both average 24.6
percent.
This compares with a vehicle trip reduction of 14% when parking is not addressed in the TDM programme.
They conclude:
The supply and price of parking serving a worksite have the single largest effect on the
performance of employer-based TDM programs. Not only does limited parking or the
existence of parking fees discourage solo driving outright, but such conditions also tend to
increase the appeal of travel alternatives and other TDM strategies.
Given the converse is true (that parking demand is higher because FBT is not charged), current application
of FBT policy generates a market distortion biased towards car use and against more efficient modes. This
should be of significant interest as the government is losing legitimate FBT revenue while subsidising
public transport (by a higher amount) reflecting foregone fare payments that additional travellers would
make.
A 25% to 27% reduction in vehicle trips is a significant reduction in peak travel demand with potential
congestion benefits to the wider economy. Provision of free car parking at employers’ worksites results in
an oversupply of single-occupant cars being driven to work. Shoup (1990) found that employers with free
(subsidised parking) had single occupant trip rates of 71% and public transport mode share rates of 13%
while those with no subsidies had single occupant vehicle trip rates of 54% and public transport mode
share rates of 36%.
4.4 Quantifying the untaxed value of car parking
The cost to use car parking is extremely variable with most rural areas and towns having an abundant
supply of free parking. Even in urban areas, the price to park for a day can vary between free on-street
parking to $25 a day or more within a 2km radius. The cost of employer-provided car parking is
demonstrated by an analysis of car parking rates in Auckland.
Table 4.1 provides the range of parking rates in Auckland city using the advertised early bird daily rates.
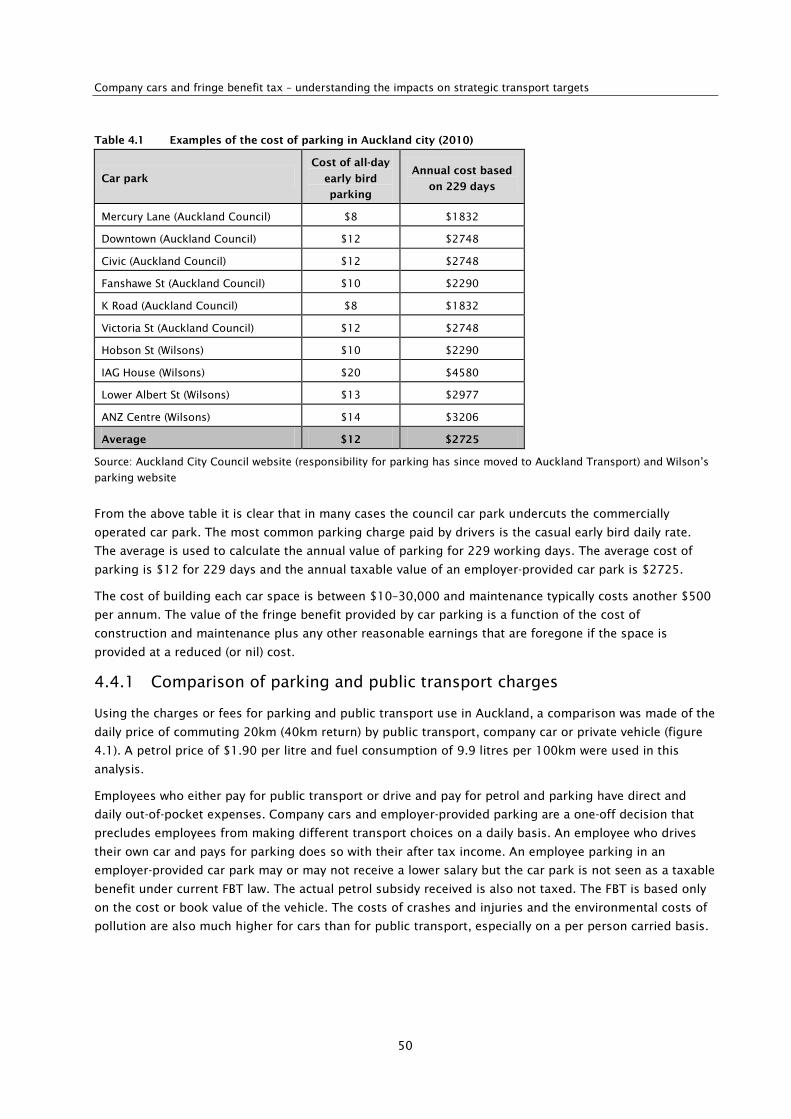
Company cars and fringe benefit tax – understanding the impacts on strategic transport targets
50
Table 4.1 Examples of the cost of parking in Auckland city (2010)
Car park
Cost of all-day
early bird
parking
Annual cost based
on 229 days
Mercury Lane (Auckland Council) $8 $1832
Downtown (Auckland Council) $12 $2748
Civic (Auckland Council) $12 $2748
Fanshawe St (Auckland Council) $10 $2290
K Road (Auckland Council) $8 $1832
Victoria St (Auckland Council) $12 $2748
Hobson St (Wilsons) $10 $2290
IAG House (Wilsons) $20 $4580
Lower Albert St (Wilsons) $13 $2977
ANZ Centre (Wilsons) $14 $3206
Average $12 $2725
Source: Auckland City Council website (responsibility for parking has since moved to Auckland Transport) and Wilson’s
parking website
From the above table it is clear that in many cases the council car park undercuts the commercially
operated car park. The most common parking charge paid by drivers is the casual early bird daily rate.
The average is used to calculate the annual value of parking for 229 working days. The average cost of
parking is $12 for 229 days and the annual taxable value of an employer-provided car park is $2725.
The cost of building each car space is between $10–30,000 and maintenance typically costs another $500
per annum. The value of the fringe benefit provided by car parking is a function of the cost of
construction and maintenance plus any other reasonable earnings that are foregone if the space is
provided at a reduced (or nil) cost.
4.4.1 Comparison of parking and public transport charges
Using the charges or fees for parking and public transport use in Auckland, a comparison was made of the
daily price of commuting 20km (40km return) by public transport, company car or private vehicle (figure
4.1). A petrol price of $1.90 per litre and fuel consumption of 9.9 litres per 100km were used in this
analysis.
Employees who either pay for public transport or drive and pay for petrol and parking have direct and
daily out-of-pocket expenses. Company cars and employer-provided parking are a one-off decision that
precludes employees from making different transport choices on a daily basis. An employee who drives
their own car and pays for parking does so with their after tax income. An employee parking in an
employer-provided car park may or may not receive a lower salary but the car park is not seen as a taxable
benefit under current FBT law. The actual petrol subsidy received is also not taxed. The FBT is based only
on the cost or book value of the vehicle. The costs of crashes and injuries and the environmental costs of
pollution are also much higher for cars than for public transport, especially on a per person carried basis.
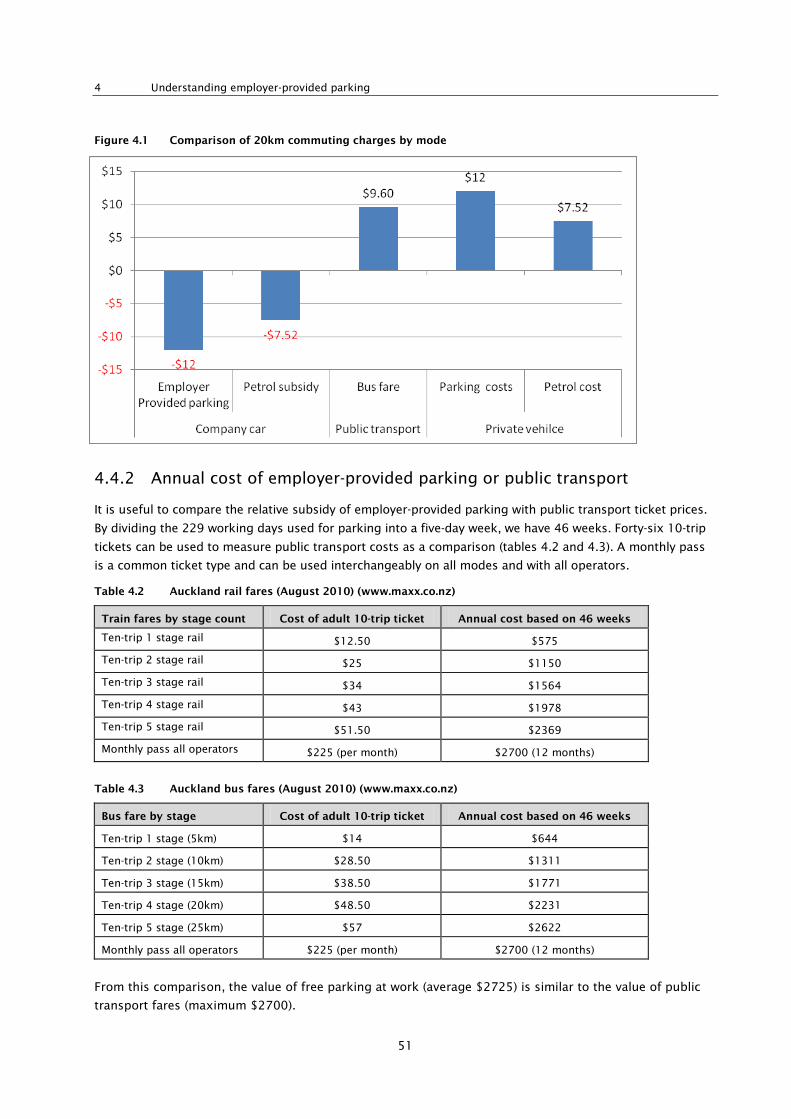
4 Understanding employer-provided parking
51
Figure 4.1 Comparison of 20km commuting charges by mode
4.4.2 Annual cost of employer-provided parking or public transport
It is useful to compare the relative subsidy of employer-provided parking with public transport ticket prices.
By dividing the 229 working days used for parking into a five-day week, we have 46 weeks. Forty-six 10-trip
tickets can be used to measure public transport costs as a comparison (tables 4.2 and 4.3). A monthly pass
is a common ticket type and can be used interchangeably on all modes and with all operators.
Table 4.2 Auckland rail fares (August 2010) (www.maxx.co.nz)
Train fares by stage count Cost of adult 10-trip ticket Annual cost based on 46 weeks
Ten-trip 1 stage rail $12.50 $575
Ten-trip 2 stage rail $25 $1150
Ten-trip 3 stage rail $34 $1564
Ten-trip 4 stage rail $43 $1978
Ten-trip 5 stage rail $51.50 $2369
Monthly pass all operators $225 (per month) $2700 (12 months)
Table 4.3 Auckland bus fares (August 2010) (www.maxx.co.nz)
Bus fare by stage Cost of adult 10-trip ticket Annual cost based on 46 weeks
Ten-trip 1 stage (5km) $14 $644
Ten-trip 2 stage (10km) $28.50 $1311
Ten-trip 3 stage (15km) $38.50 $1771
Ten-trip 4 stage (20km) $48.50 $2231
Ten-trip 5 stage (25km) $57 $2622
Monthly pass all operators $225 (per month) $2700 (12 months)
From this comparison, the value of free parking at work (average $2725) is similar to the value of public
transport fares (maximum $2700).
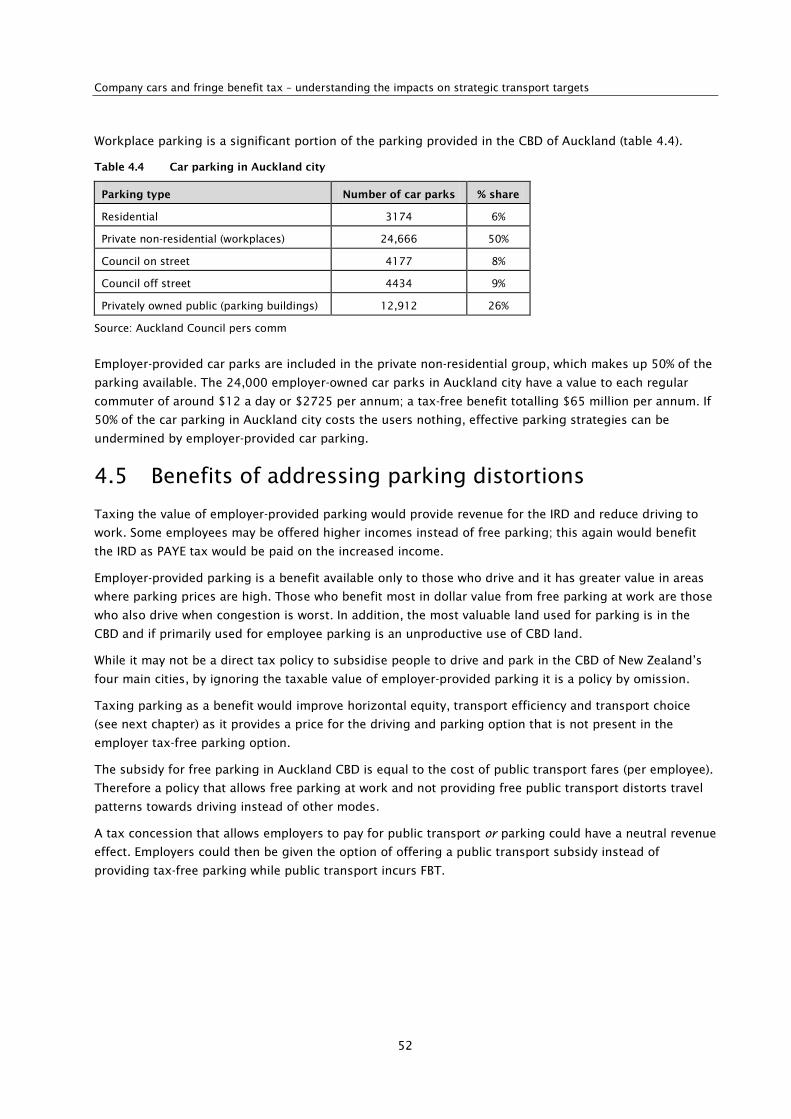
Company cars and fringe benefit tax – understanding the impacts on strategic transport targets
52
Workplace parking is a significant portion of the parking provided in the CBD of Auckland (table 4.4).
Table 4.4 Car parking in Auckland city
Parking type Number of car parks % share
Residential 3174 6%
Private non-residential (workplaces) 24,666 50%
Council on street 4177 8%
Council off street 4434 9%
Privately owned public (parking buildings) 12,912 26%
Source: Auckland Council pers comm
Employer-provided car parks are included in the private non-residential group, which makes up 50% of the
parking available. The 24,000 employer-owned car parks in Auckland city have a value to each regular
commuter of around $12 a day or $2725 per annum; a tax-free benefit totalling $65 million per annum. If
50% of the car parking in Auckland city costs the users nothing, effective parking strategies can be
undermined by employer-provided car parking.
4.5 Benefits of addressing parking distortions
Taxing the value of employer-provided parking would provide revenue for the IRD and reduce driving to
work. Some employees may be offered higher incomes instead of free parking; this again would benefit
the IRD as PAYE tax would be paid on the increased income.
Employer-provided parking is a benefit available only to those who drive and it has greater value in areas
where parking prices are high. Those who benefit most in dollar value from free parking at work are those
who also drive when congestion is worst. In addition, the most valuable land used for parking is in the
CBD and if primarily used for employee parking is an unproductive use of CBD land.
While it may not be a direct tax policy to subsidise people to drive and park in the CBD of New Zealand’s
four main cities, by ignoring the taxable value of employer-provided parking it is a policy by omission.
Taxing parking as a benefit would improve horizontal equity, transport efficiency and transport choice
(see next chapter) as it provides a price for the driving and parking option that is not present in the
employer tax-free parking option.
The subsidy for free parking in Auckland CBD is equal to the cost of public transport fares (per employee).
Therefore a policy that allows free parking at work and not providing free public transport distorts travel
patterns towards driving instead of other modes.
A tax concession that allows employers to pay for public transport or parking could have a neutral revenue
effect. Employers could then be given the option of offering a public transport subsidy instead of
providing tax-free parking while public transport incurs FBT.
5 FBT and transport
53
5 FBT and transport
This chapter discusses the key principals of taxation policy and how this relates to broad transport and
land-use policy objectives. A critique of current practices is presented followed by a perspective on these
issues from discussions with the IRD.
5.1 FBT and horizontal equity
The goal of FBT policy is to tax anything that employers provide to employees in place of salary and
wages. Fringe benefits that reduce an employee’s private outgoings are effectively a payment of additional
salary and wages. All other employee’s salary and wages are taxable, and so to ensure neutrality of
treatment fringe benefits should be taxable on an equivalent basis. Some gaps in current FBT policy
impact on travel behaviour. These gaps include the exemption of car parking and lack of valuation of
distance travelled in company cars.
Robust and fair tax policy relies on those with equal incomes paying an equal amount of tax (known as
horizontal equity). There are geographic differences across New Zealand regarding transport access
relevant to FBT:
• Public transport is only available in major cities so any policy that reduces tax on public transport will
only benefit urban taxpayers. Congestion is an urban issue and urban road construction is an
expensive public good.
• The most valuable car spaces that are currently untaxed are also in urban areas. A car space is priced
to users at around $10 per day in Wellington, Auckland and Christchurch.
• Horizontal equity does not exist in relation to parking costs with urban drivers having significant
parking costs that do not apply in smaller towns and cities.
Employers who provide free ‘on premises’ parking are exempt from FBT. This raises issues of horizontal
inequity between those with employer-provided car space and those without.
Employees who received subsidised or free parking from their employer effectively pay less tax than those
who pay for parking themselves or pay to commute by public transport.
FBT is calculated on the price or book value of the vehicle rather than the relative utility value. Therefore,
those who use a car the least pay the same tax as those who make excessive use of company cars. Policies
that have been proposed to improve horizontal equity of the tax system often highlight the need to
remove tax exemptions for employer-provided parking and apply FBT on company cars in relation to the
distance travelled.
5.2 Tax neutrality and environmental taxes
5.2.1 Tax neutrality
The concept of tax neutrality is based on the principal that tax is intended to have a neutral impact on
how individuals and companies make decisions (ie choose to invest). Income taxes should not divert
investment from one area into another. Good tax policy does not arbitrarily favour one group or industry
over others, such as motorists versus non-motorists, and therefore the automobile and fuel industry over
other industries. Sound tax policy should also be economically neutral (tax policy does not favour one
industry or consumer good over others, such as automobile and fuel purchases over other goods) or
Company cars and fringe benefit tax – understanding the impacts on strategic transport targets
54
biased to achieve a specific outcome (such as taxing cigarettes at a higher rate to reduce smoking and
raise revenue to pay for additional health costs).
Companies and individuals should make decisions based on economic benefit or merit rather than based
on tax policy. The tax neutrality of FBT in relation to company cars is difficult to achieve because:
• the provision of car parking has a significant taxable value but is not taxed
• the cars provided are typically new vehicles while most New Zealanders buy second-hand vehicles
when purchasing a vehicle of their own. The salary sacrificed is less than the value of the vehicle
provided, hence FBT is not a neutral effect
• those with the highest parking costs and longest commutes benefit most from current tax policy.
It has been suggested that tax benefits provided for company cars be extended to assist in paying for
public transport fares. A policy that targets public transport is not neutral according to tax policy
principals. Public transport is only a viable option for some employees, while those who walk or cycle
obtain no benefit and those who do not live near public transport may not have viable options. By
excluding benefits for those who walk and cycle, a tax exemption for public transport fares would also be
horizontally inequitable.
5.2.2 Externality taxes
The goal of externality taxes is to correct the pricing signals so externalities such as congestion, crashes
and pollution are included in the price and thus the decision process. The taxes are used as a pricing
mechanism rather than being a traditional revenue gathering mechanism. They can be considered as
charges, levies or externality prices so that neutrality objectives are met. Externality pricing is a more
accurate description of their function than a tax. Externality-based taxes differ from income taxes in that
they have a deliberate diversion intention. The intent is to divert investment away from activities that
cause the externality or towards measures that mitigate the effect.
The tax system can be designed to encourage certain behaviour (the UK company car tax system is an
example of this). It can be argued the externality tax introduces a price to counterbalance externality
distortions in the market. Before externalities are priced, they are not included in the decision-making
process and hence decisions are made without considering the full consequences. In the worst case, the
products with the lowest costs of production and highest externalities can have the lowest price. This is
the case with cars in particular. Cars with the least safety features and limited emissions controls are
cheaper to buy than cars with advanced safety features, particle filters and high fuel efficiency features.
Environmental taxes are aimed at taxing externalities to resolve market failures. These taxes are aimed at
changing behaviour with the tax reflecting the externality price. This tax is not paid equally (in terms of
horizontal equity) with many choosing to avoid paying the tax by choosing a product with a lower
externality impact and therefore a lower tax burden.
Effective externality taxes generate lower revenue as the externality impact is reduced. Thus, the tax
system loses revenue in favour of lower externalities. While society as a whole may benefit from lower
rates of pollution, congestion or crashes, the government on the other hand will collect less revenue.
However, the government will benefit in terms of lower costs related to congestion, crashes and pollution-
related illness. The financial benefits may accrue over the long term, eg rates of cancer and deaths related
to pollution will fall in the long term but tax revenue will decreasein the same year the tax is introduced.
Externality impacts are often long term and are spread across all sectors of society and the environment,
not just government sectors. As a result of the UK experience with company car tax reform based on
emissions, there was a switch to low-emissions vehicles as company cars. This achieved the goals of lower
5 FBT and transport
55
emissions but had a corresponding drop in FBT revenue. There was also evidence of a switch to the use of
private vehicles (which tend to be less fuel efficient and have higher emissions) and expense
reimbursement.
5.2.3 Tax policy dilemma
The ideological differences between an ‘ideal’ income tax and an ‘ideal’ externality tax make them
incompatible. Income taxes are ideally unavoidable while taxes aimed at changing behaviour are most
successful if people change their behaviour to avoid the tax (and potentially no tax gets collected).
Transport and environmental policy has increasingly targeted reduction in emissions and a focus on
transport efficiency by discouraging single occupant travel in favour of more efficient and environmentally
lower-impact modes. If all transport choices had the same external effects then neutral policy could be
applied. The cost of emissions has not been borne by the emitter and this market failure needs to be
addressed by various measures such as regulation, pricing and taxation. Policy alignment is important to
avoid environmental and transport policy being undermined by tax policy.
5.3 Transport efficiency
Transport efficiency is not typically a major consideration when developing tax policy. FBT policy appears
to have avoided the relative resource requirements and impacts of driving compared with other modes. By
omitting car parking as a taxable benefit, allowing work vehicles to be exempt and taxing public transport
fare subsidies, taxation policy has acted to encourage car use rather than be neutral to mode choice. The
additional externality impacts related to driving include:
• traffic congestion
• road and parking facility costs
• crashes
• energy consumption
• pollution emissions
• sedentary living/obesity
• urban sprawl.
These are generally ignored in current FBT policy. The tax is focused on the purchase price and
depreciated price of the vehicle and acts like a subsidy in favouring longer distance driving over shorter
commutes and alternative modes of travel. Transport efficiency is not well addressed in existing taxation
arrangements for company cars.
5.4 Land-use development efficiency
In New Zealand, FBT is calculated on the value of the vehicle, which means the distance it is driven and the
cost of fuel are not taken into account. Those who benefit the most in these circumstances are those who
have the furthest to travel to get to and from work. This is not an effective policy in regard to land-use
efficiency as it creates incentives biased in favour of motor car use and long commute distances. These act
to encourage fringe or rural living in favour of living close to the workplace. Urban consolidation and the
reduction of urban sprawl is seen as a major aim of land-use policy in most western countries. Current FBT
policy conflicts with these aims.
Company cars and fringe benefit tax – understanding the impacts on strategic transport targets
56
5.5 Assessment
Current FBT as applied to company cars and tax-free car parking at work can be said to be problematic
when evaluated against the tax ideals of horizontal equity, tax neutrality, transport efficiency and land-use
development efficiency.
FBT is neutral in its treatment of vehicles’ energy efficiency and emissions, so there is no financial
incentive to choose low emissions or fuel efficient vehicles. Individuals may elect to choose a company car
that is more powerful and inefficient as they are not paying for the petrol, thus they choose a car that they
would not have chosen if they were buying it privately.
Transport policy has increasingly become multimodal in its focus and there has been increased investment in
public transport. Travel plans and TDM initiatives have been implemented. In Auckland, initiatives like the
Northern Busway and the upgrade of the rail system demonstrate an ongoing commitment of government.
These direct investments encourage commuting to the CBD by public transport and involve large amounts of
government expenditure. Current FBT policy conflicts with these transport policies (and projects) by
encouraging increased car use (subsidised by government). Commuters get mixed policy messages; on one
hand they are paying for improved public transport infrastructure through petrol tax and property rates and
at the same time others are afforded a tax-free incentive to continue driving to work.
Variable registration fees have been introduced in some countries based on CO2 emissions and engine
size or based on Euro standards. Annual registration fees need to be high for this to have a major
influence on purchase decisions. Regulations such as the Euro standards are a much more effective
measure as they target vehicle manufacturers thus preventing inefficient and polluting cars from being
manufactured (at least in those countries where the standards apply). The introduction of low sulphur
diesel in 2006 and the removal of leaded petrol in 1996 and the requirement for catalytic converters are
all good examples of effective regulation to reduce pollution. New Zealand has restricted new car sales
and imported Japanese vehicles based on similar emissions standards in the 2007 Vehicle Exhaust
Emissions Rule. This has the advantage of affecting the entire fleet rather than just the company car
portion. The gradual tightening of emissions standards via regulation is the most appropriate means of
addressing this issue.
5.6 Tax reform and revenue neutrality
Tax reform often comes with the proviso of revenue neutrality. The Treasury and IRD wish to maintain tax
revenue so any change in tax is expected to maintain current revenue. Effective environmental taxes have
the goal of influencing behaviour and, if effective, result in tax avoiding behaviour that reduces revenue
but also reduces externalities. Thus, many of the policies aimed at pricing externalities, if effective, result
in a declining tax revenue stream much like taxes on alcohol and tobacco.
Transport-related externalities are more difficult to tax as they are not uniform across the product range.
Congestion is specific to a time and place with many areas of the country never affected. As such, a tax on
petrol does nothing to reduce congestion and more specific road pricing measures are needed.
5.7 Inland Revenue perspective
The above issues were canvassed in discussions with the IRD. Tax policy is set at the macroeconomic level
and is revenue based. The IRD uses FBT to capture tax avoidance. If employers did not offer cars instead
5 FBT and transport
57
of salary and wages there would be no need for FBT. The IRD protects tax revenue by taxing things used in
place of cash in employment packages.
The IRD view is that the tax system should not distort behaviour. The IRD opposes using tax to create
incentives and holds that allowing the exemption of public transport from FBT would reduce tax revenue
and distort behaviour towards public transport use. The IRD is more interested in capturing the currently
lost revenue that employer-provided car parking represents. Employer-provided parking needs to be
addressed as a benefit in kind and taxed as such. The issue therefore is one of establishing a fair value of
parking and political acceptance. Traditionally ‘on-premises’ parking benefits are exempt and parking
prices vary considerably making it difficult to establish the scale of benefits.
Using an average parking amount could be a second-best approach to that of an actual value system. Part
of the problem is that parking is unpriced on a per person basis when it is on employer premises. However
all cities have both public and private parking buildings which do provide a good indication of the value of
parking. Linking the employer’s value of parking to the value of the nearest public or private car parking
building may be an option for establishing fair value. All-day early bird parking rates are actually similar in
each urban centre due to competition between parking operators (including council-owned car parks). This
might also be an option to consider.
The reliance on PAYE income tax rather than a focus on user charges and behaviours causes those who
behave in desirable ways to subsidise those who do not. The change to hypothecate petrol tax from July
2008 has assisted in making the costs of road use more aligned to the cost of provision. This is an
example where tax policy has been aligned to transport impacts and efficiencies. Company car tax is part
of income tax policy, and is therefore removed from the transport policy area despite its implications for
transport.
Vehicle levies do not currently distinguish between cars registered as company cars and private vehicles,
despite their clearly different risk and travel behaviour profiles. Motorcycle users have had large increases
in their levies to reflect their higher risk and actual cost. In principle the same approach should be applied
to company cars to reflect their much higher crash and injury rates.
Allowing a tax exemption for public transport creates an incentive to use public transport instead of
walking, cycling and car use. Employees whose employers decide not to offer public transport passes are
disadvantaged and pay a higher tax burden. Public transport is limited to the urban environment, but even
within cities not all transport requirements can be met by public transport. Therefore, a tax exemption
that can only be used by a portion of taxpayers is clearly inequitable. The equity issues identified in
company car and car parking FBT would also apply if public transport were exempt from FBT.
The IRD preference would be to include the valuable benefit that parking represents as an alternative to
salary payment rather than add another exemption for public transport. It considers that adding another
exemption is adding another wrong to the system to make it right. However, this would only be the case if
the currently exempt car parking became taxable. To continue to exclude parking from FBT and to
disallow any change to favour public transport would perpetuate the problem rather than resolve it.
The neutrality of tax policy (especially with regards to environmental issues) has increasingly been
abandoned in favour of targeted tax policy with environmental objectives. The UK company car tax policy
is a good example. In New Zealand, the Ministry of Transport formulates transport policy but company car
taxation in New Zealand is related to personal income tax and despite its impact on transport and the
environment, it is determined by Inland Revenue and Treasury. Thus, the impacts on transport may be
irrelevant or incidental in tax policy but have a major implication for the effectiveness of Ministry of
Transport policy.
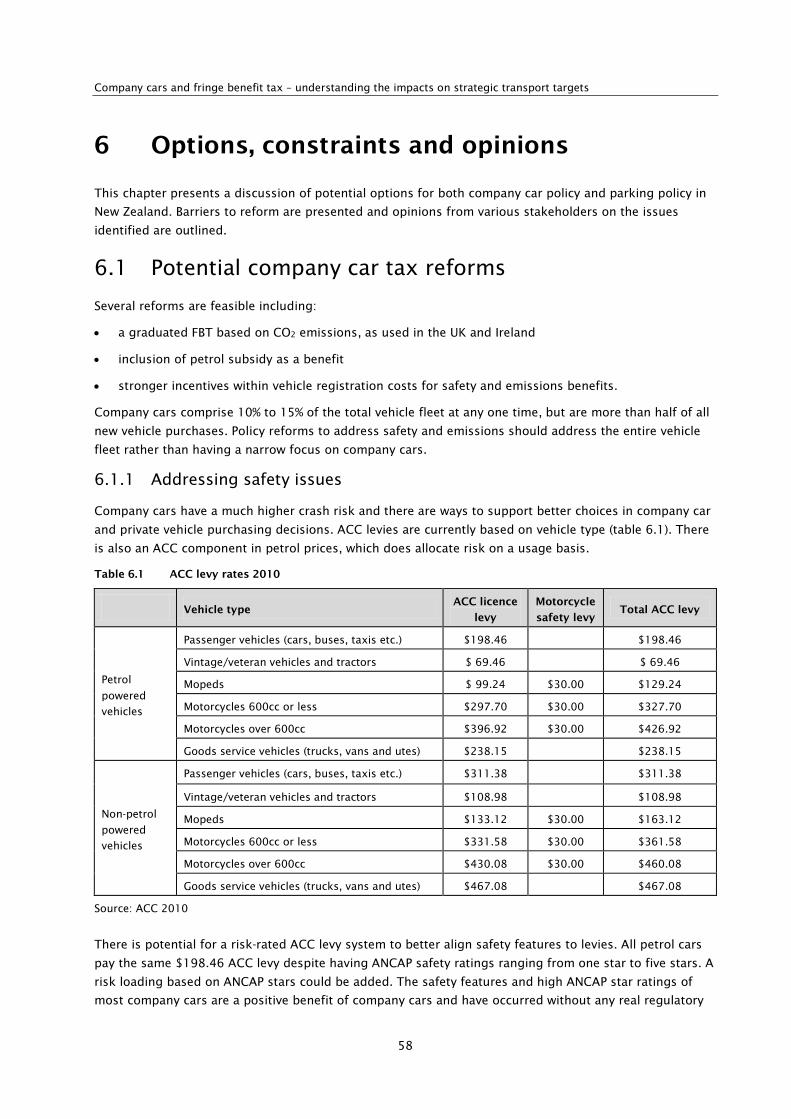
Company cars and fringe benefit tax – understanding the impacts on strategic transport targets
58
6 Options, constraints and opinions
This chapter presents a discussion of potential options for both company car policy and parking policy in
New Zealand. Barriers to reform are presented and opinions from various stakeholders on the issues
identified are outlined.
6.1 Potential company car tax reforms
Several reforms are feasible including:
• a graduated FBT based on CO2 emissions, as used in the UK and Ireland
• inclusion of petrol subsidy as a benefit
• stronger incentives within vehicle registration costs for safety and emissions benefits.
Company cars comprise 10% to 15% of the total vehicle fleet at any one time, but are more than half of all
new vehicle purchases. Policy reforms to address safety and emissions should address the entire vehicle
fleet rather than having a narrow focus on company cars.
6.1.1 Addressing safety issues
Company cars have a much higher crash risk and there are ways to support better choices in company car
and private vehicle purchasing decisions. ACC levies are currently based on vehicle type (table 6.1). There
is also an ACC component in petrol prices, which does allocate risk on a usage basis.
Table 6.1 ACC levy rates 2010
Vehicle type ACC licence
levy
Motorcycle
safety levy Total ACC levy
Petrol
powered
vehicles
Passenger vehicles (cars, buses, taxis etc.) $198.46 $198.46
Vintage/veteran vehicles and tractors $ 69.46 $ 69.46
Mopeds $ 99.24 $30.00 $129.24
Motorcycles 600cc or less $297.70 $30.00 $327.70
Motorcycles over 600cc $396.92 $30.00 $426.92
Goods service vehicles (trucks, vans and utes) $238.15 $238.15
Non-petrol
powered
vehicles
Passenger vehicles (cars, buses, taxis etc.) $311.38 $311.38
Vintage/veteran vehicles and tractors $108.98 $108.98
Mopeds $133.12 $30.00 $163.12
Motorcycles 600cc or less $331.58 $30.00 $361.58
Motorcycles over 600cc $430.08 $30.00 $460.08
Goods service vehicles (trucks, vans and utes) $467.08 $467.08
Source: ACC 2010
There is potential for a risk-rated ACC levy system to better align safety features to levies. All petrol cars
pay the same $198.46 ACC levy despite having ANCAP safety ratings ranging from one star to five stars. A
risk loading based on ANCAP stars could be added. The safety features and high ANCAP star ratings of
most company cars are a positive benefit of company cars and have occurred without any real regulatory
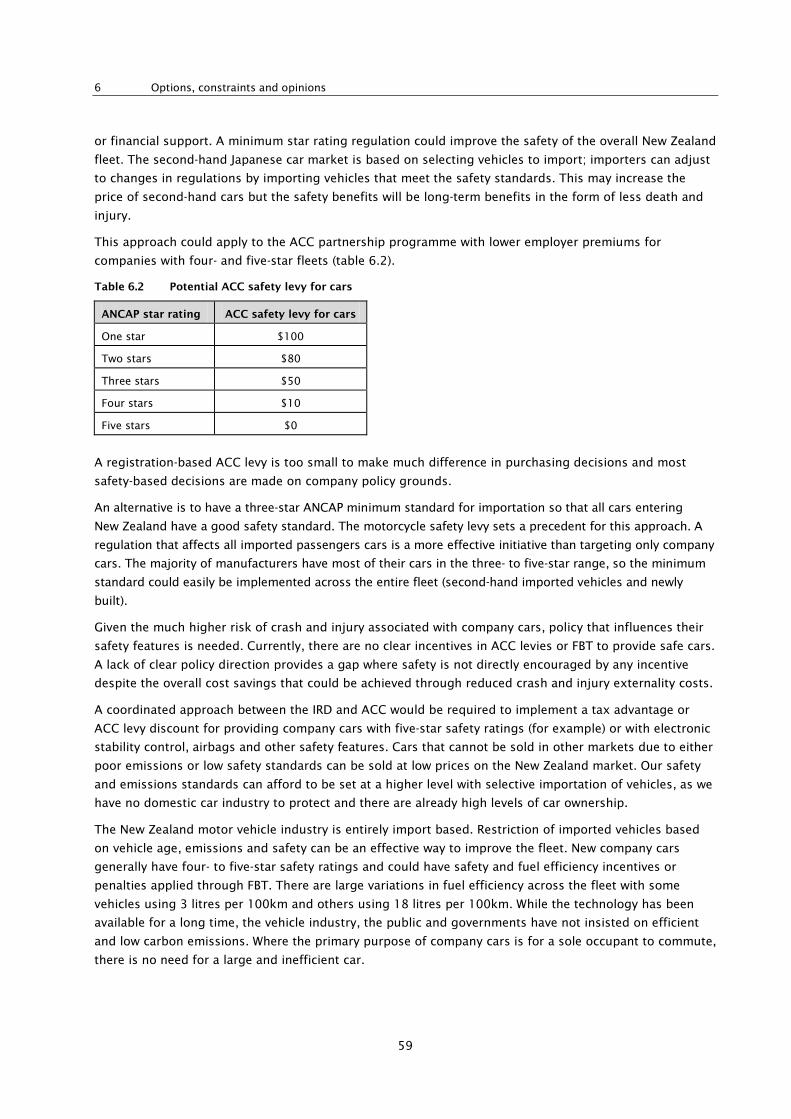
6 Options, constraints and opinions
59
or financial support. A minimum star rating regulation could improve the safety of the overall New Zealand
fleet. The second-hand Japanese car market is based on selecting vehicles to import; importers can adjust
to changes in regulations by importing vehicles that meet the safety standards. This may increase the
price of second-hand cars but the safety benefits will be long-term benefits in the form of less death and
injury.
This approach could apply to the ACC partnership programme with lower employer premiums for
companies with four- and five-star fleets (table 6.2).
Table 6.2 Potential ACC safety levy for cars
ANCAP star rating ACC safety levy for cars
One star $100
Two stars $80
Three stars $50
Four stars $10
Five stars $0
A registration-based ACC levy is too small to make much difference in purchasing decisions and most
safety-based decisions are made on company policy grounds.
An alternative is to have a three-star ANCAP minimum standard for importation so that all cars entering
New Zealand have a good safety standard. The motorcycle safety levy sets a precedent for this approach. A
regulation that affects all imported passengers cars is a more effective initiative than targeting only company
cars. The majority of manufacturers have most of their cars in the three- to five-star range, so the minimum
standard could easily be implemented across the entire fleet (second-hand imported vehicles and newly
built).
Given the much higher risk of crash and injury associated with company cars, policy that influences their
safety features is needed. Currently, there are no clear incentives in ACC levies or FBT to provide safe cars.
A lack of clear policy direction provides a gap where safety is not directly encouraged by any incentive
despite the overall cost savings that could be achieved through reduced crash and injury externality costs.
A coordinated approach between the IRD and ACC would be required to implement a tax advantage or
ACC levy discount for providing company cars with five-star safety ratings (for example) or with electronic
stability control, airbags and other safety features. Cars that cannot be sold in other markets due to either
poor emissions or low safety standards can be sold at low prices on the New Zealand market. Our safety
and emissions standards can afford to be set at a higher level with selective importation of vehicles, as we
have no domestic car industry to protect and there are already high levels of car ownership.
The New Zealand motor vehicle industry is entirely import based. Restriction of imported vehicles based
on vehicle age, emissions and safety can be an effective way to improve the fleet. New company cars
generally have four- to five-star safety ratings and could have safety and fuel efficiency incentives or
penalties applied through FBT. There are large variations in fuel efficiency across the fleet with some
vehicles using 3 litres per 100km and others using 18 litres per 100km. While the technology has been
available for a long time, the vehicle industry, the public and governments have not insisted on efficient
and low carbon emissions. Where the primary purpose of company cars is for a sole occupant to commute,
there is no need for a large and inefficient car.
Company cars and fringe benefit tax – understanding the impacts on strategic transport targets
60
6.1.2 Differentiated fringe benefit tax rate based on emissions
Changing FBT from the dollar value to a differentiated tax rate based on emissions seems to be a suitable
policy. This is used in the UK and Ireland. Variable registration and annual use taxes based on CO2 can
affect purchasing decisions.
Restrictive emissions regulations have not had a major impact on vehicle prices which indicates this type
of regulation could be acceptable (in that emission standards could be raised without a negative financial
impact on New Zealand consumers).
Historically, company cars have had larger engines and this has distorted the New Zealand fleet more
towards these cars than if all vehicles were privately purchased. However, the company car market reduces
the average age and now introduces new safety and fuel efficiency into the fleet.
The recent increase in fuel prices combined with the global recession has caused a rapid change in the
type of company cars purchased and leased. A change to FBT policy that taxes emissions and offers
discounts for safety features would reinforce current best practice. Broader regulatory policies aimed at
safety and emissions of the total fleet would be more effective and FBT reform should focus on taxing
employer-provided parking, or as a second-best option affording public transport and cycling the same
subsidy as parking.
6.1.3 Taxing private use using commute distance
The current policy establishes a fixed percentage taxable value of the vehicle that includes an assumption
about average annual distance travelled and an assumption regarding the split between business and
private travel. This approach is easy to apply but imprecise and inequitable. By adding a value for each
kilometre of distance between home and work, the extra benefit that long-distance commuters gain could
be taxed. While this would capture the primary commute, other private use would not be measured. It
would be a single measure so would be easy to apply. By adding a per kilometre value for the commuting
benefit of subsidised running costs a person commuting 20km from home to work (40km per day) would
have their taxable income increased to match the fringe benefit received.
This approach would more equitably tax the benefit of receiving a company car and having commute to
work costs paid for.
6.1.4 Recommendations
To improve the horizontal equity of the tax system, employer-provided parking should not receive a tax
exemption and those who gain the most value in terms of private distance travelled should pay more than
those who travel shorter distances. Company cars can be taxed at different rates based on their emissions
and safety benefits rather than value alone. If car parking is not taxed then an exemption for public
transport subsidy should be added as a second-best policy. Subsidy of cycling can also be exempt in the
absence of a correction of the parking subsidy. Complementary policies concerning stricter emissions and
safety regulations on imported vehicles will improve the efficiency and safety of the fleet. ACC levies can
also be better targeted to give discounts to vehicles with high safety ratings and penalties to those with a
lack of safety features. Councils can also apply parking levies and introduce maximum parking standards
rather than minimum standards in urban planning regulations. Council-owned car spaces could minimise
all day commuter parking and reduce parking supply in association with improvements in public transport.
6 Options, constraints and opinions
61
6.2 Barriers to company car tax reforms
Most opposition to reform is likely to come from those fleet providers, employers and employees who
currently benefit from the current tax policy.
Employers can reduce wage costs by substituting wages for company cars and parking. Employers have
access to discounted vehicles, which may be required to provide business functions anyway. In Australia
some employers have been known to obtain motor vehicle trader licences (totally unrelated to their
business) in order to maximise the benefit at sale from cheap company car purchases.
Fleet providers and car sales yards also have a stake in supplying company cars and a significant
proportion of new vehicle sales supply this market.
Employees with company cars who live a long way from where they work may be opposed to a more accurate
assessment of the commuting benefit they receive. Employees who currently receive company cars or car
parking especially in cities may also be opposed to changes. Employees who cycle, walk, use public transport
or pay for their own parking may be in favour of changes as this would improve equity for them.
6.3 Observations on changing business culture
The shift away from hierarchical structures to flatter management structures reduces the need for status-
linked remuneration. There is also a trend to have pool cars available for work purposes during the day.
These pool cars are ‘work vehicles’ (see glossary) often including logos, bolted-down seats and cargo net
screens. Pool fleets are often homogeneous vehicles purchased in bulk. Pool cars typically have smaller
engines and access is not status based. There may still be a few fringe benefit vehicles reserved for upper
management. The practice of garaging pool vehicles at home may be prompted by a lack of secure
parking at an employer’s premises or as a way of rewarding staff.
The problem has traditionally been that staff members view their company car as being a
status symbol, so downsizing was not a popular option, but FleetSmart really has seen a
change in this attitude where clients and their staff are taking the environment more
seriously and purchasing smaller vehicles where practical. This attitude has been driven from
the top down, with many managers moving from V8s and V6s to 4 –cylinder options. (Alan
Roberts, FleetSmart, New Zealand Company Vehicle Feb 2009, p54)
The company car is often the only choice of subsidised transport available; however, if companies wish to
offer public transport as an option then annual passes would make this easier. People living near rail, ferry
or busways can travel fastest by public transport. As employment packages have become more flexible
and more individually tailored, there has been some improvement in the alternatives offered.
Coca Cola Amatil New Zealand (CCANZ) switched from four-wheel-drive Suzuki Vitaras to Volkswagen Golf
1.9 l TDI diesels between 2008 and 2010. Some representatives had monthly fuel bills of $1000 with the
Vitara; however, on the same route, the Golf TDI consumed $250 of fuel (New Zealand Company Vehicle
April 2010, p46). This sort of change reflects the global shift away from the four-wheel-drive SUV to fuel-
efficient vehicles. Companies may have been motivated by high fuel prices in 2008 and 2009, which still
remained high in 2010 and 2011.
Some companies have adopted a four-cylinder maximum policy thus reducing car choices. Suppliers are
aware of this trend and are offering more four-cylinder vehicles.
However, status-based cars can still be fuel efficient. European manufacturers have been producing
efficient diesel and hybrid luxury cars for some time. Companies have been downsizing the engines while
Company cars and fringe benefit tax – understanding the impacts on strategic transport targets
62
the cars remain the larger-size vehicles. Mercedes Benz has several diesel hybrids (C220 EDI, E 250 CDI,
S400 and the E300 Bluetec Diesel Hybrid). BMW has also a range of diesels with low carbon dioxide
emissions and good fuel economy.
Manufacturers are already strongly focused on luxury models with efficient engines; therefore, there will
soon be many more choices in terms of efficient low-emission vehicles in the market. For example, a four-
cylinder Ford Falcon became available in late 2011. The advances in engine efficiency have been achieved
without major reductions in power output. Some also achieve this via the switch to second- and third-
generation common rail diesel engines with better power output. The diesel fleet will continue to grow in
New Zealand as it has in Europe. Petrol engines are not as energy efficient as modern diesel engines and if
particulates are minimised, emissions can be lower.
The commercial vehicle market (delivery vans and small trucks) has also seen changes in company policy
with some companies moving to efficient diesel vans and even hybrid delivery trucks. Some of this is
driven from overseas policies. For example, Coca Cola USA uses hybrid delivery trucks and a Hino hybrid
is used in Auckland.
A shift to smaller vehicles addresses energy conservation and emissions reductions. It does nothing to
reduce traffic congestion, crashes or sprawl, or the inequity of a tax policy that favours automobile
commuters over people who rely on other modes.
6.4 The fleet providers’ perspective
Fleet providers in New Zealand have been fast to react to the changing requirements of their customers.
The increasing importance of environmental performance has been met with emissions limits being
included in the standard specifications of vehicles reviewed in industry magazines.
Market and labour conditions have not yet forced executives out of their six cylinder cars, but
it is only a matter of time before this happens. (New Zealand Company Vehicle December
2008, p14)
There is no doubt that the six cylinder vehicle is no longer the mainstay of the New Zealand
company fleet and the average cubic capacity of our car park has certainly dropped.
(New Zealand Company Vehicle December 2009, p50)
The cars on offer are now typically four cylinder and two litres or less. It is rare to find cars with official
fuel efficiency figures of over 10 litres per 100km. Most are around the five to six litres per 100km mark.
Active fuel management systems can be used in V8 cars making them run on four cylinders some of the
time to reduce fuel consumption.
The incentive to change vehicle choice has come through high oil prices rather than through government
intervention and the market has had a fundamental and likely long-term shift.
Ten years ago, nobody gave a damn. Today, the three biggest questions that get asked by
organisations looking at prospective new business vehicles are:
1. How many crash safety stars does it have?
2. How economical is it on fuel?
3. How clean are its emissions?
(Lease Plan Steering Column Autumn 2010)
6 Options, constraints and opinions
63
The company car fleet of the future is likely to have much lower emissions, better safety and fuel
efficiency than in the past. The increasing use of stop-start technology reduces fuel consumption while
stopped or idling at traffic lights or in congested traffic. Testing of stop-start vehicles in Auckland
conditions as reported in New Zealand Company Vehicle shows they will save fuel.
The Eco-Start Sprinter had proved to be about 10 percent more economical and considering
that the cost of the option is only $365 inclusive of GST, we think that it would pay for itself
many times over particularly for urban operators. (New Zealand Company Vehicle August
2009)
Given the availability of stop-start options and their cost effectiveness, it is likely they will be widely
adopted. Small hybrid electric/diesel trucks with idle stop are now available that suit the delivery market in
urban environments. Cars are being designed with low drag coefficients, low roll resistant tyres, lighter
engines and CVT transmissions. Holden has spark ignition direct injection petrol engines while Ford has
its ECO boost range of engines, which are typically 20% to 25% more efficient than their previous engines.
Fleet leasing companies are left with a vehicle to either sell or lease at the end of lease contracts. The
residual value of vehicles has an influence on the range and price of vehicles they offer to employers.
Fuel (price) has had a major impact on the residual values of the large 6 cylinder category of
vehicle. There has been a permanent mind shift to find alternatives. (New Zealand Company
Vehicle February 2009, p62)
The leasing operators can see that in an environment of high fuel prices, they will not get the residual
prices they have in the past and some have reduced the number of six-cylinder vehicles on offer.
Three years ago (2006) Lease Direct decided to forgo second time leases on six cylinder
vehicles because of the high costs involved in maintenance which had to be factored into
lease payments. (New Zealand Company Vehicle October 2009, p62)
Lease Direct specialises in second-time lease cars so has to have a long-term view of the market. Once
vehicles are returned they will be selling back into the second-hand market dominated by second-hand
Japanese vehicles; therefore, they must have vehicles that will sell in that market. In 2009 and 2010, there
was a trend for leasing contracts to be extended from 36 to 45 months, which has mitigated the residual
value impact of releasing vehicles into a market where there was little demand for them (New Zealand
Company Vehicle December 2009, p51). The drop in demand is both recession and petrol price driven,
with demand for larger V8 and V6 cars dropping considerably and the smaller vehicle market outselling
the large vehicle section.
The sustainability and efficiency goals of employers have been identified quickly by fleet providers who
have responded with programmes to identify ways to reduce emissions and increase energy efficiency.
Examples of sustainability-focused products aimed at employers include the Custom Fleet Drive Lightly
programme and Fleetsmart’s EcoFleet service.
The growth in diesel vehicle sales has largely been driven by the inherent energy-density benefits of diesel
fuel and the improvements in modern diesel engine performance. Lightweight aluminium common rail
diesel engines in association with advanced particle filters will become increasingly common, with the
Ford Fiesta Ecocentric being one example.
Diesel hybrids like the Peugeot 3008 Hybrid4 are the next generation. While the particulate emissions are
of more concern with diesel engines, this can be addressed by particle filters and other methods. Diesel
vehicles also have an advantage for transport pricing policy purists as they pay distance-based road user
charges so reflect road use more accurately than petrol excise.
Company cars and fringe benefit tax – understanding the impacts on strategic transport targets
64
Vehicle manufactures are also targeting fuel consumption (a proxy for carbon dioxide emissions). Mazda
Motor Corporation has a target of reducing the fuel consumption of Mazda vehicles sold by an average
30% by 2015 (New Zealand Company Vehicle October/November 2008, p15).
The importance of the company car market in keeping the New Zealand fleet up to date with innovations
should not be underestimated. Fleet providers can import cars with or without new innovative features
(such as safety or efficiency improvements) and if employers are not given any reason to opt for such
features, there is no guarantee the New Zealand fleet will, in the future, reflect improvements to safety,
efficiency and emissions. A safety strategy that targets company cars and rental cars can influence the
vast majority of new cars, while a comprehensive strategy would need to include the second-hand market.
Changes to the regulation of Japanese imported vehicles in association with changes to company car tax
policies could assist in ensuring both second-hand and new car sales include these types of innovations.
At present, the pricing signals are absent. The incentive to purchase cars with safety features is consumer
driven, with no requirement to display the safety features when selling a vehicle. Fuel price incentive has
only been recently strong enough to cause a change in car purchasing decisions. European manufacturers
have had much more stringent emissions controls under EU standards so have had incentives to develop
efficient engines; hence, they are well advanced in their production of diesel engines compared with
American and Australian manufacturers who have had to catch up quickly to maintain market share in the
new world of high price oil since 2007. The lack of good policy may have assisted in the demise of the US
auto industry, which was still focused on large vehicles with relatively inefficient engines when fuel prices
soared. Some of the more successful American cars such as the Chrysler 300c were made possible with
Mercedes Benz diesel engines.
6.5 Corporate responsibility
6.5.1 Workplace safety and company vehicles
The New Zealand Department of Labour stipulates employers must take all practicable steps to ensure
their employees are safe from harm while they are working. Concerning driving, ‘all practicable steps’
would include having processes for ensuring any vehicle used for work purposes is:
• roadworthy and warranted
• adequately and appropriately insured
• loaded and used only within its specified capability.
These are minimal requirements and a more robust guide is found in Your safe driving policy (August
2010), which is jointly published by the NZTA, ACC and the Department of Labour.
The safe driving policy guide has much better direction and suggests that employers:
• choose vehicles with a high safety rating
• provide driver education
• deal with driver tiredness and distraction
• reduce speeding and promote use of safety belts and other features
• provide incentives to ensure safe driving.
The policy provided as a model in the document has some guidance on vehicle procurement and suggests:
• buying and/or hiring vehicles that rate four or more stars in the ANCAP tests

6 Options, constraints and opinions
65
• choosing vehicles with electronic stability control (ESC), ABS brakes and side head-protecting airbags
• buying and/or hiring vehicles that are light coloured
• fitting all vehicles with a first aid kit, fire extinguisher, torch and emergency triangle.
This joint approach to education materials is commendable and could lead to more coordinated
regulation. The guide also makes it difficult for employers to argue they did not know what types of things
they could do to make the workplace safer. It would be difficult to justify purchasing a fleet with a one- or
two-star ANCAP rating. As features such as ESC and ABS become almost standard, choosing vehicles
without them becomes questionable. Any change to ACC levies or the partnership programme to
incorporate some sort of registration or levies discount for ANCAP ratings or for airbags, stability controls
or braking systems would impact on the total vehicle fleet. Given the large portion of the fleet that enters
New Zealand as second-hand cars any policy needs to consider the wider impacts of policy adoption.
Cars are part of the workplace for many employees and, as such, the safety features available are
important considerations under Occupational Safety and Health (OSH) regulations regarding provision of a
safe place to work. While there is not an explicit requirement to have the latest safety features, most
employers whose employees drive as part of their job incorporate safety concerns in their procurement
decision. Employers have responsibilities under duty of care and safe workplace environment
requirements; however, how this is interpreted and implemented in terms of fleet procurement and
driving policies is largely left to employers.
6.5.2 Environmental performance
Many companies have changed how they report performance to include environmental performance as
part of triple bottom line reporting. The transport emissions of a vehicle fleet can be a significant part of a
company’s total emissions and therefore come under scrutiny. Company car choice becomes aligned to
these principles and therefore considers driver safety, energy efficiency and emissions. A status-based
company car with a larger engine size for upper management may be incompatible with this new
philosophy.
This year (2008) we committed to replace all of our current fleet with more environmentally
efficient vehicles, which we estimate will reduce our carbon emissions by 600 tonnes per year
once the whole fleet is replaced. (Westpac New Zealand Stakeholder report 2008)
Alan Large, Westpac category manager: Reducing carbon dioxide emission and total cost of
ownership was one part of the equation but the procurement team also had to factor in
safety features, fuel efficiency and fit for purpose. (New Zealand Company Vehicle December
2008)
Increasingly, company sustainability strategies are influencing fleet choices. Progressive
Enterprises sustainability strategy aims to reduce their carbon dioxide footprint by 40% from
2006 to 2015. By changing the company car cars to efficient and low carbon dioxide
emissions vehicles a 30% reduction in the footprint of the fleet was achieved. (New Zealand
Company Vehicle December 2008)
I would think that in two to three years’ time environmental and social responsibility will be
the key driver in fleet purchases. Charles Wilmer LeasePlan (New Zealand Company Vehicle
October/November 2008)
Companies with European or UK head offices are increasingly directing global policies, which reflect the
market conditions that exist in the EU, with increasingly restrictive emissions policies. If fleet lease and
Company cars and fringe benefit tax – understanding the impacts on strategic transport targets
66
company purchase of new cars with high safety and environmental benefits can be encouraged without
reducing the overall size of the company car market then the environmental and safety standard of the
fleet can be improved.
The recent increase in oil prices has achieved a significant change in the transport market. The industry
has had a painful period of adjustment that could have been made easier by earlier and unambiguous
government policy signals (regarding environmental, congestion and peak oil considerations).
6.6 Potential policies to address employer-provided parking
Policy applied by different segments of government needs to align to ensure the objectives of the various
policies are complementary rather than undermining each other.
Employer-provided parking and the requirement to provide minimum levels of parking is perhaps the main
area for a change in policy focus. There is a major focus on reducing congestion and to increase use of
public transport in Auckland, Wellington and Christchurch, yet parking provided on premises by
employers is tax free and at no cost to employees. The cost of this parking is hidden in the rents paid by
employers. There may be no daily out-of-pocket charge for those who drive and park at work.
Taxation of employer-provided car spaces happens in Canada, Sweden and Australia and Ireland. These
countries have similar economies, car ownership and urban rural population patterns. In Ireland the tax
only applies to selected cities, a €200 per annum parking levy on employees using car parking facilities
provided by their employer has been introduced in the cities of Dublin, Cork, Galway, Limerick and
Waterford. The levy is reduced for job sharers, part-time employees, people on maternity leave and shift
workers. The levy does not apply to disabled drivers. This type of limited application parking levy can
target the tax to those cities where parking has a value, where congestion has an impact and where public
transport alternatives are available.
Employer-provided car parking is taxed as a benefit in Australia.
A car parking fringe benefit will not arise from providing parking facilities for employees
unless there was a commercial car parking station within one kilometre of the employer
provided facility, and that car parking station charged more than $7.07 for all day parking
at the start of this FBT year. (Australian Tax Office 2009)
The $7 threshold isolates the tax to urban areas where parking is valuable, congestion problems exist,
and public transport alternatives are available. A similar amendment to New Zealand tax law would assist
in aligning Australian and New Zealand tax law, and reduce the significant tax revenue loss that this
untaxed benefit currently represents.
New Zealand local authorities in the absence of nationwide action have introduced measures to combat
the market failures that lead to smog and congestion. Several cities have introduced car parking taxes or
low emissions zones. Low emissions zones can focus on heavy goods vehicles to increase the turnover
towards the newer diesel engines with lower emissions. The visible smoke test is also an important
measure introduced to target the worst vehicles. The banning of wood burning fires in Christchurch is an
example of a localised regulatory approach. The congestion charges in Singapore and London also
address the congestion issue through a charge or tax-based measure. Common resources such as road
space require pricing (taxing) to reduce market failure.
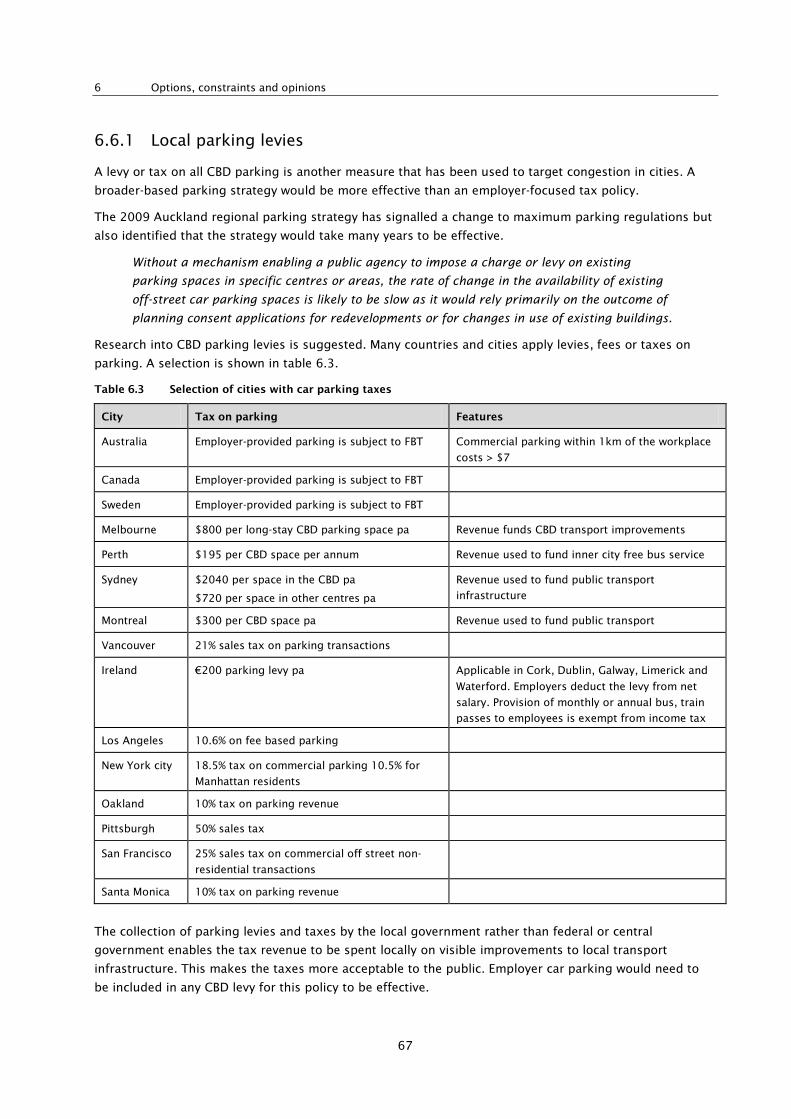
6 Options, constraints and opinions
67
6.6.1 Local parking levies
A levy or tax on all CBD parking is another measure that has been used to target congestion in cities. A
broader-based parking strategy would be more effective than an employer-focused tax policy.
The 2009 Auckland regional parking strategy has signalled a change to maximum parking regulations but
also identified that the strategy would take many years to be effective.
Without a mechanism enabling a public agency to impose a charge or levy on existing
parking spaces in specific centres or areas, the rate of change in the availability of existing
off-street car parking spaces is likely to be slow as it would rely primarily on the outcome of
planning consent applications for redevelopments or for changes in use of existing buildings.
Research into CBD parking levies is suggested. Many countries and cities apply levies, fees or taxes on
parking. A selection is shown in table 6.3.
Table 6.3 Selection of cities with car parking taxes
City Tax on parking Features
Australia Employer-provided parking is subject to FBT Commercial parking within 1km of the workplace
costs > $7
Canada Employer-provided parking is subject to FBT
Sweden Employer-provided parking is subject to FBT
Melbourne $800 per long-stay CBD parking space pa Revenue funds CBD transport improvements
Perth $195 per CBD space per annum Revenue used to fund inner city free bus service
Sydney $2040 per space in the CBD pa
$720 per space in other centres pa
Revenue used to fund public transport
infrastructure
Montreal $300 per CBD space pa Revenue used to fund public transport
Vancouver 21% sales tax on parking transactions
Ireland €200 parking levy pa Applicable in Cork, Dublin, Galway, Limerick and
Waterford. Employers deduct the levy from net
salary. Provision of monthly or annual bus, train
passes to employees is exempt from income tax
Los Angeles 10.6% on fee based parking
New York city 18.5% tax on commercial parking 10.5% for
Manhattan residents
Oakland 10% tax on parking revenue
Pittsburgh 50% sales tax
San Francisco 25% sales tax on commercial off street non-
residential transactions
Santa Monica 10% tax on parking revenue
The collection of parking levies and taxes by the local government rather than federal or central
government enables the tax revenue to be spent locally on visible improvements to local transport
infrastructure. This makes the taxes more acceptable to the public. Employer car parking would need to
be included in any CBD levy for this policy to be effective.
Company cars and fringe benefit tax – understanding the impacts on strategic transport targets
68
The city councils in Auckland, Wellington and Christchurch also own parking facilities. They can influence
the parking price, type and supply. The managers of council-owned car spaces may have revenue targets
and be motivated to ensure maximum occupancy rather than to achieve other TDM goals. Hence much of
the parking supply in Auckland provided by the city council is priced lower than the surrounding
commercial operators. It is targeted at long-stay commuters, with most of the car parks used by early bird
(in before 9.30am) parkers. If all the council car parking buildings became short-stay parking, there would
be an oversupply of short-stay parking and a sudden shortage of commuter parking.
The Melbourne levy had a less than expected impact on mode share. The authors of a review found:
One of the main reasons for the levy’s relatively small impact is that the driver does not
typically pay for the cost of parking. As economic conditions change, and as labour contracts
are renegotiated, there may be increased opportunities to place the burden of the parking
levy on to drivers. (Hamer et al 2009)
If employers pay the cost (instead of the employee) then parking levies will have minimal effect on mode
share changes. In the Melbourne example, the charge was levied against the facility owners (not even
employers) at a time of heightened competition (due to reduced car mode share for CBD travel). The result
was an escalation in short-term parking fees (as they are inelastic) and a reduction in long-term parking
fees (as demand for long-term parking is highly elastic).
A similar argument could be applied to FBT on parking; if the employer pays this the employee may not be
exposed to this new cost. This type of policy may take a long time to have its full effect – as employers
can only change employment conditions when contracts are changed this may only be for new employees.
The Irish parking levy is paid from employees’ incomes so it is a clearer incentive for those who can avoid
parking to do so.
6.7 Barriers to parking policy changes
Introducing a tax on employer-provided parking might result in a reduction in the provision of onsite
parking and shift parking to elsewhere in the CBD. The CBDs of Auckland, Wellington, Hamilton,
Christchurch and Tauranga already have parking controls that reduce the availability of free parking within
the CBD to a minimum. Employees can still choose to drive and park in the privately operated car parks in
the CBD. There is a risk that people will continue to drive and park especially if employers absorb the tax.
For the IRD the problem of an untaxed benefit would be solved, but transport behaviour may not change
as much as might be expected.
Arguments against applying FBT to employer-provided parking are usually based on the difficulties of
calculation and administrative costs that would be added to employers. By using a standard urban parking
value of $10 per day per space in cities (adjusted for consumer price index changes) this would reduce the
administration costs and provide a standard parking rate. While this might represent an under-charge in
some cases and an over-charge in others, it would correctly identify that parking provided by an employer
has value and is being ‘paid’ to employees instead of PAYE income. Even if this charge was only applied in
Auckland, Wellington, Christchurch, Hamilton and Tauranga, a significant transport price inequity would
have been addressed and a loss of tax revenue resolved for the majority of the population. There is little
point in instituting a parking charge in small towns where there are no parking charges on suburban streets.
The Australian system of using the parking price in nearby parking buildings above a minimum threshold
is also a viable policy. Aligning New Zealand FBT policy regarding company cars and car parking to policy
in Australia could make it easier for trans-Tasman businesses to manage their FBT obligations.
7 Conclusions
69
7 Conclusions
This chapter presents a summary of the key findings of the review.
7.1 Overview of key findings
This analysis implies that 22% of all cars used in the commuter peak are company cars, ie more than one
in five cars on the road. Despite the significant proportion of company car use by the commuting public,
the impact of this is largely unstudied.
This research reviewed New Zealand’s FBT policy against taxation and transport policy principals. Taxes
should have horizontal equity; people with equal incomes should pay an equal amount of tax. Current FBT
law causes those who do not receive the benefit of a company car and an employer car park to pay more
tax. The principal of tax neutrality means tax policy should not alter individual or company investment
decisions. The salary sacrificed is less than the benefits gained from subsidised (free) parking, running
costs and the type of vehicle provided; hence, FBT does not have a neutral effect.
Those commuters with the highest parking cost and longest commutes (consuming more) also gain the
largest fringe benefit (untaxed) from current tax policy. There is not the same financial incentive for
drivers to choose smaller cars if a third party is paying the fuel bills. The distortion towards cars with
larger engines is a classic ‘principal–agent’ problem where the individual who chooses and uses the
vehicle does not pay for its costs. Current FBT is not effectively aligned with land-use efficiency as it
creates the wrong incentives in regard to home and work locations with a reduced incentive to live close to
work when a company car is provided compared with when one is not. New Zealand’s FBT is focused on
the purchase price and depreciated value of the vehicle but ignores the variances in fuel subsidy and
parking benefits. As such it subsidises long-distance driving over other modes and shorter commutes.
Current tax policy favours resource intensive modes, such as driving, instead of resource efficient modes,
such as walking, cycling and public transport. This occurs by ignoring car parking as a taxable benefit,
exempting work vehicles and taxing public transport fares.
The additional impacts related to driving: traffic congestion, road and parking facility costs, crashes,
energy consumption, pollution emissions, sedentary living/obesity, and sprawl are not considered in the
development of FBT policy. The result is an economic policy failure whereby the broader community pays
(through congestion and other factors including reduced economic productivity) for the financial benefits
received by those with company cars.
Current FBT policy encourages employees to choose larger vehicles, drive more kilometres, reduce use of
alternative modes and choose more dispersed, automobile-dependent locations than would otherwise
occur. These tend to increase traffic problems, including congestion, road and parking facility costs,
crashes, energy consumption, pollution emissions and land-use sprawl. The exemption of employer-
provided parking is a widespread benefit that has a significant impact on transport choices. The value of
employer-provided car parking in the cities of Auckland, Wellington and Christchurch is around $2700 per
employee. There are over 250,000 company cars in New Zealand. The untaxed benefits total at least $675
million annually.
Taxing employer-provided car parks is a viable option as practised in Australia. Many Australian cities also
have parking levies and taxes on all parking spaces in their central areas.
Company cars make up the majority of new vehicles introduced into the New Zealand fleet. New vehicles
tend to have better safety and efficiency measures and if FBT policy encouraged safety and efficiency the
Company cars and fringe benefit tax – understanding the impacts on strategic transport targets
70
tendency of company cars to be less efficient could be reversed. Calculating a value of private use based
on the daily commute distance can more accurately apportion the fringe benefit that individuals gain by
using company cars.
The research also looked at barriers to policy changes. An emissions-based reform of FBT without
addressing emissions of second-hand imported vehicles may create a switch to older second-hand cars
and employee reimbursement of travel costs instead of the provision of company cars. IRD is reluctant to
add further tax exemptions such as a public transport subsidy by employers. The failure to address
existing distortions such as tax-free employer-provided parking at the same time as refusing to allow FBT
subsidy of public transport perpetuates the bias towards the existing car-based subsidy.
Employee parking subsidies undermine attempts to encourage more efficient commuting behaviour. FBT
reform can create more neutral (and therefore more efficient and equitable) commuting incentives.
8 Recommendations
71
8 Recommendations
This chapter presents a summary of the key findings of the review and presents a series of preferred
policy alternatives to address the issues identified.
8.1 Policy alternatives for New Zealand
It is recommended the IRD either address the parking subsidy by taxing the value of employer-provided
parking or adopt another strategy to reduce the market distortion and economic policy failure.
The following options are suggested to address the issues identified in this research.
8.1.1 Mitigating the externality impacts of company cars
The larger engines, longer journeys and higher crash rates of company cars can be addressed by
modifying the current FBT.
FBT is a broad-based measure while the major problems associated with company cars can be
geographically concentrated on the CBD. Any measures applied to employer-provided car parks will also
have an impact on company cars, especially cars for upper management.
The company car is captured by any emissions regulations applied to the entire vehicle fleet; as European
and Japanese standards are tightened company cars will by default have lower emissions if not smaller
engines. The types of company cars used by fleet leasing companies have changed rapidly over the last
three years in response to employers’ changing environmental responsibilities, increased oil prices, and
the impact of the recession on both cost control and labour market conditions. Oil price increases are
likely in future. Fuel efficiency is therefore an increasingly important objective. While the UK has used FBT
to target emissions, a broader-based policy is required in New Zealand given the large numbers of
imported Japanese second-hand cars. Recent tightening of emissions regulations should be updated to
reflect changing technological advances. The safety features of cars could be better marketed by a
compulsory display of ANCAP ratings and by banning the importation of one and two star vehicles. These
measures are best applied to all cars rather than targeting company cars.
If company cars become the safest and most fuel-efficient cars on the road the benefits of having
company cars may outweigh the negative influences. The recent trend away from large, heavy and
inefficient vehicles can improve the long-term safety and efficiency of the fleet. This change has only
occurred due to pricing mechanisms of high fuel prices and lower residual values for large cars.
Employer’s policies and attitudes towards emissions and efficiency have changed.
It is therefore recommended that the Irish FBT allowances (related to vehicle emissions) be investigated as
a potential basis for improving the New Zealand FBT regime.
Around 70% of New Zealand’s new vehicle fleet are company cars and 90% of company cars are less than
five years old (Graus Worrell 2008). In order to continue the importation of new vehicles with the latest
safety, emissions and efficiency advances, company cars must remain an important part of the market.
The types of vehicle purchased could be better directed towards the safe and efficient model ranges with
support from FBT legislation or through more stringent importing regulations.
Taxation policies that subsidise company car travel create transport users who are not
sensitive to the marginal cost of car use and make excessive use of the car. As a result a
Company cars and fringe benefit tax – understanding the impacts on strategic transport targets
72
significant portion of Travel Demand Management (TDM) measures cannot affect this group.
(Cohen-Blankshtain 2007)
Commuters who bike, walk and use public transport reduce the costs borne by the community and
employers by not causing congestion or requiring car parking, yet they receive no financial benefit (other
than travel cost savings) or government subsidy.
An isolated charge or tax, however well designed, cannot successfully influence travel
behaviour if the rest of the fiscal and regulatory system is operating contrary to it. (Potter et
al 2006)
The desire to reform FBT stems from the frustrations that the inequitable tax causes in implementing TDM
policy. Currently travel demand policies such as travel plans are being implemented in an environment
where transport policy is not aligned.
The transport field is affected by non-transport policy makers with non-transport policy goals
that have unintended effects on the transport field. (Cohen-Blankshtain 2008)
It is therefore recommended that FBT policies be aligned to meet economic and transport policy
objectives, specifically to reduce market distortion and traffic congestion.
8.1.2 Income tax thresholds and company cars
Company cars are used as a way to avoid high tax rates. There is a reduced incentive to earn PAYE income
when taxes rise to 38% over $65,000 (as was the case in New Zealand prior to October 2010). Employers
find ways to increase the total employment package (using non-taxable and taxable fringe benefits) for
employees who earn over this tax threshold. Parking and company cars are two ways of doing this. If tax
rates were lower, there would be less of a distortion and rewards would be more likely to be cash based
rather than in-kind benefits. The problem of parking and single occupant travel go beyond employees who
receive these benefits and a wider parking and congestion pricing system has been an effective instrument
in other cities.
8.1.3 Alternatives to FBT reform
FBT reform is one aspect of a wider transport policy. Consistent policy is lacking with FBT creating
incentives to commute longer distances in large powerful vehicles and to park at work. This generates a
significant inefficiency in the economy and reduces productivity.
A range of measures can remedy the problems of high crash rates, long commute distances and
distortions towards single occupant car use. Employer-provided parking in the CBD is only a subset of the
total parking provided in the CBD and a holistic approach to parking in the CBD can be achieved without
an FBT focus as long as employer-provided car parks are included along with levies. Congestion is a wider
issue and congestion charges that apply to all traffic address the congestion externality more effectively.
Company cars are only a small part of the total car fleet (although a large proportion of the peak hour
fleet) and emissions-based taxes or regulations can be applied more broadly to capture all vehicles.
Company cars, however, need special consideration due to their principal agent-related problems.
Employers can choose to pay employees to travel by public transport and pay the associated FBT. This is an
underutilised option and can be a much cheaper alternative to paying for company car use. The lack of
annual passes or specific products aimed at the employer subsidy market does not assist in this option. In
the USA, there are well established employer public transport subsidies and a simple administrative process.
8 Recommendations
73
An annual pass could be an attractive option for many especially if the public transport trip is faster. The rail
systems in Wellington and Auckland can provide a faster trip. The Northern Busway and other bus lanes
ensure the bus is time competitive with the car so an employer-subsidised public transport annual pass
could become a viable option. While the IRD would prefer not to make public transport a tax-exempt benefit,
a tax-free subsidy of public transport is no worse than a tax-free subsidy of employer-provided parking and
an employee could only gain either a car park or public transport subsidy (as they can only travel to work
one way or the other on any given day).
8.1.4 Regulation as an effective policy instrument
One of the most effective emissions-based regulations has been the requirement to have catalytic
converters and unleaded petrol. In Europe, the emissions standards have been very effective at reducing
emissions. The mandatory wearing of safety belts was another effective regulatory approach. In the State
of Victoria in Australia, electronic stability control is mandatory on new vehicles registered after January
2011. The UK FBT reform targeted emissions to cause a shift toward low emissions vehicles. Parking in
urban CBD areas in Sydney, Perth and Melbourne has been managed by regulation and parking levies that
are often called congestion levies.
Almost all externality-based problems can also be addressed by regulatory measures. Crash externalities
can be addressed by safety regulations, emissions can be controlled by air quality regulations. Car parking
can be regulated by planning regulations, which lower the minimum requirements or alternatively place
parking maximums on development. In fact, some of the parking issues are caused by the over generous
parking requirements of local building codes. As cities reduce the parking provided by councils, and
reduce the number of spaces required in new buildings, consistent tax policy becomes increasingly
important so that employer-provided parking does not undermine other policy objectives.
Regulation has the advantage of compulsion and has been effective in motor vehicle emissions. A wider-
based carbon price will also reduce emissions by providing an incentive for industry to use more efficient
low-polluting energy. The advantage of these measures is that they target not just company cars but all
new vehicles. In New Zealand this would need to include imported second-hand Japanese vehicles. Many of
the measures that are introduced do not directly influence company car drivers, especially measures
aimed at fuel prices, parking measures and even congestion charges.
Regulation has some disadvantages as once the minimum standard is met there is no longer any incentive
to improve beyond the standard. Regular adjustments to regulations are required to ensure emissions or
safety is continuously improved rather than reaching a plateau. The Euro standards are a good example of
regulations that are being increasingly tightened. Technology is continually improving and this enables
stricter emissions standards to be achieved. Consumers have also been attracted to the fuel efficiency and
green credentials of cars independently of the regulations so those vehicles with better environmental
performance have sold well.
An environmental-based tax once paid allows the polluter to keep polluting as long as they pay the tax.
Carbon pricing will add cost to the burning of carbon-based fuels but the price is low to avoid inflation
and suppression of economic growth. Large variations in petrol and diesel costs have already been
experienced during 2006 to 2011 with many of the changes in travel demand and vehicle purchase
decisions being driven from fuel prices rather than any minor increase linked to a carbon price. Transport
emissions have been effectively controlled by regulatory measures especially where they are systematically
tightened such as the Euro standards and the Japanese regulations. Failure to address imbalances between
New Zealand’s emissions regulations and those of Japan (in particular) would result in vehicles that are no
Company cars and fringe benefit tax – understanding the impacts on strategic transport targets
74
longer road worthy in Japan being dumped on the New Zealand market (along with the externalities
avoided by Japanese regulators).
Prices that affect petrol consumption have minimal impact on company car drivers who have their petrol
paid for by the employer. While employees will have noticed increased costs of paying for company car
running costs the experience in the UK suggests that varying the FBT rate based on emissions has been
very effective at changing employers’ policies in regard to the type of cars on offer as company cars.
Linking annual registration fees to both fuel economy and emissions can enable the fleet to be
differentiated by coloured registration labels. When combined with electronic tolling, emissions-based
tolls can be introduced into CBD areas where smog issues can be a problem. While government agencies
concerned with energy efficiency, emissions and transport have been coordinating their policy the tax
system has remained outside this collaborative effort. Fringe benefits and in particular the treatment of
company cars and car parking in comparison with public transport undermine the workplace travel plans
and TDM efforts of other government agencies.
The journey to work involves a choice of mode over a fixed distance. This modal choice has different
energy requirements and emissions outputs. The distance between home and work can be covered by
using public transport, in some cases walking and cycling, or by car. Each car also has its own energy and
emissions profile.
A flat petrol tax has no impact on reducing the external costs of congestion. Countries with even double
the tax on petrol still have congestion problems. Those that have introduced a congestion charge have
been much more successful at reducing congestion problems.
9 BIbliography
75
9 Bibliography
Accident Compensation Corporation (ACC) (2010) Motor vehicle levy rates. Accessed November 2010.
www.acc.co.nz/PRD_EXT_CSMP/groups/external_levies/documents/reference_tools/wpc087593.pdf
Ashden Trust (1997) Company car taxation. A contribution to the debate. London: Ashden Trust, London
First and the University of Westminster.
Auckland Regional Council (2009) Auckland regional parking strategy.
Auckland Transport (2010) Auckland city parking rates. Accessed September 2010.
www.aucklandcity.govt.nz/auckland/transport/parking/default.asp
Australian Tax Office (2009) Completing your 2009 fringe benefits tax return. Accessed November 2010.
www.ato.gov.au
Auto Media Group Ltd (2010) Autotalk. NZ Auto Industry news. Accessed November 2010.
www.autotalk.co.nz
Badland, HM, N Garrett and GM Schofield (2010) How does car parking availability and public transport
accessibility influence work-related travel behaviours? Sustainability 2: 576–590.
Baker, L (1987) Company cars: their effects on journey to work in central London. Traffic Engineering
Control 28, no.10: 530–536.
Baker, S, D Judd and R Oram (2010) Tax free transit benefits at 30: evolution of a free parking offset.
Journal of Public Transportation 13, no.2.
Barker, T et al (2008) The cost and effectiveness of policies to reduce vehicle emissions. Joint Transport
Research Centre round table discussion paper. Paris: OECD, ITF.
Broughton, J, C Baughan, L Pearce, L Smith and G Buckle (2003) Work-related road accidents. Prepared for
Road Safety Division, Department for Transport. TRL report 582.
Burt, G (1998) Trends & issues in a new tax environment. How to manage the fleet mix & transitional
issues. Fleet management – drive to excellence. 1998 Conference of Australian Fleet Managers
Association: pp21–29.
Cairns, S, A Davies, C Newson and C Swiderska (2002) Making travel plans work: research report. London:
Department for Transport.
Chirinko, R and E Harper, Jr (1993) Buckle up or slow down? New estimates of offsetting behavior and their
implications for automobile safety regulation. Journal of Policy Analysis and Management 12, no.2:
270–296.
Cohen-Blankshtain, G (2008) Institutional constraints on transport policymaking: the case of company cars
in Israel. Transportation 35: 411–424.
Collingwood, V (1997) Promoting the safe driving policy in NSW fleets of twenty or more vehicles. Staysafe
36: Drivers as workers, vehicles as workplaces: issues in fleet management. Report no. 9/51. Ninth
report of the Joint Standing Committee on Road Safety of the 51st Parliament. Sydney: Parliament of
New South Wales.
Cornelis, E, M Castaigne, X Pauly, A De Witte and K Ramaekers (2009) Professional mobility and company
car ownership ‘Promoco’. Final report, Brussels: Belgian Science Policy. 126pp.
Company cars and fringe benefit tax – understanding the impacts on strategic transport targets
76
Dargay, J (2005) The journey to work: an analysis of mode choice based on panel data. Paper presented at
the European Transport Conference, Strasbourg, France, October 2005.
Department for Transport (2008) Transport and the economy: Government response to SACTRA report.
Di Domenico, A (2006) Employer-provided benefits and the environment: transit passes and parking.
Canadian tax journal/Revue fiscale canadienne 54, no.1.
Downs, C, M Keigan, G Maycock and G Grayson (1999) The safety of fleet car drivers: a review. TRL report
390. Crowthorne, Berkshire: Transport Research Laboratory.
Dueker, K, J Strathman and M Bianco (1998) Strategies to attract auto users to public transportation. TCRP
report 40. Washington DC: Transportation Research Board.
European Commission Directorate-General for Environment (2002) Fiscal measures to reduce CO2
emissions from new passenger cars. Final report.
European Environment Agency (2005) Market-based instruments for environmental policy in Europe.
Technical report 8/2005.
European Transport Safety Council (2009) Road safety at work in spotlight in Poland. News release.
Accessed August 2011. www.etsc.eu/documents/copy_of_09%2024%20-
%20Poland%20PRAISE%20press%20release.pdf
Graus, W and E Worrell (2008) The principal–agent problem and transport energy use: case study of
company lease cars in the Netherlands. Energy policy 36.
Griffiths, M (1997) Selecting safe vehicles: issues in vehicle crash safety. Staysafe 36: Drivers as workers,
vehicles as workplaces: Issues in fleet management. Report no. 9/51. Ninth report of the Joint Standing
Committee on Road Safety of the 51st Parliament. Sydney: Parliament of New South Wales.
Gutiérrez-i-Puigarnau, E and J van Ommeren (2009) Welfare effects of distortionary company car taxation.
Amsterdam: Tinbergen Institute.
Hamer, P, G Currie and W Young (2009) Exploring travel and parking impacts of the Melbourne CBD
parking levy. Proceedings of the 32nd Australasian transport research forum (ATRF).
Haworth, N, C Tingvall and N Kowadlo (2000) Review of best practice fleet safety initiatives in the
corporate and/or business environment. Report no. 166. Melbourne: Monash University Accident
Research Centre.
Hensher, D and J King (2001) Parking demand and responsiveness to supply, price and location in Sydney
central business district. Transportation Research A, 35, no.3: 177–196.
Her Majesty’s Revenue and Customs, pages relating to FBT rules and treatment of company cars.
www.hmrc.gov.uk
Hirota, K and J Poot (2005) Taxes and the environmental impact of private car use: evidence from 68
cities. Pp299–317 in Methods and models in transport and telecommunications: cross-Atlantic
perspectives. A Reggiani and L Schintler (Eds). Berlin: Springer Verlag.
Inland Revenue (IRD) (2009) Fringe benefit tax guide. Wellington: IRD.
Inland Revenue (UK) (1992) Company cars: reform of income tax treatment: a consultative document.
London: Inland Revenue.
Inland Revenue (UK) (2004) Report on the evaluation of the company car tax reform.
www.inlandrevenue.gov.uk/cars/company_cars.htm
9 BIbliography
77
Inland Revenue (UK) (2006) Report on the evaluation of the company car tax reform: stage 2.
www.hmrc.gov.uk/budget2006/company-car-evaluation.pdf
Institute for European Environmental Policy (IEEP) (1999) Winners and losers: company car tax reform.
London: IEEP, Transport 2000.
Institute of Transportation Engineers (1993) Implementing effective employer-based travel demand
management programs. A guidance manual. Washington, DC.
Internal Revenue Service (US), pages relating to FBT rules and treatment of company cars. Accessed
January 2011. www.irs.gov
International Energy Agency (2008) World energy outlook 2008. www.iea.org/weo/2008.asp
Irish Tax and Customs, pages relating to FBT rules and treatment of company cars. Accessed November
2010. www.revenue.ie
Ison, S and T Rye (2005) Overcoming barriers to the implementation of car parking charges at UK
workplaces. Transport Policy 12: 57–64.
Ison, S and T Rye (2008) Introduction: TDM measures and their implementation. Chapter 1 in The
implementation and effectiveness of transport demand measures – an international perspective. S Ison
and T Rye (Eds). Aldershot, Hampshire: Ashgate Publishing.
Johansson, O and L Schipper (1997) Measuring the long-run fuel demand for cars. Journal of Transport
Economics and Policy 31, no.3: 277–292.
Kenert, U and H Kuhfeld (2007) Diverse structure of passenger car taxation In Europe and the EU
Commission’s proposal for reform. Transport Policy 14, no.4: 306–316.
Knight, L (1990) An Australian study of impact of company cars on energy consumption. Australian Road
Research 20, no.2: 13–22.
Knight, P, T Vanden Branden, S Potter, M Enoch and B Ubbels (2000) European Commission fair and
efficient pricing in transport – the role of charges and taxes. An EU-wide review of transport charges
and taxes (national) in commuter and business travel, a world-wide review of the use of charges and
taxes (local and regional) to fund public transport. Birmingham: Oscar Faber, Open University
Amsterdam Free University.
Kompfner, P, RHC Hudson, K Shoarian-Sattari and DM Todd (1991) Company travel assistance in the
London area. TRRL research report 326.
Kraal, D, PW Senarath Yapa and D Harvey (2008) The impact of Australia’s fringe benefits tax for cars on
petrol consumption and greenhouse emissions. Melbourne: La Trobe University.
Kuzmyak, JR, JE Evans and R Pratt (2010) Employer and institutional TDM strategies. TCRP report 95,
chapter 19.
LeasePlan (2003) Fleeting update. Leaseplan driver survey 2002.
LeasePlan (2010) Steering column autumn 2010. Accessed November 2010. www.leaseplan.co.nz
Litman, T (1997) Employer provided transit passes: a tax exempt benefit. Victoria BC: Victoria Transport
Policy Institute.
Litman, T (2006) Parking management: strategies, evaluation and planning. Victoria BC: Victoria
Transport Policy Institute.
Company cars and fringe benefit tax – understanding the impacts on strategic transport targets
78
Litman, T (2010) Transportation elasticities. How prices and other factors affect travel behaviour. Victoria
BC: Victoria Transport Policy Institute.
Luk, J and T Richardson (1997) Company cars and management of travel demand. Vermont South:
Australian Road Research Board.
Lynn, P and C Lockwood (1998) The accident liability of company car drivers. Prepared for Road Safety
Division, Department of the Environment, Transport and the Regions. TRL report 317.
Maat, K and H Timmermans (2009) A causal model relating urban form with daily travel distance through
activity/travel decisions. Transport Planning and Technology 32, no.2: 115–134.
Mayeres, I (2002) Taxes and transport externalities. Leuven: Centre for Economic Studies.
Ministry of Economic Development (MED) (2009) New Zealand energy greenhouse gas emissions.
Wellington: MED.
Ministry of Transport (MoT) (2007) The New Zealand light vehicle fleet. Fleet statistics 2006. Wellington:
MoT.
Moret, Ernst & Young (1994) Tax provisions which have an impact on the environment. Report to the
European Commission. Brussels.
Murray, W, S Newnam, B Watson, J Davey and C Schonfeld (2002) Evaluating and improving fleet safety in
Australia. ATSB report.
Naess-Schmidt, S and M Winiarczyk (2010) Taxation papers: company car taxation. Copenhagen
economics. Luxembourg: Office for Offical Publications of the European Union.
Newman, S, B Watson and W Murray (2004) Factors predicting intentions to speed in a work and personal
vehicle. Transportation Research Part F: Traffic Psychology and Behaviour 7, no.4–5: 287–300.
New South Wales Ministry of Transport (2006) Tax incentives for public transport users. Ernst & Young.
New Zealand Environmental and Occupational Health Research Centre (2003) Work-related fatal traffic
injuries in New Zealand 1985–1998. Descriptive epidemiology. Injury Prevention Research Unit.
New Zealand Company Vehicle. Citations from issues, December 2000, October/November 2008,
December 2008, February 2009, April 2009, August 2009, October 2009, December 2009, April 2010.
New Zealand Management Magazine (2004) Remuneration – a company car: what is it really worth?,
February 2004.
New Zealand Transport Agency (NZTA) (2009) National land transport programme 2009–2012. Accessed
November 2010. www.nzta.govt.nz/resources/national-land-transport-programme/2009-
2012/index.html
New Zealand Transport Agency (NZTA), Accident Compensation Corporation and Department of Labour
(2010) Your safe driving policy. Accessed August 2011. www.nzta.govt.nz/resources/your-safe-driving-
policy
Ommeren, J and D Wentink (2010) The (hidden) cost of employer parking policies. Amsterdam: Tinbergen
Institute.
Oram, R (2008) Tax-free employer provided benefits for public transport: Background, history and 2008
status. Paper delivered at European Transport Conference 2008.
9 BIbliography
79
Parry, I, M Walls and W Harrington (2006) Automobile externalities and policies. Resources for the Future
discussion paper 06–26.
Potter, S, M Enoch, T Rye and T Black (2001) The potential for further changes to the personal taxation
regime to encourage modal shift. Final report to the Department of the Environment, Transport and the
Regions and the Inland Revenue. Milton Keynes: Open University.
Potter, S, M Enoch, T Rye, T Black and B Ubbels (2006) Tax treatment of employer commuting support: an
international review. Transport Reviews 26, no.2: 221–237.
Rietveld, P and J van Ommeren (2002) Company cars and company-provided parking. Pp201–208 in Social
changes and sustainable transport. WR Black and P Nijkamp (Eds). Bloomington: Indiana University
Press.
Schou, K (1981) Energy policies and company cars: an application of experimental design methods in
economic research. Canberra: Australian Bureau of Transport.
Shoup, D (1990) The effects of employer-paid parking in downtown Los Angeles: a study of office workers
and their employers. Los Angeles: Southern California Association of Governments.
Shoup, D (2002) Eco passes: an evaluation of employer-based transit programs. Berkeley: University of
California, Department of Urban Planning.
Shoup, D (2005a) The high cost of free parking. Washington DC: American Planning Association.
Shoup, D (2005b), Parking cash out. APA Planning Advisory Service report no.532.. Planners Press.
Shoup, D and R Willson (1992a) Commuting, congestion and pollutions: the employer-paid parking
connection. Working paper no.120. Berkeley: University of California Transportation Center. 26pp
Shoup, D and R Willson (1992b) Employer-paid parking: the problem and proposed solutions. Berkeley:
University of California Transportation Center.
Sochon, P (1999) Improving driver and vehicle safety fleet safe policy and guidelines for local government
the southern Sydney region. Southern Sydney Regional Organisation of Councils.
Statistics New Zealand (2006) 2006 Census. Accessed February 2012.
www.stats.govt.nz/Census/2006CensusHomePage.aspx
The Commonwealth of Australia (2010) Australia’s future tax system. Report to the Treasurer. Accessed
August 2011. http://taxreview.treasury.gov.au/content/Content.aspx?doc=html/home.htm
Transportation Research Board (TRB) (2003a) Strategies for increasing the effectiveness of commuter
benefits programs. Transit Cooperative Research program. TCRP report 87. Washington DC: TRB.
Transportation Research Board (TRB) (2003b) Traveler response to transportation system changes, chapter
18 – Parking management and supply. Transit Cooperative Research Program. TCRP report 95.
Washington DC: TRB.
Transportation Research Board (TRB) (2005) Traveler response to transportation system changes, chapter
13 – Parking pricing and fees. Transit Cooperative Research Program. TCRP report 95. Washington DC:
TRB.
Transportation Research Board (TRB) (2010) Traveler response to transportation system changes, chapter
19 – Employer and institutional TDM strategies. Transit Cooperative Research Program. TCRP report
95. Washington DC: TRB
Company cars and fringe benefit tax – understanding the impacts on strategic transport targets
80
University of Washington (2005) U-Pass annual report. Accessed August 2011.
www.washington.edu/facilities/transportation/commuterservices/files/reports/annualreport2005.pdf
US Department of Transportation (1993) Guidance manual for implementing employer based TDM
programs.
Van Ommeren, J, A van der Vlist and P Nijkamp (2006) Transport-related fringe benefits: implications for
moving and the journey to work. Journal of Regional Science 46, no.3: 49–506.
Vavasour, P and C Vignali (1999) Research into the motivational aspect of the company car: examined
specifically in Calsberg-Tetley-Scotland. Career Development 4: 19–25.
Venter, C (2007) Some observations on car availability and car use, and implications for TDM policy.
Pretoria: University of Pretoria, Department of Civil and Biosystems Engineering.
Warren, N (2006) Fringe benefit tax reform: decision time. Australia: The Institute of Chartered
Accountants.
Westpac New Zealand (2008) Stakeholder report 2008.
Whitelegg, J (1984) The company car in the United Kingdom as an instrument of transport policy.
Transportation Policy Decision Making 2: 219–230.
Wilmink, IR, PLC Eijkelenbergh, W Korver, and MN Droppert-Zilver (2002) Cars at the beginning of the 21st
century. Delft: TNO Instituut voor Verkeer en Vervoer, Logistiek en Ruimtelijke Ontwikkeling.
Wilsons Parking Accessed November 2010. www.wilsonparking.co.nz/go/regions/auckland-cbd
Zwerts, E and E Nuyts (2004) Onderzoek verplaatsingsgedrag Vlaanderen 2000–2001. Brussels: Ministry
of the Flemish Community.
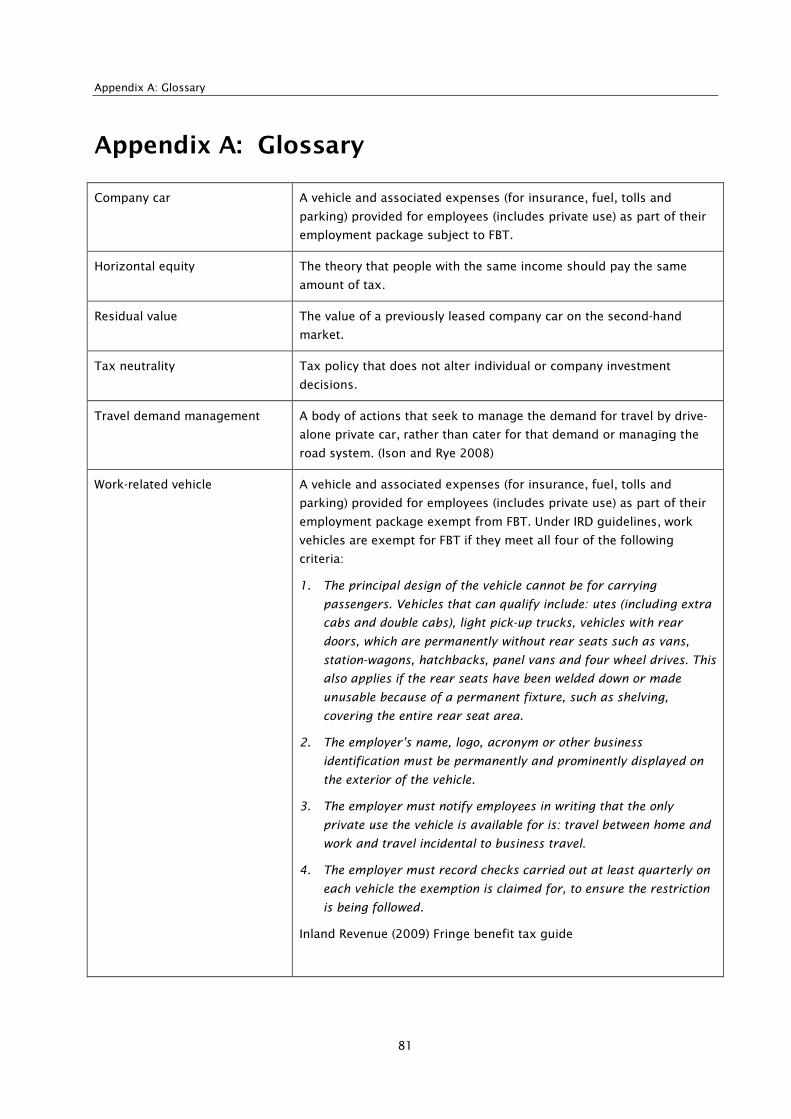
Appendix A: Glossary
81
Appendix A: Glossary
Company car A vehicle and associated expenses (for insurance, fuel, tolls and
parking) provided for employees (includes private use) as part of their
employment package subject to FBT.
Horizontal equity The theory that people with the same income should pay the same
amount of tax.
Residual value The value of a previously leased company car on the second-hand
market.
Tax neutrality Tax policy that does not alter individual or company investment
decisions.
Travel demand management A body of actions that seek to manage the demand for travel by drive-
alone private car, rather than cater for that demand or managing the
road system. (Ison and Rye 2008)
Work-related vehicle A vehicle and associated expenses (for insurance, fuel, tolls and
parking) provided for employees (includes private use) as part of their
employment package exempt from FBT. Under IRD guidelines, work
vehicles are exempt for FBT if they meet all four of the following
criteria:
1. The principal design of the vehicle cannot be for carrying
passengers. Vehicles that can qualify include: utes (including extra
cabs and double cabs), light pick-up trucks, vehicles with rear
doors, which are permanently without rear seats such as vans,
station-wagons, hatchbacks, panel vans and four wheel drives. This
also applies if the rear seats have been welded down or made
unusable because of a permanent fixture, such as shelving,
covering the entire rear seat area.
2. The employer’s name, logo, acronym or other business
identification must be permanently and prominently displayed on
the exterior of the vehicle.
3. The employer must notify employees in writing that the only
private use the vehicle is available for is: travel between home and
work and travel incidental to business travel.
4. The employer must record checks carried out at least quarterly on
each vehicle the exemption is claimed for, to ensure the restriction
is being followed.
Inland Revenue (2009) Fringe benefit tax guide

Company cars and fringe benefit tax – understanding the impacts on strategic transport targets
82