Embed Size (px)
Citation preview
HSEHealth & Safety
Executive
An evidence based evaluation of how best tosecure compliance with health and safety law
Prepared by Greenstreet Berman Ltdfor the Health and Safety Executive 2005
RESEARCH REPORT 334
HSEHealth & Safety
Executive
An evidence based evaluation of how best tosecure compliance with health and safety law
Michael Wright, Ali Antonelli, John Norton Doyle,Mark Bendig and Richard Genna
Greenstreet Berman LtdFulcrum House
5 Southern CourtSouth Street
ReadingBerkshireRG1 4QS
This research builds on previous studies by delineating companies into discrete groups and mappingonto each type of organisation “levers” which influence compliance with health and safety law. It alsoacquires evidence about the likely degree of influence that each lever might have. It providesconclusions on the targeting of interventions and the potential role of new levers to motivatecompliance with health and safety law.
This main report is accompanied by a summary report.
This report and the work it describes were funded by the Health and Safety Executive (HSE). Itscontents, including any opinions and/or conclusions expressed, are those of the authors alone and donot necessarily reflect HSE policy.
HSE BOOKS
ii
© Crown copyright 2005
First published 2005
ISBN 0 7176 2989 9
All rights reserved. No part of this publication may bereproduced, stored in a retrieval system, or transmitted inany form or by any means (electronic, mechanical,photocopying, recording or otherwise) without the priorwritten permission of the copyright owner.
Applications for reproduction should be made in writing to: Licensing Division, Her Majesty's Stationery Office, St Clements House, 2-16 Colegate, Norwich NR3 1BQ or by e-mail to [email protected]
Executive summary
The Revitalising Health and Safety (RHS) Action Plan incorporates many ideas suggested in consultation on how to achieve targets, such as fewer injuries. These ideas aim to build on the HSE’s existing strategy of encouragement, persuasion, assistance and enforcement. Whilst past research has identified key drivers for health and safety there are examples of conflicting findings. Against a background of mixed and incomplete research findings, it is important to understand the interaction between motivational “levers” in order to:
• Understand how the influence of motivational factors co-vary and interact;
• Understand how the attitudes and behaviours of organisations vary according to their type, whilst also mapping out how other organisational characteristics / types vary as organisational attitudes to health and safety vary;
• Seek evidence of the importance of each factor and the case for “new levers”.
Therefore, this research built on previous studies by delineating companies into discrete groups and mapping “levers” onto each type of organisation. We acquired evidence about the likely degree of influence that each lever might have.
After completing a literature review, thirty-nine exploratory discussions were run with employers and key stakeholders, such as the CBI and trade associations, selected from a representative range of sectors and sizes of organisations. Next, two different questionnaire based surveys were developed to assess what motivates organisations to comply with health and safety; one for employers and one for intermediaries. The content was the same apart from the addition of a separate section within the intermediary version, which was incorporated to establish their willingness to take a more active role.
The list of motivational factors remains largely unchanged from previous research, namely enforcement/regulation, reputational risk, the moral case, avoiding cost of accidents and business incentives. However, it is apparent that:
• The financial incentive provided by insurance premiums has grown;
• The fear of enforcement is intertwined with the fear of reputational damage as well as business disruption;
• There is also evidence that the moral case remains a driver, especially in SMEs where you may know or be related to your colleagues. In larger firms the moral case is expressed in terms of societal values, and;
• It is also clear that understanding and awareness remain key precursors.
iii
It is clear that organisational attitudes and the influence of “levers” varies between organisations, primarily according to their size and sector. It is also apparent that a link can be made between the current attitude of organisations towards health and safety, their size/sector and their recommendation of new incentives for health and safety. This suggests that it is not only possible, but also more effective, to match compliance tactics to the attitudes of the organisations, rather than adopt a “one size fits all approach”. The inference that can be drawn from this is that no single “lever” will be equally needed nor effective for all organisations.
These findings also support the notion of targeting interventions and communications according to the expressed attitude of organisations. This can be considered in the context of both national initiatives, such as media campaigns, and inspection tactics.
It is important not to dismiss relatively low rated ‘incentives’. It is legitimate to argue that the moderate rating assigned to some as yet untested incentives is actually strong evidence because (1) with greater awareness and experience they may offer potential and (2) the effect of more established incentives may have already been realised. Thus, whilst enforcement and the business case remain important, established incentives, other as yet untried incentives such as earned autonomy, adverse publicity, greater investor/worker pressure and restorative justice have scope for increased impact. Clearly, as these levers are relatively untested in the UK health and safety arena, the way in which they may operate and the actions needed to increase their influence require further research, piloting and evaluation. Insurance is a prime example of how the role of an incentive can change, as well as being a lever that the HSE could make more use.
iv
CONTENTS
EXECUTIVE SUMMARY
1 INTRODUCTION ............................................................................................................................1
1.1 BACKGROUND............................................................................................................................1
1.2 MODELS AND EVIDENCE OF ORGANISATIONAL H&S ATTITUDES AND BEHAVIOURS ...................5
1.2.1 A decision making model ......................................................................................................5
1.2.2 Restorative justice...............................................................................................................14
1.2.3 Adverse publicity ................................................................................................................15
1.2.4 Internalising costs of poor performance.............................................................................18
1.2.5 Reducing compliance costs.................................................................................................19
1.2.6 Raising awareness of hazards, risks and costs ...................................................................19
1.2.7 Inter-company variations ...................................................................................................23
1.2.8 Concluding points...............................................................................................................25
2 EXPLORATORY DISCUSSIONS................................................................................................26
2.1 INTRODUCTION ........................................................................................................................26
2.2 CONCLUSIONS FROM RESEARCH AND DISCUSSIONS ..................................................................27
2.2.1 Networking, partnering and amplifying impact of the HSE................................................27
2.2.2 Drivers for health and safety ..............................................................................................29
2.2.3 Costs and benefits of health and safety...............................................................................31
2.2.4 Potential implications.........................................................................................................31
3 POSTAL SURVEY .........................................................................................................................33
3.1 INTRODUCTION ........................................................................................................................33
3.2 PILOTING..................................................................................................................................33
3.2.1 Overview.............................................................................................................................33
3.2.2 Draft questionnaire.............................................................................................................33
3.2.3 Pilot study...........................................................................................................................34
3.3 SAMPLE FRAME AND SIZE.........................................................................................................35
4 ANALYSIS OF EMPLOYERS’ RESPONSES ............................................................................39
4.1 INTRODUCTION ........................................................................................................................39
4.2 PROFILE OF RESPONDENTS .......................................................................................................39
4.3 SUMMARY OF EMPLOYERS ATTITUDE TO HEALTH AND SAFETY................................................42
v
4.3.1 Overview of attitudes to health and safety..........................................................................42
4.3.2 Differences in attitudes between small and larger organisations.......................................43
4.3.3 Inhibitors ............................................................................................................................48
4.3.4 Motivational factors ...........................................................................................................49
4.3.5 Impact of inspection on employers’ attitude to the HSE/EHO ...........................................50
4.4 FACTORS ANALYSIS OF EMPLOYERS’ ATTITUDES TO HEALTH AND SAFETY ..............................51
4.5 ASSOCIATION OF ATTITUDES WITH OTHER FACTORS ................................................................53
4.5.1 Overview.............................................................................................................................53
4.5.2 Association of attitudes with organisational attributes, risk perceptions, incident experience and new incentives..........................................................................................................53
4.6 ASSOCIATION OF RISK PERCEPTIONS WITH ORGANISATIONAL ATTRIBUTES ..............................73
4.6.1 Associations between organisational attributes with number of accidents, notices etc .....86
4.7 EMPLOYERS VIEW OF NEW INCENTIVES ....................................................................................89
4.8 EMPLOYERS AND THEIR TRADE ASSOCIATIONS........................................................................96
4.8.1 Level of membership of trade associations by company size and sector ............................96
4.9 FREE TEXT SUGGESTIONS AND COMMENTS...............................................................................98
4.9.1 Introduction ........................................................................................................................98
4.9.2 HSE under resourcing ........................................................................................................98
4.9.3 The number of HSE regulations and complexity ................................................................98
4.9.4 Directors being qualified in health and safety....................................................................99
4.9.5 Availability of H&S resource materials, publications and services ...................................99
4.9.6 International occupational health and safety standards.....................................................99
4.9.7 Guidance.............................................................................................................................99
4.9.8 Whistle blowers ................................................................................................................100
5 ANALYSIS OF INTERMEDIARIES’ RESPONSES................................................................101
5.1 OVERVIEW .............................................................................................................................101
5.2 PROFILE OF RESPONDENTS .....................................................................................................102
5.3 INTERMEDIARY HEALTH AND SAFETY ACTIVITY ....................................................................104
5.4 WILLINGNESS TO WORK IN PARTNERSHIP...............................................................................108
5.5 FREE TEXT COMMENTS AND SUGGESTIONS.............................................................................111
6 DISCUSSION OF FINDINGS .....................................................................................................112
6.1 OVERVIEW .............................................................................................................................112
6.2 ASSOCIATION OF ATTITUDES WITH PREFERRED INTERVENTIONS ............................................112
6.2.1 Associations......................................................................................................................112
vi
6.2.2 Implications for targeting.................................................................................................114
6.3 STRATEGY FOR COMPLIANCE .................................................................................................117
6.3.1 Advice and guidance: the role of the HSE........................................................................117
6.3.2 Advice and guidance: the role of intermediaries..............................................................118
6.3.3 The business case for health and safety............................................................................119
6.3.4 Enforcement......................................................................................................................121
6.3.5 Encouraging rehabilitation ..............................................................................................122
6.4 DISPARITIES IN THE PERCEPTION OF HEALTH AND SAFETY .....................................................122
6.5 CONCLUSIONS ........................................................................................................................123
6.5.1 Factors motivating health and safety improvements ........................................................123
6.5.2 New levers for health and safety.......................................................................................123
6.5.3 Segmenting organisations.................................................................................................124
7 REFERENCES..............................................................................................................................125
8 APPENDIX A: PROFORMA FOR EXPLORATORY DISCUSSIONS......................................1
9 APPENDIX B: OVERVIEW OF EXPLORATORY DISCUSSIONS FEEDBACK ..................8
9.1 TRADE ASSOCIATION AND SECTOR BASED ACTIVITY ..................................................................8
9.1.1 Profile ...................................................................................................................................8
9.1.2 Health and safety activity .....................................................................................................9
9.1.3 Current health and safety issues.........................................................................................10
9.2 RELATIONSHIPS WITH REGULATORS.........................................................................................10
9.3 RESPONSE TO NEWS OF SAFETY ISSUES ....................................................................................12
9.3.1 Hearing about incidents .....................................................................................................12
9.3.2 Response to hearing about prosecution / improvement notices..........................................13
9.4 UNDERSTANDING AND PERCEPTION OF HEALTH AND SAFETY RISKS.........................................15
9.4.1 Level of understanding of health and safety between sectors .............................................15
9.4.2 Perception of risk................................................................................................................16
9.4.3 Overall risk.........................................................................................................................17
9.5 UNDERLYING DRIVERS FOR HEALTH AND SAFETY ....................................................................18
9.5.1 Good for business ...............................................................................................................18
9.5.2 A critical business success factor .......................................................................................18
9.5.3 An important aspect of ensuring staff productivity and morale..........................................19
9.5.4 A moral duty .......................................................................................................................19
9.5.5 Something you do just because of regulations....................................................................19
vii
9.6 THE COSTS AND BENEFITS OF HEALTH AND SAFETY .................................................................20
9.6.1 Value or burden?................................................................................................................20
9.6.2 The business case................................................................................................................21
9.7 IMPACT OF THE INSURANCE MARKET/INDUSTRY ......................................................................21
9.8 REPUTATIONAL RISK ................................................................................................................22
9.9 FEAR OF ENFORCEMENT ACTION ..............................................................................................27
9.9.1 Fear of enforcement............................................................................................................27
9.9.2 Frequency and level of understanding of enforcement action ............................................30
9.9.3 Effectiveness of enforcement action....................................................................................32
9.9.4 Enforcement action as a yard stick.....................................................................................33
9.10 THE ROLE OF REGULATIONS .....................................................................................................34
9.11 THE MORAL CASE.....................................................................................................................37
9.12 WHY DO ORGANISATIONS AND SECTORS DIFFER IN THEIR VIEWS OF HEALTH AND SAFETY?.....38
9.13 HOW FIRMS COULD BE BETTER MOTIVATED TO MANAGE HEALTH AND SAFETY .......................40
10 APPENDIX C: FINAL INTERMEDIARIES’ POSTAL QUESTIONNAIRES........................44
11 APPENDIX D: FINAL EMPLOYERS’ POSTAL QUESTIONNAIRES..................................56
12 APPENDIX E: ASSOCIATION OF ATTITUDINAL FACTORS WITH OTHER FACTORS & ISSUES..................................................................................................................................................68
12.1 ASSOCIATIONS OF ATTITUDES WITH ORGANISATIONAL ATTRIBUTES........................................69
12.2 ASSOCIATIONS OF ATTITUDES WITH RISK PERCEPTIONS ...........................................................88
12.3 ASSOCIATIONS OF ATTITUDES WITH NUMBER OF ACCIDENTS, NOTICES ETC ...........................103
12.4 EMPLOYERS RATING OF NEW INCENTIVES ..............................................................................105
12.4.1 Simple proportions ...........................................................................................................105
12.4.2 Associations between ranking of new incentives and organisational attributes...............108
12.5 COMPARISON OF INTERMEDIARIES AND EMPLOYERS PREFERENCE OF NEW INCENTIVES.........110
12.6 COMPARISON OF EMPLOYERS’ VERSUS INTERMEDIARIES’ CHARACTERISTICS........................112
viii
1 INTRODUCTION
1.1 BACKGROUND
The Revitalising Health and Safety (RHS) Action Plan incorporates many ideas suggested in consultation on how to achieve targets, such as fewer injuries. These ideas aim to build on the HSE’s existing strategy of encouragement, persuasion, assistance and enforcement. As discussed in Wright, Marsden and Antonelli (2004) past research lends support to many of the ideas laid out in RHS and elsewhere, particularly the idea of increasing access to advice and help, increasing concern for health and safety and reducing inhibitory factors.
Examples of new ideas about advice include:
• Help lines – low cost advisory service for SMEs;
• Working with partners, e.g. trade associations, business links and TECs;
• Working with other government departments, such as the Department of Health on occupational health;
• Increasing the role and reach of employee representatives, such as via roving workplace advisors;
• Developing more sector specific advice;
• Increasing the role of internet based advice and information;
• Education regarding health and safety in schools and colleges.
Examples of ideas to increase concern for health and safety include:
• Increasing supply chain pressure, such as including health and safety to a higher level in government procurement;
• Insurance & other financial incentives;
• Naming and shaming;
• Court mandated publicity of prosecutions;
• Novel penalties and restorative justice, such as court ordered administrative orders;
• Corporate manslaughter law;
• Higher levels of accident investigation and post-accident enforcement;
• Higher levels of inspection;
1
• More effective inspection, such as through the Enforcement Policy Statement aimed at achieving consistent enforcement practices amongst other things;
• Requiring company health and safety external reporting;
• Regulating Directors’ health and safety responsibilities.
Examples of ideas to reduce inhibitors include:
• Subsidies;
• Improving the presentation of economic argument by creating company specific examples of the costs and benefits of health and safety, and;
• The study into provision of an OH service for SMEs highlighted the possibility of considering tax breaks to encourage uptake of OH.
The study provides:
• An up to date review of research on the factors motivating compliance with health and safety;
• Empirical evidence on employers’ view of the HSE’s current approach, particularly the economic argument for compliance and the role of regulations and sanctions;
• Evidence about the relative merits of levers in different contexts, sectors, sizes of firms etc;
• New ideas on how to motivate compliance in the context of RHS and Securing Health Together.
The research provides an evidence base on which to propose “levers” in different contexts and to consider the likely impact of ideas within RHS and Securing Health Together.
Past research
Previous research on the factors that motivate employers to comply or not comply with health and safety was compiled and reviewed in 1998 (Wright 1998) and more recently by Wright, Marsden and Antonelli (2004). These reviews, particularly the latter one provide an overview of motivational factors. They indicate that the main drivers for health and safety in the 1990’s have included:
• Regulations and enforcement;
• Financial and business benefits;
• Reputational risk;
• The moral case.
Recent research (Wright, Marsden and Antonelli, 2004) on motivational factors indicate, on balance, that:
2
• The incentive created by Employers’ Liability insurance premiums has grown due to the cost increases;
• There is mixed evidence about the extent to which employers believe that the business benefits of health and safety outweigh the costs;
• It is also clear from past research that the perceived cost and affordability of health and safety can inhibit improvements;
• The general perception of occupational health and safety as being something that boards need to manage as a potential risk to the organisation has grown, due to general increase in pressure from the regulator and other stakeholders;
• There is mixed evidence about whether there has been an increase in supply chain pressure for health and safety;
• The ‘compliance’ oriented and regulation driven attitude of organisations remains significant, and;
• The need for increased education and awareness remains significant.
Thus, motivational factors can be split into (1) factors that prompt concern, (2) mediating factors that moderate action especially affordability of health and safety, and (3) factors that enable action including awareness and knowledge of health and safety.
At times research has provided what at first appears to be conflicting findings, where for example, studies alternately report reputational risk or regulatory compliance as the main drivers, whilst others report that employers are not driven by the business case to manage H&S but nonetheless recommend that the business case is demonstrated in order to provide a “self-interest” for compliance. For example, loss of credibility (Hillage et al 2001) is reported to be the most influential factor together with the idea of moral necessity (belief in), which promotes a need to comply with the law. On the other hand it is reported that reviews of specific legislation generally concluded that compliance with the law was the most important reason that employers took actions to improve their health and safety practices and procedures (e.g. Honey et al., 1996b, Lancaster et al. 2001).
Other studies have suggested that enforcement has a specific deterrence effect on the firm acted upon but that enforcement does not have an industry wide preventive impact (McCaffrey, 1983, Ruser and Smith, 1991 and Smith, 1979 – quoted in Johnstone 2003). More recently Baggs etc al (2003) report (quoted in Johnstone 2003) that “enforcement visits may trigger a re-shuffling of managerial priorities and a greater attention to safety...”, suggesting specific deterrence goes beyond the narrow focus of the inspection. Johnstone (2003) suggests that the “rather confusing empirical evidence suggests that deterrence has some effect in the case of corporate, although it does not work across the board..”(p14).
Also, whilst previous reviews have indicated that many employers are motivated by the need to comply with regulations and the prospect of enforcement action, it was unclear what underlay the perceived need to comply and avoid enforcement. Hillage et al (2001) found that:
3
“among SMEs the threat of prosecution can raise awareness and understanding of workplace risks and can lead to the adoption of better health and safety practices. ….. The evidence therefore seems to suggest that there are at least two related factors at work here:
• the fear of being taken to court and/or receiving claims for compensation if found to be in breach of the law;
• the acceptance that the law is an expression of what should be done and that there is a moral duty to meet it.”
(quoted from Hillage et al 2001).
However, there was little hard evidence to clarify these points. Also, in this context the perceived seriousness of the hazard is important. If employers accept that a hazard poses a serious risk they appear more likely to respond to new health and safety requirements and guidance on the grounds that there is a substantive moral case to safeguard employees’ health and safety. It is unclear whether employers are motivated to comply with regulations for fear of the immediate costs arising from sanctions such as fines, especially given the perceived low probability of prosecution and (usually) low cost of a fine.
The differences in research findings may arise for a number of reasons. First, it is possible that the importance of various factors has changed over time due to changes in socio-economic and regulatory processes. For example, there is some evidence that the importance of insurance as a driver for H&S has changed since the 1990s. Whilst earlier studies rarely cited insurers or the desire to reduce employers’ liability premiums as a driver for H&S, studies completed since the 2002 price rises present a very different picture.
Secondly, it is possible that some factors are intertwined. If any one study focuses on (say) the role of regulation, the study may report regulation as the main driver. Another study may focus on reputational risk and report this to be the main driver. If reputational risk and regulation compliance are intertwined, both studies would “validly” report that the factor focused on is the main driver.
Thirdly, it is possible the influence of various factors varies according to the type of organisation. For example, governmental and charitable organisations may be driven by a different set of factors than (say) large private corporations. Similarly, large and small companies may differ in their attitudes and behaviours. Hence the conclusions of various studies may differ according to the type of organisation consulted.
The latter concept has been elaborated by Jensen and Jensen in relation to Danish inspection strategies, where they characterise enterprises as per Table 1. The idea is that firms vary in their nature and hence the influence of motivational drivers, such as enforcement or self-interest, will vary. The Danish grouping, if applied to UK research findings, might place small firms in box 2 or 3, with larger firms in box 1 or 3.
4
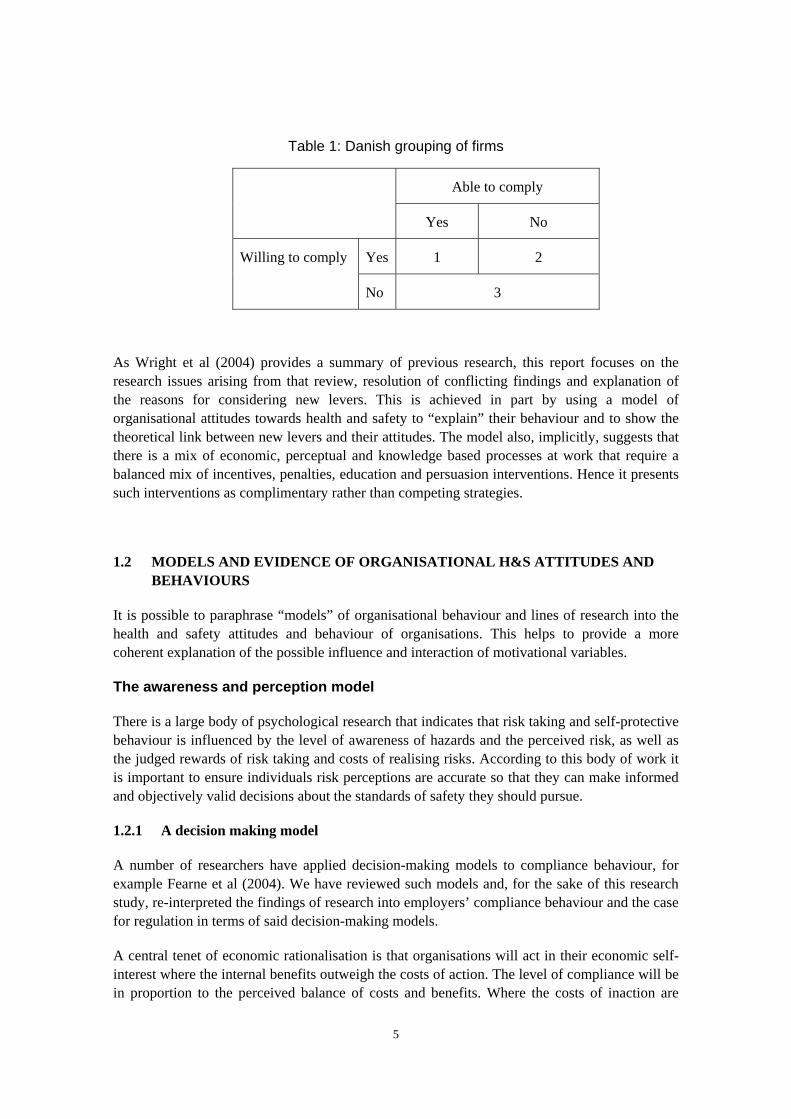
Table 1: Danish grouping of firms
Able to comply
Yes No
Yes 1 2 Willing to comply
No 3
As Wright et al (2004) provides a summary of previous research, this report focuses on the research issues arising from that review, resolution of conflicting findings and explanation of the reasons for considering new levers. This is achieved in part by using a model of organisational attitudes towards health and safety to “explain” their behaviour and to show the theoretical link between new levers and their attitudes. The model also, implicitly, suggests that there is a mix of economic, perceptual and knowledge based processes at work that require a balanced mix of incentives, penalties, education and persuasion interventions. Hence it presents such interventions as complimentary rather than competing strategies.
1.2 MODELS AND EVIDENCE OF ORGANISATIONAL H&S ATTITUDES AND BEHAVIOURS
It is possible to paraphrase “models” of organisational behaviour and lines of research into the health and safety attitudes and behaviour of organisations. This helps to provide a more coherent explanation of the possible influence and interaction of motivational variables.
The awareness and perception model
There is a large body of psychological research that indicates that risk taking and self-protective behaviour is influenced by the level of awareness of hazards and the perceived risk, as well as the judged rewards of risk taking and costs of realising risks. According to this body of work it is important to ensure individuals risk perceptions are accurate so that they can make informed and objectively valid decisions about the standards of safety they should pursue.
1.2.1 A decision making model
A number of researchers have applied decision-making models to compliance behaviour, for example Fearne et al (2004). We have reviewed such models and, for the sake of this research study, re-interpreted the findings of research into employers’ compliance behaviour and the case for regulation in terms of said decision-making models.
A central tenet of economic rationalisation is that organisations will act in their economic self-interest where the internal benefits outweigh the costs of action. The level of compliance will be in proportion to the perceived balance of costs and benefits. Where the costs of inaction are
5
external to the organisation, regulation is required to ensure that the organisation that benefits from the activity that creates the external costs manages those risks in a proportionate and effective way. In this situation, the level of compliance would be in proportion to the perceived balance of internal costs and external benefits.
Such economic rationalisation provides a classic justification for regulating health and safety, rather than relying on economic self-interest, where the costs of poor health and safety performance are borne outwith the organisation that creates the risk and benefits from the activities that create the risk.
There is a large body of research that indicates that this has, and may remain, the position in the UK, although recent events in insurance and reputational risk may be changing this position. Indeed, the case for UK health and safety regulation is often framed in terms of the benefits to society, measured in terms of the subjective value of those deaths, injuries and ill-health that would be averted by the mandated duties. Indeed, many Regulatory Impact Assessments of health and safety regulations are based on a comparison of the compliance costs borne by organisations and the benefits accrued to society in the form of averted injury and ill-health. Such comparisons are completed to demonstrate and ensure that the mandated duties are proportionate.
It is possible to interpret many of the findings of previous research into employer behaviour in these terms. Many studies have indicated that employers’ compliance behaviour is influenced by the perception that the regulations address a real risk and that there are moral and ethical reasons to manage health and safety. It is possible to suggest that employers are, either consciously or implicitly, recognising that regulations exist to ensure that they do not “profit” at others expense. Indeed, many studies have indicated that whilst few firms quantify the costs of compliance and many do not believe there are tangible financial benefits of compliance, they nonetheless regard the costs and benefits of compliance to be reasonable. These paradoxical findings may well reflect the recognition that the costs are borne by organisations and the benefits are borne by wider society.
Following on from this line of reasoning, it is essential for the regulator to demonstrate the mandated duties are justified by the level of harm posed by the regulated activities and that the mandated duties are proportionate to the risk and effective.
However, it is possible to interpret these findings in another light. That is, it is possible to argue that, if the costs are currently external to the organisation, one way forward would be to transfer some or all of these costs into the organisation that creates the risk. Indeed, there are examples of this strategy being explicitly pursued, such as with the reform of the United States workers’ compensation system in the 1970’s. The reform had an explicit objective of creating a financial incentive for health and safety by transferring the largest possible proportion of the costs of injury and ill-health to employers via insurance. Hence it is perhaps unsurprising that the research in some countries has indicated that organisations bear a higher proportion of the costs of injury and ill-health, and that these internalised costs play a greater role in employers behavior. In contrast, the UK’s employers’ liability system was designed to ensure employers have funds to fulfill compensation settlements if they are sued, on grounds of negligence, by employees. That is. The imperative was to ensure funds were available for the employee. Employers’ liability was not designed to ensue all of the costs of injury and ill-health were borne by employers. Costs such as the NHS treatment of injuries have been excluded.
6
Following on from this line of reasoning, it could be argued that the UK, where costs of injury and ill-health have traditionally been external to organisations, should seek ways of transferring them to organisations. Indeed, more recent UK research can be interpreted as indicating that there has been some movement in this direction already. First, the very recent increases in employers’ liability insurance premiums have increased employers’ concern for health and safety and led to action to make improvements. It is also possible to see at least two other emerging developments. First, there is some evidence that supply chain pressure has created an “internal” driver for health and safety in some sectors. That is, where clients and customers place demands on suppliers/contractors to meet certain health and safety standards, this has the effect of “internalising” the cost of poor health and safety, i.e. organisation risk the loss of trade if they display poor health and safety. Secondly, there is some evidence that the fear of reputational damage is a driver for health and safety in some sectors. Again, in the event of poor health and safety performance the organisation incurs “internalised” costs in the form of loss of brand value for example.
However, even where the costs of injury and ill-health are internalised, this does not necessarily lead to a proportionate response. There is evidence that compliance, and general organisational commitment to health and safety, is highly influenced by awareness and perception of risks. It is possible to explain the role of these factors in terms of “imperfect knowledge” and perceptual bias. If an organisation is unaware of the full risk or costs of harm, internal or external to the organisation, arising from an activity or hazard, the rational decision would be against taking preventive measures. Indeed, there is a large body of evidence that indicates that awareness of a risk is often a pre-requisite to taking action, and that media attention about a “new” (or newly recognised hazard” such as stress can lead to an increase in preventive actions. There is also evidence that the presence of health and safety specialists in an organisation is associated with higher levels of awareness and action.
Similarly, if the cost and practicality of preventing a risk are overestimated, this may again sway an organisation against preventative action on the grounds that it is not proportionate to the risk. Following on from this line of evidence it is reasonable to suggest that it is essential to ensure organisations have a valid and accurate understanding of the risks posed by an activity or hazard, the costs and practicality of risk management, and the internal benefits of compliance.
As the time and cost involved in understanding regulations and planning actions is part of the compliance cost, this raises the issue of the “transaction” cost aspect of compliance. The importance of this factor can be seen in the often-reported request from small firms, in particular, for specific guidance. This can be interpreted as a wish to minimize the cost of compliance. That is, smaller organisations which typically lack in-house health and safety expertise may believe that they incur (or at least perceive that they incur) a high cost if they have to interpret a “flexible” non-prescriptive regulation, and translate general requirements into the specific actions they need to take. The wish to reduce the cost of compliance is evidenced by the perception that it is easier, less time consuming and hence cheaper for a small firm to be presented with a simple set of requirements that are specific to their business, and which hence require no interpretation.
It is also possible to interpret the expressed desire (from employers) for advisory site visits from inspectors in economic terms. Such visits are desired on the presumption that they will lead to specific advice on how to manage risks posed by the organisations own activities. Such advice, being specific, would entail little interpretation cost by the employer, and would avoid
7
unnecessary or inappropriate (and hence wasteful) actions. Also, with the inspector coming to the workplace, this avoids the time and cost of the employer seeking advice.
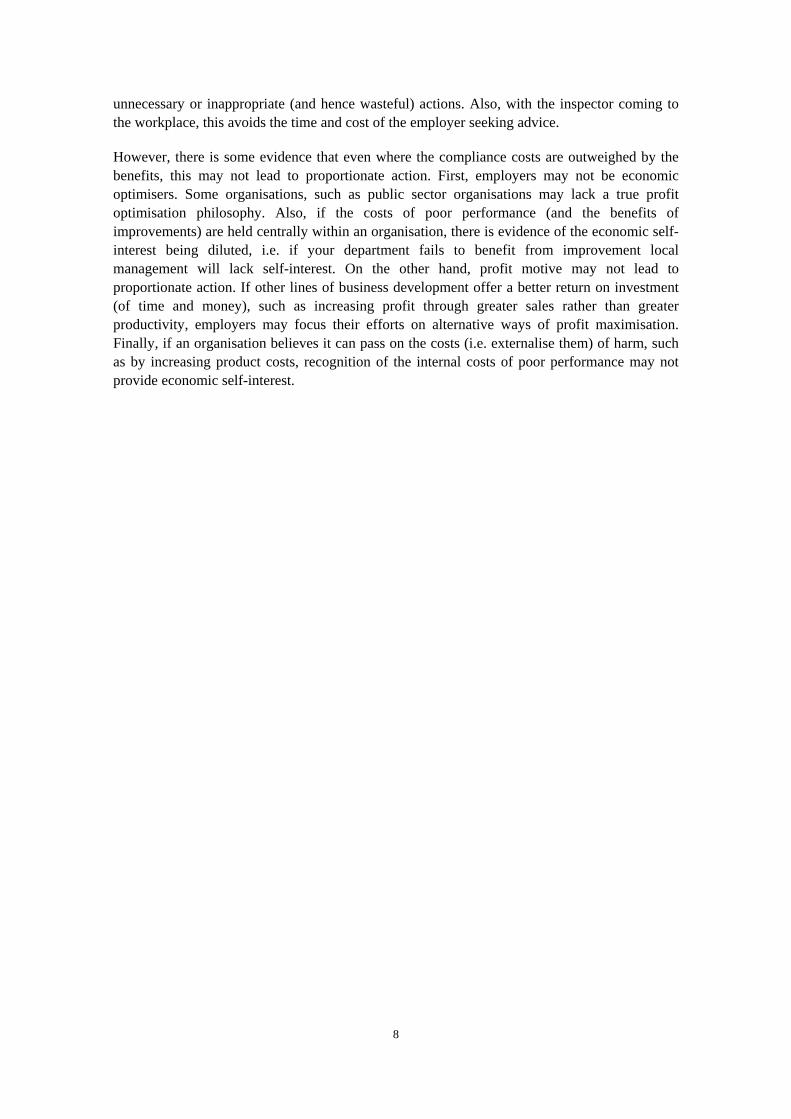
However, there is some evidence that even where the compliance costs are outweighed by the benefits, this may not lead to proportionate action. First, employers may not be economic optimisers. Some organisations, such as public sector organisations may lack a true profit optimisation philosophy. Also, if the costs of poor performance (and the benefits of improvements) are held centrally within an organisation, there is evidence of the economic self-interest being diluted, i.e. if your department fails to benefit from improvement local management will lack self-interest. On the other hand, profit motive may not lead to proportionate action. If other lines of business development offer a better return on investment (of time and money), such as increasing profit through greater sales rather than greater productivity, employers may focus their efforts on alternative ways of profit maximisation. Finally, if an organisation believes it can pass on the costs (i.e. externalise them) of harm, such as by increasing product costs, recognition of the internal costs of poor performance may not provide economic self-interest.
8
High
e
t
Low Knowledge/ perception of risks
High Transaction/compliance costs
Low Economic rationality
Figure 1: Economic model of H&S compliance
With this model, knowledge and perception of risk is influenced by:
• Objective level of risk;
• History of incidents
• Level of media attention
• Company size and /or possession of in-house expertise – external advice
The perception of transaction costs are influenced by:
• Objective level of compliance costs;
Economic rationality influenced by factors such as:
• Profit motivated or not;
• Are costs transferable?
• Are costs borne by the individual?
9
Self-complian
Mandat
Internal costs ofpoor H&S
Low
High
Low
High
The level of internal cost is influenced by:
• Objective level of internal costs, e.g. cost of insurance
• Perceived risk of reputational damage – which in turn is influenced by extent to which firm has a public image/brand value, whether demand is elastic, whether H&S is perceived as important by customers etc, possibility of detection and degree of publicity awarded wrong doing;
• Position in the supply chain and level of customer pressure.
The role of education, regulation and enforcement
A central tenet of economic rationalisation is that organisations will act in their economic self-interest where the internal benefits outweigh the costs of action. This model would argue for (1) ensuring organisations have a correct understanding of the costs and benefits of compliance, (2) costs are internalised where possible and (3) regulation is applied where cost internalisation is not possible or where an imperfect market exists. Therefore, in the context of the economic model of compliance behaviour, regulation and enforcement can be said to have a number of roles:
• Where the costs of poor health and safety are external to the organisation, regulation is required to ensure the organisation manages these risk in proportion to the external costs;
• If regulations exist to ensure all organisations manage risks that create external harm (social costs), for such enforcement to be seen as socially just it must be consistent across all organisations, otherwise the social case for regulation is undermined;
• Where lack of knowledge and/or skewed perceptions of risk cause organisation to under-rate the importance of a specific aspect of risk management, enforcement is required to force the organization to manage a risk in proportion to its importance (as judged by the regulator);
• Where compliance is due to lack of awareness of (for example) appropriate risk management practices, enforcement may have the effect of raising awareness. In this respect, the publicity of enforcement action may have an impact on other organizations, by raising their awareness;
• Where the costs of interpreting general regulations is seen as high by an employer, enforcement may be seen as a way of translating general requirements into specific ones;
• Where the employer is unwilling to incur the transaction costs involved in understanding and interpreting regulations, enforcement involves the regulator making the judgement for the employer;
• Where an employer does not follow a rationale model of decision making, enforcement applies an external view of rational and proportionate behaviour.
10
In this context, enforcement can be seen to:
• Have a deterrent effect beyond the enforced organization by generating a fear of reputational damage (where they are perceived by society to have acted unethically or negligently, as shown by a prosecution for example);
• Have a narrow effect within organisations by forcing them to act on risks they either did not recognise or which they would not act on due to their belief that the costs of compliance were disproportionate;
• Have an educational effect beyond the enforced organisation by increasing awareness of the risks and appropriate preventive actions;
• Help internalise the costs of poor health and safety, by generating reputational damage, leading to customer dissatisfaction (if they have H&S demands) and by levying fines.
The economic analysis of crime assumes that commercial organisations will breach the law if the benefits exceed its expected costs. This interpretation of the economic model leads to a “detect and punish” approach where the regulator must police organisations to detect intentional and purposeful non-compliance. It assumes that the costs of poor H&S are either not internalised by organisations or are insufficient to lead to appropriate H&S standards, and that organisations consciously act in a criminal manner.
In a more general paper looking at challenges for regulatory compliance (across all aspects of legislation) the OECD (2001) address a number of points about how enforcement may influence behaviour:
• They refer to the need for regulation to be simple so that it can be easily understood with lower costs of compliance;
• They also highlight the need to ensure that there is fairness in regulation, otherwise rule breaking will occur where the regulation and its application is perceived to be unfair, and this in turn requires a high level of detection of rule breaking.;
• The studies quoted by the OECD seem to indicate that both the nature and extent of enforcement action are important with purely negative and punitive approaches actually reducing compliance;
• The OECD also points to the failures in monitoring of compliance with regulations as being a factor, an issue also highlighted by Hopkins (1995). As pointed out by the OECD paper, any form of justice is only effective if there is a high likelihood of being caught - as without being detected the impact of any penalty is non-existent.
Hopkins (1995) addresses the impact of on the spot fines as being effective and it would appear that it is the shock of the penalty itself, rather than the size of the penalty, that has the impact. This was a factor also cited by Mendaloff (in Sullivan and Frank 2003). Although, once this shock is overcome it may tend to have an opposite effect. Mendalof, again, refers to the increase in inspection related penalties in US from 35% (inspections resulting in penalties) between 1979-87 to 75% between 1992-8, inferring that as managers could now expect a penalty with each inspection the motivating effect of surprise is lost.
11
Whilst there are many studies, which report that employers cite regulation and enforcement as key drivers for health and safety, few studies have demonstrated the link with performance. Evidence, mostly from North America and cited in both; Sullivan and Frank (2003) and Hopkins (1995), seems to indicate that the nature and intensity of inspection, including the issue of fixed penalty notices has a direct bearing on safety performance.
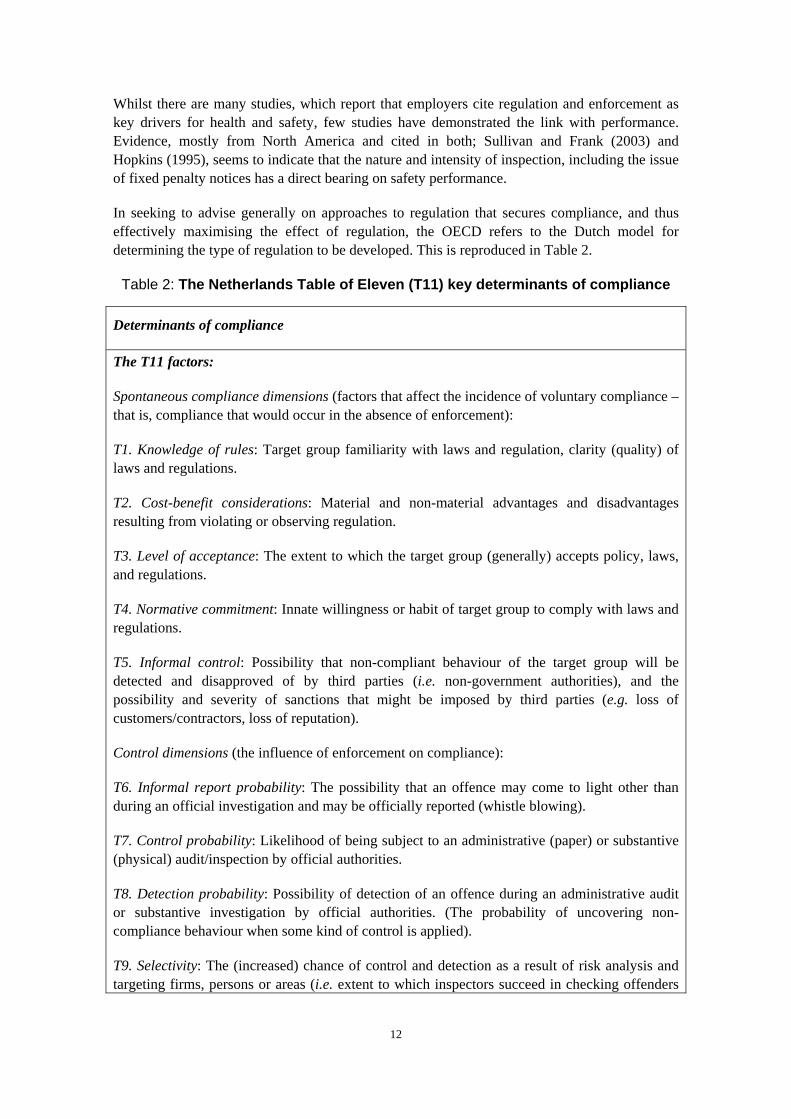
In seeking to advise generally on approaches to regulation that secures compliance, and thus effectively maximising the effect of regulation, the OECD refers to the Dutch model for determining the type of regulation to be developed. This is reproduced in Table 2.
Table 2: The Netherlands Table of Eleven (T11) key determinants of compliance
Determinants of compliance
The T11 factors:
Spontaneous compliance dimensions (factors that affect the incidence of voluntary compliance – that is, compliance that would occur in the absence of enforcement):
T1. Knowledge of rules: Target group familiarity with laws and regulation, clarity (quality) of laws and regulations.
T2. Cost-benefit considerations: Material and non-material advantages and disadvantages resulting from violating or observing regulation.
T3. Level of acceptance: The extent to which the target group (generally) accepts policy, laws, and regulations.
T4. Normative commitment: Innate willingness or habit of target group to comply with laws and regulations.
T5. Informal control: Possibility that non-compliant behaviour of the target group will be detected and disapproved of by third parties (i.e. non-government authorities), and the possibility and severity of sanctions that might be imposed by third parties (e.g. loss of customers/contractors, loss of reputation).
Control dimensions (the influence of enforcement on compliance):
T6. Informal report probability: The possibility that an offence may come to light other than during an official investigation and may be officially reported (whistle blowing).
T7. Control probability: Likelihood of being subject to an administrative (paper) or substantive (physical) audit/inspection by official authorities.
T8. Detection probability: Possibility of detection of an offence during an administrative audit or substantive investigation by official authorities. (The probability of uncovering non-compliance behaviour when some kind of control is applied).
T9. Selectivity: The (increased) chance of control and detection as a result of risk analysis and targeting firms, persons or areas (i.e. extent to which inspectors succeed in checking offenders
12
Determinants of compliance
more often than those who abide by the law).
Sanctions dimensions (the influence of sanctions on compliance):
T10. Sanction probability: Possibility of a sanction being imposed if an offence has been detected through controls and criminal investigation.
T11. Sanction severity: Severity and type of sanction and associated adverse effects caused by imposing sanctions e.g. loss of respect and reputation.
Source: Dick Ruimschotel, Compliance Methodology Consultants, Amsterdam and But Klaasen, Ministry of Justice, The Hague.
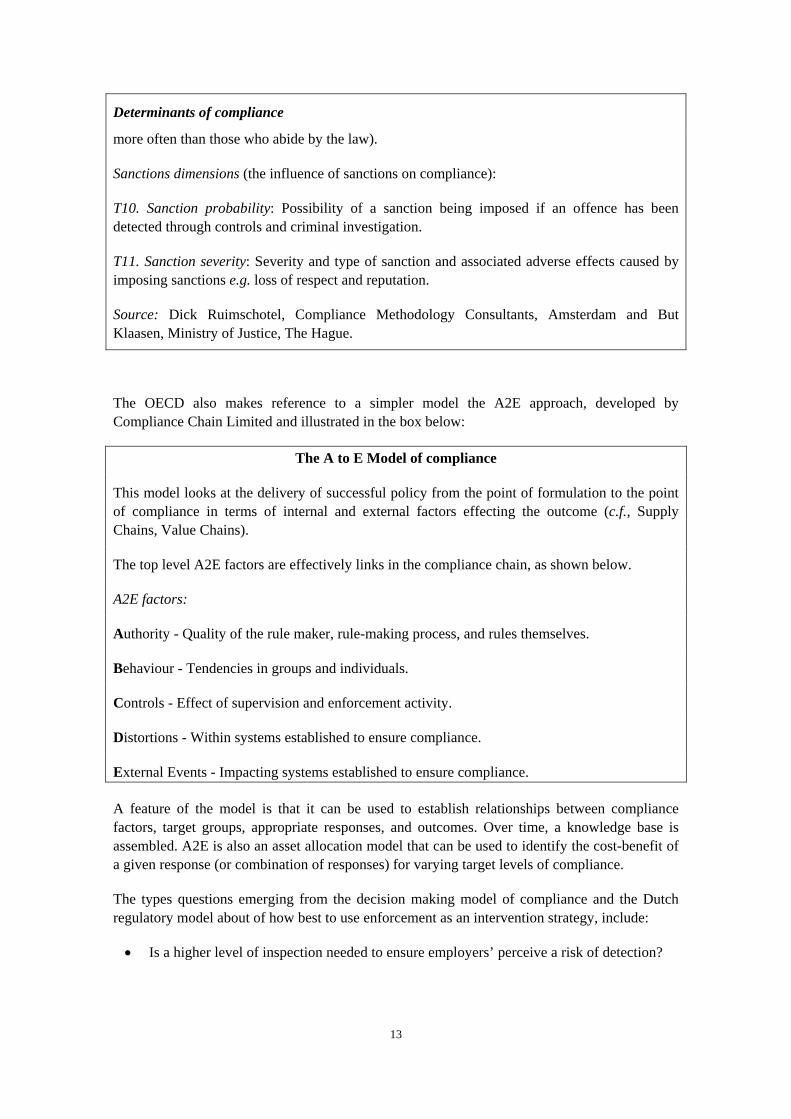
The OECD also makes reference to a simpler model the A2E approach, developed by Compliance Chain Limited and illustrated in the box below:
The A to E Model of compliance
This model looks at the delivery of successful policy from the point of formulation to the point of compliance in terms of internal and external factors effecting the outcome (c.f., Supply Chains, Value Chains).
The top level A2E factors are effectively links in the compliance chain, as shown below.
A2E factors:
Authority - Quality of the rule maker, rule-making process, and rules themselves.
Behaviour - Tendencies in groups and individuals.
Controls - Effect of supervision and enforcement activity.
Distortions - Within systems established to ensure compliance.
External Events - Impacting systems established to ensure compliance.
A feature of the model is that it can be used to establish relationships between compliance factors, target groups, appropriate responses, and outcomes. Over time, a knowledge base is assembled. A2E is also an asset allocation model that can be used to identify the cost-benefit of a given response (or combination of responses) for varying target levels of compliance.
The types questions emerging from the decision making model of compliance and the Dutch regulatory model about of how best to use enforcement as an intervention strategy, include:
• Is a higher level of inspection needed to ensure employers’ perceive a risk of detection?
13
• Would higher penalties increase the internalised costs of poor performance or would it lead to a perception of enforcement as unfair/ disproportionate and hence undermine the perceived legitimacy of regulations?
• Should prosecutions focus on the corporate body rather than the individual?
• Should employers’ be offered greater incentives in reward for better performance (such as earned autonomy or targeted inspection) to help internalise and increase the benefits (less inspection) of good performance?
• Are there alternative penalties that would help to internalise costs of poor performance and / or provide a more positive incentive to organisations (see 1.2.2 and 1.2.3 for two examples)?
• Should the law be changed to increase the possibility and consequence of prosecution?
• Should the actual or perceived cost of compliance be reduced?
It is also the case that the relevance of the economic argument at the organisational level is questioned by a number of theorists. For example, Cutler and James (1996) criticize the HSE for painting an overly simplistic picture of the ‘safety pays’ argument, and points out three flaws with it, namely:
• It encourages the notion that employers should prioritise the avoidance of accidents by reference to potential financial returns;
• It is estimated that the average costs of non-injury accidents are nearly three times those of injury accidents;
• At some point further investment in the safety programme will not give a net return. Thus, based on a purely financial argument, safety expenditure should be increased up to the point where the marginal cost of safety equals its marginal benefit, and no further (Ashby & Diacon, 1996).
In addition, Hopkins (1999) believes that managers’ thinking about expenditure on health and safety may in fact be essentially flawed. He points to ‘Institutionalized irrationality’ in which managers’ focus on the costs of complying with health and safety legislation, over too short a period of time. As a result, the costs of compliance are identified as a financial burden. Next he points to ‘Bounded rationality’ in which managers lack access to all relevant information. Such failures to fully weigh up the economic arguments are thought to lead to faulty decision making by managers.
This leads to the further issue of whether there is evidence that employers are influenced by the costs and benefits of H&S.
1.2.2 Restorative justice
The concept of restorative justice (OECD, 2001) has been expressed as a more familial social control mechanism involving the identification of wrongdoing, the creation of shame, and then reintegration (back into the family). To quote the OECD paper:
14
“a number of business regulators have experimented with adopting innovative mechanisms for restorative justice when compliance fails, in order to remedy the wrong
and ensure compliance in the future. While the evidence on the effectiveness and fairness of restorative justice for individual offenders is still being evaluated, there is good evidence that the restorative justice is effective for corporate law breaking. The
aim of restorative justice is to restore enterprises to a position where they have both the capacity and willingness to comply after they have committed a violation.”
Whereas the use of restorative justice approaches increased compliance – this is attributed in part to the point that whilst the enforcers disapproved of the original non-compliance, they provided approval/ praise for the actions taken once the non-compliance was identified.
1.2.3 Adverse publicity
The role of reputation risk in securing compliance
There is a large body of research in the UK that indicates organisations are prompted to manage H&S to avoid the reputational damage of incidents, as summarised in Wright et al 2004. In the context of the economic model of behaviour, reputational damage (arising from H&S incidents or enforcement) is a way in which external costs are internalised, through loss of brand value. In this sense, enforcement may also play a role in internalising costs if it causes reputational damage.
Following on from this line of thinking, it is important to publicize enforcement actions to ensure its role in internalising costs is maximised. This may have the effect of increasing other organisations perception of the possibility of reputational damage, and hence have a deterrent effect beyond the enforced organisation. Such publicity is also needed for the enforcement to be known, such as publicity via mass media, and hence for it to create reputation damage. For this to be achieved, the enforcement action must be needed to be perceived by wider society (or at least customers) as an indication of unethical behaviour by the organisation, or in some way create a loss of brand value. If stakeholders perceive the enforcement to be disproportionate or unjust, such enforcement is less likely to create reputational damage.
Indeed, there has been a body of research summarised and reviewed by Yeung (Yeung, 200?) completed on the role of adverse publicity in securing regulatory compliance. This work has been awarded greater interest in Australia recently due to the introduction of Adverse Publicity Orders. Similarly, the OECD (2001) refers to the effect of negative publicity and the associated loss of corporate prestige. In brief, it is suggested by Yeung that reputational risk has grown in importance for a number of reasons, including:
• Growth in information technology and media – leading to rapid transmission of information directly to general public on a, low cost and instantaneous basis;
• A professionalisation of communications where society actively engages media;
• A greater public (and company) interest in corporate misconduct due to (1) a recognition of the impact of shares value on pension funds as well as the wider share ownership in some countries and (2) growing impact of brand values on commercial performance (due to consumer sensitivity towards brand image and values).
15
It is suggested that these trends have led to a growth in media attention towards reporting of corporate misconduct and a growth in the impact of “misconduct” on commercial performance. Indeed, Yeung concludes that:
“There appears to be verifiable evidence that firms are sensitive to adverse publicity.” (p11)
“In these studies, a statistically significant negative impact between adverse publicity and firm performance is typically observed.” (p11)
“..firms fear the sting of adverse publicity attacks on their reputations more than they fear the law itself.” (p12)
Accordingly it is argued that regardless of whether brand values really do impact commercial performance, organisations are increasingly motivated to manage their reputations and image.
These observations formed the context for the introduction of adverse publicity orders in Australia, the pros and cons of which are summarised in Table 3. They also form the context for recent HSE proposals and initiatives such as:
• Encourage corporate firms to publicly report their health and safety standards / performance, and;
• Operate an Offenders Database.
Recent research, as reviewed by Wright, Marsden and Antonelli (2004), suggests that it is apparent that enforcement is important in respect of:
• Creating a deterrent for large and small firms alike, including a fear of reputational damage;
• The HSE is an active actor in the creation of reputational risk for organisations, including its enforcement work and the published findings of audits and reviews.
This lends support to the idea of better publicising the outcome of enforcement action.
16
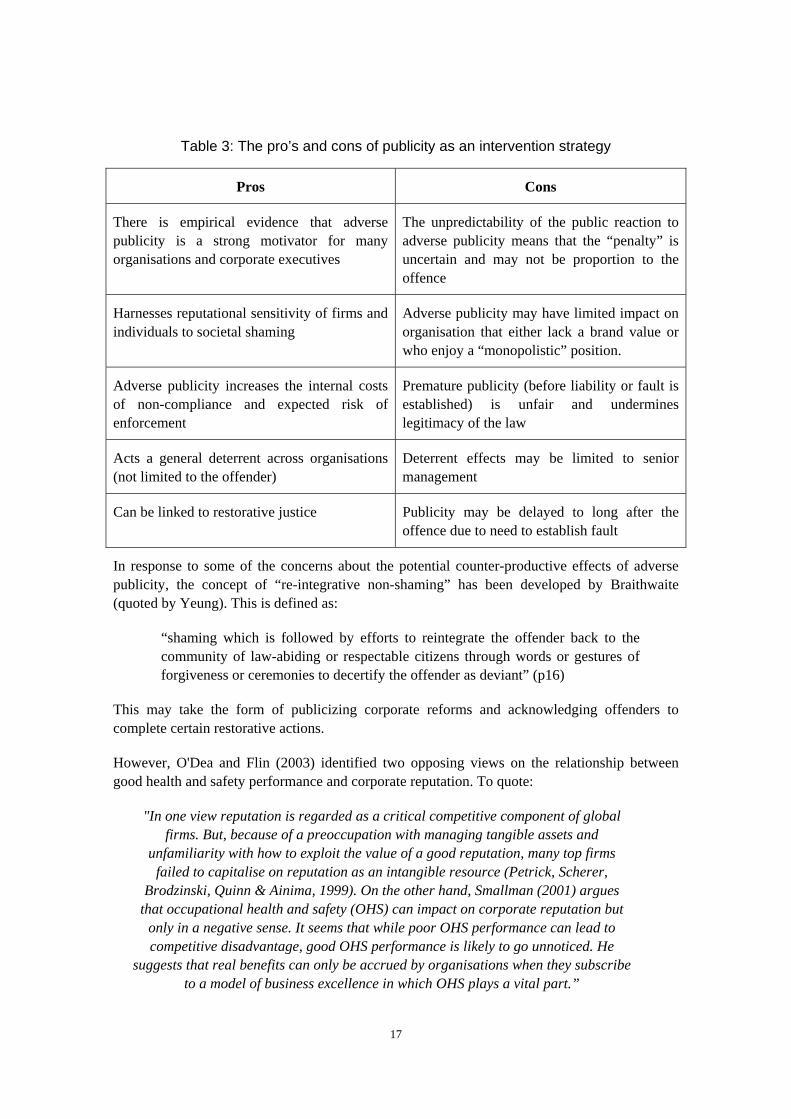
Table 3: The pro’s and cons of publicity as an intervention strategy
Pros Cons
There is empirical evidence that adverse publicity is a strong motivator for many organisations and corporate executives
The unpredictability of the public reaction to adverse publicity means that the “penalty” is uncertain and may not be proportion to the offence
Harnesses reputational sensitivity of firms and individuals to societal shaming
Adverse publicity may have limited impact on organisation that either lack a brand value or who enjoy a “monopolistic” position.
Adverse publicity increases the internal costs of non-compliance and expected risk of enforcement
Premature publicity (before liability or fault is established) is unfair and undermines legitimacy of the law
Acts a general deterrent across organisations (not limited to the offender)
Deterrent effects may be limited to senior management
Can be linked to restorative justice Publicity may be delayed to long after the offence due to need to establish fault
In response to some of the concerns about the potential counter-productive effects of adverse publicity, the concept of “re-integrative non-shaming” has been developed by Braithwaite (quoted by Yeung). This is defined as:
“shaming which is followed by efforts to reintegrate the offender back to the community of law-abiding or respectable citizens through words or gestures of forgiveness or ceremonies to decertify the offender as deviant” (p16)
This may take the form of publicizing corporate reforms and acknowledging offenders to complete certain restorative actions.
However, O'Dea and Flin (2003) identified two opposing views on the relationship between good health and safety performance and corporate reputation. To quote:
"In one view reputation is regarded as a critical competitive component of global firms. But, because of a preoccupation with managing tangible assets and
unfamiliarity with how to exploit the value of a good reputation, many top firms failed to capitalise on reputation as an intangible resource (Petrick, Scherer,
Brodzinski, Quinn & Ainima, 1999). On the other hand, Smallman (2001) argues that occupational health and safety (OHS) can impact on corporate reputation but
only in a negative sense. It seems that while poor OHS performance can lead to competitive disadvantage, good OHS performance is likely to go unnoticed. He
suggests that real benefits can only be accrued by organisations when they subscribe to a model of business excellence in which OHS plays a vital part.”
17
The findings of Yeung and others indicate that there are some issues to be addressed, including:
• How can adverse publicity be applied in a fair and proportionate way?
• Can adverse publicity be designed to provide a positive “restorative” penalty?
• What are the best routes for such publicity?
• In which sectors may adverse publicity have an effect?
1.2.4 Internalising costs of poor performance
The economic model of H&S behaviour would also prompt the questions:
• Should and how can the proportion of costs borne internally by organisations be changed?
• How can a clear link between H&S performance on their costs/benefits be improved?
Outside of enforcement and penalties, two further options have been the subject of research, namely:
• Supply chain pressure, and;
• Insurance
Supply chain
Customers’ pressures have been identified as another way of “internalising” costs of poor H&S. As concluded in Wright at al (2004) “when exercised, supply chain pressure can have a significant effect on suppliers and contractors”(pvi). This is supported by Vickers et al (2003) who found a range of pressures, including those from insurers, of customers and suppliers including customer reinforced pressure regarding environmental legislation together with a need to create or maintain competitive advantage.
Of interest, there appears to be a common thread through much of the research indicating that, for food safety, there is a marked degree of "pressure" through the supply chain related to food quality standards. For example, in the contractorisation study (2003), the authors identify that in the catering sector there are demands by business on their suppliers for food safety reasons.
The PWC report of a small firms project for HSE and Belfast Council identified that one of the reasons health and safety was identified as a priority was the extent to which customers or standard bodies exerted pressure on a business.
However, it is unclear how common supply chain pressure is applied.
Insurance
The Wright (2002) study found from a review of experience in other countries that insurance is a significant motivator where a greater proportion of the costs of injury and ill-health are borne by the insured. It was suggested that the role of insurance could develop if the proportion of injury and ill-health costs borne by UK employers via employers’ liability insurance were to
18
rise. Subsequent to the prices rises in 2002-2003, the review of evidence for the HSE Strategy (Wright, Marsden and Antonelli, 2004) concluded that:
“Whilst earlier research provided mixed messages on the effectiveness of financial incentives, there is emerging evidence that with the increased cost of insurance that some organisations are starting to respond to insurance premiums by trying to improve health
and safety. Research has also found that small firms would be more likely to be incentivised if they saw a clearer link between their premiums and their health and safety performance. This provides support for the idea of developing a more risk based method of setting SMEs insurance premiums, and for further developing the role of insurance as
an incentive for better health and safety.”
This finding that the cost of insurance, and hence the prospect of discounts, suggests that insurance has the potential to become a particularly effective incentive for SMEs.
1.2.5 Reducing compliance costs
A number of options for reducing compliance costs have been suggested. The first and simplest idea has been to simplify and/or reduce the level of regulation. Other suggestions include:
• Reward good performance through “Earned autonomy” and / or “targeted inspection”, wherein good firms are the subject of less inspection;
• Create sector specific standards, which require less interpretation and hence lower compliance costs, and;
• Provision of tax incentives for health and safety expenditures, or grants for small firms.
1.2.6 Raising awareness of hazards, risks and costs
A series of HSE projects have indicated that raising employers’ awareness of hazards and how to control them is an essential pre-requisite for compliance. It is also commonly reported that the a priori level of awareness of hazards and the perceived risk posed by H&S hazards has a major influence on compliance. This is particularly so in the case of SMEs which tend to lack in-house health and safety specialists. In the context of the economic model of behaviour, awareness and knowledge of hazards are essential elements of rationale decision-making and judgement of the proportionality of risk controls and associated regulations. Recognition of the information needs of firms and the difficulty that is reported in accessing some firms leads to the notion of “relationship” building, as opposed to enforcement, as well as drawing on concepts of public information campaigns and marketing.
One study by Hillage, et al (2001) found that, overall, some 20-30% of employers are not aware of the law that affects them; the least understanding being amongst SMEs. Another study (Vickers et al 2003) confirmed this view identifying that h&s legislation specific to their business was not identified by 50% of SMEs. This latter study identified that the larger SMEs were better, in terms of their knowledge of health and safety legislation, although they were still described as poor in this respect. Of interest here was the finding that a recent visit by an inspector was not a factor in the business knowing specific legislation.
19
In the context of the economic model of behaviour, the perceived affordability and benefits of compliance are important variables. The relevance of this to health and safety behaviour is indicated by many research studies. First, there is some evidence from previous research to suggest that employers are sensitive to the “affordability” of health and safety management. That is, they appear to judge the “reasonableness” of health and safety in terms of whether the costs of compliance are in proportion to the seriousness of the risk and whether the health and safety controls are affordable in absolute terms. Highlighting the costs of injury and ill-health to the employer is important, in so far that it helps to offset some of employers’ direct compliance costs, and hence makes compliance more affordable. These “costs” can include intangibles elements, such as reputational damage, industrial relations problems and loss of customers. Reputational damage can come in the form of a high-profile accident, prosecution, adverse inspection report and so on (namely anything that castes doubt on the ethical behaviour or competence of the company). Indeed, there is anecdotal evidence that the value of a fine is seen as a measure of censure.
At the same time, education and awareness raising is important, in the context of enforcement, in order to:
• Demonstrate the fairness of the regulation and its proportionately, and;
• Enable organisations to manage the risk by raising awareness of suitable and effective risk controls.
O'Dea and Flin (2003) also found evidence from several studies supporting the view that companies have imperfect cost information. In a review of whether “cost of accident” and “business case” publicity has worked Wright et al (2004) concluded that “Whilst it appears that progress has been made in convincing organisations of the business case, the results are mixed and hence further work in promoting the business case is needed.” (pvi)
There is also mixed evidence that organisations see a link between productivity and health and safety. O'Dea and Flin (2003) in their review report Warrack and Sinah (1999) found that among the most sophisticated firms in their sample, this is in fact the case. They also report that Petrick et al (1999) found that excellent global leaders are capable of balancing four competing criteria of performance:
i) Profitability and productivity;
ii) Continuity and efficiency;
iii) Commitment and morale, and;
iv) Adaptability and innovation.
However, there is little evidence that other firms, such as SMEs, recognise this link.
These types of findings have led to a focus on how best to communicate with employers, especially the large number of small employers, with the goals of:
• Improving awareness of hazards and increasing their perception of the risk such that they accept the need to implement risk controls;
20
• Advising them of how best to manage the risk as well as their regulatory duties.
Working with intermediaries
Hillage et al (2001) identified that an improved understanding of health and safety and how to manage risks was a strong driver, although the link between information provision and improvement in performance is not strong. In concurrence with a number of studies the major source of information was from HSE/LA inspectors, although the absence of any link between an inspectors visit and knowledge of health and safety legislation should be noted. Although two thirds of respondents would use LA/HSE, 1 in 10 of respondents did not know how to get health and safety information. Whereas, some SMEs use other sources of information e.g. insurance companies, financial services and consultants. The indications are that these are actually little used.
A paper by John Kingston Associates (quoted in Atkins, 2003) recognised the overall problem of information handling within small firms, which may impact upon the effectiveness of health and safety information. This is an issue raised in other studies. In a 1999 consultation document it was found that SMEs had a lack of understanding /knowledge of health and safety with poorer training and employee competence. This view was reiterated by a HSL consultation draft in 2000 (quoted in Atkins).
One de-motivator to information handling may be related to literacy within organisations, especially small firms and EMB’s. A study by Wiseman et al (2002) of chemical information in small firms identified that health and safety issues were usually communicated verbally and a very low level of reading skills predominates. Thus suggesting that for some sectors there is possibly an issue relating to how information needs to be presented to reflect the regulatory driver. Safety information centres (Loughborough, 2000) appear to offer an approach to assisting in safety information provision to small firms, particularly in relation to establishing management systems.
On a somewhat different note, another study in 2000 conducted by Norwich Enterprise Agency trust (quoted in Atkins 2003) found that SMEs saw HSE as the enemy and a source of red tape. In Contractorisation aspects of health and safety in the supply chain, Partnership Sourcing Ltd (2000), the authors found that SMEs have difficulty in coping with the sheer volume of legislation.
These, and other concerns about how best to raise awareness and advise firms, have led to the suggestion that the HSE needs to work with other stakeholders to reach employers, especially SMEs, as well as set up an advisory service that is seen as independent of the enforcement side of the HSE. The review of evidence for the HSE (Wright, Marsden and Antonelli, 2004) strategy noted that:
“It is clear that working with intermediaries can effectively amplify the impact of the HSE and that this is particularly needed amongst the large number of SMEs. It is also clear that there is a range of intermediaries that the HSE could work with, but the relative effectiveness of each type
of intermediaries is less well researched. The effectiveness of some intermediaries has been subject to limited research and / or a single pilot. Whilst this provides an initial indication of
their potential role uncertainties remain.”
21
Thus, whilst the need for partnering and education is generally accepted and many alternative routes for education have been identified, they have yet to be subjected to full-scale evaluation.
The suggestion is that a collaborative approach involving all relevant stakeholders has a better chance of succeeding in achieving improvement than a single agency or stakeholder operating alone. This idea is supported by the OECD (2001), particularly with reference to success in other areas of policy regulation such as environmental controls. Additional support comes from Mootz, Franklin and Wickizer (2003) citing a study of inter-agency/stakeholder co-operation and community systems in Washington state relating to musculoskeletal injury management. However, what this study identified was that the area is fraught with difficulties. And, whilst such an approach may be effective it may not have an impact (J Hillage, et al 2001), in terms of reducing injury per se. Mootz et al (2003) argue that, on the basis of the evidence available, it is necessary to adopt a multiple attack approach, securing collaboration from and mobilising stakeholders with interventions that are synergistic.
Use of IT also seems to be an important area, particularly (as might be expected) with SMEs. For example, EMBs with IT felt less over regulated (Vickers et al 2003). However, other researchers cited in Atkins (2003) found that 25% of SMEs have no access to PC’s or web sites. Although an HSL report (quoted in Atkins 2003) showed that 50% of SMEs did have access to internet (major areas being manufacturing and financial sector) across all sectors (lowest in retail, hotels and restaurants), less than 30% of business used Government internet services. Overall, less than 2% of respondents had accessed HSE internet services. Indications are that small businesses prefer to talk (face/face). The Atkins (2003) review identifies a number of areas where IT has been found to be useful, including the relative success of COSHH although the precise impact of this is not clear.
Amplifying impact of accidents
Another inferred lever relates to the possible susceptibility to improvement that employers appear to exhibit after an accident. Clearly whilst the aim would be to prevent accidents in the first place, the argument for a "new" lever is one based on this apparent susceptibility by elevating the importance and practice of accidents investigation and the organisational learning that can come from this. An internal HSE paper by Evans and Molloy (2000), suggests that companies may be more susceptible (to health and safety interventions/advice) after an accident has happened. This view is supported by the arguments made for isomorphic learning by Toft and Reynolds (1997).
However, there may be a number of impediments to this area of motivation. The Centre for Corporate Accountability study (2002) identified that not all fatal accidents were investigated and that some 81% of injury accidents were not investigated. Thus, the opportunity to motivate companies post accident would require a major increase in the regulatory response to accidents.
Further support for the idea of using accident investigation as a lever comes from O’Dea and Flin (2003) who identify that, amongst a number of factors, investigation of all accidents and near misses is one of the ways that management can influence the perception by employees of health and safety supporting the development and maintenance of a safety climate in an organisation. Although, here their evidence relates to the lower level of organisational management rather than to the impact upon senior management. It is thus possible that more
22
focus on accident investigation, from a number of perspectives, could be developed as a motivator for overall safety improvement.
The role of enforcement
Previous research has also suggested that enforcement action can have an “educational” and “attention” raising effect, wherein it alerts employers that their current practices are unacceptable or out of date. Indeed, there is some evidence that enforcement action can have a “ripple” effect, wherein other employers respond to the news of enforcement action against another employer.
Communicating costs/ benefits to SMEs
For small business, some researchers have found that:
• SMEs are particularly motivated by financial rewards (a study undertaken for the HSE and Belfast City Council (quoted in Atkins 2003)) and that the extent to which health and safety is a priority depends on whether:
• Health and safety is seen as crucial to running the business, and;
• On the extent to which the costs of not addressing health and safety are seen as being significant.
• Health and safety is not seen as part of business (Vickers 2003), or it is given a low priority (Davies and Mckinney, 2001);
• The cost involved in achieving good health and safety performance was seen as an issue and clearly acting as a demotivating agent, whereas, larger organisations were more likely to see this cost as an investment (Vickers et al 2003);
• Compliance was also seen as a burden and SMEs were resistance to the cost (price resistance) of OH.
In response to the question how can employers’, especially SMEs, awareness of the costs and benefits be improved, it has been found that:
• Davies and Mckinney (2001) found that events such as preparation of financial accounts, contact with banks and payment of taxes are critical to SMEs. It might be suggested that, for smaller firms at least, the linking of safety performance with the key critical business events noted by Davies and Mckinney (2001) may in itself be a new motivator.
• On the other hand, Vickers et al (2003) found that for small firms motivators for Health and Safety include; best interest of business on basis of staff retention, staff training and development, and the adoption of familial/paternalistic approaches.
1.2.7 Inter-company variations
Previous research (Wright 1998) has indicated that the manifestation of these factors varies between companies according to their size, hazard profile, market position, safety record and
23
other organisational characteristics. For example, SMEs tend to be less aware of hazards and less able to manage them than large firms. There may also be inter-sector variations and sector specific factors. For example, sectors that operate major hazard plants may regard safety to be an essential aspect of business management wherein an accident can have very significant costs, regardless of company size. Construction sector duty holders appear to be aware of health and safety matters but claim to be inhibited by structural and organisational problems specific to the construction business, such as short-term contracts. There is also evidence that employers’ concern for health and safety varies between hazards according to awareness and perception of hazards. It is often reported that acute hazards, such as fatal falls, are perceived as posing a greater risk than chronic health conditions, such as cancer. It is also apparent that there are organisation specific factors, such as the occurrence of a serious incident, which can influence subsequent behaviour.
More recent work suggests that there appear to be a number of cultural factors (both internal and external), which may motivate business to prioritise or otherwise react to health and safety issues. In small firms, Vickers et al (2003) found that the actual nature of the management (style, approach), the extent of employee representation, the degree of management training taking (taken) place, values and behaviours were important factors. In particular, previous management experience and education were found to be important. This study found a gender differentiation, with indications that females prefer non-hierarchical relationships and generally value health and safety higher, although it is clearly unwise to generalise and there are distinct, though difficult to characterise, ethnic differences.
Further ethnic minority businesses (EMBs) were found to have suspicion of external agencies as opposed to non-EMB businesses. Other findings on SME employee involvement include:
• There is lower literacy and higher verbal communication in SME firms;
• There is evidence of self-initiation (of safety approaches, generally hardware) to protect workers and reduce risks;
Variation according to size and sector
If the question is asked how the models of organisational behaviour may operate across organisations of different sizes and sectors it is possible to hypothesis, on the basis of previous research, differences in attitudes and behaviour. For example;
• Small firms, that commonly report lower levels of H&S expertise and knowledge, may be predicted as operating with an imperfect perception of hazards and how best to control them – and as a consequence either failing to act of (unrecognised) risks, regarding risk controls to be disproportionate (as they underestimate the risk) etc
• Larger organisations, that commonly report higher level of H&S expertise and knowledge, may operate with a more valid (if not perfect) perception of the risk. However, noting that large organisation differ in their brand sensitivity, concern for profitability etc, their concern for avoiding direct costs and reputational damage of poor H&S may vary between (say) charitable / governmental bodies and “high street” firms.
24
1.2.8 Concluding points
Against the background of mixed and incomplete research findings, it is important to understand the interaction between motivational “levers” in order to:
• Understand how the influence of motivational factors co-vary and interacts, and;
• How the attitudes and behaviours of organisations vary according to their type, whilst also mapping out the dimensions along which organisational attitudes to H&S vary.
In addition, it is important to seek evidence of the importance of each factor and the case for “new levers”. A number of studies and position papers have suggested a number of new "levers", more by inference than direct evidence. With a few exceptions, discussions focus on extending or reinforcing the operation of existing “levers”, such as by changing penalties. Whilst there are many new ideas on how to promote health and safety and some research on how these relate to company size and hazard profile, the relative merits of these “levers” in different contexts have not been mapped out. Also, companies have not been delineated into discrete groups that may respond in a common manner to each lever.
Therefore, this research aimed to build on previous studies by delineating companies into discrete groups and mapping “levers” onto each type of organisation. We also aimed to acquire evidence about the likely degree of influence that each lever might have. Some specific issues include:
• How best to amplify the impact of enforcement and use it as a general deterrent?
• Are new penalties (e.g. adverse publicity for example) and incentives (e.g. earned autonomy) of value?
• How can the HSE best amplify its awareness raising and educational work?
25
2 EXPLORATORY DISCUSSIONS
2.1 INTRODUCTION
A series of exploratory discussions were run with employers and key stakeholders, such as the CBI and trade associations, selected from a representative range of sectors and sizes of organisations. The aims of exploratory discussions were two-fold. First they provide an initial test of the assumptions underlying the HSE approach to securing compliance and the relative merits of different levers in different contexts. Whilst the discussions do not provide quantitative evidence, they would provide a rich qualitative body of evidence.
Second, they also focused on the new issues and areas of uncertainty left from previous research, as discussed in section 1. Particular attention was given to issues such as:
• What is the potential role of trade associations and other intermediaries as HSE partners?
• To what extent is insurance a potential lever?
• What do employers mean by being regulation driven?
• To what extent is enforcement a positive or negative motivator?
• How does the motivation of organisations vary between sectors and why?
• What is the relationship between enforcement and reputational risk?
The discussions probed (in semi-structured format):
• Employers’ perceptions of various motivational factors and inhibiting factors.
• Novel ideas on how to motivate and assist firms to comply.
• Employers’ view of the economic argument and regulatory compliance. For example, to what extent do they accept there are financial benefits of good health and safety, or is it simply a part of their judgement of whether societal costs of ill-health and injury justify imposing regulations on employers?
• Do they fear the direct costs of prosecutions, or is it the business disruption and reputational damage they fear?
This entailed presenting respondents with “attitude statements” and evaluating their agreement with them, such as “the business costs of ill-health and injury are an important factor in judging the affordability of health and safety improvements”.
A total of thirty-nine in depth interviews were undertaken, each lasting in the order of 1¼ hours. Respondents were drawn from a broad section of industry and included a number from the FTSE 350 list, several trade and professional associations, trade unions and public sector
26
organisations. They also represented a broad range of sectors including manufacturing, catering, retail, distribution, nuclear, rail and service sectors. Those from the public sector included the emergency services, local authorities and health care.
Discussions were held with:
• 13 trade associations;
• Two trade unions;
• One fire service and one police service;
• 16 large private sector firms spanning retail, catering, chemicals, rail, manufacturing, mining, distribution;
• One NHS trust;
• Two colleges, and;
• One public sector corporation and one local authority.
We then draw together the research review and exploratory discussions. The discussions are summarised in section 9, with conclusions drawn out below.
2.2 CONCLUSIONS FROM RESEARCH AND DISCUSSIONS
2.2.1 Networking, partnering and amplifying impact of the HSE
There is significant scope for a higher level of promotion of incidents and enforcement events for the purpose of propagating the impact of incidents and enforcement to other organisations. It is also apparent that there is significant scope for improving the extent of networking about health and safety, and that such networking would be influential. Many respondents felt that they have to look for such information and that they would prefer the news to be more sector specific. Within this, it is important that the news is sufficiently detailed for the reader to work out if the event applies to them, and for them to identify with the event.
In general, respondents felt that the HSE could raise the profile of incidents far more. In particular, it is thought that the HSE could and should:
• Advertise incidents more;
• Provide more sector specific news, and;
• Provide sufficient information for the reader to identify with the incident.
The role of Trade Associations as partners for the HSE
Trade associations provide a worthwhile channel for communication, although they are best for sector specific issues, and the value of working with associations is sector specific. In cases where there is a fear of infringing anti competition rules, trade associations are an essential vehicle for communication between organisations. It is clear that some associations are highly
27
and actively engaged in promoting health and safety, and that some associations are highly influential, such as the Chemical Industry Association. However, the effectiveness of trade associations, and the ability to disseminate news throughout a sector, varies according to the size and diversity of a sector.
Whilst working with Trade Associations would extend the reach of the HSE, associations tend to be skewed towards the relatively larger end of SMEs. Trade Associations are skewed towards the relatively larger SMEs and those with larger turnovers. They tend to represent the minority of SMEs, who account for the majority of turnover. This has the implication that the reach of trade associations, whilst significant, has its limits. Micro SMEs, independent owner managed firms and sole proprietorships are less likely to be represented.
The level of interest in networking depends in part of the perceived importance of health and safety, which in turn is influenced by the occurrence of events, such as fatalities and poor image.
It is possible that there are two or three associations representing a single trade. Hence it may be necessary to work with a variety of associations, and hence incur more liaison than if there was a single association.
In sectors that are predominated by large organisations, the associations tend to have a higher degree of representation, thereby easing the task of reaching employers.
Whilst there is a high degree of homogeneity in some sectors, such as craft bakers, other sectors and hence the members of trade associations, are more diverse, even within a sub-sector such as woodworking. For example, whilst some firms may simply supply storage equipment, others may erect it. This means that the idea of communicating a relatively discrete body of information to a narrowly based set of firms is not always true.
Whilst some sectors are very tight knit, others are far more diverse. For example, the small exhibition contractors, cement and dairy processing sectors are tight knit, whilst sectors such as hospitality, NHS and pubs are far more diverse. This has the implication that the degree of networking, and hence the potential to communicate via a network, varies between sectors. In some cases the work of members is considered so diverse that it is meaningless to, for example, share accident statistics.
It is apparent that the degree of networking also varies between sectors, with for example a high degree of networking in chemicals and railways.
It is also apparent that many trade associations tend to focus in on the sector specific health and safety issues, such as assault in the case of retail and contractors in the case of storage distribution. In many cases initiatives are prompted by a specific event(s) such as a series of deaths, concerns about the standard of management in a sector, poor image or HSE pressure. However, it is also apparent that some associations start up health and safety work for no single specific reason.
Small and low risk sectors network less than large higher risk sectors.
There is some suggestion that skill based trades are more likely to network than knowledge based trades. This may be because skill based sectors feel they have a management deficit to
28
fill, whilst knowledge based trades do not recognise a deficit in management. Hence, trade associations may have a greater role to fulfil in skill-based sectors.
The subject of networking is risk based. Associations and their members focus on what they regard to be their greatest risks, particularly sector specific issues. This can lead to a position where a sector focuses on one type of risk, such as food safety or aircraft safety, to a far greater extent than generic health and safety issues. Whilst this, in our opinion, provides an effective channel to communicate on sector specific issues, it may be a less effective channel for generic health and safety issues.
On balance, it is concluded that there are many opportunities for working with, and via, trade associations, although this does vary by sector and association. The factors that appear to impact the degree of networking of sectors include:
• The number of organisations in a sector – with more potential for networking in smaller sectors;
• The size of firms – with easier networking amongst larger organisations;
• The nature of the business – with less networking amongst more transient trades;
• Homogeneity of the work – with easier networking amongst firms that are alike;
• Perception of the trade association – is it perceived to be active, effective and authoritative?
• Culture of openness – is there a fear of loss of competitive advantage?
• Perception of importance of health and safety – are there substantive matters for the sector to network upon?
Trade unions
Trade unions are, due to their active interest and resources, able and willing to act as an initiator of health and safety improvements in firms. This confirms the findings other research projects.
2.2.2 Drivers for health and safety
The list of drivers remains largely unchanged from previous research, namely enforcement/regulation, reputational risk and the moral case, financial incentives and supply chain pressures. However, it is apparent that:
• The financial incentive provided by insurance premiums has grown, and;
• The fear of enforcement is intertwined with the fear of reputational damage as well as business disruption.
As organisations view safety as encompassing fire, food and occupational health and safety, this leads them to prioritise across these risks. In many cases fire and food safety are ranked higher due to the perceived magnitude of their impact on the business.
29
There is also evidence that the moral case remains a driver, especially in SMEs where you may know or be related to your colleagues. In larger firms the moral case is expressed in terms of societal values.
It is also clear that understanding and awareness remain key precursors.
To some extent the fear of enforcement and the fear of reputational damage are one and the same. This fear emanates from the potential loss of business and loss of brand image. This, in part, explains the differing results of some previous studies, where some point towards regulations or enforcement as a key driver, whilst others point towards reputational risk as a key driver. It is possible that the difference in findings reflect a difference in the questions asked.
The importance of reputation and the perceived risk of reputational damage are influenced by:
• Are you a high street name?
• The severity of the risk and prospect of enforcement.
• Do you have long term relationships with clients?
• Do customers demand or expect good health and safety?
i.e. is health and safety an important business risk?
Enforcement also remains a key driver. However, whilst organisations are prompted by the prospect of enforcement, the perception of the low likelihood of enforcement mutes this driver, especially in ‘low risk’ sectors. On the other hand, some sectors and individual firms remain enforcement driven, and require active enforcement to prompt improvement, including the NHS. In this respect, regulations are a driver. The influence of regulations is moderated by the perception of whether they are ‘applicable’ (i.e. do you have a significant risk) and are they effective, as well as awareness.
The impact and perception of enforcement varies depending on:
• Which risk is perceived to be the focus of enforcement (food, fire or occupational health and safety);
• The consistency and level of enforcement, and;
• The extent to which the enforcer is perceived as understanding the business.
It was noted with concern that the merger of HSE NIGs has reduced the level of sector specific discourse and that the new wider NIGs are too broad to talk about the needs of specific sub-sectors. This reflects the desire for sector specific, and hence more applicable, guidance from the HSE. Applicable and practical advice is required for enforcement to be seen as fair and reasonable.
It is also important to note that:
• Firms see health and safety as something that is enforced by the HSE, local authority EHOs, local authorities (public events), licensing of pubs etc;
30
• Blitzes are seen as a sign of under-resourcing and are regarded to be ineffective, as there is little risk of enforcement between blitzes;
• There is a disparity on perception of the HSE and local authorities, due to their different focuses;
• Risk based enforcement is seen as negative, as the HSE are seen not to be working with firms to prevent problems, but only taking an interest when something goes wrong, and;
• The impact of the HSE and local authorities is muted by the perception that contact is infrequent.
Respondents distinguish between the HSE and local authority enforcement officers in respect of health and safety. There is a perception that local authorities are less consistent in their enforcement practices and the level of enforcement. In addition, it is perceived that local authorities focus on food safety. This may explain some of the inconsistencies in the research on the impact of enforcement. That is, the impact of enforcement may be related to whether this refers to the HSE or local authority enforced sectors.
However, there is also a perception amongst some respondents that the HSE only appear after an incident or a complaint. This creates the impression that the HSE see health and safety to be a reactive and retributive area. (It is understood by the researchers that risk based inspection frequencies mean that the HSE will rarely visit lower risk premises. This appears to lead, inadvertently to the impression that the HSE are only interested when things go wrong. This was reinforced by the perception that the HSE do not provide positive feedback when an organisation has satisfied an improvement notice. Finally, as many organisations equate the risk of a fatality with a “high risk”, this leads to a perception that the level of enforcement is not proportionate to the risk in what are classed, due to their injury rates, as low risk sectors.
Also, respondents cited the practice of local authority officers providing advisory notices in respect of food safety prior to serving improvement notices. This was associated with the perception that EHOs are more helpful in enabling firms to improve safety in the first instance, whereas occupational health and safety proceeds quickly to enforcement.
2.2.3 Costs and benefits of health and safety
First, it is important to note that few respondents say that a business case is required for compliance with regulations. On the other hand, there remains a perception that health and safety remains a burden, especially in SMEs that cannot see the benefits.
It is clear that a business case is required for anything that goes beyond compliance. However, there is little evidence that organisations develop costed business cases, except larger companies.
2.2.4 Potential implications
The emerging findings from this stage of work included:
• HSE should explore and maximise working with trade associations and trade unions to develop and disseminate sector specific news, advice and support;
31
• There is a potential that risk based inspection is seen to be reactive and that the HSE is only interested when things go wrong;
• There is a potential that post accident enforcement reinforces the perception that HSE is only concerned with retribution and not about prevention;
• This combines with the perception that any fatal hazard is high risk, to create the view that the HSE do not help firms prevent key risks and that their work is not proportionate to the risk;
• There remains a need to ensure enforcement is consistent in level and content across HSE and local authority enforced sectors;
• The HSE approach to “advertising”, and hence magnifying the impact of enforcement and news of incidents, should be reviewed as this probably presents an opportunity for the HSE;
• HSE could make more use of insurance as a financial incentive;
• HSE should maximise the motivational role of reputational and supply chain drivers;
• The need for education, advice and support remains as great as ever.
32
3 POSTAL SURVEY
3.1 INTRODUCTION
Two different surveys were developed to assess what motivates organisations to comply with Health and Safety: one for employers, and; one for intermediaries. The questions have been designed to address the issues raised from the interviews and also from the literature review previously conducted. In essence, the content was the same apart from the addition of a separate section within the intermediary version, which was incorporated to establish their willingness to take a more active role. The rationale for using two different questionnaires was as follows:
• To identify what level intermediaries would be willing to participate / form partnerships / to provide health and safety advice;
• To establish if there are differences between employees and intermediaries opinions of potential new motivators, and;
• To establish if the perceptions differ between intermediaries and employees attitudes towards health and safety.
3.2 PILOTING
3.2.1 Overview
This stage of the work entailed two main tasks;
• The development and piloting of the two surveys amongst 20 different organisations. (16 employees and 4 intermediaries);
• Survey completion and administration to 14,682 organisations. (13,682 employees and 1,000 intermediaries).
3.2.2 Draft questionnaire
Employees version
The draft questionnaire was designed to cover the following;
• Organisational profile (size, sector, tenure, member of trade association or professional body etc);
• Personal profile of the person with overall responsibility for Health and Safety within the organisation (sex, qualifications, job title etc);
• Attitude towards Health and Safety;
33
• Perception of risk associated with health and safety;
• New incentives to motivate organisations to better comply with health and safety, and;
• A space for hand written comments.
Intermediary version
In essence, the intermediary version of the questionnaire is a replication of the employees’ version with the exception that intermediaries were asked to complete the survey on behalf of the organisations they work with. A further section was also added to establish their willingness to take a more active role on health and safety. The draft questionnaire was designed to cover the following:
• Organisational profile (size, sectors they work with, tenure, current level of activity and effectiveness on advising on health and safety);
• Personal profile of the person with overall responsibility for health and safety within the organisation (sex, qualifications);
• Perception of attitudes towards health and safety of the organisations they work with;
• Perception of risks associated with health and safety held by the organisations they work with;
• New incentives to motivate organisations to comply with health and safety, and;
• Their level of willingness to take a more active role in health and safety.
3.2.3 Pilot study
The questionnaires were piloted in two stages. The method used to conduct both stages of the piloting was a confidential postal survey. The rationale for using this method, rather than telephone, was to ensure that the piloting process replicated the actual survey as closely as possible. The only difference being that the respondents were contacted by telephone after completion to discuss their comments.
The initial drafts of the two versions (employers and intermediaries) were completed by twelve organisations from a variety of sectors. A total of ten employers and two intermediaries completed the initial draft. The sectors that they represented are listed below:
• Construction,
• Education,
• Transport,
• Manufacturing,
• Trade associations
34
• Independent consultancies
The pilot study was conducted to establish the following:
• The respondents comprehension of the questions;
• The length of time the questionnaire takes to complete (approximately 15 minutes);
• Whether the questionnaire addressed the key issues surrounding motivation to comply;
• Readiness to answer the questions in an honest manner;
• Ease of completion and practicality;
• Whether the content of the questions generated the information needed by this study;
• Comprehensiveness of the coding categories, and;
• Any other points raised by the respondents.
After the first stage of the piloting, the outcomes and comments were reviewed and edits were made to the questionnaires. The main comments related to the following:
• The length of time to complete (on average 20 minutes instead of 15 minutes);
• The amount of repetition within the question sets, and;
• All respondents agreed that all the key issues were addressed within the questionnaires.
As such, the questionnaires were amended to take these points into account, namely to shorten the questionnaires and to reword and condense questions that appeared repetitive.
The second and final stage of the piloting involved a further eight respondents completing the questionnaire by means of a confidential postal survey (6 employers and 2 intermediaries). The questionnaires remained largely unaltered after this stage, as no further comments were made concerning time or repetition.
The final versions of the questionnaires are shown in Appendix 10 and 11.
3.3 SAMPLE FRAME AND SIZE
A total of 13,682 questionnaires have been sent out to employers, and a total of 1,000 questionnaires have been sent out to intermediaries. The breakdown of the sampling structures is shown below.
Employees
The rationale was to achieve a sample frame that provided a representative sample across sectors and sizes of organisations. The sample was structured according to the following sub-divisions of sectors and small, medium and large firms;
• Agriculture
35
• Banking, finance, etc.
• Construction
• Manufacturing
• Hotel and Catering
• Education
• Health and social services
• Local Authority / regional government
• Other services
• Utilities
• Retail and repairs
• Telecommunications
• Transport
• Membership organisations
For the sample as a whole, the actual split between small, medium and large has taken account of the proportion of organisations in each sector. For example, the vast majority of agricultural firms are small. Accordingly, the agricultural sample would be predominantly small firms. In contrast, the vast majority of manufacturing firms are large. The sample would also be skewed to ensure that there is a ‘fair’ representation of low, medium and high risk sectors.
The structure of the survey sample for employers is shown in Table 4 (overleaf). Within these categories the sample has been drawn randomly from England, Scotland and Wales.
36
Table 4: Sample frame – as posted
SIZE
SECTOR Small (1-50 employees)
Medium (51 – 250 employees
Large (250+ employees)
Total
Agriculture 450 78 4 532
Banking, finance etc 88 15 168 271
Construction 1562 269 127 1958
Education 632 109 55 796
Health or social work 1114 205 490 1809
Hotels and catering 580 100 235 915
Local authority / regional government 225 39 158 422
Manufacturing 155 27 1631 1813
Other services (laundry, hairdressing, estate agents etc)
1232 212 203 1647
Utilities (gas, water, electricity) 64 2 151 217
Retail and repairs 848 146 406 1400
Telecommunications (post, phone) 405 126 80 611
Transport 642 105 474 1221
Membership organisations 23 23 24 70
Total 8020 1456 4206 13682
37
Intermediaries
The structure of the survey sample for intermediaries is shown in Table 5. Within these categories the sample has been drawn randomly from England, Scotland and Wales.
Table 5: Intermediary sample frame
TYPE OF INTERMEDIARY SAMPLE SIZE
Trade Associations 140
Higher Education 135
Rehabilitation / Occupational Health Services 35
Insurance Companies / Professional Bodies 34
NHS Plus 58
Business Link 91
Chamber of Commerce 62
Training Organisations 15
Institutes 29
Trade Unions 101
Consultancies 183
National Associations 117
Total 1000
38
4 ANALYSIS OF EMPLOYERS’ RESPONSES
4.1 INTRODUCTION
Employer’s responses to this questionnaire revealed complex interactions between several independent response categories, as expected from the questionnaire design. These categories can be broadly identified as:
1. Organisational attributes, i.e. Organisational size, trading age and sector, etc;
2. The attitudes of respondents, i.e. behavioural attitudes held towards health and safety;
3. The perceived Risks/Impacts of health and safety to an organisation;
4. Incident experience, deaths, compensation claims, improvement notices, prosecutions, and inspections;
5. New incentives for health and safety proposed by respondents.
An initial breakdown of respondents in each category was used to identify any important patterns in the types of responses given. This was followed by an attempt to identify significant relationships between categories and, given the inherent complexity of the interactions between them, this analysis was broken down into several sections using various multivariate techniques as detailed for each of the sections below.
4.2 PROFILE OF RESPONDENTS
The response rate for employers was 12.5% overall, i.e. 1746 respondents from 13,682. The response rate for each size of organisation is given in Table 6, along with the proportion of the overall sample that each size of respondent accounts for. Large (and very large organisations) account for 54% of respondents, which is close to the proportion of employees who work for large firms. Medium sized organisations are over-represented by about 8% whilst small firms are under-represented by about the same proportion, when compared with the proportion of employees working for each size of organisation. The responses from small and medium sized organisations are therefore consistent with the proportion of employees working in such organisations in the UK.
Table 6: Response rate by size of organisation
Size Number of respondents Response rate % of overall sample
Very large and large 941(449 plus 492) 22.4% 54%
Medium 346 24% 20%
Small and micro 432 (172 plus 260) 5.4% 25%
39
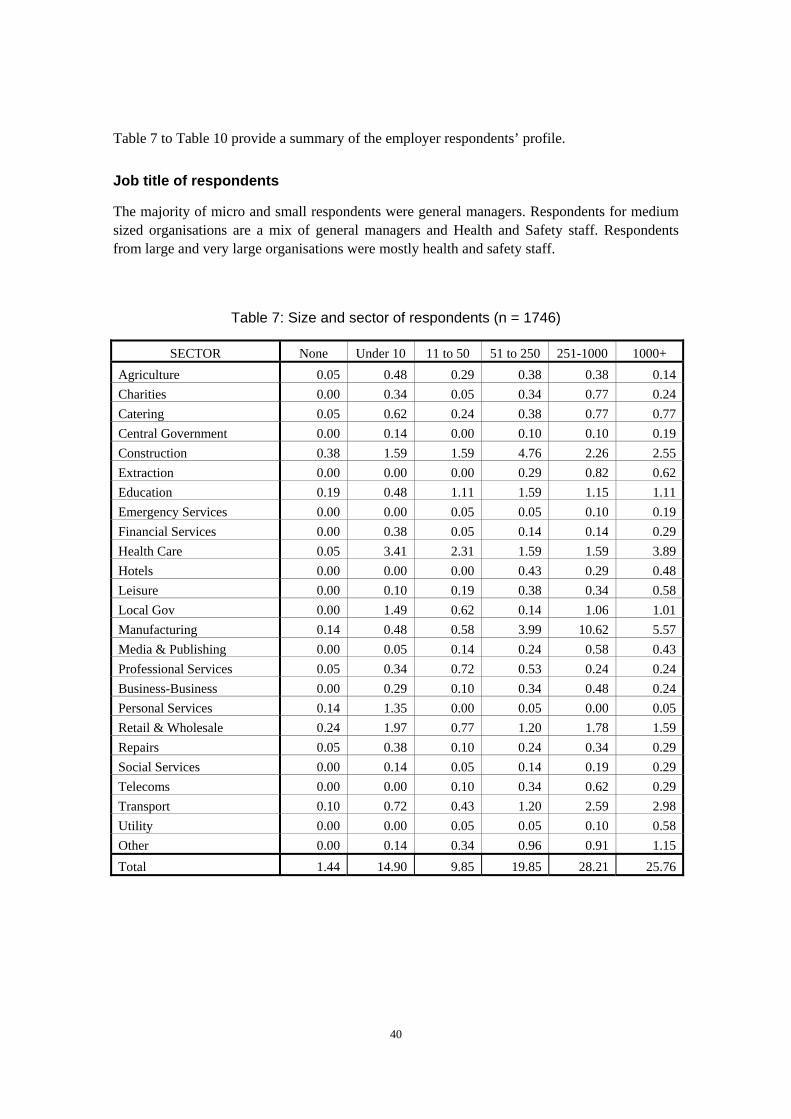
Table 7 to Table 10 provide a summary of the employer respondents’ profile.
Job title of respondents
The majority of micro and small respondents were general managers. Respondents for medium sized organisations are a mix of general managers and Health and Safety staff. Respondents from large and very large organisations were mostly health and safety staff.
Table 7: Size and sector of respondents (n = 1746)
SECTOR None Under 10 11 to 50 51 to 250 251-1000 1000+ Agriculture 0.05 0.48 0.29 0.38 0.38 0.14Charities 0.00 0.34 0.05 0.34 0.77 0.24Catering 0.05 0.62 0.24 0.38 0.77 0.77Central Government 0.00 0.14 0.00 0.10 0.10 0.19Construction 0.38 1.59 1.59 4.76 2.26 2.55Extraction 0.00 0.00 0.00 0.29 0.82 0.62Education 0.19 0.48 1.11 1.59 1.15 1.11Emergency Services 0.00 0.00 0.05 0.05 0.10 0.19Financial Services 0.00 0.38 0.05 0.14 0.14 0.29Health Care 0.05 3.41 2.31 1.59 1.59 3.89Hotels 0.00 0.00 0.00 0.43 0.29 0.48Leisure 0.00 0.10 0.19 0.38 0.34 0.58Local Gov 0.00 1.49 0.62 0.14 1.06 1.01Manufacturing 0.14 0.48 0.58 3.99 10.62 5.57Media & Publishing 0.00 0.05 0.14 0.24 0.58 0.43Professional Services 0.05 0.34 0.72 0.53 0.24 0.24Business-Business 0.00 0.29 0.10 0.34 0.48 0.24Personal Services 0.14 1.35 0.00 0.05 0.00 0.05Retail & Wholesale 0.24 1.97 0.77 1.20 1.78 1.59Repairs 0.05 0.38 0.10 0.24 0.34 0.29Social Services 0.00 0.14 0.05 0.14 0.19 0.29Telecoms 0.00 0.00 0.10 0.34 0.62 0.29Transport 0.10 0.72 0.43 1.20 2.59 2.98Utility 0.00 0.00 0.05 0.05 0.10 0.58Other 0.00 0.14 0.34 0.96 0.91 1.15Total 1.44 14.90 9.85 19.85 28.21 25.76
40
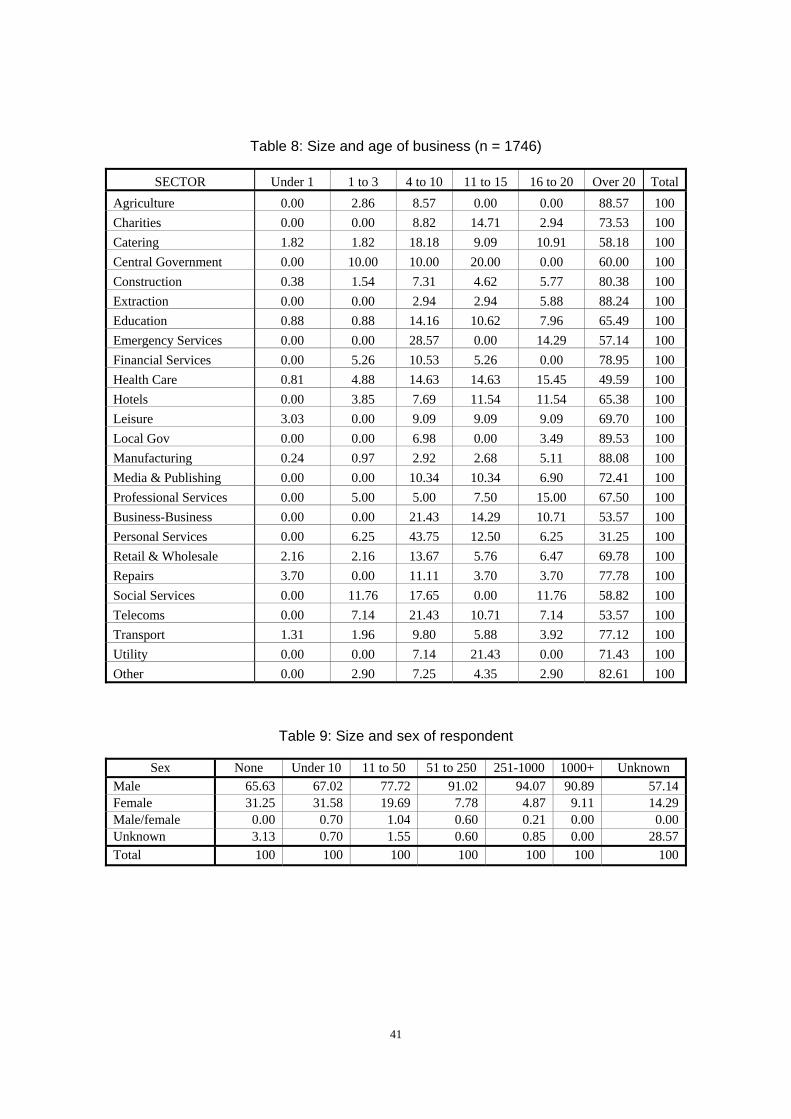
Table 8: Size and age of business (n = 1746)
SECTOR Under 1 1 to 3 4 to 10 11 to 15 16 to 20 Over 20 TotalAgriculture 0.00 2.86 8.57 0.00 0.00 88.57 100 Charities 0.00 0.00 8.82 14.71 2.94 73.53 100 Catering 1.82 1.82 18.18 9.09 10.91 58.18 100 Central Government 0.00 10.00 10.00 20.00 0.00 60.00 100 Construction 0.38 1.54 7.31 4.62 5.77 80.38 100 Extraction 0.00 0.00 2.94 2.94 5.88 88.24 100 Education 0.88 0.88 14.16 10.62 7.96 65.49 100 Emergency Services 0.00 0.00 28.57 0.00 14.29 57.14 100 Financial Services 0.00 5.26 10.53 5.26 0.00 78.95 100 Health Care 0.81 4.88 14.63 14.63 15.45 49.59 100 Hotels 0.00 3.85 7.69 11.54 11.54 65.38 100 Leisure 3.03 0.00 9.09 9.09 9.09 69.70 100 Local Gov 0.00 0.00 6.98 0.00 3.49 89.53 100 Manufacturing 0.24 0.97 2.92 2.68 5.11 88.08 100 Media & Publishing 0.00 0.00 10.34 10.34 6.90 72.41 100 Professional Services 0.00 5.00 5.00 7.50 15.00 67.50 100 Business-Business 0.00 0.00 21.43 14.29 10.71 53.57 100 Personal Services 0.00 6.25 43.75 12.50 6.25 31.25 100 Retail & Wholesale 2.16 2.16 13.67 5.76 6.47 69.78 100 Repairs 3.70 0.00 11.11 3.70 3.70 77.78 100 Social Services 0.00 11.76 17.65 0.00 11.76 58.82 100 Telecoms 0.00 7.14 21.43 10.71 7.14 53.57 100 Transport 1.31 1.96 9.80 5.88 3.92 77.12 100 Utility 0.00 0.00 7.14 21.43 0.00 71.43 100 Other 0.00 2.90 7.25 4.35 2.90 82.61 100
Table 9: Size and sex of respondent
Sex None Under 10 11 to 50 51 to 250 251-1000 1000+ Unknown Male 65.63 67.02 77.72 91.02 94.07 90.89 57.14Female 31.25 31.58 19.69 7.78 4.87 9.11 14.29Male/female 0.00 0.70 1.04 0.60 0.21 0.00 0.00Unknown 3.13 0.70 1.55 0.60 0.85 0.00 28.57Total 100 100 100 100 100 100 100
41
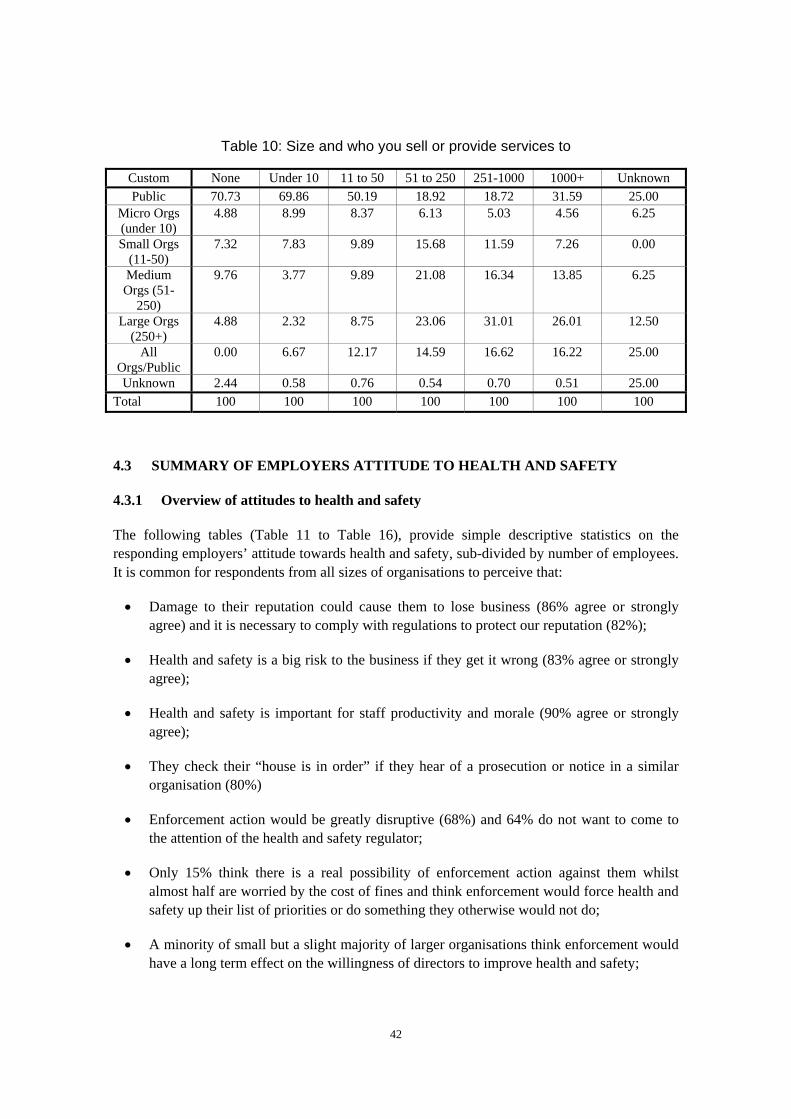
Table 10: Size and who you sell or provide services to
Custom None Under 10 11 to 50 51 to 250 251-1000 1000+ Unknown Public 70.73 69.86 50.19 18.92 18.72 31.59 25.00
Micro Orgs (under 10)
4.88 8.99 8.37 6.13 5.03 4.56 6.25
Small Orgs (11-50)
7.32 7.83 9.89 15.68 11.59 7.26 0.00
Medium Orgs (51-
250)
9.76 3.77 9.89 21.08 16.34 13.85 6.25
Large Orgs (250+)
4.88 2.32 8.75 23.06 31.01 26.01 12.50
All Orgs/Public
0.00 6.67 12.17 14.59 16.62 16.22 25.00
Unknown 2.44 0.58 0.76 0.54 0.70 0.51 25.00 Total 100 100 100 100 100 100 100
4.3 SUMMARY OF EMPLOYERS ATTITUDE TO HEALTH AND SAFETY
4.3.1 Overview of attitudes to health and safety
The following tables (Table 11 to Table 16), provide simple descriptive statistics on the responding employers’ attitude towards health and safety, sub-divided by number of employees. It is common for respondents from all sizes of organisations to perceive that:
• Damage to their reputation could cause them to lose business (86% agree or strongly agree) and it is necessary to comply with regulations to protect our reputation (82%);
• Health and safety is a big risk to the business if they get it wrong (83% agree or strongly agree);
• Health and safety is important for staff productivity and morale (90% agree or strongly agree);
• They check their “house is in order” if they hear of a prosecution or notice in a similar organisation (80%)
• Enforcement action would be greatly disruptive (68%) and 64% do not want to come to the attention of the health and safety regulator;
• Only 15% think there is a real possibility of enforcement action against them whilst almost half are worried by the cost of fines and think enforcement would force health and safety up their list of priorities or do something they otherwise would not do;
• A minority of small but a slight majority of larger organisations think enforcement would have a long term effect on the willingness of directors to improve health and safety;
42
• There is a split opinion on whether they are more likely to act on advice from the regulator because they have enforcement power (45%);
• They are as good at health and safety as most organisations in their sector (82%);
• Very few (12%) organisations always require a fully costed business plan to make health and safety improvements;
• Only 22% consider the costs and benefits of health and safety to wider society, such as the burden on the NHS and state benefits, and;
• Regard any workplace that could have a fatal accident as ‘high risk’, even if the chance is low (67%).
A number of the attitudinal questions were asked to see if they would help discriminate between organisations. It is apparent that most organisations believe they operate in a highly competitive area of business (86%) and that a slight majority believe that there are lots of organisations that do the same type of work as them (54%). It appears unlikely that you can discriminate between organisations according to their perception of the competitiveness of their sector, as all sectors are regarded as competitive.
4.3.2 Differences in attitudes between small and larger organisations
It is also clear that the attitude of respondents varies by organisation size. As the number of employees increases from micro to very large there is a tendency for the organisation to report the attitudes that we would believe would better predispose them to health and safety.
Larger organisations are:
More networked
Larger organisations are more likely to hear about health and safety incidents (such as prosecutions and accidents), are more likely to network with other organisations and are more familiar with the HSE’s Offenders’ Database.
More driven by insurance
Larger organisations believe that employers’ liability costs them a lot and that their insurers both take account of their health and safety performance when setting premiums as well as seeking evidence of health and safety compliance.
Pressured by customers, wishing to be industry leaders and demanding of their suppliers
Larger organisations are more likely to be pressured by customers (39% of micro vs 61% of very large) to be good at health and safety, are more likely to aim to be industry leaders in health and safety (29% of micro vs 70% of very large) and are more likely to place demands on their suppliers (40% of micro vs 84% of very large).
43
Perceive health and safety to be a critical risk and not as a burden
Larger organisations are more likely to report that their directors think that health and safety is a critical business success factor and are less likely to regard health and safety regulations as a burden.
Have more health and safety expertise, but perceive they have fewer significant risks
Larger organisations are less likely to report a lack of health and safety expertise, but also state they have only a few significant hazards.
Understand health and safety penalties, and have a good relationship with the HSE/EHOs
Larger organisations are more likely to report they understand health and safety penalties and that they both have a good relationship with the HSE/EHOs and get good advice from them.
Enforcement has a longer-term impact
Larger organisations are more likely to report that enforcement would have a long term impact on their willingness to improve health and safety, rising from 41% of micro to 52% of very large organisations.
A brand name
Larger organisations are far more likely to report having a well-known brand name
44
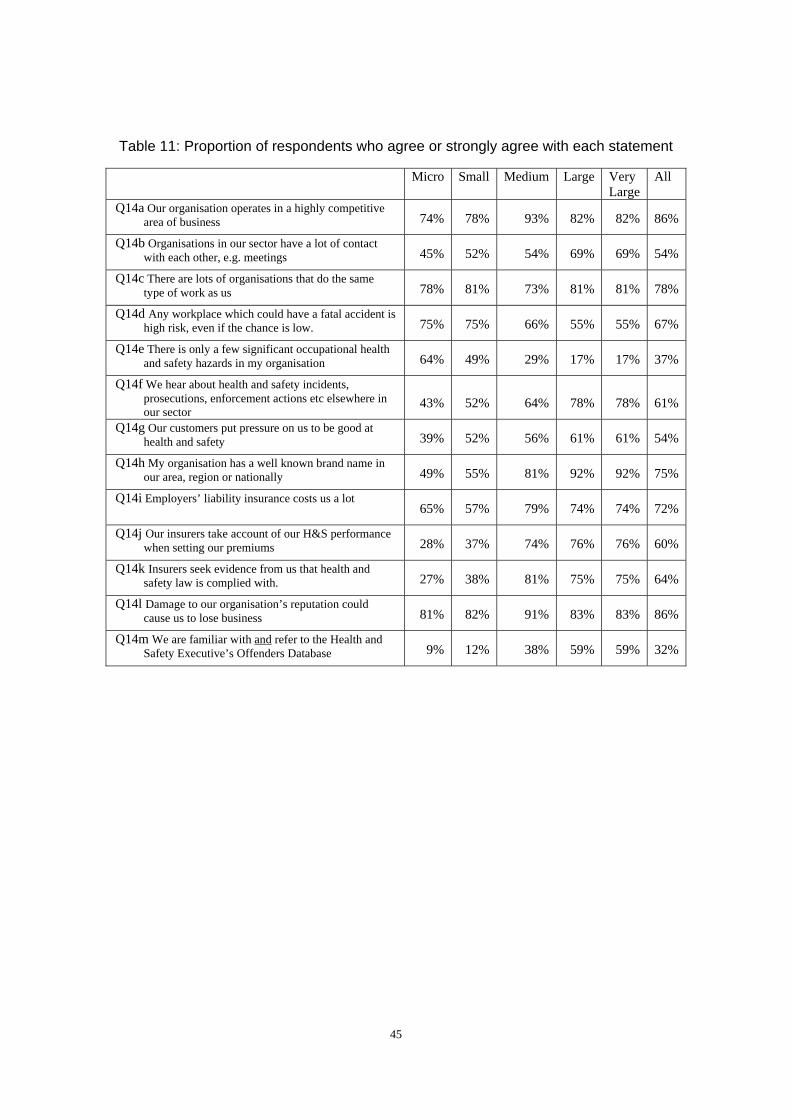
Table 11: Proportion of respondents who agree or strongly agree with each statement
Micro Small Medium Large Very Large
All
Q14a Our organisation operates in a highly competitive area of business 74% 78% 93% 82% 82% 86%
Q14b Organisations in our sector have a lot of contact with each other, e.g. meetings 45% 52% 54% 69% 69% 54%
Q14c There are lots of organisations that do the same type of work as us 78% 81% 73% 81% 81% 78%
Q14d Any workplace which could have a fatal accident is high risk, even if the chance is low. 75% 75% 66% 55% 55% 67%
Q14e There is only a few significant occupational health and safety hazards in my organisation 64% 49% 29% 17% 17% 37%
Q14f We hear about health and safety incidents, prosecutions, enforcement actions etc elsewhere in our sector 43% 52% 64% 78% 78% 61%
Q14g Our customers put pressure on us to be good at health and safety 39% 52% 56% 61% 61% 54%
Q14h My organisation has a well known brand name in our area, region or nationally 49% 55% 81% 92% 92% 75%
Q14i Employers’ liability insurance costs us a lot 65% 57% 79% 74% 74% 72%
Q14j Our insurers take account of our H&S performance when setting our premiums 28% 37% 74% 76% 76% 60%
Q14k Insurers seek evidence from us that health and safety law is complied with. 27% 38% 81% 75% 75% 64%
Q14l Damage to our organisation’s reputation could cause us to lose business 81% 82% 91% 83% 83% 86%
Q14m We are familiar with and refer to the Health and Safety Executive’s Offenders Database 9% 12% 38% 59% 59% 32%
45
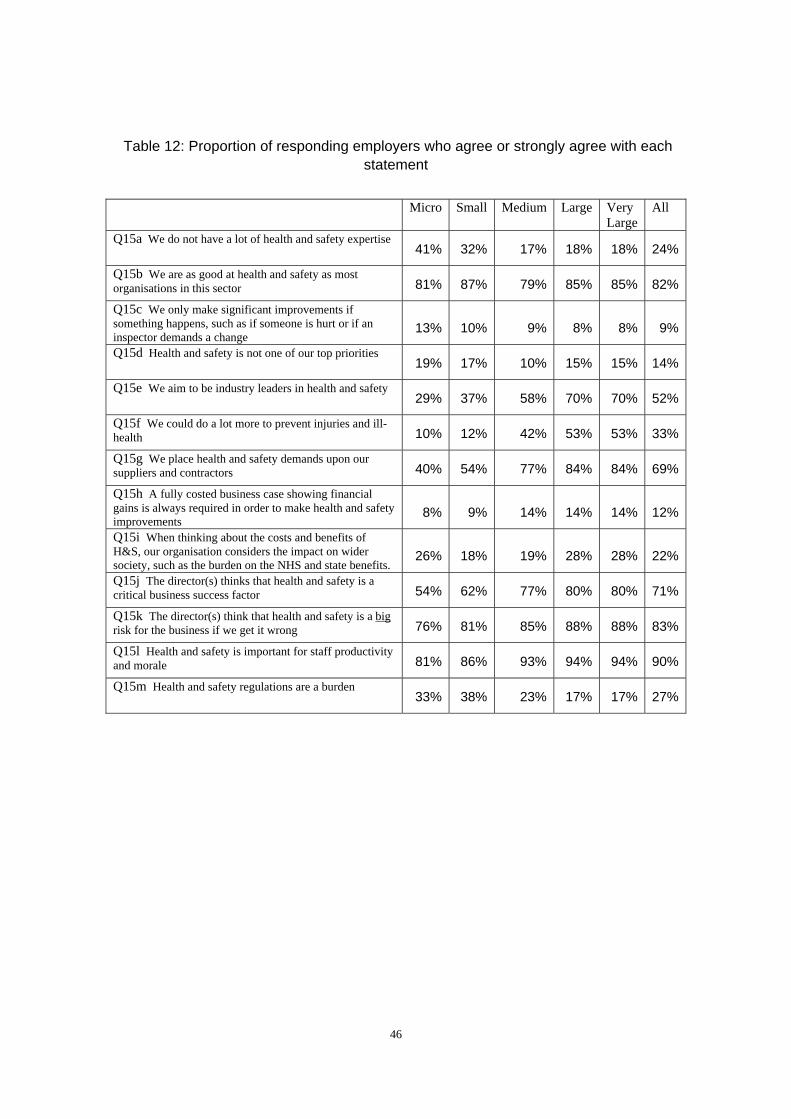
Table 12: Proportion of responding employers who agree or strongly agree with each statement
Micro Small Medium Large Very Large
All
Q15a We do not have a lot of health and safety expertise 41% 32% 17% 18% 18% 24%
Q15b We are as good at health and safety as most organisations in this sector 81% 87% 79% 85% 85% 82%
Q15c We only make significant improvements if something happens, such as if someone is hurt or if an inspector demands a change 13% 10% 9% 8% 8% 9%
Q15d Health and safety is not one of our top priorities 19% 17% 10% 15% 15% 14%
Q15e We aim to be industry leaders in health and safety 29% 37% 58% 70% 70% 52%
Q15f We could do a lot more to prevent injuries and ill-health 10% 12% 42% 53% 53% 33%
Q15g We place health and safety demands upon our suppliers and contractors 40% 54% 77% 84% 84% 69%
Q15h A fully costed business case showing financial gains is always required in order to make health and safety improvements 8% 9% 14% 14% 14% 12%
Q15i When thinking about the costs and benefits of H&S, our organisation considers the impact on wider society, such as the burden on the NHS and state benefits. 26% 18% 19% 28% 28% 22%
Q15j The director(s) thinks that health and safety is a critical business success factor 54% 62% 77% 80% 80% 71%
Q15k The director(s) think that health and safety is a big risk for the business if we get it wrong 76% 81% 85% 88% 88% 83%
Q15l Health and safety is important for staff productivity and morale 81% 86% 93% 94% 94% 90%
Q15m Health and safety regulations are a burden 33% 38% 23% 17% 17% 27%
46
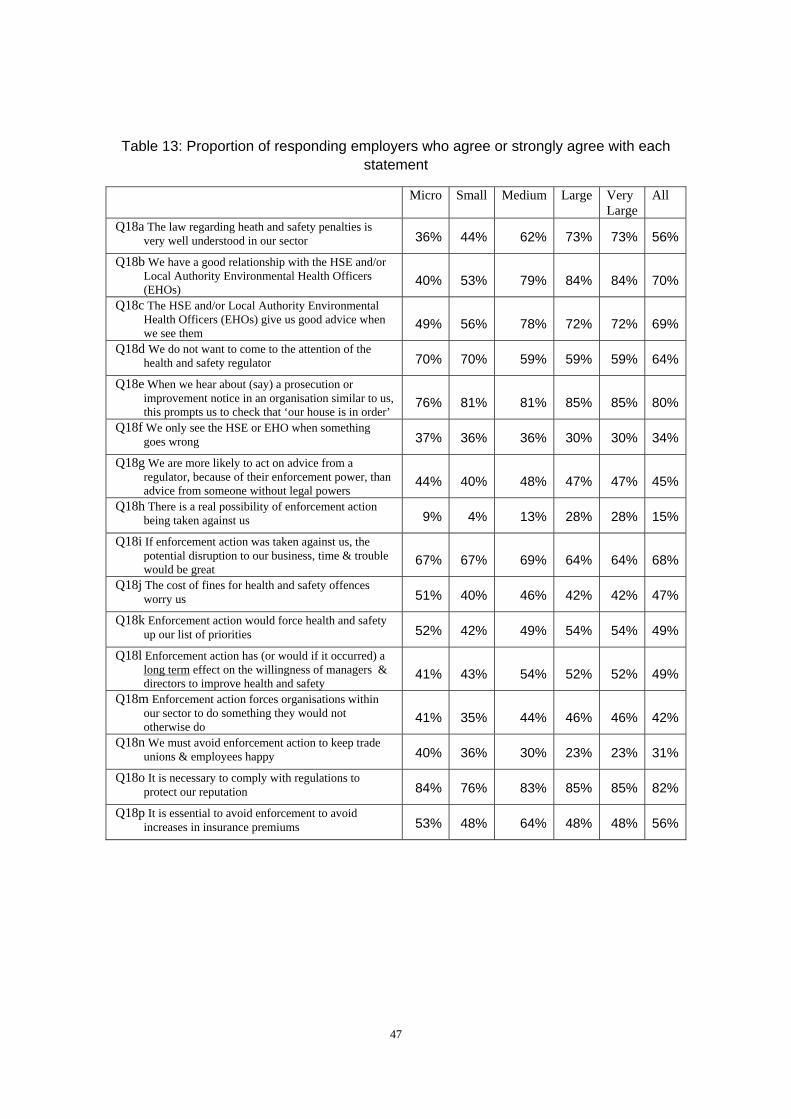
Table 13: Proportion of responding employers who agree or strongly agree with each statement
Micro Small Medium Large Very Large
All
Q18a The law regarding heath and safety penalties is very well understood in our sector 36% 44% 62% 73% 73% 56%
Q18b We have a good relationship with the HSE and/or Local Authority Environmental Health Officers (EHOs) 40% 53% 79% 84% 84% 70%
Q18c The HSE and/or Local Authority Environmental Health Officers (EHOs) give us good advice when we see them 49% 56% 78% 72% 72% 69%
Q18d We do not want to come to the attention of the health and safety regulator 70% 70% 59% 59% 59% 64%
Q18e When we hear about (say) a prosecution or improvement notice in an organisation similar to us, this prompts us to check that ‘our house is in order’ 76% 81% 81% 85% 85% 80%
Q18f We only see the HSE or EHO when something goes wrong 37% 36% 36% 30% 30% 34%
Q18g We are more likely to act on advice from a regulator, because of their enforcement power, than advice from someone without legal powers 44% 40% 48% 47% 47% 45%
Q18h There is a real possibility of enforcement action being taken against us 9% 4% 13% 28% 28% 15%
Q18i If enforcement action was taken against us, the potential disruption to our business, time & trouble would be great
67% 67% 69% 64% 64% 68%
Q18j The cost of fines for health and safety offences worry us 51% 40% 46% 42% 42% 47%
Q18k Enforcement action would force health and safety up our list of priorities 52% 42% 49% 54% 54% 49%
Q18l Enforcement action has (or would if it occurred) a long term effect on the willingness of managers & directors to improve health and safety 41% 43% 54% 52% 52% 49%
Q18m Enforcement action forces organisations within our sector to do something they would not otherwise do 41% 35% 44% 46% 46% 42%
Q18n We must avoid enforcement action to keep trade unions & employees happy 40% 36% 30% 23% 23% 31%
Q18o It is necessary to comply with regulations to protect our reputation 84% 76% 83% 85% 85% 82%
Q18p It is essential to avoid enforcement to avoid increases in insurance premiums 53% 48% 64% 48% 48% 56%
47
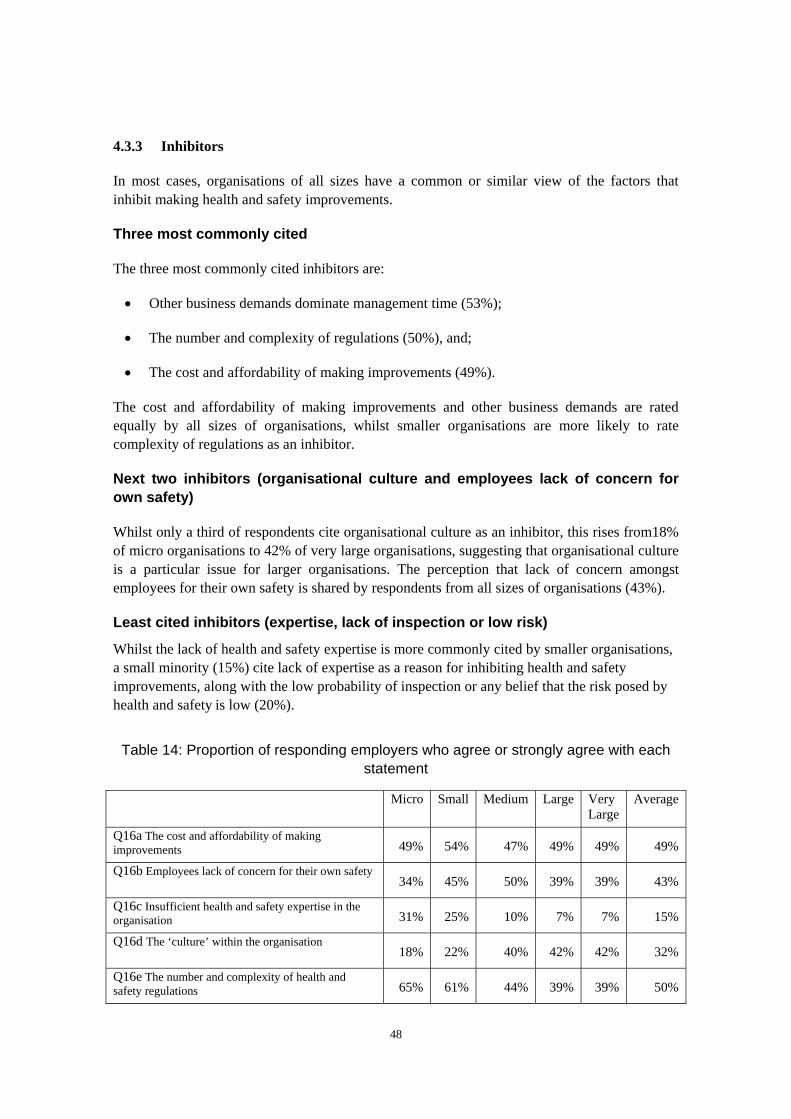
4.3.3 Inhibitors
In most cases, organisations of all sizes have a common or similar view of the factors that inhibit making health and safety improvements.
Three most commonly cited
The three most commonly cited inhibitors are:
• Other business demands dominate management time (53%);
• The number and complexity of regulations (50%), and;
• The cost and affordability of making improvements (49%).
The cost and affordability of making improvements and other business demands are rated equally by all sizes of organisations, whilst smaller organisations are more likely to rate complexity of regulations as an inhibitor.
Next two inhibitors (organisational culture and employees lack of concern for own safety)
Whilst only a third of respondents cite organisational culture as an inhibitor, this rises from18% of micro organisations to 42% of very large organisations, suggesting that organisational culture is a particular issue for larger organisations. The perception that lack of concern amongst employees for their own safety is shared by respondents from all sizes of organisations (43%).
Least cited inhibitors (expertise, lack of inspection or low risk)
Whilst the lack of health and safety expertise is more commonly cited by smaller organisations, a small minority (15%) cite lack of expertise as a reason for inhibiting health and safety improvements, along with the low probability of inspection or any belief that the risk posed by health and safety is low (20%).
Table 14: Proportion of responding employers who agree or strongly agree with each statement
Micro Small Medium Large Very Large
Average
Q16a The cost and affordability of making improvements 49% 54% 47% 49% 49% 49%
Q16b Employees lack of concern for their own safety 34% 45% 50% 39% 39% 43%
Q16c Insufficient health and safety expertise in the organisation 31% 25% 10% 7% 7% 15%
Q16d The ‘culture’ within the organisation 18% 22% 40% 42% 42% 32%
Q16e The number and complexity of health and safety regulations 65% 61% 44% 39% 39% 50%
48
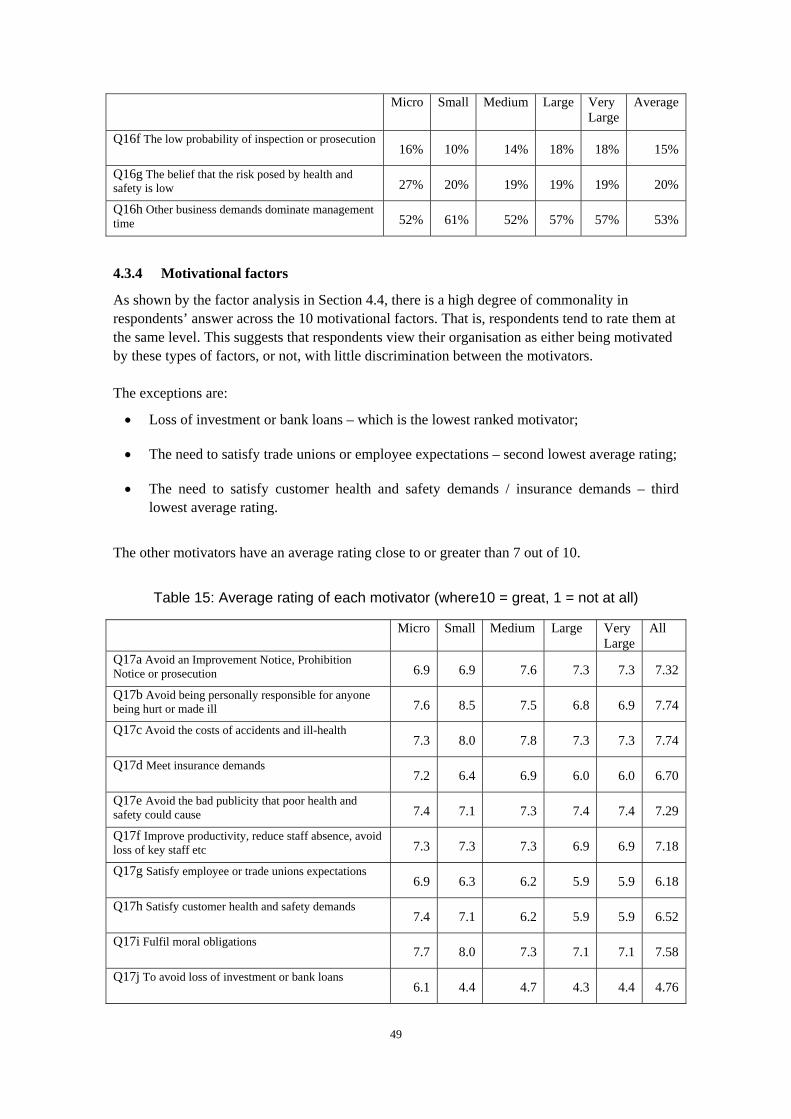
Micro Small Medium Large Very Large
Average
Q16f The low probability of inspection or prosecution 16% 10% 14% 18% 18% 15%
Q16g The belief that the risk posed by health and safety is low 27% 20% 19% 19% 19% 20%
Q16h Other business demands dominate management time 52% 61% 52% 57% 57% 53%
4.3.4 Motivational factors
As shown by the factor analysis in Section 4.4, there is a high degree of commonality in respondents’ answer across the 10 motivational factors. That is, respondents tend to rate them at the same level. This suggests that respondents view their organisation as either being motivated by these types of factors, or not, with little discrimination between the motivators. The exceptions are:
• Loss of investment or bank loans – which is the lowest ranked motivator;
• The need to satisfy trade unions or employee expectations – second lowest average rating;
• The need to satisfy customer health and safety demands / insurance demands – third lowest average rating.
The other motivators have an average rating close to or greater than 7 out of 10.
Table 15: Average rating of each motivator (where10 = great, 1 = not at all)
Micro Small Medium Large Very Large
All
Q17a Avoid an Improvement Notice, Prohibition Notice or prosecution 6.9 6.9 7.6 7.3 7.3 7.32
Q17b Avoid being personally responsible for anyone being hurt or made ill 7.6 8.5 7.5 6.8 6.9 7.74
Q17c Avoid the costs of accidents and ill-health 7.3 8.0 7.8 7.3 7.3 7.74
Q17d Meet insurance demands 7.2 6.4 6.9 6.0 6.0 6.70
Q17e Avoid the bad publicity that poor health and safety could cause 7.4 7.1 7.3 7.4 7.4 7.29
Q17f Improve productivity, reduce staff absence, avoid loss of key staff etc 7.3 7.3 7.3 6.9 6.9 7.18
Q17g Satisfy employee or trade unions expectations 6.9 6.3 6.2 5.9 5.9 6.18
Q17h Satisfy customer health and safety demands 7.4 7.1 6.2 5.9 5.9 6.52
Q17i Fulfil moral obligations 7.7 8.0 7.3 7.1 7.1 7.58
Q17j To avoid loss of investment or bank loans 6.1 4.4 4.7 4.3 4.4 4.76
49
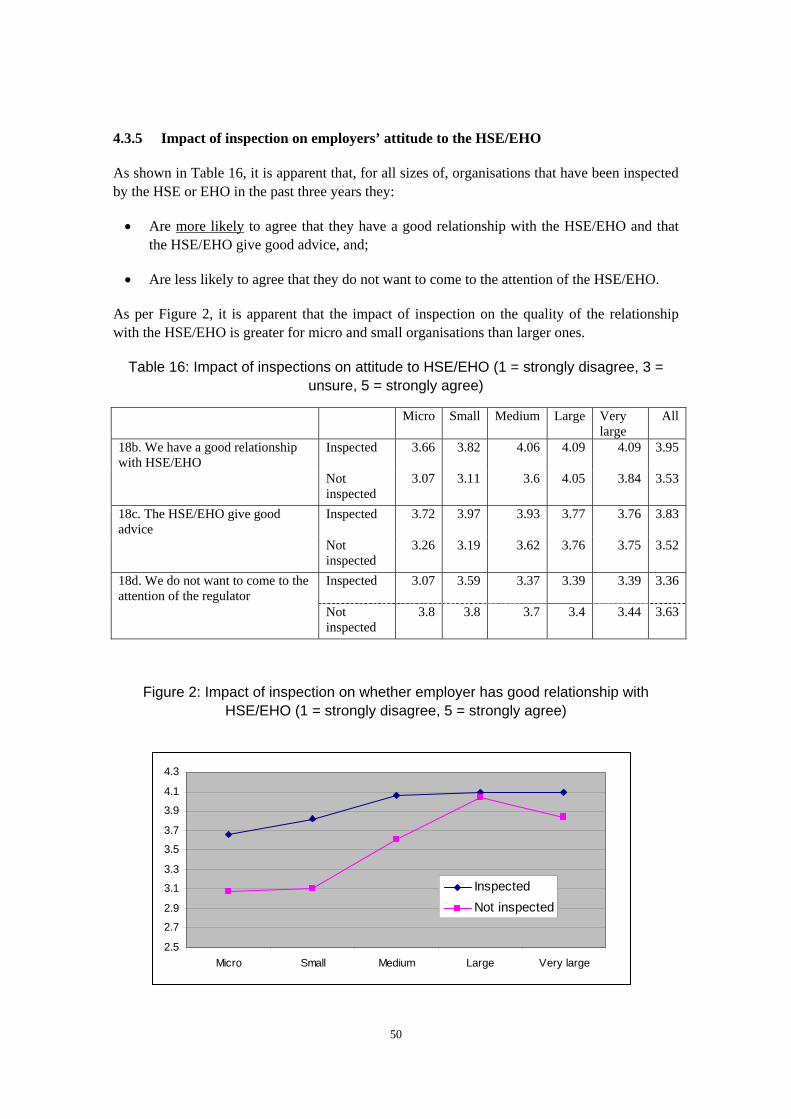
4.3.5 Impact of inspection on employers’ attitude to the HSE/EHO
As shown in Table 16, it is apparent that, for all sizes of, organisations that have been inspected by the HSE or EHO in the past three years they:
• Are more likely to agree that they have a good relationship with the HSE/EHO and that the HSE/EHO give good advice, and;
• Are less likely to agree that they do not want to come to the attention of the HSE/EHO.
As per Figure 2, it is apparent that the impact of inspection on the quality of the relationship with the HSE/EHO is greater for micro and small organisations than larger ones.
Table 16: Impact of inspections on attitude to HSE/EHO (1 = strongly disagree, 3 = unsure, 5 = strongly agree)
Micro Small Medium Large Very large
All
18b. We have a good relationship with HSE/EHO
Inspected 3.66 3.82 4.06 4.09 4.09 3.95
Not inspected
3.07 3.11 3.6 4.05 3.84 3.53
18c. The HSE/EHO give good advice
Inspected 3.72 3.97 3.93 3.77 3.76 3.83
Not inspected
3.26 3.19 3.62 3.76 3.75 3.52
18d. We do not want to come to the attention of the regulator
Inspected 3.07 3.59 3.37 3.39 3.39 3.36
Not inspected
3.8 3.8 3.7 3.4 3.44 3.63
Figure 2: Impact of inspection on whether employer has good relationship with HSE/EHO (1 = strongly disagree, 5 = strongly agree)
2.5
2.7
2.9
3.1
3.3
3.5
3.7
3.9
4.1
4.3
Micro Small Medium Large Very large
InspectedNot inspected
50
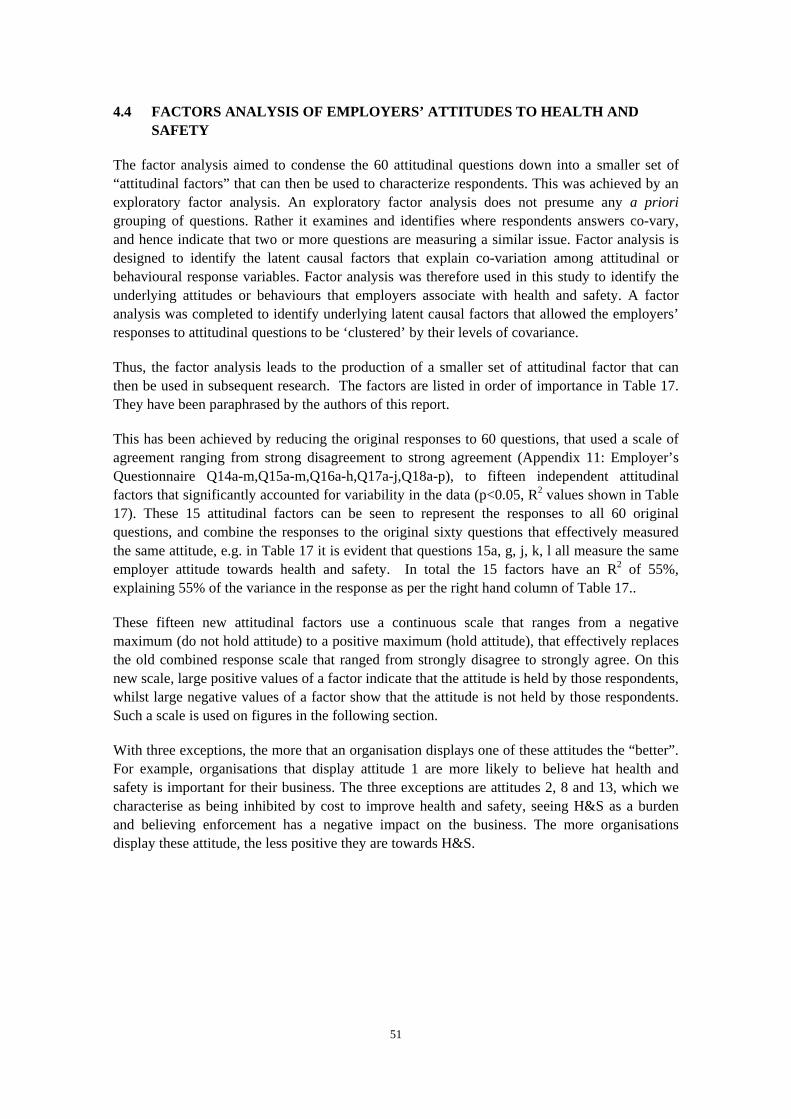
4.4 FACTORS ANALYSIS OF EMPLOYERS’ ATTITUDES TO HEALTH AND SAFETY
The factor analysis aimed to condense the 60 attitudinal questions down into a smaller set of “attitudinal factors” that can then be used to characterize respondents. This was achieved by an exploratory factor analysis. An exploratory factor analysis does not presume any a priori grouping of questions. Rather it examines and identifies where respondents answers co-vary, and hence indicate that two or more questions are measuring a similar issue. Factor analysis is designed to identify the latent causal factors that explain co-variation among attitudinal or behavioural response variables. Factor analysis was therefore used in this study to identify the underlying attitudes or behaviours that employers associate with health and safety. A factor analysis was completed to identify underlying latent causal factors that allowed the employers’ responses to attitudinal questions to be ‘clustered’ by their levels of covariance.
Thus, the factor analysis leads to the production of a smaller set of attitudinal factor that can then be used in subsequent research. The factors are listed in order of importance in Table 17. They have been paraphrased by the authors of this report.
This has been achieved by reducing the original responses to 60 questions, that used a scale of agreement ranging from strong disagreement to strong agreement (Appendix 11: Employer’s Questionnaire Q14a-m,Q15a-m,Q16a-h,Q17a-j,Q18a-p), to fifteen independent attitudinal factors that significantly accounted for variability in the data (p<0.05, R2 values shown in Table 17). These 15 attitudinal factors can be seen to represent the responses to all 60 original questions, and combine the responses to the original sixty questions that effectively measured the same attitude, e.g. in Table 17 it is evident that questions 15a, g, j, k, l all measure the same employer attitude towards health and safety. In total the 15 factors have an R2 of 55%, explaining 55% of the variance in the response as per the right hand column of Table 17..
These fifteen new attitudinal factors use a continuous scale that ranges from a negative maximum (do not hold attitude) to a positive maximum (hold attitude), that effectively replaces the old combined response scale that ranged from strongly disagree to strongly agree. On this new scale, large positive values of a factor indicate that the attitude is held by those respondents, whilst large negative values of a factor show that the attitude is not held by those respondents. Such a scale is used on figures in the following section.
With three exceptions, the more that an organisation displays one of these attitudes the “better”. For example, organisations that display attitude 1 are more likely to believe hat health and safety is important for their business. The three exceptions are attitudes 2, 8 and 13, which we characterise as being inhibited by cost to improve health and safety, seeing H&S as a burden and believing enforcement has a negative impact on the business. The more organisations display these attitude, the less positive they are towards H&S.
51
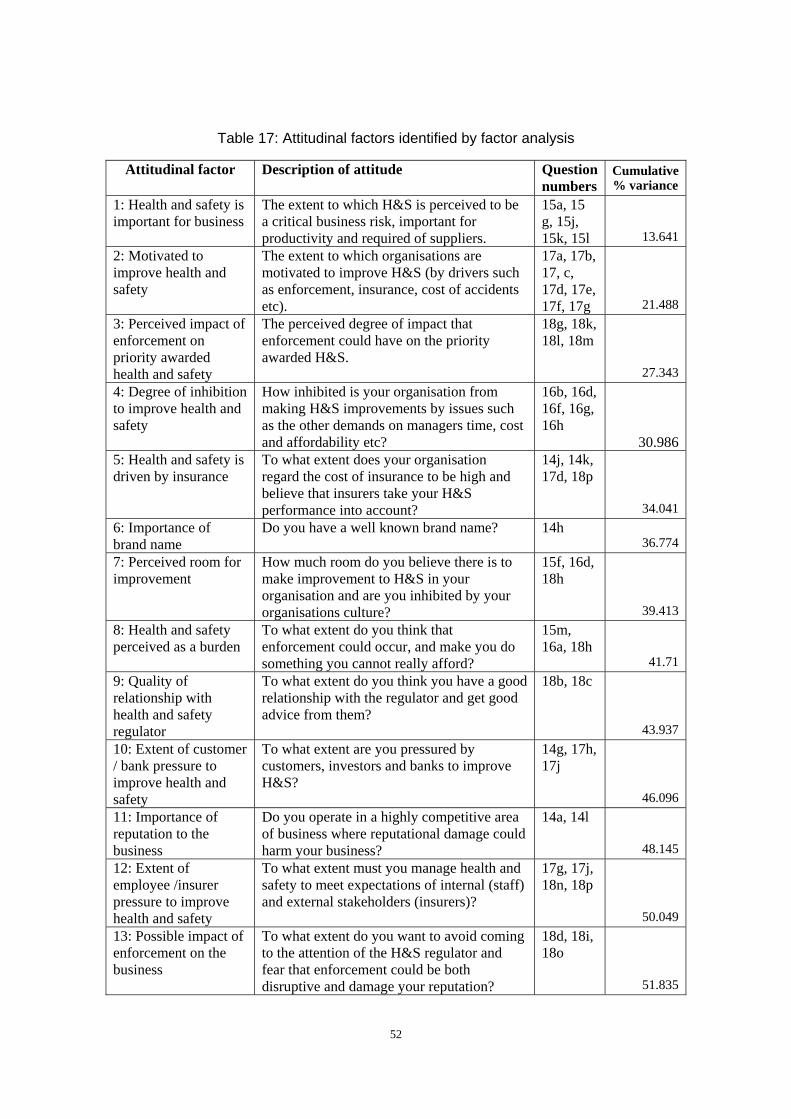
Table 17: Attitudinal factors identified by factor analysis
Attitudinal factor Description of attitude Question numbers
Cumulative % variance
1: Health and safety is important for business
The extent to which H&S is perceived to be a critical business risk, important for productivity and required of suppliers.
15a, 15 g, 15j, 15k, 15l 13.641
2: Motivated to improve health and safety
The extent to which organisations are motivated to improve H&S (by drivers such as enforcement, insurance, cost of accidents etc).
17a, 17b, 17, c, 17d, 17e, 17f, 17g 21.488
3: Perceived impact of enforcement on priority awarded health and safety
The perceived degree of impact that enforcement could have on the priority awarded H&S.
18g, 18k, 18l, 18m
27.343 4: Degree of inhibition to improve health and safety
How inhibited is your organisation from making H&S improvements by issues such as the other demands on managers time, cost and affordability etc?
16b, 16d, 16f, 16g, 16h
30.9865: Health and safety is driven by insurance
To what extent does your organisation regard the cost of insurance to be high and believe that insurers take your H&S performance into account?
14j, 14k, 17d, 18p
34.041 6: Importance of brand name
Do you have a well known brand name? 14h 36.774
7: Perceived room for improvement
How much room do you believe there is to make improvement to H&S in your organisation and are you inhibited by your organisations culture?
15f, 16d, 18h
39.413 8: Health and safety perceived as a burden
To what extent do you think that enforcement could occur, and make you do something you cannot really afford?
15m, 16a, 18h
41.71 9: Quality of relationship with health and safety regulator
To what extent do you think you have a good relationship with the regulator and get good advice from them?
18b, 18c
43.937 10: Extent of customer / bank pressure to improve health and safety
To what extent are you pressured by customers, investors and banks to improve H&S?
14g, 17h, 17j
46.096 11: Importance of reputation to the business
Do you operate in a highly competitive area of business where reputational damage could harm your business?
14a, 14l
48.145 12: Extent of employee /insurer pressure to improve health and safety
To what extent must you manage health and safety to meet expectations of internal (staff) and external stakeholders (insurers)?
17g, 17j, 18n, 18p
50.049 13: Possible impact of enforcement on the business
To what extent do you want to avoid coming to the attention of the H&S regulator and fear that enforcement could be both disruptive and damage your reputation?
18d, 18i, 18o
51.835
52
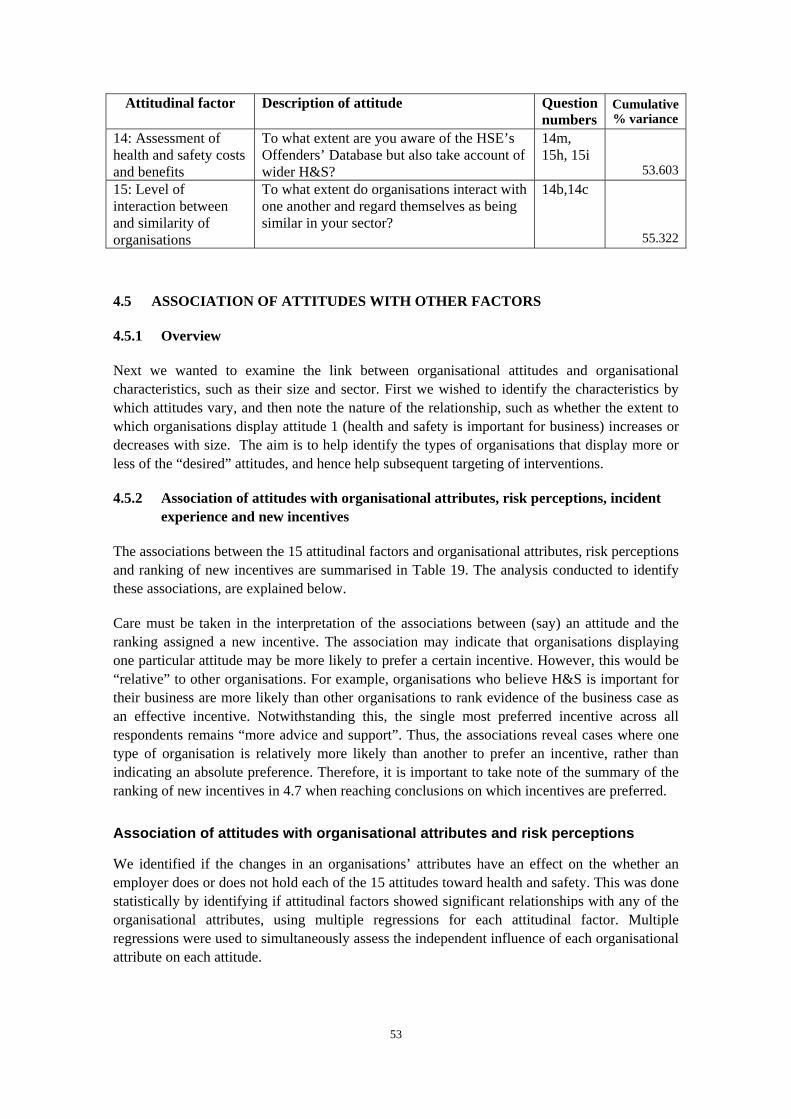
Attitudinal factor Description of attitude Question numbers
Cumulative % variance
14: Assessment of health and safety costs and benefits
To what extent are you aware of the HSE’s Offenders’ Database but also take account of wider H&S?
14m, 15h, 15i
53.603 15: Level of interaction between and similarity of organisations
To what extent do organisations interact with one another and regard themselves as being similar in your sector?
14b,14c
55.322
4.5 ASSOCIATION OF ATTITUDES WITH OTHER FACTORS
4.5.1 Overview
Next we wanted to examine the link between organisational attitudes and organisational characteristics, such as their size and sector. First we wished to identify the characteristics by which attitudes vary, and then note the nature of the relationship, such as whether the extent to which organisations display attitude 1 (health and safety is important for business) increases or decreases with size. The aim is to help identify the types of organisations that display more or less of the “desired” attitudes, and hence help subsequent targeting of interventions.
4.5.2 Association of attitudes with organisational attributes, risk perceptions, incident experience and new incentives
The associations between the 15 attitudinal factors and organisational attributes, risk perceptions and ranking of new incentives are summarised in Table 19. The analysis conducted to identify these associations, are explained below.
Care must be taken in the interpretation of the associations between (say) an attitude and the ranking assigned a new incentive. The association may indicate that organisations displaying one particular attitude may be more likely to prefer a certain incentive. However, this would be “relative” to other organisations. For example, organisations who believe H&S is important for their business are more likely than other organisations to rank evidence of the business case as an effective incentive. Notwithstanding this, the single most preferred incentive across all respondents remains “more advice and support”. Thus, the associations reveal cases where one type of organisation is relatively more likely than another to prefer an incentive, rather than indicating an absolute preference. Therefore, it is important to take note of the summary of the ranking of new incentives in 4.7 when reaching conclusions on which incentives are preferred.
Association of attitudes with organisational attributes and risk perceptions
We identified if the changes in an organisations’ attributes have an effect on the whether an employer does or does not hold each of the 15 attitudes toward health and safety. This was done statistically by identifying if attitudinal factors showed significant relationships with any of the organisational attributes, using multiple regressions for each attitudinal factor. Multiple regressions were used to simultaneously assess the independent influence of each organisational attribute on each attitude.
53
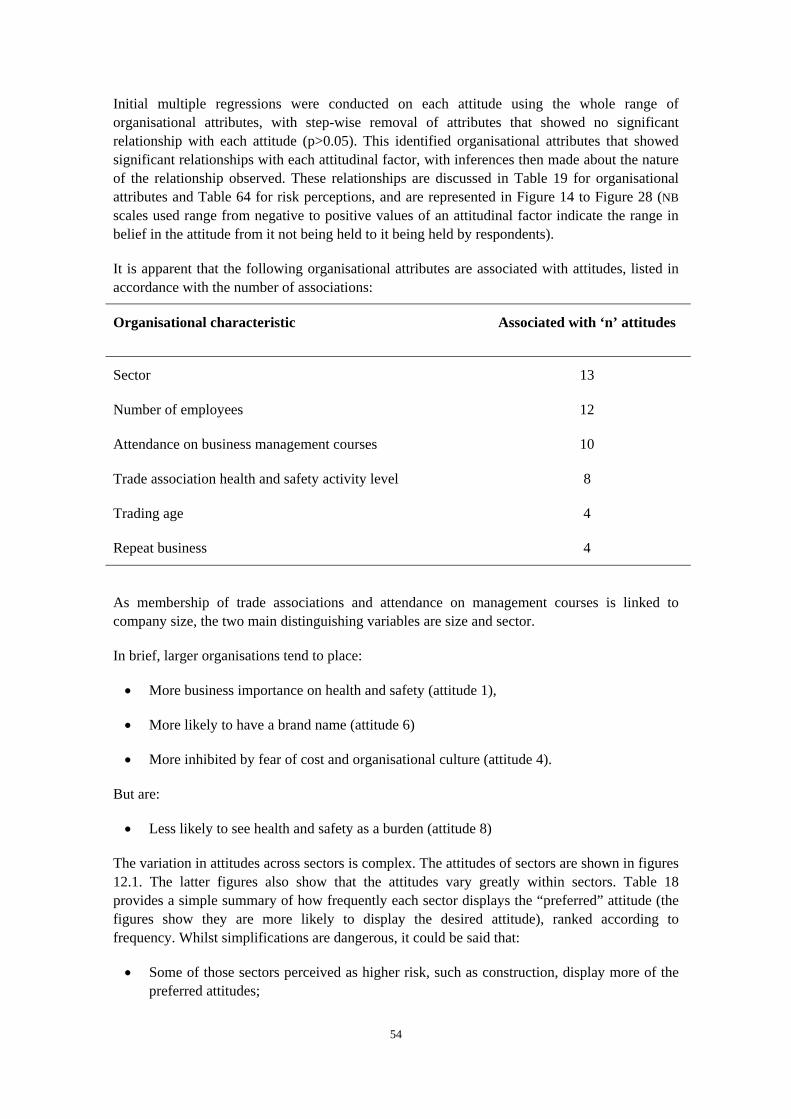
Initial multiple regressions were conducted on each attitude using the whole range of organisational attributes, with step-wise removal of attributes that showed no significant relationship with each attitude (p>0.05). This identified organisational attributes that showed significant relationships with each attitudinal factor, with inferences then made about the nature of the relationship observed. These relationships are discussed in Table 19 for organisational attributes and Table 64 for risk perceptions, and are represented in Figure 14 to Figure 28 (NB scales used range from negative to positive values of an attitudinal factor indicate the range in belief in the attitude from it not being held to it being held by respondents).
It is apparent that the following organisational attributes are associated with attitudes, listed in accordance with the number of associations:
Organisational characteristic Associated with ‘n’ attitudes
Sector 13
Number of employees 12
Attendance on business management courses 10
Trade association health and safety activity level 8
Trading age 4
Repeat business 4
As membership of trade associations and attendance on management courses is linked to company size, the two main distinguishing variables are size and sector.
In brief, larger organisations tend to place:
• More business importance on health and safety (attitude 1),
• More likely to have a brand name (attitude 6)
• More inhibited by fear of cost and organisational culture (attitude 4).
But are:
• Less likely to see health and safety as a burden (attitude 8)
The variation in attitudes across sectors is complex. The attitudes of sectors are shown in figures 12.1. The latter figures also show that the attitudes vary greatly within sectors. Table 18 provides a simple summary of how frequently each sector displays the “preferred” attitude (the figures show they are more likely to display the desired attitude), ranked according to frequency. Whilst simplifications are dangerous, it could be said that:
• Some of those sectors perceived as higher risk, such as construction, display more of the preferred attitudes;
54

• Some of those sectors perceived as lower risk, such as financial services, display fewer of the preferred attitudes.
However, agriculture (a priority area for H&S) displays few of the preferred attitudes.
It is also pertinent to note that many sectors are “neutral” on many attitudes, as shown in Table 63.
Table 18: Sectors ranked according to frequency of displaying “positive” health and safety attitudes
Sector Frequency of positive attitudes
(18) Personal Services 8 (13) Local government 8 (5) Construction 8 (21) Social Services 7 (6) Extraction 6 (16) Professional Services 5 (2) Charities 4 (7) Education 4 (8) Emergency Services 4 (10) Health Care 4 (14) Manufacturing 4 (15) Media 4 (23) Transport 4 (24) Utility 4 (25) Other 4 (1) Agriculture 3 (3) Catering 3 (22) Telecoms 3 (4) Central Government 2 (9) Financial Services 2 (11) Hotels 2 (12) Leisure 2 (17) Business to business services 2 (19) Retail 2 (20) Repairs 1
Link between incident experience and attitudes
We identified if the number of ‘incidents’ (inspections, deaths, improvement or prohibition notices, prosecutions) is associated with whether an employer does or does not hold each of the 15 attitudes toward health and safety, as shown in Table 65. It is interesting to note that:
55
• There were far fewer associations between “incident experience” and attitudes, than there are between organisational attributes and attitudes;
• Respondents who had not been inspected were less likely to see health and safety as a burden and less likely to think that enforcement would disrupt the business, but are also less likely to say they have a good relationship with the regulator;
• Respondents that have been inspected are more likely to see health and safety as a burden but are also more likely to report they have a good relationship with the regulator despite also saying that enforcement is disruptive to the business.
Thus, whilst inspection appears to be associated with a perception that health and safety is a burden and enforcement is disruptive, it does not preclude a good relationship.
Associations between ranking of new incentives and attitudes to health and safety
We investigated links between the support for new incentives and employers’ strength of belief in each of the 15 attitudes toward health and safety. This was done statistically by identifying if attitudinal factors showed significant relationships with any of the new incentives, using multiple regressions for each attitudinal factor. Multiple regressions were used to simultaneously assess the independent influence of each performance indicator on each attitude.
Initial multiple regressions were conducted on each attitude using the whole range of new incentives, with step-wise removal of incentives that were not related to each attitude (p>0.05). This identified performance indicators that showed significant relationships with each attitudinal factor, with inferences then made about the nature of the relationship observed, as stated in Table 19.
56
Table 19: Summary of associations between health and safety attitudes with organisational attributes, risk perceptions and ranking of new incentives
Features Preferences for new incentives
Attitude 1: Importance of health and safety for business
Organisations that:
• Are larger;
• Class themselves as agriculture, charities, catering, hotels, leisure, local government, manufacturing, media, repairs, social services or transport;
• Have trade associations active in promoting health and safety;
• Value their reputation;
• Attend business management courses, and;
• Perceive greater risk of major accidents/RTAs, and;
• But do not rate costs of putting health and safety right after an incident as great.
Are MORE likely to regard health and safety to be important for their business.
Companies who do perceive the importance of health and safety for their business are more likely to:
• Rate evidence that good health and safety improves productivity as an incentive to improve health and safety as ‘best’, and;
• Do not rate personal fines for directors as an effective way increasing enforcement.
Companies who do not perceive the importance of health and safety for the business are more likely to:
• Rate more enforcement, new or severe penalties as ‘best’ at increasing motivation to improve health and safety;
• Rate local councils (Environmental Health Officers) as best as a source of health and safety information.
• Rate a significant increase in Employers Liability or public liability insurance premiums as an incentive to improve health and safety as ‘best’.
57
Features Preferences for new incentives
Attitude 2: Motivated to improve health and safety
Organsations that are:
• Larger;
• Less than 15 years old;
• Believe that a serious health and safety incident could cause a loss of investment, reputational damage or an increase in insurance costs;
Are more likely to report they are motivated to improve health and safety.
Companies who are motivated to improve health and safety are more likely to:
• Rate more training, advice and support as a way of encouraging an organisation to improve health and safety
• Rate business link as the ‘best’ candidate for providing more advice and information on health and safety
Companies who are less motivated to improve health and safety are more likely to:
• Rate Trade Unions as ‘best’ at providing more advice and information on health and safety
• Rate as ‘best’ a legal requirement that the employers provide rehabilitation to people injured or made ill by work as the most effective way of encouraging an organisation to improve rehabilitation.
Attitude 3: Perceived impact of enforcement on priority awarded health and safety
Respondents that:
• Attend business management courses;
Companies who perceive that enforcement has an impact on the priority awarded health and safety are more likely to:
• Rate more enforcement, new or more severe penalties as the best way of
58
Features Preferences for new incentives
• Have trade associations active in promoting health and safety;
• Rate the risk of customer/public injuries as medium (as opposed to low or high);
• Rate the risk of selling or hiring unsafe or faulty products as high;
• Believe that a serious health and safety incident could cause a lot of cost to out health and safety right or increase cost of insurance.
Are more likely to report that enforcement would increase the priority awarded health and safety.
motivating an organisation to improve health and safety
• Rate a significant increases in Employers Liability or public liability insurance as the ‘second best’ way of providing a business incentive to improve health and safety
• Rate that a high profile newsletter that reported health and safety incidents, prosecutions, etc. would increase the risk of reputational damage, should a serious health and safety incident occur in the workplace
• Rate personal fines for directors as ‘best’ at increasing the impact of health and safety enforcement
• Rate a legal requirement that employers provide rehabilitation to people injured or made ill by work as ‘best’ in improving the level of rehabilitation offered
Companies who do not perceive that enforcement has an impact on the priority awarded health and safety are more likely to:
• Rate more training, advice & support for employers to manage health and safety as the ‘best’ way to motivate organisations to improve health and safety
59
Features Preferences for new incentives
4: Degree of inhibition to improve health and safety
Respondents that:
• Larger organisations
• Operate in central government, financial services, hotels, leisure, media, professional services, business to business services, personal services or telecoms;
• Rate the risk of staff being bullied or harassed as high;
• Do NOT attend business management courses;
• Do NOT have trade associations active in promoting health and safety.
Are more likely to report that they are inhibited from making health and safety improvements due to factors such as cost and other demands on management.
Perception of this attitude varies by sector, see Figure 16.
Companies who are inhibited to improving health and safety are more likely to:
• Rate more enforcement as the ‘best’ way to motivate an improvement in health and safety performance
• Rate insurance companies as the ‘best’ candidate for providing more advice and information on health and safety
• Rate a significant increase in Employers Liability or public liability insurance premiums as ‘best at providing a business incentive to improve health and safety
• Rate evidence that investors or banks will reduce investment if they have a poor health and safety record as ‘best’ at providing a business incentive to improve health and safety
• Rate personal fines for directors as the most effective way of increasing health and safety enforcement
• Rate evidence that the business benefits of rehabilitation exceeds the costs is the most effective way of improving levels of rehabilitation as ‘best’
Companies who are not inhibited to improve health and safety are more likely to:
60
Features Preferences for new incentives
• Rate trade associations as the ‘best’ candidate for providing more advice and information on health and safety
• Rate a significant increase in Employers Liability or public liability insurance premiums as ‘second best’ at providing a business incentive to improve health and safety
• Rate giving Trade Unions the power to serve ‘provisional improvement notices’ as a way of increasing the impact of health and safety enforcement as ‘best’
5: Health and safety is driven by the cost of insurance to improve health and safety
Organisations that are:
• Larger;
• Attend business management courses;
• Operate in agriculture, charities, hotels, leisure, local government, manufacturing, media, social services and transport;
• Perceive risk of fire, food poisoning as higher and could lose contracts / a prosecution or a lot of cost if a serious incident occurred:
Are more driven to improve health and safety due to the cost of insurance and the fact that insurers take their health and safety
Companies who do perceive that health and safety performance is driven by the cost of insurance are more likely to:
• Rate insurance companies as a candidate for providing more advice and information on health and safety
• Rate IOSH as a candidate for providing more advice and information on health and safety as ‘second best’
• Rate a significant increase in Employers Liability or public insurance premiums as an incentive to improve health and safety as ‘best’
• Rate as ‘best’ a better link between the cost of insurance and a companies health and safety performance is more likely to provide a business incentive to improve health and safety performance
61
Features Preferences for new incentives
performance into account.
• Rate a requirement that health and safety performance is reported in Company’s annual report would increase the risk of reputational damage should a health and safety incident occur
• Rate as ‘best’ that a significant increase in the cost of Employers Liability insurance would improve the level of rehabilitation
Companies who do not perceive that health and safety performance is driven by insurance are more likely to:
• Rate the risk of reputational damage if there had been an accident as effective at improving health and safety performance
• Rate business link and Small Business Service as ‘best’ for providing more advice and information on health and safety
• Rate IOSH as a candidate for providing more advice and information on health and safety as ‘best’
6: Importance of brand name
Organizations that
• Are larger:
• Have been trading longer;
• Have more active trade associations;
• Operate in central government, construction, education, financial
Companies whose brand name is important to their business are more likely to:
• Rate a greater risk of reputational damage as being an effective way to increase motivation to improve health and safety as ‘best’
• Rate evidence that good health and safety improves productivity as
62
Features Preferences for new incentives
services, media, professional services, business to business services, personal services, and utilities.
• Believe they may lose contracts if a serious health and safety incident were to occur
Place higher value on their brand name. Organisations that rate food poisoning risk higher tend to rate the importance of their brand name less, as are organizations operating in the agriculture, catering, health care, hotels, emergency services, local government, social services, telecoms.
‘best’
• Rate evidence that good health and safety improves productivity is an incentive to improve health and safety performance as ‘best’
• Rate a better link between cost of insurance and health and safety performance provides a business incentive to improve health and safety as ‘best’
• Rate as ‘best’ that tax incentives for health and safety expenditure is the most effective way of providing a business incentive to improve health and safety
• Rate ‘best’ and ‘third best’ that making employers meet relatives and injured staff to explain and apologise after an incident occurred would increase the impact of enforcement
Companies whose brand name is not important to their business are more likely to:
• Rate more training, advice & support for employers on how to manage health and safety as ‘best’
• Rate business link as a candidate for more advice and information on health and safety
• Rate local council (Environmental Health Officers) as a candidate for more advice and information on health and safety as ‘best’
63
Features Preferences for new incentives
• Rate ‘second best’ that making employers meet relatives and injured staff to explain and apologise after an incident occurred would increase the impact of enforcement
• Rate a significant increase in the cost of Employers Liability insurance to improve the level of rehabilitation as ‘best’
7: Perceived room for improvement
Organisations with:
• Active trade associations;
• Who rate fire, traffic accident, customer injury, staff injury risk higher;
• Who believe an incident could cost a lot to put right and incur a criminal prosecution:
Are more likely to be think they have room for improvement. Large and very large are more likely to think they have scope for improvement. However, small and medium less so. Perception of this attitude varies by sector, see Figure 19.
Companies who do perceive room for improvement in health and safety performance are more likely to:
• Rate as ‘best’ that more enforcement is an effective way to improve health and safety
• Rate as ‘best’ that more sector specific partnerships created between trade/professional associations, regulators and employers would motivate their organisation to improve health and safety
• Rate evidence that good health and safety improves productivity as ‘best’ for providing a business incentive to improve health and safety
• Rate as ‘best’ a requirement that health and safety performance should be reported in Company annual reports would increase the risk of reputational damage should a serous health and safety incident occur
Companies who do not perceive room for improvement in health and safety performance are more likely to:
64
Features Preferences for new incentives
• Rate business link as a source of more advice and information on health and safety
• Rate as ‘best’ Trade Associations or Professional Bodies as providing more advice an information on health and safety
• Rate as ‘best’ that local councils (Environmental Health Officers) in providing information and advice on health and safety
• Rate as ‘best’ that there should be more incentives to motivate companies to improve health and safety
8: Health and safety perceived as a burden
Organizations that are:
• Small organizations
• Organisations that do NOT get a lot of repeat business;
• Do not attend business management courses;
• Perceive risk of injury to be low and believe a serious incident could bankrupt them;
• Organisations that operate in agriculture, catering, emergency services, hotels, business to business services:
Are more likely to see health and safety as a burden, complex etc
Companies who do perceive health and safety as a burden to their organisation are more likely to:
• Rate more training, advice and support for employers on how to manage health and safety as ‘best’
• Rate business link as providing more health and safety advice and information as ‘best’
• Rate Trade Associations or Professional Bodies as providing more advice and information as ‘best’
• Rate the provision of grants and subsidies for health and safety as ‘best’
• Rate as ‘best’ that more consistent, pragmatic and fairer enforcement
65
Features Preferences for new incentives
Medium and large organizations are less likely to see health and safety as a burden, as are organizations who believe they could lose contracts and incur a lot of costs if a serious incident occurs.
would increase the impact of health and safety enforcement
• Rate as ‘best’ that more frequent inspections is an effective way of increasing the impact of health and safety enforcement
Companies who do not perceive health and safety as a burden to their organisation are more likely to:
• Rate evidence that good health and safety improves productivity as an incentive to improve health and safety performance as ‘best’
• Rate as ‘best’ and ‘second best’ that a better link between the cost of insurance and health and safety performance is an effective incentive to improve health and safety performance
9: Quality of relationship with health and safety regulator
Organisations that are:
• Small, medium and large
• With active trade associations;
• Who rate food poisoning risk as higher;
• Rate risk of bullying as low;
Are more likely to grade relationship with the regulator and quality of advice as good. Whilst very large grade relationship as poorer, all other sizes of organization grade it as good.
Companies who do perceive that they have a quality relationship with the health and safety regulator are more likely to:
• Rate local council (Environmental Health Officer) as providing more advice and information on health and safety as ‘best’
• Rate evidence that good health and safety improves productivity is a business incentive to improve health and safety as ‘best’
• Rate as ‘best’ that an accredited British Standard for health and safety Management would increase the impact of health and safety
66
Features Preferences for new incentives
Perception of this attitude varies by sector, see Figure 21.
enforcement
Companies Who not perceive that they have a quality relationship with the health and safety regulator are more likely to:
• Rate Trade Associations and Professional Bodies as a providing more advice and information on health and safety as ‘best’
10: Extent of customer / bank pressure to improve health and safety
Organizations that are:
• Under the age of 10 years, but greater than 1 year;
• Attend business management courses;
• Have an active trade association;
• Rate a higher risk of customer injuries, traffic accidents, medium risk of staff assault;
• Believe they could lose investment, suffer reputational damage, lose contracts, incur difficulty recruiting staff.
Are more likely to say they have pressure from customers and banks to improve health and safety. Organisations that think that a serious incident could increase premiums were less likely to report pressure from customers/banks. Perception of this attitude varies by sector, see Figure 22.
Companies who do perceive that there is pressure from customers and banks to improve health and safety are more likely to:
• Rate insurance companies as providing more advice and information on health and safety as ‘second best’
• Rate trade associations or professional bodies as ‘best’ as providing more advice and information on health and safety
• Rate a requirement that health and safety performance is reported in Company annual reports as increasing the risk of reputational damage , should a serious health and safety incident occur, as best
Companies who do not perceive that there is pressure from customers and banks to improve health and safety are more likely to:
• Rate consultancies as providing more advice and information on health and safety as ‘best’
67

Features Preferences for new incentives
• Rate a reduction in the compensation payments to employees who do not participate in rehabilitation as an effective way of improving the level of rehabilitation
11: Importance of reputation to the business
Organisations that:
• Are larger:
• Have a lot of repeat business;
• Attend business management courses;
• Rate risk of food poisoning, staff being assaulted, business interruptions higher;
• Believe a serious incident could cause loss of investment, lose contracts, staff going on strike, loss of sales, poor local community reputation or increased insurance costs;
The more likely they are to say that their reputation is important to their business. Perception of this attitude varies by sector, see Figure 23.
Companies whose reputation is important to their business are more likely to:
• Rate as ‘best’ that a greater risk of reputational damage increase the motivation to improve health and safety performance
• Rate as ‘best’ that insurance companies provide more advice and information on health and safety
• Rate as ‘best’ business link as providing more advice and information on health and safety
• Rate Trade Associations or Professional Bodies as third best as providing advice and information on health and safety
• Rate a high profile newsletter that reported health and safety incidents, prosecutions, etc. as increasing the risk of reputational damage as a result of serous health and safety incident
• Rate a significant increase in the cost of Employers Liability insurance will improve the level of rehabilitation
68
Features Preferences for new incentives
Companies whose reputation is less important to their business are more likely to:
• Rate as ‘best’ that a legal requirement that employers provide rehabilitation to people made ill or injured by work is a way of encouraging an organisation to improve the level of rehabilitation
• Rate best and second best that tax incentives for rehabilitation expenditure is an effective way of improving levels of rehabilitation
12: Extent of employee /insurer pressure to improve health and safety
Organisations that:
• Are smaller
• Attend business management courses
• Perceive the potential for strike action by staff, as a consequence of a serious health and safety incident
• Perceive the potential for insurance cost to increase as a consequence of a serious health and safety incident
Are more likely to say that they perceive pressures from employees and insurers to improve health and safety performance. Perception of this attitude varies by sector, see Figure 24.
Companies who do perceive pressure from employees and insurers to improve health and safety performance are more likely to:
• Rate as ‘best’ business link or Small Business Service as providing more advice and information on health and safety
• Rate as ‘second best’ that increasing awareness of rehabilitation and how to access services is a way of encouraging improvements in the levels of rehabilitation
Companies who do not perceive pressure from employees and insurers to improve health and safety performance are more likely to:
• Rate as ‘best’ evidence that the business benefits of rehabilitation exceed costs improves the level of rehabilitation
69
Features Preferences for new incentives
• Rate as ‘best’ that increasing awareness of rehabilitation and how to access services is a way of encouraging improvements in the levels of rehabilitation
13: Possible impact of enforcement on the business
Orgnisations that:
• Perceive business interruptions are possible due to equipment failure, virus or flooding
• Perceive a loss of investment would occur as consequence of an health and safety incident
• Perceive reputational damage could occur as a consequence of an health and safety incident
• Perceive that a loss of custom would occur as a consequence of an health and safety incident
Are more likely to say they want avoid coming to the attention of the regulator and fear that enforcement could be disruptive to their business and damage their reputation. Perception of this attitude varies by sector, see Figure 25.
Companies who do perceive a possible impact of enforcement on their business are more likely to:
• Rate ‘best’ a requirement that health and safety performance is reported in Company annual reports as increasing the risk of reputational damage
Companies who do not perceive a possible impact of enforcement on their business are more likely to:
• Rate insurance companies as providing more advice and information on health and safety as ‘best’
• Rate as second best a requirement that health and safety performance is reported in Company annual reports as increasing the risk of reputational damage
70
Features Preferences for new incentives
14: Assessment of health and safety costs and benefits
Organsiations that:
• That have been trading for the fewest number of years
• Who do not do a lot of repeat business
• Attend business meetings frequently
• Perceive their organization pose low and medium levels of risk of injuries to customers
• Perceive there is a risk of their employees being attacked
• Perceive that a loss of investment would occur as a consequence of serious health and safety incident
Are more likely to say they are aware of the HSE’s offenders database and take account of wider societal costs and benefits when considering health and safety. Those organization that perceive their business is at risk of interruption due to equipment failure, computer viruses, flooding, are less likely to say they are aware of the HSE’s offenders database and take account of wider societal costs and benefits when considering health and safety. Perception of this attitude varies by sector, see Figure 26.
Companies who consider the wider costs and benefits of health and safety are more likely to:
• Rate ‘more incentives’ as a way to motivate an organisations;
• Rate “evidence that good health and safety improves productivity” as a business incentive;
• Rate as ‘best’ a law that makes it easier to secure Corporate Manslaughter convictions as the most effective way to increase the impact of enforcement;
• Rate an accredited British Standard for health and safety management as the most effective way of improving enforcement;
• Rate as ‘best’ a big increase in the availability of low cost occupational health and rehabilitation support as an effective way of improving rehabilitation.
Companies who do not consider the wider costs and benefits of health and safety are more likely to:
• Rate ‘more incentives’ as a way to motivate an organisations;
• Rate a legal requirement to inform customers and suppliers of your health and safety performance would increase the risk of reputational
71
Features Preferences for new incentives
damage in the vent of serious health and safety incident
• Rate as ‘best’ more frequent inspections as an effective way of increasing the impact of enforcement
15: Level of interaction between and similarity of organisations
Organisations that:
• Attend business courses;
• Have trade associations active in the promotion of health and safety;
• Perceive a risk of injury/illness amongst their staff or contractors;
• Perceive that a loss of reputation in the community would occur as a consequence of serious health and safety incident.
Are more likely to say that interact with other organisations.
Organisations that do repeat business and perceive a risk of losing custom as a consequence of a serious health and safety incident, are less likely to say that they interact with other organisations. Perception of this attitude varies by sector, see Figure 28.
Companies who do perceive that there is an interaction between and similar organisations in similar sectors are more likely to:
• Rate Trade Associations or Professional Bodies as providing more advice and information on health and safety
• Rate an increase in awareness of rehabilitation and how to access rehabilitations services as an effective way of encouraging an improvement in rehabilitation levels
Companies who do not perceive that there is an interaction between similar organisations in similar sectors are more likely to:
• Rate as ‘best’ that more incentives is an effective way to motivate an organisation to improve health and safety performance
• Rate as ‘best’ a legal requirement to inform customers and suppliers of your health and safety performance as increasing the risk of reputational damage in the event of serious health and safety incident
72
4.6 ASSOCIATION OF RISK PERCEPTIONS WITH ORGANISATIONAL ATTRIBUTES
It is clear that the level of perceived risk varies by sector (see Table 21) and by the number of employees (as per Table 22), with:
• Larger organisations perceiving risk to be higher;
• Higher risk ratings from respondents who attend business management courses Table 23;
• Organisations that employ a health and safety specialist or consultant rate risk as higher (see Table 24 and Table 25);
• Organisation that are members of trade associations and have trade associations active in promoting health and safety, rate the risk as higher (see Table 26 and Table 27)
Thus, larger and more “informed” organisations rate the risk posed to the organisation as higher if still between low and medium.
The average risk rating (risk to the organisation) across the 10 risks is shown in Table 21, with the sectors ranked from highest risk rating to lowest risk rating.
It is also possible to highlight that, on a scale where 1 = No risk and 4 = High risk;
• The average risk rating is just above low (2.2);
• The risk of fire, staff injury, work related road traffic accident and customer injury get the highest risk ratings (between low and medium) when averaged across all sectors;
• The highest risk rating for staff injury is 3 (medium) for extraction sector.
Thus, it is apparent that, on average, respondents perceive the risk to the organisation as low to medium.
Impact of a serious health and safety incident
As regards the impact of a serious health and safety incident, it is apparent that:
The top three impacts, rated as “possible” are:
• Reputational damage;
• An increase in insurance costs, and;
• A criminal prosecution.
Larger organisations tend to give these impacts a higher possibility.
On average, respondents regard the following to be unlikely:
• Loss of investment;
73
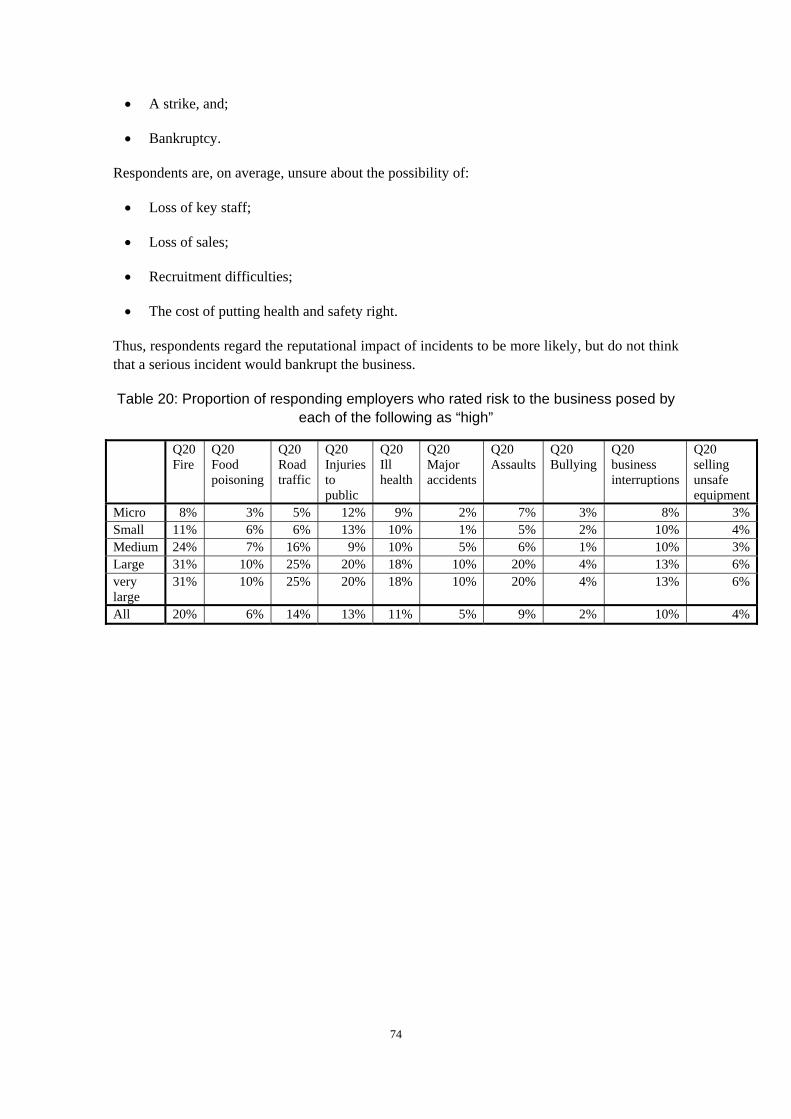
• A strike, and;
• Bankruptcy.
Respondents are, on average, unsure about the possibility of:
• Loss of key staff;
• Loss of sales;
• Recruitment difficulties;
• The cost of putting health and safety right.
Thus, respondents regard the reputational impact of incidents to be more likely, but do not think that a serious incident would bankrupt the business.
Table 20: Proportion of responding employers who rated risk to the business posed by each of the following as “high”
Q20 Fire
Q20 Food poisoning
Q20 Road traffic
Q20 Injuries to public
Q20 Ill health
Q20 Major accidents
Q20 Assaults
Q20 Bullying
Q20 business interruptions
Q20 selling unsafe equipment
Micro 8% 3% 5% 12% 9% 2% 7% 3% 8% 3%Small 11% 6% 6% 13% 10% 1% 5% 2% 10% 4%Medium 24% 7% 16% 9% 10% 5% 6% 1% 10% 3%Large 31% 10% 25% 20% 18% 10% 20% 4% 13% 6%very large
31% 10% 25% 20% 18% 10% 20% 4% 13% 6%
All 20% 6% 14% 13% 11% 5% 9% 2% 10% 4%
74
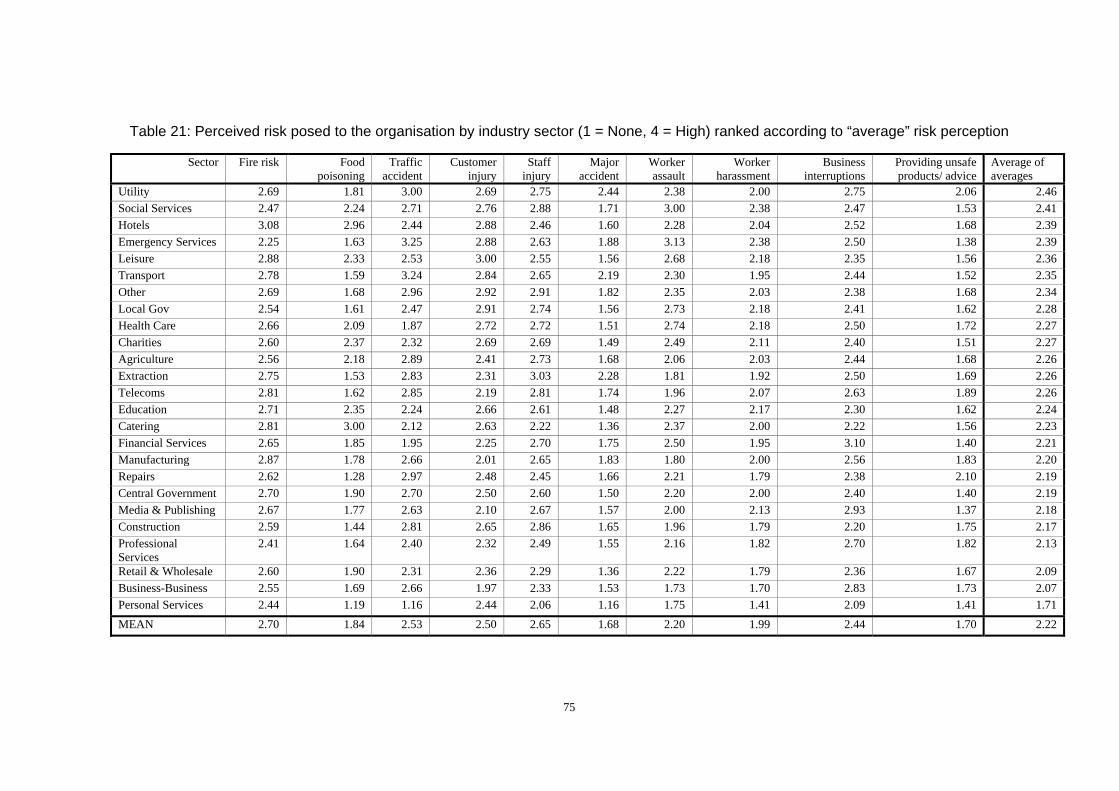
Table 21: Perceived risk posed to the organisation by industry sector (1 = None, 4 = High) ranked according to “average” risk perception
Sector Fire risk Food poisoning
Traffic accident
Customer injury
Staff injury
Major accident
Worker assault
Worker harassment
Business interruptions
Providing unsafe products/ advice
Average of averages
Utility 2.69 1.81 3.00 2.69 2.75 2.44 2.38 2.00 2.75 2.06 2.46Social Services 2.47 2.24 2.71 2.76 2.88 1.71 3.00 2.38 2.47 1.53 2.41Hotels 3.08 2.96 2.44 2.88 2.46 1.60 2.28 2.04 2.52 1.68 2.39Emergency Services 2.25 1.63 3.25 2.88 2.63 1.88 3.13 2.38 2.50 1.38 2.39Leisure 2.88 2.33 2.53 3.00 2.55 1.56 2.68 2.18 2.35 1.56 2.36Transport 2.78 1.59 3.24 2.84 2.65 2.19 2.30 1.95 2.44 1.52 2.35Other 2.69 1.68 2.96 2.92 2.91 1.82 2.35 2.03 2.38 1.68 2.34Local Gov 2.54 1.61 2.47 2.91 2.74 1.56 2.73 2.18 2.41 1.62 2.28Health Care 2.66 2.09 1.87 2.72 2.72 1.51 2.74 2.18 2.50 1.72 2.27Charities 2.60 2.37 2.32 2.69 2.69 1.49 2.49 2.11 2.40 1.51 2.27Agriculture 2.56 2.18 2.89 2.41 2.73 1.68 2.06 2.03 2.44 1.68 2.26Extraction 2.75 1.53 2.83 2.31 3.03 2.28 1.81 1.92 2.50 1.69 2.26Telecoms 2.81 1.62 2.85 2.19 2.81 1.74 1.96 2.07 2.63 1.89 2.26Education 2.71 2.35 2.24 2.66 2.61 1.48 2.27 2.17 2.30 1.62 2.24Catering 2.81 3.00 2.12 2.63 2.22 1.36 2.37 2.00 2.22 1.56 2.23Financial Services 2.65 1.85 1.95 2.25 2.70 1.75 2.50 1.95 3.10 1.40 2.21Manufacturing 2.87 1.78 2.66 2.01 2.65 1.83 1.80 2.00 2.56 1.83 2.20Repairs 2.62 1.28 2.97 2.48 2.45 1.66 2.21 1.79 2.38 2.10 2.19Central Government 2.70 1.90 2.70 2.50 2.60 1.50 2.20 2.00 2.40 1.40 2.19Media & Publishing 2.67 1.77 2.63 2.10 2.67 1.57 2.00 2.13 2.93 1.37 2.18Construction 2.59 1.44 2.81 2.65 2.86 1.65 1.96 1.79 2.20 1.75 2.17Professional Services
2.41 1.64 2.40 2.32 2.49 1.55 2.16 1.82 2.70 1.82 2.13
Retail & Wholesale 2.60 1.90 2.31 2.36 2.29 1.36 2.22 1.79 2.36 1.67 2.09Business-Business 2.55 1.69 2.66 1.97 2.33 1.53 1.73 1.70 2.83 1.73 2.07Personal Services 2.44 1.19 1.16 2.44 2.06 1.16 1.75 1.41 2.09 1.41 1.71MEAN 2.70 1.84 2.53 2.50 2.65 1.68 2.20 1.99 2.44 1.70 2.22
75
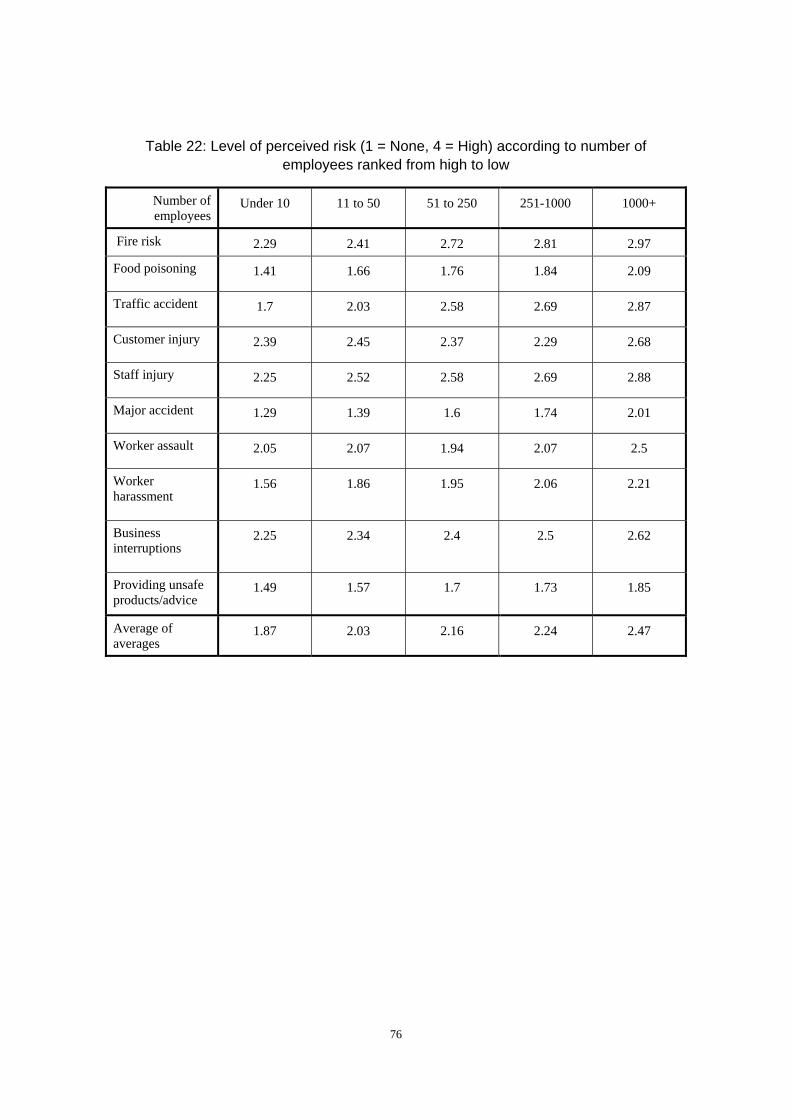
Table 22: Level of perceived risk (1 = None, 4 = High) according to number of employees ranked from high to low
Number of employees
Under 10 11 to 50 51 to 250 251-1000 1000+
Fire risk 2.29 2.41 2.72 2.81 2.97
Food poisoning 1.41 1.66 1.76 1.84 2.09
Traffic accident 1.7 2.03 2.58 2.69 2.87
Customer injury 2.39 2.45 2.37 2.29 2.68
Staff injury 2.25 2.52 2.58 2.69 2.88
Major accident 1.29 1.39 1.6 1.74 2.01
Worker assault 2.05 2.07 1.94 2.07 2.5
Worker harassment
1.56 1.86 1.95 2.06 2.21
Business interruptions
2.25 2.34 2.4 2.5 2.62
Providing unsafe products/advice
1.49 1.57 1.7 1.73 1.85
Average of averages
1.87 2.03 2.16 2.24 2.47
76
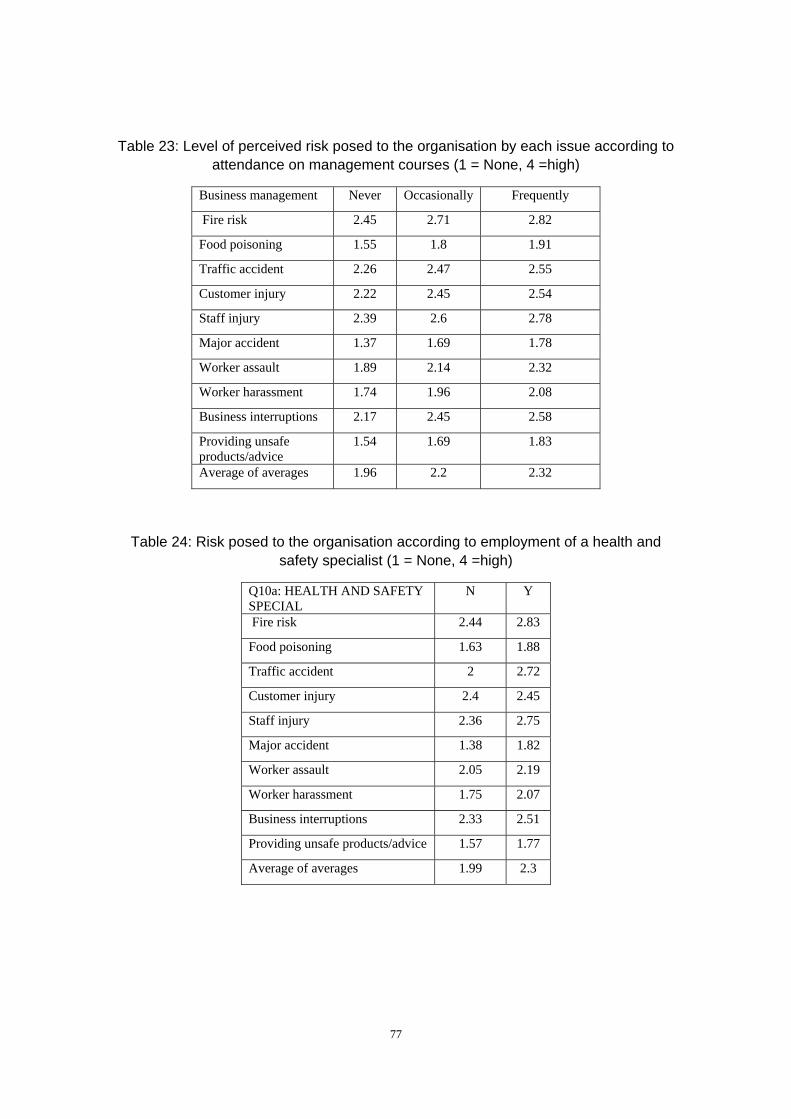
Table 23: Level of perceived risk posed to the organisation by each issue according to attendance on management courses (1 = None, 4 =high)
Business management Never Occasionally Frequently
Fire risk 2.45 2.71 2.82
Food poisoning 1.55 1.8 1.91
Traffic accident 2.26 2.47 2.55
Customer injury 2.22 2.45 2.54
Staff injury 2.39 2.6 2.78
Major accident 1.37 1.69 1.78
Worker assault 1.89 2.14 2.32
Worker harassment 1.74 1.96 2.08
Business interruptions 2.17 2.45 2.58
Providing unsafe products/advice
1.54 1.69 1.83
Average of averages 1.96 2.2 2.32
Table 24: Risk posed to the organisation according to employment of a health and safety specialist (1 = None, 4 =high)
Q10a: HEALTH AND SAFETY SPECIAL
N Y
Fire risk 2.44 2.83
Food poisoning 1.63 1.88
Traffic accident 2 2.72
Customer injury 2.4 2.45
Staff injury 2.36 2.75
Major accident 1.38 1.82
Worker assault 2.05 2.19
Worker harassment 1.75 2.07
Business interruptions 2.33 2.51
Providing unsafe products/advice 1.57 1.77
Average of averages 1.99 2.3
77
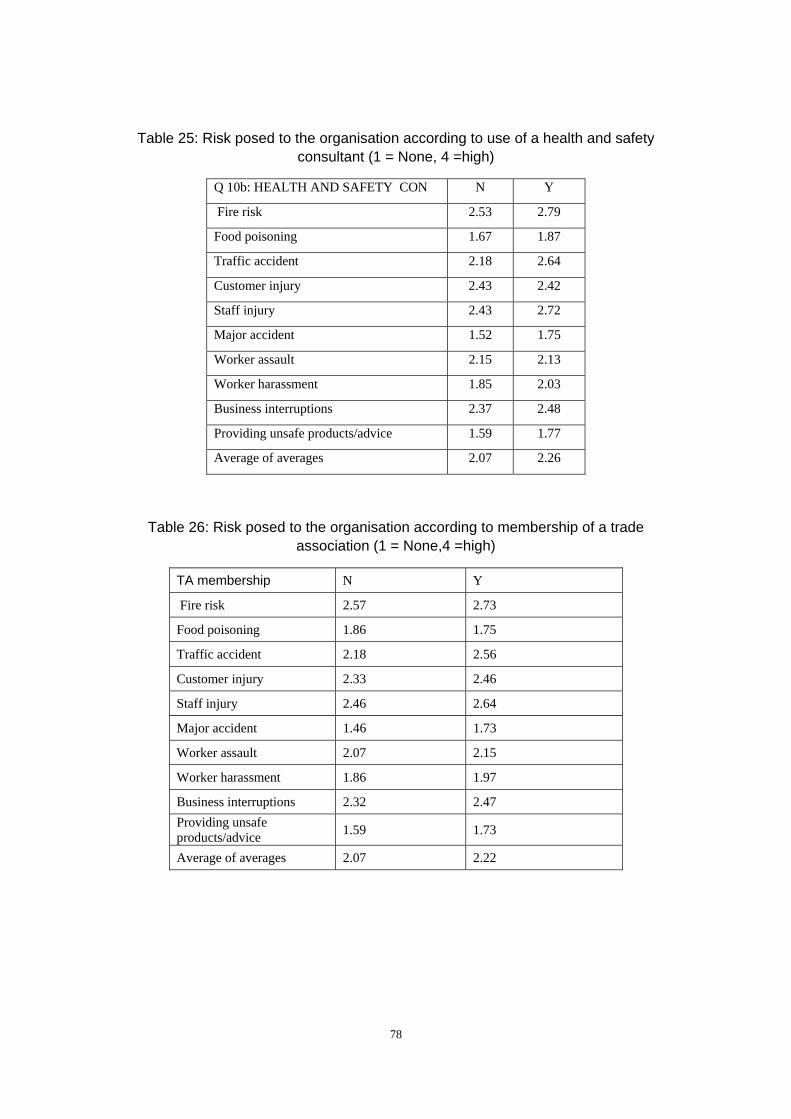
Table 25: Risk posed to the organisation according to use of a health and safety consultant (1 = None, 4 =high)
Q 10b: HEALTH AND SAFETY CON N Y
Fire risk 2.53 2.79
Food poisoning 1.67 1.87
Traffic accident 2.18 2.64
Customer injury 2.43 2.42
Staff injury 2.43 2.72
Major accident 1.52 1.75
Worker assault 2.15 2.13
Worker harassment 1.85 2.03
Business interruptions 2.37 2.48
Providing unsafe products/advice 1.59 1.77
Average of averages 2.07 2.26
Table 26: Risk posed to the organisation according to membership of a trade association (1 = None,4 =high)
TA membership N Y
Fire risk 2.57 2.73
Food poisoning 1.86 1.75
Traffic accident 2.18 2.56
Customer injury 2.33 2.46
Staff injury 2.46 2.64
Major accident 1.46 1.73
Worker assault 2.07 2.15
Worker harassment 1.86 1.97
Business interruptions 2.32 2.47 Providing unsafe products/advice 1.59 1.73
Average of averages 2.07 2.22
78
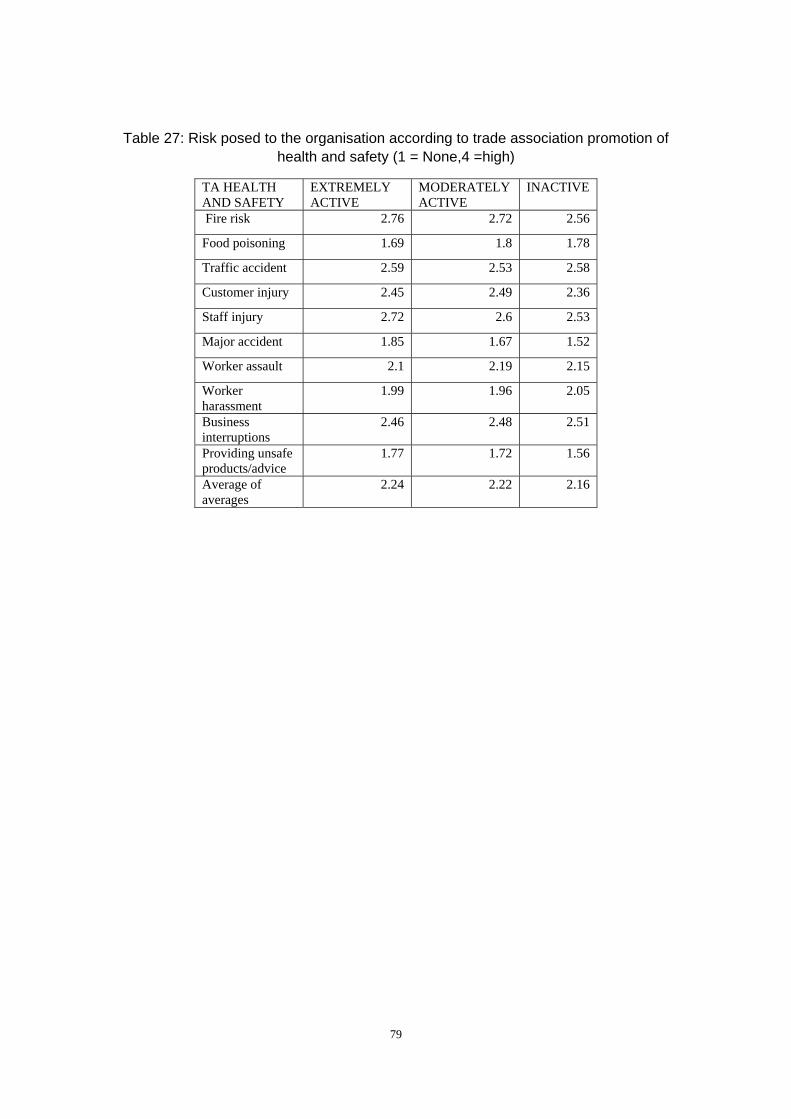
Table 27: Risk posed to the organisation according to trade association promotion of health and safety (1 = None,4 =high)
TA HEALTH AND SAFETY
EXTREMELY ACTIVE
MODERATELY ACTIVE
INACTIVE
Fire risk 2.76 2.72 2.56
Food poisoning 1.69 1.8 1.78
Traffic accident 2.59 2.53 2.58
Customer injury 2.45 2.49 2.36
Staff injury 2.72 2.6 2.53
Major accident 1.85 1.67 1.52
Worker assault 2.1 2.19 2.15
Worker harassment
1.99 1.96 2.05
Business interruptions
2.46 2.48 2.51
Providing unsafe products/advice
1.77 1.72 1.56
Average of averages
2.24 2.22 2.16
79
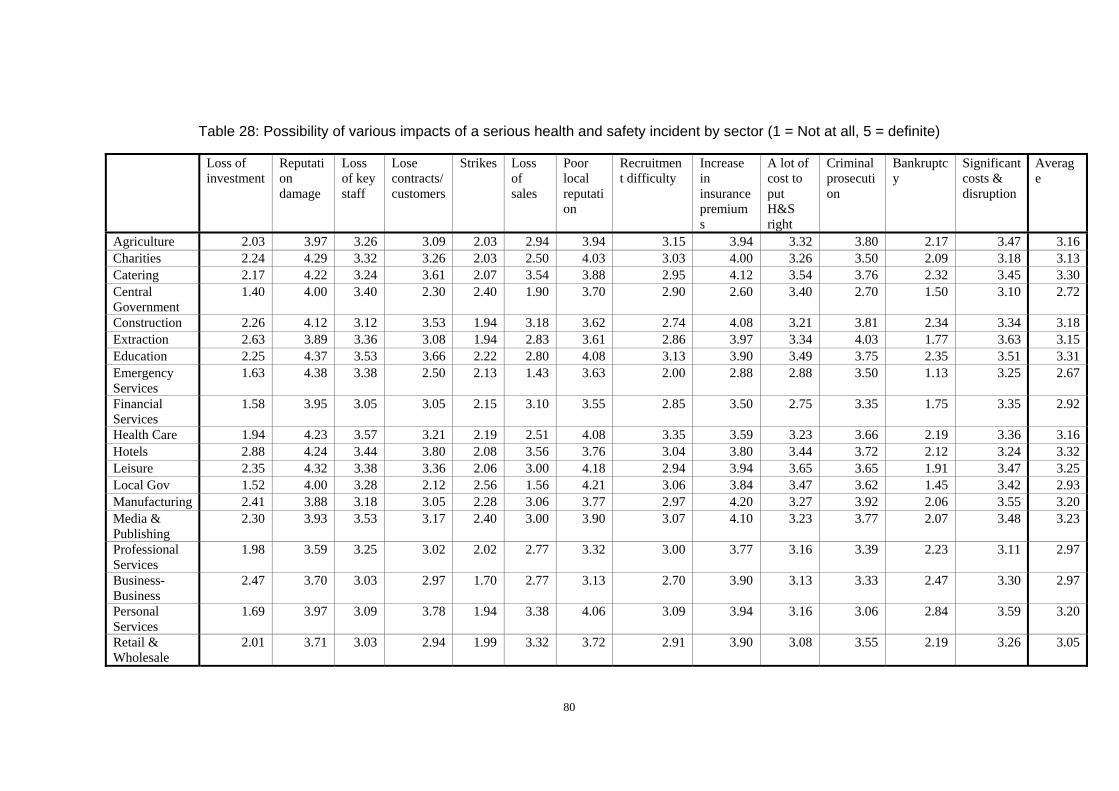
Table 28: Possibility of various impacts of a serious health and safety incident by sector (1 = Not at all, 5 = definite)
Loss of investment
Reputation damage
Loss of key staff
Lose contracts/ customers
Strikes Lossof sales
Poor local reputation
Recruitment difficulty
Increase in insurance premiums
A lot of cost to put H&S right
Criminal prosecution
Bankruptcy
Significant costs & disruption
Average
Agriculture 2.03 3.97 3.26 3.09 2.03 2.94 3.94 3.15 3.94 3.32 3.80 2.17 3.47 3.16Charities 2.24 4.29 3.32 3.26 2.03 2.50 4.03 3.03 4.00 3.26 3.50 2.09 3.18 3.13Catering 2.17 4.22 3.24 3.61 2.07 3.54 3.88 2.95 4.12 3.54 3.76 2.32 3.45 3.30Central Government
1.40 4.00 3.40 2.30 2.40 1.90 3.70 2.90 2.60 3.40 2.70 1.50 3.10 2.72
Construction 2.26 4.12 3.12 3.53 1.94 3.18 3.62 2.74 4.08 3.21 3.81 2.34 3.34 3.18Extraction 2.63 3.89 3.36 3.08 1.94 2.83 3.61 2.86 3.97 3.34 4.03 1.77 3.63 3.15Education 2.25 4.37 3.53 3.66 2.22 2.80 4.08 3.13 3.90 3.49 3.75 2.35 3.51 3.31Emergency Services
1.63 4.38 3.38 2.50 2.13 1.43 3.63 2.00 2.88 2.88 3.50 1.13 3.25 2.67
Financial Services
1.58 3.95 3.05 3.05 2.15 3.10 3.55 2.85 3.50 2.75 3.35 1.75 3.35 2.92
Health Care 1.94 4.23 3.57 3.21 2.19 2.51 4.08 3.35 3.59 3.23 3.66 2.19 3.36 3.16 Hotels 2.88 4.24 3.44 3.80 2.08 3.56 3.76 3.04 3.80 3.44 3.72 2.12 3.24 3.32Leisure 2.35 4.32 3.38 3.36 2.06 3.00 4.18 2.94 3.94 3.65 3.65 1.91 3.47 3.25Local Gov 1.52 4.00 3.28 2.12 2.56 1.56 4.21 3.06 3.84 3.47 3.62 1.45 3.42 2.93 Manufacturing 2.41 3.88 3.18 3.05 2.28 3.06 3.77 2.97 4.20 3.27 3.92 2.06 3.55 3.20Media & Publishing
2.30 3.93 3.53 3.17 2.40 3.00 3.90 3.07 4.10 3.23 3.77 2.07 3.48 3.23
Professional Services
1.98 3.59 3.25 3.02 2.02 2.77 3.32 3.00 3.77 3.16 3.39 2.23 3.11 2.97
Business-Business
2.47 3.70 3.03 2.97 1.70 2.77 3.13 2.70 3.90 3.13 3.33 2.47 3.30 2.97
Personal Services
1.69 3.97 3.09 3.78 1.94 3.38 4.06 3.09 3.94 3.16 3.06 2.84 3.59 3.20
Retail & Wholesale
2.01 3.71 3.03 2.94 1.99 3.32 3.72 2.91 3.90 3.08 3.55 2.19 3.26 3.05
80
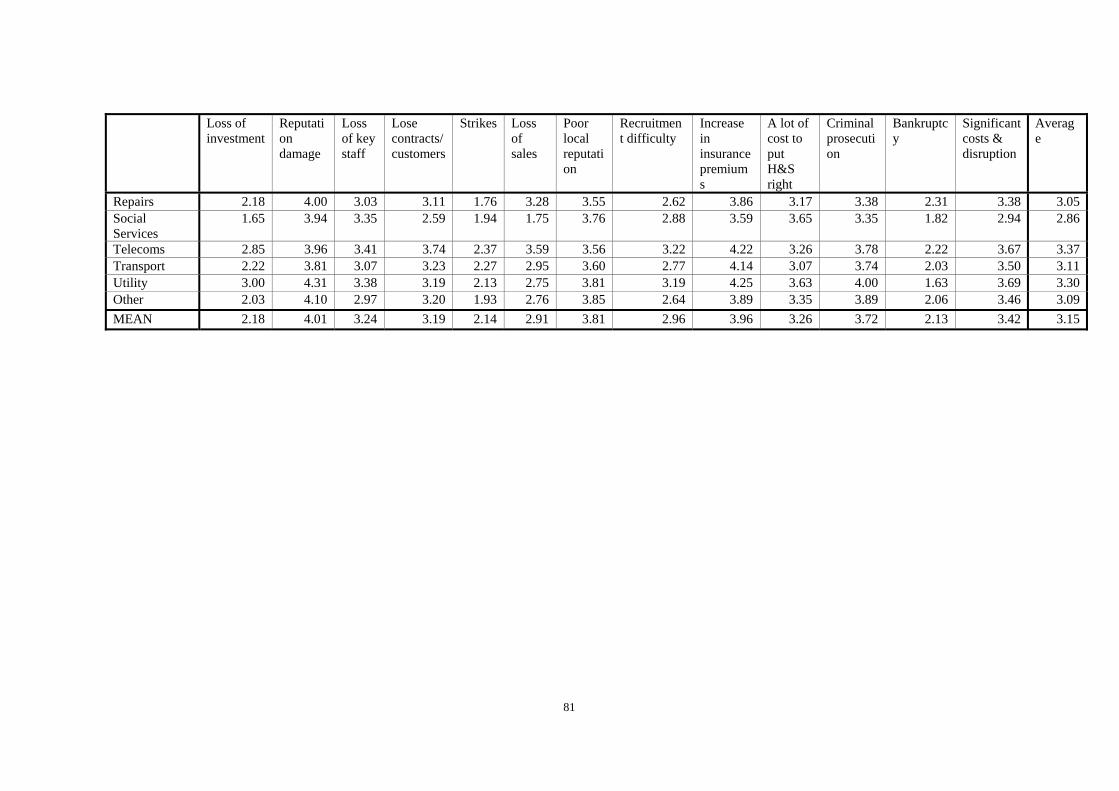
Loss of investment
Reputation damage
Loss of key staff
Lose contracts/ customers
Strikes Loss of sales
Poor local reputation
Recruitment difficulty
Increase in insurance premiums
A lot of cost to put H&S right
Criminal prosecution
Bankruptcy
Significant costs & disruption
Average
Repairs 2.18 4.00 3.03 3.11 1.76 3.28 3.55 2.62 3.86 3.17 3.38 2.31 3.38 3.05Social Services
1.65 3.94 3.35 2.59 1.94 1.75 3.76 2.88 3.59 3.65 3.35 1.82 2.94 2.86
Telecoms 2.85 3.96 3.41 3.74 2.37 3.59 3.56 3.22 4.22 3.26 3.78 2.22 3.67 3.37Transport 2.22 3.81 3.07 3.23 2.27 2.95 3.60 2.77 4.14 3.07 3.74 2.03 3.50 3.11Utility 3.00 4.31 3.38 3.19 2.13 2.75 3.81 3.19 4.25 3.63 4.00 1.63 3.69 3.30Other 2.03 4.10 2.97 3.20 1.93 2.76 3.85 2.64 3.89 3.35 3.89 2.06 3.46 3.09MEAN 2.18 4.01 3.24 3.19 2.14 2.91 3.81 2.96 3.96 3.26 3.72 2.13 3.42 3.15
81
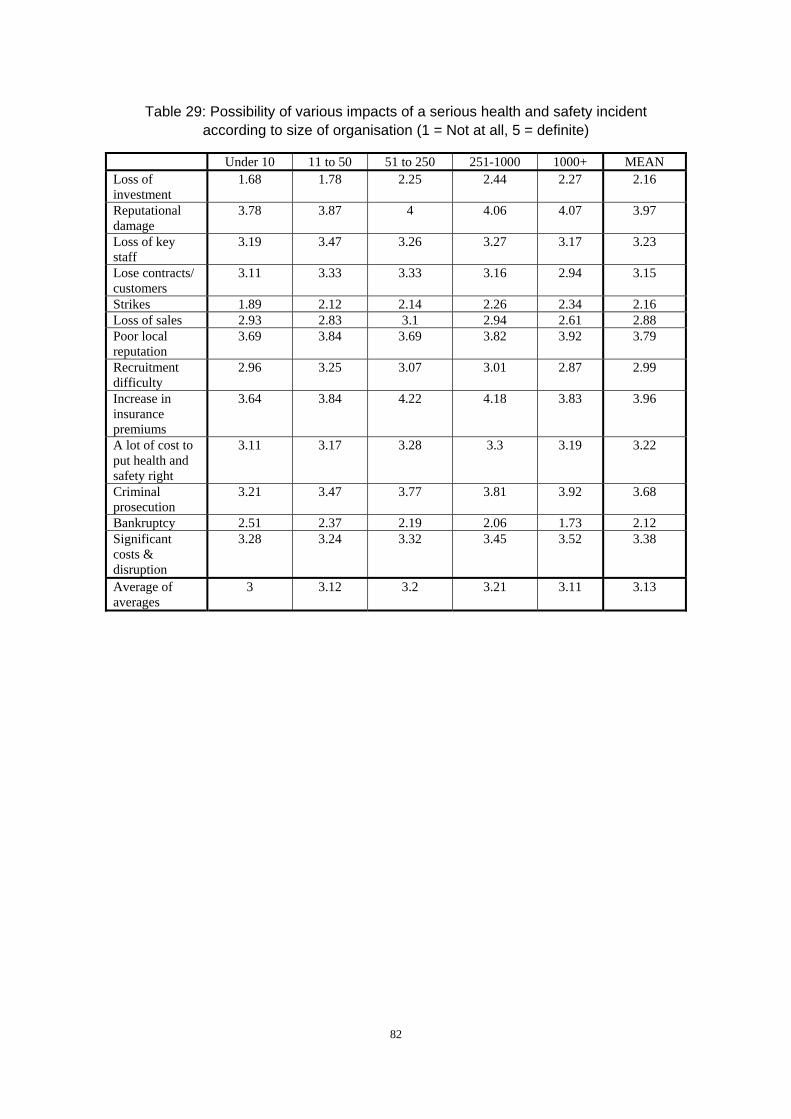
Table 29: Possibility of various impacts of a serious health and safety incident according to size of organisation (1 = Not at all, 5 = definite)
Under 10 11 to 50 51 to 250 251-1000 1000+ MEAN Loss of investment
1.68 1.78 2.25 2.44 2.27 2.16
Reputational damage
3.78 3.87 4 4.06 4.07 3.97
Loss of key staff
3.19 3.47 3.26 3.27 3.17 3.23
Lose contracts/ customers
3.11 3.33 3.33 3.16 2.94 3.15
Strikes 1.89 2.12 2.14 2.26 2.34 2.16 Loss of sales 2.93 2.83 3.1 2.94 2.61 2.88 Poor local reputation
3.69 3.84 3.69 3.82 3.92 3.79
Recruitment difficulty
2.96 3.25 3.07 3.01 2.87 2.99
Increase in insurance premiums
3.64 3.84 4.22 4.18 3.83 3.96
A lot of cost to put health and safety right
3.11 3.17 3.28 3.3 3.19 3.22
Criminal prosecution
3.21 3.47 3.77 3.81 3.92 3.68
Bankruptcy 2.51 2.37 2.19 2.06 1.73 2.12 Significant costs & disruption
3.28 3.24 3.32 3.45 3.52 3.38
Average of averages
3 3.12 3.2 3.21 3.11 3.13
82
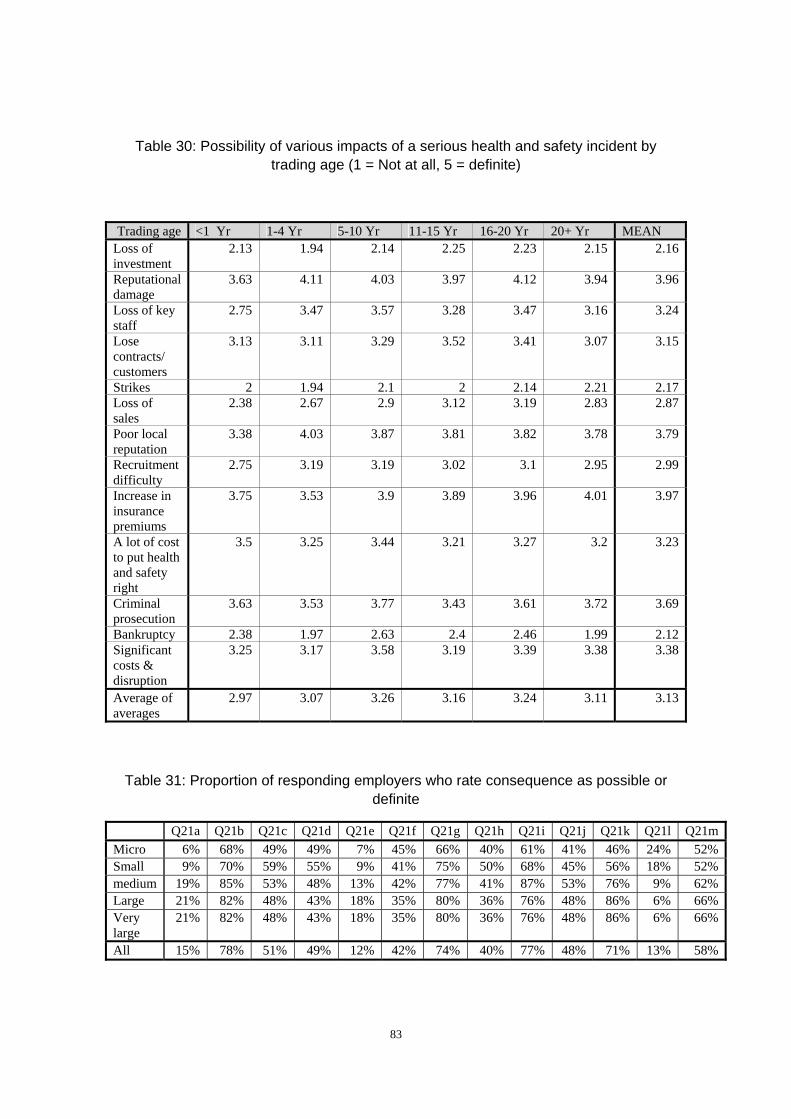
Table 30: Possibility of various impacts of a serious health and safety incident by trading age (1 = Not at all, 5 = definite)
Trading age <1 Yr 1-4 Yr 5-10 Yr 11-15 Yr 16-20 Yr 20+ Yr MEAN Loss of investment
2.13 1.94 2.14 2.25 2.23 2.15 2.16
Reputational damage
3.63 4.11 4.03 3.97 4.12 3.94 3.96
Loss of key staff
2.75 3.47 3.57 3.28 3.47 3.16 3.24
Lose contracts/ customers
3.13 3.11 3.29 3.52 3.41 3.07 3.15
Strikes 2 1.94 2.1 2 2.14 2.21 2.17Loss of sales
2.38 2.67 2.9 3.12 3.19 2.83 2.87
Poor local reputation
3.38 4.03 3.87 3.81 3.82 3.78 3.79
Recruitment difficulty
2.75 3.19 3.19 3.02 3.1 2.95 2.99
Increase in insurance premiums
3.75 3.53 3.9 3.89 3.96 4.01 3.97
A lot of cost to put health and safety right
3.5 3.25 3.44 3.21 3.27 3.2 3.23
Criminal prosecution
3.63 3.53 3.77 3.43 3.61 3.72 3.69
Bankruptcy 2.38 1.97 2.63 2.4 2.46 1.99 2.12Significant costs & disruption
3.25 3.17 3.58 3.19 3.39 3.38 3.38
Average of averages
2.97 3.07 3.26 3.16 3.24 3.11 3.13
Table 31: Proportion of responding employers who rate consequence as possible or definite
Q21a Q21b Q21c Q21d Q21e Q21f Q21g Q21h Q21i Q21j Q21k Q21l Q21mMicro 6% 68% 49% 49% 7% 45% 66% 40% 61% 41% 46% 24% 52%Small 9% 70% 59% 55% 9% 41% 75% 50% 68% 45% 56% 18% 52%medium 19% 85% 53% 48% 13% 42% 77% 41% 87% 53% 76% 9% 62%Large 21% 82% 48% 43% 18% 35% 80% 36% 76% 48% 86% 6% 66%Very large
21% 82% 48% 43% 18% 35% 80% 36% 76% 48% 86% 6% 66%
All 15% 78% 51% 49% 12% 42% 74% 40% 77% 48% 71% 13% 58%
83
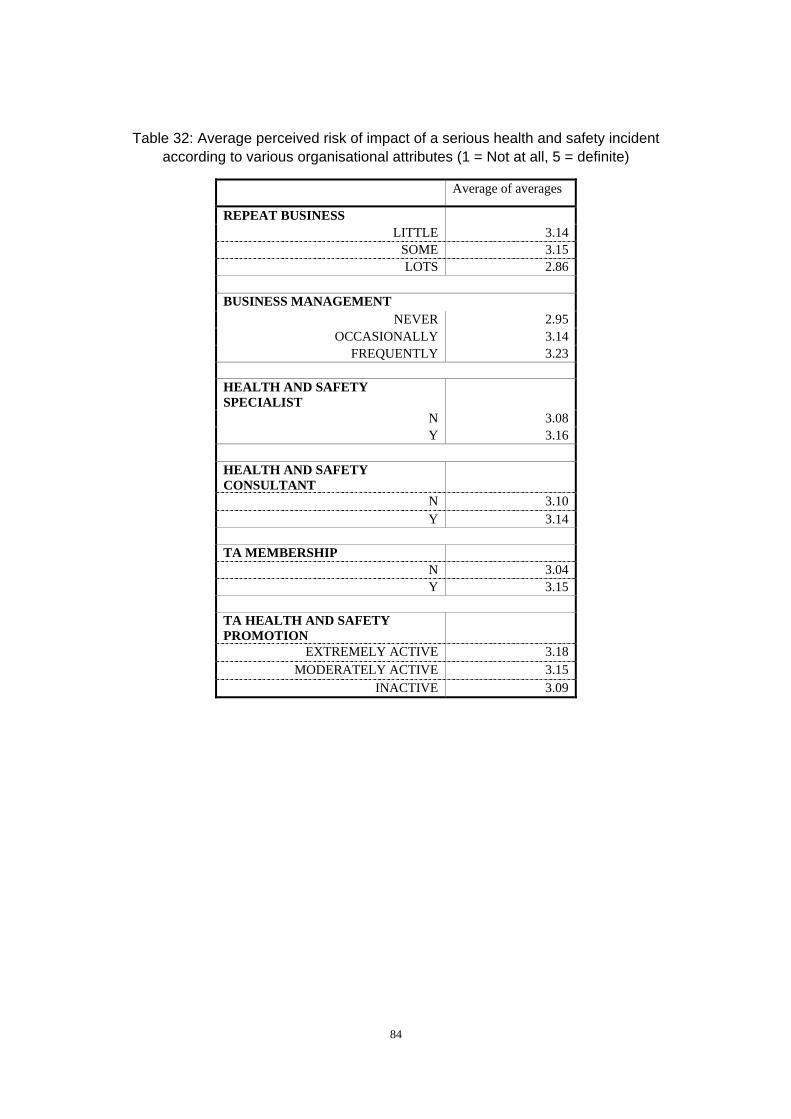
Table 32: Average perceived risk of impact of a serious health and safety incident according to various organisational attributes (1 = Not at all, 5 = definite)
Average of averages
REPEAT BUSINESS LITTLE 3.14
SOME 3.15 LOTS 2.86
BUSINESS MANAGEMENT
NEVER 2.95 OCCASIONALLY 3.14
FREQUENTLY 3.23
HEALTH AND SAFETY SPECIALIST
N 3.08 Y 3.16
HEALTH AND SAFETY CONSULTANT
N 3.10 Y 3.14
TA MEMBERSHIP
N 3.04 Y 3.15
TA HEALTH AND SAFETY PROMOTION
EXTREMELY ACTIVE 3.18 MODERATELY ACTIVE 3.15
INACTIVE 3.09
84
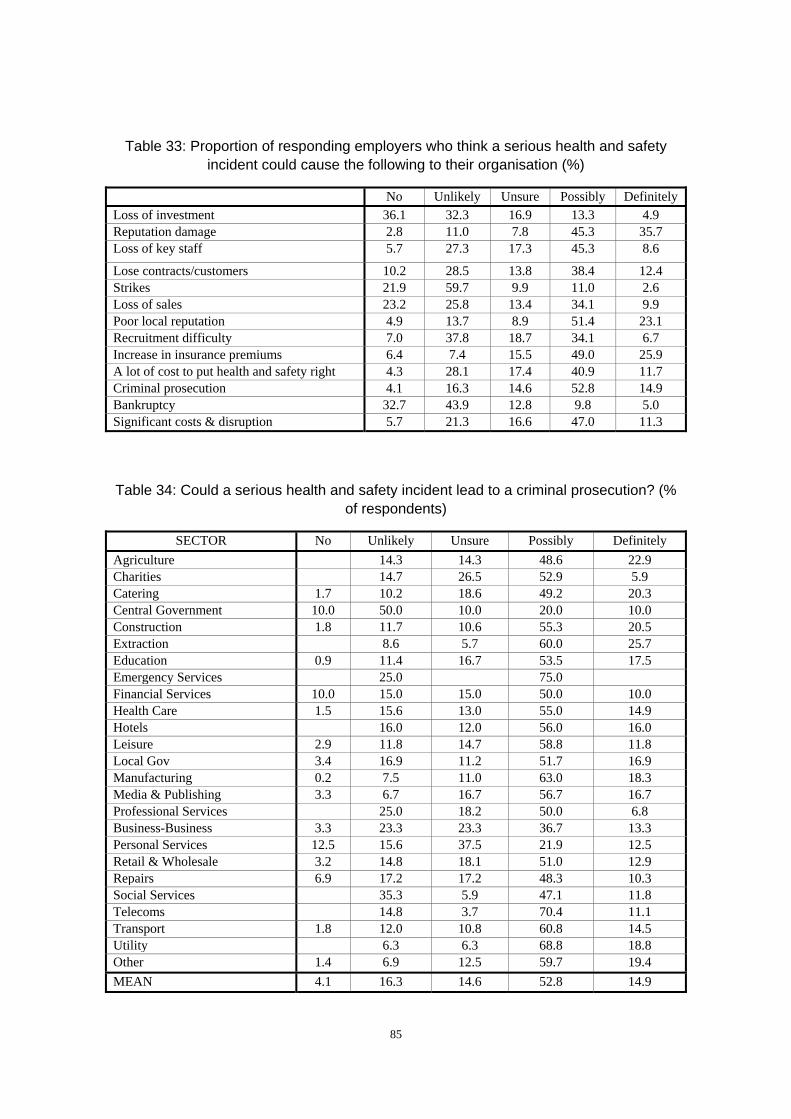
Table 33: Proportion of responding employers who think a serious health and safety incident could cause the following to their organisation (%)
No Unlikely Unsure Possibly Definitely Loss of investment 36.1 32.3 16.9 13.3 4.9 Reputation damage 2.8 11.0 7.8 45.3 35.7 Loss of key staff 5.7 27.3 17.3 45.3 8.6
Lose contracts/customers 10.2 28.5 13.8 38.4 12.4 Strikes 21.9 59.7 9.9 11.0 2.6 Loss of sales 23.2 25.8 13.4 34.1 9.9 Poor local reputation 4.9 13.7 8.9 51.4 23.1 Recruitment difficulty 7.0 37.8 18.7 34.1 6.7 Increase in insurance premiums 6.4 7.4 15.5 49.0 25.9 A lot of cost to put health and safety right 4.3 28.1 17.4 40.9 11.7 Criminal prosecution 4.1 16.3 14.6 52.8 14.9 Bankruptcy 32.7 43.9 12.8 9.8 5.0 Significant costs & disruption 5.7 21.3 16.6 47.0 11.3
Table 34: Could a serious health and safety incident lead to a criminal prosecution? (% of respondents)
SECTOR No Unlikely Unsure Possibly Definitely Agriculture 14.3 14.3 48.6 22.9 Charities 14.7 26.5 52.9 5.9 Catering 1.7 10.2 18.6 49.2 20.3 Central Government 10.0 50.0 10.0 20.0 10.0 Construction 1.8 11.7 10.6 55.3 20.5 Extraction 8.6 5.7 60.0 25.7 Education 0.9 11.4 16.7 53.5 17.5 Emergency Services 25.0 75.0 Financial Services 10.0 15.0 15.0 50.0 10.0 Health Care 1.5 15.6 13.0 55.0 14.9 Hotels 16.0 12.0 56.0 16.0 Leisure 2.9 11.8 14.7 58.8 11.8 Local Gov 3.4 16.9 11.2 51.7 16.9 Manufacturing 0.2 7.5 11.0 63.0 18.3 Media & Publishing 3.3 6.7 16.7 56.7 16.7 Professional Services 25.0 18.2 50.0 6.8 Business-Business 3.3 23.3 23.3 36.7 13.3 Personal Services 12.5 15.6 37.5 21.9 12.5 Retail & Wholesale 3.2 14.8 18.1 51.0 12.9 Repairs 6.9 17.2 17.2 48.3 10.3 Social Services 35.3 5.9 47.1 11.8 Telecoms 14.8 3.7 70.4 11.1 Transport 1.8 12.0 10.8 60.8 14.5 Utility 6.3 6.3 68.8 18.8 Other 1.4 6.9 12.5 59.7 19.4 MEAN 4.1 16.3 14.6 52.8 14.9
85
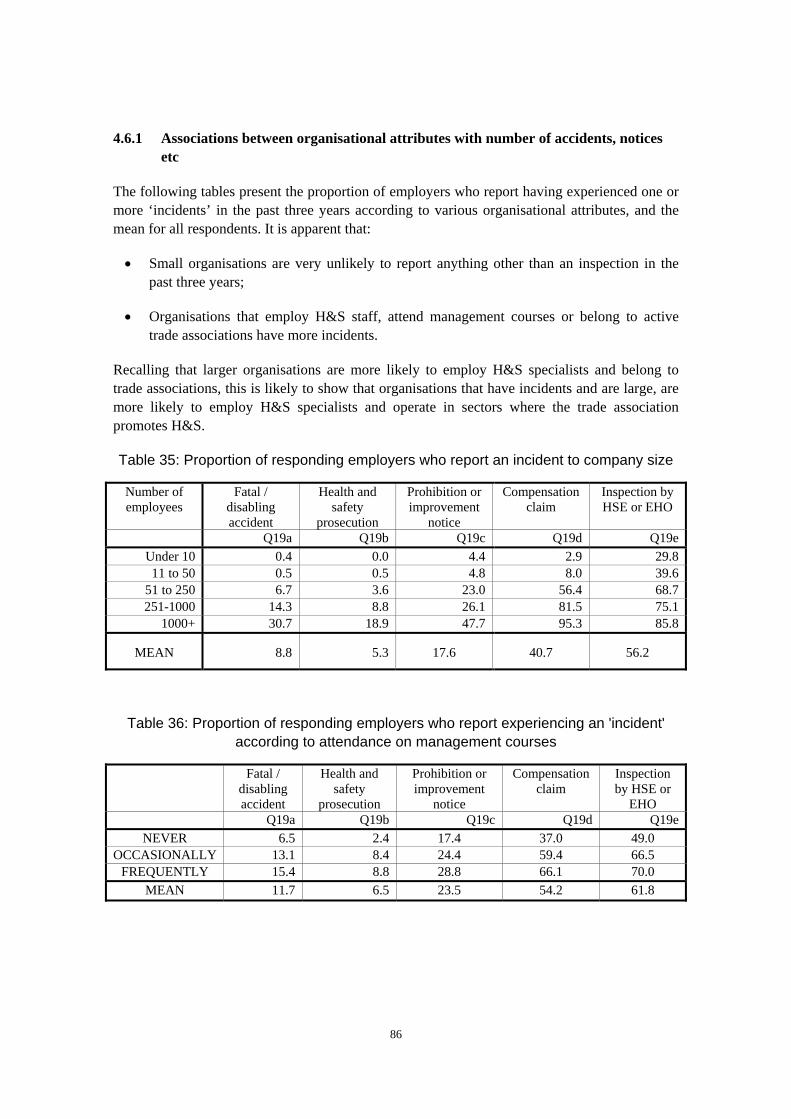
4.6.1 Associations between organisational attributes with number of accidents, notices etc
The following tables present the proportion of employers who report having experienced one or more ‘incidents’ in the past three years according to various organisational attributes, and the mean for all respondents. It is apparent that:
• Small organisations are very unlikely to report anything other than an inspection in the past three years;
• Organisations that employ H&S staff, attend management courses or belong to active trade associations have more incidents.
Recalling that larger organisations are more likely to employ H&S specialists and belong to trade associations, this is likely to show that organisations that have incidents and are large, are more likely to employ H&S specialists and operate in sectors where the trade association promotes H&S.
Table 35: Proportion of responding employers who report an incident to company size
Number of employees
Fatal / disabling accident
Health and safety
prosecution
Prohibition or improvement
notice
Compensation claim
Inspection by HSE or EHO
Q19a Q19b Q19c Q19d Q19eUnder 10 0.4 0.0 4.4 2.9 29.811 to 50 0.5 0.5 4.8 8.0 39.6
51 to 250 6.7 3.6 23.0 56.4 68.7251-1000 14.3 8.8 26.1 81.5 75.1
1000+ 30.7 18.9 47.7 95.3 85.8
MEAN 8.8 5.3 17.6 40.7 56.2
Table 36: Proportion of responding employers who report experiencing an 'incident' according to attendance on management courses
Fatal / disabling accident
Health and safety
prosecution
Prohibition or improvement
notice
Compensation claim
Inspection by HSE or
EHO Q19a Q19b Q19c Q19d Q19e
NEVER 6.5 2.4 17.4 37.0 49.0 OCCASIONALLY 13.1 8.4 24.4 59.4 66.5
FREQUENTLY 15.4 8.8 28.8 66.1 70.0 MEAN 11.7 6.5 23.5 54.2 61.8
86
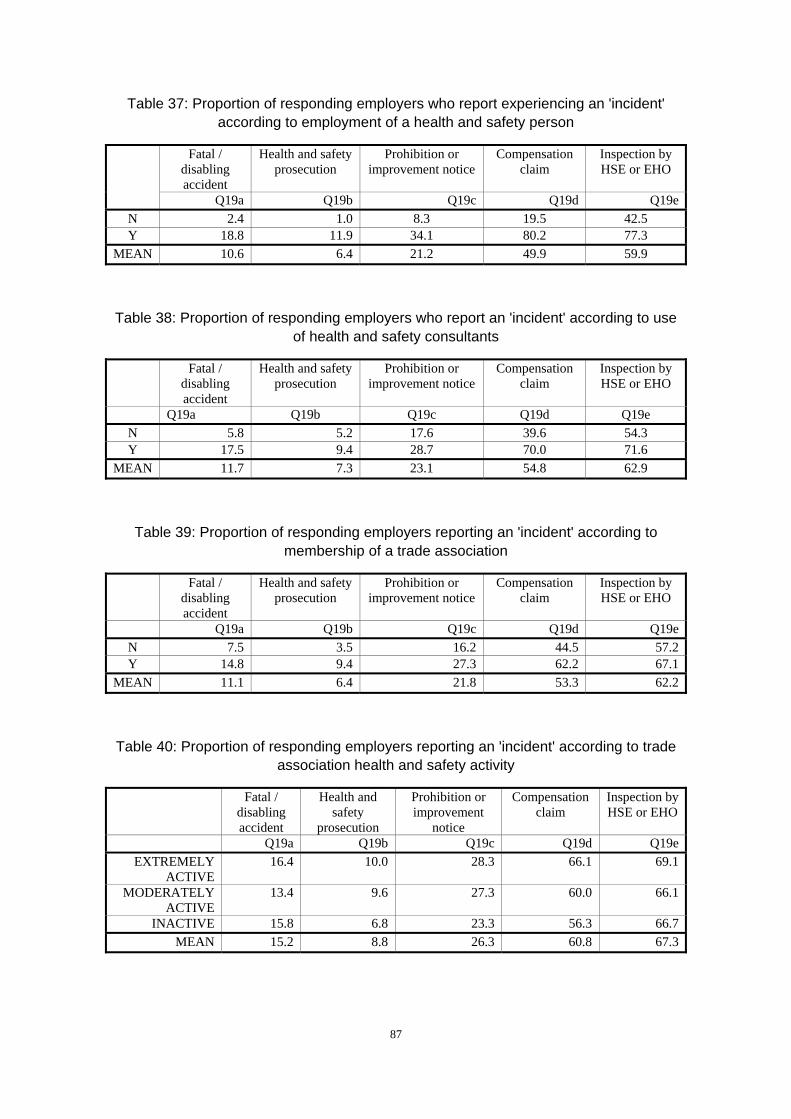
Table 37: Proportion of responding employers who report experiencing an 'incident' according to employment of a health and safety person
Fatal / disabling accident
Health and safety prosecution
Prohibition or improvement notice
Compensation claim
Inspection by HSE or EHO
Q19a Q19b Q19c Q19d Q19eN 2.4 1.0 8.3 19.5 42.5 Y 18.8 11.9 34.1 80.2 77.3
MEAN 10.6 6.4 21.2 49.9 59.9
Table 38: Proportion of responding employers who report an 'incident' according to use of health and safety consultants
Fatal / disabling accident
Health and safety prosecution
Prohibition or improvement notice
Compensation claim
Inspection by HSE or EHO
Q19a Q19b Q19c Q19d Q19e N 5.8 5.2 17.6 39.6 54.3 Y 17.5 9.4 28.7 70.0 71.6
MEAN 11.7 7.3 23.1 54.8 62.9
Table 39: Proportion of responding employers reporting an 'incident' according to membership of a trade association
Fatal / disabling accident
Health and safety prosecution
Prohibition or improvement notice
Compensation claim
Inspection by HSE or EHO
Q19a Q19b Q19c Q19d Q19eN 7.5 3.5 16.2 44.5 57.2Y 14.8 9.4 27.3 62.2 67.1
MEAN 11.1 6.4 21.8 53.3 62.2
Table 40: Proportion of responding employers reporting an 'incident' according to trade association health and safety activity
Fatal / disabling accident
Health and safety
prosecution
Prohibition or improvement
notice
Compensation claim
Inspection by HSE or EHO
Q19a Q19b Q19c Q19d Q19eEXTREMELY
ACTIVE 16.4 10.0 28.3 66.1 69.1
MODERATELY ACTIVE
13.4 9.6 27.3 60.0 66.1
INACTIVE 15.8 6.8 23.3 56.3 66.7MEAN 15.2 8.8 26.3 60.8 67.3
87
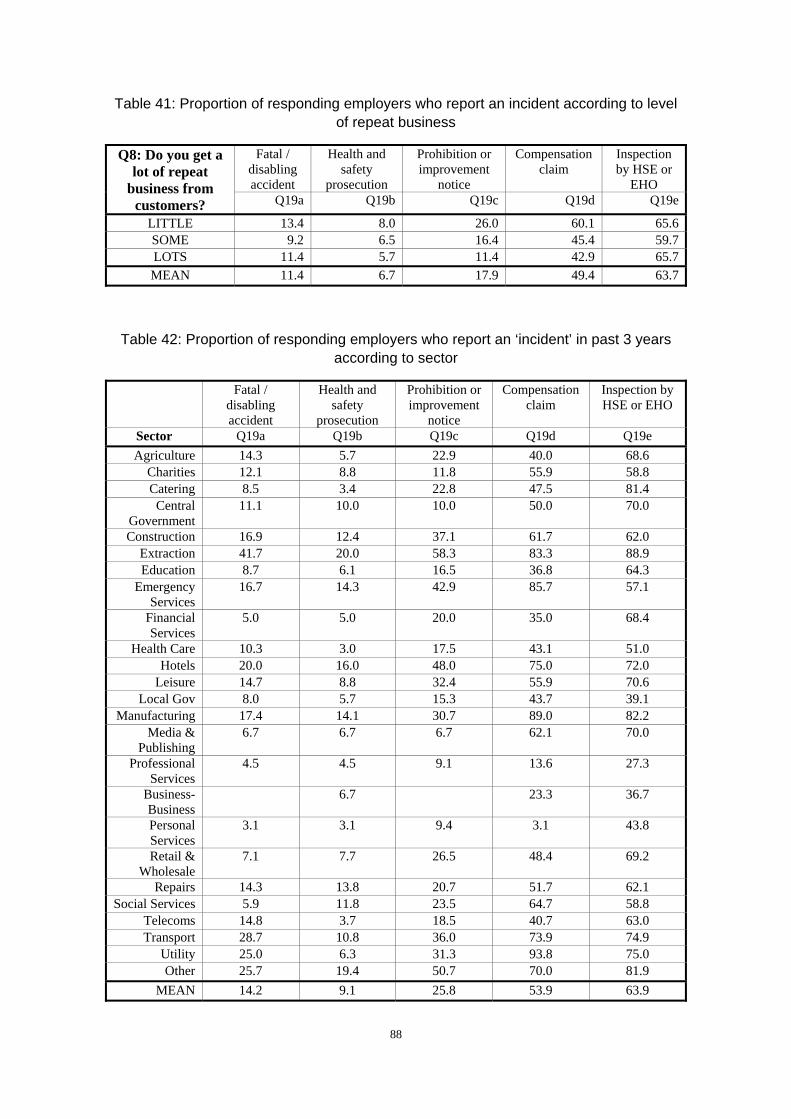
Table 41: Proportion of responding employers who report an incident according to level of repeat business
Fatal / disabling accident
Health and safety
prosecution
Prohibition or improvement
notice
Compensation claim
Inspection by HSE or
EHO
Q8: Do you get a lot of repeat
business from customers? Q19a Q19b Q19c Q19d Q19e
LITTLE 13.4 8.0 26.0 60.1 65.6SOME 9.2 6.5 16.4 45.4 59.7LOTS 11.4 5.7 11.4 42.9 65.7MEAN 11.4 6.7 17.9 49.4 63.7
Table 42: Proportion of responding employers who report an ‘incident’ in past 3 years according to sector
Fatal / disabling accident
Health and safety
prosecution
Prohibition or improvement
notice
Compensation claim
Inspection by HSE or EHO
Sector Q19a Q19b Q19c Q19d Q19e Agriculture 14.3 5.7 22.9 40.0 68.6
Charities 12.1 8.8 11.8 55.9 58.8 Catering 8.5 3.4 22.8 47.5 81.4
Central Government
11.1 10.0 10.0 50.0 70.0
Construction 16.9 12.4 37.1 61.7 62.0 Extraction 41.7 20.0 58.3 83.3 88.9 Education 8.7 6.1 16.5 36.8 64.3
Emergency Services
16.7 14.3 42.9 85.7 57.1
Financial Services
5.0 5.0 20.0 35.0 68.4
Health Care 10.3 3.0 17.5 43.1 51.0 Hotels 20.0 16.0 48.0 75.0 72.0
Leisure 14.7 8.8 32.4 55.9 70.6 Local Gov 8.0 5.7 15.3 43.7 39.1
Manufacturing 17.4 14.1 30.7 89.0 82.2 Media &
Publishing 6.7 6.7 6.7 62.1 70.0
Professional Services
4.5 4.5 9.1 13.6 27.3
Business-Business
6.7 23.3 36.7
Personal Services
3.1 3.1 9.4 3.1 43.8
Retail & Wholesale
7.1 7.7 26.5 48.4 69.2
Repairs 14.3 13.8 20.7 51.7 62.1 Social Services 5.9 11.8 23.5 64.7 58.8
Telecoms 14.8 3.7 18.5 40.7 63.0 Transport 28.7 10.8 36.0 73.9 74.9
Utility 25.0 6.3 31.3 93.8 75.0 Other 25.7 19.4 50.7 70.0 81.9
MEAN 14.2 9.1 25.8 53.9 63.9
88
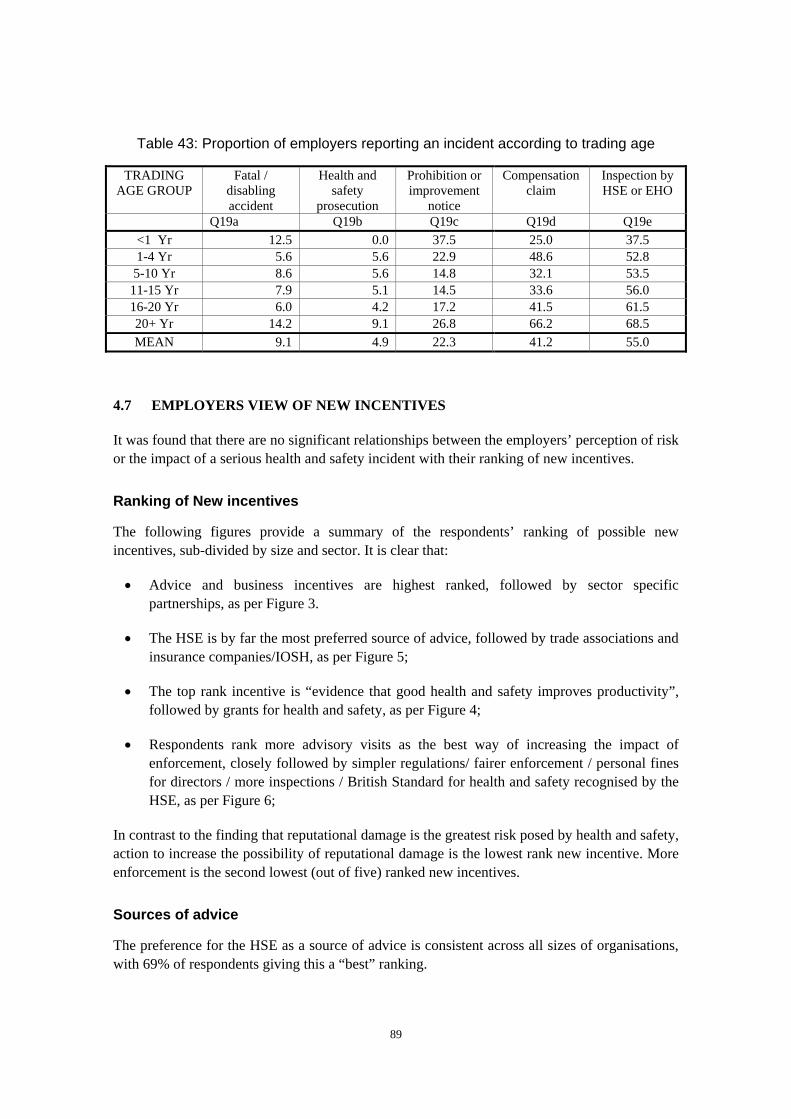
Table 43: Proportion of employers reporting an incident according to trading age
TRADING AGE GROUP
Fatal / disabling accident
Health and safety
prosecution
Prohibition or improvement
notice
Compensation claim
Inspection by HSE or EHO
Q19a Q19b Q19c Q19d Q19e <1 Yr 12.5 0.0 37.5 25.0 37.5 1-4 Yr 5.6 5.6 22.9 48.6 52.8 5-10 Yr 8.6 5.6 14.8 32.1 53.5
11-15 Yr 7.9 5.1 14.5 33.6 56.0 16-20 Yr 6.0 4.2 17.2 41.5 61.5 20+ Yr 14.2 9.1 26.8 66.2 68.5 MEAN 9.1 4.9 22.3 41.2 55.0
4.7 EMPLOYERS VIEW OF NEW INCENTIVES
It was found that there are no significant relationships between the employers’ perception of risk or the impact of a serious health and safety incident with their ranking of new incentives.
Ranking of New incentives
The following figures provide a summary of the respondents’ ranking of possible new incentives, sub-divided by size and sector. It is clear that:
• Advice and business incentives are highest ranked, followed by sector specific partnerships, as per Figure 3.
• The HSE is by far the most preferred source of advice, followed by trade associations and insurance companies/IOSH, as per Figure 5;
• The top rank incentive is “evidence that good health and safety improves productivity”, followed by grants for health and safety, as per Figure 4;
• Respondents rank more advisory visits as the best way of increasing the impact of enforcement, closely followed by simpler regulations/ fairer enforcement / personal fines for directors / more inspections / British Standard for health and safety recognised by the HSE, as per Figure 6;
In contrast to the finding that reputational damage is the greatest risk posed by health and safety, action to increase the possibility of reputational damage is the lowest rank new incentive. More enforcement is the second lowest (out of five) ranked new incentives.
Sources of advice
The preference for the HSE as a source of advice is consistent across all sizes of organisations, with 69% of respondents giving this a “best” ranking.
89
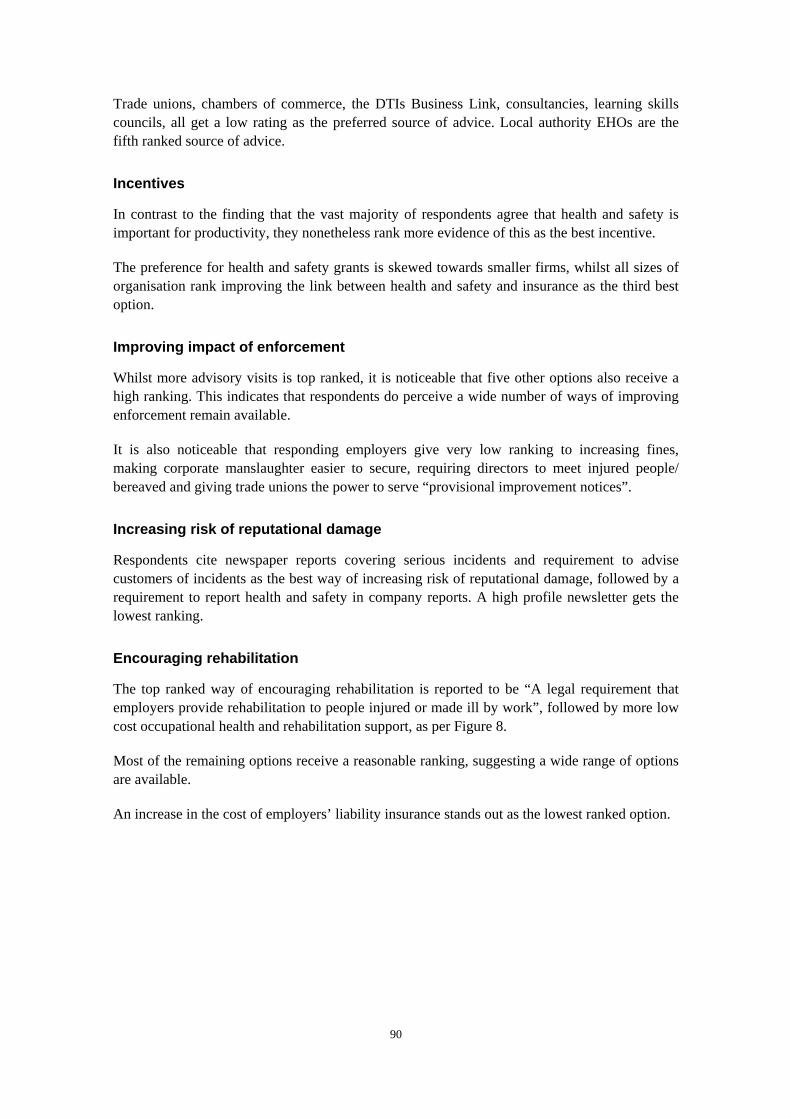
Trade unions, chambers of commerce, the DTIs Business Link, consultancies, learning skills councils, all get a low rating as the preferred source of advice. Local authority EHOs are the fifth ranked source of advice.
Incentives
In contrast to the finding that the vast majority of respondents agree that health and safety is important for productivity, they nonetheless rank more evidence of this as the best incentive.
The preference for health and safety grants is skewed towards smaller firms, whilst all sizes of organisation rank improving the link between health and safety and insurance as the third best option.
Improving impact of enforcement
Whilst more advisory visits is top ranked, it is noticeable that five other options also receive a high ranking. This indicates that respondents do perceive a wide number of ways of improving enforcement remain available.
It is also noticeable that responding employers give very low ranking to increasing fines, making corporate manslaughter easier to secure, requiring directors to meet injured people/ bereaved and giving trade unions the power to serve “provisional improvement notices”.
Increasing risk of reputational damage
Respondents cite newspaper reports covering serious incidents and requirement to advise customers of incidents as the best way of increasing risk of reputational damage, followed by a requirement to report health and safety in company reports. A high profile newsletter gets the lowest ranking.
Encouraging rehabilitation
The top ranked way of encouraging rehabilitation is reported to be “A legal requirement that employers provide rehabilitation to people injured or made ill by work”, followed by more low cost occupational health and rehabilitation support, as per Figure 8.
Most of the remaining options receive a reasonable ranking, suggesting a wide range of options are available.
An increase in the cost of employers’ liability insurance stands out as the lowest ranked option.
90
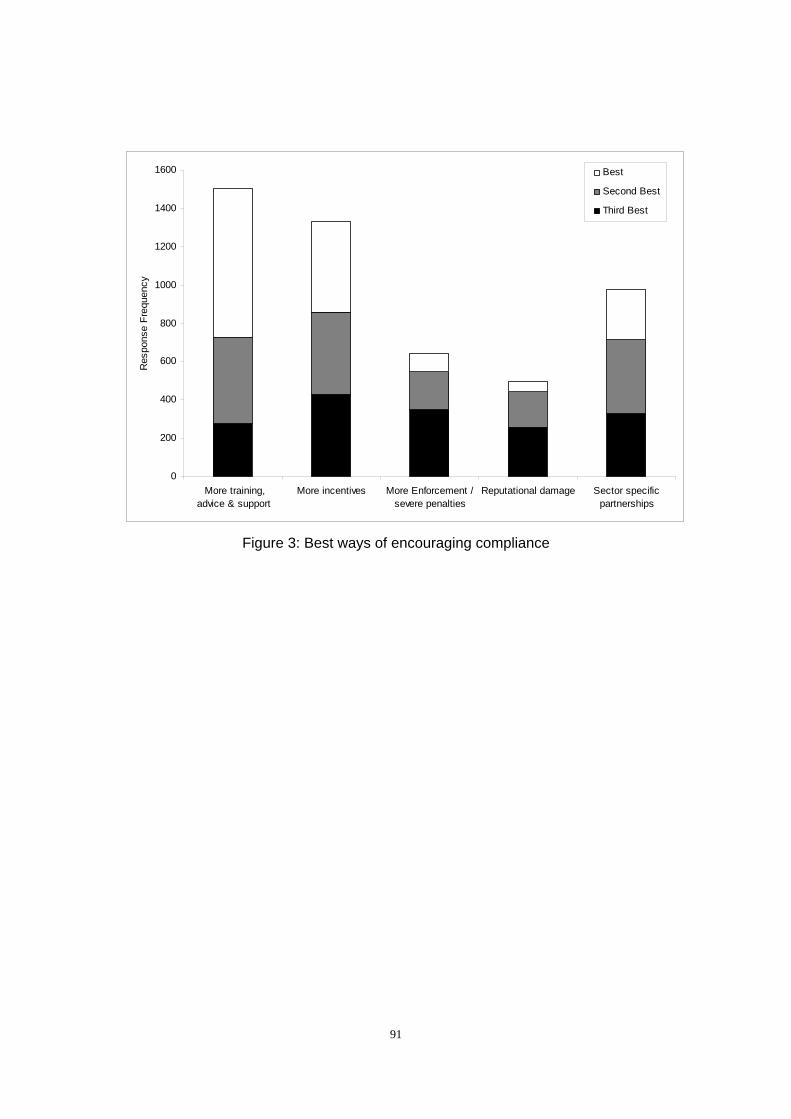
0
200
400
600
800
1000
1200
1400
1600
More training, advice & support
More incentives More Enforcement /severe penalties
Reputational damage Sector specificpartnerships
Res
pons
e Fr
eque
ncy
Best
Second Best
Third Best
Figure 3: Best ways of encouraging compliance
91
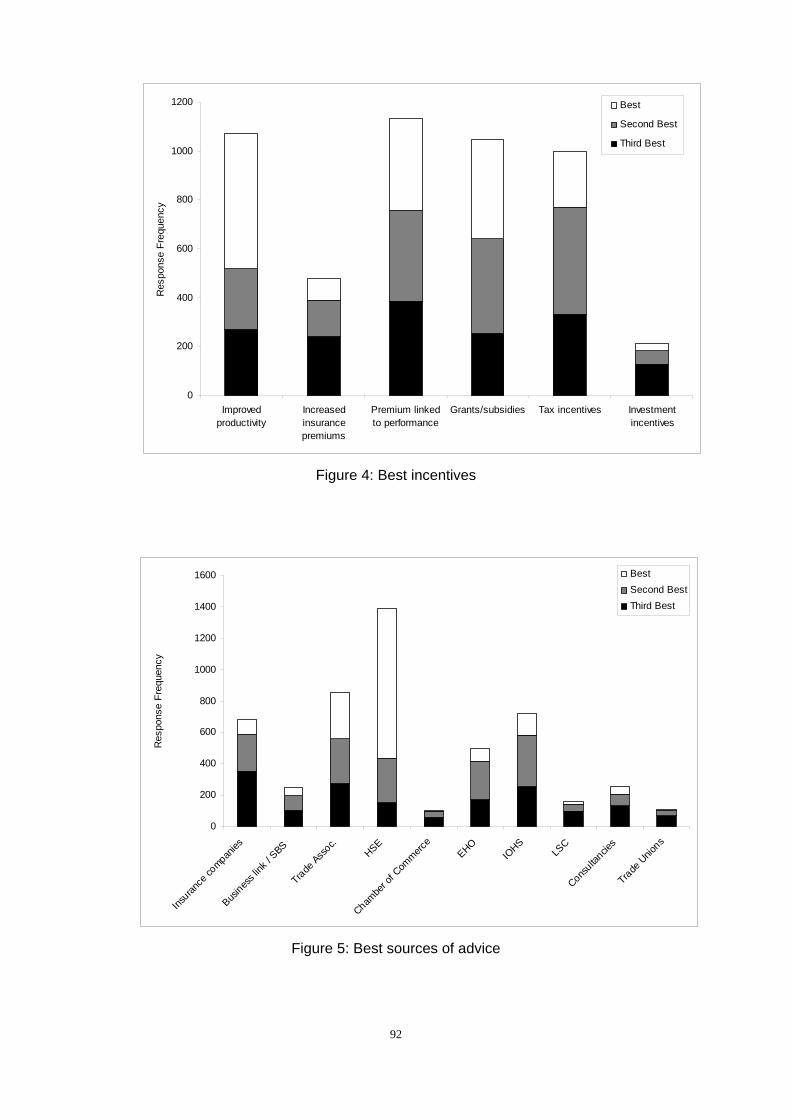
0
200
400
600
800
1000
1200
Improvedproductivity
Increasedinsurancepremiums
Premium linkedto performance
Grants/subsidies Tax incentives Investmentincentives
Res
pons
e Fr
eque
ncy
Best
Second Best
Third Best
Figure 4: Best incentives
0
200
400
600
800
1000
1200
1400
1600
Insuran
ce co
mpanies
Busines
s link
/ SBS
Trade Ass
oc.HSE
Chambe
r of C
ommerc
eEHO
IOHS
LSC
Consulta
ncies
Trade U
nions
Res
pons
e Fr
eque
ncy
BestSecond BestThird Best
Figure 5: Best sources of advice
92
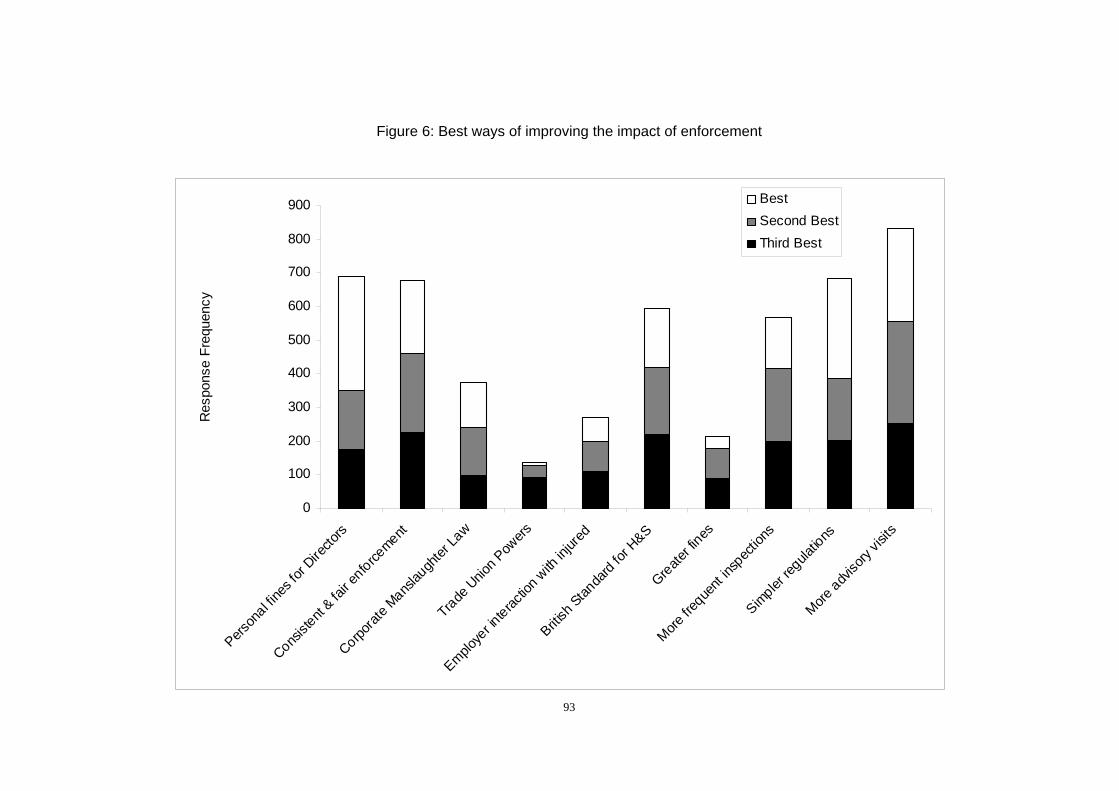
Figure 6: Best ways of improving the impact of enforcement
0
100
200
300
400
500
600
700
800
900
Person
al fine
s for
Directo
rs
Consist
ent & fa
ir enforce
ment
Corporat
e Mans
laugh
ter La
wTrade
Unio
n Powers
Employe
r interac
tion w
ith in
jured
British
Standa
rd for H
&S Greate
r fines
More fre
quent
inspec
tions
Simpler
regula
tions
More adv
isory
visits
Res
pons
e Fr
eque
ncy
BestSecond BestThird Best
93
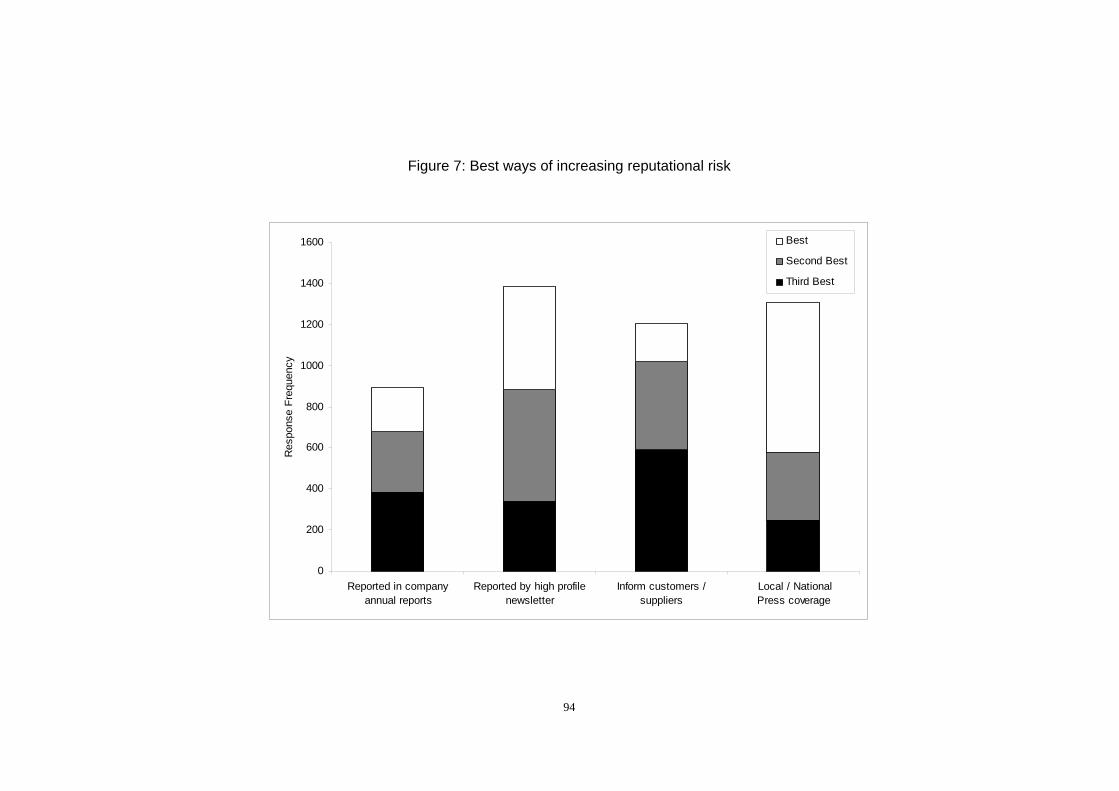
Figure 7: Best ways of increasing reputational risk
0
200
400
600
800
1000
1200
1400
1600
Reported in companyannual reports
Reported by high profilenewsletter
Inform customers /suppliers
Local / National Press coverage
Res
pons
e Fr
eque
ncy
Best
Second Best
Third Best
94
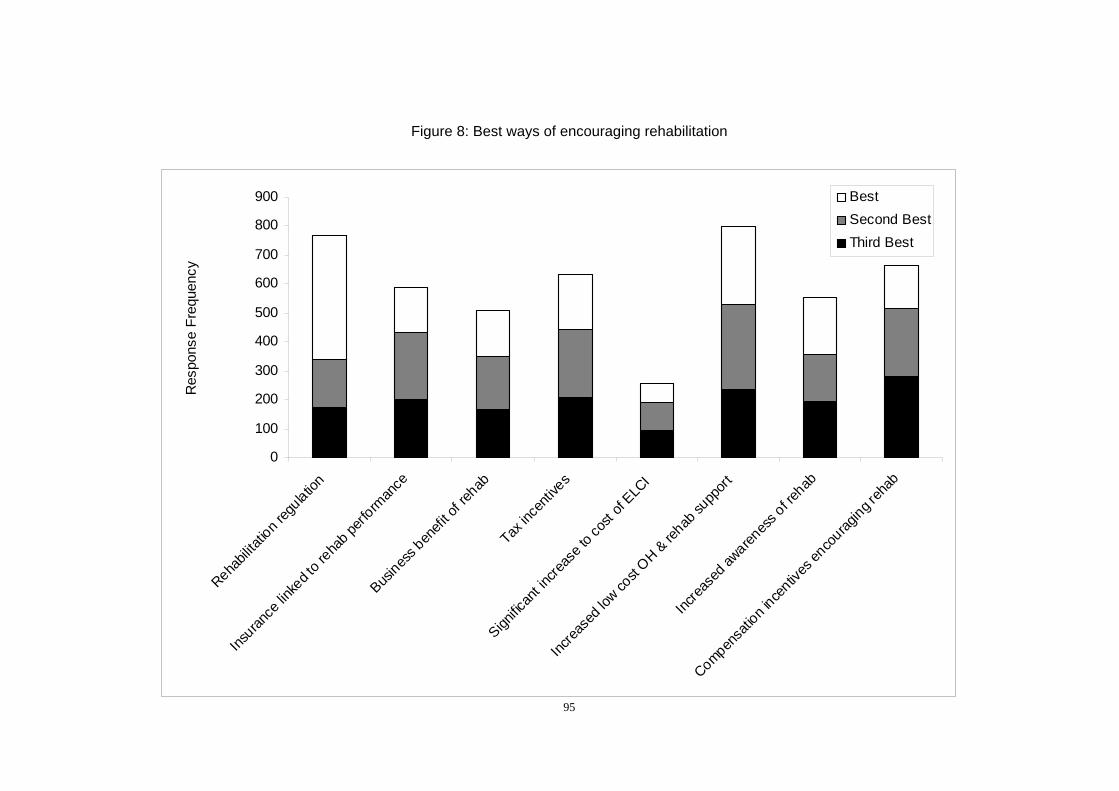
Figure 8: Best ways of encouraging rehabilitation
0
100
200
300
400
500
600
700
800
900
Rehabil
itatio
n reg
ulation
Insuran
ce lin
ked t
o reha
b perf
orman
ce
Busines
s ben
efit o
f rehab
Tax in
centi
ves
Signific
ant in
creas
e to c
ost o
f ELC
I
Increa
sed l
ow co
st OH & re
hab su
pport
Increa
sed a
warenes
s of re
hab
Compensa
tion i
ncentiv
es en
courag
ing reh
ab
Res
pons
e Fr
eque
ncy
BestSecond BestThird Best
95
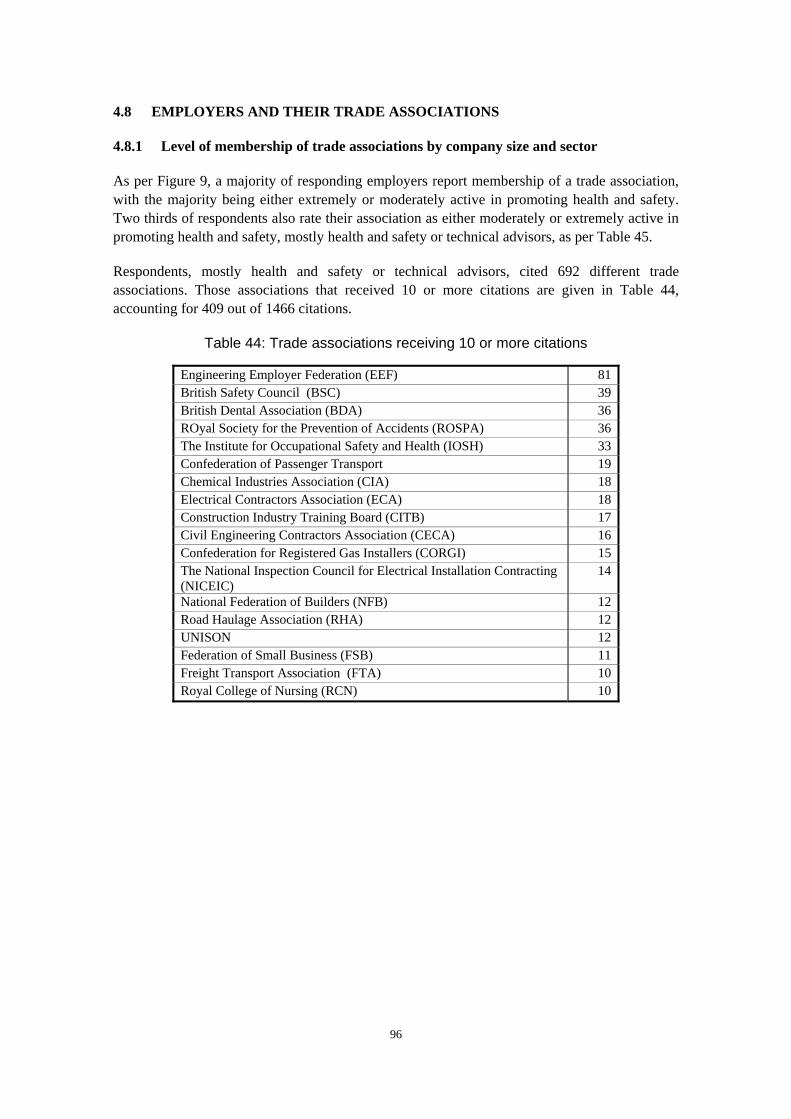
4.8 EMPLOYERS AND THEIR TRADE ASSOCIATIONS
4.8.1 Level of membership of trade associations by company size and sector
As per Figure 9, a majority of responding employers report membership of a trade association, with the majority being either extremely or moderately active in promoting health and safety. Two thirds of respondents also rate their association as either moderately or extremely active in promoting health and safety, mostly health and safety or technical advisors, as per Table 45.
Respondents, mostly health and safety or technical advisors, cited 692 different trade associations. Those associations that received 10 or more citations are given in Table 44, accounting for 409 out of 1466 citations.
Table 44: Trade associations receiving 10 or more citations
Engineering Employer Federation (EEF) 81 British Safety Council (BSC) 39 British Dental Association (BDA) 36 ROyal Society for the Prevention of Accidents (ROSPA) 36 The Institute for Occupational Safety and Health (IOSH) 33 Confederation of Passenger Transport 19 Chemical Industries Association (CIA) 18 Electrical Contractors Association (ECA) 18 Construction Industry Training Board (CITB) 17 Civil Engineering Contractors Association (CECA) 16 Confederation for Registered Gas Installers (CORGI) 15 The National Inspection Council for Electrical Installation Contracting (NICEIC)
14
National Federation of Builders (NFB) 12 Road Haulage Association (RHA) 12 UNISON 12 Federation of Small Business (FSB) 11 Freight Transport Association (FTA) 10 Royal College of Nursing (RCN) 10
96
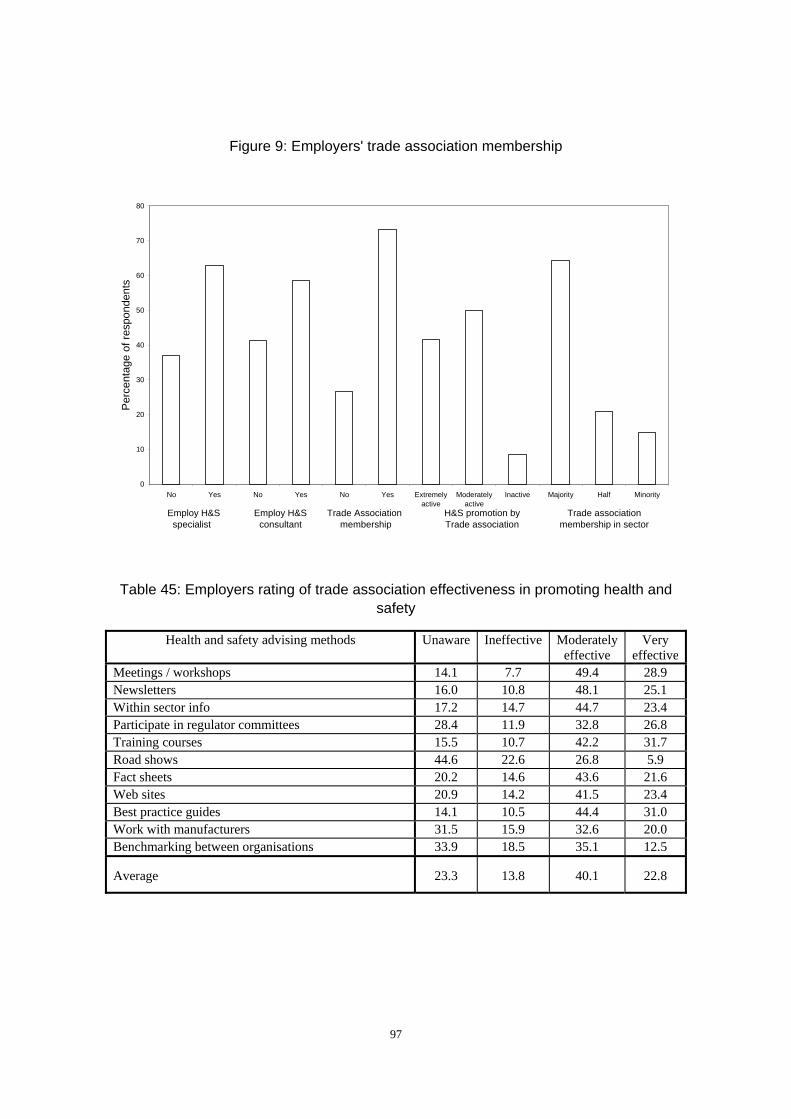
Figure 9: Employers' trade association membership
0
10
20
30
40
50
60
70
80
No Yes No Yes No Yes Extremelyactive
Moderatelyactive
Inactive Majority Half Minority
Per
cent
age
of re
spon
dent
s
Employ H&S specialist
Employ H&S consultant
Trade Association membership
H&S promotion by Trade association
Trade association membership in sector
Table 45: Employers rating of trade association effectiveness in promoting health and safety
Health and safety advising methods Unaware Ineffective Moderately effective
Very effective
Meetings / workshops 14.1 7.7 49.4 28.9 Newsletters 16.0 10.8 48.1 25.1 Within sector info 17.2 14.7 44.7 23.4 Participate in regulator committees 28.4 11.9 32.8 26.8 Training courses 15.5 10.7 42.2 31.7 Road shows 44.6 22.6 26.8 5.9 Fact sheets 20.2 14.6 43.6 21.6 Web sites 20.9 14.2 41.5 23.4 Best practice guides 14.1 10.5 44.4 31.0 Work with manufacturers 31.5 15.9 32.6 20.0 Benchmarking between organisations 33.9 18.5 35.1 12.5
Average 23.3 13.8 40.1 22.8
97
4.9 FREE TEXT SUGGESTIONS AND COMMENTS
4.9.1 Introduction
The majority of comments respondents made support the general observations already made at length in previous sections. However, a number of comments were made on issues that have not already been covered in depth, but nevertheless raise a number of pertinent and interesting general points about how best to motivate companies to improve health and safety performance. Predictably, the majority of comments were aimed at how the HSE could improve performance. Employers made a number of comments, some of which are echoed in the intermediary’s free text responses (see section 5.5).
The comments below are presented by theme, and are indicative of the views expressed by respondents.
4.9.2 HSE under resourcing
There were a number of respondents that commented on the poor resourcing of the HSE, and that this may affect the effectiveness of the HSE in terms of improving health and safety performance. This view is typified in the following comment:
‘I think the HSE is massively under-resourced at the moment’.
4.9.3 The number of HSE regulations and complexity
Regarding the number of regulations in force, a number of respondents commented that there were simply: ‘too many regulations’. Similarly, a number of respondents commented that HSE regulations are not only too numerous, but very often couched in language that many find difficult to understand and follow. As one respondent put it:
‘…There a thousands and thousands of regs written in gibberish. Plain English please, with advisory suggestions…’
Another put it like this:
‘…Keep regulations simple, and clear to understand…’
A number of respondents, representing small companies in particular, had the impression of being overwhelmed by the sheer number of regulations:
‘…The main problem many small businesses find is that they are overwhelmed by the sheer number and complexity of regs…’
The last view accords with the findings of this report, i.e. that small companies tend to perceive health and safety as a burden. A number of respondents from small companies commented that resourcing health and safety was also an issue, especially when the business has not been operating for long.
98
4.9.4 Directors being qualified in health and safety
Some respondent’s commented that they felt there should be legislation introduced to ensure that senior managers and directors meet a minimum standard in terms of their knowledge of health and safety. This view is characterised, as follows:
‘…all senior management and directors to achieve a minimal H&S qualification.’
Another commented, thus:
‘…All company directors should have some recognised formal training in health and safety’.
And yet another commented:
‘Ensure directors have a good understanding of their role in respect of health and safety. Qualify them’.
4.9.5 Availability of H&S resource materials, publications and services
A number of respondent’s commented that HSE publications should made available for no cost as away of allowing companies to reduce costs and encourage uptake. Others commented that publications available via the internet as a downloadable file would also help, again at no cost.
These thoughts are typified in the following comment:
‘I believe that all publications by the HSE (HSMO) should be made readily available and free.’
Other believed that the HSE could usefully supply health and safety videos at a reduced price. Thus, one respondent commented:
‘Providing a video lending service at a nominal value, covering a more diverse area than is currently available.’
Others put it this way:
‘Make more leaflets and regs free access’ and: ‘Make more publications free of charge.’
4.9.6 International occupational health and safety standards
A view was occasionally expressed that occupational health and safety standards ought to apply internationally. This view was summed up, as follows:
‘Establish an international standard for OSH that is endorsed by the HSE. This should then become a legal requirement and audited by the HSE.’
4.9.7 Guidance
Some respondents thought health and safety guidance from the HSE could be improved, especially regarding minimum standards and that this did not seem to be clearly laid out. Thus, it was commented:
99
‘More guidance regarding minimum standards, e.g. BSI for health and safety’
Other had commented that the HSE did not seem especially disposed to providing guidance. This is typified in the following comment, thus:
‘HSE could help by giving actual advice, which they currently refuse to do.’
Another commented that:
‘With smaller organsiations than ours, support is essential, so long as it is delivered in pragmatic way.’
4.9.8 Whistle blowers
One respondent felt that more effort should be made to act on whistle blowers, reporting that several things he had reported had not been followed up. He put it this way:
‘Act more upon whistle blowers complaints. I have informed H&S (HSE?) on 2 very dangerous building sites and seen no evidence of improvement’.
100
5 ANALYSIS OF INTERMEDIARIES’ RESPONSES
5.1 OVERVIEW
The key findings are that:
• Two thirds of intermediaries rate themselves as active in promoting health and safety, effective at doing so and willing to work with the HSE;
• They gauge that either the majority or a half of organisations are members of trade associations;
• The level of health and safety activity and willingness to work with the HSE varies by sector;
• The characteristics of intermediaries and employers along with their ranking of new incentives, are similar.
Comparison of employers versus intermediaries ranking of new incentives
In an attempt to identify if both intermediaries and employers supported the same incentives, fully nested ANOVA was conducted with type of respondents (intermediary vs employer) and new incentive (all represented) as levels. The ANOVA showed no significant overall differences present between groups of respondents (total d.f. =353, F=0.687, p=0.409). Furthermore, testing for differences in the individual and overall mean between respondents and employers revealed no significant differences in those measures. Paired t-tests of transformed data (to ensure normality) showed no significant differences in the means of either group for the levels of new incentives chosen (individual: d.f.= 42 t= -0.062, p=0.95; overall: d.f.= 42, t=0.76, p= 0.45), despite some differences in individual new incentives, as shown in 12.5.
Comparison of employers’ versus intermediaries’ characteristics
Wilcoxon signed rank tests were used to compare each of the attributes of employers and intermediaries, in order to test for differences between respondents. In all tests, no significant differences were found in the levels or types of responses (p>0.05), suggesting that both the intermediaries and employers that responded shared the same attributes and organisational characteristics, i.e. all respondents were from similar backgrounds and shared the same working characteristics.
101
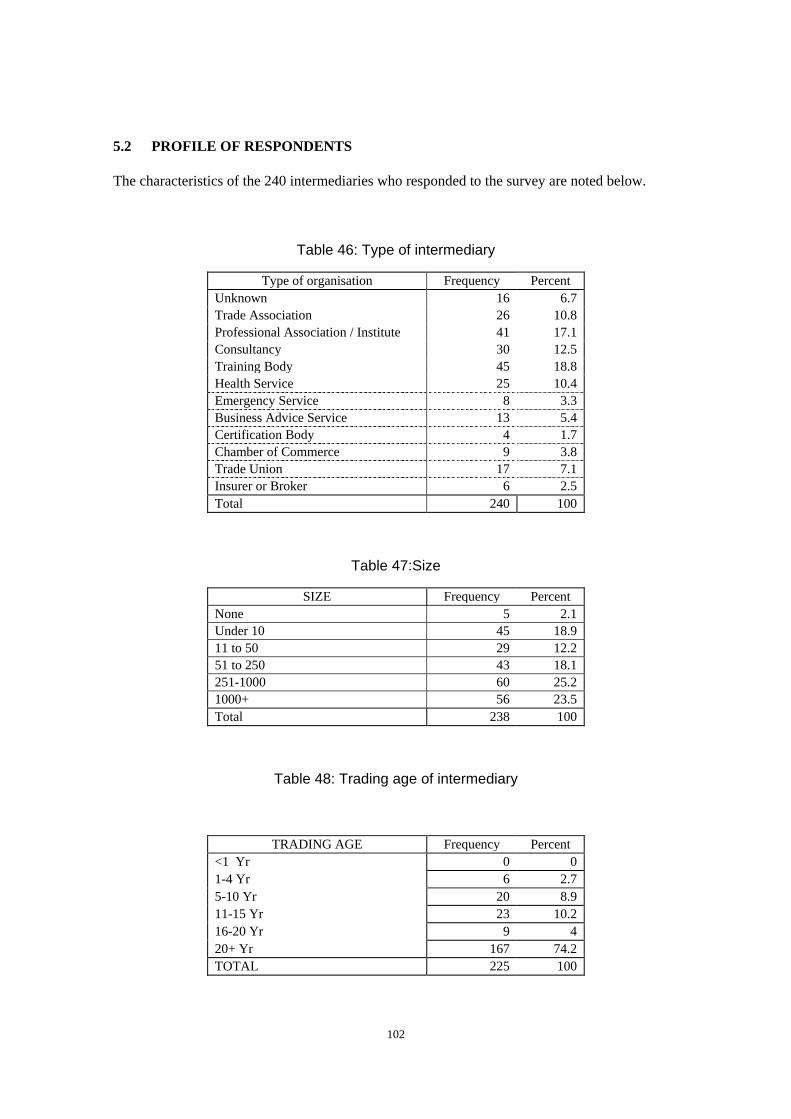
5.2 PROFILE OF RESPONDENTS
The characteristics of the 240 intermediaries who responded to the survey are noted below.
Table 46: Type of intermediary
Type of organisation Frequency Percent Unknown 16 6.7 Trade Association 26 10.8 Professional Association / Institute 41 17.1 Consultancy 30 12.5 Training Body 45 18.8 Health Service 25 10.4 Emergency Service 8 3.3 Business Advice Service 13 5.4 Certification Body 4 1.7 Chamber of Commerce 9 3.8 Trade Union 17 7.1 Insurer or Broker 6 2.5 Total 240 100
Table 47:Size
SIZE Frequency Percent None 5 2.1 Under 10 45 18.9 11 to 50 29 12.2 51 to 250 43 18.1 251-1000 60 25.2 1000+ 56 23.5 Total 238 100
Table 48: Trading age of intermediary
TRADING AGE Frequency Percent <1 Yr 0 0 1-4 Yr 6 2.7 5-10 Yr 20 8.9 11-15 Yr 23 10.2 16-20 Yr 9 4 20+ Yr 167 74.2 TOTAL 225 100
102
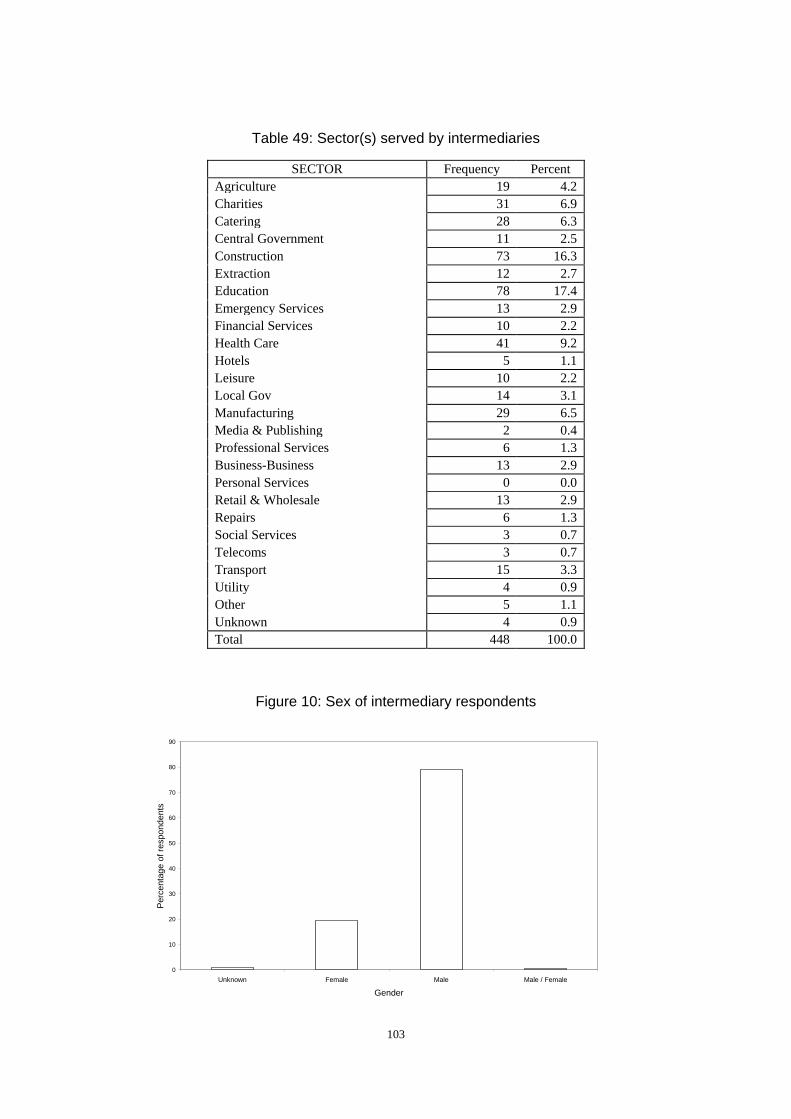
Table 49: Sector(s) served by intermediaries
SECTOR Frequency Percent Agriculture 19 4.2 Charities 31 6.9 Catering 28 6.3 Central Government 11 2.5 Construction 73 16.3 Extraction 12 2.7 Education 78 17.4 Emergency Services 13 2.9 Financial Services 10 2.2 Health Care 41 9.2 Hotels 5 1.1 Leisure 10 2.2 Local Gov 14 3.1 Manufacturing 29 6.5 Media & Publishing 2 0.4 Professional Services 6 1.3 Business-Business 13 2.9 Personal Services 0 0.0 Retail & Wholesale 13 2.9 Repairs 6 1.3 Social Services 3 0.7 Telecoms 3 0.7 Transport 15 3.3 Utility 4 0.9 Other 5 1.1 Unknown 4 0.9 Total 448 100.0
Figure 10: Sex of intermediary respondents
0
10
20
30
40
50
60
70
80
90
Unknown Female Male Male / Female
Gender
Per
cent
age
of re
spon
dent
s
103
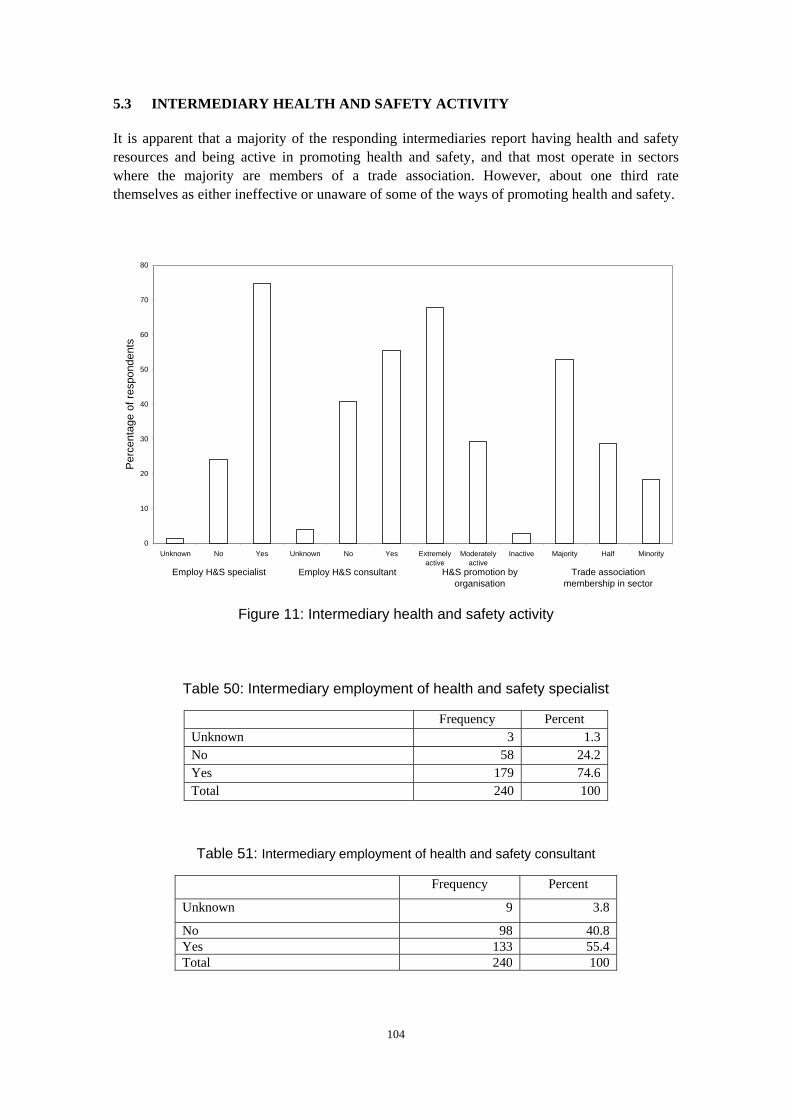
5.3 INTERMEDIARY HEALTH AND SAFETY ACTIVITY
It is apparent that a majority of the responding intermediaries report having health and safety resources and being active in promoting health and safety, and that most operate in sectors where the majority are members of a trade association. However, about one third rate themselves as either ineffective or unaware of some of the ways of promoting health and safety.
0
10
20
30
40
50
60
70
80
Unknown No Yes Unknown No Yes Extremelyactive
Moderatelyactive
Inactive Majority Half Minority
Per
cent
age
of re
spon
dent
s
Employ H&S specialist Employ H&S consultant H&S promotion byorganisation
Trade association membership in sector
Figure 11: Intermediary health and safety activity
Table 50: Intermediary employment of health and safety specialist
Frequency Percent Unknown 3 1.3 No 58 24.2 Yes 179 74.6 Total 240 100
Table 51: Intermediary employment of health and safety consultant
Frequency Percent
Unknown 9 3.8
No 98 40.8 Yes 133 55.4 Total 240 100
104
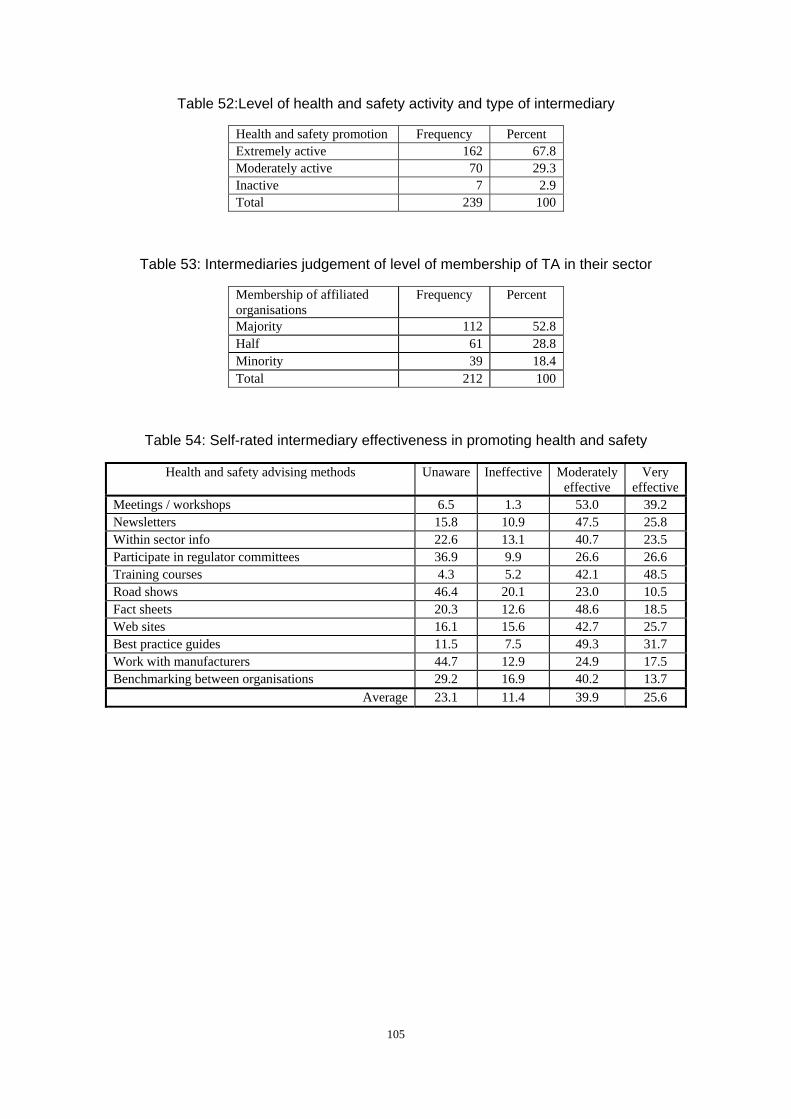
Table 52:Level of health and safety activity and type of intermediary
Health and safety promotion Frequency Percent Extremely active 162 67.8 Moderately active 70 29.3 Inactive 7 2.9 Total 239 100
Table 53: Intermediaries judgement of level of membership of TA in their sector
Membership of affiliated organisations
Frequency Percent
Majority 112 52.8 Half 61 28.8 Minority 39 18.4 Total 212 100
Table 54: Self-rated intermediary effectiveness in promoting health and safety
Health and safety advising methods Unaware Ineffective Moderately effective
Very effective
Meetings / workshops 6.5 1.3 53.0 39.2 Newsletters 15.8 10.9 47.5 25.8 Within sector info 22.6 13.1 40.7 23.5 Participate in regulator committees 36.9 9.9 26.6 26.6 Training courses 4.3 5.2 42.1 48.5 Road shows 46.4 20.1 23.0 10.5 Fact sheets 20.3 12.6 48.6 18.5 Web sites 16.1 15.6 42.7 25.7 Best practice guides 11.5 7.5 49.3 31.7 Work with manufacturers 44.7 12.9 24.9 17.5 Benchmarking between organisations 29.2 16.9 40.2 13.7
Average 23.1 11.4 39.9 25.6
105
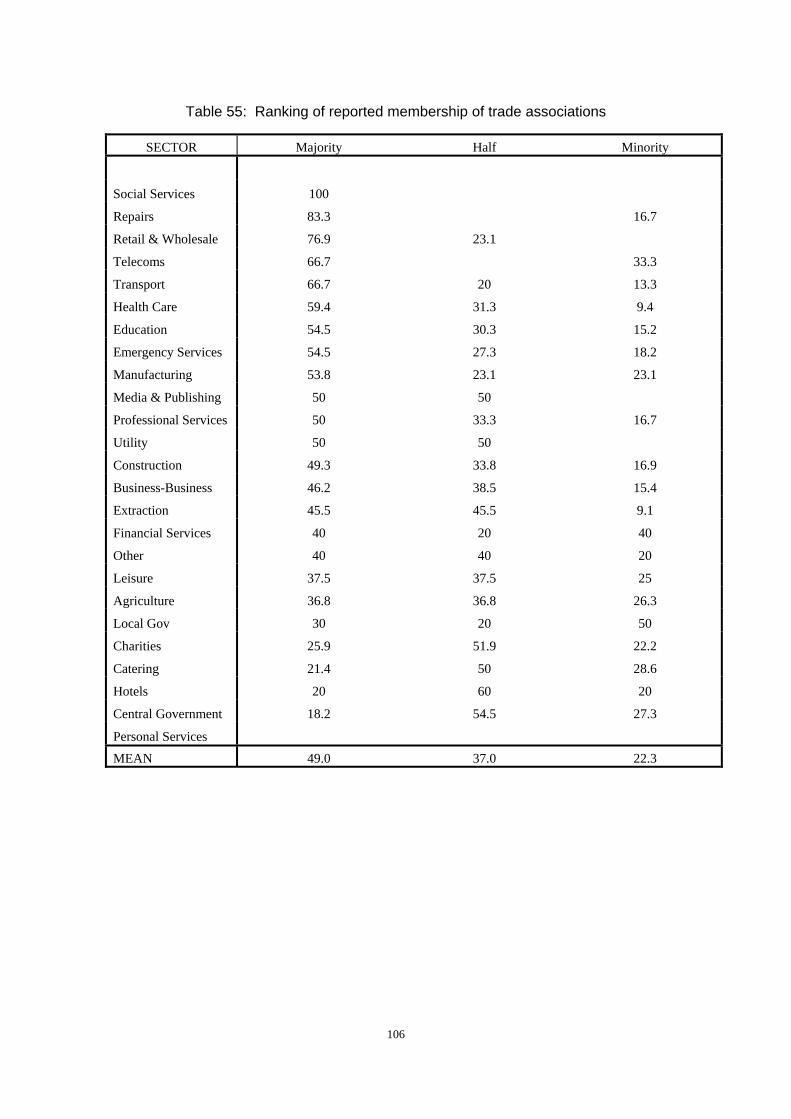
Table 55: Ranking of reported membership of trade associations
SECTOR Majority Half Minority
Social Services 100
Repairs 83.3 16.7
Retail & Wholesale 76.9 23.1
Telecoms 66.7 33.3
Transport 66.7 20 13.3
Health Care 59.4 31.3 9.4
Education 54.5 30.3 15.2
Emergency Services 54.5 27.3 18.2
Manufacturing 53.8 23.1 23.1
Media & Publishing 50 50
Professional Services 50 33.3 16.7
Utility 50 50
Construction 49.3 33.8 16.9
Business-Business 46.2 38.5 15.4
Extraction 45.5 45.5 9.1
Financial Services 40 20 40
Other 40 40 20
Leisure 37.5 37.5 25
Agriculture 36.8 36.8 26.3
Local Gov 30 20 50
Charities 25.9 51.9 22.2
Catering 21.4 50 28.6
Hotels 20 60 20
Central Government 18.2 54.5 27.3
Personal Services
MEAN 49.0 37.0 22.3
106
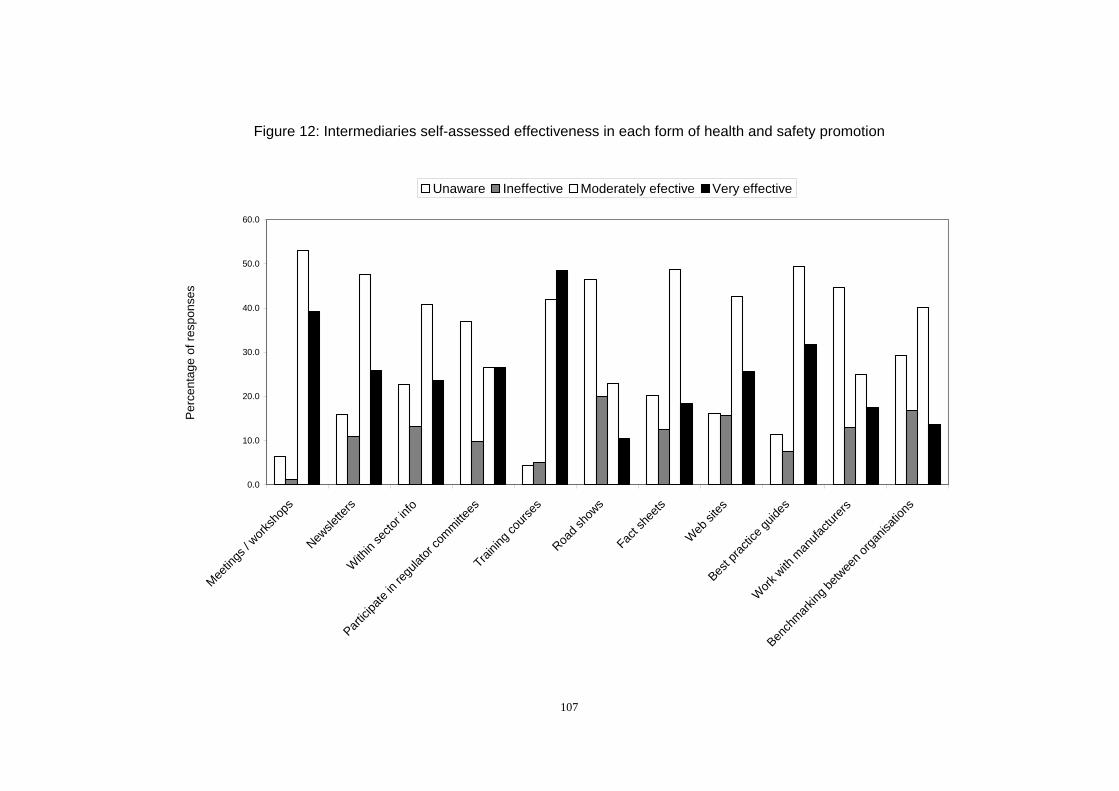
Figure 12: Intermediaries self-assessed effectiveness in each form of health and safety promotion
0.0
10.0
20.0
30.0
40.0
50.0
60.0
Meetin
gs / w
orksh
ops
Newsle
tters
With
in se
ctor in
fo
Partici
pate
in reg
ulator
committe
esTrai
ning c
ourse
sRoa
d sho
ws
Fact s
heets
Web
sites
Best p
ractic
e guid
es
Work
with
man
ufactu
rers
Bench
marking
betw
een o
rganis
ation
sP
erce
ntag
e of
resp
onse
sUnaware Ineffective Moderately efective Very effective
107
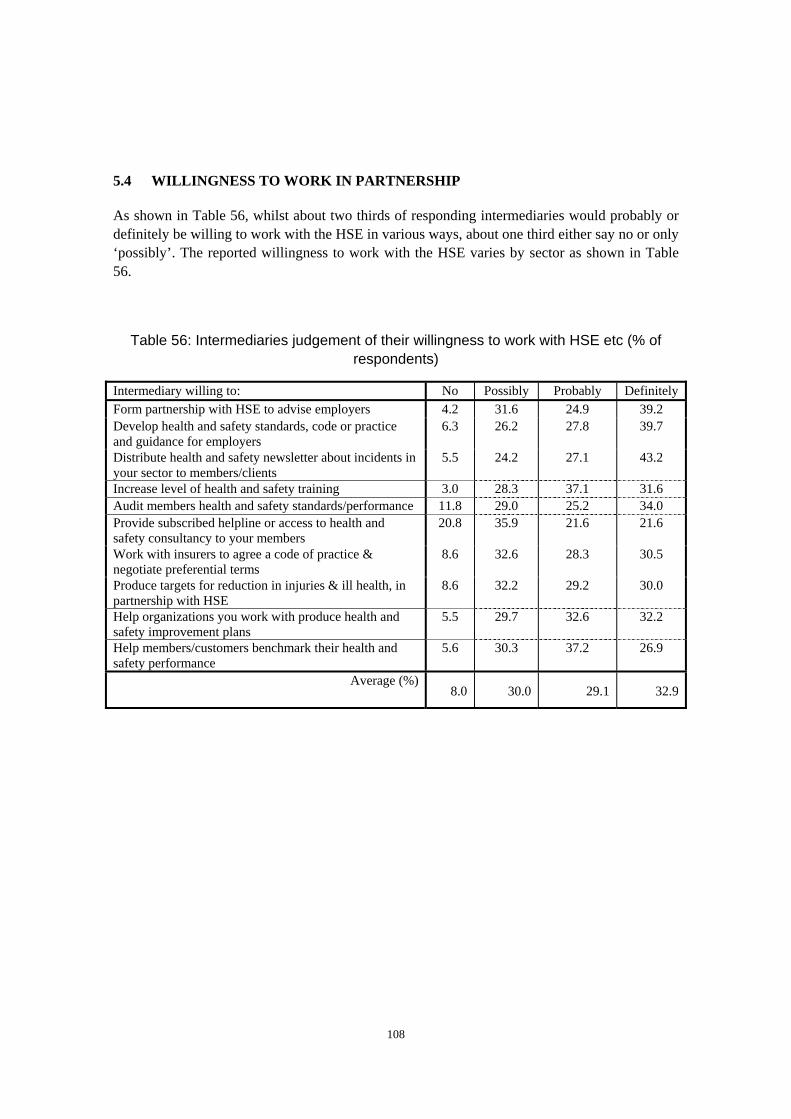
5.4 WILLINGNESS TO WORK IN PARTNERSHIP
As shown in Table 56, whilst about two thirds of responding intermediaries would probably or definitely be willing to work with the HSE in various ways, about one third either say no or only ‘possibly’. The reported willingness to work with the HSE varies by sector as shown in Table
. 56
Table 56: Intermediaries judgement of their willingness to work with HSE etc (% of respondents)
Intermediary willing to: No Possibly Probably DefinitelyForm partnership with HSE to advise employers 4.2 31.6 24.9 39.2 Develop health and safety standards, code or practice and guidance for employers
6.3 26.2 27.8 39.7
Distribute health and safety newsletter about incidents in your sector to members/clients
5.5 24.2 27.1 43.2
Increase level of health and safety training 3.0 28.3 37.1 31.6 Audit members health and safety standards/performance 11.8 29.0 25.2 34.0 Provide subscribed helpline or access to health and safety consultancy to your members
20.8 35.9 21.6 21.6
Work with insurers to agree a code of practice & negotiate preferential terms
8.6 32.6 28.3 30.5
Produce targets for reduction in injuries & ill health, in partnership with HSE
8.6 32.2 29.2 30.0
Help organizations you work with produce health and safety improvement plans
5.5 29.7 32.6 32.2
Help members/customers benchmark their health and safety performance
5.6 30.3 37.2 26.9
Average (%)8.0 30.0 29.1 32.9
108
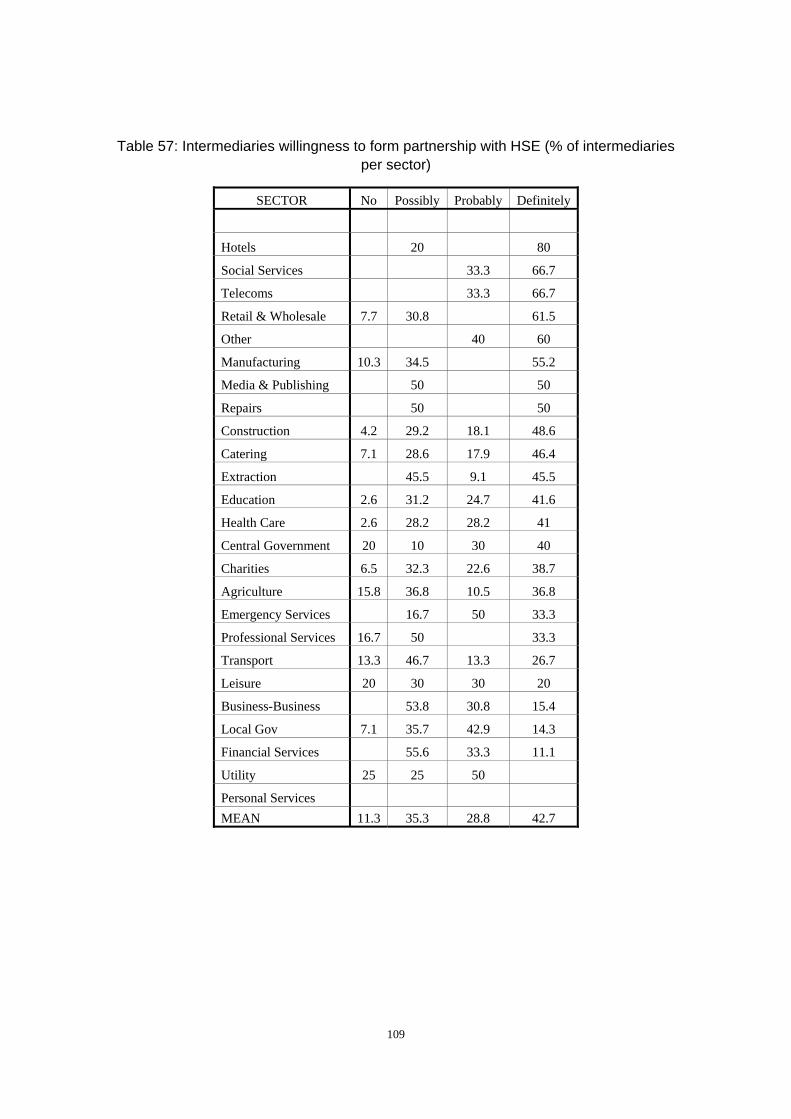
Table 57: Intermediaries willingness to form partnership with HSE (% of intermediaries per sector)
SECTOR No Possibly Probably Definitely
Hotels 20 80
Social Services 33.3 66.7
Telecoms 33.3 66.7
Retail & Wholesale 7.7 30.8 61.5
Other 40 60
Manufacturing 10.3 34.5 55.2
Media & Publishing 50 50
Repairs 50 50
Construction 4.2 29.2 18.1 48.6
Catering 7.1 28.6 17.9 46.4
Extraction 45.5 9.1 45.5
Education 2.6 31.2 24.7 41.6
Health Care 2.6 28.2 28.2 41
Central Government 20 10 30 40
Charities 6.5 32.3 22.6 38.7
Agriculture 15.8 36.8 10.5 36.8
Emergency Services 16.7 50 33.3
Professional Services 16.7 50 33.3
Transport 13.3 46.7 13.3 26.7
Leisure 20 30 30 20
Business-Business 53.8 30.8 15.4
Local Gov 7.1 35.7 42.9 14.3
Financial Services 55.6 33.3 11.1
Utility 25 25 50
Personal Services MEAN 11.3 35.3 28.8 42.7
109
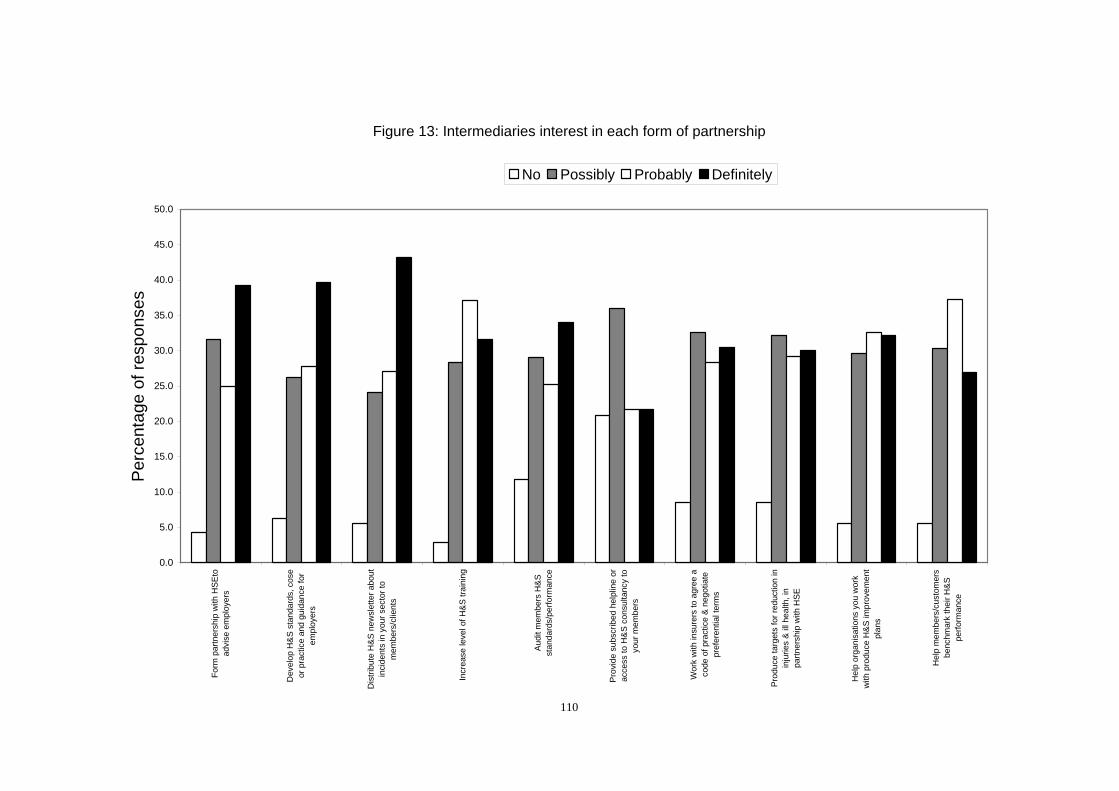
Figure 13: Intermediaries interest in each form of partnership
0.0
5.0
10.0
15.0
20.0
25.0
30.0
35.0
40.0
45.0
50.0Fo
rm p
artn
ersh
ip w
ith H
SEto
advi
se e
mpl
oyer
s
Dev
elop
H&
S st
anda
rds,
cos
eor
pra
ctic
e an
d gu
idan
ce fo
rem
ploy
ers
Dis
tribu
te H
&S
new
slet
ter a
bout
inci
dent
s in
you
r sec
tor t
om
embe
rs/c
lient
s
Incr
ease
leve
l of H
&S
train
ing
Audi
t mem
bers
H&
Sst
anda
rds/
perfo
rman
ce
Prov
ide
subs
crib
ed h
elpl
ine
orac
cess
to H
&S
con
sulta
ncy
toyo
ur m
embe
rs
Wor
k w
ith in
sure
rs to
agr
ee a
code
of p
ract
ice
& n
egot
iate
pref
eren
tial t
erm
s
Prod
uce
targ
ets
for r
educ
tion
inin
jurie
s &
ill h
ealth
, in
partn
ersh
ip w
ith H
SE
Hel
p or
gani
satio
ns y
ou w
ork
with
pro
duce
H&
S im
prov
emen
tpl
ans
Hel
p m
embe
rs/c
usto
mer
sbe
nchm
ark
thei
r H&
Spe
rform
ance
Per
cent
age
of re
spon
ses
No Possibly Probably Definitely
110
5.5 FREE TEXT COMMENTS AND SUGGESTIONS
The majority of comments respondents made support the general observations already made at length in previous sections. However, some issues discussed by employers were also reflected by intermediaries. As many of these are identical in flavour to those made by employers, what follows is a list of areas where there was concurrence with employers’ comments. Thus:
• Simplifying guidance;
• Simplifying rules and put into plain English, and;
• A recognition of under-resourcing of the HSE, particularly in regard to the number of inspectors
111
6 DISCUSSION OF FINDINGS
6.1 OVERVIEW
This study first and foremost reinforces the conclusion of previous studies, which is that a combination of advice / guidance, enforcement and persuasion of the business case are all important and complimentary elements of securing compliance. Indeed, respondents (‘general’ managers and health and safety managers) to this study cite more advice and incentives as the best way forward for improving health and safety, with more enforcement, reputational risk, bigger fines and more expensive insurance generally receiving less support. More generally it appears that, to some extent, where respondents are motivated by one driver, such as avoiding the cost of accidents, they are also reportedly motivated by other drivers. This can be interpreted to mean that employers are equally motivated (or not) by a battery of drivers and/or that these drivers are “intertwined”.
This discussion is split into four parts:
• A summary of the link between organisational attitudes to H&S and their preference for alternative incentives;
• A more general discussion of the implication of the study findings for the weight that can be assigned to each type of intervention;
• A discussion of some disparities in respondents view of H&S and the “objective” view of H&S;
• Overall conclusions.
6.2 ASSOCIATION OF ATTITUDES WITH PREFERRED INTERVENTIONS
6.2.1 Associations
Referring back to the survey findings shown in 4.5.2 it is clear that there are links between attitudes and preferred new “incentives”, as well as with organisational attributes. The links can be presented according to those who prefer more incentives, more enforcement or more advice and support, as below. Clearly there is no one simple division of organisations preferences for incentives according to their attitudes. However, it is reasonable to say that attitudes align with three main types of “levers” as follows:
• Persuasion (and incentives) for those who are influenced by the business case and / or have a good relationship with the regulator because they think H&S is important to be the business either due to their brand or reputation, or because of a belief that a serious incident could cause a loss of investment, reputational damage, or because they believe insurance costs them a lot, insurers scrutinise their H&S and take it into account when setting premiums;
112
• Enforcement of those who have a negative view of H&S, either because they believe that cost (affordability), other demands on management or internal cultural problems may inhibit H&S improvements or because they have scope for improvement;
• Advice and support for those who are already motivated or see H&S as a burden.
Promotion of the business case & /or incentives
• Business case driven: Organisations who believe health and safety is important for their business (attitude 1) recommend more advice and evidence of the business case (evidence of productivity benefits of health and safety) as incentives;
• Reputationally/customer driven: Organisations whose brand/reputation is important (attitude 6 and 11) or are pressured by customers/ banks (attitude 10) (who often believe they can lose business due to a serious H&S incident) recommend increases in reputational risk, evidence of the business case, linking H&S performance to insurance, better tax incentives and “restorative justice”, and are more likely to prefer insurers as a source of advice;
• Insurance driven: Organisations who believe insurance costs them a lot and that insurers take account of their H&S performance (attitude 5), are more likely to say that increased insurance costs, better links with H&S performance and advice from insurers will help.
• Good regulator relationship: Organisations that report a good relationship with the regulator (attitude 9) prefer more evidence of the business case and a standard for H&S that inspectors can give credit to (i.e. earned autonomy).
• Cost aware: Organisations that take account of wider societal costs of H&S and / or are aware of the HSE Offenders Database are more likely to prefer incentives, evidence of the business case, a standard for H&S that inspectors can give credit to (i.e. earned autonomy), a corporate manslaughter law, and low cost OH support.
More enforcement
• The inhibited: Organisations who do not believe health and safety is important for their business (attitude 1) or who report they are inhibited by cost, other demands on management or company culture (attitude 4) tend to recommend more enforcement and personal fines for directors, as well as increased insurance costs and evidence that incidents will cause loss of investment/loans and evidence of the business case;
• Laggers: Organisations that believe they have room for improvement (attitude 7) are more likely to recommend more enforcement, more sector specific partnerships and evidence of the business case.
• Enforcement sensitive: Organisations that report that enforcement would raise the importance of H&S amongst management (attitude 3) are more likely to recommend more enforcement, directors’ fines, a rehabilitation law and more severe penalties as well as increased insurance costs and a high profile newsletter about prosecutions etc.
113
More advice and support
• Already motivated: Organisations that report they are already motivated by a battery of drivers (attitude 2), recommend more advice and support.
• H&S is a burden: Organisations who see H&S as a burden (attitude 8) are more likely to recommend more advice and support (with a tendency towards Business Link and trade associations), along with grants/subsidies and more frequent but pragmatic inspections.
• Networked: Organisations that interact with one another (attitude 15) are more likely to prefer trade associations or professional bodies and increased awareness of rehabilitation.
6.2.2 Implications for targeting
The case for targeting and segmentation
It is also clear that organisational attitudes and the influence of “levers” varies between organisations, primarily according to their size and sector. It is also apparent that a link can be made between the current attitude of organisations towards health and safety, their size/sector and their recommendation of new incentives for health and safety. This suggests that it is not only possible, but also more effective, to match compliance tactics to the attitudes of the organisations, rather than adopt a “one size fits all approach”. The inference that can be drawn from this is that no single “lever” will be equally needed nor effective for all organisations.
Interpretation of implications of a priori attitudes for strategy
Organisations that believe health and safety is important (more likely to be larger) for the business report being influenced by the “business case” argument and recommend business incentives. Organisations that do not believe health and safety is important for business (more likely to be smaller) recommend more enforcement. This can be interpreted in two ways. First, a simple interpretation is that more enforcement should be sought for the latter “unconvinced” organisations, whilst the “convinced” can be persuaded.
On the other hand, it could be argued that the “unconvinced” organisations need to be persuaded of the business case in order to move them on from being enforcement driven, especially as this implies a reactive approach to health and safety that is governed by the level of enforcement achievable. Thus, care should be taken in assuming that an expressed preference for (say) enforcement should be taken to conclude that enforcement should be selected intervention. It is equally valid to argue that:
• If you wish to reduce reliance on enforcement, then you need to change organisations’ current attitude from one of inhibition (focusing on costs and other management demands) to one that sees the business value of H&S;
• If you wish to maintain n organisations concern about the impact of a serious H&S incident on reputation and the business, then you need to maintain the possibility of detection and enforcement arising from such incidents.
Clearly the application of this study’s findings to the selection of intervention strategies involved an element of policy led interpretation.
114
It is also interesting to recall that experience of inspections are associated with a good relationship with the HSE/ EHO although it is also associated with seeing H&S as a burden. Nonetheless, contact with inspectors does not necessarily prevent a good relationship and hence a preference for persuasion.
Sector based segmentation
Whilst something of a simplification, it is apparent that some sectors are less likely to display positive attitudes to health and safety, whilst other are broadly neutral and others are more likely to display positive attitude to health and safety. For example, sectors that work directly with the public (personal services, construction and social work) do appear to display more positive attitudes to health and safety and may be more receptive to persuasion. Indeed, taking sectors, by reference to Table 63, they can be characterised as tending to display the following attitudes. It should be noted that:
• Whilst some sectors display few ‘positive’ attitudes, they do for example value their reputation, such as financial services, suggesting that there is scope for applying “new levers” to them;
• Some sectors are difficult to characterise as ‘positive’ or ‘negative’ due to a mix of attitudes and/ or mostly neutral attitudes;
• Whilst the display of attitudes varies across sectors, there is also great variation within sectors and the inter-sector variation is complex;
• Whilst some sectors can be categorised as “poor”, the variation within sectors is as great as it is between sectors.
This does suggest that sector segmentation cannot be applied in a literal manner. It is noticeable that those sectors commonly regarded as “higher” risk tend to display more positive attitudes, such as construction and manufacturing, whilst sectors commonly regarded as “lower” risk do not, such as financial services.
Sectors with broadly positive attitudes – preferring persuasion or advice
• Construction tends to place importance on H&S for their business, being pressured by customers, concern for reputation, see scope for improvement, not inhibited by cost, but (surprisingly) tend not to be driven by insurance;
• Manufacturing, whilst displaying fewer “positive” attitudes also sees H&S as important to the business, are not inhibited by cost and are motivated to improve H&S – again open to persuasion and advice;
• Health, whilst reporting that H&S is important for business, motivation to improve H&S, awareness of the societal costs of H&S and interaction with other organisations, suggesting a persuasive strategy, they do not reportedly place value on brand;
• Personal services, do see H&S as important to their business, value their brand/reputation, do not see H&S as a burden and interact with other businesses;
115
• Social services, see H&S as important to their business, are not inhibited by costs etc, are driven by insurance and have a good relationship with the regulator although hey tend not to see scope for improvement or value their brand;
• Extraction, sees H&S as important for the business, are not inhibited by cost, have a good relationship with the regulator and are pressured to improve H&S;
• Utilities, see H&S as important to the business, value their brand, see scope for improvement although they tend to report a poorer relationship with the regulator and less insurance driven;
• Local government, whilst tending not to see H&S as important to the business, are driven by insurance, are not inhibited by costs etc, see scope for improvement and do not see H&S as a burden;
Sectors tending to display less positive attitudes
• Agriculture, whilst reporting scope for improvement and do not fear enforcement, see H&S as a burden, have a poor relationship with HSE and do not value their image;
• Retail, whilst they do not tend to see H&S as a burden, they are less likely to see H&S as important to the business and do not perceive pressure from banks, insurers, and are less likely to say their brand name is important;
• Repairs, mostly neutral in their attitudes but tend to say they have poor relationship with HSE and fear enforcement;
• Financial, professional and business to business services, whilst valuing their reputation tend not to see H&S as important for the business, are inhibited by cost etc and do not see scope for improvement;
• Hotels and leisure, whilst they are insurance driven and interact with other organisations, they see H&S as a burden, have a poor relationship with the regulator, (hotels) do not see scope for H&S improvement and do not value their brand;
• Catering, whilst seeing scope for improvement, they tend to see H&S as a burden with few pressures to improve it and do not see H&S as important for the business.
Sectors difficult to characterise, as they are either neutral in their attitudes or a mixed
• Central government do see H&S as important for H&S and do not see H&S as a burden, but so not see scope for improvement;
• Education, is mostly neutral, value their reputation and interact with other organisations but tend to say they have a poor relationship with their regulator;
• Media, whilst they do not see H&S important to the business and are inhibited by costs etc, they do tend to be driven by insurance and value their brand;
• Charities, whilst seeing H&S as important to their ‘business’ and are driven by insurance , they are inhibited by cost and tend to not see scope for improvement;
116
• Emergency services, whilst not inhibited by cost., accepting scope for improvement and have a good relationship with the regulator they tend to not to value their brand/reputation, see H&S as a burden;
• Telecoms, whilst tending not to see H&S as a burden, being pressured by customers and having good relationship with the regulator, are inhibited by cost, do not value reputation;
• Transport, whilst not seeing H&S as important to the business, not valuing brand or having good relationship with the regulator, they are not inhibited by cost, they are driven by insurance and accept scope for improvement.
Segmenting by size
On the other hand, larger organisations are more likely to display positive attitudes to H&S and prefer persuasion and advice, as well as belong to active trade associations, network and attend courses. This does support the notion of segmenting small versus large organisation for the sake of targeting interventions
Segmenting by expressed attitude
What these findings do support is the notion of targeting interventions and communications according to the expressed attitude of organisations. This can be considered in the context of both national initiatives, such as media campaigns, and inspection tactics.
• Inspection tactics: If as part of an inspection it is apparent that the organisation is “convinced” of the business case, they may be more receptive to the evidence that further improvement to health and safety are justified for business reasons and advice. The “unconvinced” could either be responded to by “persuasion” to try to convince them, or enforcement.
• National initiatives: National initiatives can be designed to address the sub-set of attitudes of those organisations that the intervention aims to change. For example, messages and materials can be matched to the attitudes (e.g. H&S is a burden) of the target group.
The attitude-based segmentation is analogous to standard marketing and public education techniques, where the campaign message is designed to change a priori attitudes or beliefs.
6.3 STRATEGY FOR COMPLIANCE
6.3.1 Advice and guidance: the role of the HSE
Whilst some respondents express reticence about approaching the HSE and the majority do not want to “come to the attention of the regulator”, the HSE remains the favoured source of advice for the majority of respondents, including those that have recently been inspected. Moreover, organisations that have been inspected are more likely to agree that they have a good relationship with the HSE/EHO and get good advice from them. Combining these findings with the ranking of more advice as the best way of increasing compliance and the provision of more advisory inspections, provides strong support for a continued HSE role in providing advice and guidance as part of the inspection process and more generally. This finding is consistent with
117
the majority of previous research, which has also reported a preference amongst most employers for the HSE to provide advice.
It also suggests that the “fear” of the HSE may be more prominent amongst organisations that have not had contact with the HSE. This can be interpreted in a number of ways. It can be suggested that the HSE need to reach out to organisations they do not normally have contact with and re-assure them. The alternative interpretation is that a separate or “virtually” separate body or intermediaries are needed to form a relationship those organisations not normally reached by the HSE/ EHOs.
6.3.2 Advice and guidance: the role of intermediaries
Whilst the HSE remain the most favoured single source of advice and guidance there is a reasonable body of findings to suggest trade associations/professional bodies are also important sources. In particular organisations who see H&S to be a burden and believe they have scope for improvement in H&S are more likely to rank trade associations and Business Link as the best candidate for advice, suggesting that working with intermediaries is of particular value for the “unconvinced” organisations.
In addition:
• Trade associations and professional bodies are the second best source of advice and guidance for health and safety according to respondents;
• Organisations whose associations are active in promoting health and safety display more positive attitudes to health and safety;
• About two thirds of respondents rate their association as effective in promoting health and safety;
• About two thirds of these associations are willing to work with the HSE in promoting health and safety;
• Associations tend to be medium or large and employ health and safety specialists;
• There are numerous associations representing a very large number of specialist sector and professions.
Thus, it does appear that working with trade associations and professional bodies deserves consideration, especially given the need to reach out to organisations that have not had prior contact with the HSE/EHO. Whilst working with all such bodies (over 1000) may pose a resource challenge in its own right, the existence of such bodies in so many sectors, their expressed willingness and possession of H&S staff suggests they could worked with where the need arises.
118
6.3.3 The business case for health and safety
Overview
It is apparent that:
• Whilst respondents do not appear to fully consider the costs and benefits of health and safety, they appear “convinced” of the business case in respect of productivity and business impact (especially on reputation), and
• Most organisations think they are as a good as most others.
The former finding is consistent with a number of other recent surveys. For example, a MORI survey of 500 organisations and 3000 workers/non-workers found that 73% of employers believe health and safety requirements benefit their business as a whole, with 64% saying they save money in the long term and only 14% viewing H&S as an obstacle to their business (reported in Safety and Health Practitioner, June 2004).
This does suggest that employers, on the whole, recognise business benefits of health and safety. It is also apparent from our study that;
• (1) reputational risk is one of the most clearly recognised drivers for managing health and safety and (2) that employers believe a serious health and safety incident and/or enforcement can cause reputational damage.
• Both insurance costs and supply chain pressures are common drivers for health and safety, especially amongst medium and large organisations if less so amongst small and micro organisations.
The former finding goes some way to explaining the apparently conflicting results of some previous studies that have alternately ranked reputational risk and enforcement (or regulatory compliance) as the top reason for managing health and safety. It appears that they are closely linked and that part of employers’ “fear” of enforcement comprises the possible reputational damage it causes.
Further increasing reputation risk
The finding that reputational risk is clearly very influential can be contrasted with the finding that “increasing the risk of reputational damage” receives the lowest ranking as a way of improving compliance. On the one hand it can be argued that this is a strong motivator, and hence should be maximised. On the other hand, it can be argued that this driver is already operating effectively, and hence only needs to be maintained rather than increased.
Whilst increasing reputational risk is not generally recommended by respondents, it is reported that the best way of doing so is to increase the level of media attention to incidents/enforcement. The finding that the majority of organisations report “checking their house is in order” if they hear of an incident, supports the case for publicizing incidents. Moreover, our exploratory interviews found that employers feel they rarely hear about incidents and that there is significant scope for publicizing them. For such news to have an impact, it is suggested that the audience needs to “identify” with the organisation that has had the incident (in respect of size, sector, type
119
of business etc), and that enough information is provided on the cause of the incident for the audience to understand if it could happen to them.
Whilst larger organisations are relatively more likely to recommend requiring health and safety performance to be reported in annual accounts, this is a generally less favoured option.
Further promotion of the business case
The same contrast is not apparent with the “business case”. Whilst the vast majority of respondents already agree that health and safety is important for productivity, further evidence that ‘good health and safety’ improves productivity is cited as the best business incentive. When combined with the finding that almost half of the respondents report other business demands and cost / affordability inhibit making health and safety improvement, it is apparent that demonstrating the business case remains important. Given that few respondents appear to consider the wider societal costs and benefits of health and safety, it is probable that the “business case” needs to focus on the employers’ direct costs and benefits. This should not be interpreted to mean that fully costed business cases are needed, as few respondents report requiring these.
A growing role of insurance
It has also been found here that insurance plays a greater role than reported in some earlier (1990’s) studies. Many respondents report that employers’ liability insurance costs them a lot, that insurers seek evidence from them that health and safety law is complied with, especially larger organisations. Meeting insurance demands is also cited as a motivator for improving health and safety. This is consistent with the most recent study of employers’ view of employers’ liability insurance, completed after the 2002+ increases in ELCI premiums. Thus, it appears from the evidence available that the cost of insurance has become an important motivator for health and safety. Indeed, the achievement of a closer link between health and safety performance and the cost of insurance is cited as an effective way of providing business incentives for health and safety.
Other drivers
There are a number of potential drivers and incentives for health and safety that received relatively low ratings in this survey, namely:
• The relatively low ranking assigned to the potential loss of investment, customer and trade union demands is matched by a relatively low rating of the possibility of strikes, loss of sales and investment in the event of a serious health and safety incident;
This can be interpreted in at least two ways.
• First, it can be interpreted that these are relatively weak motivators for health and safety, and hence do not offer much potential as new “levers” for securing compliance.
• It can equally be argued that as these drivers are currently ranked low, there is potential for increasing their role as levers by, for example, encouraging institutional investors to take account of H&S in their investment portfolios.
120
6.3.4 Enforcement
It is clear from the main survey that enforcement is a significant driver for health and safety. This is consistent with previous studies and the exploratory discussions. Moreover:
• Enforcement is perceived to have a “ripple” effect in that respondents act on hearing about other enforcement actions, although only 12% of respondents are familiar with the HSE’s Offenders Database;
• They also believe that enforcement would be very disruptive to their business with the majority not wanting to come to the attention of the regulator;
• There is a perception that enforcement can cause serious business disruption and effect insurance costs, providing added reasons to comply with health and safety law, and hence avoid enforcement;
• Few believe they will be the subject of enforcement action, and;
• There is a mixed opinion on the impact of enforcement with less than half thinking enforcement increases the priority attached to health and safety or must be avoided to keep trade unions and employees happy, and a split opinion on the longevity of the impact of enforcement on directors’ attitudes.
Moving on from this point, this study provides some indication on how it operates and whether it has a consistent effect across organisations. First, as noted above, enforcement is obviously linked to the risk of reputational damage and feared for the potential business disruption it can cause. News of enforcement can also have a “ripple effect” on other organisations that hear of it.
However, there is a split of opinion on whether it has a lasting effect or whether it increases the priority awarded health and safety. The reasons for this split of opinion are not apparent from this study.
The possible implication for new incentives is that:
• There is scope for increasing the general deterrence effect of enforcement by increasing the level of publicity awarded actions, especially given the low level of awareness of the Offenders Database and the apparent sensitivity of organisations to the reputational impact of enforcement – the concept of “adverse publicity” warrants consideration;
• There is value in increasing the perceived possibility of being the subject of enforcement, again as a means of increasing the general deterrence impact of enforcement.
However, respondents also ask for more pragmatic/consistent enforcement and more ‘advisory’ inspections. This matches previous studies which have reported that employers recommend more face to face contact with the regulator for the sake of advice. Thus, care must be taken in assuming employers ‘wish’ for more inspection equates to a wish for more enforcement as opposed to more site based advice and support. Employers, especially larger ones, report a good relationship with their regulator and say they get good advice. If this finding is combined with the provision of more advice and support as the single most preferred way of improving compliance, it does provide support to the idea that the HSE/EHO should look at how to
121
increase the level of advice and support, including that provided during inspections, to employers.
Earned autonomy
Both the exploratory discussions and the survey offer support for providing a way for organisations to “earn autonomy”, through the operation of an accredited standard for health and safety. The idea has yet to be elaborated, but would involve the regulator giving credit to organisations (in an as yet unspecified way) that achieve an accredited health and safety standard (certificated by an organisation such as the BSI).
Restorative justice
“Restorative justice” is a very new, and as yet undebated, option for promoting health and safety in the UK. It has not been publicized. Hence, the finding that almost 20% of respondents recognize it as a potential new lever may suggest that, with further debate and consideration, this could be a truly new lever for health and safety.
It can equally be argued that as restorative justice is currently ranked low, there is potential for increasing their role as levers by, for example, introducing restorative conditions in court judgements.
6.3.5 Encouraging rehabilitation
The mandation of rehabilitation and provision of low cost OH/rehabilitation support are the top ranked way of encouraging rehabilitation. Whilst a new regulation placing a duty of employers to provide rehabilitation to people injured or made ill by work is not being developed, one option is to encourage the inclusion of rehabilitation in court conditions.
The recommendation for low cost support is common to previous studies and reinforces the weight of this recommendation. However, it is also clear that other incentives also receive a high ranking, specifically evidence of the business case for rehabilitation, linking rehabilitation performance to insurance costs, tax incentives, increasing awareness of rehabilitation and reducing compensation payments to employees who do not participate in rehabilitation. This does suggest that there are a number of valuable new ways of encouraging an increase in rehabilitation availability.
6.4 DISPARITIES IN THE PERCEPTION OF HEALTH AND SAFETY
It is possible to highlight some contrasts between respondents’ attitudes and common health and safety standpoints, as follows:
• The view that any workplace that could have a fatal accident as high risk even if the chance is low, can be contrasted with the “professional” view that risk is a product of probability and severity.
• The reported lack of consideration of the wider societal costs and benefits of health and safety stands in contrast to the importance commonly attached to these in the assessment (such as in Regulatory Impact Assessments) of health and safety regulations, and in assessments of the costs to the UK of work related injury and ill-health.
122
• It is interesting to note that whilst the vast majority of organisations value their reputation, with the exception of very large organisations, and only a small minority of respondents are familiar with the HSE’s Offenders Database. Only 12% of small organisations reporting that they are familiar with it.
It is also possible to highlight the point that respondents accept the importance of health and safety to productivity, but regard themselves to be as good as most other organisations. It is only in the case of very large organisations that a majority of respondents believe they could do a lot more to improve health and safety. The vast majority of micro, small and medium sized organisations do not agree that they could do a lot more to improve health and safety. Thus, respondents appear “convinced” of the importance of health and safety, but not of the need to improve it a lot.
6.5 CONCLUSIONS
6.5.1 Factors motivating health and safety improvements
The key factors are confirmed as the business case, especially reputational risk, enforcement and the moral dimension. There is a high degree of correspondence in the weight of these drivers, i.e. organisations tend to be motivated by these factors to the same level (or not). This is apparently in part because the impact of such factors is intertwined. In particular, reputational risk and the impact enforcement are intertwined – wherein the potential impact of enforcement on an organisation’s reputation is a key issue. These findings suggest a complimentary range of intervention strategies.
6.5.2 New levers for health and safety
This study reinforces the view that a strategy that combines advice/information, incentives and enforcement is consistent with the reported attitudes and behaviours of employers. Employers recommend a mixture of more advice/guidance and incentives as the best way of encouraging improved health and safety, with the HSE as the most preferred single source of advice and information.
However, the findings also indicate that if you wish to move from an enforcement driven approach to compliance, to one where employers are motivated by the business case, it is important to provide evidence of the productivity benefits of health and safety as well as highlighting the reputational risk of serious incidents. Whilst many organisations recommend more enforcement, this recommendation is skewed towards organisations that do not regard health and safety to be an important business issue, especially smaller organisations, and may actually reflect a wish for more advisory oriented ‘inspections’.
It is important to avoid dismissing the drivers assigned relatively low ratings. It is equally possible to argue that the moderate rating assigned to some as yet untested incentives is actually strong evidence because (1) with greater awareness and experience they offer potential and (2) the incentive effect of more established incentives has already been realised. Thus, whilst enforcement and the business case remain important, established incentives, other as yet tried incentives such as earned autonomy, adverse publicity, greater investor pressure and restorative justice have scope for increased impact.
123
In addition, whilst employers do not recommend an increase in reputational risk, it is clear that there is scope for increasing the level of media attention and awareness of serious incidents.
6.5.3 Segmenting organisations
Having tested whether organisations’ attitudes to health and safety vary by many different factors, it is apparent that size and sector are the most common “external” denominators. It is also apparent that there is a wide range of opinion within each size and sector of organisation, indicating that care must be exercised in applying generalisations to the attitudes of organisations within any one size or sector.
It is also possible that interventions can be matched to the attitudes of organisations rather than their size and sector. The key distinguishing attitudes to which interventions can be matched are:
1. Perceived importance of H&S to the business and its reputation;
2. Perceived degree of inhibition (cost, other demands and culture) and scope for improvement;
3. Extent to which the organisation is already motivated to improve H&S or perceives it as a burden.
The size, sector, importance of the organisation’s brand/ reputation, extent to which its trade association/ professional body promotes H&S, extent of pressure from customers/insurers, level of interaction with other organisations and the quality of the relationship with the regulator are related to the expression of these attitudes and their associated preferences for new “incentives”.
124
7 REFERENCES
Ashby, S. Diacon, S.R. (1996) Motives for occupational risk management in large UK companies. Safety Science, 22 (1-3) p.229-243.
Atkins (2003) Health and Safety Management in small businesses: A review of HSE’s progress and future activity.
Burke, L. Logsdon, J.M. (1996) How corporate social responsibility pays off. Long range planning, 29 (4), p.495-502
Bostock Marketing (2002) COSHH Essentials. HSE CRR 432/2002.
Cutler and James (1996) Does safety pay? Work, employment and safety, 10 (4) 755-765.
Davies, F. McKinney, P. ( 2001) Expanding HSE’s ability to communicate with small firms; A targeted approach. AEA Technology, Oxford.
Fearne, A, Garcia, M, Bourlakis M, Brennan M, Caswell, J, Hooker N and Henson S. Review of the economics of food safety and food standards. Document prepared for the Food Standards Agency under contract RRD10/D03/A, 2004, available by post from FSA library.
Hillage, J. Tyers, C. Davis, S. and Guppy, A. (2001) The impact of the HSAC/E A review.
Honey, S. Hillage, J. (1996b) The costs and benefits of the noise at work regulations 1989. HSE CRR 116/1996.
Honey,S. Giles,L. (1997b) Evaluation of the breathe freely campaign. IES. Brighton
Hopkins, A. (1995) Making safety work: Getting management commitment to occupational health and safety. Allen and Unwin. Sydney.
Jensen, P and Jensen J. Carrots and sticks – inspection strategies in Denmark. Presented at Australian OHS Regulation for 21st Century, National Research Centre of Occupational Health and safety Regulation and National Occupational Health and Safety Commission, Gold Coast, July 20-22,2003.
Johnstone, R. From fact to fiction – rethinking OHS enforcement. Presented at Australian OHS Regulation for 21st Century, National Research Centre of Occupational Health and safety Regulation and National Occupational Health and Safety Commission, Gold Coast, July 20-22,2003.
Mootz, R. Franklin, G. Wickizer, M. (2003) Preventing and managing disabling injury at work. Taylor and Francis
OECD (2001)Reducing the Risk of Policy Failure: Challenges For Regulatory Compliance,.
125
‘O’ Dea, A. Flinn, R. (2003) The role of managerial leadership in determining workplace safety outcomes. HSE CRR 044/2003
Partnership Sourcing Ltd (2003) Contractorisation aspects of health and safety in the supply chain. HSE CRR 112/2003
CCA. (2002) Safety last? The under enforcement of health and safety law. Published by UNISON and Centre for Corporate Accountability, October 2002.
Sullivan, T. Frank, J. (2003) Preventing and managing disabling injury at work. Taylor and Francis, London
Tait, R. et al (2000) An Evaluation of the safety Information Centre approach in providing health and safety advice to small firms, Centre for Hazard and risk Management, Loughborough University.
Toft B and Reynolds S (1997) Learning from Disasters. Perpetuity Press.
Vickers, I. et al (2003) Cultural influences on health and safety attitudes and behaviour in small businesses. HSE CRR 150/2003.
Warrack, B. Sinah, M. (1999) Integrating safety and uality building to achieve excellence in the workplace. Total uality management. 10 (4,5)
Wright, M., Marsden, S and Antonelli, A. (2004) Building an evidence base for Health and Safety Commission Strategy to 2010 and beyond: A literature review of the interventions to improve health and safety compliance. HSE Research Report, 2004.
Wright, M. et al (1998) Factors promoting proactive health and safety management. HSE CRR 179/1998.
Wright, M. et al (2000) Evaluation of good health is good business campaign. HSE CRR 272/2000.
Yeung, K. Is the use of informal adverse publicity a legitimate regulatory compliance technique?
126

8 APPENDIX A: Proforma for exploratory discussions
A1
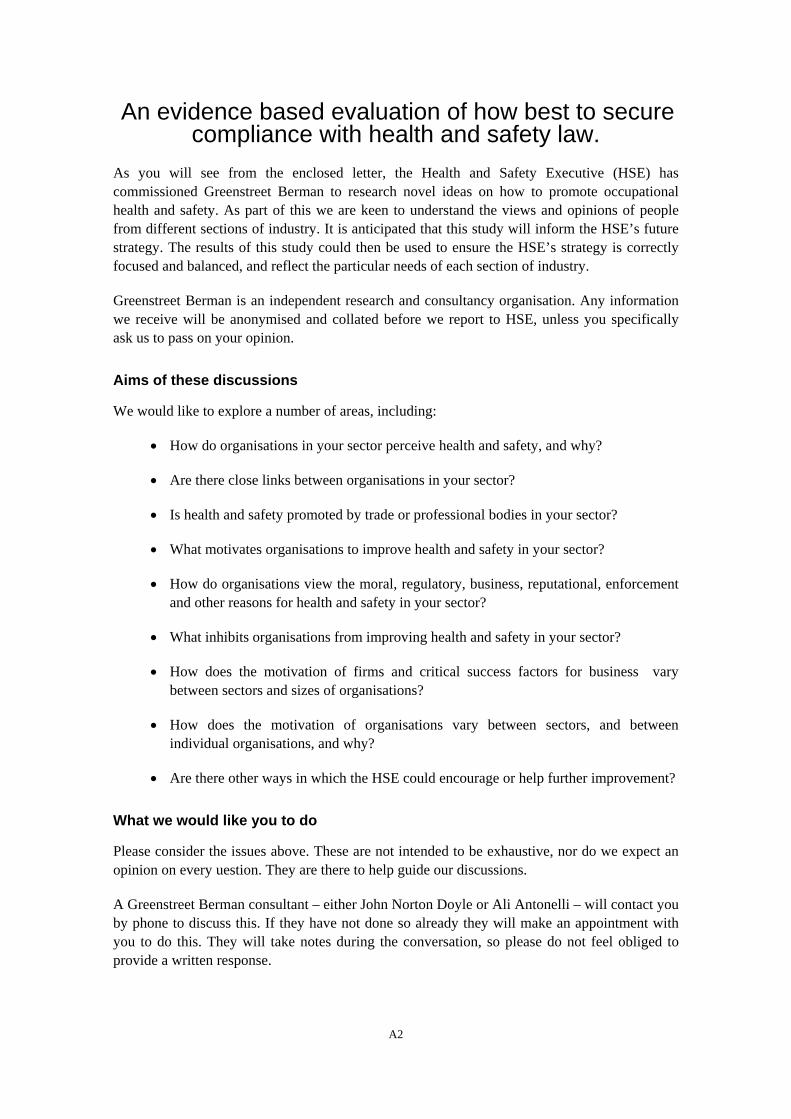
An evidence based evaluation of how best to secure compliance with health and safety law.
As you will see from the enclosed letter, the Health and Safety Executive (HSE) has commissioned Greenstreet Berman to research novel ideas on how to promote occupational health and safety. As part of this we are keen to understand the views and opinions of people from different sections of industry. It is anticipated that this study will inform the HSE’s future strategy. The results of this study could then be used to ensure the HSE’s strategy is correctly focused and balanced, and reflect the particular needs of each section of industry.
Greenstreet Berman is an independent research and consultancy organisation. Any information we receive will be anonymised and collated before we report to HSE, unless you specifically ask us to pass on your opinion.
Aims of these discussions
We would like to explore a number of areas, including:
• How do organisations in your sector perceive health and safety, and why?
• Are there close links between organisations in your sector?
• Is health and safety promoted by trade or professional bodies in your sector?
• What motivates organisations to improve health and safety in your sector?
• How do organisations view the moral, regulatory, business, reputational, enforcement and other reasons for health and safety in your sector?
• What inhibits organisations from improving health and safety in your sector?
• How does the motivation of firms and critical success factors for business vary between sectors and sizes of organisations?
• How does the motivation of organisations vary between sectors, and between individual organisations, and why?
• Are there other ways in which the HSE could encourage or help further improvement?
What we would like you to do
Please consider the issues above. These are not intended to be exhaustive, nor do we expect an opinion on every uestion. They are there to help guide our discussions.
A Greenstreet Berman consultant – either John Norton Doyle or Ali Antonelli – will contact you by phone to discuss this. If they have not done so already they will make an appointment with you to do this. They will take notes during the conversation, so please do not feel obliged to provide a written response.
A2
We expect conversations may be held by phone or, exceptionally, face to face. We expect the discussions to take around 30 minutes, but of course this will in part depend on your views.
INTERVIEWEE:
ORGANISATION:
CONTACT DETAILS:
Tel: Email:
Address:
A3
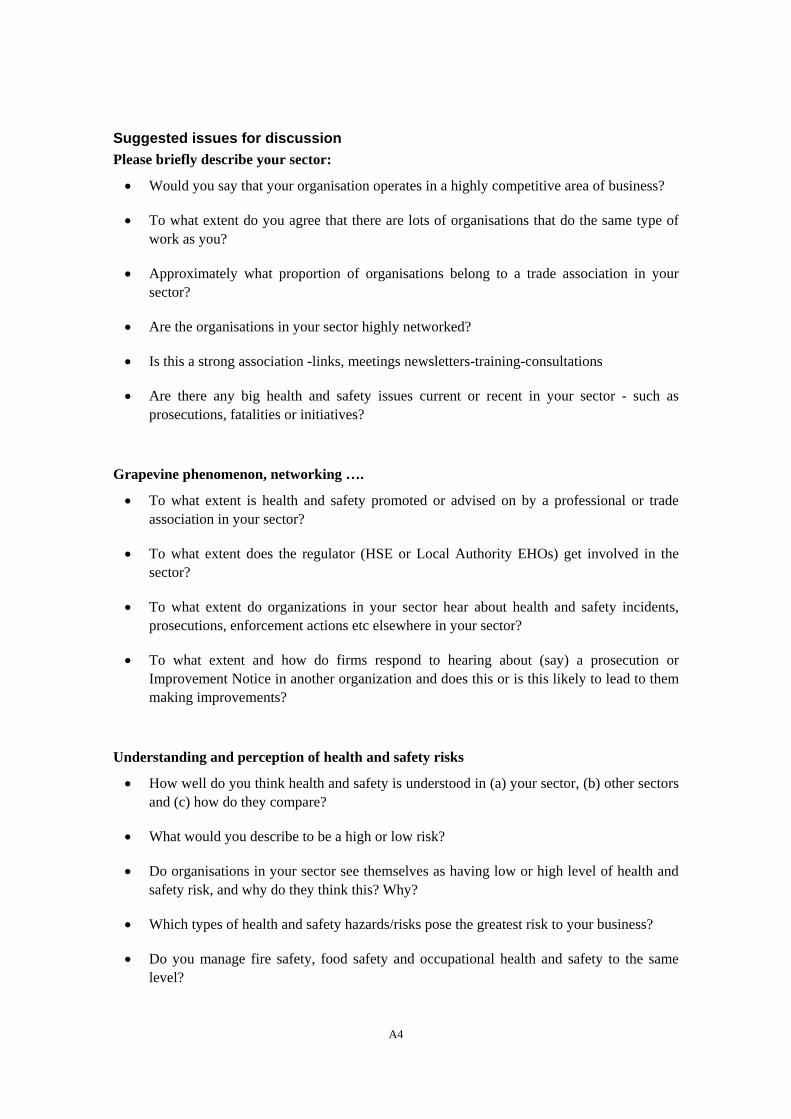
Suggested issues for discussion Please briefly describe your sector:
• Would you say that your organisation operates in a highly competitive area of business?
• To what extent do you agree that there are lots of organisations that do the same type of work as you?
• Approximately what proportion of organisations belong to a trade association in your sector?
• Are the organisations in your sector highly networked?
• Is this a strong association -links, meetings newsletters-training-consultations
• Are there any big health and safety issues current or recent in your sector - such as prosecutions, fatalities or initiatives?
Grapevine phenomenon, networking ….
• To what extent is health and safety promoted or advised on by a professional or trade association in your sector?
• To what extent does the regulator (HSE or Local Authority EHOs) get involved in the sector?
• To what extent do organizations in your sector hear about health and safety incidents, prosecutions, enforcement actions etc elsewhere in your sector?
• To what extent and how do firms respond to hearing about (say) a prosecution or Improvement Notice in another organization and does this or is this likely to lead to them making improvements?
Understanding and perception of health and safety risks
• How well do you think health and safety is understood in (a) your sector, (b) other sectors and (c) how do they compare?
• What would you describe to be a high or low risk?
• Do organisations in your sector see themselves as having low or high level of health and safety risk, and why do they think this? Why?
• Which types of health and safety hazards/risks pose the greatest risk to your business?
• Do you manage fire safety, food safety and occupational health and safety to the same level?
A4
When employers think about health and safety in your sector, to what extent do you think
health and safety is seen to be:
• Good for business;
• A critical business success factor;
• An important aspect of ensuring staff productivity and morale.
• A moral duty;
• Something you do just because of the regulations;
• Do you think health and safety is responded to or should be responded to in the same way that firms respond to taxation requirements and law?
• etc
The costs and benefits of health and safety.
• Is health and safety valued in your sector or seen as a burden? If so why?
• What do organizations in your sector see as the business case for health and safety?
• In what way does the cost of health and safety improvements enter into decision making about whether or not to make health and safety improvements or comply with specific health and safety regulations?
• To what extent do you think organizations require a fully costed business case, showing tangible financial gains, in order to make health and safety improvements?
• Is a cost-benefit case needed to justify compliance with the law or only when you wish to go beyond the law?
• Are organizations satisfied by evidence that health and safety improvements offer intangible benefits such as better staff morale and worker productivity, if such improvements are affordable?
• When thinking about the costs and benefits of health and safety, do organizations simply think about the costs and benefits to their organization, or do they also think about the impact on wider societal, such as the burden on the NHS and state benefits?
• What is the impact of insurance in the sector? is there evidence that the premiums are being set in relation to health and safety claims history.?
• Are insurers seeking certain demonstrations that the law is being complied with e.g. risk assessments? To what extent are insurers proactive in requesting health and safety performance.
A5
Reputational risk
• How well do members in your sector value their reputation? Is there an issue if reputations are in some way damaged, if so why or how?
• When firms say they fear the reputational damage from poor health and safety, what do you think they mean?
• Why might some organizations fear the reputational impact of poor health and safety more than others? Which sectors do you think fear the reputational impact more than others and why?
Could organisations in your line of business lose contracts or customers if a serious incident occurred?
• Are organisations in your sector in a supply chain - head of chain, feeder in chain?
• Do customers (supplies or services) place health and safety demands on sector either contractually or otherwise?
Fear of enforcement action
• To what extent do firms fear enforcement action in your sector?
• When firms say they fear enforcement action, such as Improvement notices, what they mean? Is it, for example, the fear of business disruption, the impact on their customer’s perception of the organization, the impact on staff morale….the conseuences for the managers’ careers…the cost of fines…the time and trouble dealing with an Improvement Notice…fear of social sanction?
To what extent do you think enforcement action:
• Is it common and understood in the sector?
• Is enforcement action feared in your sector?
• Helps to focus busy employers attention on what needs to be done;
• Forces health and safety up the list of busy employers priorities;
• Forces them to do something they would not otherwise do;
• Acts as a wake up call for busy employers who do not normally have time to think about health and safety.
• Provides a precedent by which organizations can judge if they are doing enough.
A6
The role of regulations
• How well does the sector respond to /understand /support legislation regulation?
• When people say they are motivated to improve health and safety by regulations, what do you think they mean? Is it simply fear of prosecution; is it a general sense that its right to comply the regulations, is it unthinking deference....?
• What health and safety regulations do you think firms are least likely to comply with and why?
When some people say they are motivated by the moral case for health and safety, what do you think they mean?
Why do organizations and sectors differ in their view of health and safety?
Do you believe or perceive that organisations differ in their view of health and safety and if so why? Such as their perception of the severity of risks in their organization, their personal experience of or witnessing of a serious incident, whether they have been the subject to HSE enforcement action…
• How might the attitude of employers vary between sectors?
• Is it the level of competition in the sector?
• Is it the financial climate that matters?
• Is the level of perceived risk that matters?
• Etc,.
What distinguishes organisations in respect of how they see health and safety? - is it about how sensitive their business is to poor health and safety, is their high street profile, is it the probability of inspection etc...?
Can you think of some other ways in which the HSE could motivate firms to better
manage health and safety? Tax breaks, subsidies, new types of penalties (eg corporate probation orders), a HSE advisory service…
Any other comments?
A7
9 APPENDIX B: OVERVIEW OF EXPLORATORY DISCUSSIONS FEEDBACK
9.1 TRADE ASSOCIATION AND SECTOR BASED ACTIVITY
9.1.1 Profile
All of the non-public sector respondents were of the view that the area in which they or their members (in the case of professional and trade associations) operated was competitive, some much more so than others. Comments ranged from "cut throat" to depending on whether there was much work around (for example in the construction sector), some smaller firms having a group of clients effectively, it would seem, restricting the degree of competition to which they are exposed. Although this response did not specifically or practically apply to the public sector organisations, it was clear that within the sector and for the varying bodies, competition for resources was an issue.
It is wrong to generalise how competitive pressures impact health and safety. Firstly, all sectors regard themselves to be either highly competitive or cut throat. Secondly, it is opined that the extent to which competitive pressures impact a firm depends on the owner and is unrelated to the sector. Competitive pressures are not thought to restrict the extent of networking on health and safety. Indeed, it is thought that Trade Associations can enable networking in competitive industries, especially where there is a fear that direct networking may be construed as a cartel.
Indeed, the education sector is considered to be highly competitive and has little networking. However, the health service does not regard competition to be an issue as patients always wish to attend the nearest unit.
Some organisations view networking as a recriminative process and not minded to participate. They can also hold a negative view of their trade association, and hence are not minded to participate in its activities.
Trade associations clearly represented a large number of employers and these tended to be sectorally based with some being very specialised within a sector. Although it is difficult to generalise, what was evident from the respondents was that in the main trade associations tended to represent the larger businesses, or at least those operating a significant proportion of the market. Respondents gave both actual numbers of employers involved and the share of the market, usually expressed as turnover, they represented. Thus, for example, whilst they may represent only 50 % of a sector, their members achieve 90% of the business in the sector. This, of course, leaves many of the smaller business unrepresented.
Membership of a trade organisation varied between sectors, to some extent quite considerably. This, in part, appeared to have something to do with the nature of the sector as well as the degree to which the sector was regulated. In general, private sector organisations belong to associations that are extremely active. Public sector organisations were members of a number of bodies representing their sector, although such membership of "trade associations" amongst organisations within the public sector tends to be more sporadic. Although, again, it is difficult to generalise.
A8
Of interest, at least one of the trade unions interviewed appeared to be acting in some respect like a trade association by assisting managers in firms where there was no trade union representation/ membership, but where they had identified a problem relating to health and safety information/knowledge.
9.1.2 Health and safety activity
Where trade associations were involved, in general, there was evidence of significant health and safety related activity, although again there were exceptions to this. This involved a range of activities including training, newsletters and meetings. There are many examples of high-level schemes, such as:
• Contractor registration;
• Training;
• Courses;
• Participation in committees;
• Working with manufacturers;
• Involvement in technical groups;
• Road shows;
• Web sites;
• Fact sheets;
• Best practice guides.
Some Associations (and professional / trade bodies) appeared to be acting as the main or only networking route/ forum for the businesses in their sector and were looked upon as being the leaders in the provision of information and advice. One particular case related to a specific manufacturing sector, where it would appear that the Association existed in order that intra industry dialogue could take place without infringing anti competition agreements, the sector only having a very small number of major players. In other sectors the trade association, whilst supportive, was an adjunct to the networking activities as the firms in the sector either knew each other or employed the same group of people.
Overall the conclusions to be drawn are:
• Trade and professional bodies do represent a wide spectrum across all sectors and business types, and where they have strong representation they provide an extremely valuable networking service;
• The degree to which they are involved in networking and provision of advice information, etc., on health and safety varies considerably;
A9
• A large proportion of smaller business and in some case larger business are not members of trade associations, and;
• The extent to which firms get involved with trade associations varies considerably both within and across sectors and it is not possible to identify any one factor or series of factors which can account for this variation.
9.1.3 Current health and safety issues
We asked if there were any major health and safety issues within the industry/ sector. This was primarily to determine if there were any confounding factors which might be likely to skew respondent’s answers to specific question sets. For example, it might be expected that a major fatality in an industry would have increased awareness, and hence lead to somewhat focussed answers, not necessarily reflecting the overall situation with regard to health and safety in a sector.
As it turned out this question elicited a range of responses, which broadly divided into two categories. The first appeared to be related to very sector based risk / hazards, with the respondents referring to specific industry issues, such as "hot oil" in the catering industry or fire safety or control of contractors. One particular initiative related to using contractors as a conduit of information. Because of the transience of contractual staff between different organisations within similar sectors, regular meetings are held to establish initiatives / safety issues within other organisations. This sharing of information has proved a valuable learning resource.
The second category of response related to initiatives being undertaken within a sector, such as the development of industry based guidance. Interestingly the responses from the Trades Unions and the rail sector appeared in both categories.
There thus appeared to be a variation in how health and safety was perceived, depending on whether the industry/ sector was proactive in its response to health and safety or reactive, although this is a wide generalisation. One manufacturing body fitted into neither category: the industry was seen as being very diverse, and hence no major (global) initiatives were undertaken, and health and safety was largely perceived to be well under control with no major prosecutions (although within the sector, guidance for specific manufacturers was being developed and provided).
9.2 RELATIONSHIPS WITH REGULATORS
On the whole trade associations and professional bodies appeared to have good working relationships with the HSE. This also applied to the major companies, who networked with the HSE through trade organisations (for example the BRC), with at least one respondent viewing the HSE as a "critical friend". This was not a consistent picture however, as at least one manufacturing organisation stated that the businesses "try to avoid the HSE" as it was seen as "putting the head above the parapet", although the Association itself was engaged in a number of health and safety programmes involving the HSE.
With regard to organisations in both the public and private sector, many expressed the view that their direct involvement with the HSE and Local Authorities varied depending upon the level of incident reporting. In essence, they perceived both the HSE and LA’s to be highly reactive rather than pro-active. The main exceptions to this were in the nuclear, chemical and transport
A10
industries, which have traditionally been associated with higher levels of risk / hazards. These organisations reported that they have very good relationships with the HSE, and a high level of consultation takes place between their organisations.
A number of the trade bodies and larger organisations were, however, concerned regarding an apparent falling off of HSE involvement in their sectors. This was seen, partly, as due to changes in the NIG structure and the grouping together of larger industry groupings, e.g. manufacturing, and partly due to a lack of resources on the part of the Inspectorate. A general feeling was expressed that the HSE still needed to support, and be active in, those areas where a good standard was perceived to have been achieved. As one respondent put it - "member companies would like to see a vibrant HSE".
At the local level it was generally felt that there were issues of inconsistency and a failure in some cases for the HSE to ensure local inspectors were provided with the information agreed with the national bodies. By far the greatest concern was raised in relation to enforcement by LA EHOs. Here consistency was seen as an issue, but particularly in the food business sector it was evident that health and safety was seen as a poor relation, with workplace safety issues rarely being taken up and all the emphasis being place on food safety. As one respondent put it : "EHOs either do nothing or show interested rage."
Overall involvement of both branches of the regulator (HSE and LAs) appeared to be patchy, with some industries having members where an inspector was not seen for years. This was also expressed by one respondent as "never seen". Although, the regulatory activity of LA enforcement activity appeared to be higher than for the HSE. An average figure quoted for an HSE visit was 7 years, whereas in the LA enforced sector it was 1½ years, although the latter was confused with food safety enforcement, reflecting the generally held view that food safety took precedence over health and safety for the LA enforced sectors.
There were, however, some specific areas where LA activity was found to be regular and common, but not necessarily leading to enforcement action. For example, in the areas of exhibition staging and where licensing activity (entertainment and alcohol) were involved.
Similarly, comment was made on the HSE prioritisation of construction site safety with the comment that although "blitzes" were taking place there was a lack of resources (for enforcers) and domestic sites were not being targeted.
In the public sector a comment was made that HSE activity appears to follow mainly after a serious accident with whatever else happens being patchy - a view being expressed that the approach appeared to be to "do nothing, prosecute the survivors."
Thus, overall, the extent of involvement of the regulator both within and across sectors was found to be variable, with general comments about inconsistency and lack of resources. In particular, enforcement by LAs was seen to be generally unhelpful. Only one respondent, however, felt that the HSE was too involved. At a national level, a somewhat different picture emerges with generally high involvement of the HSE in some sectors on such matters as guidance, programmes and intra industry liaison. Again, with a general comment that resources were lacking and the level of this activity was not the same as it had been a few years ago.
A11
9.3 RESPONSE TO NEWS OF SAFETY ISSUES
9.3.1 Hearing about incidents
Two aspects were examined in detail to determine:
• If health and safety issues as expressed by incidents, prosecutions and other enforcement action was communicated within and across sectors, and;
• To what extent firms would respond to such information.
On the matter of whether there is good communication of health and safety issues it is again difficult to generalise. The responses obtained gave a very patchy picture, which did not appear to offer up any consistency.
One clear message was that where a professional safety adviser/ manager is employed it is far more likely that an employer would be aware of enforcement issues and "pick up " on the implications of incidents, prosecutions etc. This, however, was moderated to some extent by the nature of the specific issue and its relevance to the firm / organisation concerned. Mostly, the information appeared to come from professional / safety specific journals of one sort or another, or through personal contacts.
To some extent trade association and professional bodies acted as a channel for disseminating information with some being very active in this respect. However, their activity could be limited. As one trade association put it: "we do not hear about all INs in the sector and therefore the response ( to providing information ) was very mixed". They were also very clear (trade associations) that it was only their members that would get the information (in the main) and that others in the industry would not therefore respond.
A general impression was obtained that it was only the "bigger" incidents that appeared to be noted or picked up on. This was possibly because of the general held view that it was necessary for the trade associations "to get the information in the first place".
However, for the larger companies, there appeared to be a certain level of disparity about sharing information and responding to incidents. One major company commented " not sure how useful; more discussions with other sectors about potential issues… (would be)"., although they were engaged on intra industry safety improvements. Another was unsure as to how much information would be shared. If a prosecution was involved the company themselves would be more likely "to keep the information to themselves", although more general information would be shared through the trade association. In contrast, another organisation stated that “because of the ‘shame and blame’ culture surrounding enforcement action, information is not freely shared. This is unfortunate because we should take this information and use it to educate and inform. The desire to hide this reinforces the ‘shame culture’ even further”.
On the Trade Union front there was a marked difference as to the approach adopted. One of the respondents was clear that they did not "promote prosecutions" apparently as part of an overall philosophy to promote prevention. Another related to the local TUC networking and education structure as a means of disseminating information, together with TU representatives picking up on local stories.
A12
The overall conclusion is that if information is available it may be shared, but this is more likely to happen via trade association and professional networks rather than individual companies taking the lead, especially the larger ones. However, the one exception to this seems to be where the industry is more familial in nature. This has the effect of increasing the networking so that any incident or activity is heard about "almost straight away…the grapevine is very strong".
The majority of respondents stated that they consider the HSE to be a poor conduit of information, and this could be vastly improved. This would have the effect of alerting organisations to relevant breaches, which they may be exposed to, and, secondly, (in the words of one respondent) “blow away the shroud of secrecy, hence bring these issues into the open”.
9.3.2 Response to hearing about prosecution / improvement notices
As to whether firms would respond on hearing about safety issues (prosecutions, incidents, Ins, etc.), some general comments were more or less consistent across both sectors and respondents. The majority of respondents stated that hearing about events elsewhere acts as a check, especially if the event is sector specific. Specifically, such news:
• Prompts them to check that “they’re house is in order”;
• Seeing if you are at risk;
• Focuses the mind, and;
• Creates awareness amongst management, if only in the short term.
This is more likely if the event is sector specific, if the company can “identify” with the event and if it is a shared problem.
Respondents could cite examples of acting upon news.
However, other respondents noted:
• That it is only the serving of improvement notices that initiates action, even after hearing of events elsewhere.
• They would respond to news of a prosecution, but not to news of an Improvement Notice.
• Any response would only occur if those receiving the information thought it was pertinent and relevant to their immediate situation.
• The overall impact of this effect would be very low and the majority would not respond, unless they considered themselves to be at risk.
• A common view that "it will not happen to me" was prevalent in most sectors irrespective of size of company, but particularly relevant to SMEs.
• In the public sector the issue was more one of if best practice was being presented or if the issue could be used as a "stick" to drive through safety on the management agenda.
A13
• Larger firms may need to get their own IN before they would respond, but may well respond to hearing about a relevant prosecution in another competitor. (or sector if relevant).
• Where there is a response this would only last for a short period, and then the response "would fall off".
• Within the private sector, it is sometimes viewed as providing a useful tool in “focusing management’s attention upon health and safety issues”.
Hence, it appears that whilst news of Improvement Notices, etc. can have an impact, there are a number of factors that can dampen the impact of such ‘news’.
Two respondents from the private sector pointed out that an issue (incident, prosecution. IN etc) could be a competitive advantage for others in the industry who would respond "very quickly if they saw a competitive advantage ".
A further comment related to the fact that organisations had to pro-actively look for information regarding prosecutions because the HSE do not widely publicise this information. As such, the response depends upon knowing about current issues. “ People don’t spend enough time looking for this information because they have too many demands placed upon their time; if prosecutions were widely publicised by the HSE, the response within organisations might be much greater”.
The main sources of “grapevine” news were:
• Subscription based journals, especially health and safety ones;
• Local networking between firms;
• British Safety Council, and;
• HSE bulletins.
The HSE’s Offenders Database was noticeable only by its absence in the feedback from respondents, and the HSE website is hard to navigate. The Offenders Database is considered ineffective, as a means of advertising news of prosecutions, as currently designed and operated. The Offenders Database is considered ineffective because:
• It is out of date (prosecutions are only included once secured);
• Provides insufficient information to tell you anything about the offence and if its applies to you, and;
• Is uninteresting.
Some trade associations and trade unions actively advertise incidents. Others do not make any attempt to do so.
Another cross sector comment was provided relating to the issue of an IN on a LA for stress. This was seen as a possible motivator by a manufacturing organisation but the "lack of clarity
A14
and external direction from the HSE" meant that the issue was not driven forward. One other comment did highlight that a prosecution (for a food safety offence) did set an example and other traders did respond, adapting their own behaviour in the light of the prosecution; although again this was a tight knit community and such a response would not appear to be generalised across other sectors.
9.4 UNDERSTANDING AND PERCEPTION OF HEALTH AND SAFETY RISKS
We were interested to establish to what extent the perception of risk was a driver in promoting safety performance and if this varied across sectors. We asked how well health and safety was understood in the sector and how this compared with other sectors understanding.
In order to ensure that the responses were not confounded by differing terminology or appreciation of risk per se, we tried to establish how the respondents would describe High or Low risk. This then provided a baseline from which to describe if the industry/ sector saw themselves as being a high or low risk "business" and which were the greatest risks in that business.
Finally, we were interested to see how and where health and safety sat in terms of overall risk to business. We did this by examining if fire safety, food safety occupational health and occupational safety were managed to the same "level".
9.4.1 Level of understanding of health and safety between sectors
The results from the discussions were interesting. The trade union view was that the understanding of health and safety was variable. Whilst larger companies were generally better than smaller ones, the overall impression given was that health and safety was "pretty poorly understood, although there were clear sector variations.
In the public sector health and safety was not understood well and did not have a priority. If, however, a senior "board" level, manager had experience of health and safety problems then the level of understanding was improved, although not necessarily acted upon. For the emergency services health and safety understanding was limited to the "operational level". Comparison with other sectors ranged from " other areas, such as nuclear and rail were better strategically - they have got it in their heads" to " much about the same as other sectors".
For the larger companies the issues of health and safety were held to be "very well understood" and evidence was provided of initiatives and cultural issues to demonstrate this. A general view appeared to be that the chemical industry was the leader in understanding of health and safety issues. In some instances the understanding of health and safety was driven by competitive pressures, as exampled by "the bigger companies trying to out do each other --(and demonstrate better health and safety performance and understanding)" This view was also expressed by another respondent as " it is now seen as part and parcel of selling the product". However, it was also commented that although there is a growing understanding of health and safety amongst Board / Senior management teams, this becomes somewhat diffused lower down organisations.
In the manufacturing sector the "hard issues" were well understood, but they "were not good at looking for new problems such as exposure to less noxious materials."
A15
Whilst in another sector the understanding was expressed as "they subconsciously understand" or they have past experience of operating dangerous machinery"
Almost all the Trade association/ professional bodies commented that the understanding was not as much as it should be but was improving. In some cases with marked improvement over the last 5 years. Although the picture was somewhat variable and sector or industry dependant, part of these differences may be explained by trade association activity, or the issue of complacency by particular employers.
Again, overall, the picture emerging is that where employers were familiar with the inherent and traditional risk in their business - for example machinery - (and not withstanding any issue of complacency), the understanding of health and safety is relatively good. But they are generally not good at new issues or the "soft" aspects of health and safety, such as management systems and occupational health.
One professional body commented that, for them, the problem was that whilst health and safety was "appreciated considerably" it was not "understood fully" as trainees (graduates in the construction industry) lacked practical on site experience, mainly due to sub contractor resistance to visiting groups.
In general, respondents considered that health and safety is gaining increasing understanding amongst senior members of organisations. However, the level of understanding lower down organisations is to a much lesser extent.
9.4.2 Perception of risk
The general picture that emerged was that the respondents were, for the most part, not sophisticated in the appreciation and description of risk. However some interesting factors came out. The main differentiation was between those who described risk purely in terms of exposure to specific hazards, such as "unsafe scaffolding", "hot oil" and those who saw risk in wider terms. For example, the "high risk" for one respondent (retail sector) was not so much the actual hazards in the workplace, but the fact that members of the public coming into an "unfamiliar environment", or for another industry as "time driven deadlines", high risk being an issue related to the amount of time available for a specific job and not the actual hazards inherent in that job. In the main, however, the appreciation of high/low risk was based on industry specific exposure to hazards. Many respondents appear to equate high risk with the possibility of a fatality.
The perception of risk in the various industries and sectors was fairly broad. Surprisingly the emergency services saw themselves as being reasonably low risk, partly because "health and safety is on the back burner" and fatalities were low with much more emphasis on other matters, such as diversity and associated political issues. Also, in the public sector, the professional safety staff saw the risk as being fairly high as issues such as confined spaces and hot working had to be dealt with. Whereas the management team (and Authorities) saw the risk as being low and the HSE probably did as well.
For the manufacturing sector (including distribution) the perception of risk tended to gravitate around the size of the industry or business. Larger companies, probably having a greater appreciation of risk than smaller ones, would see themselves at the higher end of risk for their business sector. Most of the responses saw the retail sector as under appreciating the actual level
A16
of risk , perhaps related to their views of the sector in terms of understanding of health and safety in general. One general comment was that :
"Chemical see themselves as high risk, retail see themselves as low risk (but ignorant of the extent of the problem) food manufacturing is the most ignorant of their risk profile. For
example, meat processing and slaughtering."
Whereas, for the construction industry one comment was:
"They see themselves as high risk but mentally they think it won't happen to me"
A view expressed by another respondent as:
" construction is perceived as high risk, ..depends on the company for example a single storey build is really No risk .. due to complacency they think " it won't happen to me"
Part of the problem was put down to " not sure who and who is not qualified (to be on site)", issues around the various "passport" schemes and the need for a visiting qualified professionals card.
It is thus hard to generalise about the perception of risk. What appears to be the case is that each industry/sector perceives risk according to its own traditional activities and understanding experience. Moreover, and particularly in the public sector, there may be a shift of risk perception as between the safety professionals and the senior managers.
Certainly, when asked to describe the main risk for the sector, the general response was one to be expected and related to the work being undertaken. Although, there were notable exceptions to this view. For example, for the electrical industry safety, in terms of working with electricity, was well understood and paramount, so that the high risks were seen as issues like working at height.
One manufacturing trade association felt that they actually contributed to reducing risk by supplying safe equipment and removing manual tasks from the workplace. Although the HSE saw the sector as high risk they felt they contributed more to the quality of life, all the problems being caused by the user in carrying out on site modifications of supplied equipment.
9.4.3 Overall risk
Again there was marked sector variations. That being so, the issue of fire safety was predominant in a number of sectors and industries. This was even so in some aspects of the food industry where fire safety and food safety were both seen as very important in some situations. For the food industry one comment was made that safety, food hygiene and environment all needed specialists so tended to have specialist advisers on these subjects for the bigger companies whereas "fire safety could be anyone's job". Although this view was by no means universal.
The larger FTSE companies tended to have an integrated approach to all risks but otherwise the subject areas of food safety, fire safety and occupational health and safety tended to be managed according to the perceived risk within the business/ sector. For retailers in general this meant
A17
fire was the greatest priority although for food retailers food became the more important area of concern. For the construction industry one comment was "it is not managed at all!"
9.5 UNDERLYING DRIVERS FOR HEALTH AND SAFETY
We were interested in examining what employers, particularly, thought about health and safety in terms whether they saw health and safety (or did not) in terms:
• Good for business;
• A critical business success factor;
• An important aspect of ensuring staff productivity and morale;
• A moral duty, and;
• Something done only because of the regulations.
9.5.1 Good for business
Again the responses were varied. In the public sector health and safety was not seen as a key business driver, although the moral duty and compliance with regulation were seen as relevant.
For the FTSE companies, the business case appeared to be much stronger although still somewhat mixed. Indeed, one company had linked performance in health and safety to their wishing to be seen as a preferred employer making a link with business retention and thus highly critical for business. One respondent reported that “good health and safety practices are a reflection of a well run business” For others, however, the business case is less strong. “There is a growing awareness. However, it is still seen as a necessary hindrance in some aspects”.
For high street chains the main driver appears to be reputation. As one respondent put it"in theory, at least, customers would not want to come into (unsafe premises) but people (customers) are odd in their behaviour ". In general, customers therefore see health and safety as ‘a given’.
In other sectors/ business the business case appears to be less important, with the regulation or moral driver predominating, although some respondents said all factors contributed.
For some sectors there appears to be an increasing "awareness" that health and safety performance may be good for business, although several of the Trade Associations pointed out that this has been difficult to prove.
Company size appears also to be a critical factor in how health and safety is viewed. The larger the company the more likely it is that the business case predominates. For smaller companies the moral case appears to be the main issue, with any poor performance in health and safety also causing business disruption.
9.5.2 A critical business success factor
Within the nuclear sector health and safety is seen as a critical business factor. It was reported that “another incident like Chernobyl would kill the industry”. Another respondent from the
A18
chemical sector reported that “although not critical to the short term viability of the business, it is critical to the longer term sustainability”. In contrast, other organisations responses ranged from it “being a key goal, but not top of the agenda”, through to it not being considered at all.
9.5.3 An important aspect of ensuring staff productivity and morale.
In general, organisations within the private sector supported this statement to greater or lesser extent. However comments also indicated that health and safety improvements / interventions would not necessarily motivate employees, they would ‘expect’ to be looked after in this way. In essence, “health and safety is seen as a hygiene factor – not a motivator”.
Within public sector organisations a mixed message emerged. These ranged from “we pay lip service to this, in part because we don’t really understand” through to “We are beginning to learn, however it is not accepted as a major aspect” However, all respondents indicated that they believed it is important for staff to feel ‘cared for’.
9.5.4 A moral duty
This statement evoked a range of responses. In general, respondents from within the public sector (bar one exception) reported that employers don’t think of health and safety as a moral duty. In contrast, responses from organisations within the private sector considered that they did have a moral duty, although this tended to be driven by the fear of damage to their reputation and associated level of publicity any breach might attract.
One trade union view was "the majority see it as a moral duty, they would be offended if they knew (the) truth on the shop floor. The moral duty is backed up by fear of prosecution". In contrast, one private sector organisation (within the transport industry) stated that an associated trade union created barriers against the organisation making one particular safety improvement by encouraging its members not to comply. The respondent believed that this was led by the increased ‘claims culture’. In essence, if employees were to comply with the recommendations, they would not be able to claim against damage later in life.
One company was much more motivated by the moral case directly as a result of the "socialist environment" in which the company had been nurtured and developed.
9.5.5 Something you do just because of regulations
In terms of regulations being considered a key health and safety driver, the responses tended to fall into two main categories: approximately 50% of respondents see regulations as a key driver and admitted that they sought to comply but go no further; the other 50% regard regulations as basic minimum requirements and will always seek to go beyond these.
Several respondents commented that although compliance with regulations is a driver, they believe that they may prove detrimental to safety in some sectors because “some organisations will comply with regulations to avoid the threat of prosecution, however they will not go any further. Basically their motivation is to avoid prosecution when it should be to keep employees safe”.
A19
9.6 THE COSTS AND BENEFITS OF HEALTH AND SAFETY
We then went on to explore whether businesses / sectors viewed health and safety as a burden or as something that is valued. Coupled to this we were also interested to determine to what extent, if any, the business case for health and safety was developed, whether this involved both tangible and intangible benefits and if cost benefit considerations were made either to comply with the law or go beyond legal compliance.
9.6.1 Value or burden?
For the larger companies, the general view was that health and safety was seen as of value but only in the sense that it provided some benefits. These benefits tended to relate to either maintaining reputations or relevance to the industry sector. The compliance with health and safety systems, as one respondent put it "...probably burdensome because of all the things you need to do to prove”... and on the "shop floor" this was difficult for managers where the paper work was seen as a burden and taking their time away from "business issues".
In fact, several comments were made about the "paper chase" of health and safety compliance. Another problem was seen as the sheer volume of health and safety requirements and the absence of any apparent help to assist businesses to keep up.
The extent of whether health and safety was seen as a burden or value was partly determined by any visible value arising from health and safety activities. This was especially so for the smaller business, where health and safety was more likely to be seen as a burden with "too much red tape". Although, for some businesses, this was modified, with one respondent seeing it as "a cost burden, but it is also a value as it protects assets, including morale" and in some sectors it was seen as a value or more to the point "added value" largely, it would appear, based on client perceptions and requirements and as a way of maintaining business.
One trade association made the point that "if you can't manage you can't manage safety .. but a well managed (firm) will (see health and safety) as something that can be put to good use" And one of the manufacturing industry associations commented that "it is valued, it has gone beyond being a burden"
In the public sector there were mixed responses. In general the responses indicated that health and safety was seen as 50% burden – 50% value. The burden related to the chronic underfunding and conflicting demands made upon finite resources. However, it is valued because it is deemed necessary because it prevents disruption to the business. In some areas health and safety was also seen as a burden, partly because of the way it was done. One example was cited as cleaning up oil on the floor. This meant that health and safety was seen as "a dirty word". On the other hand, there was evidence that the perception of health and safety was changing in the public sector with it now being seen as a benefit, with tangible results like lower sickness absence.
The trade union view supported the idea that health and safety is still seen as a burden and from one respondent "sadly too many don't seem to see the business case for health and safety " whilst another commented "would like to think they saw a business case for health and safety , but probably not".
A20
9.6.2 The business case
The examination of the business case issues around health and safety was difficult to unravel. For the most part, irrespective of sector or size of business, there did not appear to be much solid evidence to show that fully costed business cases were undertaken. There was some evidence in the public sector that justification of scare resources could be made, an example given for providing a fire safety post, with expenditure on safety being queried more than for other areas. The approach in the public sector is about meeting the cost benefit for compliance with the law and not for seeking best practice. In some cases it was difficult to separate out the health and safety costs and benefits. For example, emergency services training. The comment was made that as far as the Comprehensive Performance Review was concerned there was no mention of health and safety.
Overall, there seemed to be general empathy with the idea that health and safety was good for business, but the evidence for this was not available in many cases, particularly so for the intangible benefits. Where expenditure on health and safety was required to meet the law, then, in general, this would be done. As one respondent put it "they would bite the bullet", particularly so for smaller businesses.
For some of the larger companies there were examples to show that the business case was well understood to the extent that it was actually about "making places safer and not about finances (business)" - but this was an exception. In general, the larger companies may be involved in the development of basic level cost-benefit assessments. In one case cost benefit was required to demonstrate the adoption of best practice (compared to legal compliance). However, CSR was also seen to have an impact in this area, with some of the larger companies actively involved in demonstrating a commitment to CSR principles incorporating wider safer issues.
One area where there appears to be some indirect cost benefit analysis is that of client/customer preference. Clients (customers) rather than regulations causing business to invest in safety to meet contractual requirements to maintain or obtain business.
Overall cost-benefit analysis / justification, where it does happen, appears to be restricted to the larger firms . This, in part, would appear to be due to smaller firms having neither the time nor the expertise to undertake such an assessment.
No evidence appeared, however, to show that wider social considerations in terms of such matters as NHS costs (for remedial treatment post accident) were figured into any business case/cost-benefit assessments. However, several organisations reported that they do consider the impact of their activities on local communities and invest in these.
9.7 IMPACT OF THE INSURANCE MARKET/INDUSTRY
We endeavoured to establish how, and to what extent, insurers were impacting on health and safety across sectors and within business, particularly with regard to ELCI.
Firstly, we attempted to establish if premiums were being set in relation to claims history and to try and ascertain how this was being moderated.
Responses in this area were variable. In part they reflected hardening insurance markets with several respondents referring to the fact that in their sector insurance was proving more difficult
A21
to get, and in some cases insurers had moved out of the market. Several respondents confirmed that insurance was being set, at least partly, against claims history, but also with some use of insurers surveys (for the larger companies/sites). Others suggested that premiums were being set against claims. However, this was for sectors claims rather than specific claims against organisations. As such, the organisation does not benefit financially (lower premiums) if they see a reduction in claims. Some also referred to fire claims, rather than ELCI claims as being assessed. But, on the other hand, several respondents also said that premiums were not being set against claims history. One observed that "mark up is only partly set against claims".
In terms of the impact of the insurance sector one respondent commented "...important for companies to be seen as a marriageable prospect, there being plenty of others to come to the alter"
We then asked if there was any evidence that insurers were seeking some form of demonstration that the law was being complied with. In this area we received a number of positive responses with the overall view being that insurers were becoming more proactive, and not just in relation to ELCI, but also other areas, such as fire. Where insurers were being "proactive" actions included;
• Asking for risk assessments;
• Seeking safety polices, and;
• Undertaking site surveys.
To some extent the activity of insurers varied, depending on the size of the account and only a relative few of the respondents reported positive actions on the part of insurers in this regard. One respondent remarked that the “insurance company have become the ‘policemen’ of health and safety – they dictate what has to be done and we comply”.
9.8 REPUTATIONAL RISK
All those interviewed from within the private sector clearly valued their reputation, with many stating that this was the biggest business driver for them. Many stated that the rationale behind this related to the length of time it has taken to build a good reputation, yet the quickness of time that it can be lost.
“Our good reputation has been built up over forty years, yet it can be lost overnight”.
In contrast, however, for some smaller businesses reputation may not be an issue. As one trade association commented:
"reputation is valued hugely but the smaller (firms) - those on the edge (of the major business) won't value it (reputation)"
With regard to the public sector, although they too valued reputation, it was to a lesser extent. In particular more than one interviewee pointed out that this was, in part, related to the lack of alternative services available to the public within geographical locations. One interviewee commenting:
A22
"people have to use the service provided by us, they have nowhere else to go, (they) have no choice"
As such, even if their reputation was damaged to a certain extent, it was doubted that they would lose ‘clients’ as a result because of the absence of alternative options. However, "members" (that is elected representatives) were seen as valuing their personal reputation highly, although this was on political issues with health and safety not being seen as a reputation issue.
The trade associations view largely coincided with that of the bigger businesses, reporting that their reputation is highly valued amongst themselves and their members. For the smaller businesses one commented:
"they are proud of their name above the door (whereas) for the larger businesses it is more of a corporate issue".
On the other hand, the view of the trades unions was somewhat polarised, tending to reflect the sector they represented. Thus, one commented that:
"{reputation} is a massive issue, especially on the retail side " but another remarked:
"it depends on size, the market and branding- only those who can suffer damage {quotes company} worry about it. Fatalities in the construction industry don't make the news, it doesn't
seem to be an issue for the media and hence no reputational risk is involved (for the companies)".
Is there an issue if reputations are damaged?
Respondents from the private sector reported that they perceived that if their reputation was severely damaged it could impact on the viability of their business. The extent of the damage would depend upon the amount of adverse publicity afforded. As such, if an incident was not widely reported, it would not have the same impact. The greatest fears expressed related to the following:
• Loss of investment from external parties (customers, financial institutions etc);
• Potential decrease in the value of shares;
• The change in stakeholders perceptions – “if health and safety is poorly adhered to, what other aspects of the business are sloppy”. In simpler terms, it highlights weaknesses within the organisation;
• Damage to the longer term goals of the organisations to “be the best”;
• Impact upon employees – loss of morale leading to decrease in productivity and higher staff turnover;
• For an international brand if issues are not resolved the whole market is brought into disrepute;
A23
• Job losses, and;
• (For smaller firms), their standing in the community.
• Difficulty in retaining existing employees;
• A decrease in the ‘perceived value’ of the service from members of the public;
One trade association made the point that:
" ours is a very visual industry , our reputation is damaged by not delivering on time, rip off prices and our ability on site but it would be damaged by health and safety if the client was
concerned" and that loss of business would follow from this.”
With the exception of the nuclear sector, when asked if they could quantify the impact of the above, no-one could provide actual examples, only hypothetical constructs. However, because of the extent that they perceived reputational value, none of the larger organisations would be prepared to take the risk of ‘leaving themselves vulnerable’ to reputational damage. This was not the case for some sectors of smaller business. One trade association comment was
"if they are small enough they don't care" - this largely relating to the fact that work is obtained on price . And yet another observed
"they (smaller firms) don't understand the issues"
With regard to the response from interviewees in the public sector, their fear of reputational damage related more pertinently to the impact it may have internally. For example, in:
• Not being able to recruit suitably qualified and experienced employees;
• A political impact on elected representatives, and;
• A poor relationship with staff
When organisations say they fear the reputational damage from poor health and safety, what do you think they mean?
The most frequently reported response from organisations within the private sector related to the potential loss of business. This is more pertinent for those that have direct contact with customers. One reason given for this was that “customers are more clued up on health and safety, therefore may be willing to take their custom elsewhere if poor health and safety standards were reported or heavily publicised, thus damaging reputation”.
The point was underlined in a trade association comment: "if customers didn't care they wouldn't do it"
This view was moderated, however, by the amount of publicity that would be attracted. In essence, if it was unlikely to ‘hit any headlines’ it would not have the same impact. Even then, some commented that a local impact would not affect a larger company, "a small business might suffer more proportionally as therefore there would be a big local impact. But an accident (that
A24
happened in one county) would mean that not many people would know about it - that is if you have 5000 employees an accident is less significant to the public"
From another perspective, there are those industries where reputation would appear to be a key driver in obtaining business. As one trade association commented:
"we get work because of reputation - if a major accident this would be a problem - architects look at the website (HSE name and shame) and use the information in making a decision (on
who to appoint)"
Another aspect considered is illustrated by one respondent in commenting on reputation:
"we are very jealous of it"
Thus, indicating that, whilst loss of business is a primary concern, it is not the only factor.
Again, it was evident that, in the main, for the food sector (including retail, catering and hotels) health and safety was not the issue, reputation concerns were related to food safety unless there was a major public health issue, such as a legionella outbreak.
In other sectors it was clear that "product liability" was the main reputation issue, as illustrated by the suppliers to the automotive and aerospace industries.
It was also reported that the level of competition and ‘brand name’ within a sector were mediating factors in relation to the level of impact. In a highly competitive business where ‘brand name’ is synonymous with high moral and ethical values, the perceived impact upon loss of business was the greatest. This effect was magnified, or compounded, even for the less well known companies, if the company had a national profile.
Within the public sector the level of fear, where it existed, in general was related to the potential withdrawal of funding. For example; NHS trusts reported that primary care trusts (GP’s etc) have the option to use an alternative trust to provide treatment. However, the impact of this was not perceived as great because patients, in general, would choose to use local service providers. Although one responding public body had suffered two major health and safety prosecutions, with no apparent impact on reputation in any way.
Why might some organisations fear the reputational impact of poor health and safety more than others?
There was a general consensus of agreement amongst respondents from the private sector, the public sector and trade associations on this question. The most frequently cited responses are noted below:
• The public’s perception of the ‘brand name’ and its associated reputation.
• The amount of publicity that the organisation attracts.
• The quality of the relationship the organisation has with the local, regional and national community.
A25
• The size of the organisation, i.e. the larger the organisation alongside the amount of publicity it attracts.
• High risk organisations – the greater the potential damage they can cause to employees, communities and the environment.
• Organisations within ‘sensitive sectors’ e.g. RSPCA, RSPCC
• "a lot of people just bury their head in the sand and think they can get away with minimal or non compliance".
• Within organisations, where a high level of trust is afforded e.g. transport, food, pharmaceuticals, health and care sectors, and any sector that has direct involvement with children (theme parks, activity centres, fairgrounds etc)., although not particularly the emergency services.
• The closer they are to an identified end customer or the relationship they have with their customers.
• Against this background a number of the trade associations pointed out, as illustrated by one respondent, that:
• "it depends on size, and the way they behave generally, the bigger they are the more sensitive to trading on brand image"
• And another, commenting on a small business sector, said:
• "some fear health and safety, but the majority do not think of it"
• Another pointed out:
• And another:
• "large companies have nowhere to hide but a smaller company may be able to keep head down".
Could organisations in your line of business lose contracts or customers if a serious incident occurred?
There was a level of disparity amongst the responses to this question, both within the public and private sectors, and to a certain extent this depended upon their position within the supply chain. In general, organisations that enjoy a high profile amongst members of the public, and have direct contact, believe that they would lose customers. However, organisations that do not have the same public profile (and tend to be in the middle of the supply chain), or where there is no obvious competition (hence they have a captive audience), do not believe that this would impact greatly on their business. One respondent stated that “customers just want the goods”. Another commented that loss of business was "very unlikely, you would have to show there was gross negligence"
A26
With regard to customers (supplies or services) placing demands on organisations, either contractually or otherwise, there was an almost unanimous response. Nearly all organisations placed demands upon contractors with regard to health and safety management. Many reported that the contractors had to abide by the organisations health and safety standards. Indeed examples were given where contracts had been lost because of health and safety failings. However, in some cases it was the companies who were placing demands upon their customers to ensure, for example, safety on sites where deliveries are made. Furthermore, in some cases, no demands appeared to be made, as one industry association commented:
"there are no contractual demands- not like the automotive industry- if the top of the chain did require them (health and safety actions) then it would happen, but not sure if this would
improve safety"
Whereas, many reported that if they were supplying services, demands were also made upon them. The rationale offered for this was twofold: firstly, as a way of ‘sharing risk,’ and; secondly, to ensure that any reputational damage as a result of a breach of health and safety by a contractor would be minimised as they would have ‘been seen’ to have followed procedures.
There did appear to be some differences in sectors with one respondent stating that the petrochemical industry and the NHS (as a client) were more demanding, and further that:
" the contractor is there to be bashed and off set loses in other parts of the (clients) business, this is quite explicit."
Another pointed out that:
"customers’ demands for health and safety are not directly linked to legislation, for example working at height and restrictions on young people. (In the latter case) they are laying off the
risk, risk avoidance by not employing under 18s"
Again, in the food sector there was some evidence that demands were made against food safety standards, but the same rationale was not being applied to occupational safety.
The Trades Unions raised the issue of the use of contractors in the building industry, pointing out that this was multi layered and it was only the "bigger jobs" where health and safety approaches might be imposed. Further that in some other sectors "there was not much evidence of health and safety , but evidence of strict quality control"
9.9 FEAR OF ENFORCEMENT ACTION
9.9.1 Fear of enforcement
Respondents were asked to what extent organisations within their sector fear enforcement action. There was a level of disparity amongst the responses. These responses are shown in Table 58 below. The responses have been categorised as either high, medium or low. Although a number of respondents rejected the idea that there was actual fear of enforcement, some said that they actually "liked" enforcement or saw the regulator as a "critical friend" or "not feared but respected but not expected". Another trade association respondent was more direct: "there is no fear of enforcement but fear of the enforcers". Yet another commented: "there is fear of food safety enforcement but not health and safety as not much is happening"
A27
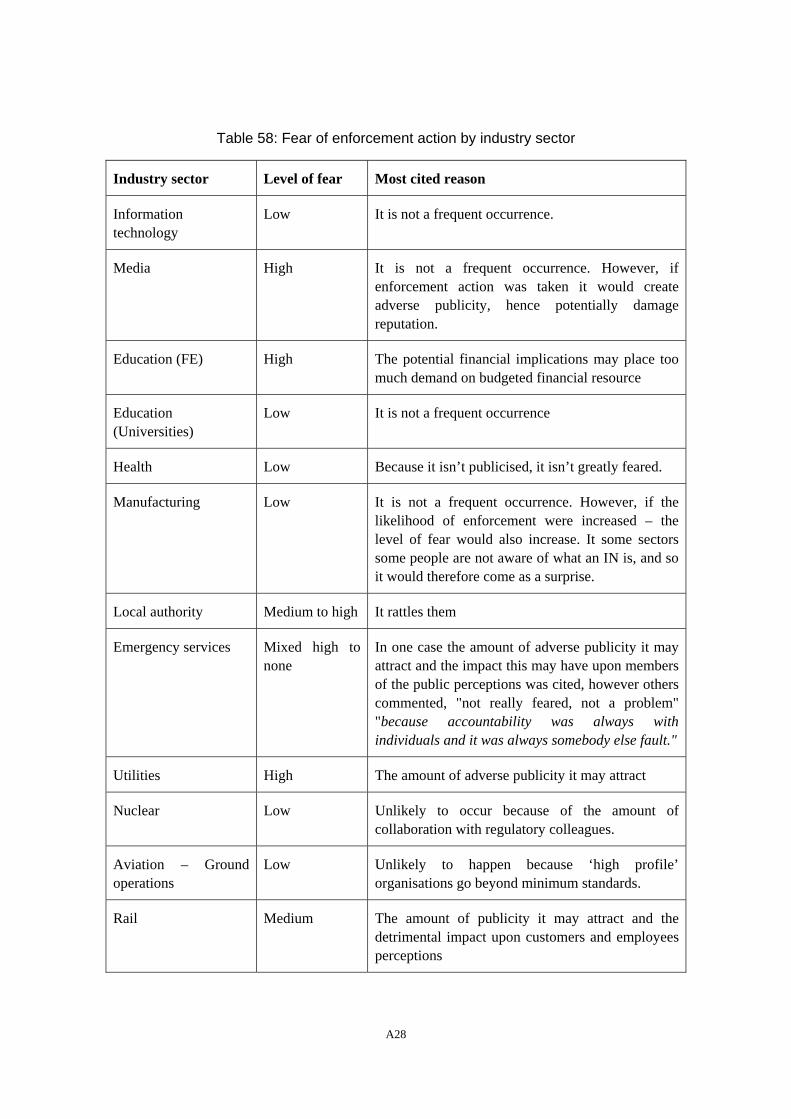
Table 58: Fear of enforcement action by industry sector
Industry sector Level of fear Most cited reason
Information technology
Low It is not a frequent occurrence.
Media High It is not a frequent occurrence. However, if enforcement action was taken it would create adverse publicity, hence potentially damage reputation.
Education (FE) High The potential financial implications may place too much demand on budgeted financial resource
Education (Universities)
Low It is not a frequent occurrence
Health Low Because it isn’t publicised, it isn’t greatly feared.
Manufacturing Low It is not a frequent occurrence. However, if the likelihood of enforcement were increased – the level of fear would also increase. It some sectors some people are not aware of what an IN is, and so it would therefore come as a surprise.
Local authority Medium to high It rattles them
Emergency services Mixed high to none
In one case the amount of adverse publicity it may attract and the impact this may have upon members of the public perceptions was cited, however others commented, "not really feared, not a problem" "because accountability was always with individuals and it was always somebody else fault."
Utilities High The amount of adverse publicity it may attract
Nuclear Low Unlikely to occur because of the amount of collaboration with regulatory colleagues.
Aviation – Ground operations
Low Unlikely to happen because ‘high profile’ organisations go beyond minimum standards.
Rail Medium The amount of publicity it may attract and the detrimental impact upon customers and employees perceptions
A28
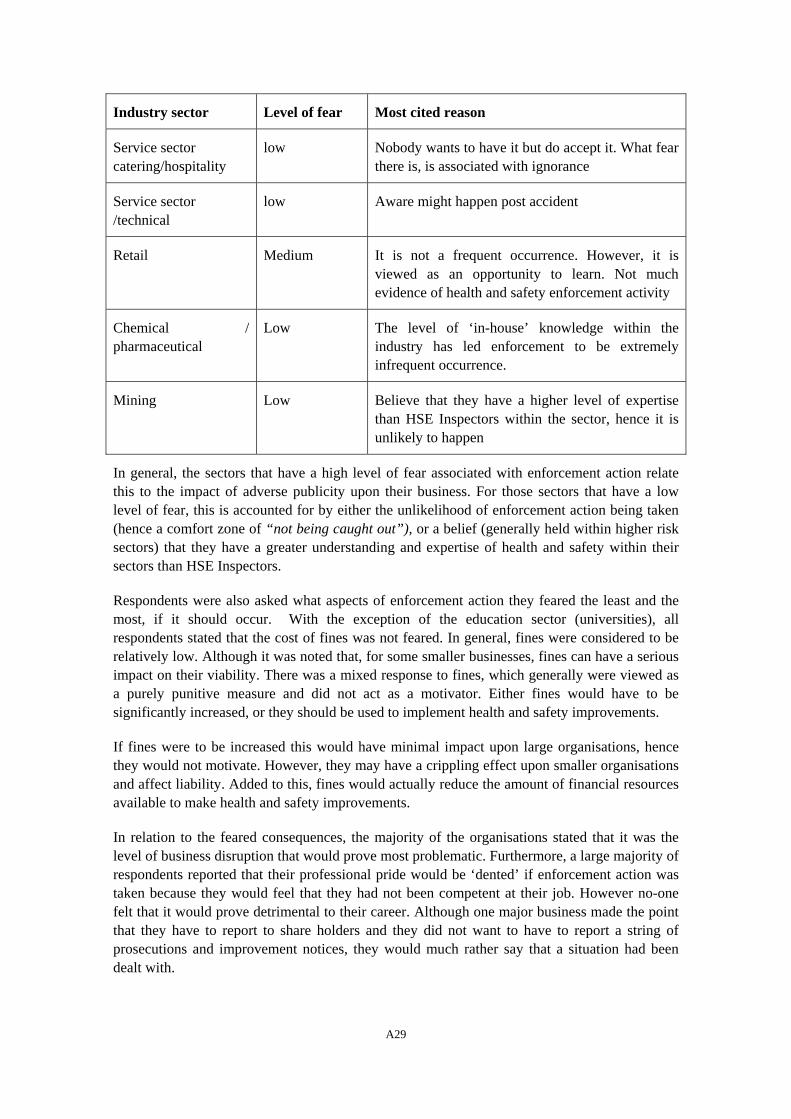
Industry sector Level of fear Most cited reason
Service sector catering/hospitality
low Nobody wants to have it but do accept it. What fear there is, is associated with ignorance
Service sector /technical
low Aware might happen post accident
Retail Medium It is not a frequent occurrence. However, it is viewed as an opportunity to learn. Not much evidence of health and safety enforcement activity
Chemical / pharmaceutical
Low The level of ‘in-house’ knowledge within the industry has led enforcement to be extremely infrequent occurrence.
Mining Low Believe that they have a higher level of expertise than HSE Inspectors within the sector, hence it is unlikely to happen
In general, the sectors that have a high level of fear associated with enforcement action relate this to the impact of adverse publicity upon their business. For those sectors that have a low level of fear, this is accounted for by either the unlikelihood of enforcement action being taken (hence a comfort zone of “not being caught out”), or a belief (generally held within higher risk sectors) that they have a greater understanding and expertise of health and safety within their sectors than HSE Inspectors.
Respondents were also asked what aspects of enforcement action they feared the least and the most, if it should occur. With the exception of the education sector (universities), all respondents stated that the cost of fines was not feared. In general, fines were considered to be relatively low. Although it was noted that, for some smaller businesses, fines can have a serious impact on their viability. There was a mixed response to fines, which generally were viewed as a purely punitive measure and did not act as a motivator. Either fines would have to be significantly increased, or they should be used to implement health and safety improvements.
If fines were to be increased this would have minimal impact upon large organisations, hence they would not motivate. However, they may have a crippling effect upon smaller organisations and affect liability. Added to this, fines would actually reduce the amount of financial resources available to make health and safety improvements.
In relation to the feared consequences, the majority of the organisations stated that it was the level of business disruption that would prove most problematic. Furthermore, a large majority of respondents reported that their professional pride would be ‘dented’ if enforcement action was taken because they would feel that they had not been competent at their job. However no-one felt that it would prove detrimental to their career. Although one major business made the point that they have to report to share holders and they did not want to have to report a string of prosecutions and improvement notices, they would much rather say that a situation had been dealt with.
A29
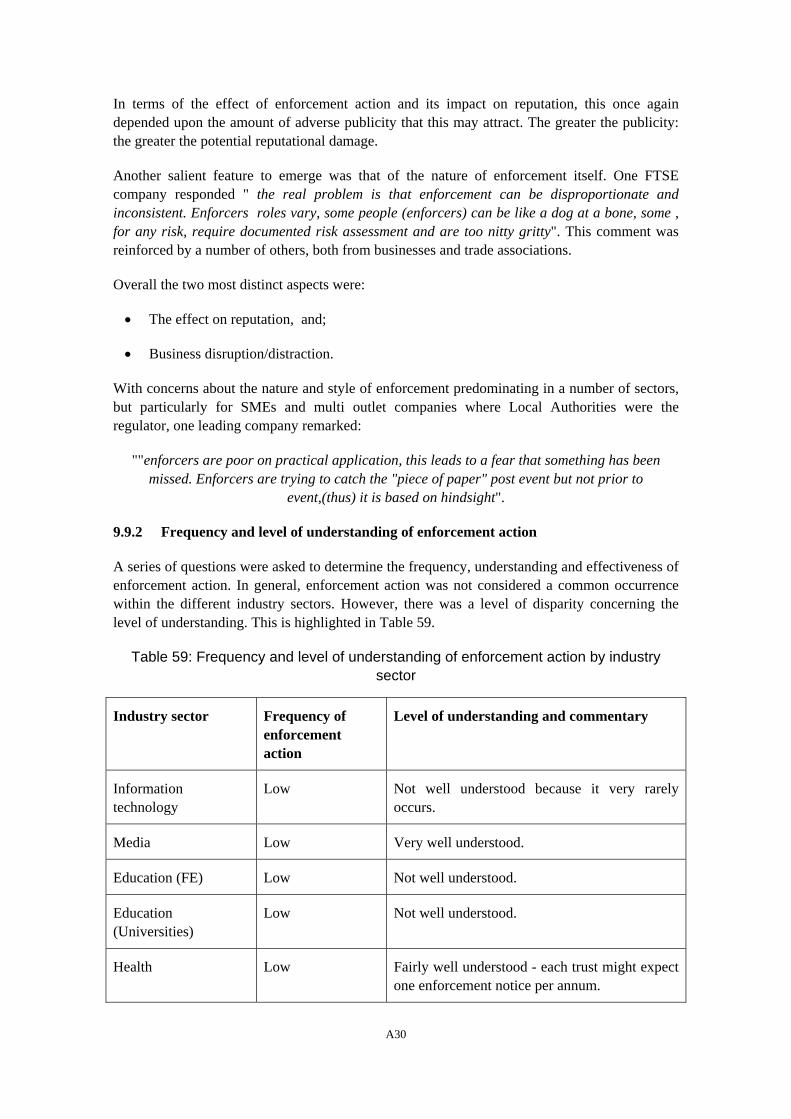
In terms of the effect of enforcement action and its impact on reputation, this once again depended upon the amount of adverse publicity that this may attract. The greater the publicity: the greater the potential reputational damage.
Another salient feature to emerge was that of the nature of enforcement itself. One FTSE company responded " the real problem is that enforcement can be disproportionate and inconsistent. Enforcers roles vary, some people (enforcers) can be like a dog at a bone, some , for any risk, require documented risk assessment and are too nitty gritty". This comment was reinforced by a number of others, both from businesses and trade associations.
Overall the two most distinct aspects were:
• The effect on reputation, and;
• Business disruption/distraction.
With concerns about the nature and style of enforcement predominating in a number of sectors, but particularly for SMEs and multi outlet companies where Local Authorities were the regulator, one leading company remarked:
""enforcers are poor on practical application, this leads to a fear that something has been missed. Enforcers are trying to catch the "piece of paper" post event but not prior to
event,(thus) it is based on hindsight".
9.9.2 Frequency and level of understanding of enforcement action
A series of questions were asked to determine the frequency, understanding and effectiveness of enforcement action. In general, enforcement action was not considered a common occurrence within the different industry sectors. However, there was a level of disparity concerning the level of understanding. This is highlighted in Table 5 . 9
Table 59: Frequency and level of understanding of enforcement action by industry sector
Industry sector Frequency of enforcement action
Level of understanding and commentary
Information technology
Low Not well understood because it very rarely occurs.
Media Low Very well understood.
Education (FE) Low Not well understood.
Education (Universities)
Low Not well understood.
Health Low Fairly well understood - each trust might expect one enforcement notice per annum.
A30
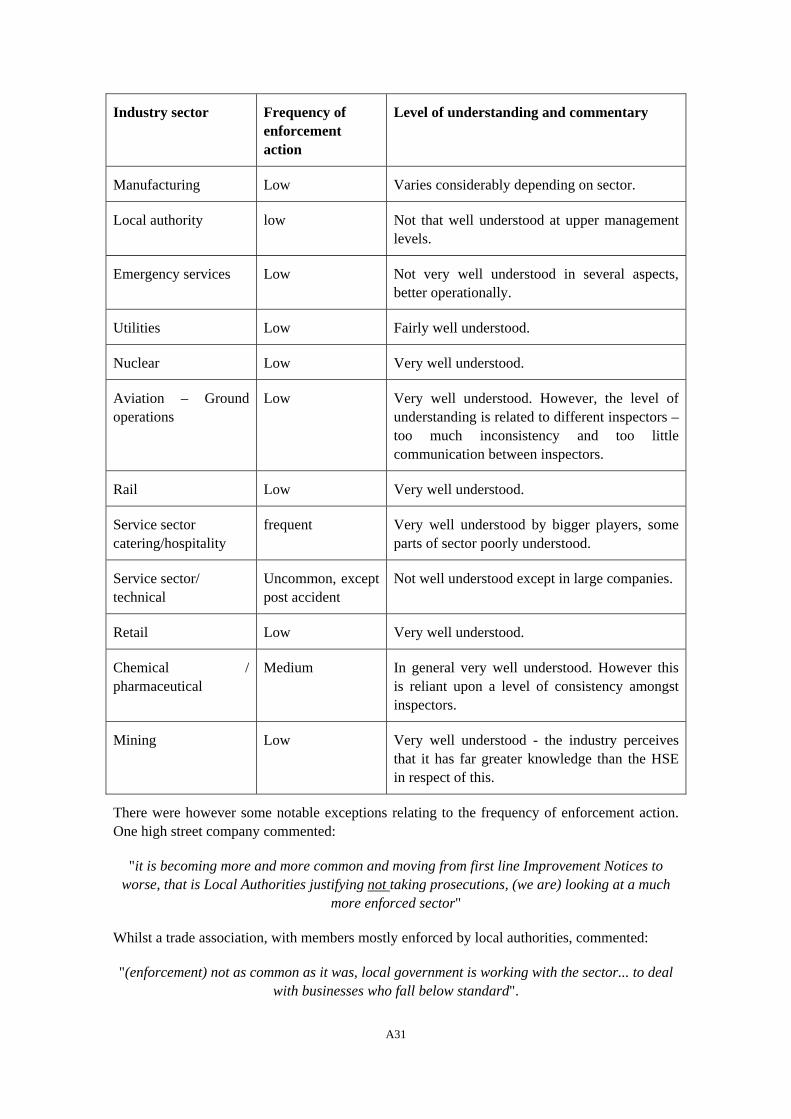
Industry sector Frequency of enforcement action
Level of understanding and commentary
Manufacturing Low Varies considerably depending on sector.
Local authority low Not that well understood at upper management levels.
Emergency services Low Not very well understood in several aspects, better operationally.
Utilities Low Fairly well understood.
Nuclear Low Very well understood.
Aviation – Ground operations
Low Very well understood. However, the level of understanding is related to different inspectors – too much inconsistency and too little communication between inspectors.
Rail Low Very well understood.
Service sector catering/hospitality
frequent Very well understood by bigger players, some parts of sector poorly understood.
Service sector/ technical
Uncommon, except post accident
Not well understood except in large companies.
Retail Low Very well understood.
Chemical / pharmaceutical
Medium In general very well understood. However this is reliant upon a level of consistency amongst inspectors.
Mining Low Very well understood - the industry perceives that it has far greater knowledge than the HSE in respect of this.
There were however some notable exceptions relating to the frequency of enforcement action. One high street company commented:
"it is becoming more and more common and moving from first line Improvement Notices to worse, that is Local Authorities justifying not taking prosecutions, (we are) looking at a much
more enforced sector"
Whilst a trade association, with members mostly enforced by local authorities, commented:
"(enforcement) not as common as it was, local government is working with the sector... to deal with businesses who fall below standard".
A31
Thus, indicating that, whilst the overall frequency of enforcement may not be increasing, the nature of the action taken was changing, particularly in Local Authority enforced sectors.
9.9.3 Effectiveness of enforcement action
With some exceptions, most sectors believe that enforcement is a highly effective tool in prompting action. This is, in part, driven by the desire to minimise business disruption and to limit reputational damage. However, the longer term impact of enforcement action in focusing attention more upon health and safety was doubted. In essence, everything would be done to correct the breach. However, once this had been corrected health and safety may slip down the agenda.
It was frequently cited amongst respondents that non compliance was more consistently associated with a lack of understanding, rather than a deliberate attempt to ignore regulations. As such, although enforcement action leads to action, because it stipulates specific requirements, it is viewed as a purely punitive measure. What organisations wished for was advice to help them understand how they had failed to comply in the first place.
A selection of free text quotes exemplifying respondents views are shown below:
“In the short term enforcement action forces health and safety up the agenda, but not in the longer term”
“Health and safety is always on the agenda, however if a prosecution occurred, it would focus the Boards attention but only in the short term”
“ Health and Safety is always high up on the Boards agenda, so enforcement action would not alter this, however it does focus managements attention, but I do not think that they sustain this
once the problem has been sorted out”
“It would not force us to do something we would not otherwise do, because we would only be in the situation if we were ignorant to it. In that sense, punishing us for being ignorant seems
extremely reactive. Surely it would be better to advise and then punish if no action was taken?”
“It makes us take stock and review to ensure that we do not leave ourselves vulnerable to further enforcement action”
“It is the best motivator the HSE have got – however we would always wish to comply and any breach is usually because of a lack of understanding of the relevance of certain legislation
within our sector. It is near on impossible to keep up to date with every regulation and how it is applicable”
“Enforcement action focuses the attention from Board members. However, the impact is only in the short term because members of the Board change relatively frequently”
"it makes them more aware, but the truth is they have to make a profit"
"HSE action is quite a stark experience, so forces new priorities."
"the industry gets away with a lot because Inspectors are not around"
A32
"Know that HSE is stretched and that unlikely to get checked and may be able to restore (situation) if advanced notice given of HSE on site".
"it tends not to act as a "wake up" call because sometimes enforcement action has spurious reasons, is inconsistent and latitude by inspectors needs to be exercised"
"Improvement notices are issued and then nothing is done, revisit made and recorded at the time and is therefore not really a focussing issue, but a prohibition will make them sit up , but
probably only temporarily"
One distinct feature to emerge is illustrated by this comment from a major company, referring to the effectiveness of enforcement action
"it is limiting, (it does not focus attention) because (managers) will not take responsibility for health and safety due to litigation and criminal sanction, at Board level people are wary about
taking responsibility on board"
Overall, it would appear that there is almost general agreement that enforcement action does have an impact upon companies, but this is limited by:
• What effect there is, is short lived and once an issue is dealt with the impact of the enforcement has worn off;
• The impact itself is limited as a driver, because in most sectors enforcement is not a common experience;
• Inconsistencies in enforcement create a lack of faith in the enforcing action itself, and;
• Responses to enforcement varies across sectors.
9.9.4 Enforcement action as a yard stick
We asked if enforcement action was seen as something by which organisation could determine or judge if they were doing enough as regards health and safety.
The majority of respondents did not feel that enforcement action had much impact in this area, although one commented:
"suppose it will make them look at their health and safety policy and may motivate them to think about it".
And others commented:
"big chains might for fear of being sued, but .. more reactive than proactive"
"yes would thinks so, because feel that doing the right thing but inspection would act as a benchmark"
"for some firms a once a year inspection does this"
"inspectors do not highlight good practice from other companies"
A33
9.10 THE ROLE OF REGULATIONS
In general, regulations are well supported and valued within all sectors as long as the benefits are clear. This comes with the view that
"see benefit and need as a reputable company to comply positively"
One trade association commenting:
"(regulations) provides direction, even if not wanting to comply, it provides a business objective- in absence of a lot of the regulations it would be a maelstrom out there" and yet an
emergency services view was
" absence of regulations would make no difference - particularly operationally"
However, it was widely reported that the regulations and associated guidance is, at times, overly complex, difficult to understand and not focused enough on specific sectors. For example, the working at heights regulations have proved difficult to adhere to within the retail sector because they do not provide specific guidance on the activities involved. Other sectors reported similar problems.
One respondent was keen to iterate that “much legislation and guidance is ambiguous, badly written and difficult to interpret”. Hence, although organisations in general support legislation, they feel it is made unnecessarily difficult for them to interpret. Another made the point:
"part of the British character is to comply, …(but) it would be easier if safety law was like food law, i.e. one Act and two Regs, instead of one Act and lots of Regs."
Whilst another expressed the view:
"well underlined regulations are supported - e.g. asbestos but the whole body of legislation is poor therefore there is no blanket support "
With regard to specific legislation that was viewed particularly cumbersome/least likely to be complied with, the following examples were given:
• Manual handling regulations;
• Working at heights;
• Workplace regulations;
• Working time regulations;
• PUWER;
• Electricity- hard wire testing;
• DSE;
• Dangerous Substances and Explosive Regs;
A34
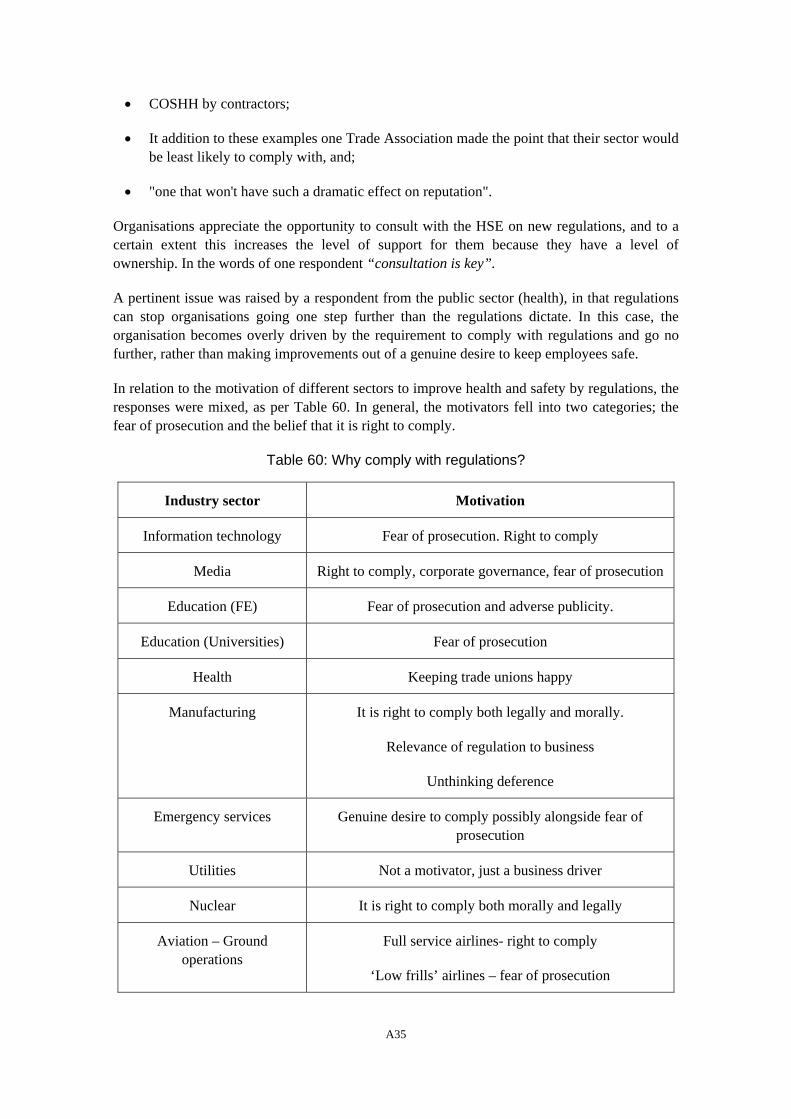
• COSHH by contractors;
• It addition to these examples one Trade Association made the point that their sector would be least likely to comply with, and;
• "one that won't have such a dramatic effect on reputation".
Organisations appreciate the opportunity to consult with the HSE on new regulations, and to a certain extent this increases the level of support for them because they have a level of ownership. In the words of one respondent “consultation is key”.
A pertinent issue was raised by a respondent from the public sector (health), in that regulations can stop organisations going one step further than the regulations dictate. In this case, the organisation becomes overly driven by the requirement to comply with regulations and go no further, rather than making improvements out of a genuine desire to keep employees safe.
In relation to the motivation of different sectors to improve health and safety by regulations, the responses were mixed, as per Table 60. In general, the motivators fell into two categories; the fear of prosecution and the belief that it is right to comply.
Table 60: Why comply with regulations?
Industry sector Motivation
Information technology Fear of prosecution. Right to comply
Media Right to comply, corporate governance, fear of prosecution
Education (FE) Fear of prosecution and adverse publicity.
Education (Universities) Fear of prosecution
Health Keeping trade unions happy
Manufacturing It is right to comply both legally and morally.
Relevance of regulation to business
Unthinking deference
Emergency services Genuine desire to comply possibly alongside fear of prosecution
Utilities Not a motivator, just a business driver
Nuclear It is right to comply both morally and legally
Aviation – Ground operations
Full service airlines- right to comply
‘Low frills’ airlines – fear of prosecution
A35
Industry sector Motivation
Rail Fear of prosecution
Catering/hospitality Right to comply, fear of non compliance
Service sector/ technical Provides direction
Retail Goal setting , good practice
Right to comply
Chemical / pharmaceutical Fear of prosecution
Mining It is right to comply. Fear of prosecution
To keep employees safe
With regard to regulations that organisations are least likely to comply with, the most frequent response was given as “ones they don’t understand or know about”. Overall, all industry sectors stated that as long as the regulations were applicable to them and they could see the ‘value’, they would comply. The only exception to this related to the working time regulations. Compliance with this regulation has proved problematic within the health and education sectors.
One trade union comment was:
"loads of examples where legislation has been misunderstood, costing money and adding to the myth of the financial burden of health and safety. For example, accident books"
The overriding message given by all sectors was that non-compliance was usually a result of ignorance and lack of understanding, rather than a deliberate act to ignore the regulations. This was accounted for by the sheer volume of regulations and the speed at which amendments are made. However, for the construction sector, there was a fairly well supported view that in some parts "loop holes" in the law would be exploited. And, from a trade’s union point of view:
"employers (are) relying on PPE rather than eliminating risk, they look how they can get round issues"
Another point was that literacy varies, and that for some regulations the wording is confusing (e.g PUWER) coupled with the fact that goal setting (such as braking on machines) is open to interpretation.
It was also pointed out that that there were problems with goal setting regulations:
"goal setting is not (goal setting) it is aspiration - smaller companies need prescription".
A36
9.11 THE MORAL CASE
Respondents were asked what they thought people mean when they say that they are motivated by the moral case for health and safety. Once again, this resulted in extreme opinions. Either comments indicating a high degree of cynicism were expressed, or a general belief that organisations have a moral duty to ensure their employees do not come to any harm.
For example, one respondent commented that the moral case only really came to light after someone had been killed or injured "there is a supposed to be a family relationship - culture, but this is really retrospective. We show concern after someone has been killed"
Again, in the public sector, another respondent observed that "60% of the care is after the event" whilst at the same time pointing out that "staff don't come to work to be injured and this is the Authorities view - there are enormous variations, lots of managers go beyond the pale to ensure staff are not injured"
Another observed that the moral case was short lived and transient and although there was a driver in the sense "I must do this" other pressures and distractions prevented it being effective.
One strong message that comes through is that where familial relationships exist the moral driver is quite strong. For example, one company quoted that:
"… employees over 20 years service, Strong relationship between all employees, and hence their welfare, is significant for all managers. To see someone injured is not something you
want" ,
The point was also made that in smaller companies the boss was often working alongside the employees, and hence the relationship was direct and immediate. Others linked the moral case to wishing to be the preferred employer and sending out a strong social cultural message was important, and this included good health and safety.
One leading high street retailer stated that ".. moral case is a powerful case, about upbringing and societal values. Vast majority of business leaders see that they have a moral as well as fiduciary duty, (it’s about) doing the right thing"
Although in some sectors in the bigger companies "the family issues don’t apply". In businesses with high staff turnover, as can be found in the catering sector, there is no real opportunity for the moral drivers to exist. As one trade association commented: "the employers only think the people are there a few hours" the inference being, so why worry. Again, another commented that the moral case existed if the situation was life threatening, but if not then the moral case did not exist. Overall the moral case was often simply put as "not wanting to injure people", “To keep people safe and to minimise the impact on the person and their family”, “It’s wrong to kill people” expressing a general belief that organisations have a moral duty to ensure their employees do not come to any harm.
However, comments indicating a high degree of cynicism were also expressed, as illustrated by the selection of free text quotes shown below:
“We pay lip service to the moral case because it is what people want to hear”
“People want assurance at the personal level that they don’t have blood on their hands”
A37
“I think they are lying”
“It’s not much fun to tell a woman that she has become a widow”
“If it’s costing the business too much, the moral case goes out the window”
To a certain extent the level of motivation for the moral case appears to be related to the following:
• the organisations that fear reputational damage the most (household names who may attract a high level of publicity, which would have a detrimental impact upon business);
• organisations involved in high hazard activities (particularly the nuclear and chemical sectors);
• the extent of familial relationships within the company, and;
• the extent of the social-cultural attitudes and beliefs of the company.
9.12 WHY DO ORGANISATIONS AND SECTORS DIFFER IN THEIR VIEWS OF HEALTH AND SAFETY?
We endeavoured to establish what, if any, differences existed in the attitudes of companies (and sectors) to health and safety and, if such differences existed, how they could be explained. We posited that any variation could be due to, amongst other issues:
• Level of competition within a sector;
• The financial climate, and;
• Perceived risk.
Overall, we identified that there are differences between and within sectors, although the reasons for this were not altogether clear.
Thus, one large company expressed the view that in their sector all the bigger companies had very similar attitudes to their own, but in smaller companies it largely depended on the "principles of the driver", that is the personal attributes of the MD, production director or owner. Three main drivers were seen to be operating here: customer demand; appreciation of health and safety, and money. The view was made that the differences were really between businesses and not between sectors, with cultural issues predominating. It was found difficult to apply the principles of UK law where the cultural mix on site (people with differing ethnic backgrounds) developed a different understanding of what was required. Moreover in the food sector Government changes meant that manufacturing of food in the UK was going to get expensive and two big pressures, price and demand from supermarkets meant that the sector was changing with mergers, which, in turn, had an impact on health and safety.
Another reiterated this view commenting that there were no enormous differences between the major players in the sector. Competition was ever present and did not change much although some might be more training led and others more profit driven. Risk perception was "pretty absolute" the main driver being would a "manager be able to sleep at night".
A38
Yet another commented that the biggest differences between sectors related to the employment of self employed contractors - as with the construction industry. Here, it was perceived that time was a major motivator and attitudes were thus more to do with time and money. The level of risk was not seen as a driver in these circumstances on the basis of "it will never happen to them".
In the public sector a different picture emerged. This was expressed as " unconscious incompetence, not aware of responsibilities or influence" and since they could not operate at a profit and even if they did, they cannot choose where and what to spend the money on, the attitudes appeared to have a lot to do with finances. One of the bigger attitudinal aspects was whether the senior management had personal experience of "unfortunate situations". Additionally, another respondent pointed out that "the employer has no view of health and safety, only some partial understanding" and that the political environment largely drove attitudes with "trans-gender realignment polices" taking a greater priority than health and safety, even in relatively high hazard environments like the emergency services. This view was further expanded by the observation that attitude is risk related;
"for example the ISO series (management standards for health and safety & E) are much more prominent in private areas (of business) and the application of these standards was associated
with improved attitudes"
Others, in the private sector, observed that the "big issue is money" especially in construction where tight pricing means the job has to get done quickly and this was linked to competition. In this respect the risk issue was really one of complacency. A view reiterated by another trade association, where the sector was dependant upon very small margins (1-2%).
For others, attitude differences were largely about the size of the company. The larger they are, the more vigilant they are or about education, training and mentality. One trade association comment was that it: "depends on knowledge, where they are more aware of the risk they more likely to do new health and safety systems"
Another, reiterating this view, commented that some companies are ill informed - about everything in general - and have poor views, so dismiss health and safety until they are galvanised by an "experience". Lack of awareness was also identified by others.
For this respondent the financial climate was not an attitude driver, observing that "If companies have no money they won't spend it and if they do have money they think they are OK"
Again, as with the comments on responses to safety issues where a professional safety adviser was employed, there was more likely to be an overview approach with attitudes being driven by risk perception and on professional basis.
One problem area was identified for some sectors, as expressed by one trade association. This was the view that the UK was always the first to comply with EU legislation and, as such, firms could not compete in the EU and this affected attitudes when companies on small margins were deciding where to spend money.
Overall, the attitudes differences were thus seen to be several fold with financial climate, competition, and knowledge being bigger issues than risk perception. Although two of the
A39
respondents mention enforcement, one arguing that it had no relevance and the other wishing there was more of it in their sector, as it would improve attitudes.
What distinguishes organisations
We then went on to examine what it is that distinguishes organisation in terms of how they see health and safety.
• Is it their sensitivity to poor health and safety?
• Is it their high street profile?
• Is it the probability of inspection or some other factor?
Two main issues became apparent. The first is that virtually every respondent agreed that reputation was the single biggest factor in how health and safety was seen and hence how they operated. This, however, needs to be taken in the context of the results of the previous section as clearly company size, sector profile and financial position all seem to play a part together with the overall attitude of the senior managers or owner. Thus, where reputation is linked to health and safety performance - either directly or indirectly - differences between companies are obvious.
The second issue was that of size. Although this was only observed by one or two respondents, one commenting that "larger sites are more likely to get inspected" with another commenting "the bigger they are the harder they fall". This would seem to indicate that the probability of inspection may have an influence, although from these discussions this was by not means at all certain and was not highlighted by most of the respondents.
What seems to be the case is that firms are distinguished in their views of health and safety by a complex set of factors related to their size, sector, risks, managing attitudes and reputation, alongside the level of media / publicity attention they would attract. All of these, to some extent, being linked with customer/client drivers (themselves a complex of factors). We endeavoured to establish what, if any, differences existed in the attitudes of companies (and sectors) to health and safety and if such differences existed how could they be explained.
9.13 HOW FIRMS COULD BE BETTER MOTIVATED TO MANAGE HEALTH AND SAFETY
Not surprisingly, there were far ranging views from all sectors with regard to how the HSE could motivate organisations to better manage health and safety. The overview of the responses to this section are shown in Table 61.
Table 61: How to motivate
Proposed suggestion Frequency of responses
Raise the profile and clarify section 37 Corporate Manslaughter 9
A40
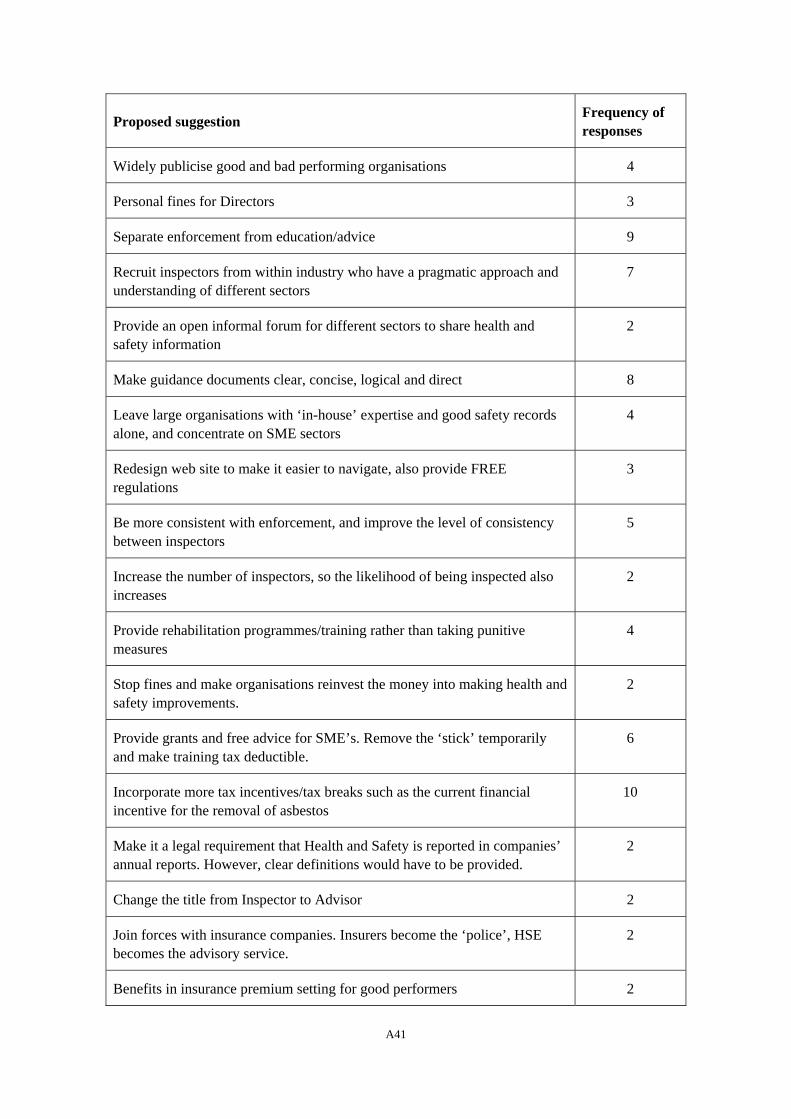
Proposed suggestion Frequency of responses
Widely publicise good and bad performing organisations 4
Personal fines for Directors 3
Separate enforcement from education/advice 9
Recruit inspectors from within industry who have a pragmatic approach and understanding of different sectors
7
Provide an open informal forum for different sectors to share health and safety information
2
Make guidance documents clear, concise, logical and direct 8
Leave large organisations with ‘in-house’ expertise and good safety records alone, and concentrate on SME sectors
4
Redesign web site to make it easier to navigate, also provide FREE regulations
3
Be more consistent with enforcement, and improve the level of consistency between inspectors
5
Increase the number of inspectors, so the likelihood of being inspected also increases
2
Provide rehabilitation programmes/training rather than taking punitive measures
4
Stop fines and make organisations reinvest the money into making health and safety improvements.
2
Provide grants and free advice for SME’s. Remove the ‘stick’ temporarily and make training tax deductible.
6
Incorporate more tax incentives/tax breaks such as the current financial incentive for the removal of asbestos
10
Make it a legal requirement that Health and Safety is reported in companies’ annual reports. However, clear definitions would have to be provided.
2
Change the title from Inspector to Advisor 2
Join forces with insurance companies. Insurers become the ‘police’, HSE becomes the advisory service.
2
Benefits in insurance premium setting for good performers 2
A41
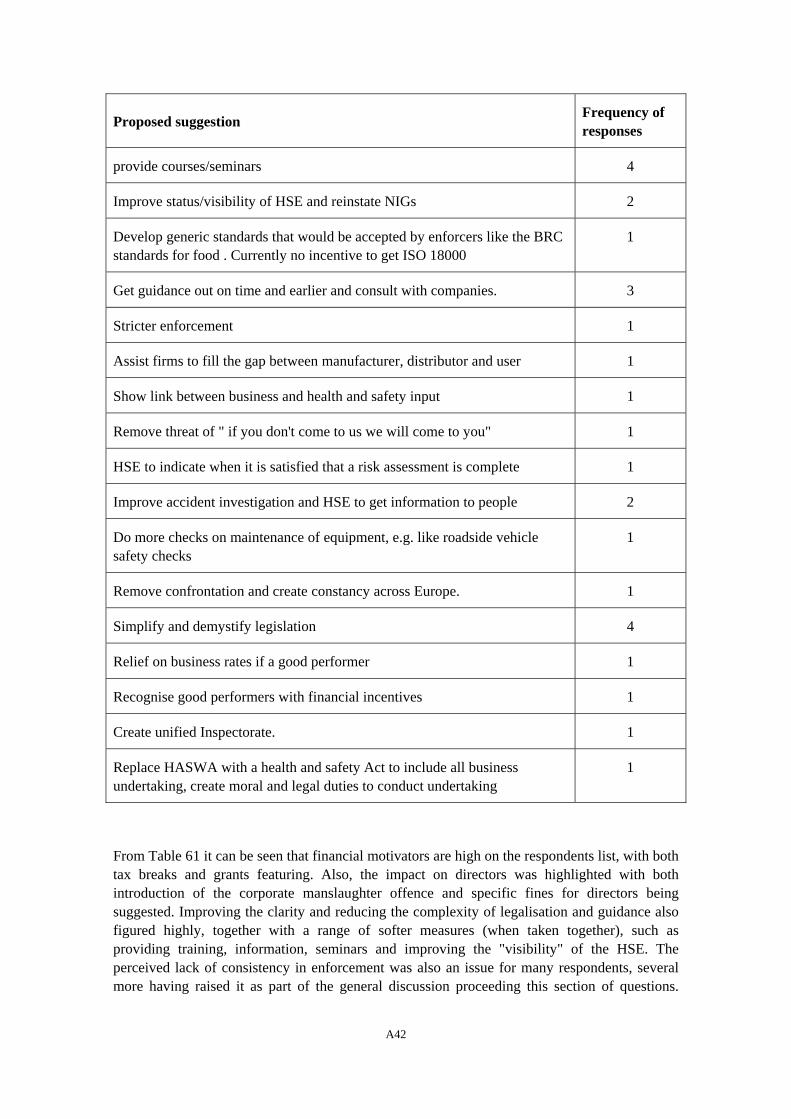
Proposed suggestion Frequency of responses
provide courses/seminars 4
Improve status/visibility of HSE and reinstate NIGs 2
Develop generic standards that would be accepted by enforcers like the BRC standards for food . Currently no incentive to get ISO 18000
1
Get guidance out on time and earlier and consult with companies. 3
Stricter enforcement 1
Assist firms to fill the gap between manufacturer, distributor and user 1
Show link between business and health and safety input 1
Remove threat of " if you don't come to us we will come to you" 1
HSE to indicate when it is satisfied that a risk assessment is complete 1
Improve accident investigation and HSE to get information to people 2
Do more checks on maintenance of equipment, e.g. like roadside vehicle safety checks
1
Remove confrontation and create constancy across Europe. 1
Simplify and demystify legislation 4
Relief on business rates if a good performer 1
Recognise good performers with financial incentives 1
Create unified Inspectorate. 1
Replace HASWA with a health and safety Act to include all business undertaking, create moral and legal duties to conduct undertaking
1
From Table 6 it can be seen that financial motivators are high on the respondents list, with both tax breaks and grants featuring. Also, the impact on directors was highlighted with both introduction of the corporate manslaughter offence and specific fines for directors being suggested. Improving the clarity and reducing the complexity of legalisation and guidance also figured highly, together with a range of softer measures (when taken together), such as providing training, information, seminars and improving the "visibility" of the HSE. The perceived lack of consistency in enforcement was also an issue for many respondents, several more having raised it as part of the general discussion proceeding this section of questions.
1
A42

There was also support for separating the enforcement and advice/ education aspects of the HSE role.
The introduction of new penalties (such as rehabilitation, training and reinvestment) received some support, although at least one respondent felt that such penalties would not work, likening the approach to the introduction of speed cameras which "had been discredited".
A43

10 Appendix C: Final intermediaries’ postal questionnaires
The formatting of this questionnaire has been altered for the sake of incorporating it into this research report. The actual questionnaire was formatted to fit an 8 page layout.
A44
About this survey
The Health and Safety Executive (HSE) has commissioned this survey.
The Health and Safety Executive (HSE) has commissioned Greenstreet Berman to research new ideas on how to promote occupational health and safety. As part of this, we are keen to understand the views and opinions of people from different sections of industry. It is anticipated that these views and opinions will inform the HSE’s future strategy to ensure it is correctly focused and balanced, and reflect the particular needs of each section of industry.
Who should respond The person responsible for health and safety in your organisation should complete the questionnaire.
Anonymity
We can assure you of complete anonymity.
You do not need to give us your company name or contact details. Greenstreet Berman Ltd is an independent research and consultancy organisation. Please visit our website at www.greenstreet.co.uk alternatively call Michael Wright on 0118-938-7704 or Ali Antonelli on 0118-938-7706 if you want further information about the company or survey.
The questionnaire should take about 15 minutes to complete. Please return it to Greenstreet Berman in the reply paid envelope provided.
We appreciate and value your help. Many thanks for completing this questionnaire and don’t forget that your responses are anonymous – your opinion matters.
If you need any health and safety advice, please contact HSE Infoline: Tel 08701-545000 (Monday to Friday 8.30am – 5pm) email
HSE’s website is http://www.hse.gov.uk
Greenstreet Berman Ltd, Fulcrum House, 5 Southern Court, South Street, Reading, RG1 4QS Telephone: 0118-938-7700 (switchboard)
A45
1. How many people does your entire organisation employ? Tick one box:
None Under 10 11 to
50
51 to
250
251 to
1,000
Over 1,000
2. How many years has your organisation been in business? Tick one box
Under 1 1 to 3 4 to 10 11 to 15 16 to 20 Over
20
3. What is your job title?
4. What is your organisation? Tick one only: Trade association A Business advice service, eg Business Link G
Professional association or institute B Certification body, e.g. British Standard Institute, IiP, CORGI,
H
Consultancy C Chamber of commerce, IOD, CBI etc I
Training body, e.g. Learning Skills Council D Trade union J
Health service, e.g. NHS Plus, NHS Trust, occupational health centre
E Insurer or broker K
Police, fire or other emergency service F
5. Which of the categories best describe the type of work your customers/members do? Circle all numbers that apply
Agriculture, forestry 1 Education Manufacturing
Chemicals/pharmaceuticals/ petroleum 45 Charities & membership organisations
2 Nursery 25
Stone, clay etc products 46
Catering, incl pubs & restaurants
3 Primary 26 Food & drink or tobacco 47
Central government 4 Secondary 27 Engineering, machinery & metal goods 48
Construction Tertiary 28 Consumer goods (textiles, toys, furniture, etc)
49
General builder 5 Training 29 Plastics/rubber 50
General maintenance 6 Professional body 30 Paper & allied products 51
House building 7 Emergency services 31 Media & publishing 52
Civil engineering 8
Demolition 9
Financial services (e.g. insurance, banking)
32 Professional services (e.g. legal, accountancy)
53
Scaffold erection 10 Health care Business to business services (e.g. 54
A46

Carpenters 11 marketing, consultancy, IT, recruitment)
Glazing 12 Care homes 33 Personal services (e.g. laundry, hairdresser)
55
Roofing 13 Hospital 34 Retail & wholesale 56
Decoration 14 Repairs 57
Road construction 15
Primary care (dental, opticians, GPs, etc)
35
Social services 58
Electrician 16 Psychiatric 36 Telecommunications 59
Plumbing 17 Other healthcare 37 Transport services
Plastering 18 Hotels & other lodging places 38 Rail 60
Ground works 19 Leisure & entertainment Bus 61
Asbestos removal 20 Adventure 39 Car 62
Other construction 21 Amusement parts 40 Coach 63
Extraction Sports & swimming 41 Shipping 64
Mining 22 Museums, libraries etc 42 Air 65
Quarries 23 Clubs, theatres, cinemas 43 Haulage/freight 66
Oil & gas extraction 24 Local government 44 Utility (electrical, water & gas) 67
All of the above 68 Other, please specify
6. Is the owner or most senior director of your organisation male or female?
Male Female
7. Which of the following do you have? Please circle all that are appropriate
1 to 4 GSCEs or their equivalent A Diploma D Masters degree or PHd F
5 or more GSCEs or their equivalent
B First degree, e.g. a BSc
E Professional qualification G
1 or more A level C
8. Who do the organisations you work with mostly sell or provide their services or products to?
Circle all that apply
Members of the public 1 Medium sized firms – 51 to 250 employees
4
Micro firms, with less than 10 employees 2 Large firms – over 250 employees 5
Small firms – with 11 to 50 employees 3 All of these 6
A47
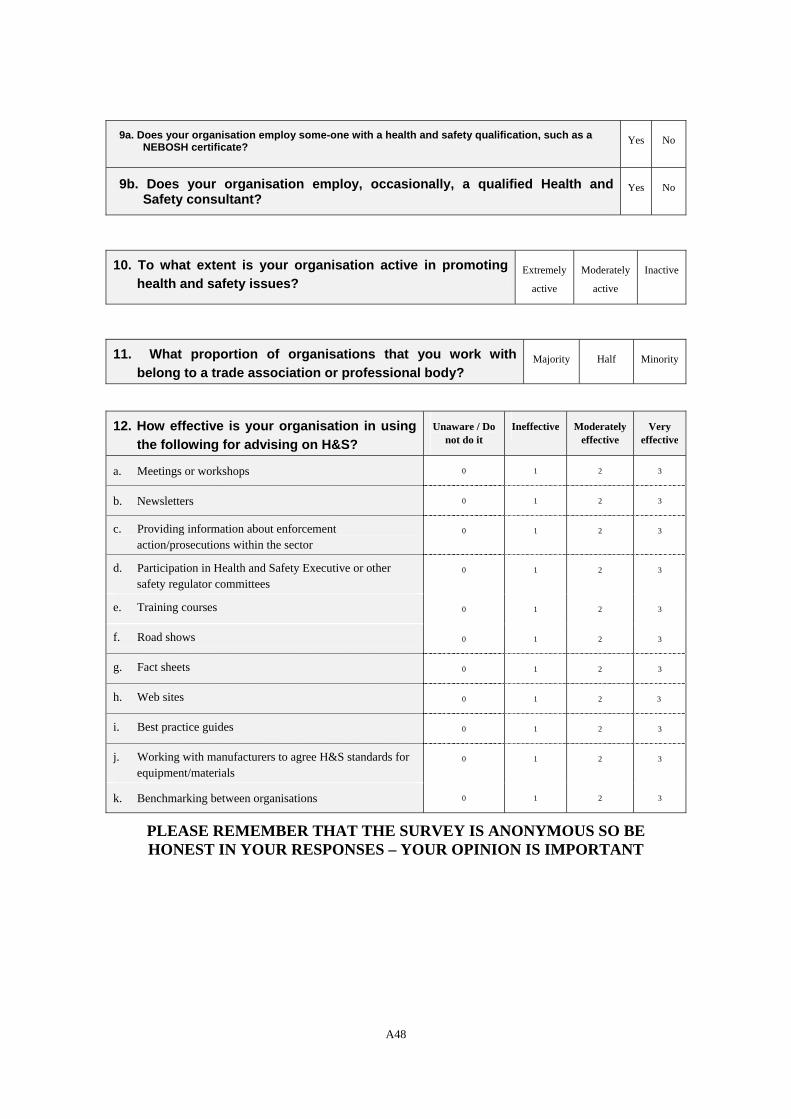
9a. Does your organisation employ some-one with a health and safety qualification, such as a NEBOSH certificate? Yes No
9b. Does your organisation employ, occasionally, a qualified Health and Safety consultant?
Yes No
10. To what extent is your organisation active in promoting health and safety issues?
Extremely
active
Moderately
active
Inactive
11. What proportion of organisations that you work with belong to a trade association or professional body?
Majority Half Minority
12. How effective is your organisation in using
the following for advising on H&S? Unaware / Do
not do it Ineffective Moderately
effective Very
effective
a. Meetings or workshops 0 1 2 3
b. Newsletters 0 1 2 3
c. Providing information about enforcement action/prosecutions within the sector
0 1 2 3
d. Participation in Health and Safety Executive or other safety regulator committees
0 1 2 3
e. Training courses 0 1 2 3
f. Road shows 0 1 2 3
g. Fact sheets 0 1 2 3
h. Web sites 0 1 2 3
i. Best practice guides 0 1 2 3
j. Working with manufacturers to agree H&S standards for equipment/materials
0 1 2 3
k. Benchmarking between organisations 0 1 2 3
PLEASE REMEMBER THAT THE SURVEY IS ANONYMOUS SO BE HONEST IN YOUR RESPONSES – YOUR OPINION IS IMPORTANT
A48
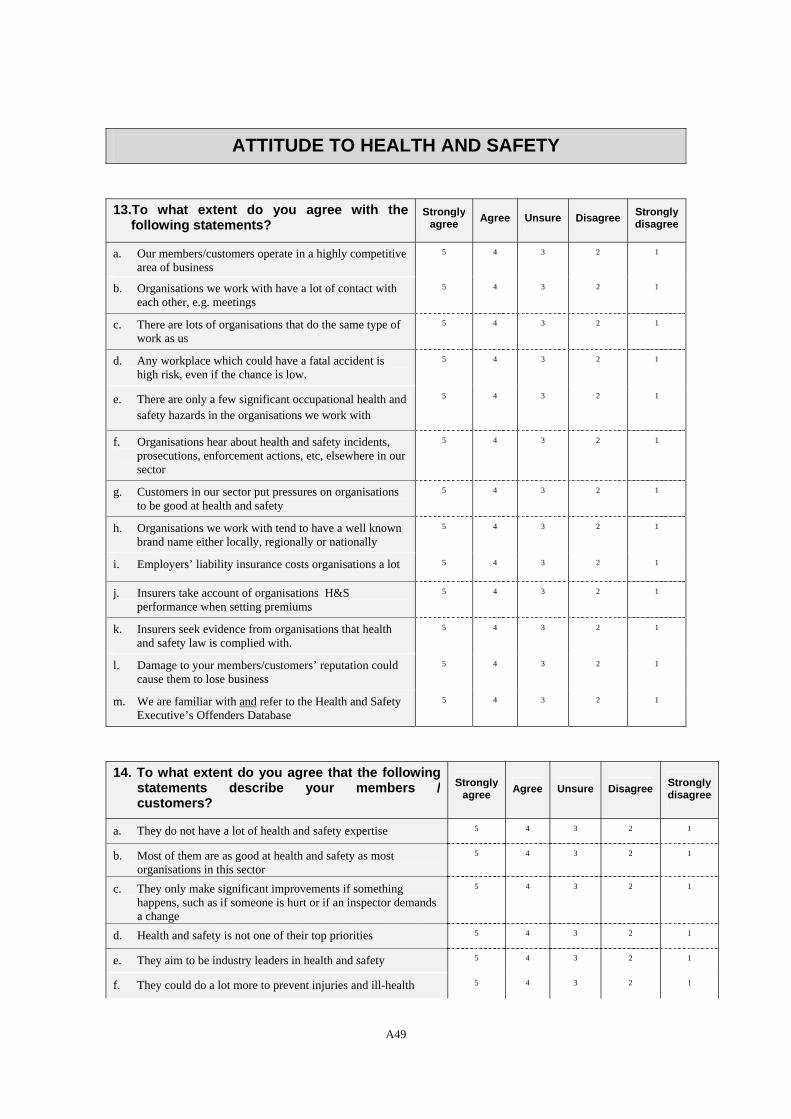
ATTITUDE TO HEALTH AND SAFETY
13.To what extent do you agree with the following statements?
Strongly agree Agree Unsure Disagree Strongly
disagree
a. Our members/customers operate in a highly competitive area of business
5 4 3 2 1
b. Organisations we work with have a lot of contact with each other, e.g. meetings
5 4 3 2 1
c. There are lots of organisations that do the same type of work as us
5 4 3 2 1
d. Any workplace which could have a fatal accident is high risk, even if the chance is low.
5 4 3 2 1
e. There are only a few significant occupational health and safety hazards in the organisations we work with
5 4 3 2 1
f. Organisations hear about health and safety incidents, prosecutions, enforcement actions, etc, elsewhere in our sector
5 4 3 2 1
g. Customers in our sector put pressures on organisations to be good at health and safety
5 4 3 2 1
h. Organisations we work with tend to have a well known brand name either locally, regionally or nationally
5 4 3 2 1
i. Employers’ liability insurance costs organisations a lot 5 4 3 2 1
j. Insurers take account of organisations H&S performance when setting premiums
5 4 3 2 1
k. Insurers seek evidence from organisations that health and safety law is complied with.
5 4 3 2 1
l. Damage to your members/customers’ reputation could cause them to lose business
5 4 3 2 1
m. We are familiar with and refer to the Health and Safety Executive’s Offenders Database
5 4 3 2 1
14. To what extent do you agree that the following statements describe your members / customers?
Strongly agree Agree Unsure Disagree Strongly
disagree
a. They do not have a lot of health and safety expertise 5 4 3 2 1
b. Most of them are as good at health and safety as most organisations in this sector
5 4 3 2 1
c. They only make significant improvements if something happens, such as if someone is hurt or if an inspector demands a change
5 4 3 2 1
d. Health and safety is not one of their top priorities 5 4 3 2 1
e. They aim to be industry leaders in health and safety 5 4 3 2 1
f. They could do a lot more to prevent injuries and ill-health 5 4 3 2 1
A49
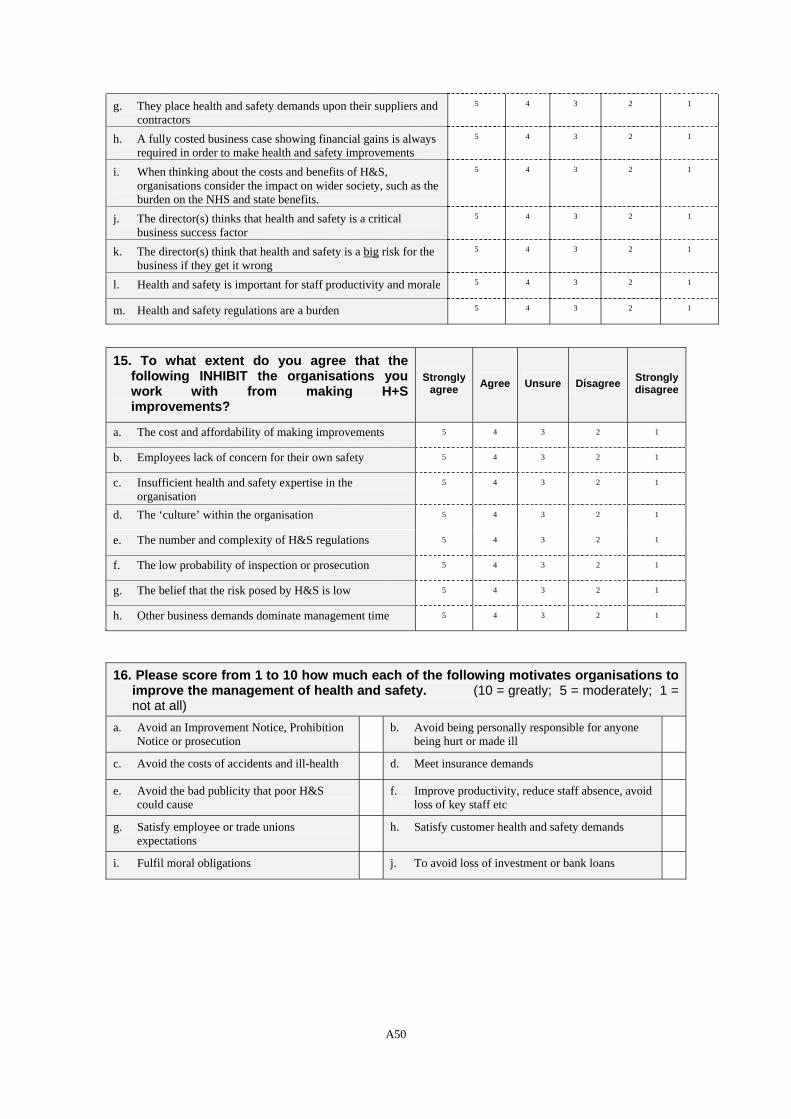
g. They place health and safety demands upon their suppliers and contractors
5 4 3 2 1
h. A fully costed business case showing financial gains is always required in order to make health and safety improvements
5 4 3 2 1
i. When thinking about the costs and benefits of H&S, organisations consider the impact on wider society, such as the burden on the NHS and state benefits.
5 4 3 2 1
j. The director(s) thinks that health and safety is a critical business success factor
5 4 3 2 1
k. The director(s) think that health and safety is a big risk for the business if they get it wrong
5 4 3 2 1
l. Health and safety is important for staff productivity and morale 5 4 3 2 1
m. Health and safety regulations are a burden 5 4 3 2 1
15. To what extent do you agree that the following INHIBIT the organisations you work with from making H+S improvements?
Strongly agree Agree Unsure Disagree Strongly
disagree
a. The cost and affordability of making improvements 5 4 3 2 1
b. Employees lack of concern for their own safety 5 4 3 2 1
c. Insufficient health and safety expertise in the organisation
5 4 3 2 1
d. The ‘culture’ within the organisation 5 4 3 2 1
e. The number and complexity of H&S regulations 5 4 3 2 1
f. The low probability of inspection or prosecution 5 4 3 2 1
g. The belief that the risk posed by H&S is low 5 4 3 2 1
h. Other business demands dominate management time 5 4 3 2 1
16. Please score from 1 to 10 how much each of the following motivates organisations to improve the management of health and safety. (10 = greatly; 5 = moderately; 1 = not at all)
a. Avoid an Improvement Notice, Prohibition Notice or prosecution
b. Avoid being personally responsible for anyone being hurt or made ill
c. Avoid the costs of accidents and ill-health d. Meet insurance demands
e. Avoid the bad publicity that poor H&S could cause
f. Improve productivity, reduce staff absence, avoid loss of key staff etc
g. Satisfy employee or trade unions expectations
h. Satisfy customer health and safety demands
i. Fulfil moral obligations j. To avoid loss of investment or bank loans
A50
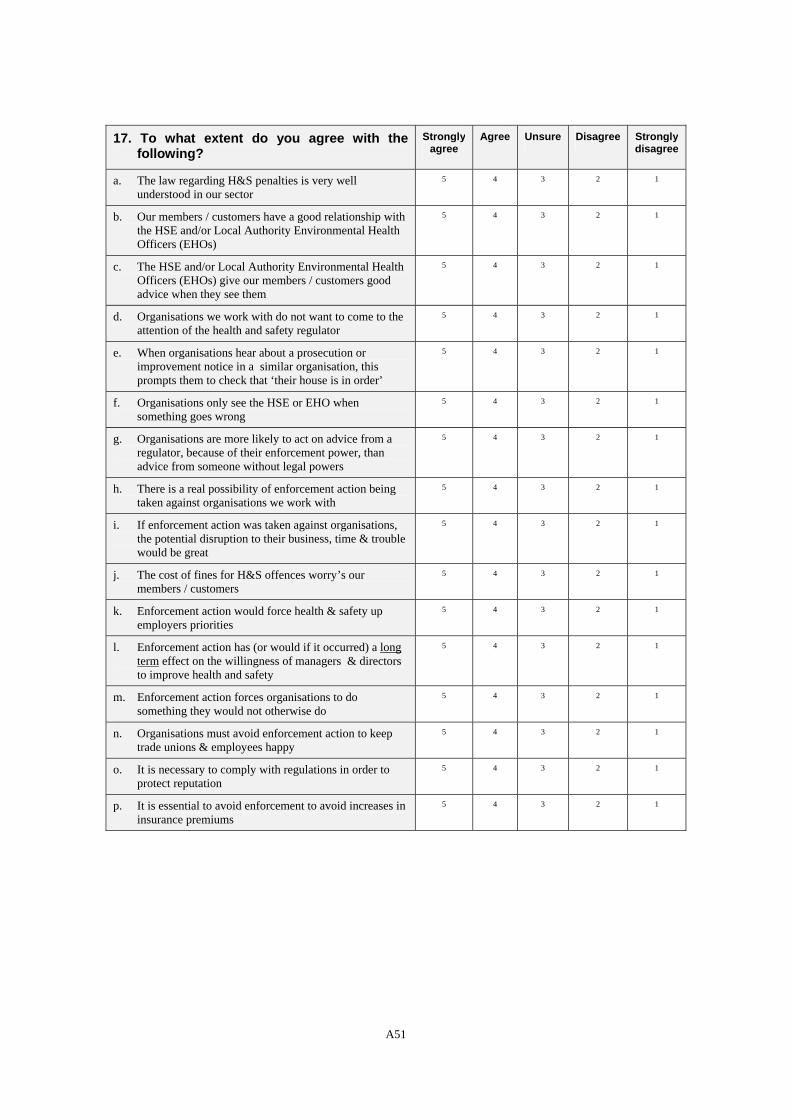
17. To what extent do you agree with the following?
Strongly agree
Agree Unsure Disagree Strongly disagree
a. The law regarding H&S penalties is very well understood in our sector
5 4 3 2 1
b. Our members / customers have a good relationship with the HSE and/or Local Authority Environmental Health Officers (EHOs)
5 4 3 2 1
c. The HSE and/or Local Authority Environmental Health Officers (EHOs) give our members / customers good advice when they see them
5 4 3 2 1
d. Organisations we work with do not want to come to the attention of the health and safety regulator
5 4 3 2 1
e. When organisations hear about a prosecution or improvement notice in a similar organisation, this prompts them to check that ‘their house is in order’
5 4 3 2 1
f. Organisations only see the HSE or EHO when something goes wrong
5 4 3 2 1
g. Organisations are more likely to act on advice from a regulator, because of their enforcement power, than advice from someone without legal powers
5 4 3 2 1
h. There is a real possibility of enforcement action being taken against organisations we work with
5 4 3 2 1
i. If enforcement action was taken against organisations, the potential disruption to their business, time & trouble would be great
5 4 3 2 1
j. The cost of fines for H&S offences worry’s our members / customers
5 4 3 2 1
k. Enforcement action would force health & safety up employers priorities
5 4 3 2 1
l. Enforcement action has (or would if it occurred) a long term effect on the willingness of managers & directors to improve health and safety
5 4 3 2 1
m. Enforcement action forces organisations to do something they would not otherwise do
5 4 3 2 1
n. Organisations must avoid enforcement action to keep trade unions & employees happy
5 4 3 2 1
o. It is necessary to comply with regulations in order to protect reputation
5 4 3 2 1
p. It is essential to avoid enforcement to avoid increases in insurance premiums
5 4 3 2 1
A51
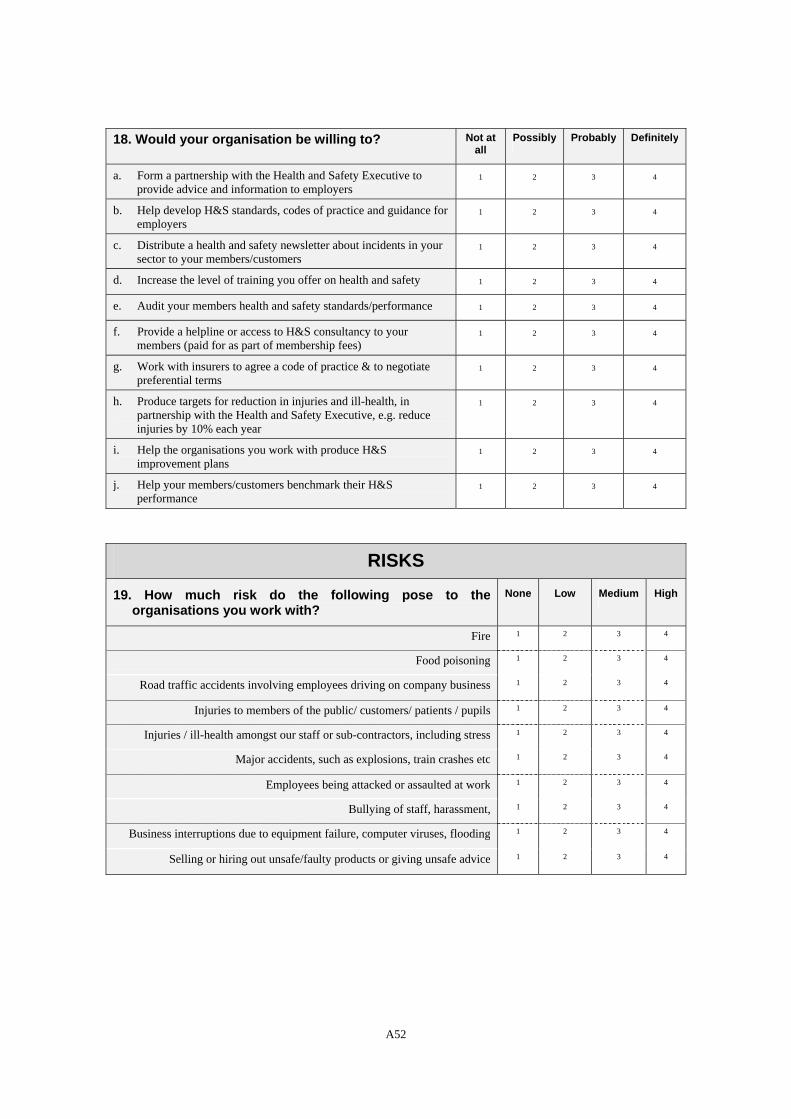
18. Would your organisation be willing to? Not at all
Possibly Probably Definitely
a. Form a partnership with the Health and Safety Executive to provide advice and information to employers
1 2 3 4
b. Help develop H&S standards, codes of practice and guidance for employers
1 2 3 4
c. Distribute a health and safety newsletter about incidents in your sector to your members/customers
1 2 3 4
d. Increase the level of training you offer on health and safety 1 2 3 4
e. Audit your members health and safety standards/performance 1 2 3 4
f. Provide a helpline or access to H&S consultancy to your members (paid for as part of membership fees)
1 2 3 4
g. Work with insurers to agree a code of practice & to negotiate preferential terms
1 2 3 4
h. Produce targets for reduction in injuries and ill-health, in partnership with the Health and Safety Executive, e.g. reduce injuries by 10% each year
1 2 3 4
i. Help the organisations you work with produce H&S improvement plans
1 2 3 4
j. Help your members/customers benchmark their H&S performance
1 2 3 4
RISKS
19. How much risk do the following pose to the organisations you work with?
None Low Medium High
Fire 1 2 3 4
Food poisoning 1 2 3 4
Road traffic accidents involving employees driving on company business 1 2 3 4
Injuries to members of the public/ customers/ patients / pupils 1 2 3 4
Injuries / ill-health amongst our staff or sub-contractors, including stress 1 2 3 4
Major accidents, such as explosions, train crashes etc 1 2 3 4
Employees being attacked or assaulted at work 1 2 3 4
Bullying of staff, harassment, 1 2 3 4
Business interruptions due to equipment failure, computer viruses, flooding 1 2 3 4
Selling or hiring out unsafe/faulty products or giving unsafe advice 1 2 3 4
A52
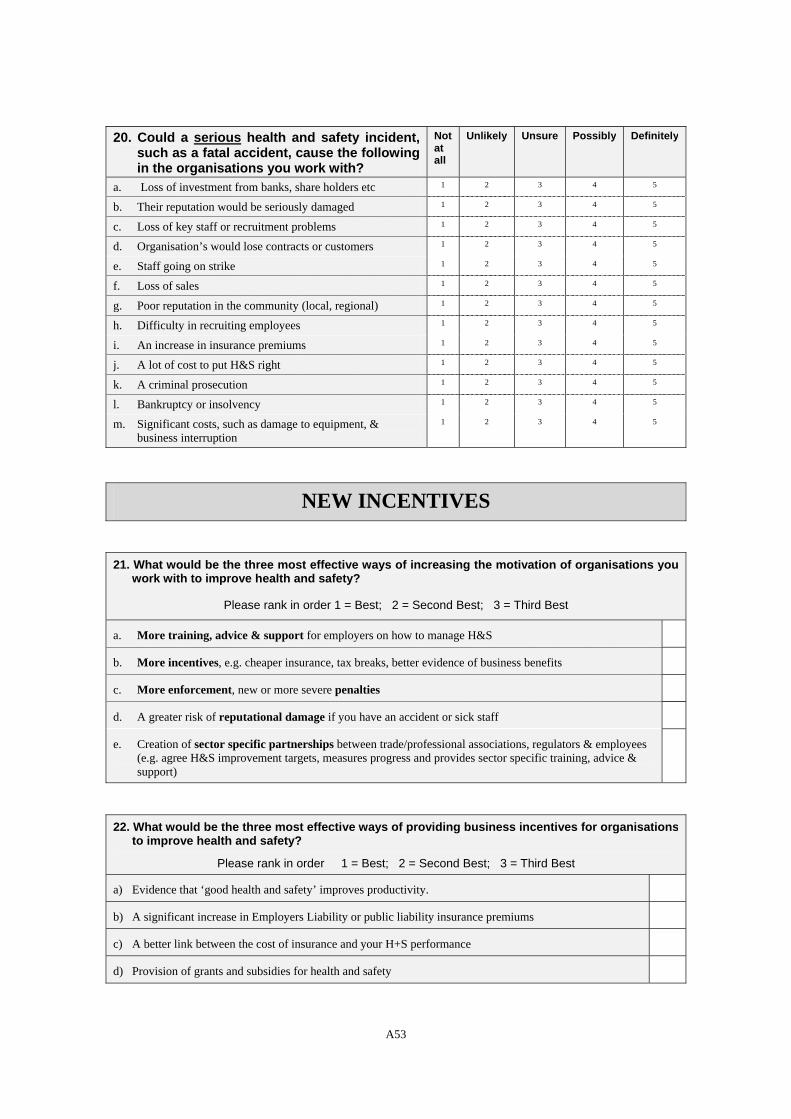
20. Could a serious health and safety incident, such as a fatal accident, cause the following in the organisations you work with?
Not at all
Unlikely Unsure Possibly Definitely
a. Loss of investment from banks, share holders etc 1 2 3 4 5
b. Their reputation would be seriously damaged 1 2 3 4 5
c. Loss of key staff or recruitment problems 1 2 3 4 5
d. Organisation’s would lose contracts or customers 1 2 3 4 5
e. Staff going on strike 1 2 3 4 5
f. Loss of sales 1 2 3 4 5
g. Poor reputation in the community (local, regional) 1 2 3 4 5
h. Difficulty in recruiting employees 1 2 3 4 5
i. An increase in insurance premiums 1 2 3 4 5
j. A lot of cost to put H&S right 1 2 3 4 5
k. A criminal prosecution 1 2 3 4 5
l. Bankruptcy or insolvency 1 2 3 4 5
m. Significant costs, such as damage to equipment, & business interruption
1 2 3 4 5
NEW INCENTIVES
21. What would be the three most effective ways of increasing the motivation of organisations you work with to improve health and safety?
Please rank in order 1 = Best; 2 = Second Best; 3 = Third Best
a. More training, advice & support for employers on how to manage H&S
b. More incentives, e.g. cheaper insurance, tax breaks, better evidence of business benefits
c. More enforcement, new or more severe penalties
d. A greater risk of reputational damage if you have an accident or sick staff
e. Creation of sector specific partnerships between trade/professional associations, regulators & employees (e.g. agree H&S improvement targets, measures progress and provides sector specific training, advice & support)
22. What would be the three most effective ways of providing business incentives for organisations to improve health and safety?
Please rank in order 1 = Best; 2 = Second Best; 3 = Third Best
a) Evidence that ‘good health and safety’ improves productivity.
b) A significant increase in Employers Liability or public liability insurance premiums
c) A better link between the cost of insurance and your H+S performance
d) Provision of grants and subsidies for health and safety
A53
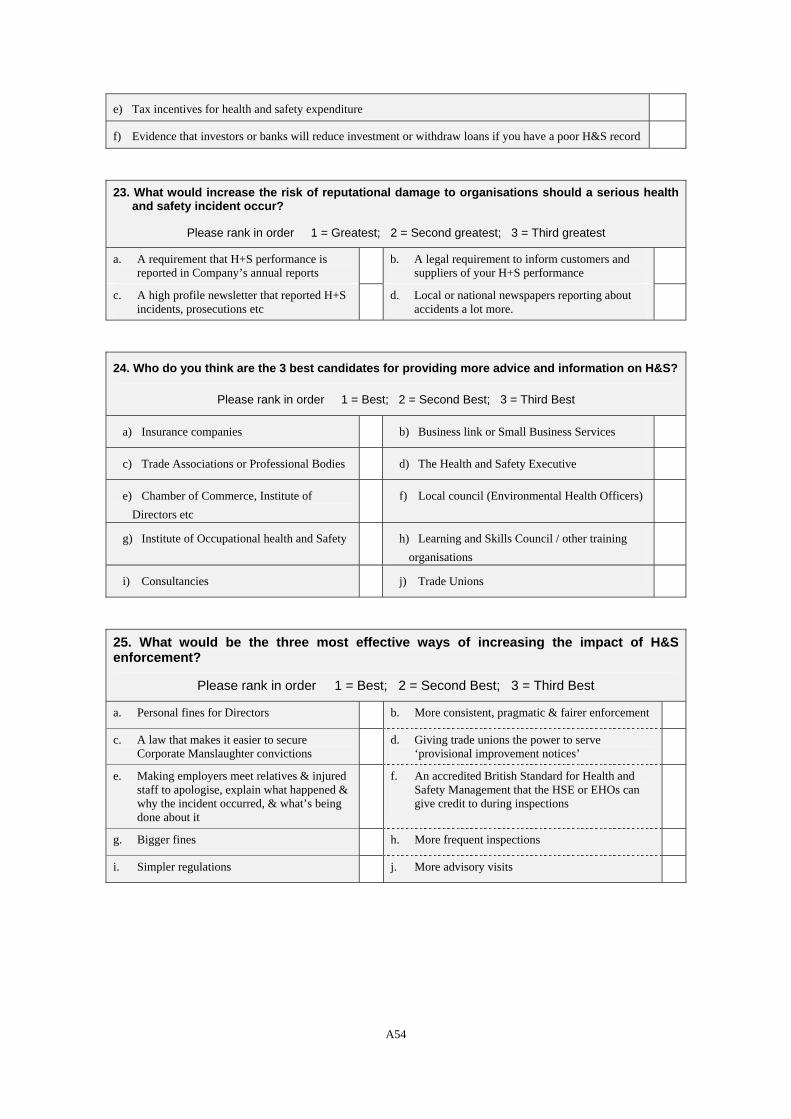
e) Tax incentives for health and safety expenditure
f) Evidence that investors or banks will reduce investment or withdraw loans if you have a poor H&S record
23. What would increase the risk of reputational damage to organisations should a serious health and safety incident occur?
Please rank in order 1 = Greatest; 2 = Second greatest; 3 = Third greatest
a. A requirement that H+S performance is reported in Company’s annual reports
b. A legal requirement to inform customers and suppliers of your H+S performance
c. A high profile newsletter that reported H+S incidents, prosecutions etc
d. Local or national newspapers reporting about accidents a lot more.
24. Who do you think are the 3 best candidates for providing more advice and information on H&S?
Please rank in order 1 = Best; 2 = Second Best; 3 = Third Best
a) Insurance companies b) Business link or Small Business Services
c) Trade Associations or Professional Bodies d) The Health and Safety Executive
e) Chamber of Commerce, Institute of Directors etc
f) Local council (Environmental Health Officers)
g) Institute of Occupational health and Safety h) Learning and Skills Council / other training organisations
i) Consultancies j) Trade Unions
25. What would be the three most effective ways of increasing the impact of H&S enforcement?
Please rank in order 1 = Best; 2 = Second Best; 3 = Third Best
a. Personal fines for Directors b. More consistent, pragmatic & fairer enforcement
c. A law that makes it easier to secure Corporate Manslaughter convictions
d. Giving trade unions the power to serve ‘provisional improvement notices’
e. Making employers meet relatives & injured staff to apologise, explain what happened & why the incident occurred, & what’s being done about it
f. An accredited British Standard for Health and Safety Management that the HSE or EHOs can give credit to during inspections
g. Bigger fines h. More frequent inspections
i. Simpler regulations j. More advisory visits
A54
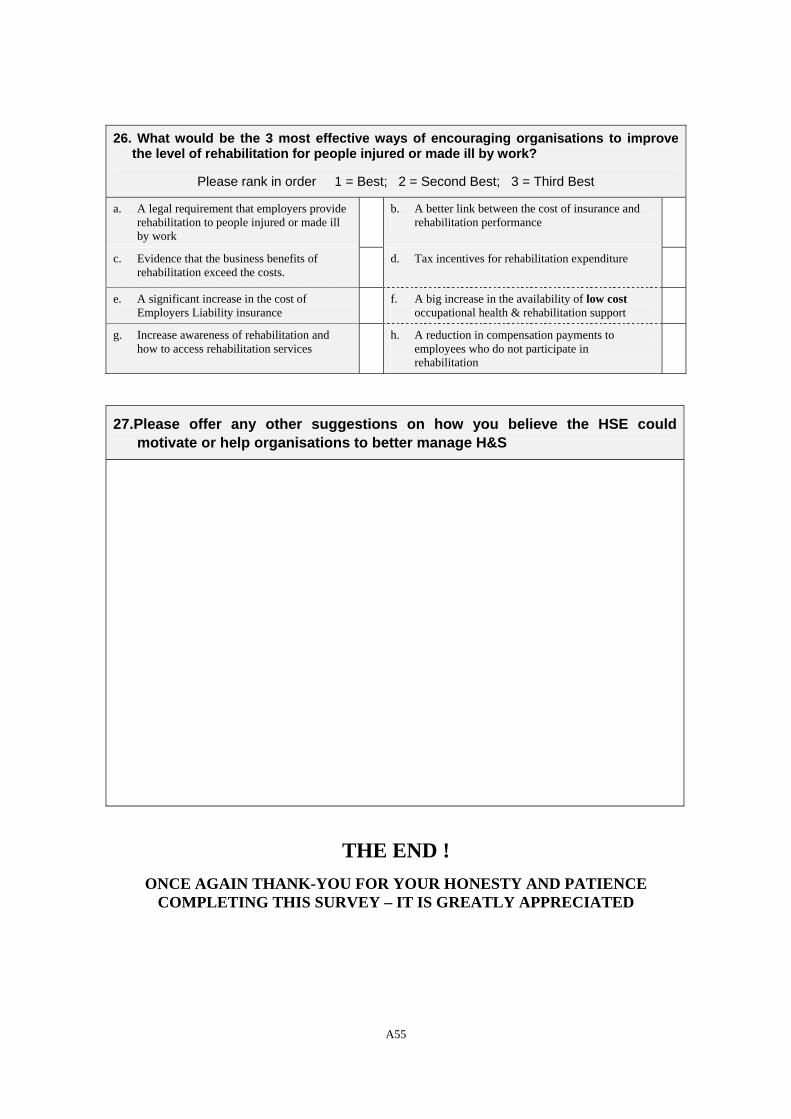
26. What would be the 3 most effective ways of encouraging organisations to improve the level of rehabilitation for people injured or made ill by work?
Please rank in order 1 = Best; 2 = Second Best; 3 = Third Best
a. A legal requirement that employers provide rehabilitation to people injured or made ill by work
b. A better link between the cost of insurance and rehabilitation performance
c. Evidence that the business benefits of rehabilitation exceed the costs.
d. Tax incentives for rehabilitation expenditure
e. A significant increase in the cost of Employers Liability insurance
f. A big increase in the availability of low cost occupational health & rehabilitation support
g. Increase awareness of rehabilitation and how to access rehabilitation services
h. A reduction in compensation payments to employees who do not participate in rehabilitation
27.Please offer any other suggestions on how you believe the HSE could motivate or help organisations to better manage H&S
THE END !
ONCE AGAIN THANK-YOU FOR YOUR HONESTY AND PATIENCE COMPLETING THIS SURVEY – IT IS GREATLY APPRECIATED
A55

11 Appendix D: Final employers’ postal questionnaires
The formatting of this questionnaire has been altered for the sake of incorporating it into this research report. The actual questionnaire was formatted to fit an 8 page layout.
A56
About this survey
The Health and Safety Executive (HSE) has commissioned this survey.
The Health and Safety Executive (HSE) has commissioned Greenstreet Berman to research new ideas on how to promote occupational health and safety. As part of this, we are keen to understand the views and opinions of people from different sections of industry. It is anticipated that these views and opinions will inform the HSE’s future strategy to ensure it is correctly focused and balanced, and reflect the particular needs of each section of industry.
Who should respond The person responsible for health and safety in your organisation should complete the questionnaire.
Anonymity
We can assure you of complete anonymity.
You do not need to give us your company name or contact details. Greenstreet Berman Ltd is an independent research and consultancy organisation. Please visit our website at www.greenstreet.co.uk alternatively call Michael Wright on 0118-938-7704 or Ali Antonelli on 0118-938-7706 if you want further information about the company or survey.
The questionnaire should take about 15 minutes to complete. Please return it to Greenstreet Berman in the reply paid envelope provided.
We appreciate and value your help. Many thanks for completing this questionnaire and don’t forget that your responses are anonymous – your opinion matters.
If you need any health and safety advice, please contact HSE Infoline:
Tel 08701-545000 (Monday to Friday 8.30am – 5pm) email
HSE’s website is http://www.hse.gov.uk Greenstreet Berman Ltd, Fulcrum House, 5 Southern Court, South Street,
Reading, RG1 4QS Telephone: 0118-938-7700 (switchboard)
A57
1. How many people does your entire organisation employ? Tick one box:
None Under
10
11 to
50
51 to
250
251 to
1,000
Over 1,000
2. How many years has your organisation been in business? Tick one box
Under 1 1 to 3 4 to 10 11 to 15 16 to 20 Over
20
3. What is your job title?
4. Which categories best describe the type of work your organisation does? Circle all
numbers that apply
Agriculture, forestry 1 Education Manufacturing
Chemicals/pharmaceuticals/ petroleum 45 Charities & membership organisations
2 Nursery 25
Stone, clay etc products 46
Catering, incl pubs & restaurants
3 Primary 26 Food & drink or tobacco 47
Central government 4 Secondary 27 Engineering, machinery & metal goods 48
Construction Tertiary 28 Consumer goods (textiles, toys, furniture, etc)
49
General builder 5 Training 29 Plastics/rubber 50
General maintenance 6 Professional body 30 Paper & allied products 51
House building 7 Emergency services 31 Media & publishing 52
Civil engineering 8
Demolition 9
Financial services (e.g. insurance, banking)
32 Professional services (e.g. legal, accountancy)
53
Scaffold erection 10
Carpenters 11
Health care Business to business services (e.g. marketing, consultancy, IT, recruitment)
54
Glazing 12 Care homes 33 Personal services (e.g. laundry, hairdresser)
55
Roofing 13 Hospital 34 Retail & wholesale 56
Decoration 14 Repairs 57
Road construction 15
Primary care (dental, opticians, GPs, etc)
35
Social services 58
Electrician 16 Psychiatric 36 Telecommunications 59
Plumbing 17 Other healthcare 37 Transport services
Plastering 18 Hotels & other lodging places 38 Rail 60
A58
Ground works 19 Leisure & entertainment Bus 61
Asbestos removal 20 Adventure 39 Car 62
Other construction 21 Amusement parts 40 Coach 63
Extraction Sports & swimming 41 Shipping 64
Mining 22 Museums, libraries etc 42 Air 65
Quarries 23 Clubs, theatres, cinemas 43 Haulage/freight 66
Oil & gas extraction 24 Local government 44 Utility (electrical, water & gas) 67
Other Please specify
5. Is the owner or most senior director of your organisation male or female?
Male Female
6. Which of the following do you have? Please circle all that are appropriate
1 to 4 GSCEs or their equivalent A Diploma D Masters degree or PHd F
5 or more GSCEs or their equivalent
B First degree, e.g. a BSc
E Professional qualification G
1 or more A level C
7. Who do you mostly sell or provide your services or products to? Circle all that apply
Members of the public 1 Medium sized organisations – 51 to 250 employees
4
Micro organisations, with less than 10 employees
2 Large organisations – over 250 employees 5
Small organisations – with 11 to 50 employees
3 All of these 6
8. Do you get a lot of repeat business from customers? Yes, a
lot
Some Not a lot
9. Do you attend seminars or courses about how to manage your business?
Never Occasionally Frequently
A59
10a. Does your organisation employ some one with a health and safety qualification, such as a NEBOSH certificate? Yes No
10b. Does your organisation employ, occasionally, a qualified Health and Safety consultant?
Yes No
10c. Is your organisation a member of a trade association or professional body? (If you answer no, please commence to section 14) Yes No
Please can you provide the name of the trade association or professional body that is most active within your sector. WRITE IN HERE
11. If you answered yes to question 10c, to what extent is the association active in promoting health and safety issues to its members? Tick one
Extremely
active
Moderately
active
Inactive
12. What proportion of organisations within your sector belong to a trade association or professional body?
Majority Half Minority
13. How effective is your association in using the following regarding H&S
Unaware / Do not
do it
Ineffective Moderately effective
Very effective
l. Meetings or workshops 0 1 2 3
m. Newsletters 0 1 2 3
n. Providing information about enforcement action/prosecutions within the sector
0 1 2 3
o. Participation in Health and Safety Executive or other safety regulator committees
0 1 2 3
p. Training courses 0 1 2 3
q. Road shows 0 1 2 3
r. Fact sheets 0 1 2 3
s. Web sites 0 1 2 3
t. Best practice guides 0 1 2 3
u. Working with manufacturers to agree H&S standards for equipment/materials
0 1 2 3
v. Benchmarking between organisations 0 1 2 3
PLEASE REMEMBER THAT THE SURVEY IS ANONYMOUS SO BE HONEST IN YOUR RESPONSES – YOUR OPINION IS IMPORTANT
A60
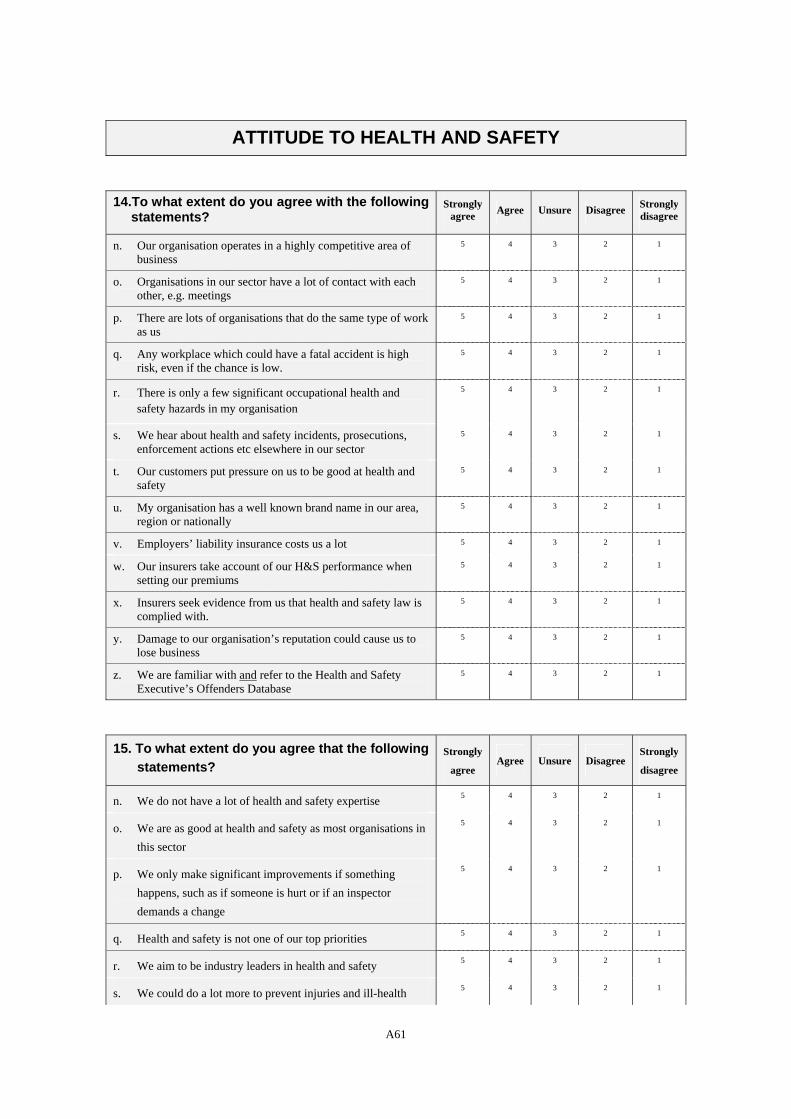
ATTITUDE TO HEALTH AND SAFETY
14.To what extent do you agree with the following statements?
Strongly agree Agree Unsure Disagree Strongly
disagree
n. Our organisation operates in a highly competitive area of business
5 4 3 2 1
o. Organisations in our sector have a lot of contact with each other, e.g. meetings
5 4 3 2 1
p. There are lots of organisations that do the same type of work as us
5 4 3 2 1
q. Any workplace which could have a fatal accident is high risk, even if the chance is low.
5 4 3 2 1
r. There is only a few significant occupational health and safety hazards in my organisation
5 4 3 2 1
s. We hear about health and safety incidents, prosecutions, enforcement actions etc elsewhere in our sector
5 4 3 2 1
t. Our customers put pressure on us to be good at health and safety
5 4 3 2 1
u. My organisation has a well known brand name in our area, region or nationally
5 4 3 2 1
v. Employers’ liability insurance costs us a lot 5 4 3 2 1
w. Our insurers take account of our H&S performance when setting our premiums
5 4 3 2 1
x. Insurers seek evidence from us that health and safety law is complied with.
5 4 3 2 1
y. Damage to our organisation’s reputation could cause us to lose business
5 4 3 2 1
z. We are familiar with and refer to the Health and Safety Executive’s Offenders Database
5 4 3 2 1
15. To what extent do you agree that the following statements?
Strongly
agree Agree Unsure Disagree
Strongly
disagree
n. We do not have a lot of health and safety expertise 5 4 3 2 1
o. We are as good at health and safety as most organisations in this sector
5 4 3 2 1
p. We only make significant improvements if something happens, such as if someone is hurt or if an inspector demands a change
5 4 3 2 1
q. Health and safety is not one of our top priorities 5 4 3 2 1
r. We aim to be industry leaders in health and safety 5 4 3 2 1
s. We could do a lot more to prevent injuries and ill-health 5 4 3 2 1
A61
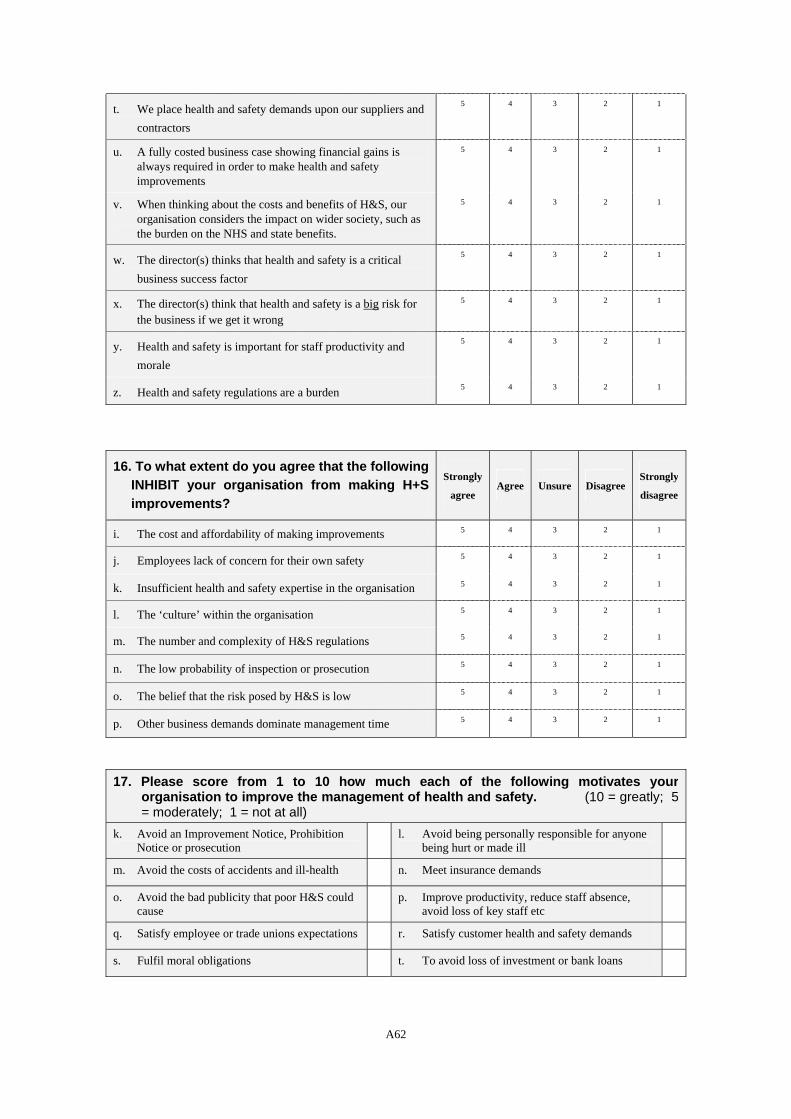
t. We place health and safety demands upon our suppliers and contractors
5 4 3 2 1
u. A fully costed business case showing financial gains is always required in order to make health and safety improvements
5 4 3 2 1
v. When thinking about the costs and benefits of H&S, our organisation considers the impact on wider society, such as the burden on the NHS and state benefits.
5 4 3 2 1
w. The director(s) thinks that health and safety is a critical business success factor
5 4 3 2 1
x. The director(s) think that health and safety is a big risk for the business if we get it wrong
5 4 3 2 1
y. Health and safety is important for staff productivity and morale
5 4 3 2 1
z. Health and safety regulations are a burden 5 4 3 2 1
16. To what extent do you agree that the following INHIBIT your organisation from making H+S improvements?
Strongly
agree Agree Unsure Disagree
Strongly
disagree
i. The cost and affordability of making improvements 5 4 3 2 1
j. Employees lack of concern for their own safety 5 4 3 2 1
k. Insufficient health and safety expertise in the organisation 5 4 3 2 1
l. The ‘culture’ within the organisation 5 4 3 2 1
m. The number and complexity of H&S regulations 5 4 3 2 1
n. The low probability of inspection or prosecution 5 4 3 2 1
o. The belief that the risk posed by H&S is low 5 4 3 2 1
p. Other business demands dominate management time 5 4 3 2 1
17. Please score from 1 to 10 how much each of the following motivates your organisation to improve the management of health and safety. (10 = greatly; 5 = moderately; 1 = not at all)
k. Avoid an Improvement Notice, Prohibition Notice or prosecution
l. Avoid being personally responsible for anyone being hurt or made ill
m. Avoid the costs of accidents and ill-health n. Meet insurance demands
o. Avoid the bad publicity that poor H&S could cause
p. Improve productivity, reduce staff absence, avoid loss of key staff etc
q. Satisfy employee or trade unions expectations r. Satisfy customer health and safety demands
s. Fulfil moral obligations t. To avoid loss of investment or bank loans
A62
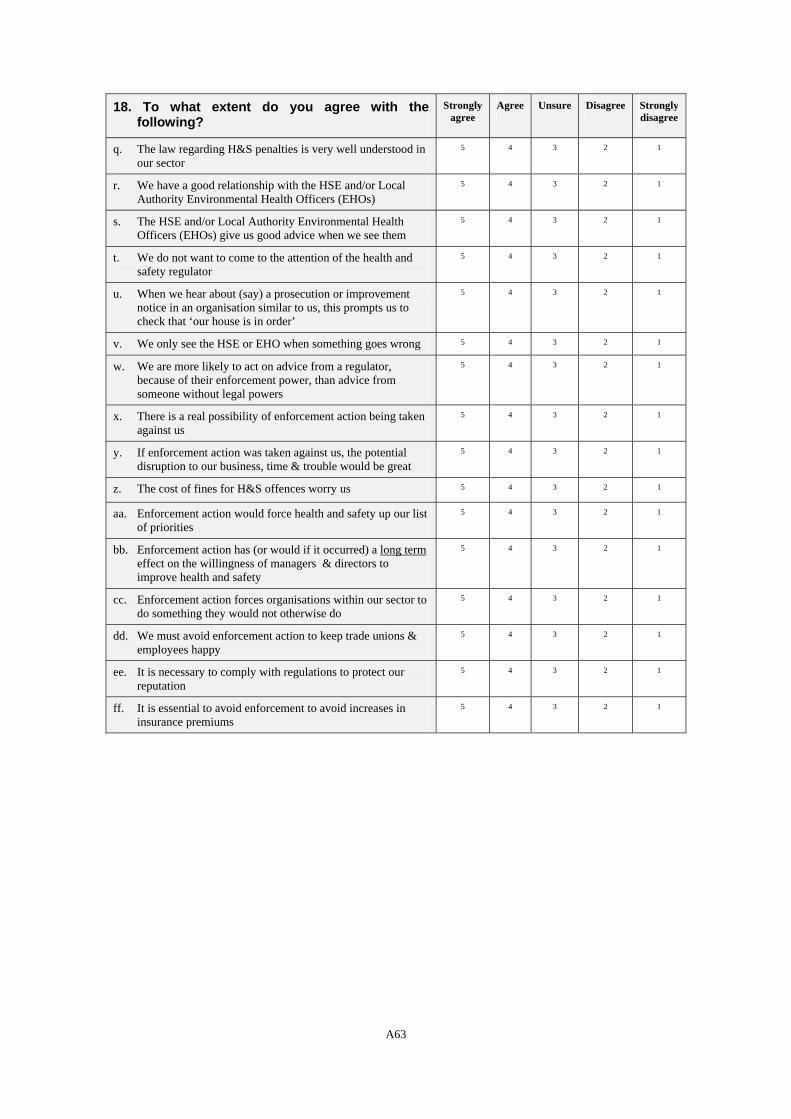
18. To what extent do you agree with the following?
Strongly agree
Agree Unsure Disagree Strongly disagree
q. The law regarding H&S penalties is very well understood in our sector
5 4 3 2 1
r. We have a good relationship with the HSE and/or Local Authority Environmental Health Officers (EHOs)
5 4 3 2 1
s. The HSE and/or Local Authority Environmental Health Officers (EHOs) give us good advice when we see them
5 4 3 2 1
t. We do not want to come to the attention of the health and safety regulator
5 4 3 2 1
u. When we hear about (say) a prosecution or improvement notice in an organisation similar to us, this prompts us to check that ‘our house is in order’
5 4 3 2 1
v. We only see the HSE or EHO when something goes wrong 5 4 3 2 1
w. We are more likely to act on advice from a regulator, because of their enforcement power, than advice from someone without legal powers
5 4 3 2 1
x. There is a real possibility of enforcement action being taken against us
5 4 3 2 1
y. If enforcement action was taken against us, the potential disruption to our business, time & trouble would be great
5 4 3 2 1
z. The cost of fines for H&S offences worry us 5 4 3 2 1
aa. Enforcement action would force health and safety up our list of priorities
5 4 3 2 1
bb. Enforcement action has (or would if it occurred) a long term effect on the willingness of managers & directors to improve health and safety
5 4 3 2 1
cc. Enforcement action forces organisations within our sector to do something they would not otherwise do
5 4 3 2 1
dd. We must avoid enforcement action to keep trade unions & employees happy
5 4 3 2 1
ee. It is necessary to comply with regulations to protect our reputation
5 4 3 2 1
ff. It is essential to avoid enforcement to avoid increases in insurance premiums
5 4 3 2 1
A63
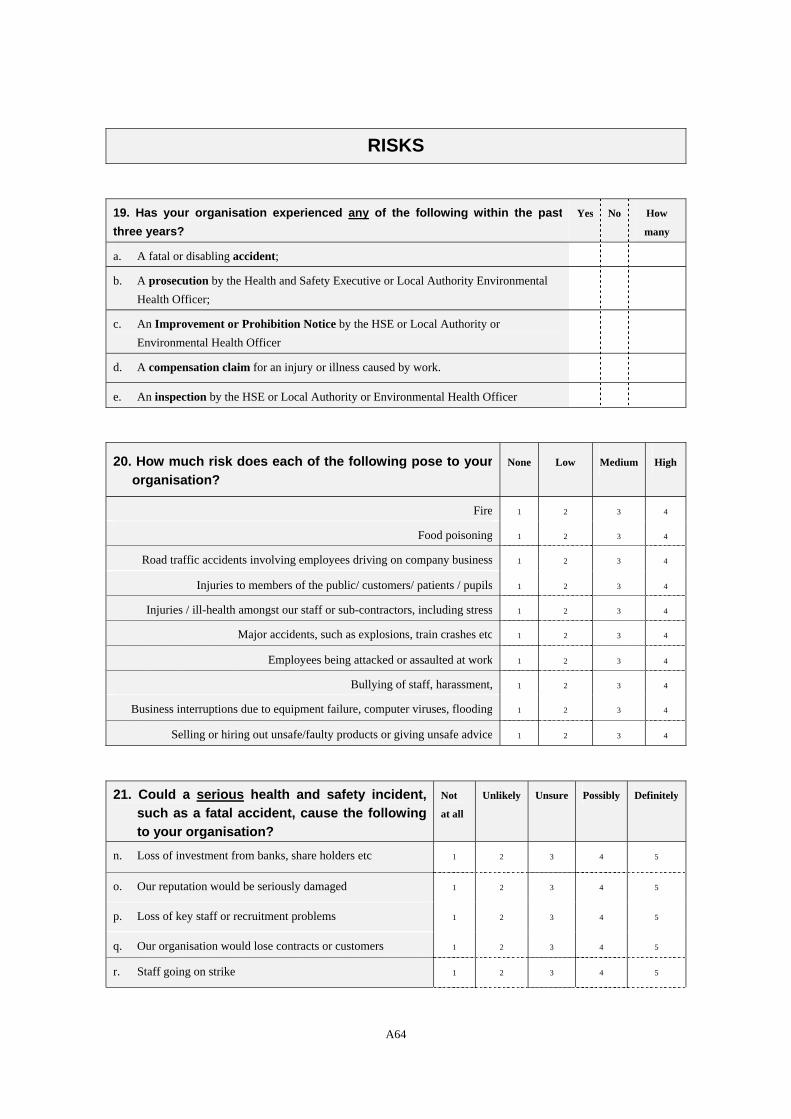
RISKS
19. Has your organisation experienced any of the following within the past three years?
Yes No How
many
a. A fatal or disabling accident;
b. A prosecution by the Health and Safety Executive or Local Authority Environmental Health Officer;
c. An Improvement or Prohibition Notice by the HSE or Local Authority or Environmental Health Officer
d. A compensation claim for an injury or illness caused by work.
e. An inspection by the HSE or Local Authority or Environmental Health Officer
20. How much risk does each of the following pose to your organisation?
None Low Medium High
Fire 1 2 3 4
Food poisoning 1 2 3 4
Road traffic accidents involving employees driving on company business 1 2 3 4
Injuries to members of the public/ customers/ patients / pupils 1 2 3 4
Injuries / ill-health amongst our staff or sub-contractors, including stress 1 2 3 4
Major accidents, such as explosions, train crashes etc 1 2 3 4
Employees being attacked or assaulted at work 1 2 3 4
Bullying of staff, harassment, 1 2 3 4
Business interruptions due to equipment failure, computer viruses, flooding 1 2 3 4
Selling or hiring out unsafe/faulty products or giving unsafe advice 1 2 3 4
21. Could a serious health and safety incident, such as a fatal accident, cause the following to your organisation?
Not
at all
Unlikely Unsure Possibly Definitely
n. Loss of investment from banks, share holders etc 1 2 3 4 5
o. Our reputation would be seriously damaged 1 2 3 4 5
p. Loss of key staff or recruitment problems 1 2 3 4 5
q. Our organisation would lose contracts or customers 1 2 3 4 5
r. Staff going on strike 1 2 3 4 5
A64
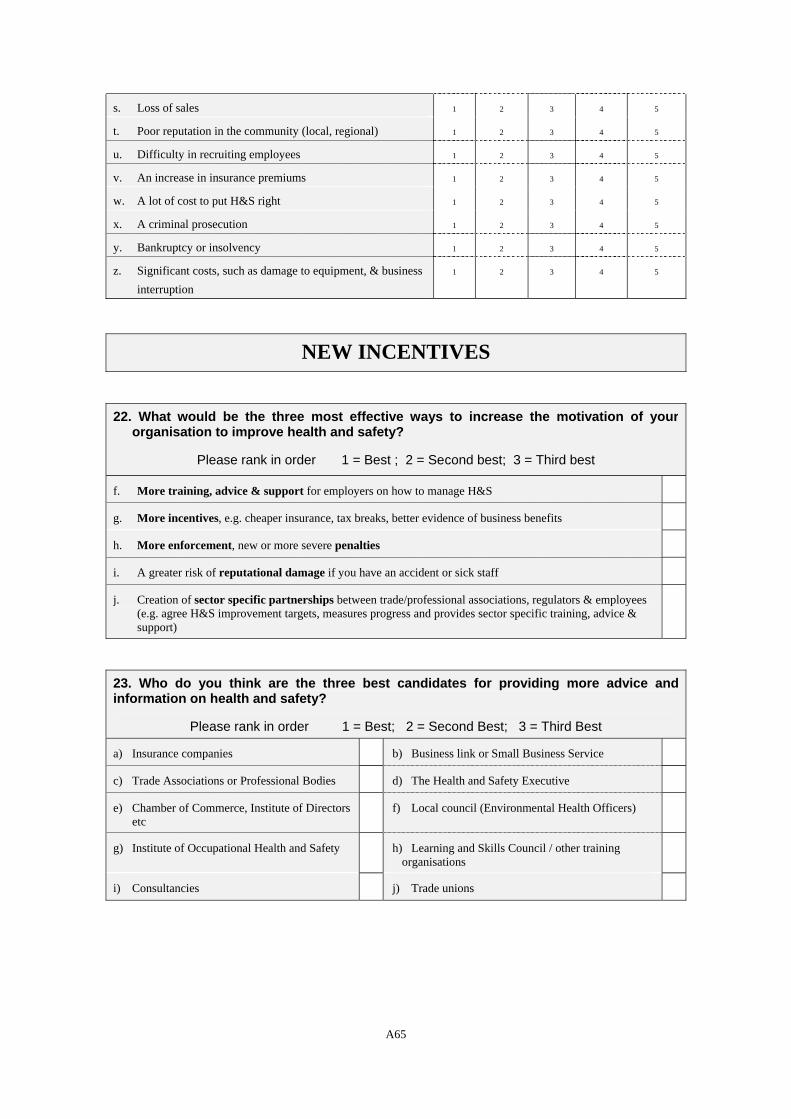
s. Loss of sales 1 2 3 4 5
t. Poor reputation in the community (local, regional) 1 2 3 4 5
u. Difficulty in recruiting employees 1 2 3 4 5
v. An increase in insurance premiums 1 2 3 4 5
w. A lot of cost to put H&S right 1 2 3 4 5
x. A criminal prosecution 1 2 3 4 5
y. Bankruptcy or insolvency 1 2 3 4 5
z. Significant costs, such as damage to equipment, & business interruption
1 2 3 4 5
NEW INCENTIVES
22. What would be the three most effective ways to increase the motivation of your organisation to improve health and safety?
Please rank in order 1 = Best ; 2 = Second best; 3 = Third best
f. More training, advice & support for employers on how to manage H&S
g. More incentives, e.g. cheaper insurance, tax breaks, better evidence of business benefits
h. More enforcement, new or more severe penalties
i. A greater risk of reputational damage if you have an accident or sick staff
j. Creation of sector specific partnerships between trade/professional associations, regulators & employees (e.g. agree H&S improvement targets, measures progress and provides sector specific training, advice & support)
23. Who do you think are the three best candidates for providing more advice and information on health and safety?
Please rank in order 1 = Best; 2 = Second Best; 3 = Third Best
a) Insurance companies b) Business link or Small Business Service
c) Trade Associations or Professional Bodies d) The Health and Safety Executive
e) Chamber of Commerce, Institute of Directors etc
f) Local council (Environmental Health Officers)
g) Institute of Occupational Health and Safety h) Learning and Skills Council / other training organisations
i) Consultancies j) Trade unions
A65
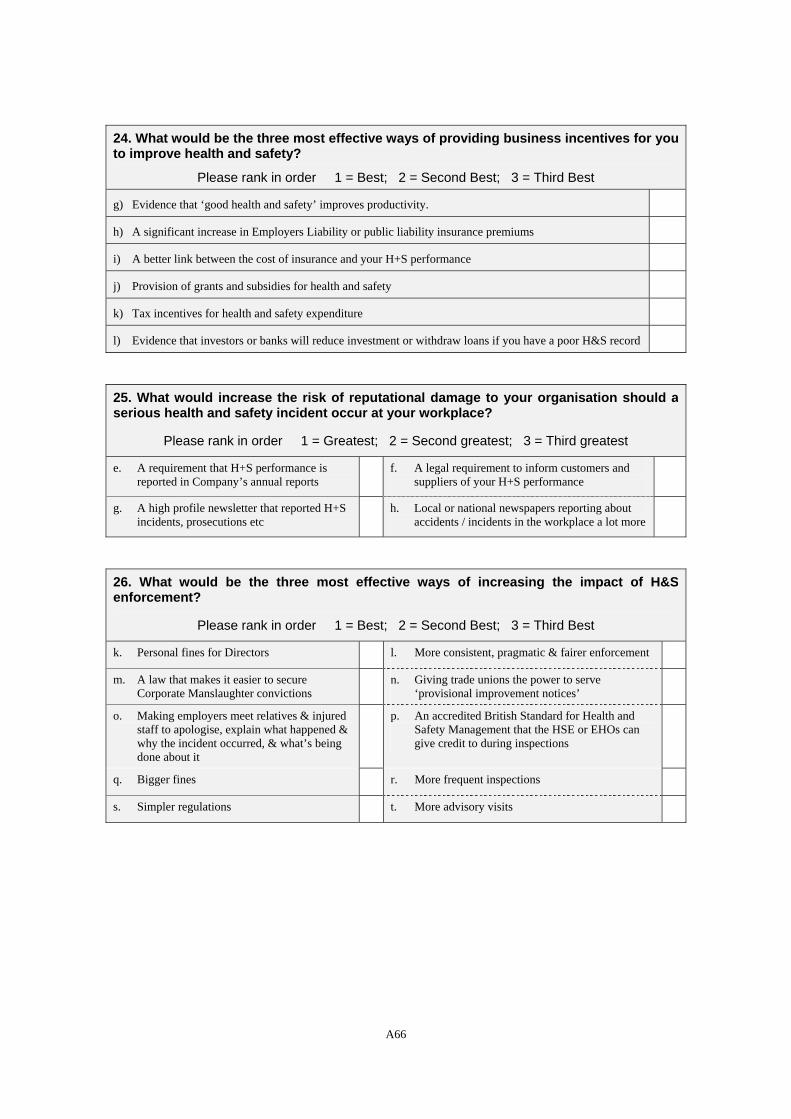
24. What would be the three most effective ways of providing business incentives for you to improve health and safety?
Please rank in order 1 = Best; 2 = Second Best; 3 = Third Best
g) Evidence that ‘good health and safety’ improves productivity.
h) A significant increase in Employers Liability or public liability insurance premiums
i) A better link between the cost of insurance and your H+S performance
j) Provision of grants and subsidies for health and safety
k) Tax incentives for health and safety expenditure
l) Evidence that investors or banks will reduce investment or withdraw loans if you have a poor H&S record
25. What would increase the risk of reputational damage to your organisation should a serious health and safety incident occur at your workplace?
Please rank in order 1 = Greatest; 2 = Second greatest; 3 = Third greatest
e. A requirement that H+S performance is reported in Company’s annual reports
f. A legal requirement to inform customers and suppliers of your H+S performance
g. A high profile newsletter that reported H+S incidents, prosecutions etc
h. Local or national newspapers reporting about accidents / incidents in the workplace a lot more
26. What would be the three most effective ways of increasing the impact of H&S enforcement?
Please rank in order 1 = Best; 2 = Second Best; 3 = Third Best
k. Personal fines for Directors l. More consistent, pragmatic & fairer enforcement
m. A law that makes it easier to secure Corporate Manslaughter convictions
n. Giving trade unions the power to serve ‘provisional improvement notices’
o. Making employers meet relatives & injured staff to apologise, explain what happened & why the incident occurred, & what’s being done about it
p. An accredited British Standard for Health and Safety Management that the HSE or EHOs can give credit to during inspections
q. Bigger fines r. More frequent inspections
s. Simpler regulations t. More advisory visits
A66
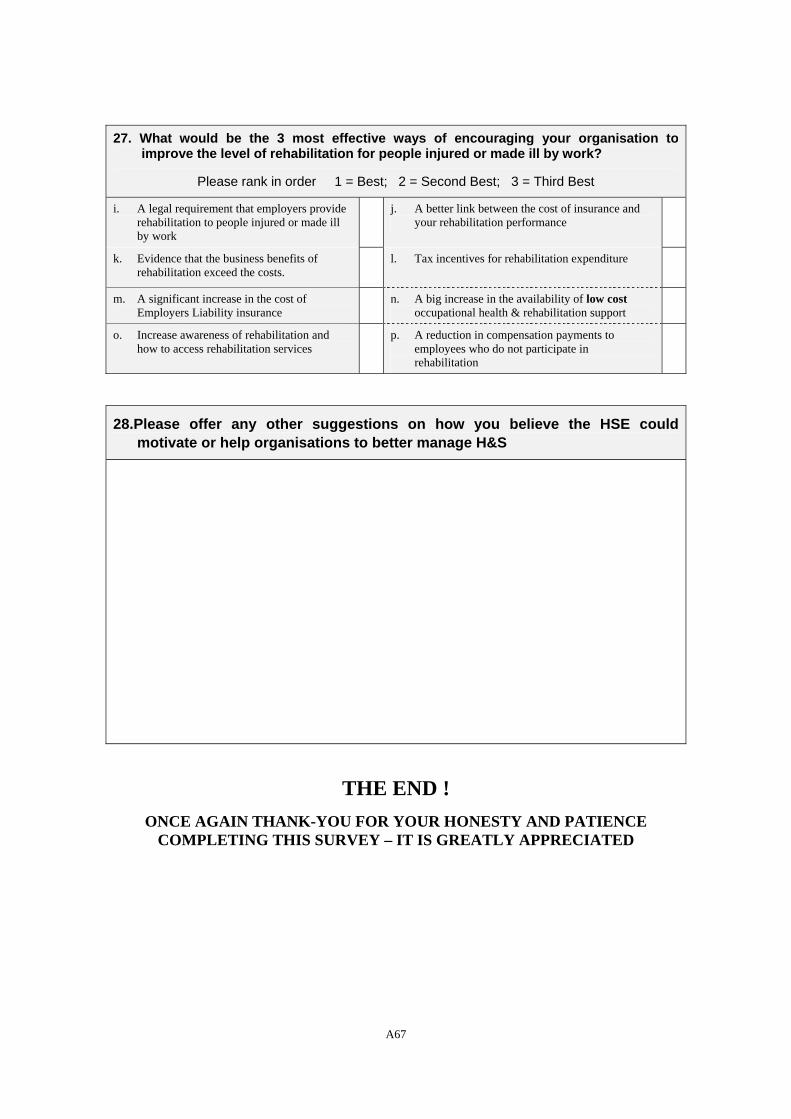
27. What would be the 3 most effective ways of encouraging your organisation to improve the level of rehabilitation for people injured or made ill by work?
Please rank in order 1 = Best; 2 = Second Best; 3 = Third Best
i. A legal requirement that employers provide rehabilitation to people injured or made ill by work
j. A better link between the cost of insurance and your rehabilitation performance
k. Evidence that the business benefits of rehabilitation exceed the costs.
l. Tax incentives for rehabilitation expenditure
n. A big increase in the availability of low cost occupational health & rehabilitation support
m. A significant increase in the cost of Employers Liability insurance
o. Increase awareness of rehabilitation and how to access rehabilitation services
p. A reduction in compensation payments to employees who do not participate in rehabilitation
28.Please offer any other suggestions on how you believe the HSE could motivate or help organisations to better manage H&S
THE END !
ONCE AGAIN THANK-YOU FOR YOUR HONESTY AND PATIENCE COMPLETING THIS SURVEY – IT IS GREATLY APPRECIATED
A67

12 Appendix E: Association of attitudinal factors with other factors & issues
A68
12.1 ASSOCIATIONS OF ATTITUDES WITH ORGANISATIONAL ATTRIBUTES
We identified if the changes in an organisations’ attributes have an effect on the whether an employer does or does not hold each of the 15 attitudes toward health and safety. This was done statistically by identifying if attitudinal factors showed significant relationships with any of the organisational attributes, using multiple regressions for each attitudinal factor. Multiple regressions were used to simultaneously assess the independent influence of each organisational attribute on each attitude.
Initial multiple regressions were conducted on each attitude using the whole range of organisational attributes, with step-wise removal of attributes that showed no significant relationship with each attitude (p>0.05). This identified organisational attributes that showed significant relationships with each attitudinal factor, with inferences then made about the nature of the relationship observed. These relationships are discussed in Table 62, and are represented in Figure 14 to Figure 28 (NB scales used range from negative to positive values of an attitudinal factor indicate the range in belief in the attitude from it not being held to it being held by respondents).
A69
Table 62: Associations of attitudes with organisational attributes
Attitudinal factor
Organisational attribute
Direction / nature of association
Trade association health and safety activity level
The extent to which health and safety is perceived as critical to the business increases as trade association activity increases.
Company size Large and very large firms are more likely to perceive health and safety as critical to the business
Attendance on business management courses
Respondents who attend business courses are more likely to perceive that health and safety is critical to the business
1: Health and safety is important for business
Sector The extent to which health and safety is perceived as a critical business risk varies across sectors, as per Figure 14
Company size The larger the size of a company the more likely they are to be motivated to improve health and safety
2: Motivated to improve health and safety
Between >1 year and 11-15 years of trading, respondents perceive that they would be more motivated to improve health and safety. Whereas from 15 years of trading onwards, respondents perceive that they would be less motivated to improve health and safety.
Trading age
Attendance of business management courses
The more business and management courses that are attended, the less likely firms are to perceive that enforcement will increase the priority awarded health and safety.
3: Perceived impact of enforcement on priority awarded health and safety Trade association
health and safety activity levels
The more active a trade association is in promoting health & safety, the less likely organisations are to perceive that enforcement will increase the priority awarded health and safety
4: Degree of inhibition to improve health and safety
Organisation size The association between organisational size and the degree of inhibition respondents perceive there is to improving health and safety varies, see Figure 15
A70
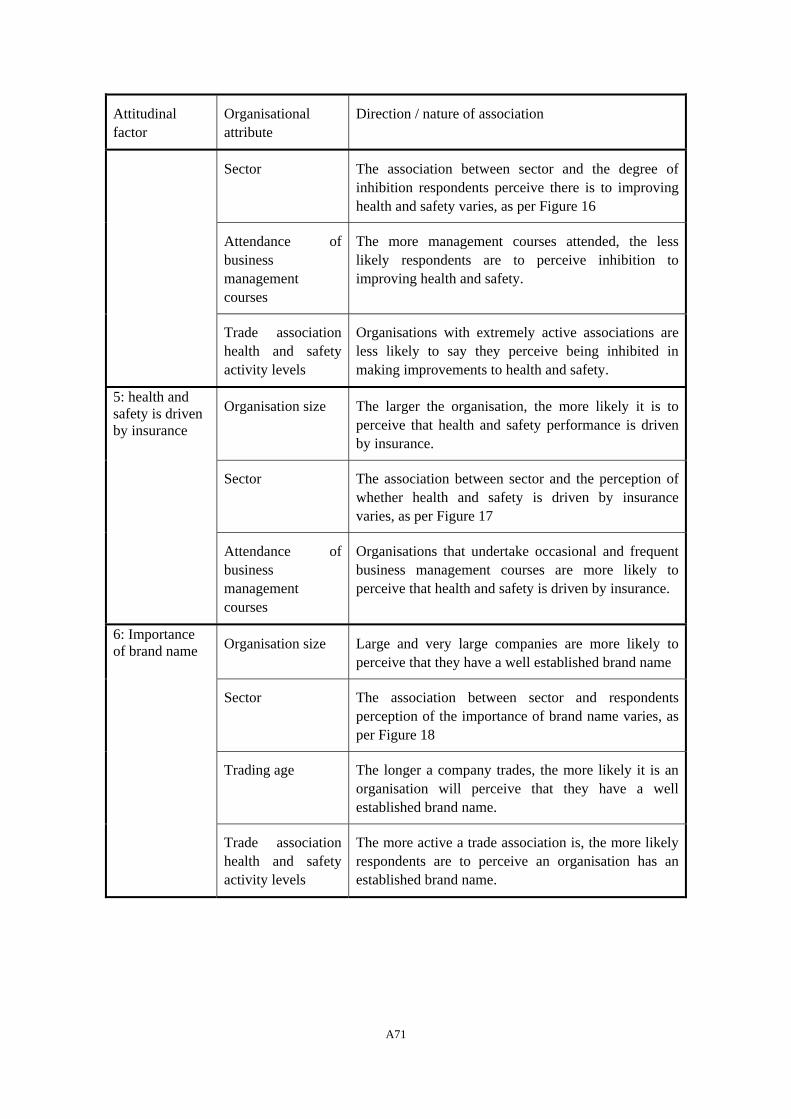
Attitudinal factor
Organisational attribute
Direction / nature of association
Sector The association between sector and the degree of inhibition respondents perceive there is to improving health and safety varies, as per Figure 16
Attendance of business management courses
The more management courses attended, the less likely respondents are to perceive inhibition to improving health and safety.
Trade association health and safety activity levels
Organisations with extremely active associations are less likely to say they perceive being inhibited in making improvements to health and safety.
Organisation size The larger the organisation, the more likely it is to perceive that health and safety performance is driven by insurance.
Sector The association between sector and the perception of whether health and safety is driven by insurance varies, as per Figure 17
5: health and safety is driven by insurance
Attendance of business management courses
Organisations that undertake occasional and frequent business management courses are more likely to perceive that health and safety is driven by insurance.
Organisation size Large and very large companies are more likely to perceive that they have a well established brand name
Sector The association between sector and respondents perception of the importance of brand name varies, as per Figure 1 8
Trading age The longer a company trades, the more likely it is an organisation will perceive that they have a well established brand name.
6: Importance of brand name
Trade association health and safety activity levels
The more active a trade association is, the more likely respondents are to perceive an organisation has an established brand name.
A71
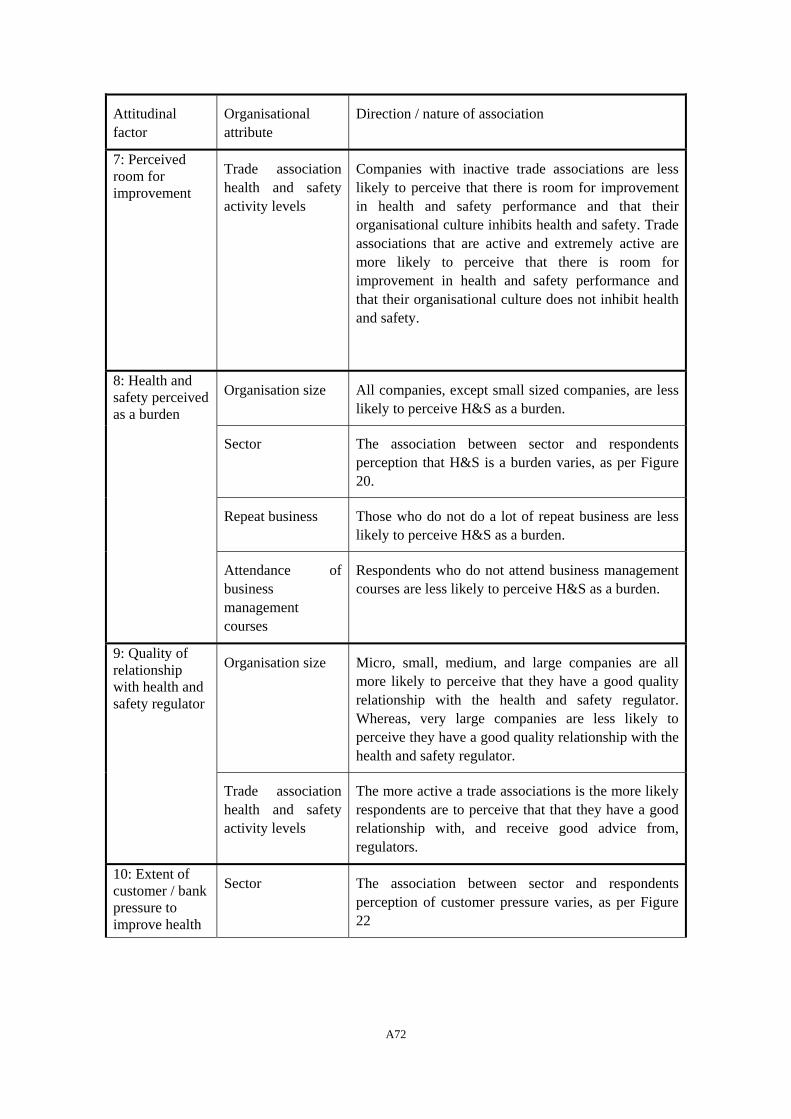
Attitudinal factor
Organisational attribute
Direction / nature of association
7: Perceived room for improvement
Trade association health and safety activity levels
Companies with inactive trade associations are less likely to perceive that there is room for improvement in health and safety performance and that their organisational culture inhibits health and safety. Trade associations that are active and extremely active are more likely to perceive that there is room for improvement in health and safety performance and that their organisational culture does not inhibit health and safety.
Organisation size All companies, except small sized companies, are less likely to perceive H&S as a burden.
Sector The association between sector and respondents perception that H&S is a burden varies, as per Figure 20.
Repeat business
8: Health and safety perceived as a burden
Those who do not do a lot of repeat business are less likely to perceive H&S as a burden.
Attendance of business management courses
Respondents who do not attend business management courses are less likely to perceive H&S as a burden.
Organisation size Micro, small, medium, and large companies are all more likely to perceive that they have a good quality relationship with the health and safety regulator. Whereas, very large companies are less likely to perceive they have a good quality relationship with the health and safety regulator.
9: Quality of relationship with health and safety regulator
Trade association health and safety activity levels
The more active a trade associations is the more likely respondents are to perceive that that they have a good relationship with, and receive good advice from, regulators.
10: Extent of customer / bank pressure to improve health
Sector
22
The association between sector and respondents perception of customer pressure varies, as per Figure
A72
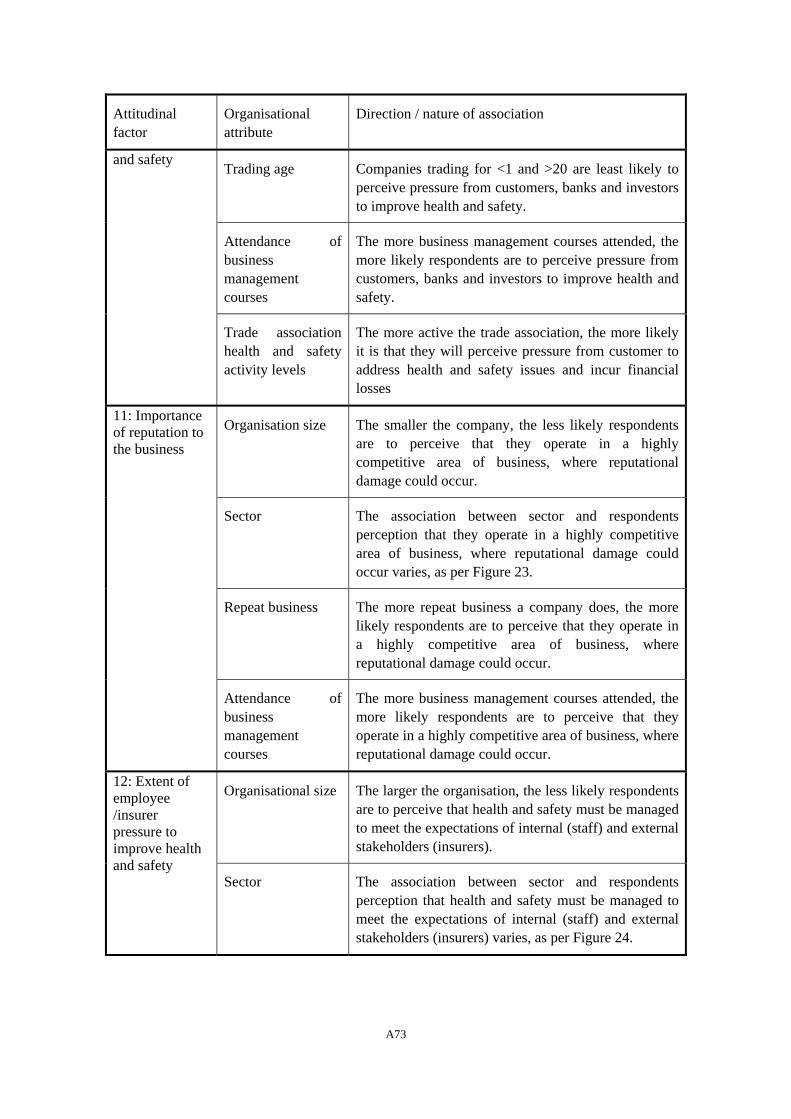
Attitudinal factor
Organisational attribute
Direction / nature of association
Trading age Companies trading for <1 and >20 are least likely to perceive pressure from customers, banks and investors to improve health and safety.
and safety
Attendance of business management courses
The more business management courses attended, the more likely respondents are to perceive pressure from customers, banks and investors to improve health and safety.
Trade association health and safety activity levels
The more active the trade association, the more likely it is that they will perceive pressure from customer to address health and safety issues and incur financial losses
Organisation size The smaller the company, the less likely respondents are to perceive that they operate in a highly competitive area of business, where reputational damage could occur.
11: Importance of reputation to the business
Sector The association between sector and respondents perception that they operate in a highly competitive area of business, where reputational damage could occur varies, as per Figure 23.
Repeat business The more repeat business a company does, the more likely respondents are to perceive that they operate in a highly competitive area of business, where reputational damage could occur.
Attendance of business management courses
The more business management courses attended, the more likely respondents are to perceive that they operate in a highly competitive area of business, where reputational damage could occur.
Organisational size The larger the organisation, the less likely respondents are to perceive that health and safety must be managed to meet the expectations of internal (staff) and external stakeholders (insurers).
12: Extent of employee /insurer pressure to improve health and safety Sector The association between sector and respondents
perception that health and safety must be managed to meet the expectations of internal (staff) and external stakeholders (insurers) varies, as per Figure 24.
A73
Attitudinal factor
Organisational attribute
Direction / nature of association
Attendance of business management courses
Respondents who attend management courses are more likely to perceive that health and safety must be managed to meet the expectations of internal (staff) and external stakeholders (insurers).
13: Possible impact of enforcement on the business
Sector The association between sector and respondents perception of the need to avoid coming to the attention of regulators, and fear that enforcement is disruptive and damages reputation varies, as per Figure 23
Size Businesses of all sizes are less likely to perceive that they are familiar with the HSE offenders database and to take account of wider social costs and benefits of health and safety.
Sector The association between sector and respondents perception that they are familiar with the HSE offenders database and to take account of wider social costs and benefits of health and safety varies, as per Figure 26.
Trading age The longer a company has been trading, the less likely respondents are to perceive that they are familiar with the HSE offenders database and to take account of wider social costs and benefits of health and safety
Repeat business The more repeat business done, the less likely respondents are to perceive that they are familiar with the HSE offenders database and to take account of wider social costs and benefits of health and safety
14: Assessment of health and safety costs and benefits
Attendance of business management courses
Respondents who never and frequently attend management courses are more likely to perceive that they are familiar with the HSE offenders database and to take account of wider social costs and benefits of health and safety.
15: Level of interaction between and similarity of organisations
Size The association between size and respondents perception of how much contact employers have with others in the same sector doing the same type of work, varies, as per Figure 27
A74
Attitudinal factor
Organisational attribute
Direction / nature of association
Sector The association between sector and respondents perception of how much contact employers have with others in the same sector doing the same type of work varies, as per Figure 28
Repeat business Respondents that do not do repeat business and those that do a lot, are less likely to perceive that they have contact with other employers in the same sector doing the same kind of work. Those that do only some repeat business are more likely to perceive this.
Attendance of business management courses
The more respondents attend business management courses, the more likely they are to perceive that they have contact with other employers in the same sector doing the same kind of work
Trade association health and safety activity levels
Respondents who say their trade associations are active, are more likely to perceive that their orgnanisation has contact with other employers in the same sector doing the same kind of work
A75
The sectors in Figure 14 to Figure 28 are numbered as follows:
1 Agriculture 14 Manufacturing
2 Charities 15 Media
3 Catering 16 Professional services
4 Central government 17 Business to business services
5 Construction 18 Personal services
6 Extraction 19 Retail
7 Education 20 Repairs
8 Emergency services 21 Social services
9 Financial services 22 Telecoms
10 Health care 23 Transport
11 Hotels 24 Utility
12 Leisure 25 Other
13 Local government
A76
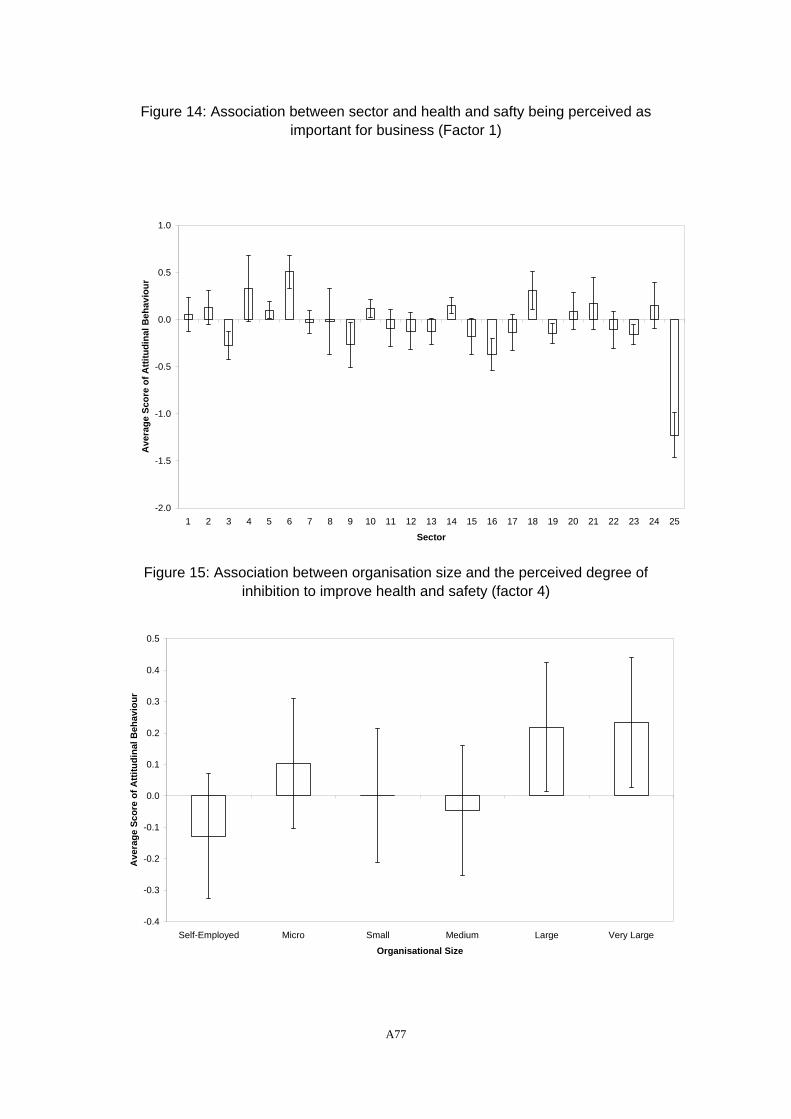
Figure 14: Association between sector and health and safty being perceived as important for business (Factor 1)
-2.0
-1.5
-1.0
-0.5
0.0
0.5
1.0
1 2 3 4 5 6 7 8 9 10 11 12 13 14 15 16 17 18 19 20 21 22 23 24 25
Sector
Ave
rage
Sco
re o
f Atti
tudi
nal B
ehav
iour
Figure 15: Association between organisation size and the perceived degree of inhibition to improve health and safety (factor 4)
-0.4
-0.3
-0.2
-0.1
0.0
0.1
0.2
0.3
0.4
0.5
Self-Employed Micro Small Medium Large Very Large
Organisational Size
Ave
rage
Sco
re o
f Atti
tudi
nal B
ehav
iour
A77
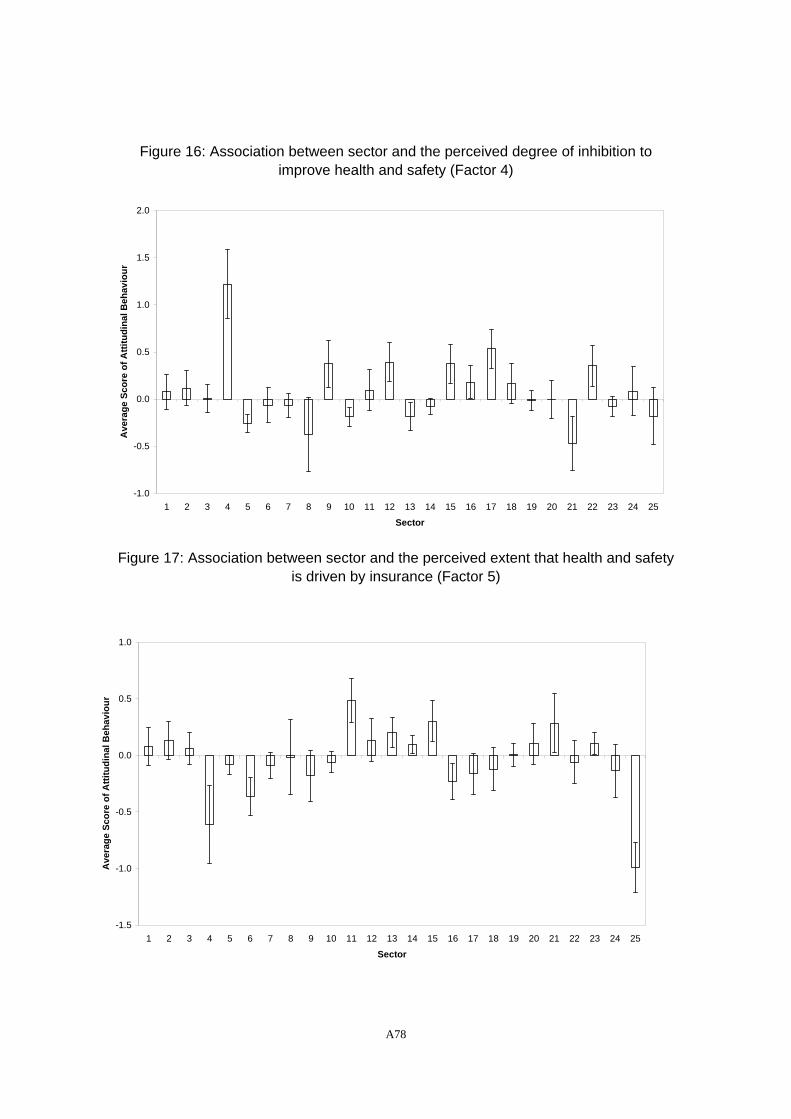
Figure 16: Association between sector and the perceived degree of inhibition to improve health and safety (Factor 4)
-1.0
-0.5
0.0
0.5
1.0
1.5
2.0
1 2 3 4 5 6 7 8 9 10 11 12 13 14 15 16 17 18 19 20 21 22 23 24 25
Sector
Ave
rage
Sco
re o
f Atti
tudi
nal B
ehav
iour
Figure 17: Association between sector and the perceived extent that health and safety is driven by insurance (Factor 5)
-1.5
-1.0
-0.5
0.0
0.5
1.0
1 2 3 4 5 6 7 8 9 10 11 12 13 14 15 16 17 18 19 20 21 22 23 24 25
Sector
Ave
rage
Sco
re o
f Atti
tudi
nal B
ehav
iour
A78
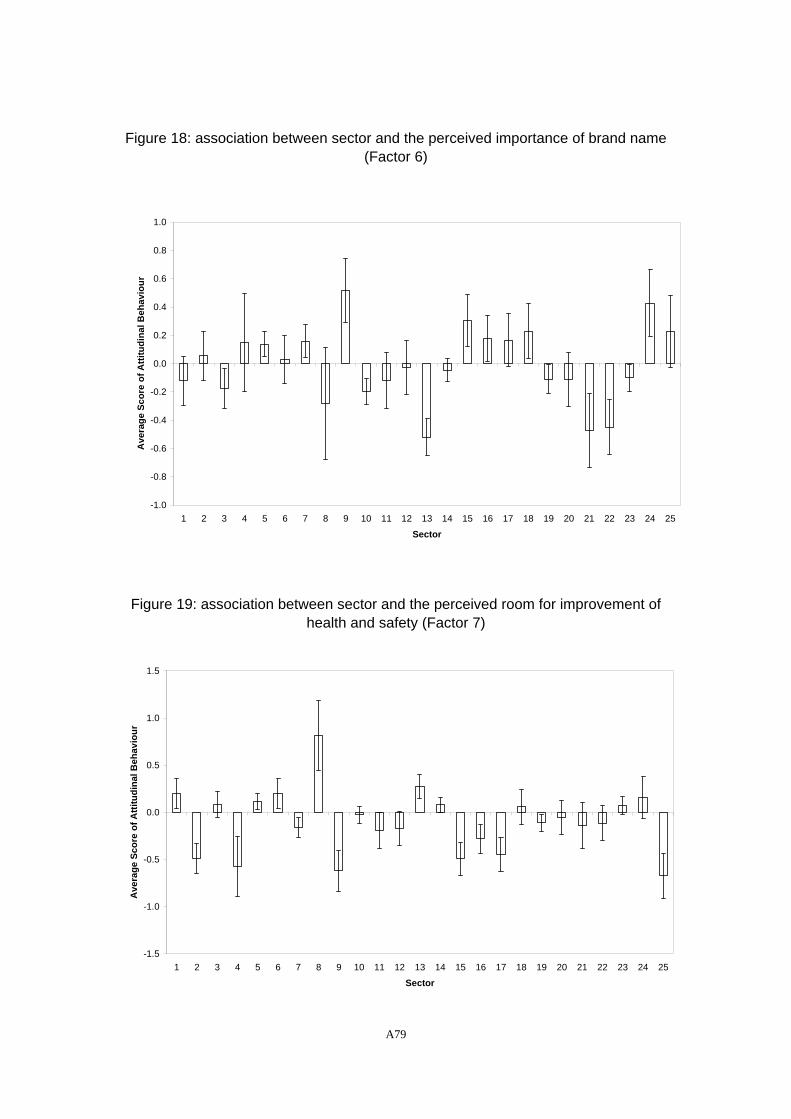
Figure 18: association between sector and the perceived importance of brand name (Factor 6)
-1.0
-0.8
-0.6
-0.4
-0.2
0.0
0.2
0.4
0.6
0.8
1.0
1 2 3 4 5 6 7 8 9 10 11 12 13 14 15 16 17 18 19 20 21 22 23 24 25
Sector
Ave
rage
Sco
re o
f Atti
tudi
nal B
ehav
iour
Figure 19: association between sector and the perceived room for improvement of health and safety (Factor 7)
-1.5
-1.0
-0.5
0.0
0.5
1.0
1.5
1 2 3 4 5 6 7 8 9 10 11 12 13 14 15 16 17 18 19 20 21 22 23 24 25
Sector
Ave
rage
Sco
re o
f Atti
tudi
nal B
ehav
iour
A79
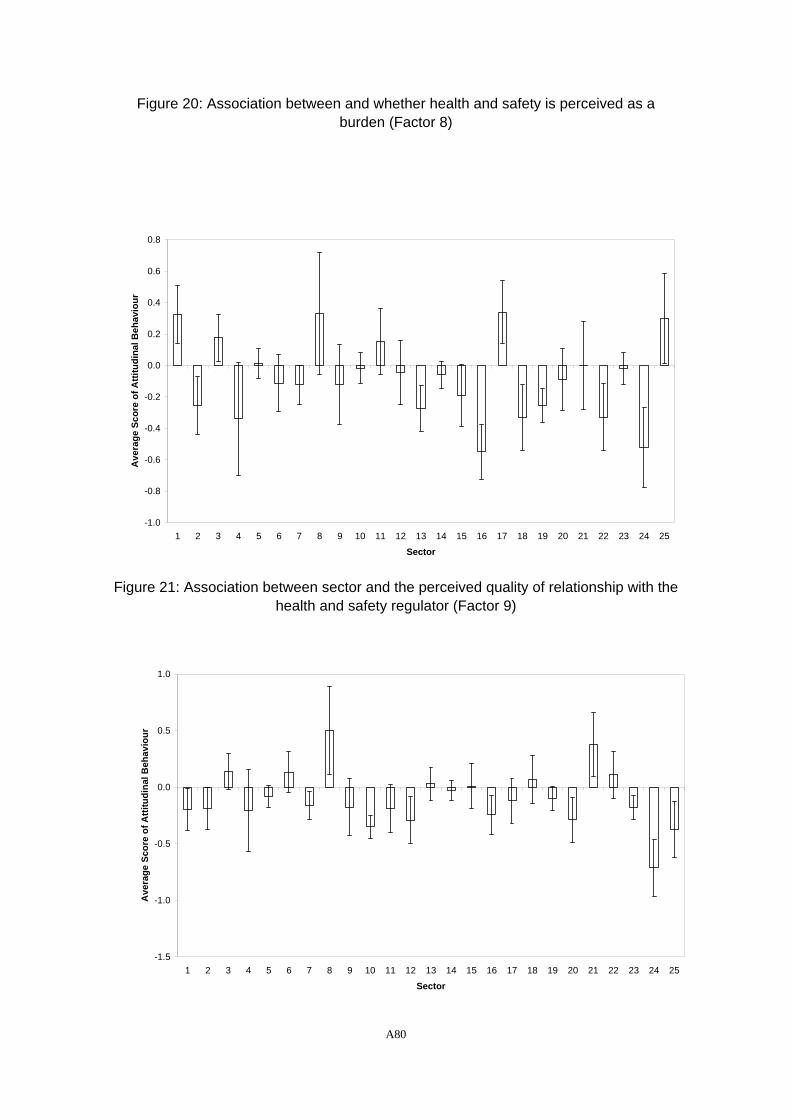
Figure 20: Association between and whether health and safety is perceived as a burden (Factor 8)
-1.0
-0.8
-0.6
-0.4
-0.2
0.0
0.2
0.4
0.6
0.8
1 2 3 4 5 6 7 8 9 10 11 12 13 14 15 16 17 18 19 20 21 22 23 24 25
Sector
Ave
rage
Sco
re o
f Atti
tudi
nal B
ehav
iour
Figure 21: Association between sector and the perceived quality of relationship with the health and safety regulator (Factor 9)
-1.5
-1.0
-0.5
0.0
0.5
1.0
1 2 3 4 5 6 7 8 9 10 11 12 13 14 15 16 17 18 19 20 21 22 23 24 25
Sector
Ave
rage
Sco
re o
f Atti
tudi
nal B
ehav
iour
A80
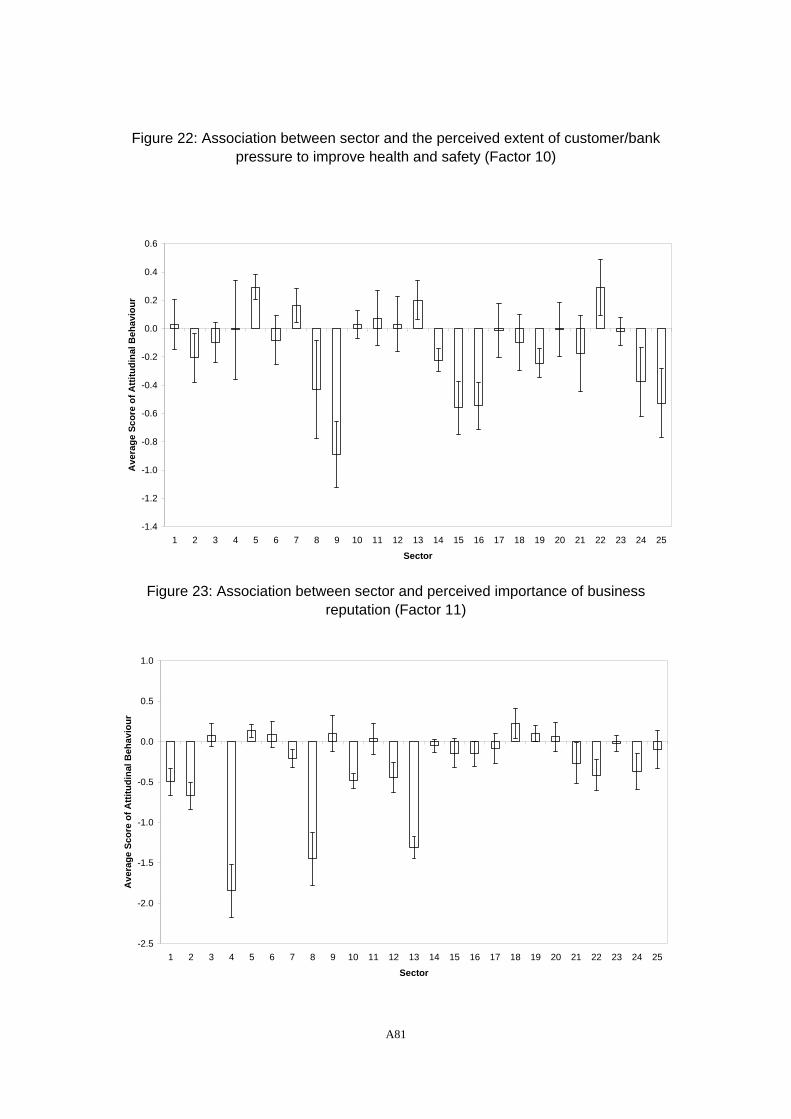
Figure 22: Association between sector and the perceived extent of customer/bank pressure to improve health and safety (Factor 10)
-1.4
-1.2
-1.0
-0.8
-0.6
-0.4
-0.2
0.0
0.2
0.4
0.6
1 2 3 4 5 6 7 8 9 10 11 12 13 14 15 16 17 18 19 20 21 22 23 24 25
Sector
Ave
rage
Sco
re o
f Atti
tudi
nal B
ehav
iour
Figure 23: Association between sector and perceived importance of business reputation (Factor 11)
-2.5
-2.0
-1.5
-1.0
-0.5
0.0
0.5
1.0
1 2 3 4 5 6 7 8 9 10 11 12 13 14 15 16 17 18 19 20 21 22 23 24 25
Sector
Ave
rage
Sco
re o
f Atti
tudi
nal B
ehav
iour
A81
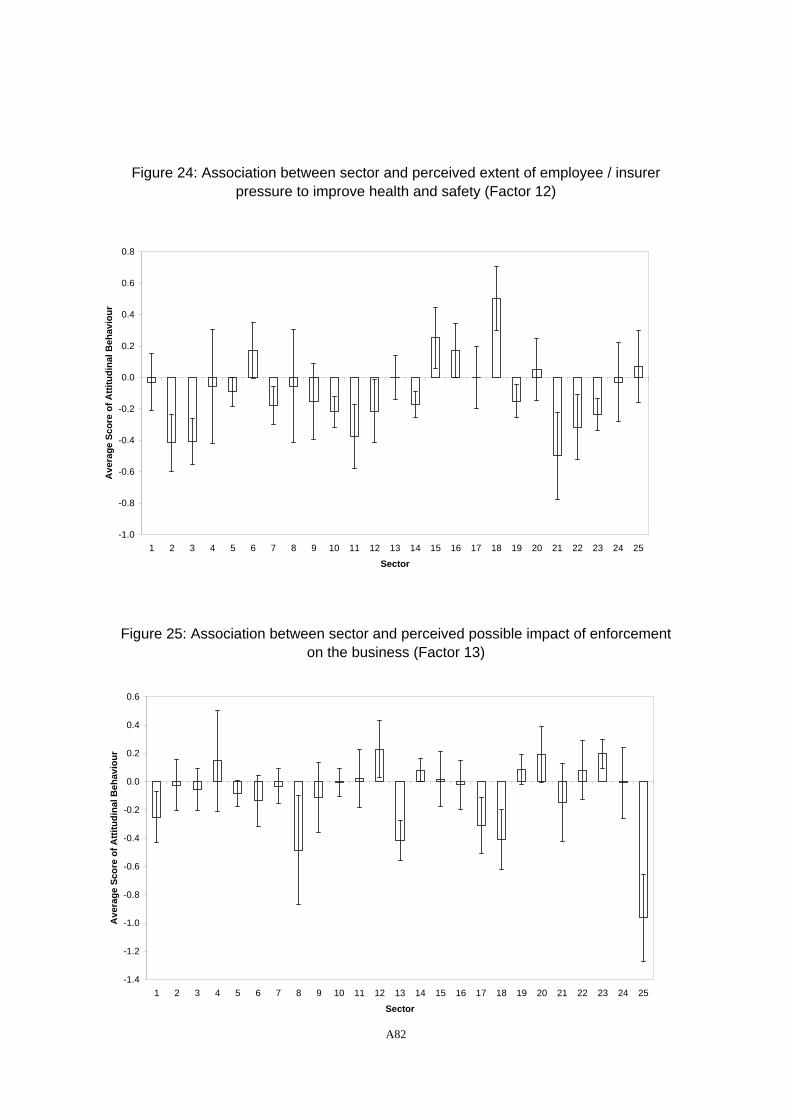
Figure 24: Association between sector and perceived extent of employee / insurer pressure to improve health and safety (Factor 12)
-1.0
-0.8
-0.6
-0.4
-0.2
0.0
0.2
0.4
0.6
0.8
1 2 3 4 5 6 7 8 9 10 11 12 13 14 15 16 17 18 19 20 21 22 23 24 25
Sector
Ave
rage
Sco
re o
f Atti
tudi
nal B
ehav
iour
Figure 25: Association between sector and perceived possible impact of enforcement on the business (Factor 13)
-1.4
-1.2
-1.0
-0.8
-0.6
-0.4
-0.2
0.0
0.2
0.4
0.6
1 2 3 4 5 6 7 8 9 10 11 12 13 14 15 16 17 18 19 20 21 22 23 24 25
Sector
Ave
rage
Sco
re o
f Atti
tudi
nal B
ehav
iour
A82
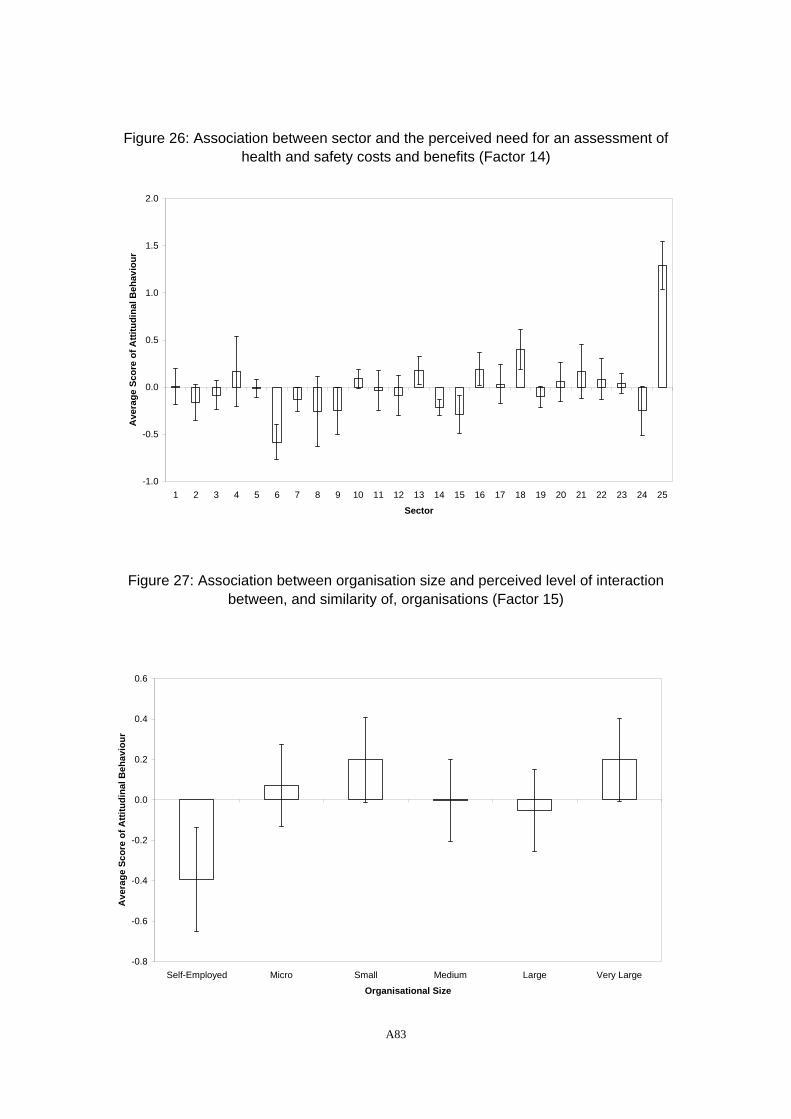
Figure 26: Association between sector and the perceived need for an assessment of health and safety costs and benefits (Factor 14)
-1.0
-0.5
0.0
0.5
1.0
1.5
2.0
1 2 3 4 5 6 7 8 9 10 11 12 13 14 15 16 17 18 19 20 21 22 23 24 25
Sector
Ave
rage
Sco
re o
f Atti
tudi
nal B
ehav
iour
Figure 27: Association between organisation size and perceived level of interaction between, and similarity of, organisations (Factor 15)
-0.8
-0.6
-0.4
-0.2
0.0
0.2
0.4
0.6
Self-Employed Micro Small Medium Large Very Large
Organisational Size
Ave
rage
Sco
re o
f Atti
tudi
nal B
ehav
iour
A83
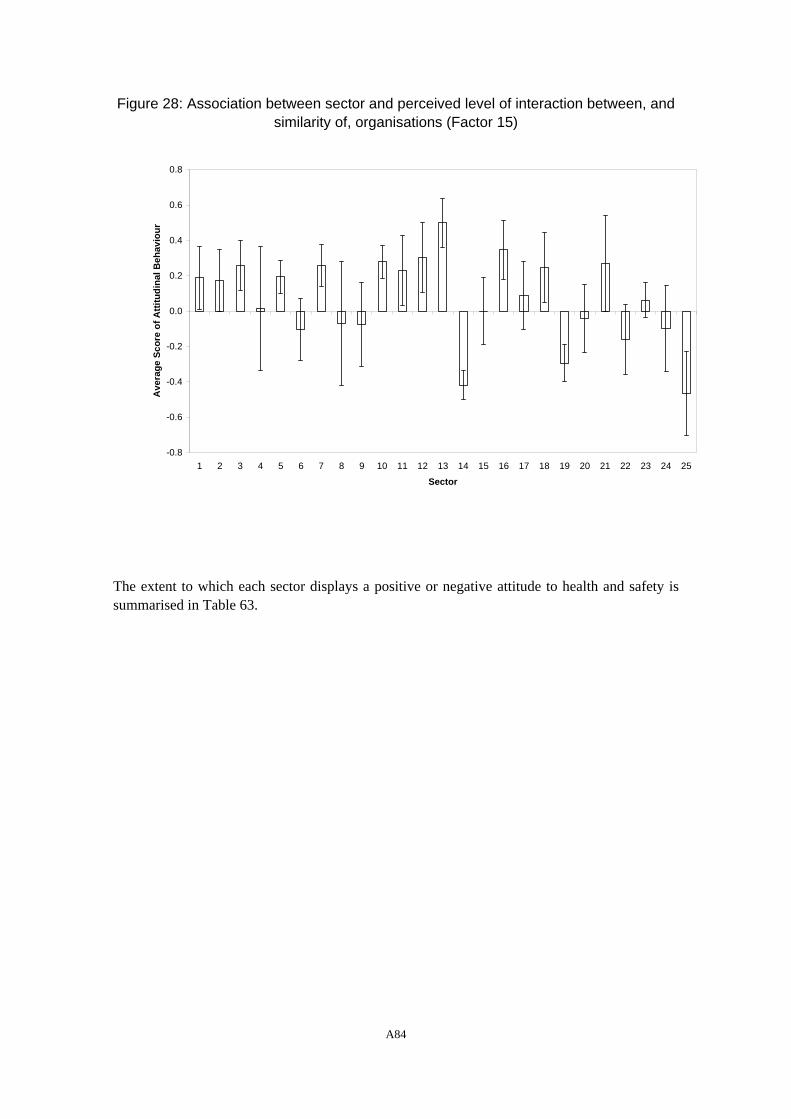
Figure 28: Association between sector and perceived level of interaction between, and similarity of, organisations (Factor 15)
-0.8
-0.6
-0.4
-0.2
0.0
0.2
0.4
0.6
0.8
1 2 3 4 5 6 7 8 9 10 11 12 13 14 15 16 17 18 19 20 21 22 23 24 25
Sector
Ave
rage
Sco
re o
f Atti
tudi
nal B
ehav
iour
The extent to which each sector displays a positive or negative attitude to health and safety is summarised in Table 63.
A84
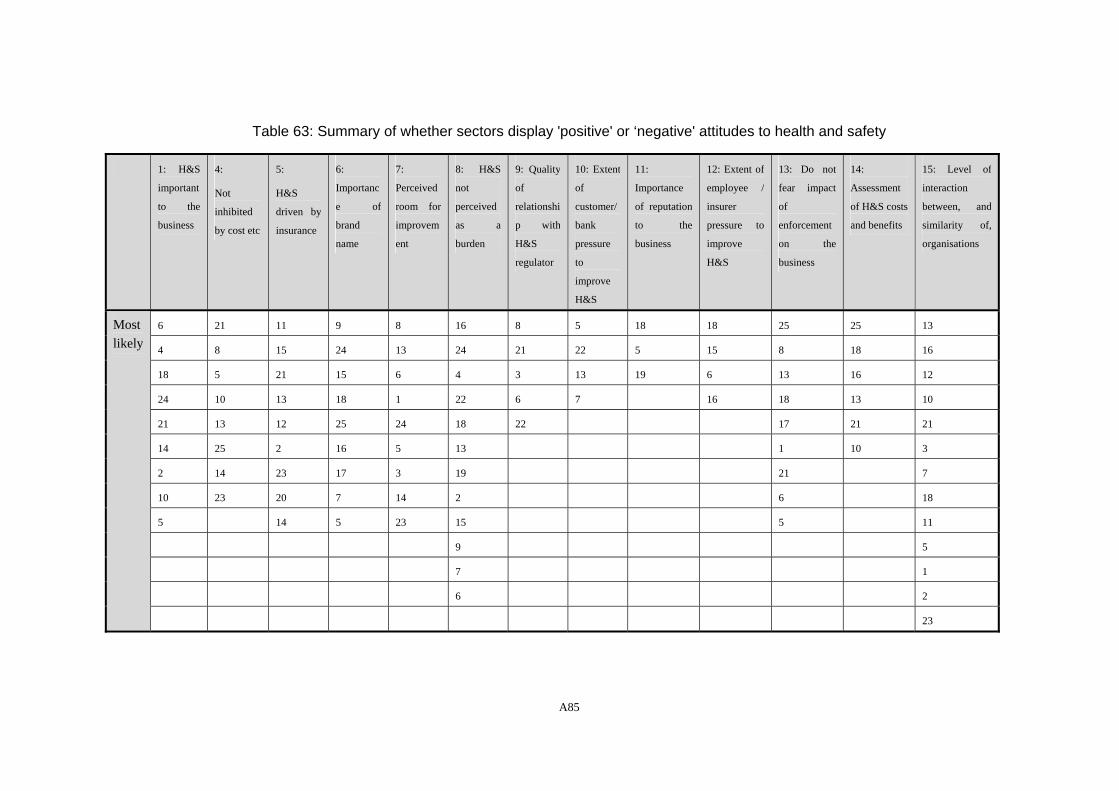
Table 63: Summary of whether sectors display 'positive' or ‘negative' attitudes to health and safety
1: H&S
important
to the
business
4:
Not
inhibited
by cost etc
5:
H&S
driven by
insurance
6:
Importanc
e of
brand
name
7:
Perceived
room for
improvem
ent
8: H&S
not
perceived
as a
burden
9: Quality
of
relationshi
p with
H&S
regulator
10: Extent
of
customer/
bank
pressure
to
improve
H&S
11:
Importance
of reputation
to the
business
12: Extent of
employee /
insurer
pressure to
improve
H&S
13: Do not
fear impact
of
enforcement
on the
business
14:
Assessment
of H&S costs
and benefits
15: Level of
interaction
between, and
similarity of,
organisations
6 21 11 9 8 16 8 5 18 18 25 25 13
4 8 15 24 13 24 21 22 5 15 8 18 16
18 5 21 15 6 4 3 13 19 6 13 16 12
24 10 13 18 1 22 6 7 16 18 13 10
21 13 12 25 24 18 22 17 21 21
14 25 2 16 5 13 1 10 3
2 14 23 17 3 19 21 7
10 23 20 7 14 2 6 18
5 14 5 23 15 5 11
9 5
7 1
6 2
Most likely
23
A85

1 1 1 2 10 5 13 1 3 1 2 1 4
7 3 3 4 18 10 14 4 6 4 3 4 8
8 6 8 6 20 12 15 6 9 8 4 5 9
11 7 19 12 20 18 10 11 13 7 11 15
12 11 22 14 21 11 17 17 9 12 17
20 19 23 12 20 20 10 17 20
22 20 17 23 24 11 20 24
24 18 25 25 15 22
20 16 23
23 22
No preference
24
13 2 25 23 19 11 5 3 14 3 14 3 6
17 18 4 19 22 3 18 21 15 19 19 19 22
19 16 6 20 21 25 17 2 16 9 23 7 19
23 22 16 11 2 1 7 14 7 14 20 2 14
15 15 9 1 12 8 9 19 21 7 12 14 25
9 9 17 3 11 17 23 24 22 12 9
3 12 24 10 16 2 8 24 10 24
6 17 18 8 17 11 25 12 23 8
Least likely
25 4 7 22 2 1 16 10 22 15
A86

5 21 15 4 15 1 11 6
10 13 4 16 9 2 3
9 20 13 2
25 12 8 21
10 4
25
24
A87
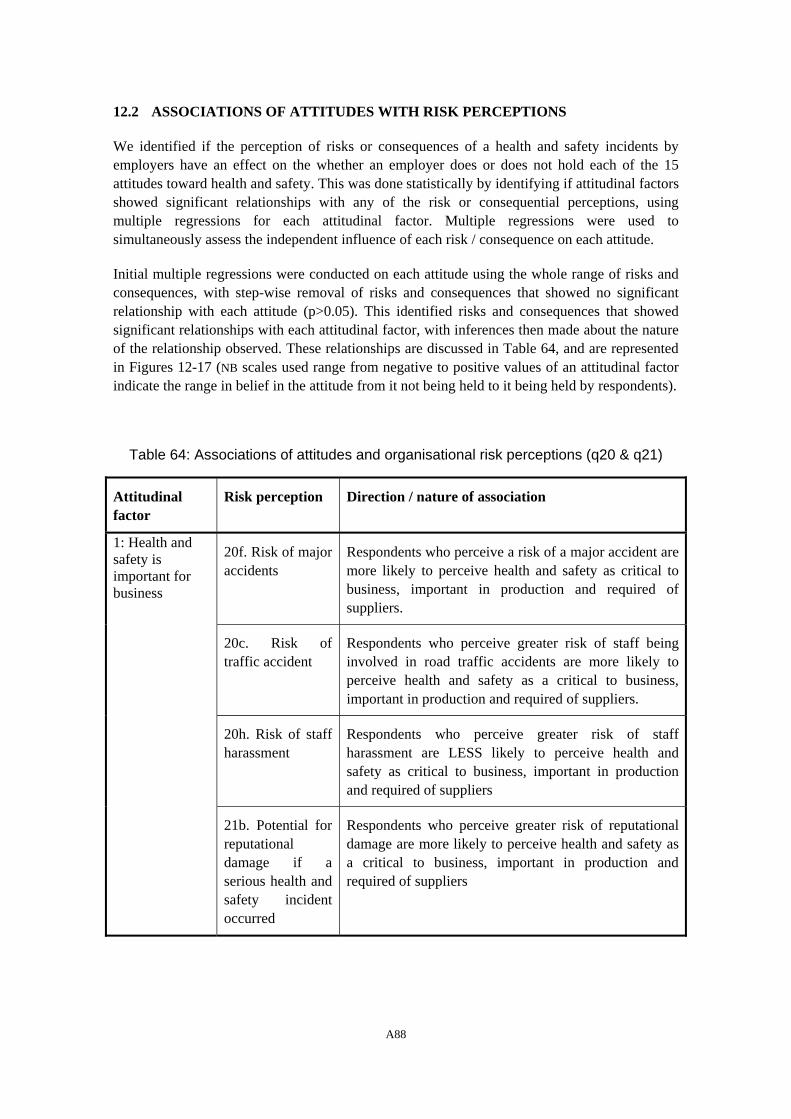
12.2 ASSOCIATIONS OF ATTITUDES WITH RISK PERCEPTIONS
We identified if the perception of risks or consequences of a health and safety incidents by employers have an effect on the whether an employer does or does not hold each of the 15 attitudes toward health and safety. This was done statistically by identifying if attitudinal factors showed significant relationships with any of the risk or consequential perceptions, using multiple regressions for each attitudinal factor. Multiple regressions were used to simultaneously assess the independent influence of each risk / consequence on each attitude.
Initial multiple regressions were conducted on each attitude using the whole range of risks and consequences, with step-wise removal of risks and consequences that showed no significant relationship with each attitude (p>0.05). This identified risks and consequences that showed significant relationships with each attitudinal factor, with inferences then made about the nature of the relationship observed. These relationships are discussed in Table 64, and are represented in Figures 12-17 (NB scales used range from negative to positive values of an attitudinal factor indicate the range in belief in the attitude from it not being held to it being held by respondents).
Table 64: Associations of attitudes and organisational risk perceptions (q20 & q21)
Attitudinal factor
Risk perception Direction / nature of association
20f. Risk of major accidents
Respondents who perceive a risk of a major accident are more likely to perceive health and safety as critical to business, important in production and required of suppliers.
20c. Risk of traffic accident
Respondents who perceive greater risk of staff being involved in road traffic accidents are more likely to perceive health and safety as a critical to business, important in production and required of suppliers.
20h. Risk of staff harassment
Respondents who perceive greater risk of staff harassment are LESS likely to perceive health and safety as critical to business, important in production and required of suppliers
1: Health and safety is important for business
21b. Potential for reputational damage if a serious health and safety incident occurred
Respondents who perceive greater risk of reputational damage are more likely to perceive health and safety as a critical to business, important in production and required of suppliers
A88
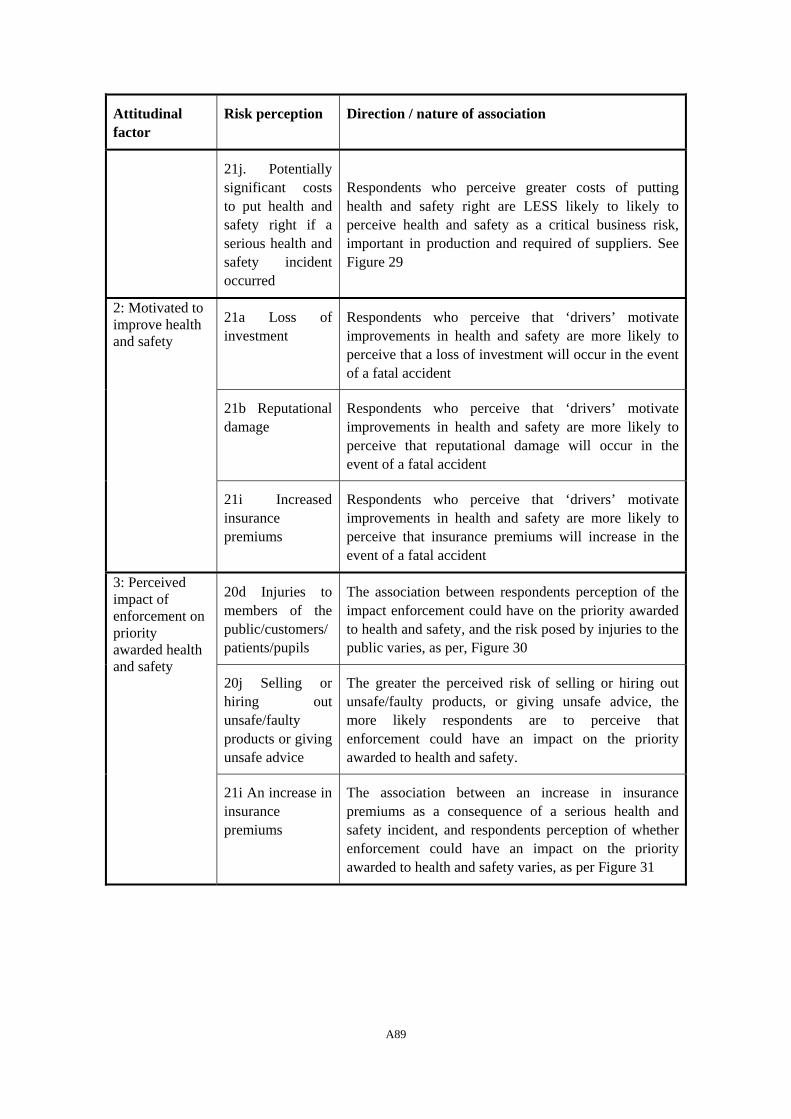
Attitudinal factor
Risk perception Direction / nature of association
21j. Potentially significant costs to put health and safety right if a serious health and safety incident occurred
Respondents who perceive greater costs of putting health and safety right are LESS likely to likely to perceive health and safety as a critical business risk, important in production and required of suppliers. See Figure 29
21a Loss of investment
Respondents who perceive that ‘drivers’ motivate improvements in health and safety are more likely to perceive that a loss of investment will occur in the event of a fatal accident
21b Reputational damage
Respondents who perceive that ‘drivers’ motivate improvements in health and safety are more likely to perceive that reputational damage will occur in the event of a fatal accident
2: Motivated to improve health and safety
21i Increased insurance premiums
Respondents who perceive that ‘drivers’ motivate improvements in health and safety are more likely to perceive that insurance premiums will increase in the event of a fatal accident
20d Injuries to members of the public/customers/patients/pupils
The association between respondents perception of the impact enforcement could have on the priority awarded to health and safety, and the risk posed by injuries to the public varies, as per, Figure 30
20j Selling or hiring out unsafe/faulty products or giving unsafe advice
The greater the perceived risk of selling or hiring out unsafe/faulty products, or giving unsafe advice, the more likely respondents are to perceive that enforcement could have an impact on the priority awarded to health and safety.
3: Perceived impact of enforcement on priority awarded health and safety
21i An increase in insurance premiums
The association between an increase in insurance premiums as a consequence of a serious health and safety incident, and respondents perception of whether enforcement could have an impact on the priority awarded to health and safety varies, as per Figure 31
A89
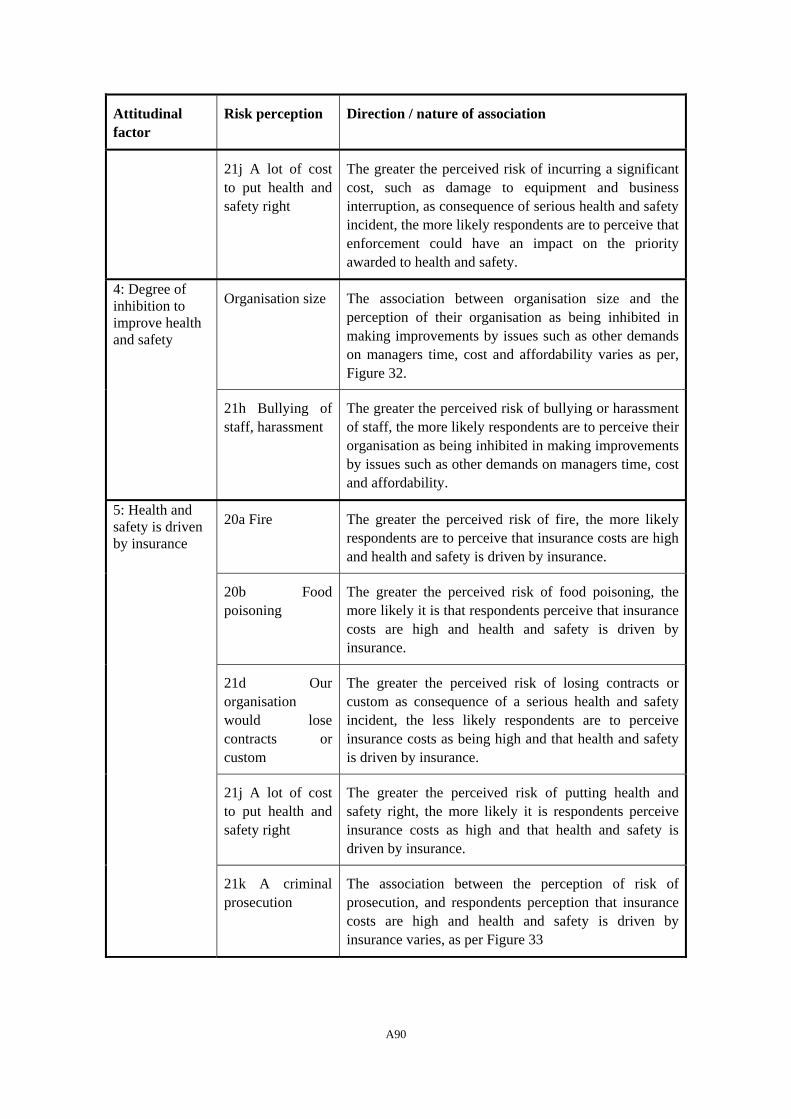
Attitudinal factor
Risk perception Direction / nature of association
21j A lot of cost to put health and safety right
The greater the perceived risk of incurring a significant cost, such as damage to equipment and business interruption, as consequence of serious health and safety incident, the more likely respondents are to perceive that enforcement could have an impact on the priority awarded to health and safety.
4: Degree of inhibition to improve health and safety
Organisation size The association between organisation size and the perception of their organisation as being inhibited in making improvements by issues such as other demands on managers time, cost and affordability varies as per, Figure 32.
21h Bullying of staff, harassment
The greater the perceived risk of bullying or harassment of staff, the more likely respondents are to perceive their organisation as being inhibited in making improvements by issues such as other demands on managers time, cost and affordability.
20a Fire The greater the perceived risk of fire, the more likely respondents are to perceive that insurance costs are high and health and safety is driven by insurance.
20b Food poisoning
The greater the perceived risk of food poisoning, the more likely it is that respondents perceive that insurance costs are high and health and safety is driven by insurance.
5: Health and safety is driven by insurance
21d Our organisation would lose contracts or custom
The greater the perceived risk of losing contracts or custom as consequence of a serious health and safety incident, the less likely respondents are to perceive insurance costs as being high and that health and safety is driven by insurance.
21j A lot of cost to put health and safety right
The greater the perceived risk of putting health and safety right, the more likely it is respondents perceive insurance costs as high and that health and safety is driven by insurance.
21k A criminal prosecution
The association between the perception of risk of prosecution, and respondents perception that insurance costs are high and health and safety is driven by insurance varies, as per Figure 33
A90
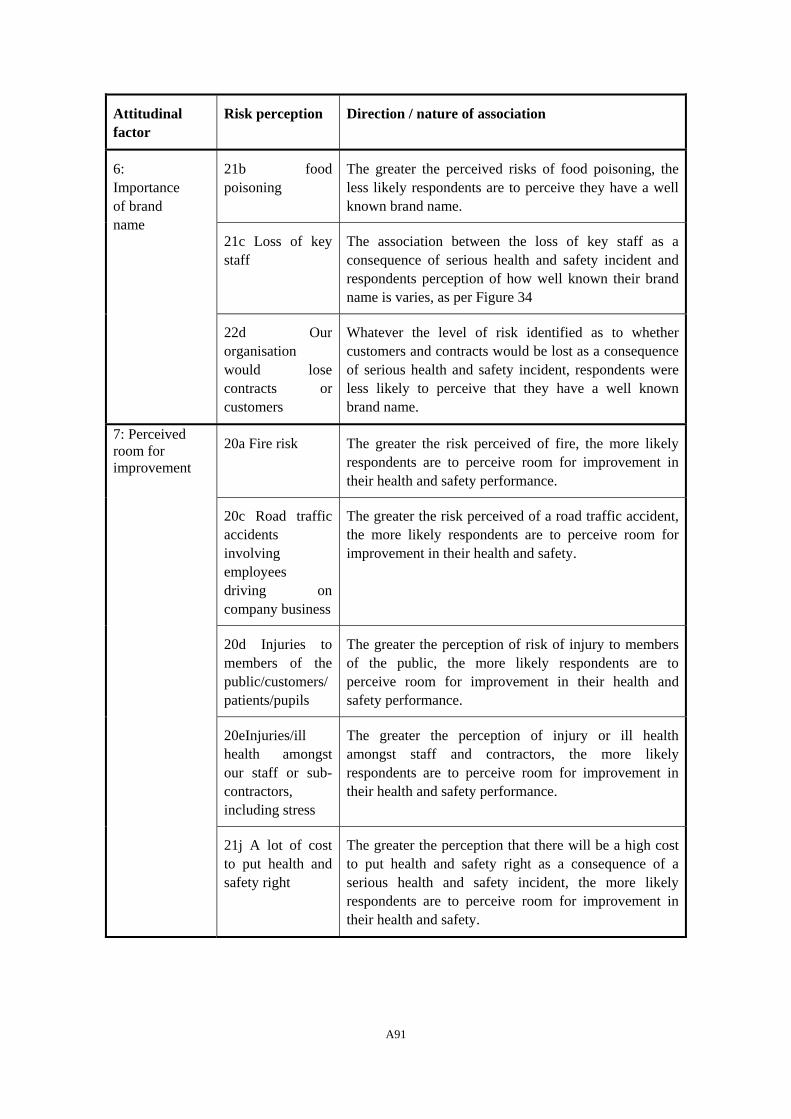
Attitudinal factor
Risk perception Direction / nature of association
21b food poisoning
The greater the perceived risks of food poisoning, the less likely respondents are to perceive they have a well known brand name.
21c Loss of key staff
The association between the loss of key staff as a consequence of serious health and safety incident and respondents perception of how well known their brand name is varies, as per Figure 34
6: Importance of brand name
22d Our organisation would lose contracts or customers
Whatever the level of risk identified as to whether customers and contracts would be lost as a consequence of serious health and safety incident, respondents were less likely to perceive that they have a well known brand name.
20a Fire risk The greater the risk perceived of fire, the more likely respondents are to perceive room for improvement in their health and safety performance.
20c Road traffic accidents involving employees driving on company business
The greater the risk perceived of a road traffic accident, the more likely respondents are to perceive room for improvement in their health and safety.
20d Injuries to members of the public/customers/patients/pupils
The greater the perception of risk of injury to members of the public, the more likely respondents are to perceive room for improvement in their health and safety performance.
20eInjuries/ill health amongst our staff or sub-contractors, including stress
The greater the perception of injury or ill health amongst staff and contractors, the more likely respondents are to perceive room for improvement in their health and safety performance.
7: Perceived room for improvement
21j A lot of cost to put health and safety right
The greater the perception that there will be a high cost to put health and safety right as a consequence of a serious health and safety incident, the more likely respondents are to perceive room for improvement in their health and safety.
A91
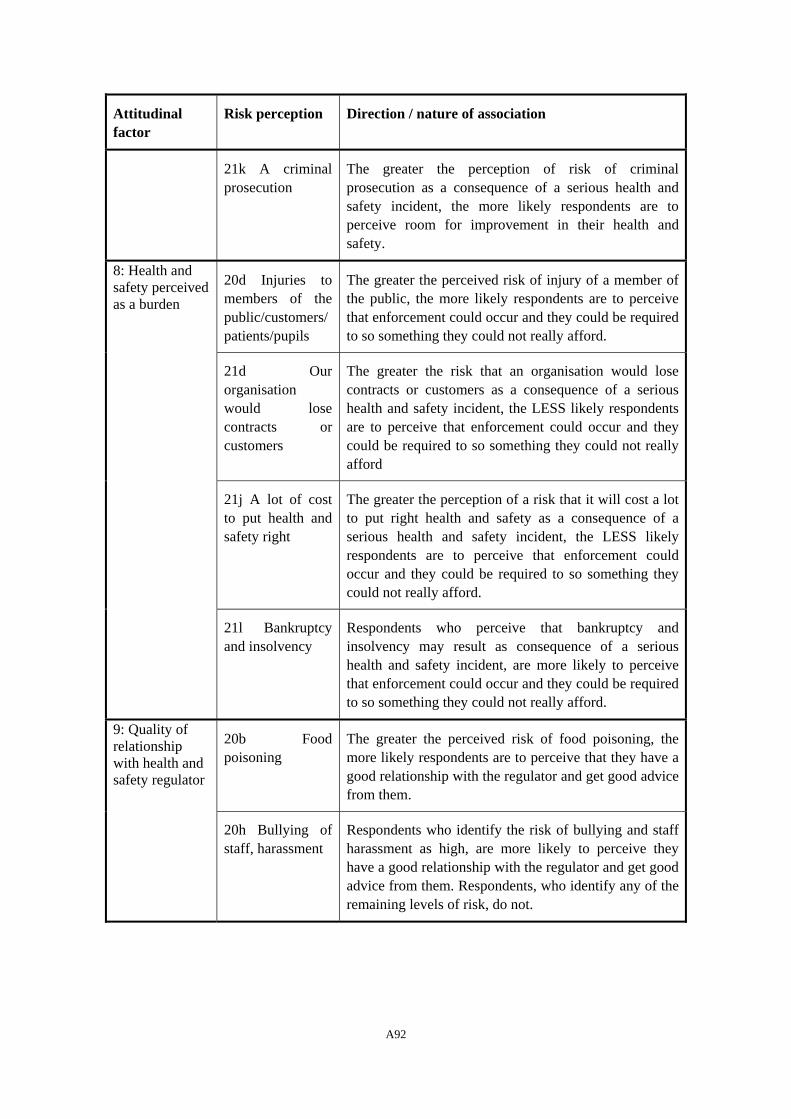
Attitudinal factor
Risk perception Direction / nature of association
21k A criminal prosecution
The greater the perception of risk of criminal prosecution as a consequence of a serious health and safety incident, the more likely respondents are to perceive room for improvement in their health and safety.
20d Injuries to members of the public/customers/patients/pupils
The greater the perceived risk of injury of a member of the public, the more likely respondents are to perceive that enforcement could occur and they could be required to so something they could not really afford.
21d Our organisation would lose contracts or customers
The greater the risk that an organisation would lose contracts or customers as a consequence of a serious health and safety incident, the LESS likely respondents are to perceive that enforcement could occur and they could be required to so something they could not really afford
21j A lot of cost to put health and safety right
The greater the perception of a risk that it will cost a lot to put right health and safety as a consequence of a serious health and safety incident, the LESS likely respondents are to perceive that enforcement could occur and they could be required to so something they could not really afford.
8: Health and safety perceived as a burden
21l Bankruptcy and insolvency
Respondents who perceive that bankruptcy and insolvency may result as consequence of a serious health and safety incident, are more likely to perceive that enforcement could occur and they could be required to so something they could not really afford.
20b Food poisoning
The greater the perceived risk of food poisoning, the more likely respondents are to perceive that they have a good relationship with the regulator and get good advice from them.
9: Quality of relationship with health and safety regulator
20h Bullying of staff, harassment
Respondents who identify the risk of bullying and staff harassment as high, are more likely to perceive they have a good relationship with the regulator and get good advice from them. Respondents, who identify any of the remaining levels of risk, do not.
A92
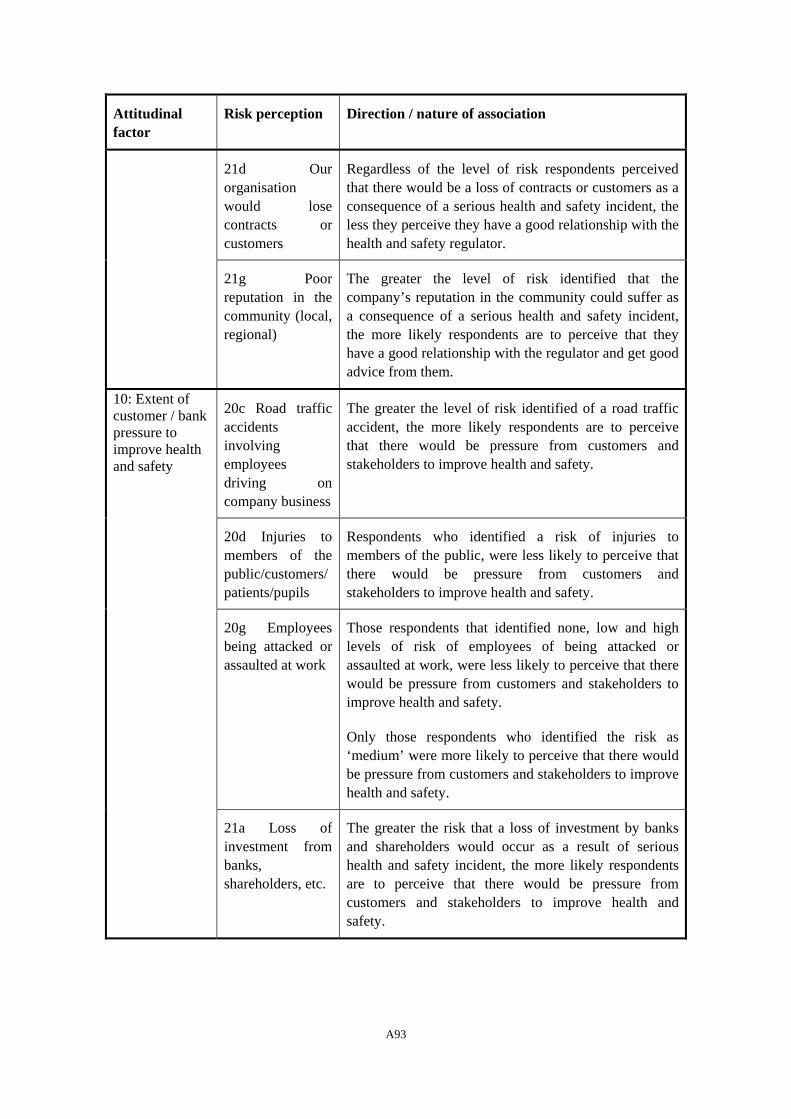
Attitudinal factor
Risk perception Direction / nature of association
21d Our organisation would lose contracts or customers
Regardless of the level of risk respondents perceived that there would be a loss of contracts or customers as a consequence of a serious health and safety incident, the less they perceive they have a good relationship with the health and safety regulator.
21g Poor reputation in the community (local, regional)
The greater the level of risk identified that the company’s reputation in the community could suffer as a consequence of a serious health and safety incident, the more likely respondents are to perceive that they have a good relationship with the regulator and get good advice from them.
20c Road traffic accidents involving employees driving on company business
The greater the level of risk identified of a road traffic accident, the more likely respondents are to perceive that there would be pressure from customers and stakeholders to improve health and safety.
20d Injuries to members of the public/customers/patients/pupils
Respondents who identified a risk of injuries to members of the public, were less likely to perceive that there would be pressure from customers and stakeholders to improve health and safety.
20g Employees being attacked or assaulted at work
Those respondents that identified none, low and high levels of risk of employees of being attacked or assaulted at work, were less likely to perceive that there would be pressure from customers and stakeholders to improve health and safety.
Only those respondents who identified the risk as ‘medium’ were more likely to perceive that there would be pressure from customers and stakeholders to improve health and safety.
10: Extent of customer / bank pressure to improve health and safety
21a Loss of investment from banks, shareholders, etc.
The greater the risk that a loss of investment by banks and shareholders would occur as a result of serious health and safety incident, the more likely respondents are to perceive that there would be pressure from customers and stakeholders to improve health and safety.
A93
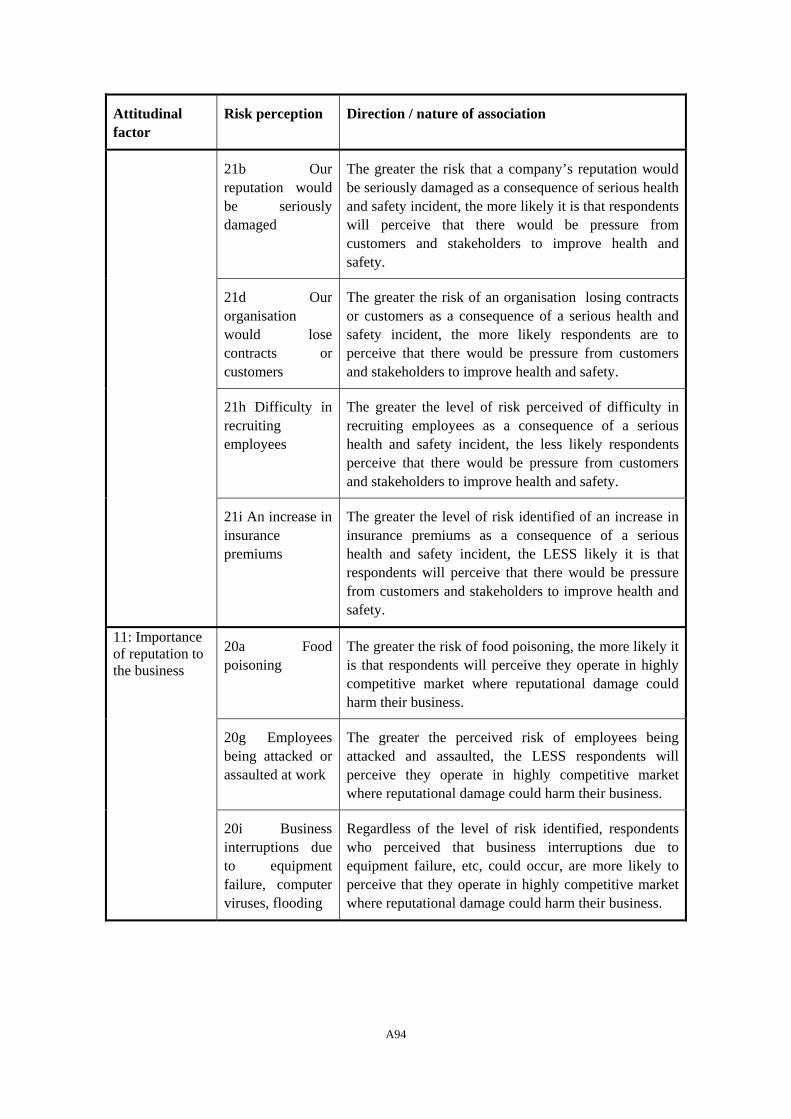
Attitudinal factor
Risk perception Direction / nature of association
21b Our reputation would be seriously damaged
The greater the risk that a company’s reputation would be seriously damaged as a consequence of serious health and safety incident, the more likely it is that respondents will perceive that there would be pressure from customers and stakeholders to improve health and safety.
21d Our organisation would lose contracts or customers
The greater the risk of an organisation losing contracts or customers as a consequence of a serious health and safety incident, the more likely respondents are to perceive that there would be pressure from customers and stakeholders to improve health and safety.
21h Difficulty in recruiting employees
The greater the level of risk perceived of difficulty in recruiting employees as a consequence of a serious health and safety incident, the less likely respondents perceive that there would be pressure from customers and stakeholders to improve health and safety.
21i An increase in insurance premiums
The greater the level of risk identified of an increase in insurance premiums as a consequence of a serious health and safety incident, the LESS likely it is that respondents will perceive that there would be pressure from customers and stakeholders to improve health and safety.
20a Food poisoning
The greater the risk of food poisoning, the more likely it is that respondents will perceive they operate in highly competitive market where reputational damage could harm their business.
20g Employees being attacked or assaulted at work
The greater the perceived risk of employees being attacked and assaulted, the LESS respondents will perceive they operate in highly competitive market where reputational damage could harm their business.
11: Importance of reputation to the business
20i Business interruptions due to equipment failure, computer viruses, flooding
Regardless of the level of risk identified, respondents who perceived that business interruptions due to equipment failure, etc, could occur, are more likely to perceive that they operate in highly competitive market where reputational damage could harm their business.
A94
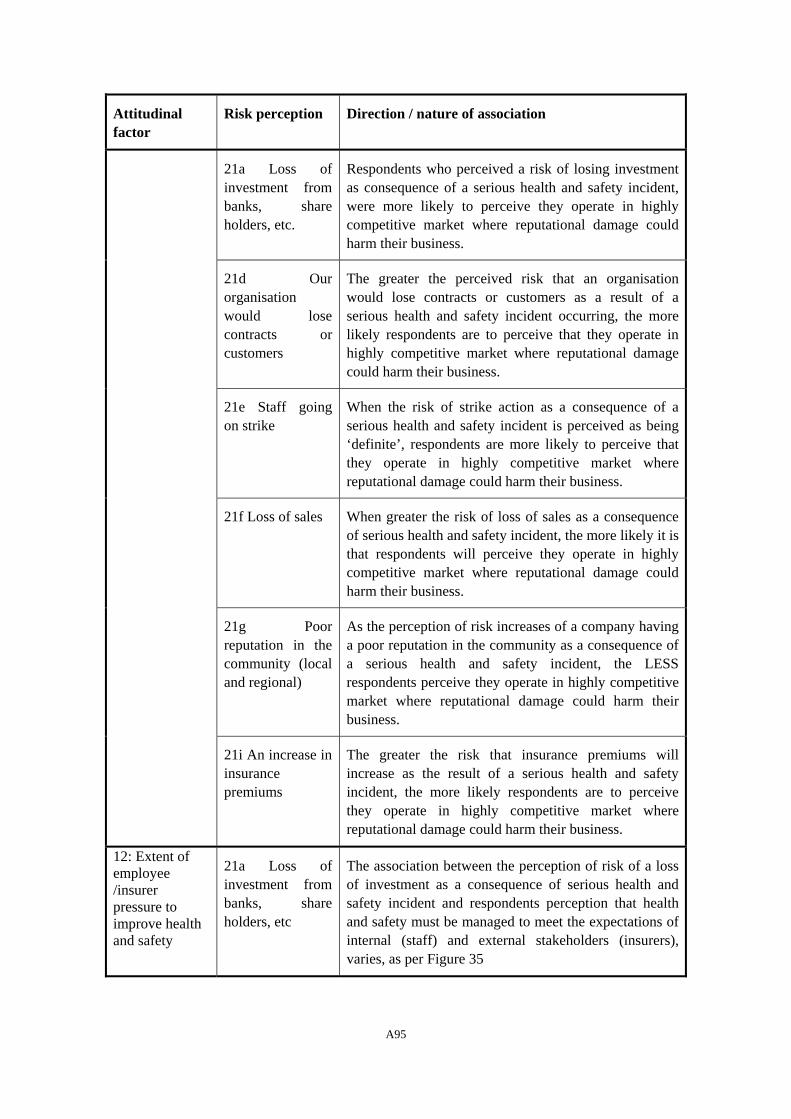
Attitudinal factor
Risk perception Direction / nature of association
21a Loss of investment from banks, share holders, etc.
Respondents who perceived a risk of losing investment as consequence of a serious health and safety incident, were more likely to perceive they operate in highly competitive market where reputational damage could harm their business.
21d Our organisation would lose contracts or customers
The greater the perceived risk that an organisation would lose contracts or customers as a result of a serious health and safety incident occurring, the more likely respondents are to perceive that they operate in highly competitive market where reputational damage could harm their business.
21e Staff going on strike
When the risk of strike action as a consequence of a serious health and safety incident is perceived as being ‘definite’, respondents are more likely to perceive that they operate in highly competitive market where reputational damage could harm their business.
21f Loss of sales When greater the risk of loss of sales as a consequence of serious health and safety incident, the more likely it is that respondents will perceive they operate in highly competitive market where reputational damage could harm their business.
21g Poor reputation in the community (local and regional)
As the perception of risk increases of a company having a poor reputation in the community as a consequence of a serious health and safety incident, the LESS respondents perceive they operate in highly competitive market where reputational damage could harm their business.
21i An increase in insurance premiums
The greater the risk that insurance premiums will increase as the result of a serious health and safety incident, the more likely respondents are to perceive they operate in highly competitive market where reputational damage could harm their business.
12: Extent of employee /insurer pressure to improve health and safety
21a Loss of investment from banks, share holders, etc
The association between the perception of risk of a loss of investment as a consequence of serious health and safety incident and respondents perception that health and safety must be managed to meet the expectations of internal (staff) and external stakeholders (insurers), varies, as per Figure 35
A95
Attitudinal factor
Risk perception Direction / nature of association
21e Staff going on strike
Where a risk is identified of a strike action occurring as a consequence of a serious health and safety incident, respondents are more likely to perceive that health and safety must be managed to meet the expectations of internal (staff) and external stakeholders (insurers).
22i An increase in insurance premiums
The greater the perception of risk that insurance premiums will increase as a consequence of a serious health and safety incident, the more likely it is that respondents perceive that health and safety must be managed to meet the expectations of internal (staff) and external stakeholders (insurers).
20i Business interruptions due to equipment failure, computer viruses, flooding.
Respondents who perceived a risk of business interruption due to equipment failure, are more likely to perceive the need to avoid coming to the attention of the regulator and fear that enforcement could be disruptive and damage their reputation.
21a Loss of investment from banks, shareholders, etc.
Respondents who perceived a risk that a loss of investment from banks, shareholders, etc. could occur as a consequence of a serious health and safety incident, were more likely to perceive the need to avoid coming to the attention of the regulator and fear that enforcement could be disruptive and damage their reputation
21b Our reputation would be seriously damaged
The greater the perceived risk of serious damage to the their reputation as a consequence of a serious health and safety incident, the more respondents perceive the need to avoid coming to the attention of the regulator and fear that enforcement could be disruptive and damage their reputation
13: Possible impact of enforcement on the business
21c Loss of key staff or recruitment problems
Respondents who perceive a risk of losing key staff or experiencing recruitment problems as a consequence of serious health and safety incident, are more likely to perceive a need to avoid coming to the attention of the regulator and fear that enforcement could be disruptive and damage their reputation.
A96
Attitudinal factor
Risk perception Direction / nature of association
21d Our organisation would lose contracts or customers
Respondents who perceive a risk of the organisation losing contracts or customers as a result of a serious health and safety incident, are more likely to perceive a need to avoid coming to the attention of the regulator and fear that enforcement could be disruptive and damage their reputation
21g Poor reputation in the community (local and regional)
Respondents who perceive there a risk of the company having poor reputation in the community (local or regional) as a result of a serious health and safety incident, are more likely to perceive a need to avoid coming to the attention of the regulator and fear that enforcement could be disruptive and damage their reputation
20d Injuries to members of the public/customers/patients/pupils
Respondents perception of the risk of injury to members of the public and respondents perception that they are familiar with the HSE offenders database and take account of wider social costs and benefits of health and safety varies, as per Figure 36
20g Employees being attacked or assaulted at work
The greater the perceived threat to employees of being attacked or assaulted at work, the more likely respondents are to perceive that they are familiar with the HSE offenders database and take account of wider social costs and benefits of health and safety.
20i Business interruptions due to equipment failure, computer virus, flooding
Except those that did not perceive a risk, the greater the perceived risk of business interruptions, the less likely respondents are to perceive that they are familiar with the HSE offenders database and take account of wider social costs and benefits of health and safety
14: Assessment of health and safety costs and benefits
21a Loss of investment
Except for those respondents that did not perceive a risk of loss of investment as a consequence of a serious health and safety incident, the greater the perception of a risk of a loss of investment as a consequence of serious health and safety incident, the more likely it is that respondents perceive that they are familiar with the HSE offenders database and take account of wider social costs and benefits of health and safety
A97
Attitudinal factor
Risk perception Direction / nature of association
20e Injuries/ill health amongst our staff or sub-contractors, including stress
The greater the respondents perception of risk of injury to staff and sub-contractors, the more likely they are to perceive that they interact with other employers in the same sector doing the same kind of work
15: Level of interaction between and similarity of organisations
21d Our organisation would lose contracts or customers
Regardless of the perceived risk of their organisation losing contracts or customers as a consequence of a serious health and safety incident, the less likely they are to perceive that they interact with other employers in the same sector doing the same kind of work
21g Poor reputation in the community (local, regional)
The greater the perception of risk of a company having a poor reputation, as a consequence of a serious health and safety incident, the more likely respondents are to perceive that they interact with other employers in the same sector doing the same kind of work
A98
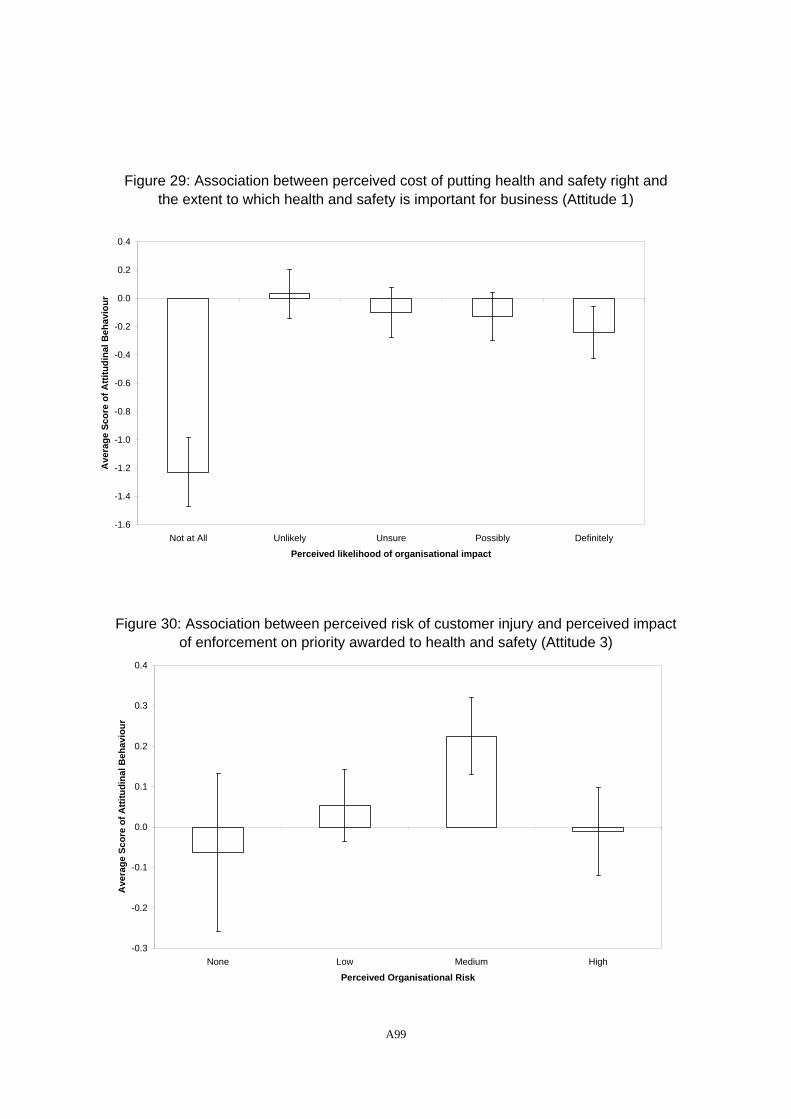
Figure 29: Association between perceived cost of putting health and safety right and the extent to which health and safety is important for business (Attitude 1)
-1.6
-1.4
-1.2
-1.0
-0.8
-0.6
-0.4
-0.2
0.0
0.2
0.4
Not at All Unlikely Unsure Possibly Definitely
Perceived likelihood of organisational impact
Ave
rage
Sco
re o
f Atti
tudi
nal B
ehav
iour
Figure 30: Association between perceived risk of customer injury and perceived impact of enforcement on priority awarded to health and safety (Attitude 3)
-0.3
-0.2
-0.1
0.0
0.1
0.2
0.3
0.4
None Low Medium High
Perceived Organisational Risk
Ave
rage
Sco
re o
f Atti
tudi
nal B
ehav
iour
A99
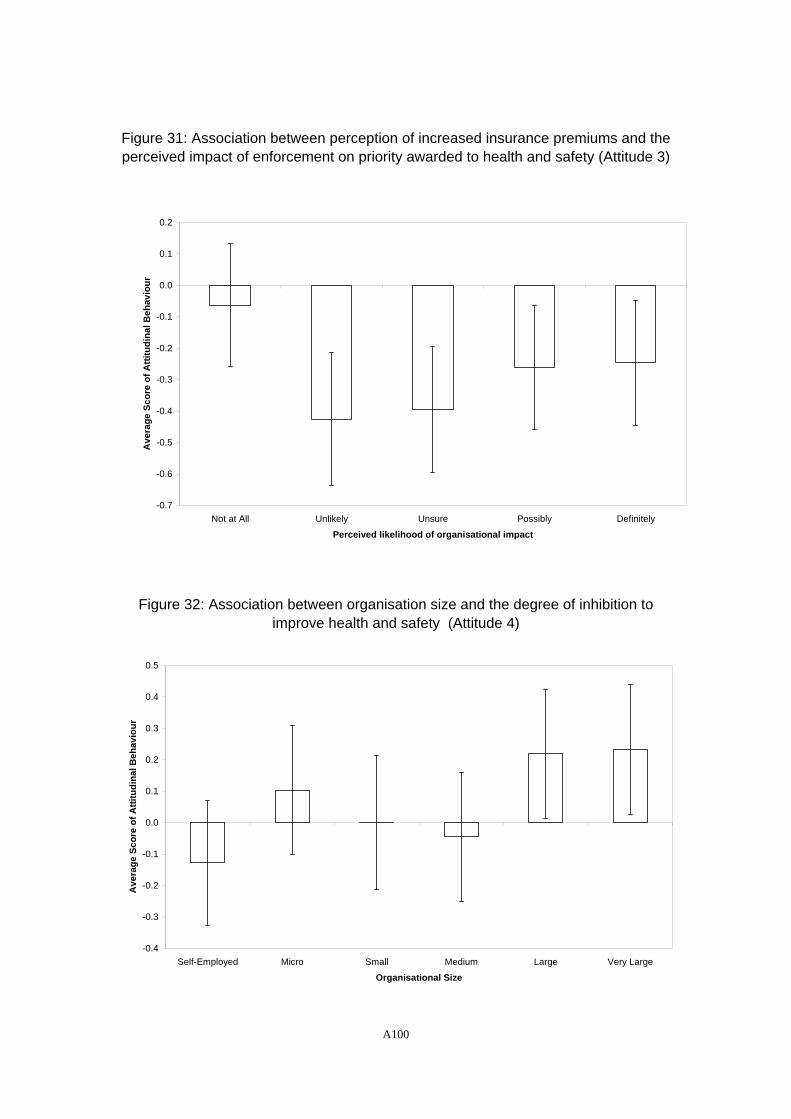
Figure 31: Association between perception of increased insurance premiums and the perceived impact of enforcement on priority awarded to health and safety (Attitude 3)
-0.7
-0.6
-0.5
-0.4
-0.3
-0.2
-0.1
0.0
0.1
0.2
Not at All Unlikely Unsure Possibly Definitely
Perceived likelihood of organisational impact
Ave
rage
Sco
re o
f Atti
tudi
nal B
ehav
iour
Figure 32: Association between organisation size and the degree of inhibition to improve health and safety (Attitude 4)
-0.4
-0.3
-0.2
-0.1
0.0
0.1
0.2
0.3
0.4
0.5
Self-Employed Micro Small Medium Large Very Large
Organisational Size
Ave
rage
Sco
re o
f Atti
tudi
nal B
ehav
iour
A100
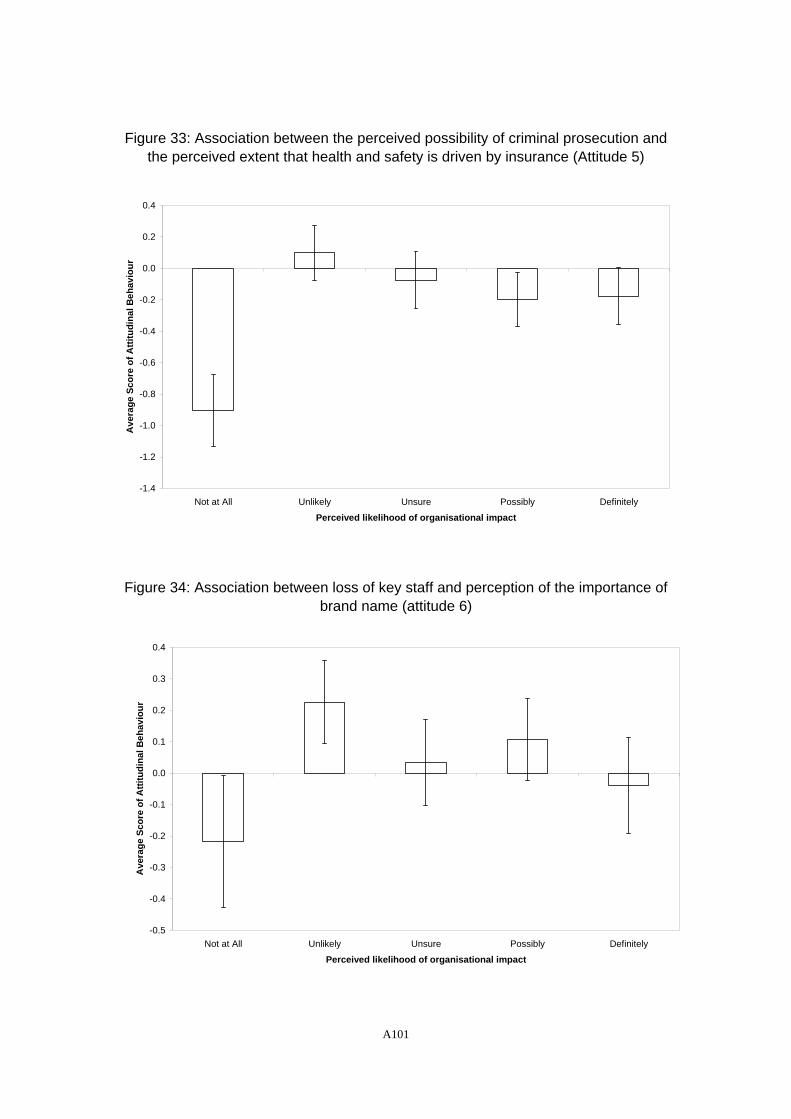
Figure 33: Association between the perceived possibility of criminal prosecution and the perceived extent that health and safety is driven by insurance (Attitude 5)
-1.4
-1.2
-1.0
-0.8
-0.6
-0.4
-0.2
0.0
0.2
0.4
Not at All Unlikely Unsure Possibly Definitely
Perceived likelihood of organisational impact
Ave
rage
Sco
re o
f Atti
tudi
nal B
ehav
iour
Figure 34: Association between loss of key staff and perception of the importance of brand name (attitude 6)
-0.5
-0.4
-0.3
-0.2
-0.1
0.0
0.1
0.2
0.3
0.4
Not at All Unlikely Unsure Possibly Definitely
Perceived likelihood of organisational impact
Ave
rage
Sco
re o
f Atti
tudi
nal B
ehav
iour
A101
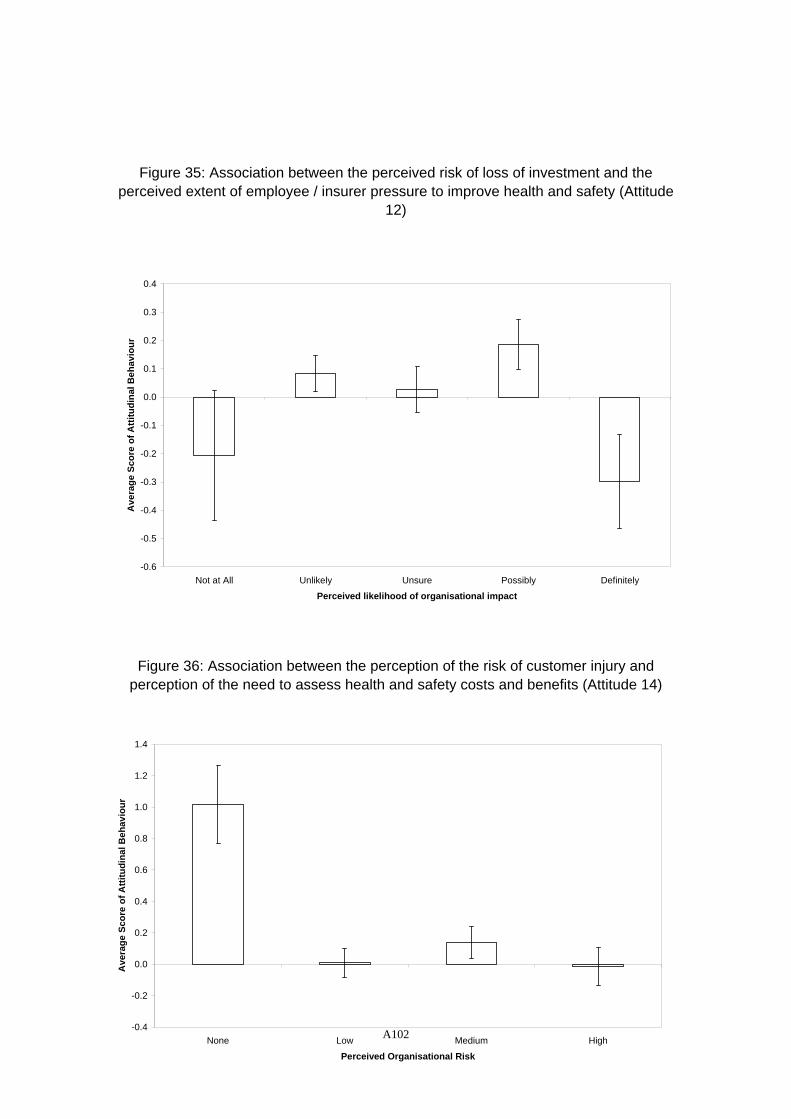
Figure 35: Association between the perceived risk of loss of investment and the perceived extent of employee / insurer pressure to improve health and safety (Attitude
12)
-0.6
-0.5
-0.4
-0.3
-0.2
-0.1
0.0
0.1
0.2
0.3
0.4
Not at All Unlikely Unsure Possibly Definitely
Perceived likelihood of organisational impact
Ave
rage
Sco
re o
f Atti
tudi
nal B
ehav
iour
Figure 36: Association between the perception of the risk of customer injury and perception of the need to assess health and safety costs and benefits (Attitude 14)
A102
-0.4
-0.2
0.0
0.2
0.4
0.6
0.8
1.0
1.2
1.4
None Low Medium High
Perceived Organisational Risk
Ave
rage
Sco
re o
f Atti
tudi
nal B
ehav
iour
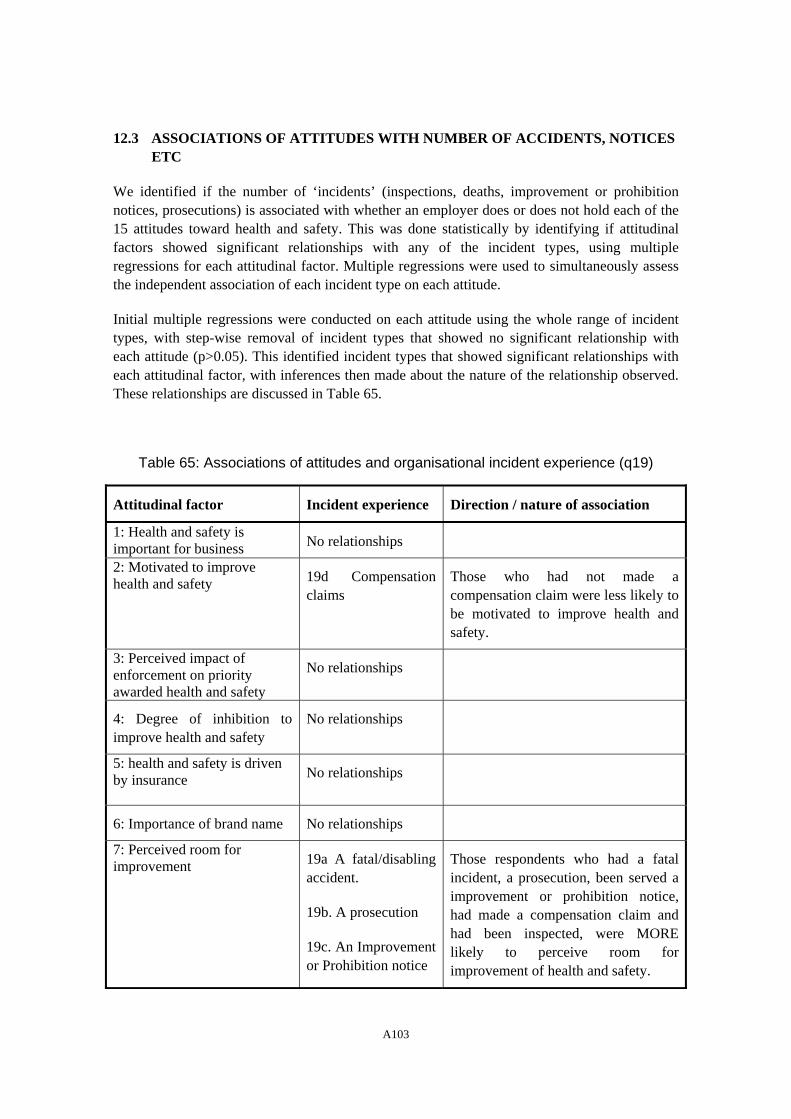
12.3 ASSOCIATIONS OF ATTITUDES WITH NUMBER OF ACCIDENTS, NOTICES ETC
We identified if the number of ‘incidents’ (inspections, deaths, improvement or prohibition notices, prosecutions) is associated with whether an employer does or does not hold each of the 15 attitudes toward health and safety. This was done statistically by identifying if attitudinal factors showed significant relationships with any of the incident types, using multiple regressions for each attitudinal factor. Multiple regressions were used to simultaneously assess the independent association of each incident type on each attitude.
Initial multiple regressions were conducted on each attitude using the whole range of incident types, with step-wise removal of incident types that showed no significant relationship with each attitude (p>0.05). This identified incident types that showed significant relationships with each attitudinal factor, with inferences then made about the nature of the relationship observed. These relationships are discussed in Table 65.
Table 65: Associations of attitudes and organisational incident experience (q19)
Attitudinal factor Incident experience Direction / nature of association
1: Health and safety is important for business No relationships
2: Motivated to improve health and safety
19d Compensation claims
Those who had not made a compensation claim were less likely to be motivated to improve health and safety.
3: Perceived impact of enforcement on priority awarded health and safety
No relationships
4: Degree of inhibition to improve health and safety
No relationships
5: health and safety is driven by insurance
No relationships
6: Importance of brand name No relationships
7: Perceived room for improvement 19a A fatal/disabling
accident.
19b. A prosecution
19c. An Improvement or Prohibition notice
Those respondents who had a fatal incident, a prosecution, been served a improvement or prohibition notice, had made a compensation claim and had been inspected, were MORE likely to perceive room for improvement of health and safety.
A103
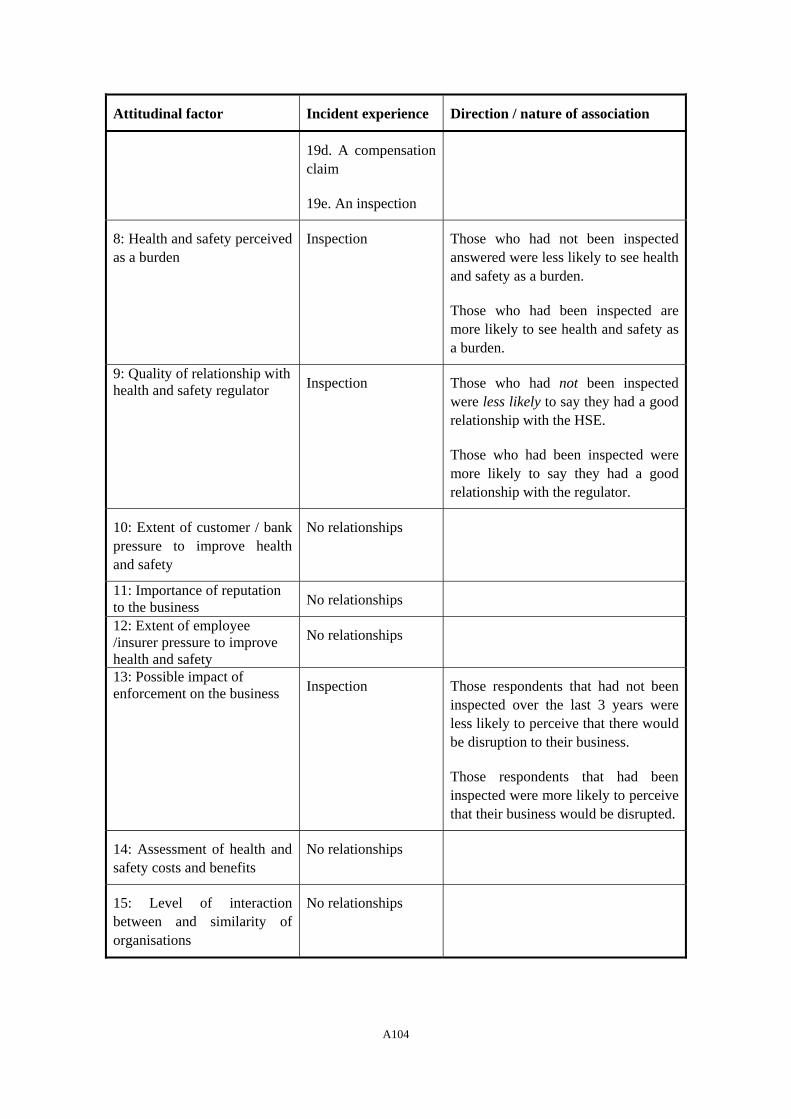
Attitudinal factor Incident experience Direction / nature of association
19d. A compensation claim
19e. An inspection
8: Health and safety perceived as a burden
Inspection Those who had not been inspected answered were less likely to see health and safety as a burden.
Those who had been inspected are more likely to see health and safety as a burden.
9: Quality of relationship with health and safety regulator
Inspection Those who had not been inspected were less likely to say they had a good relationship with the HSE.
Those who had been inspected were more likely to say they had a good relationship with the regulator.
10: Extent of customer / bank pressure to improve health and safety
No relationships
11: Importance of reputation to the business No relationships
12: Extent of employee /insurer pressure to improve health and safety
No relationships
13: Possible impact of enforcement on the business Inspection Those respondents that had not been
inspected over the last 3 years were less likely to perceive that there would be disruption to their business.
Those respondents that had been inspected were more likely to perceive that their business would be disrupted.
14: Assessment of health and safety costs and benefits
No relationships
15: Level of interaction between and similarity of organisations
No relationships
A104
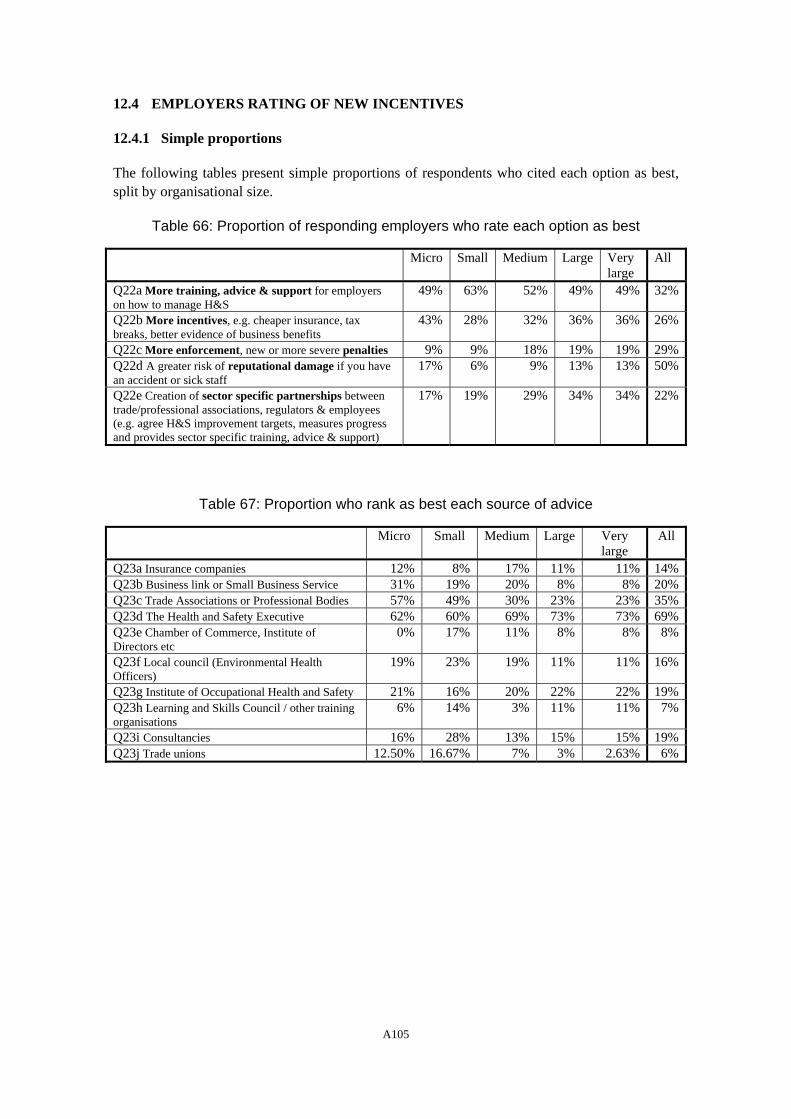
12.4 EMPLOYERS RATING OF NEW INCENTIVES
12.4.1 Simple proportions
The following tables present simple proportions of respondents who cited each option as best, split by organisational size.
Table 66: Proportion of responding employers who rate each option as best
Micro Small Medium Large Very large
All
Q22a More training, advice & support for employers on how to manage H&S
49% 63% 52% 49% 49% 32%
Q22b More incentives, e.g. cheaper insurance, tax breaks, better evidence of business benefits
43% 28% 32% 36% 36% 26%
Q22c More enforcement, new or more severe penalties 9% 9% 18% 19% 19% 29%Q22d A greater risk of reputational damage if you have an accident or sick staff
17% 6% 9% 13% 13% 50%
Q22e Creation of sector specific partnerships between trade/professional associations, regulators & employees (e.g. agree H&S improvement targets, measures progress and provides sector specific training, advice & support)
17% 19% 29% 34% 34% 22%
Table 67: Proportion who rank as best each source of advice
Micro Small Medium Large Very large
All
Q23a Insurance companies 12% 8% 17% 11% 11% 14%Q23b Business link or Small Business Service 31% 19% 20% 8% 8% 20%Q23c Trade Associations or Professional Bodies 57% 49% 30% 23% 23% 35%Q23d The Health and Safety Executive 62% 60% 69% 73% 73% 69%Q23e Chamber of Commerce, Institute of Directors etc
0% 17% 11% 8% 8% 8%
Q23f Local council (Environmental Health Officers)
19% 23% 19% 11% 11% 16%
Q23g Institute of Occupational Health and Safety 21% 16% 20% 22% 22% 19%Q23h Learning and Skills Council / other training organisations
6% 14% 3% 11% 11% 7%
Q23i Consultancies 16% 28% 13% 15% 15% 19%Q23j Trade unions 12.50% 16.67% 7% 3% 2.63% 6%
A105
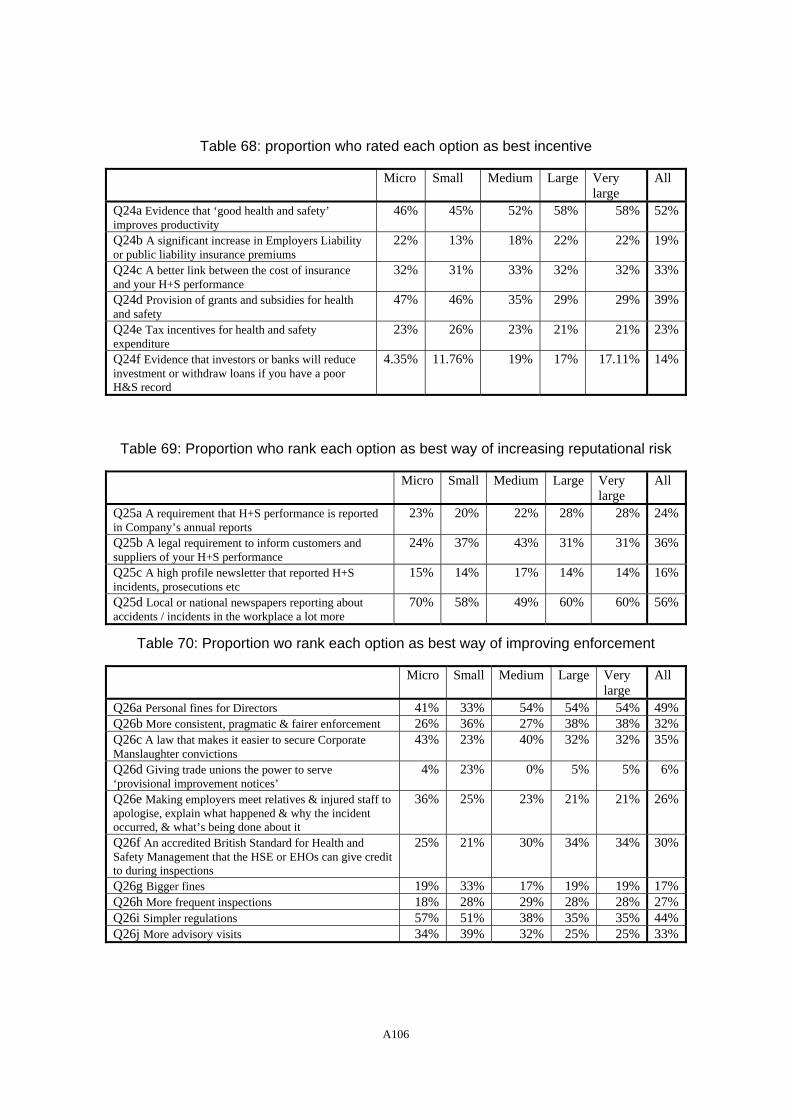
Table 68: proportion who rated each option as best incentive
Micro Small Medium Large Very large
All
Q24a Evidence that ‘good health and safety’ improves productivity
46% 45% 52% 58% 58% 52%
Q24b A significant increase in Employers Liability or public liability insurance premiums
22% 13% 18% 22% 22% 19%
Q24c A better link between the cost of insurance and your H+S performance
32% 31% 33% 32% 32% 33%
Q24d Provision of grants and subsidies for health and safety
47% 46% 35% 29% 29% 39%
Q24e Tax incentives for health and safety expenditure
23% 26% 23% 21% 21% 23%
Q24f Evidence that investors or banks will reduce investment or withdraw loans if you have a poor H&S record
4.35% 11.76% 19% 17% 17.11% 14%
Table 69: Proportion who rank each option as best way of increasing reputational risk
Micro Small Medium Large Very large
All
Q25a A requirement that H+S performance is reported in Company’s annual reports
23% 20% 22% 28% 28% 24%
Q25b A legal requirement to inform customers and suppliers of your H+S performance
24% 37% 43% 31% 31% 36%
Q25c A high profile newsletter that reported H+S incidents, prosecutions etc
15% 14% 17% 14% 14% 16%
Q25d Local or national newspapers reporting about accidents / incidents in the workplace a lot more
70% 58% 49% 60% 60% 56%
Table 70: Proportion wo rank each option as best way of improving enforcement
Micro Small Medium Large Very large
All
Q26a Personal fines for Directors 41% 33% 54% 54% 54% 49%Q26b More consistent, pragmatic & fairer enforcement 26% 36% 27% 38% 38% 32%Q26c A law that makes it easier to secure Corporate Manslaughter convictions
43% 23% 40% 32% 32% 35%
Q26d Giving trade unions the power to serve ‘provisional improvement notices’
4% 23% 0% 5% 5% 6%
Q26e Making employers meet relatives & injured staff to apologise, explain what happened & why the incident occurred, & what’s being done about it
36% 25% 23% 21% 21% 26%
Q26f An accredited British Standard for Health and Safety Management that the HSE or EHOs can give credit to during inspections
25% 21% 30% 34% 34% 30%
Q26g Bigger fines 19% 33% 17% 19% 19% 17%Q26h More frequent inspections 18% 28% 29% 28% 28% 27%Q26i Simpler regulations 57% 51% 38% 35% 35% 44%Q26j More advisory visits 34% 39% 32% 25% 25% 33%
A106
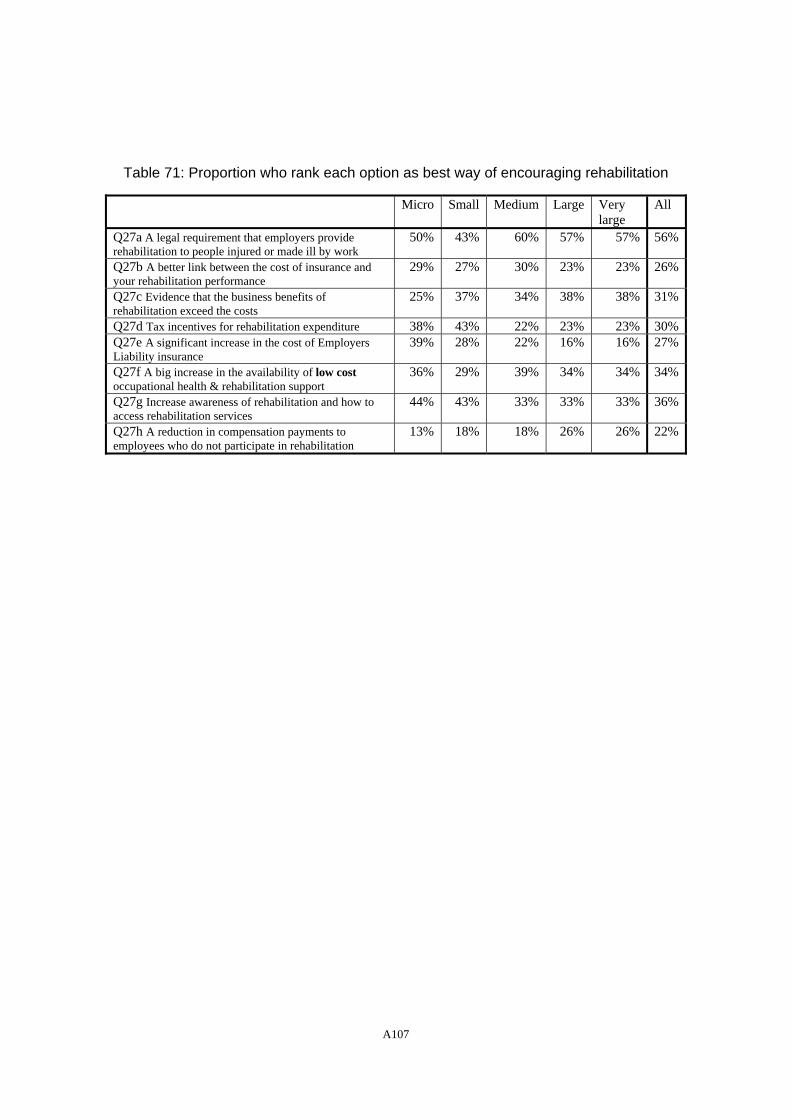
Table 71: Proportion who rank each option as best way of encouraging rehabilitation
Micro Small Medium Large Very large
All
Q27a A legal requirement that employers provide rehabilitation to people injured or made ill by work
50% 43% 60% 57% 57% 56%
Q27b A better link between the cost of insurance and your rehabilitation performance
29% 27% 30% 23% 23% 26%
Q27c Evidence that the business benefits of rehabilitation exceed the costs
25% 37% 34% 38% 38% 31%
Q27d Tax incentives for rehabilitation expenditure 38% 43% 22% 23% 23% 30%Q27e A significant increase in the cost of Employers Liability insurance
39% 28% 22% 16% 16% 27%
Q27f A big increase in the availability of low cost occupational health & rehabilitation support
36% 29% 39% 34% 34% 34%
Q27g Increase awareness of rehabilitation and how to access rehabilitation services
44% 43% 33% 33% 33% 36%
Q27h A reduction in compensation payments to employees who do not participate in rehabilitation
13% 18% 18% 26% 26% 22%
A107
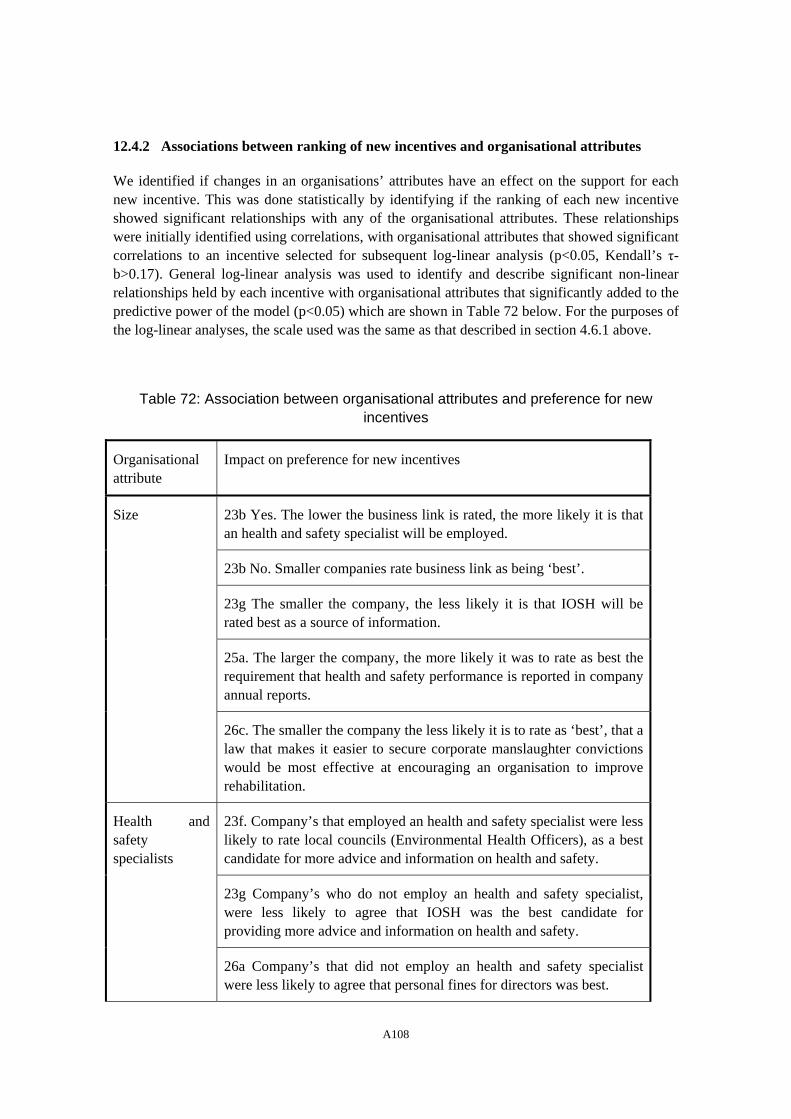
12.4.2 Associations between ranking of new incentives and organisational attributes
We identified if changes in an organisations’ attributes have an effect on the support for each new incentive. This was done statistically by identifying if the ranking of each new incentive showed significant relationships with any of the organisational attributes. These relationships were initially identified using correlations, with organisational attributes that showed significant correlations to an incentive selected for subsequent log-linear analysis (p<0.05, Kendall’s τ-b>0.17). General log-linear analysis was used to identify and describe significant non-linear relationships held by each incentive with organisational attributes that significantly added to the predictive power of the model (p<0.05) which are shown in Table 72 below. For the purposes of the log-linear analyses, the scale used was the same as that described in section 4.6.1 above.
Table 72: Association between organisational attributes and preference for new incentives
Organisational attribute
Impact on preference for new incentives
Size 23b Yes. The lower the business link is rated, the more likely it is that an health and safety specialist will be employed.
23b No. Smaller companies rate business link as being ‘best’.
23g The smaller the company, the less likely it is that IOSH will be rated best as a source of information.
25a. The larger the company, the more likely it was to rate as best the requirement that health and safety performance is reported in company annual reports.
26c. The smaller the company the less likely it is to rate as ‘best’, that a law that makes it easier to secure corporate manslaughter convictions would be most effective at encouraging an organisation to improve rehabilitation.
23f. Company’s that employed an health and safety specialist were less likely to rate local councils (Environmental Health Officers), as a best candidate for more advice and information on health and safety.
23g Company’s who do not employ an health and safety specialist, were less likely to agree that IOSH was the best candidate for providing more advice and information on health and safety.
Health and safety specialists
26a Company’s that did not employ an health and safety specialist were less likely to agree that personal fines for directors was best.
A108
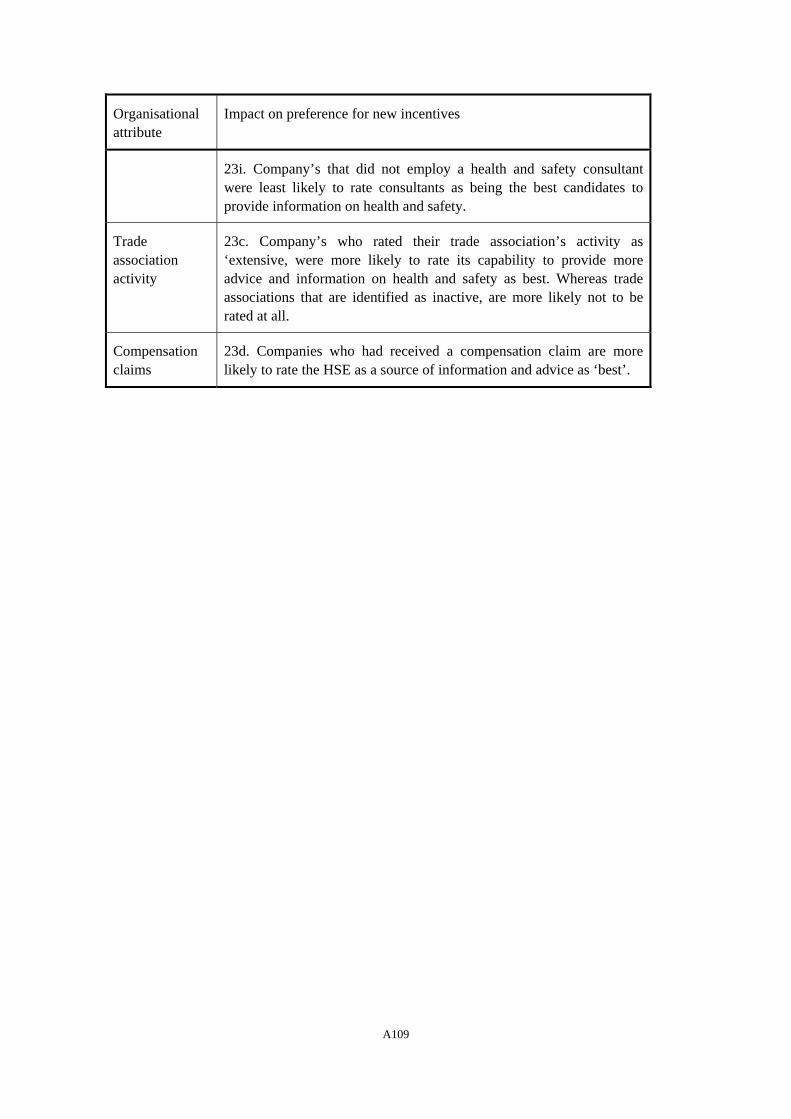
Organisational attribute
Impact on preference for new incentives
23i. Company’s that did not employ a health and safety consultant were least likely to rate consultants as being the best candidates to provide information on health and safety.
Trade association activity
23c. Company’s who rated their trade association’s activity as ‘extensive, were more likely to rate its capability to provide more advice and information on health and safety as best. Whereas trade associations that are identified as inactive, are more likely not to be rated at all.
Compensation claims
23d. Companies who had received a compensation claim are more likely to rate the HSE as a source of information and advice as ‘best’.
A109
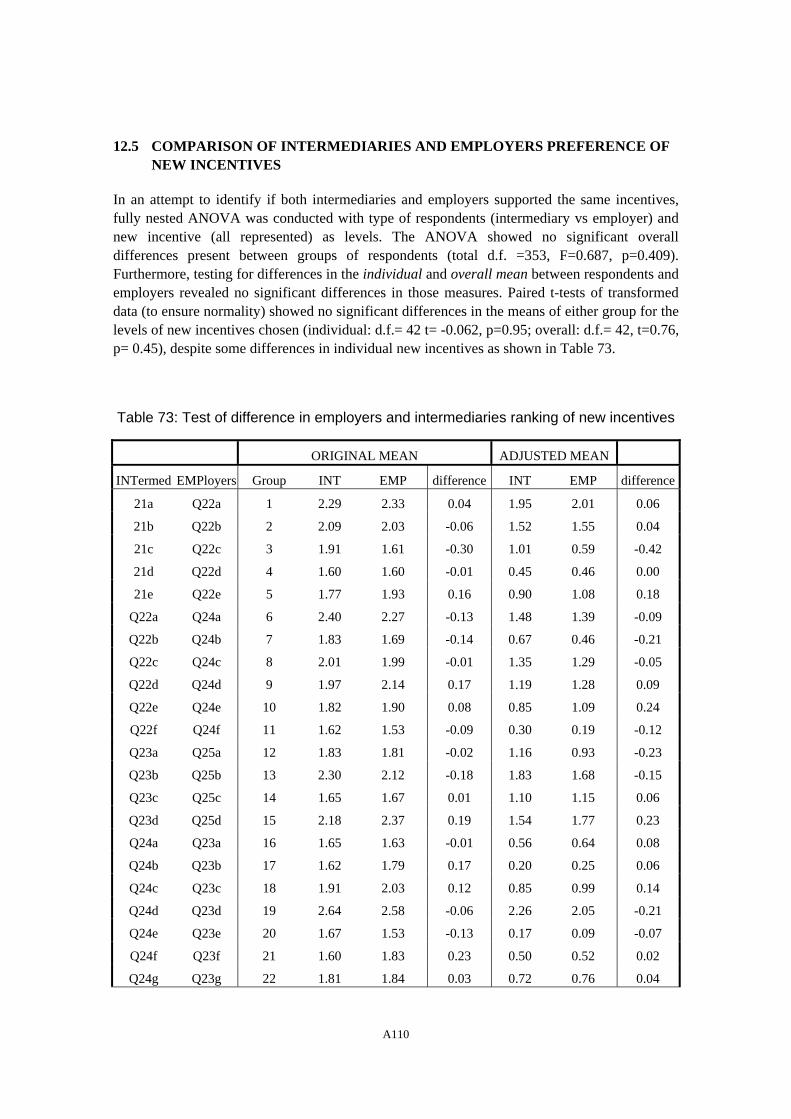
12.5 COMPARISON OF INTERMEDIARIES AND EMPLOYERS PREFERENCE OF NEW INCENTIVES
In an attempt to identify if both intermediaries and employers supported the same incentives, fully nested ANOVA was conducted with type of respondents (intermediary vs employer) and new incentive (all represented) as levels. The ANOVA showed no significant overall differences present between groups of respondents (total d.f. =353, F=0.687, p=0.409). Furthermore, testing for differences in the individual and overall mean between respondents and employers revealed no significant differences in those measures. Paired t-tests of transformed data (to ensure normality) showed no significant differences in the means of either group for the levels of new incentives chosen (individual: d.f.= 42 t= -0.062, p=0.95; overall: d.f.= 42, t=0.76, p= 0.45), despite some differences in individual new incentives as shown in Table 73.
Table 73: Test of difference in employers and intermediaries ranking of new incentives
ORIGINAL MEAN ADJUSTED MEAN
INTermed EMPloyers Group INT EMP difference INT EMP difference
21a Q22a 1 2.29 2.33 0.04 1.95 2.01 0.06
21b Q22b 2 2.09 2.03 -0.06 1.52 1.55 0.04
21c Q22c 3 1.91 1.61 -0.30 1.01 0.59 -0.42
21d Q22d 4 1.60 1.60 -0.01 0.45 0.46 0.00
21e Q22e 5 1.77 1.93 0.16 0.90 1.08 0.18
Q22a Q24a 6 2.40 2.27 -0.13 1.48 1.39 -0.09
Q22b Q24b 7 1.83 1.69 -0.14 0.67 0.46 -0.21
Q22c Q24c 8 2.01 1.99 -0.01 1.35 1.29 -0.05
Q22d Q24d 9 1.97 2.14 0.17 1.19 1.28 0.09
Q22e Q24e 10 1.82 1.90 0.08 0.85 1.09 0.24
Q22f Q24f 11 1.62 1.53 -0.09 0.30 0.19 -0.12
Q23a Q25a 12 1.83 1.81 -0.02 1.16 0.93 -0.23
Q23b Q25b 13 2.30 2.12 -0.18 1.83 1.68 -0.15
Q23c Q25c 14 1.65 1.67 0.01 1.10 1.15 0.06
Q23d Q25d 15 2.18 2.37 0.19 1.54 1.77 0.23
Q24a Q23a 16 1.65 1.63 -0.01 0.56 0.64 0.08
Q24b Q23b 17 1.62 1.79 0.17 0.20 0.25 0.06
Q24c Q23c 18 1.91 2.03 0.12 0.85 0.99 0.14
Q24d Q23d 19 2.64 2.58 -0.06 2.26 2.05 -0.21
Q24e Q23e 20 1.67 1.53 -0.13 0.17 0.09 -0.07
Q24f Q23f 21 1.60 1.83 0.23 0.50 0.52 0.02
Q24g Q23g 22 1.81 1.84 0.03 0.72 0.76 0.04
A110
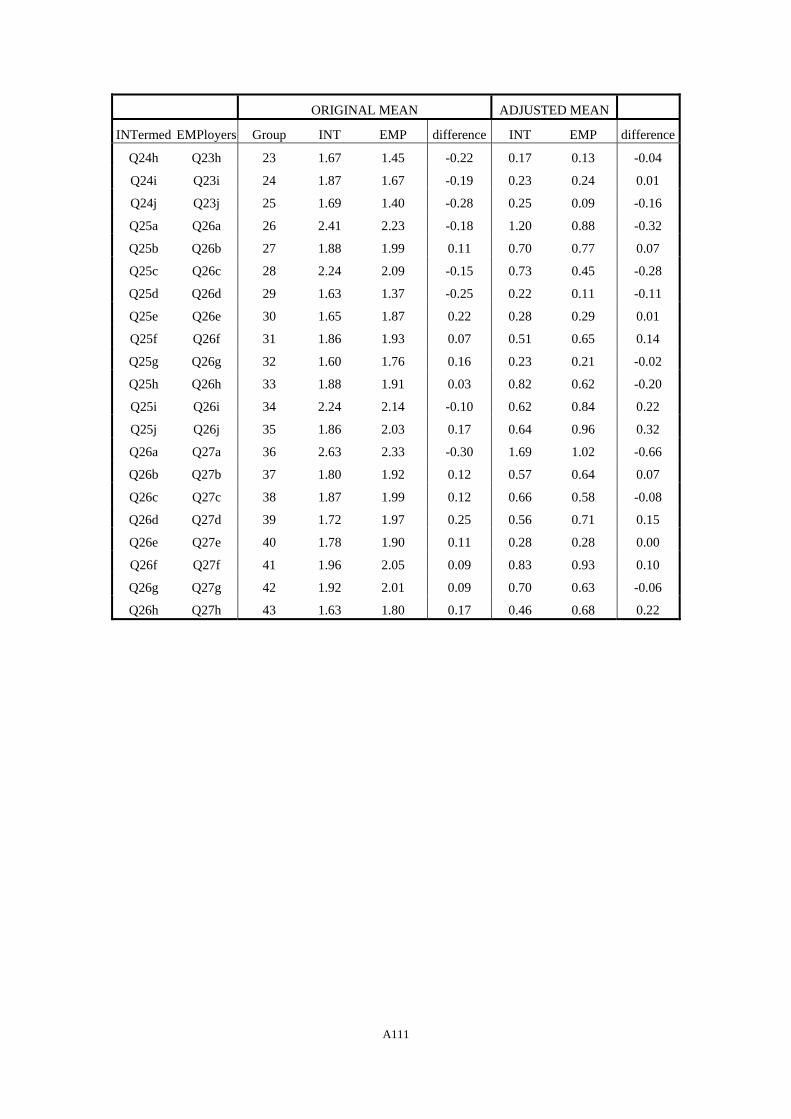
ORIGINAL MEAN ADJUSTED MEAN
INTermed EMPloyers Group INT EMP difference INT EMP difference
Q24h Q23h 23 1.67 1.45 -0.22 0.17 0.13 -0.04
Q24i Q23i 24 1.87 1.67 -0.19 0.23 0.24 0.01
Q24j Q23j 25 1.69 1.40 -0.28 0.25 0.09 -0.16
Q25a Q26a 26 2.41 2.23 -0.18 1.20 0.88 -0.32
Q25b Q26b 27 1.88 1.99 0.11 0.70 0.77 0.07
Q25c Q26c 28 2.24 2.09 -0.15 0.73 0.45 -0.28
Q25d Q26d 29 1.63 1.37 -0.25 0.22 0.11 -0.11
Q25e Q26e 30 1.65 1.87 0.22 0.28 0.29 0.01
Q25f Q26f 31 1.86 1.93 0.07 0.51 0.65 0.14
Q25g Q26g 32 1.60 1.76 0.16 0.23 0.21 -0.02
Q25h Q26h 33 1.88 1.91 0.03 0.82 0.62 -0.20
Q25i Q26i 34 2.24 2.14 -0.10 0.62 0.84 0.22
Q25j Q26j 35 1.86 2.03 0.17 0.64 0.96 0.32
Q26a Q27a 36 2.63 2.33 -0.30 1.69 1.02 -0.66
Q26b Q27b 37 1.80 1.92 0.12 0.57 0.64 0.07
Q26c Q27c 38 1.87 1.99 0.12 0.66 0.58 -0.08
Q26d Q27d 39 1.72 1.97 0.25 0.56 0.71 0.15
Q26e Q27e 40 1.78 1.90 0.11 0.28 0.28 0.00
Q26f Q27f 41 1.96 2.05 0.09 0.83 0.93 0.10
Q26g Q27g 42 1.92 2.01 0.09 0.70 0.63 -0.06
Q26h Q27h 43 1.63 1.80 0.17 0.46 0.68 0.22
A111
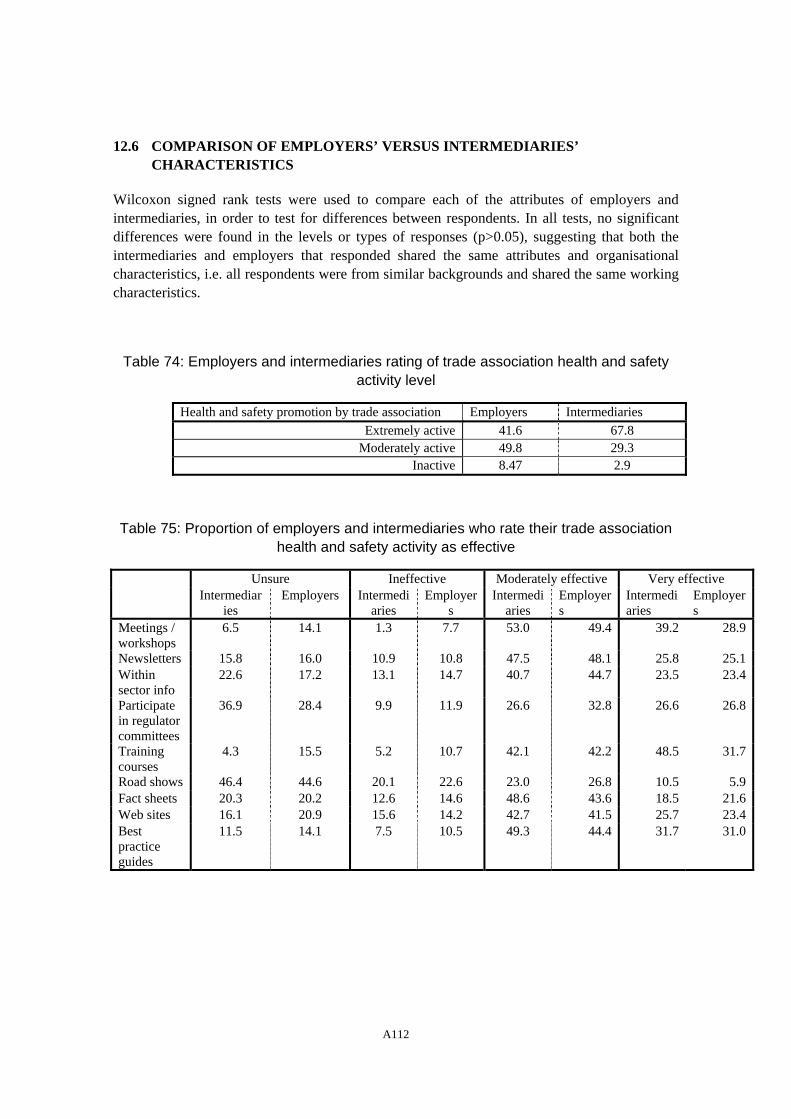
12.6 COMPARISON OF EMPLOYERS’ VERSUS INTERMEDIARIES’ CHARACTERISTICS
Wilcoxon signed rank tests were used to compare each of the attributes of employers and intermediaries, in order to test for differences between respondents. In all tests, no significant differences were found in the levels or types of responses (p>0.05), suggesting that both the intermediaries and employers that responded shared the same attributes and organisational characteristics, i.e. all respondents were from similar backgrounds and shared the same working characteristics.
Table 74: Employers and intermediaries rating of trade association health and safety activity level
Health and safety promotion by trade association Employers Intermediaries Extremely active 41.6 67.8
Moderately active 49.8 29.3 Inactive 8.47 2.9
Table 75: Proportion of employers and intermediaries who rate their trade association health and safety activity as effective
Unsure Ineffective Moderately effective Very effective Intermediar
ies Employers Intermedi
aries Employer
s Intermedi
aries Employers
Intermediaries
Employers
Meetings / workshops
6.5 14.1 1.3 7.7 53.0 49.4 39.2 28.9
Newsletters 15.8 16.0 10.9 10.8 47.5 48.1 25.8 25.1Within sector info
22.6 17.2 13.1 14.7 40.7 44.7 23.5 23.4
Participate in regulator committees
36.9 28.4 9.9 11.9 26.6 32.8 26.6 26.8
Training courses
4.3 15.5 5.2 10.7 42.1 42.2 48.5 31.7
Road shows 46.4 44.6 20.1 22.6 23.0 26.8 10.5 5.9Fact sheets 20.3 20.2 12.6 14.6 48.6 43.6 18.5 21.6Web sites 16.1 20.9 15.6 14.2 42.7 41.5 25.7 23.4Best practice guides
11.5 14.1 7.5 10.5 49.3 44.4 31.7 31.0
A112

Printed and published by the Health and Safety ExecutiveC30 1/98
Printed and published by the Health and Safety ExecutiveC1.10 03/05
RR 334
£25.00 9 78071 7 629893
ISBN 0-7176-2989-9

An e
vidence
base
d e
valu
atio
n o
f how
best to
secu
re co
mp
liance
with
health
and
safe
ty law
HS
E BO
OK
S