Embed Size (px)
Citation preview

HSEHealth & Safety
Executive
Health and well-being in the offshore environment:The management of personal health
Prepared by University of Aberdeen for the Health and Safety Executive 2005
RESEARCH REPORT 305
HSEHealth & Safety
Executive
Health and well-being in the offshore environment:The management of personal health
Kathryn Mearns and Lorraine HopeIndustrial Psychology Research Centre
University of AberdeenKings College
AberdeenAB24 2UB
The current study was conducted to examine health behaviours and health management practices onoffshore installations on the UKCS. The research was fully sponsored by Offshore Safety Division ofthe UK Health and Safety Executive and constitutes the first phase of a project to examine therelationships between the management of both safety and health in the offshore environment and thepotential outcomes for an employer of investing in workforce health.
This report and the work it describes were funded by the Health and Safety Executive (HSE). Itscontents, including any opinions and/or conclusions expressed, are those of the authors alone and donot necessarily reflect HSE policy.
HSE BOOKS
ii
© Crown copyright 2005
First published 2005
ISBN 0 7176 2993 7
All rights reserved. No part of this publication may bereproduced, stored in a retrieval system, or transmitted inany form or by any means (electronic, mechanical,photocopying, recording or otherwise) without the priorwritten permission of the copyright owner.
Applications for reproduction should be made in writing to: Licensing Division, Her Majesty's Stationery Office, St Clements House, 2-16 Colegate, Norwich NR3 1BQ or by e-mail to [email protected]
EXECUTIVE SUMMARY
Introduction The current study was conducted to examine health behaviours and health management practices on offshore installations on the UKCS. The research was fully sponsored by Offshore Safety Division of the UK Health and Safety Executive and constitutes the first phase of a project to examine the relationships between the management of both safety and health in the offshore environment and the potential outcomes for an employer of investing in workforce health. Previous findings indicated that the positive management of health promotion and health surveillance activities offshore was associated with lower lost time injury rates (Mearns et al., 2000). The current research project aimed to examine health promotion and health surveillance activities in greater detail and specifically, address the following research questions concerned with the potential relationships between health management and the overall safety and well-being of the offshore worker. • Research Question I: Do healthy employees cope better in the offshore environment? This research question sought to address the extent to which good health habits foster the ability to cope with working and living offshore. In other words, examine whether engaging in personal health and fitness management is associated with a perceived increase in ability to cope both physically and psychologically with the offshore working environment? • Research Question II: Does investment in employee health foster perceptions of company
commitment and build worker loyalty in areas such as safety? Is increased investment in health promotion and surveillance perceived to be indicative of higher levels of management commitment to the workforce and, if so, what is the effect of this additional investment? • Research Question III: Are positive health management practices also associated with
good risk assessments? It may simply be the case that an installation proficient in the management of occupational health issues will also be good at accident risk assessment. Until recently, research focussing on safety performance and behaviour within organisations has typically attempted to identify the individual level factors underpinning accidents and injuries in the workplace. However, emphasis on these individual level factors has shifted towards a focus on the impact of various organizational factors. The current research focuses on the impact of positive management of workforce health as an organizational factor. Since safety has traditionally taken precedence over health affairs, it is likely that many organisations have now reached a developmental stage where the health of their workforce is becoming increasingly important and they perceive the need to re-dress the balance for a ‘Health’ and ‘Safety’ culture in equilibrium.
iii
Sample and Method
This study was carried out in three stages. The initial phase involved the development of the Health at Work questionnaire; the second phase involved the piloting and revision of the questionnaire while questionnaire deployment to all participating installations comprised the final phase. The Health at Work 2003 questionnaire underwent extensive development and the final questionnaire comprised seven sections designed to elicit the following information: • Perceived impact of factors present in the offshore environment on worker health • Experience of and satisfaction with the management of occupational health risks • Personal health management and goals • Perceived colleague and organizational support • Health promotion activities in the workplace • Perception of health and safety climate • Risk taking behaviour • Worksite commitment Throughout the questionnaire, respondents were also invited to record more detailed comments on specific issues relating to their experiences and the management of health and safety offshore. Medical personnel on participating installations were also required to complete a comprehensive questionnaire. The main purpose of this questionnaire was to assess the role of the medic in relation to health promotion and training available in the workplace. This questionnaire also allowed the collection of other relevant information relating to the role and background of the medic in addition to their perceptions of their role. Finally, this questionnaire also allowed for the collation of other data relating to illness and injuries, health surveillance and participation in health award schemes. A total of 2,199 completed questionnaires were collected from 41 UK offshore installations operating on the UK Continental Shelf. Installations with a response rate lower than 30% were excluded from further analysis. Consequently, 1,928 completed questionnaires from 31 installations (nine different organisations) were available for analysis. Statistical methods included analysis of variance (ANOVA) with post-hoc testing to distinguish between installations, chi-square and correlational analyses to determine associations between selected variables Results The report describes the initial pattern of results for all participating installations on all questionnaire items, constituting a significant data bank for future reference purposes. Key findings are summarised briefly below: Descriptive Findings • Respondents identified heavy smoking while offshore, fatigue due to shift work and stress
about work as the factors most affecting their health in the offshore environment. 54% went on to indicate that they experienced feeling under stress or pressure ‘a few times during each trip’ but the majority of respondents believed they coped well with the stress
iv
they experienced. Less than a quarter of respondents indicated that they had received some degree of support on their installation to help them cope with stress experienced in the workplace.
• Despite satisfaction with the management of health risks, a closer examination of hand-held power tool users indicated that only 8% of regular users and 10% of occasional users had been checked for vibration white finger and associated conditions. 62% of users indicated that they were familiar with the symptoms of VWF with disparity between installations perhaps reflecting the different activities engaged in by different installations. Similarly, 64% indicated exposure to chemicals with 29% receiving a health check in relation to this exposure.
• Training levels for occupational health issues such as manual handling, noise, safe use of tools, HAVS, correct use of PPE etc were reasonably high across the sample. However, approximately one-quarter of respondents had not received training in areas they believed would be useful to them given the health risks faced in their work.
• In terms of their personal health, the majority believed themselves to be in good health although, based on self-report height and weight data, 52% returned a BMI score in the overweight category with a further 12% falling into the obese category. There was a profile of increasing weight with age. 49% indicated that they find it difficult to eat a healthy diet offshore.
• 36% of the sample reported recurring muscular pain (mostly in the lower back). 67% indicated that their work offshore can exacerbate this pain but only 38% acknowledged that they have received support/advice on their installation to help them reduce or manage this pain.
• A majority of respondents believed they could rely on support from their colleagues if they were trying to improve their health – although the perceived support available from this source varied considerably by installation.
• 28% have asked the medic for advice regarding their general health or fitness and 45% have received unsolicited advice from the medic with regard to the management of their personal health or fitness. However, approximately 20% of respondents indicated that they have felt ill while offshore but chose not to report to the medic in order to avoid an onshore referral.
• While a majority of respondents felt that the company values and is concerned about the health of the workforce, there was evidence of uncertainty that management is committed to improving employee health. Scores on the Organisation Health Orientation scale varied considerably between installations. Similarly scores on Health and Safety climate measures varied considerably between installations, reflecting more and less positive climates on-board.
• The commitment of the workforce to their workplace varied between installations. Overall, there was evidence of positive commitment to the organisation by the workforce with a high degree of willingness to work hard to ensure the success of the installation they work on.
Testing Hypotheses • Research Question I: Do healthy employees cope better in the offshore environment? A new index (known as the Health Behaviour Index or HBI) was developed to identify health-oriented individuals from reported health behaviour data. Scores were derived such that higher HBI scores reflected more positive health behaviours. Results suggest that high scorers on the health behaviour index – in other words, those individuals who most carefully manage their health in terms of personal behaviour choices – differ in several interesting ways from those
v
individuals who pay less attention to their personal health. The key findings are summarized below: • There was an age related decrease in positive health behaviours suggesting that future
health promotion activities should perhaps focus on the middle-aged to older members of the workforce.
• Supervisors reported an overall higher frequency of experiencing stress in the workplace but did not differ in their rated ability to cope with this stress from respondents who reported lower levels of stress. The reported frequency or ability to cope with stress did not appear to be associated with scores on the Health Behaviour Index.
• 36% of respondents reported that they experience a recurring muscular pain. Individuals returning a high HBI score reported a lower instance of muscular pain than low HBI scorers. There was no evidence to suggest that muscular pain was associated with increasing age within this sample.
• High HBI scorers rated their health more positively than low HBI scorers and also reported a more positive perception of the health climate on the installation. High HBI scorers also appeared to benefit from a network of colleagues who supported their health behaviours.
• Although HBI scores were not associated with the self-reported accident rate, results suggest that high HBI scorers take fewer risks, for example, they report less likelihood of taking short cuts to get the job done and are more likely to follow procedures.
• Smoking habits were examined as a feature of personal health behaviour. 32% of the sample reported that they were smokers while 27% indicated that they had smoked previously but have now quit the habit.
• Replicating previous finding in the literature, smoking was significantly associated with the self-reported accident rate with smokers returning a higher rate of accidents.
Thus, there was some support within the current data for the hypotheses that health conscious individuals perform better in the offshore environment than those who do not focus as strongly on personal health behaviour. • Research Question II: Does investment in employee health foster perceptions of company
commitment and build worker loyalty in areas such as safety? With respect to documenting actual levels of investment, it became apparent in the early stages of the project that the installations involved would not be able to provide an indication of their health investment in financial terms as various facets of this budget were subsumed into general operational costs. Therefore, to estimate a general measure of the status of occupational health activities on an installation a new index was developed. This index, termed the Health Management Index (HMI), derived a composite score relating to health management activities from objective data supplied by the medic. These health management activities were considered to be an indicator of investment. Responses were calibrated such that an overall low score on the HMI indicated a low level of commitment/investment in workforce health, according to our measures. In other words, an installation returning a low score on this index is likely to offer less in terms of additional health management activities or is less likely to have focused investment in this area. Conversely, a higher score on this index can be achieved by installations committed to the improvement of employee health and/or who have elected to focus on occupational health as a matter of course on that installation.
vi
The results obtained using the Health Management Index are clear-cut. Individuals on installations where occupational health has received only low levels of attention in terms of organizational investment and/or management input performed significantly worse on a number of unrelated measures of climate and commitment when compared to installations where investment in, and management of, occupational health has been accorded more importance. • Research Question III: Are positive health management practices also associated with
good risk assessments? Again, there was evidence of support for the current hypothesis. The most compelling evidence to support the notion that positive health management practice is associated with good risk assessment is a significant association between individual involvement in risk assessment and HMI status with individuals on high HMI installations significantly more likely to have been involved in carrying out risk assessments to do with their work. Conclusions The findings of the current study indicate interesting differences in broader organizational climate between installations where organizational level commitment (in terms of time, resources as indicators of investment) has been made in respect of workforce health issues and those worksites where workforce health has been emphasized to a lesser degree. Although the data cannot implicate specific causal mechanisms, these results suggest that the health improvement outcomes typically (and intuitively) associated with investment in workforce health may not be the only benefits an employer could anticipate following investment in worksite health initiatives. RECOMMENDATIONS The findings of this research suggests that organisations should look beyond the health-related costs when determining commitment to workforce health given the potential of positive knock-on effects of reduced risk-taking and improved workforce commitment. The following recommendations take into account the practices of high performing worksites and as such constitute best practice as determined within the current study. • Management & Investment in Offshore Medical Personnel The findings clearly indicate that the installation medic plays a pivotal role in the management of workforce health and where the medic has the support of the organisation the effectiveness of the medic in this role is greatly enhanced to the benefit of the organisation. Support might be provided in terms of training, resources, investment and release from ancillary duties unrelated to health management. • Personal Health Management Offshore While the management of personal health is in some respects an individual responsibility, the research identified a number of ways in which an organisation might support the workforce in the maintenance and improvement of personal health. The facilitation of personal health improvement is an important factor for a workforce situated in a remote location. The findings of the study suggest that the provision of reasonable exercise facilities, flexible galley hours, gym instruction, individual dietary advice and healthy options at meal times would be extremely beneficial to the workforce. The results also indicated that a significant proportion of the
vii
workforce experience musculoskeletal pain. Given the potential interaction of this pain with work tasks, greater levels of support and intervention at the worksite are necessary. • Occupational Health Management Offshore The findings indicate that, for many occupational health issues, greater levels of workforce training are required. In particular, training would appear to be required in relation to risks from vibration tools, the proper use of PPE, avoiding work-related skin conditions and the management of work-related stress. Concluding Remarks Overall, our findings suggest that much beneficial work pertaining to the management of workforce health is underway on many of the participating installations. However, many worksites have a long way to go in terms of basic health management practices. We appreciate the commercial realities of the offshore oil and gas industry – particularly for smaller operators. Nonetheless, the industry drive for improved safety must take account of the current finding that investment in workforce health would appear to be associated with broader organizational improvement in the form of greater workforce commitment and reduced risk-taking behaviour.
viii
TABLE OF CONTENTS 1 INTRODUCTION .................................................................................................................................4 1.1 Background & Objectives ...............................................................................................................4 1.2 Introducing Health and Safety .......................................................................................................4 1.3 Defining Health Promotion and Surveillance...............................................................................5 1.4 Introducing Worksite Health Promotion........................................................................................6 1.5 Health Promotion in the United States .........................................................................................6 1.6 Outcomes of a Worksite Health Promotion Programme ...........................................................8 1.7 The Cost of Occupational Ill-Health in the UK.............................................................................8 1.8 Theoretical Frameworks in Worksite Health Promotion ............................................................9 1.9 Introduction to Health Surveillance .............................................................................................10 1.10 Health and the Offshore Workforce ............................................................................................11 1.11 Health Promotion and Safety .......................................................................................................16 1.12 Health Promotion, Individual Behaviour and Safety.................................................................18 2 RESEARCH METHOD .....................................................................................................................20 2.1 Overview .........................................................................................................................................20 2.2 Description of the Health at Work Questionnaire .....................................................................21 2.3 Development of the Health at Work Questionnaire for Medics ..............................................26 2.4 Description of the Questionnaire for Medics .............................................................................26 2.5 Summary.........................................................................................................................................28 3 RESULTS I: INITIAL ANALYSIS ...................................................................................................29 3.1 Installation types, sample size and response rates..................................................................29 3.2 Demographic information .............................................................................................................30 3.3 Accident Rates ...............................................................................................................................33 3.4 Factors perceived to affect personal health ..............................................................................33 3.5 Self-reported Occurrence of Stress & Pressure at Work.........................................................34 3.6 Stress: Support & Coping in the Workplace ..............................................................................35 3.7 Risk: Management Concern & Employee Involvement ...........................................................36 3.8 Use of Powered Hand Tools ........................................................................................................37 3.9 Exposure to Chemicals .................................................................................................................38 3.10 Control of Exposure to Chemicals, Noise & Vibration Tools...................................................39 3.11 Problems with PPE........................................................................................................................40 3.12 Workforce Training ........................................................................................................................40 3.13 Personal Health .............................................................................................................................42
1
3.14 Smoking Behaviour .......................................................................................................................43 3.15 Alcohol Consumption ....................................................................................................................44 3.16 Physical Activity .............................................................................................................................44 3.17 Health Improvement Goals ..........................................................................................................45 3.18 Muscular Pain.................................................................................................................................46 3.19 Co-worker Support for Healthy Behaviour .................................................................................47 3.20 Organisation Health Orientation ..................................................................................................49 3.21 Health Promotion in the Workplace ............................................................................................50 3.22 Health and Safety Climate Scale ................................................................................................51 3.23 Risk Taking Behaviour ..................................................................................................................55 3.25 Workplace Commitment ...............................................................................................................56 4 RESULTS II MEDIC QUESTIONNAIRE........................................................................................60 4.1 Demographics and Experience ...................................................................................................60 4.2 Illness & Injury Records ................................................................................................................60 4.3 Health Surveillance .......................................................................................................................61 4.4 Health Education & Promotion ....................................................................................................61 4.5 Evaluation of Health Promotion Activities ..................................................................................63 5 RESULTS III: ADDRESSING RESEARCH QUESTIONS .........................................................65 5.1 Overview .........................................................................................................................................65 5.2 Data Coding and Analysis ............................................................................................................65 5.3 Research Question I: Profiling health conscious employees.................................................67 5.4 Research Question II: Investment in Occupational Health ....................................................74 5.5 Profiling Low & High HMI Installations .......................................................................................80 5.5 Research Question III: Occupational health management & risk assessment ...................85 6 QUALITATIVE RESPONSES..........................................................................................................86 6.1 Diet & Eating Habits Offshore......................................................................................................86 6.1.1 Problems associated with cooking methods......................................................................................86 6.1.2 Food-related concerns .......................................................................................................................87 6.1.3 Personal Failing.................................................................................................................................89 6.1.4. Organizational Factors .....................................................................................................................89 6.2 Improving personal health offshore ............................................................................................92 6.2.1 Personal health issues........................................................................................................................92 6.2.2 Occupational Health..........................................................................................................................94 6.2.3 Installation Facilities .........................................................................................................................95 6.2.4. Organizational Factors .....................................................................................................................96 7 OVERALL SUMMARY & GENERAL DISCUSSION..................................................................100 7.1 Personal Health Management Offshore...................................................................................100 7.2 Workplace Health Management Offshore................................................................................101
2

7.3 Investing in Workplace Health Offshore...................................................................................103 9 CONCLUSIONS & RECOMMENDATIONS ................................................................................107 9.1 Management & Investment in Offshore Medical Personnel..................................................107 9.2 Personal Health Management Offshore...................................................................................108 9.3 Occupational Health Management Offshore ...........................................................................109 9.4 Concluding Remarks ...................................................................................................................110
3
1 INTRODUCTION 1.1 Background & Objectives The current project was designed to investigate the impact of health promotion and health surveillance activities on the safety and well-being of the offshore worker on the UKCS. The study was fully sponsored by Offshore Safety Division of the UK Health and Safety Executive. We wish to acknowledge the participation of the following nine organisations in the current research: Agip (UK) Limited, Amerada Hess Limited, BG Group, BP plc, ConocoPhillips UK Limited, Diamond Offshore Drilling (UK) Limited, Global Santa Fe, Marathon Oil UK Limited and Transocean SedcoForex. This study represents the first phase of an ongoing study to examine the management of health offshore and associated benefits for safety and well-being offshore. The overall aim of the research is to explore the importance of both health and safety management in the operation of a safe installation and determine the organizational benefits of positive health management initiatives. A secondary aim was to gather information from the offshore workforce regarding their perceptions of their health and well-being in relation to both personal and occupational health matters. Gaining an insight of these viewpoints and a baseline indication of current health practices at worksites on the UKCS should prove beneficial for future initiatives relating to the management of health in the offshore environment. The first section of this report reviews the relevant literature in order to bring together knowledge from the worksite health promotion, health surveillance and safety domains and aims to tailor this information for the specific needs of the offshore oil and gas industry. 1.2 Introducing Health and Safety The role of organizational climate in determining how employees evaluate and respond to their work environment is well established (James & James, 1989). Work environment dimensions evaluated by employees can include communication and leadership or more specifically, the climate for ‘customer service’ or the climate for ‘safety’. Since Zohar’s seminal paper on the topic in 1980, interest in the concept of safety climate has burgeoned, due mainly to a growing focus on the related concept of safety culture by industry and regulators alike. The number of dimensions of safety climate remains disputed, although recurring themes across safety climate surveys include management commitment, supervisor competence, priority of safety over production, and time pressure (Flin, Mearns, O’Connor & Bryden, 2000). Elements of safety climate emerge as predictors of unsafe behaviour or accidents in numerous structural models (Cheyne, Tomas, Cox & Oliver, 1999; Thompson, Hilton & Witt, 1998; Tomas, Melia & Oliver, 1999), and it is becoming accepted that a favourable safety climate is an essential component for safe operation. What is less clear are which antecedent factors promote a favourable climate. This issue is important because of the implications for intervention strategies. An aspect that may well promote a favourable ‘safety’ climate is the way in which health and safety is managed within the organisation. The safety management of an organisation has been defined as “the organizational structure, responsibilities, practices, procedures, processes, and resources for determining and implementing the major-accident prevention policy” (European Council Directive 92/82/EC), although one might want to broaden the scope to safety outcomes that include near misses and personal accidents. Measuring and understanding both safety climate and safety management practices may enable organisations to detect potential safety failings before they become realised as accidents and incidents, a process termed ‘safety-condition monitoring (Flin, 1998).
4
It is interesting to note that the rapidly growing literature in the field of ‘safety culture’ or ‘safety climate’, makes little, if any, reference to the concept of ‘health’, despite the fact that many organizations run HSE (Health, Safety and Environment) or HSEQ (Health, Safety, Environment and Quality) departments. The omission of the terms ‘health’ or ‘environment’ in the safety culture literature clearly derives from the fact that the concept was coined in response to major accidents and disasters that arose due to safety failings (Sheen, 1987; Cullen, 1990). However, if organisations are to promote and develop climates (or cultures) in which the quality of life and the well being of their workforces are paramount, attention needs to be broadened to incorporate elements of both health and the environment. The safety climate research has also tended to avoid the issue of ‘health’ in the development of scales associated with both individual accident involvement and good health and safety practice, with some notable exceptions (see later in this review). This is somewhat surprising because intuitively one would expect employees’ perceptions of a positive climate at work to be affected by the emphasis placed on their health and their environment, as well as their safety. It is the objective of the current study to determine the extent to which health and safety are related in the minds of offshore industry employees, and also to understand the mechanisms by which attitudes and perceptions about health may be linked to outcome measures such as accident involvement.
1.3 Defining Health Promotion and Surveillance Just as occupational health and safety encapsulate quite distinct yet intrinsically related concepts, health promotion and health surveillance share a similar association. In the same way as occupational safety is monitored, regulated and typically given precedence over more general occupational health concerns, worksite health surveillance also lies within a more legalistic framework and is far more likely to be monitored, evaluated and regulated than health promotion activities in the workplace. Certainly, it might be argued that health in the broadest sense within an occupational context is reliant on safe behaviour and adherence to safety procedures to avoid accidents and injury. It may also be the case that the effective promotion of good health practices more generally stems from proficient risk assessment systems and a more global approach to health than one which is based solely on the risks inherent in a particular task or role. In others words, successful health surveillance in the workplace might well incorporate a more holistic approach to the health of the workforce and enhance opportunities for the early detection and identification of risks for potential health problems in the future. The current project seeks to investigate the individual contributions of both health promotion and health surveillance activities to both the safety and general well-being of the offshore workforce. Links between health promotion activities and health surveillance procedures will also be examined to determine whether companies with a good record of risk assessment and attendant health surveillance procedures also display a more general concern for the well-being of the workforce. It may be the case that this dual approach to health serves improved health and safety performance. Throughout the project, the term ‘health surveillance’ will be used in relation to activities or procedures carried out, usually in accordance with legal requirements, to identify and monitor specific occupational risks and the health conditions ordinarily associated with these risks. The term ‘health promotion’ will typically refer to voluntary programmes instigated in the workplace to effect changes in non-occupational health behaviours such as smoking, weight loss and personal fitness. A wide variety of programmes typically fall under the health promotion umbrella. Thus, consistent with the existing literature (e.g. Fielding, 1984; Mudrack, 1992) worksite health promotion will refer to any health improving activities initiated by a workplace programme but unrelated to the occupational activity of that workplace. Finally, the concept of disease prevention falls between health surveillance and
5
health promotion. Given the lag between exposure to risk and the biological manifestation of the symptoms of many diseases, disease prevention programmes may or may not embody an occupational element. For instance a particular combination of both occupational and non-occupational risk factors might increase the likelihood that particular diseases develop in the future. Therefore, both a health surveillance programme and/or a health promotion programme might also incorporate elements of disease prevention and more general health monitoring or screening.
1.4 Introducing Worksite Health Promotion The growth of health promotion programmes in the workplace is well documented. The importance of this setting for the promotion of good health has been explicitly identified by the World Health Organisation (WHO, 1991, 1997), by the recent government Green Paper Our Healthier Nation (Department of Health, 1998) and subsequent White Paper Saving Lives: Our Healthier Nation (Saving Lives: Our Healthier Nation, 1999). At its most basic level, health promotion can be defined as “a combination of diagnostic, educational and behaviour modification activities designed to support the attainment and maintenance of positive health” (Matteson & Ivancevich, 1988, p.280). This global definition also holds in the workplace where the health promotion activities are instigated, supported and financed by the employer (Everly & Feldman, 1984; Fielding, 1984; Terborg, 1986; Matteson & Ivancevich, 1988). Employers may instigate a health promotion programme for any number of reasons ranging from the maintenance of good public or employee relations to the embracing of a holistic approach to the productivity of their workforce. Alternatively, it may be that certain health promotion activities are legislatively mandated to ensure the well-being of employees as is the case in Norway and Sweden. The implementation of such programmes may also be for purely economic reasons with many companies, particularly in the United States, introducing health promotion programmes in an attempt to curb increasing healthcare costs. 1.5 Health Promotion in the United States The literature on workplace health promotion is extensive with the United States leading the field in the initiation, implementation and evaluation of such programmes. A review of this literature would appear to indicate substantial benefits to employers of health promotion activities in the workplace. Health promotion programmes have been associated with “decreased costs for employers for health claims, inpatient hospital costs, admissions, hospital days, outpatient costs, absenteeism and life insurance costs” (Forrester, Weaver, Brown, Phillips and Hilyer, 1996). Furthermore, according to Mudrack (1992) companies also anticipate additional tangible benefits when committing to health promotion activities. These benefits may include improvements such as reduced stress levels, increased worker satisfaction, less absenteeism and lower staff turnover (Falkenberg, 1987; Hoffman & Hobson, 1984; Kondrasuk, 1984). Certainly there are a number of reports indicating wide-ranging benefits of health promotion programmes and while many of these studies are beset with particular methodological flaws (see Fielding, 1982 for a review and critique) the findings are nonetheless encouraging. In terms of a costs-benefits analysis, several studies have reported positively as to the efficacy of smoking cessation projects (e.g. Fielding, 1982; Pelletier, 1984) and also hypertension reduction programmes (Logan, Milne, Achber, Campbell & Haynes, 1981). Fitness programmes have also been posited to reduce healthcare costs. For instance, a controlled study of a six-month aerobic fitness programme conducted in a Canadian insurance company demonstrated a 42% decrease in average monthly absenteeism following in the intervention. Further, fitness participants displayed a ten-month turnover rate of 1.5% as opposed to 15% for other company employees (Cox, Shepherd & Corey, 1981). These effects on absenteeism and turnover are relatively well documented (see Aldana & Pronk, 2001 for a review) but reports of generalised benefits of improved morale and increased productivity tend
6
to be more anecdotal. Improvements in energy levels, morale and performance have typically only been measured by self-reports (Durbeck, Heinzelmanm & Schaeter, 1972; Heinzelman & Bagley, 1970; Rhodes & Dunwoody, 1980) or anecdotal testimonials (Damberg, 1984; Feuer, 1985). However, earlier studies of worksite fitness breaks demonstrated increased attention, improved reactions, faster visual response and enhanced visual acuity with an attendant decrease in error scores on manual tasks such as data entry, electrical assembly and textile inspection (LaPorte, 1970). More recently researchers have taken a more holistic approach to worksite health promotion. For example, Peterson and Dunnagan (1998) assessed the impact of participation in a health promotion program and engagement in healthy behaviours on job satisfaction. In their analyses of the impact of worksite health promotion on job satisfaction, they were only able to conclude that companies aiming to improve employee health should provide health promotion programmes. They suggest that companies seeking to improve job satisfaction should address the job itself as the relationship between employee health and job satisfaction is unclear and may obscure or confound any direct effects of health promotion activities. Thus, the effectiveness of a health programme in terms of both its impact on health and any attendant benefits depends largely on the content of the programme, the degree of worker participation and the organizational climate of the operating company. In terms of content, many health promotion programmes include a focus on fitness and exercise and most studies have found marked reductions in body fat among exercisers. However, the largest reduction in body fat is obtained when exercise programmes are also combined with dietary programmes focused on low-fat healthy eating (Ostwald, 1989). Programmes have also begun to focus on overall healthy lifestyle with a particular focus on cardiac risk factors, such as weight reduction, cholesterol and blood pressure monitoring and smoking cessation. Smoking cessation has proved to be one of the most successful programmes. Shephard (1996), in a comprehensive review, observed that nine out of ten studies show reduced smoking habits following the introduction of worksite programmes. However, he also noted that the heaviest smokers, and consequently those whose health is most at risk, typically do not engage with health promotion projects from the outset or fail to maintain participation in such programmes. Nevertheless, the impact of worksite health and wellness projects on cardiac risk factors is clear for participating employees. In the Johnson and Johnson worksite programme, Blair et al (1986) noted a significant reduction in cardiac risk factors. Similarly, Heirich et al (1993) estimated a 45% reduction in cardiac risk factors over three years while Shephard, Corey & Cox (1982) noted a two year reduction in appraised health risk among male participants during the first six months of health programme participation. Finally, and perhaps most importantly the organizational climate for health is of vital importance to the success of any health promotion programme. A strong indication of this dynamic interaction can be found in an evaluation of the Johnson & Johnson Live for Life (LFL) programme, which employed a quasi-experimental design (including a control group) in its initial implementation (Breslow, Fielding & Hermann, 1990; Wilbur, Hartwell & Piserchia, 1986). The LFL was targeted at all employees and aimed to facilitate changes in the work site environment to promote health. Findings at the end of a two-year epidemiological study indicated that the programme produced positive benefits for both the employer and workforce. As in other studies, the employer benefited from reduced corporate healthcare costs (Bly, Jones & Richardson, 1986) and lower absenteeism rates (Jones, Bly & Richardson, 1990) while participating employees experienced improved fitness and physical health (Blair, Piserchia, Wilbur & Crowder, 1986) and reduced tobacco use (Shipley, Orleans & Wilbur, 1988). However, Holzbach, Piserchia, McFadden, Hartwell, Herrmann and Fielding (1990) went on to propose that as a “powerful organizational intervention” this form of health promotion programme might well be expected to affect employee attitudes towards their employer, job, management and work conditions. Results indicated this was the case. Employees at companies participating in the full health promotion programme as opposed to
7
those at designated control companies who experienced only a brief health screening procedure showed significant shifts on organizational attitude measures. Improvements were observed in attitude towards “organizational commitment, supervision, working conditions, job competence, pay and fringe benefits and job security” (Holzbach et al, 1990, p.977). Further, this positive change in attitudes was also evident (and sustained over the two year period of evaluation) for employees who did not actively participate in the formal activities of the programme but were employed by participating companies. Holzbach et al (1990) concluded that, “these attitude changes suggest a broader change in organizational environment created by the introduction of the programme” (p.978). The role of this improved organizational climate will be addressed in greater detail later in this discussion.
1.6 Outcomes of a Worksite Health Promotion Programme Research on the efficacy of worksite health promotion has typically attempted to find some objective measurement of the benefit of such programmes for employers. As outlined above these measures typically include medical costs or absenteeism. Very little focus has been directed at the actual employee (or overall company) performance – in other words, the short- and long-term productivity benefits of investment in employee health. A recent review of the literature concerning health status and worker performance surmised, “the medical cost-benefit of disease prevention and health promotion interventions is moderate and increasing” (Riedel, Lynch, Baase, Hymel & Peterson, 2001). This conclusion arose from three basic findings: (i) the “strong and convincing” evidence regarding personal health risk factors and the onset of related illnesses, (ii) the “strong and convincing” evidence that health status impacts on health related costs and (iii) the “strong and convincing” evidence that health promotion interventions do in fact significantly improve the health status of participants in those programmes. However, this comprehensive review identified significant difficulties in measuring the relationship between health status and productivity and was ultimately forced to conclude that productivity is a complex phenomenon and cannot simply be quantified in terms of presence (or absence) from the workplace or physical volume of output. In other words, “simple representations of work and production misrepresent the reality of work life in which we experience gradients of output along several dimensions” (Riedel et al, 2001, p.186). Furthermore, mechanistic approaches to the quantifying of productivity ignore psychological aspects of work such as morale, motivation, leadership and team dynamics, which may play a fundamental role in the success of a company. In their review, however, Riedel et al (2001) did manage to identify best practice in organizational initiatives to improve the health and well being of workers. These data arose from a U.S. benchmarking study which addressed ten aspects of six large organisations: group health insurance, workers compensation, disease management, non-occupational disability management, absenteeism, turnover, employee attitudes, recruitment, training and productivity. Results of the study indicated that following best practices in any five of these areas would produce up to 31% savings on health care expenditure. The study went on to identify a number of themes common across companies displaying best practice in this area. Identifying the importance of committed management, determined and visionary leaders, autonomy across roles, and on-going communication, these themes would appear to be indicators of what might be deemed a climate for health or perhaps ‘health culture’ within companies benefiting most from workplace health initiatives. These themes will undoubtedly be revisited in much greater detail under the remit of the current project. 1.7 The Cost of Occupational Ill-Health in the UK The brief review above indicates clearly the benefits of appropriate worksite health promotion plans for the health of participating employees and indeed employers. The benefits of improved health are also societal. Recent UK government statistics indicated that 187 million working days are lost to sickness every year representing a £12 billion tax on business. Furthermore,
8
conditions that can be prevented or at least alleviated by the promotion of healthy active lifestyles (such as heart disease, strokes and other related illnesses) currently place a burden of £3.8 billion on the National Health Service each year (Department of Health, 1998). In terms of occupational health, the cost of work related illnesses alone was estimated at £10 billion in 1995 (HSE, 2001). This high economic cost of occupational ill-health has led to a joint commitment by the government, HSE and other parties to work towards the reduction of these costs. The “Securing Health Together: An Occupational Health Strategy for Great Britain” (HSE, 2000) initiative sets out a ten year plan to effect a 20% reduction in the incidence of work-related ill health, a 30% reduction in the number of days lost due to work-related ill-health and increased opportunity for rehabilitation following work-related ill-health. It is estimated that these relatively modest reductions would lead to a gross societal benefit of between £8.6 and £21.8 billion by 2010. The strategy aims to employ multiple interventions but incorporates a particular focus on the benefits of worksite health promotion and in particular the promotion of a more preventative “active lifestyle” message.
1.8 Theoretical Frameworks in Worksite Health Promotion Early health promotion models typically focus on individual behaviour and the mechanisms promoting individual behaviour change, however, modelling health behaviour and behaviour change demands a multi-level approach to tackle the interactive contexts of behaviour (National Institute of Health, 1995). Five levels of health behaviour influence have been identified spanning intrapersonal factors, interpersonal factors, organizational factors, community factors and public policy factors (McLeroy et al., 1988). This multi-level explanation also takes account of two-way interactions between individuals and their environments in a form of reciprocal causation. In other words, individual behaviour can influence and be influenced by the environment or social context. Furthermore, this multi-level approach makes best use of alternative theories to explain behavioural phenomena within complex and dynamic settings. However, while all of the above levels are necessary for achieving optimum health behaviour change, not all are specifically within the control of an organisation aiming to implement a successful health promotion programme. Thus this review will focus on core models of interpersonal, community and organizational factors that impact on health behaviour.
At the interpersonal level, theories of health behaviour focus on the individual within an environment where other individuals within that environment affect their health and feelings and/or behaviour relating to their health. Therefore, at this level personal characteristics and relationships interact with the environment, which (from an organizational perspective) will include peers, co-workers, managers and health professionals within the workplace. From this perspective Social Learning Theory (or Social Cognitive Theory) is a strong if complex theoretical contender. Developed in the 1970s by Bandura, a central tenet of the theory argues that individuals do not learn solely from their own experiences but also from the behaviour of others and outcomes or results of that behaviour. In other words, this model posits a dynamic interaction between personal factors and environmental influences and presents the relationship between these factors as a continuous reciprocal interaction. Without delving in depth into the mechanisms involved in this interaction at this juncture, key concepts within this framework in addition to observational learning include behavioural capability, expectations or beliefs about the likely outcome of behaviour change, confidence in ability to take action and effect change (self efficacy) and reinforcement in the environmental context. Community level models might also be considered important for understanding the mechanisms underlying the performance of health interventions in the workplace given the reciprocal, interdependent relationships between co-workers. Many models at this level are also consistent with social learning theory in terms of attempting to model the dynamic interaction between individuals. However, the interaction is further complicated when organizational structure is considered. Organisations are complex social settings comprising many different roles, interactions, networks, hierarchies and
9
operating levels. In terms of health intervention, two key theoretical approaches can account for optimal organizational development in health intervention. Stage theory proposes that organisations pass through a series of stages as they attempt to effect change. The identification of these stages will lead to an intervention appropriate to the stage the organisation is at with the final aim being the institutionalisation of the change such that the implemented policy becomes an integral feature of the organisation. In terms of health promotion, this would lead to an organizational climate primed for the health and well-being of employees. Similarly, organizational development approaches, which tend to view organisations as interacting in a dynamic fashion with the people who comprise them, promote cultural change to ensure that worker behaviour and motivation are positively influenced by structures and processes of the organisation to maximise positive outcomes for the organisation. Again, appropriately channelled health promotion activities might well fit within this framework in terms of fostering a “culture of care and concern” for the workforce. Crump, Earp, Kozma and Herz-Picciotto (1996) derived a conceptual model to account for the relationships between worksite health promotion, participation and organizational factors. This model extended Ottoson and Green’s (1987) assertion that the implementation processes and outcomes of health promotion programmes are influenced by an interaction of four factors – policy, organisation, political milieu and environment. Crump et al (1996) found support for a revised model positing that organizational context and implementation processes interact to influence worker participation. Findings from the study supported organisation-level change and indicated how barriers to health promotion participation might be reduced in organisations so that the benefits of participation might be magnified. Thus, locating health promotion activity firmly within an organizational framework should serve to explain more wide reaching implications of that activity for the organisation and its employees. 1.9 Introduction to Health Surveillance The surveillance of employee health may take on several guises in the workplace but is typically instigated with the main aim of preventing occupational ill health. Surveillance may take the form of pre-employment medicals, fitness for work schemes, occupational risk identification in addition to more general company medicals. Broadly speaking then, workplace health surveillance falls largely into two categories – occupational health surveillance required by law and non-statutory health surveillance which seeks to maintain the health of the workforce but without a specific focus on occupational health risks. Breaking down these two categories, Bell, Bishop, Gann, Gilbert, Howe et al (1995) identify two areas of statutory health surveillance:
“health surveillance established to ensure that adverse health effects related to work are
identified at an early stage (e.g. exposure to lead) and health surveillance to ensure that employees are medically fit to do the job for which they are employed and will not constitute a danger to themselves or others” (Bell et al, 1995, p.307). The former entails assessing specific occupational risks and hazards to health within that particular workplace and will typically target known hazards (such as the adverse effects of particular chemicals or work practices) in line with statutory regulations relating to those hazards. Certain occupational roles are also covered by statutory requirements for the periodic assessment of an employee’s fitness to work to ensure that they are capable of carrying out their work in a manner conducive to their own safety and that of others. This second form of statutorily regulated health surveillance may take the form of medicals and assessments of physical and psychological fitness.
10
Non-regulatory health surveillance undertaken by companies may include annual general medical examinations, disease screening and health risk assessments, which are not targeted at any particular occupational risk. For instance, a company may offer employees non-statutory screening for particular forms of cancer. As pointed out by Bell et al (1995), along with periodic medicals this screening constitutes a relatively unfocused service (likely to be available to individuals through primary care) but may be perceived by employees as a ‘perk’ or demonstrate company concern for the more general well-being of the employee. Finally, a number of studies have identified that lifestyle health risk assessments may in fact be more cost effective to employers (and beneficial to employees) than regular medicals (Bly, Jones & Richardson, 1986; Walsh & Egdahl, 1989). This non-statutory form of health monitoring has not received much attention in the literature and research would appear to indicate it is of particularly low importance for employers in terms of health surveillance and health and safety priorities. In a survey of risk managers and finance managers of the 127 largest UK commercial companies, results indicated that the primary motives associated with the management of occupational risk involved “ensuring statutory compliance with health and safety regulations and avoidance of legal liability suits” (Ashby & Diacon, 1996, p.241). The maintenance of a more productive workforce, securing a reduction in labour turnover or reducing wage costs did not emerge as key factors in the management of occupational health and safety. Ashby and Diacon (1996) conclude that, “government regulations are necessary in order to protect employees against excessive levels of workplace risks” (ibid, p.241) particularly where those health hazards are latent. These authors also conclude government regulations frequently fall short in that they may be too general and thereby fail to address health and safety issues specific to individual workplaces. This may result in non-compliance through exploitation of loopholes in order to avoid potentially expensive regulatory compliance (Gun, 1993). Evidence of this non-compliance has already been documented with 70% of firms failing to comply fully with employee safety and health regulations (Corporate Cover, 1994).
1.10 Health and the Offshore Workforce A Special Population for Health Promotion? The offshore work environment is uniquely inhospitable and as Cox (1987) suggests “a rough and tough world, likely to tax the equilibrium of any person who is not wholly stable” (p.97). In this hostile and remote setting the health and fitness of the workforce might well mean the difference between life and death in emergency situations. The work and lifestyle conditions present in the offshore environment also pose a challenge and include “confined work and living conditions; lack of privacy; living in a mixed community of very different types of people; noise and other physical environment stressors, including potential hazards; shift patterns, dull and monotonous work in which periods of boredom are interspersed with periods of intense activity; and little opportunity for developing new skills” (Parkes, 1993, p.3). This lifestyle has implications for the health and well-being of the offshore workforce which, despite regular medical screening and check-ups, may not be as fit and healthy as they should be in such a demanding environment. Research has also indicated that this less than optimum health profile is largely a result of the offshore lifestyle (Light & Gibson, 1986; Fenn & Ballantine, 1991; Harderwijk, 1991). Furthermore, over the past thirty years, the workforce has matured from the tough young workforce of the 1970s to a more mature, experienced and middle-aged workgroup. In 1984, the mean age of offshore workers was 32.5 years (Light & Dingwall, 1985). Surveys since have observed an increasing age profile such that a large proportion of the workforce currently falls into the 40-50 years age group (Gann, 1989; Watt, 1992; Parkes & Clark, 1997). Horsley and MacKenzie (1997) report an age-related increase in medical evacuations for illnesses. This advanced age profile also carries particular health risks with this
11
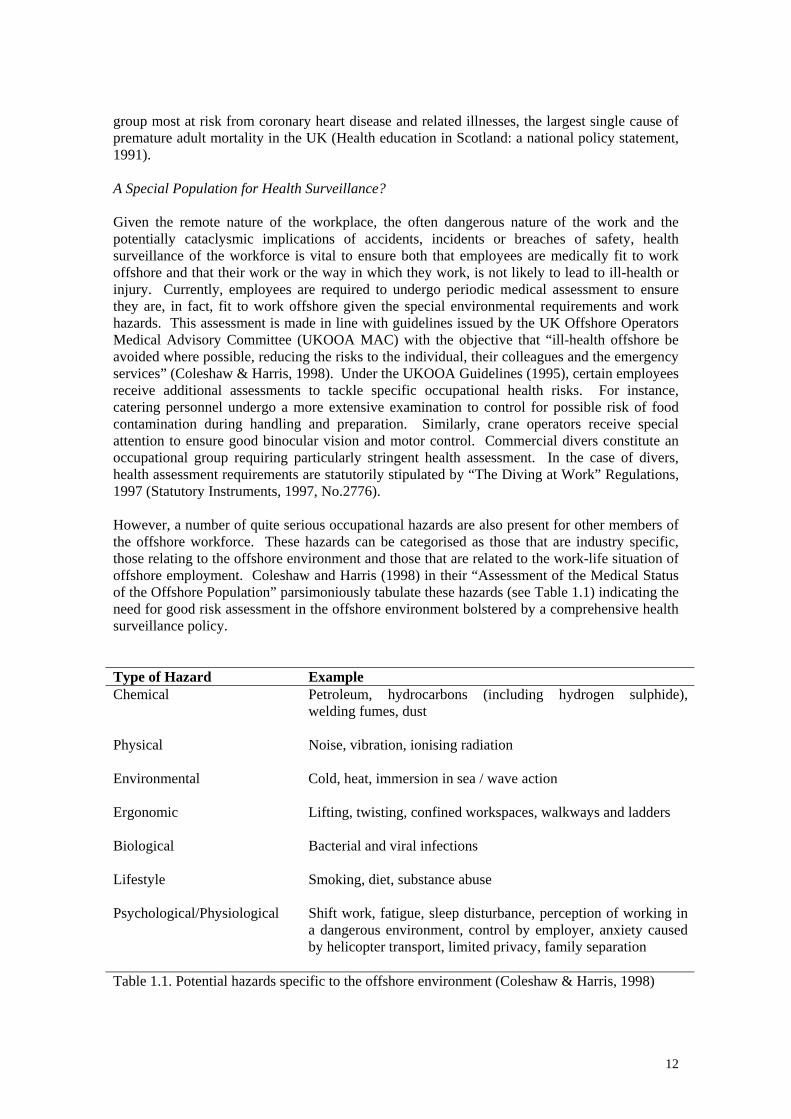
group most at risk from coronary heart disease and related illnesses, the largest single cause of premature adult mortality in the UK (Health education in Scotland: a national policy statement, 1991). A Special Population for Health Surveillance? Given the remote nature of the workplace, the often dangerous nature of the work and the potentially cataclysmic implications of accidents, incidents or breaches of safety, health surveillance of the workforce is vital to ensure both that employees are medically fit to work offshore and that their work or the way in which they work, is not likely to lead to ill-health or injury. Currently, employees are required to undergo periodic medical assessment to ensure they are, in fact, fit to work offshore given the special environmental requirements and work hazards. This assessment is made in line with guidelines issued by the UK Offshore Operators Medical Advisory Committee (UKOOA MAC) with the objective that “ill-health offshore be avoided where possible, reducing the risks to the individual, their colleagues and the emergency services” (Coleshaw & Harris, 1998). Under the UKOOA Guidelines (1995), certain employees receive additional assessments to tackle specific occupational health risks. For instance, catering personnel undergo a more extensive examination to control for possible risk of food contamination during handling and preparation. Similarly, crane operators receive special attention to ensure good binocular vision and motor control. Commercial divers constitute an occupational group requiring particularly stringent health assessment. In the case of divers, health assessment requirements are statutorily stipulated by “The Diving at Work” Regulations, 1997 (Statutory Instruments, 1997, No.2776). However, a number of quite serious occupational hazards are also present for other members of the offshore workforce. These hazards can be categorised as those that are industry specific, those relating to the offshore environment and those that are related to the work-life situation of offshore employment. Coleshaw and Harris (1998) in their “Assessment of the Medical Status of the Offshore Population” parsimoniously tabulate these hazards (see Table 1.1) indicating the need for good risk assessment in the offshore environment bolstered by a comprehensive health surveillance policy. Type of Hazard Example Chemical Petroleum, hydrocarbons (including hydrogen sulphide),
welding fumes, dust
Physical Noise, vibration, ionising radiation
Environmental Cold, heat, immersion in sea / wave action
Ergonomic Lifting, twisting, confined workspaces, walkways and ladders
Biological Bacterial and viral infections
Lifestyle Smoking, diet, substance abuse
Psychological/Physiological Shift work, fatigue, sleep disturbance, perception of working in a dangerous environment, control by employer, anxiety caused by helicopter transport, limited privacy, family separation
Table 1.1. Potential hazards specific to the offshore environment (Coleshaw & Harris, 1998)
12
There are a number of regulations in place to ensure the control of a number of these hazards and apportion responsibility for the monitoring of occupational health risks. For example, the 2002 COSHH (Control of Substances Hazardous to Health) regulations state that employers are responsible for the prevention of exposure to hazardous substances and/or the safe use of such substances where necessary. In order to comply with COSHH, employers are required to carry out the following seven steps: assess the risk, decide what precautions are needed, prevent or adequately control exposure, ensure that control measures are used and maintained, monitor exposure, carry out appropriate health surveillance and ensure employees are properly informed, trained and supervised (COSHH, 2002). Clearly these requirements place quite a heavy burden of risk assessment and surveillance on the employer. One example of an occupational disease covered in COSHH regulations is occupational asthma, which may be caused by exposure to substances known as respiratory sensitisers. A respiratory sensitiser is essentially a chemical substance that triggers a permanent allergic reaction in the respiratory system such that subsequent exposure to the substance will trigger symptoms such as those found in asthma (coughing, wheezing) and/or rhinitis and conjunctivitis. Continued exposure may lead to serious and permanent damage to lungs and exacerbated symptoms. Noise and vibration also pose serious health risks to long-term health for offshore workers. Exposure to workplace noise is regulated by the Noise at Work Regulations (1989) that were applied offshore by the offshore Electricity and Noise Regulations (1997). However, earlier research indicated that noise levels on offshore platforms were frequently in excess of the acceptable (and safe) limits (Cox, 1982) and more recent reviews of the situation have indicated that noise levels can still be unacceptably high (Gardner, 2001; 2003). Therefore, the careful surveillance of hearing is vital to ensure that the onset of any hearing loss or damage is identified in the early stages and steps taken to prevent further deterioration. In 1997 civil liability claims for noise induced hearing loss formed 74% of all occupational diseases and was approximately 31% of the value of all claims (HSE, 2001). Certain occupational groups may also be at risk from hand-arm vibration syndrome (HAVS). HAVS can result in a number of conditions including vibration white finger, carpal tunnel syndrome, permanent numbness and tingling in the hands and arms, painful joints and weakened muscles, and damage to bones in the hands and arms (HSE, 2001). The HSE have identified over one million workers at an increased risk of disease because they are exposed to HAV above advised levels. Currently, over 300,000 workers display advanced symptoms of vibration white finger (HSE, 2001). Regulations relating to the occupational use of hand held power tools are in the offing with a European directive on HAV and WBV (whole body vibration) currently before the European parliament. Skin problems are also present in the offshore workforce typically in the form of dermatitis and eczema at the rate of 7% (Coleshaw and Harris, 1998). This is similar to the rate of skin problems noted by Harjono (1991) among Indonesian oil exploration and production workers. However, research among South American steel workers suggest that certain ailments and in particular skin problems may be under-reported by these workforces and that skin problems may not be perceived as an occupation-related condition (Laurell, Noriega, Martinez & Villegas, 1992). For all the occupational diseases briefly summarised above, good risk assessment practices should identify potential hazards and result in the implementation of adequate safety controls to limit or eliminate damage to health. Thus the role played by health surveillance procedures is an important one and throughout this study health surveillance policy, procedure, how it is experienced and evaluated by the workforce and its role in safety performance will be closely examined.
13
The Offshore Lifestyle: Implications for Health While clear work-related risks were identified in the previous section there are a number of less obvious health hazards facing the offshore workforce, which, as we have seen, also makes them a special population for health promotion. Research indicates a clear link between coronary heart disease and lifestyle choices such as lack of exercise, smoking, alcohol consumption and poor diet (Ballor & Keesey, 1991; Kannel, 1988; Kendrick, Williamson & Caspersen, 1991). Survey data suggest that these particular lifestyle choices might well be endemic among the offshore population thus putting them at greater risk of health impairment (Mearns & Fenn, 1994). Parkes (1998) contends that the peculiar demands of the North Sea, the nature of the work and the social climate offshore might well increase the likelihood of unhealthy lifestyle practices. Factors accentuating health risks among offshore workers include an excess of high quality food, a relatively sedentary work pace for many employees and easy accessibility of tobacco. Other risk factors for this population might include psycho-social stressors arising from job stress or familial separation and the offshore shift work patterns which often result in unhealthy, irregular eating and sleeping habits (Hellesoy, 1985; Parkes, 1992; Sutherland & Flin, 1991). Studies assessing the health status of the workforce would appear to confirm that concern for the health of offshore workers is warranted. Examining the lifestyle risk factors for coronary heart disease listed above illustrates an increased risk for the offshore worker. For instance, Horsley and MacKenzie (1996) and Parkes and Clark (1997) identified a higher prevalence of smoking among offshore workers where 37.2% and 36.3% respectively, of surveyed samples were smokers. Contrasted with the 31% rate of smoking in the UK adult male population and 34% rate for males in Scotland alone, this elevated rate represents a significant shift. Within worker subgroups the rates were even higher. For instance 44.1% of construction and 48.1% of drilling workers reported cigarette smoking behaviours as opposed to 25.3% of production operators (Parkes, 1998). Similarly, alcohol consumption - although prohibited in the offshore work environment - is higher among the offshore population than consumption levels for the male population generally where the reported rate of drinking above the recommended level of 21 units per week is 24% in Scotland (Scottish Home and Health Department, 1991). Again, Horsley and MacKenzie (1996) reported that the proportion of offshore workers claiming to exceed this recommended level stood at 30% for males involved in a relationship or family but 46% for those workers who lived alone. Furthermore, it has been suggested that much of this excessive drinking takes place in the form of ‘binge drinking’ on returning onshore and before travelling offshore (Hellesøy, 1985; Sutherland & Flin, 1989). Studies examining health and fitness of the offshore population also point to shortcomings in diet and fitness among this group. In an assessment of body weight, height and skinfold measurements for 419 offshore workers, Light and Gibson (1986) found that over 40% of the offshore sample could be classified as overweight and a further 5.5% were obese. Body fat and Body Mass Index (BMI) scores were also found to increase with age. The normal range for BMI is 20.0 to 24.9 kg.m-2. Scores in the 25.0 to 29.9 kg.m-2 range are considered ‘overweight’ while individuals scoring over 30 kg.m-2 can be classified as obese. In the Light and Gibson (1986) sample body fat increased from 21% in the younger age group (20-29 years) to 25% in the 30-39 year age group. However, the middle age group of 40-49 years showed the most worrying increase to 30%. Light and Gibson (1986) went on to conclude that these offshore workers were also significantly more likely to be overweight or obese than a corresponding onshore sample. Similarly, Fenn and Ballantine (1991) reported that 56% of their offshore sample could be classified as overweight or obese when standard classifications were used. Most recently, Coleshaw and Harris (1998) reported that for a significant proportion of their sample of 768 offshore workers, body mass index exceeded normal values. BMI was greater than the ‘overweight’ level of 25 kg.m-2 for 51% of the sample and greater than the 30 kg.m-2 ‘obese’ level for 9% (approximately 70 individuals). This high instance of excess body fat is cause for grave concern given the close
14
links between obesity and coronary heart disease. Furthermore, Gann (1989) reports that an increase in blood pressure levels is also associated with increased weight and body mass index. In addition, as suggested by Parkes (1998) and Cox and Norman (1987) these overweight workers may encounter other practical difficulties such as difficulty climbing stairs or manoeuvring safely on narrow gangways. According to these authors overweight workers may also be a liability in offshore emergencies due to impaired health and fitness, a point that will be addressed later in this review. The factors underlying this unhealthy weight profile have been accounted for in several studies (Fenn & Ballantine, 1991; Light & Gibson, 1986, Parkes, 1998). Findings tend to be in agreement that bad eating habits develop in response to shift-work patterns and are exacerbated by the provision of large quantities of high quality food available at all times in order to cover different shift patterns. In addition, Fenn and Ballantine (1991) noted that the offshore diet tended to be high in carbohydrates relative to expended energy and relatively low in dietary fibre. Studies of dietary intake of Norwegian offshore workers indicated the consumption of approximately 3000 calories daily of which 44% came from fats, 39% from carbohydrates and 17% from protein (Oshaug, Ostgard & Trygg, 1992). This level of fat intake is particularly high and according to Parkes (1998) constitutes nearly 50% more than the maximum recommended value. Certainly, some work groups (such as drillers) may be engaging in sufficient energy expenditure in their work to warrant the effects of high calorific intake but a significant proportion of the workforce is occupied in more sedentary roles with limited energy expenditure. Ostgard (1990) reported that only a quarter of Norwegian offshore employees surveyed reported exercising and that certain workgroups, in particular drilling, catering and maintenance personnel, seldom reported exercising. This figure was somewhat higher in Horsley and MacKenzie’s (1996) UK survey where 41% of their sample reported taking some form of regular exercise while offshore. However, as these results are not broken down by workgroup nor did the question specify what constituted regular exercise, it is possible that respondents may have included aspects of their work as ‘exercise’. To summarise, poor diet, smoking, binge drinking patterns, overeating and lack of exercise have all been identified as lifestyle problems among the offshore population (Mearns & Fenn, 1994; Horsley & MacKenzie, 1996; Parkes, 1998). Unfortunately these lifestyle habits constitute the major risk factors for severe conditions such as coronary heart disease and related health complications. According to the World Health Organisation, 40% of heart attacks are fatal resulting in death within just one hour of initial symptoms for 60% of cases (Tunsdall-Pedoe et al, 1975). Baxter and Petch (1995, cited in Coleshaw and Harris, 1998, p.46) conclude that “some CHD is preventable; employers have a duty to support and reinforce community measures by discouraging smoking, encouraging health activities during rest and recreational hours, and providing a healthy diet at work”. Thus, worksite health promotion programmes clearly have an important role to play for this particular workforce and indeed programmes specifically tailored to tackle the risk factors outlined above have been recommended (Coleshaw & Harris, 1998). Furthermore, the experience of on-site rig medics reinforces the need for health promotion activities specifically targeted at reducing these risk factors: “The fitter the workforce the more efficient it becomes, less time lost through illness for the company. A healthy offshore workforce would dramatically bring down the number of cardiac incidents – we had 3 in 1992” (Rig Medic; Mearns & Fenn, 1994). Interestingly, Rig Medics in the Mearns and Fenn (1994) study also suggested another, perhaps less intuitive, benefit of improved health offshore, namely improved safety. According to one such medic “good health will lead to better safety offshore. People will feel they’re being taken care of”. The possible links between improved health, health promotion activities and better safety performance will be addressed in the next section of this review.
15
1.11 Health Promotion and Safety Until recently, research focussing on safety performance and behaviour within organisations typically attempted to identify the individual level factors underpinning accidents and injuries in the workplace. In other words, these studies tended to focus on factors such as individual human error, non-compliance with safety procedures and differences in risk-taking behaviour (Lawton, 1998; Reason, Manstead, Stradling, Baxter & Campbell, 1996). However, emphasis on these individual level factors has shifted towards a focus on the impact of organizational factors (e.g. Reason, 1990; Neal, Griffin & Hart, 2000) and, in particular, general organizational climate. Organizational climate has been described as a “multidimensional construct that encompasses a wide range of individual evaluations of the work environment (Neal et al., 2000, p. 100). Specifically it can be defined as a “set of internal characteristics that distinguishes one organisation from another, is experienced by members of the organisation, influences their behaviour, and is based on their collective perception of the organizational environment” (Basen-Engquist, Hudmon, Tripp & Chamberlain, 1998, p.112). As a multidimensional construct it can be ascribed to both the general features of the operating environment within an organisation, such as leadership or communication (James & McIntyre, 1996) as well as more specific operational areas such as safety climate. Thus, the relationship between the organizational environment and its members is an interactive one and the parameters of this relationship constitute the organizational climate. Accordingly, climate influences behaviour in conjunction with the motivations and abilities of organisation members (Field & Abelson, 1982; Moran & Volkwein, 1992) while, simultaneously, climate evolves through the shared perceptions of the organisations held by members of that organisation (Moran & Volkwein, 1992). As pointed out by Basen-Engquist (1998) this concept comprises the notion that environment, behaviour and individual factors influence each other and in this way is similar to the reciprocal determinism of Social Cognition theory discussed earlier. In a review of the organizational climate literature Neal and co-workers (2000) identify a number of studies charting a link between organizational contexts and quite diverse employee behaviours. For example, Griffin and Mathieu (1997) contend that perceptions of organizational climate can influence the course of interactions between individuals within that organisation. In a similar vein, Griffin, Tesluk and Jacobs (1995) argue that perceptions of organizational context impacts on attitudes to rewards while other research has identified a relationship between organizational climate and affective responses to the working environment (Michela, Lukaszwewski & Allegrante, 1995; Hart, Wearing & Griffin, 1996). Given this mutual influence, organizational climate plays a pivotal role in the effectiveness of health promotion programmes and worker participation in such programmes (Rost, Connell, Schechtman, Barzilai & Fisher, 1990). Components of organizational climate such as perceptions of control over work, supervisor support and worktime flexibilty to facilitate healthy activities have been identified as predictors of employee participation in worksite health promotion programmes (e.g. Sloan & Gruman, 1988). Ribisl and Reischl (1993) also identified the traditional focus on individual level factors in the worksite health promotion arena and went on to identify a ‘climate for health’ subsumed within a more general organizational climate. According to Pender (1989) and Stokols (1992) the ‘health’ and health behaviours of an organisation will be influenced by the social structure of that organisation. They suggest that what has been variously described as a “health strengthening environment” (Pender, 1989), a “healthy organizational culture” (Opatz, 1985), a “climate for health” (Ilgen, 1991) and a “wellness-oriented workplace” (Chapman, 1987) directly promotes and facilitates healthy behavioural norms. In their analyses, Ribisl and Reischl (1993) also report that health climate differed significantly across worksites under investigation and that organizational health climate was associated with exercise, nutrition and smoking behaviour. Finally, although not a direct
16
investigation of health climate, the results of the Johnson and Johnson LFL programme described earlier indicate a positive (and sustained) change in attitudes among employees who did not actively participate in the formal activities of the programme but who benefited from the change in organizational climate evoked by the implementation of a health promotion programme (Holzbach et al, 1990). Only a very limited number of studies have considered any links between organizational climate, health promotion and safety. Neal, Griffin and Hart (2000) considered the links between organizational climate, safety climate and safety behaviour. In their study safety climate was defined as “a specific form of organizational climate which describes individual perceptions of the value of safety in the work environment” (p.100). Organizational factors such as management values of safety, training provision, communication and employee involvement have been shown to predict safety outcomes such as accidents (e.g. Brown and Holmes, 1986; DeJoy, 1994; Hofmann & Stetzer, 1996). Neal et al (2000) went on to report that general organizational climate also exerts a strong influence on safety climate. They conclude that the safety climate mediates the effect of general organizational climate on safety performance. Their results also indicated that the effects of safety climate on safety performance were mediated by knowledge about safety and motivation. If we view health promotion programmes as exerting a positive influence on organizational climate (as the LFL results described above would appear to indicate), then the findings by Neal et al (2000) are pivotal for understanding why an intervention apparently unrelated to safety could, in fact, impact on safety performance. In the first study of its type, Basen-Engquist et al (1998) attempted to measure organizational climate change in response to a worksite health promotion intervention. Specifically, organizational climate relating to health and safety was investigated by means of a new questionnaire measure of organizational health and safety climate derived for the purposes of the study. Results validated this scale and although an association between health and safety climate scores did not emerge, findings demonstrated that the implementation of a health promotion intervention produced a significant improvement in worksite health climate. The relationship with safety climate was more complex with results indicating that “health and safety climate is related to other variables, indicative of an environment in which health- and safety-related behaviours are supported” (Basen-Engquist, 1998, p.117). Further, these authors also noted that changes in health climate were associated with the presence of smoking cessation programmes offered in the workplace at the time of the three-year follow-up study. Interestingly, other elements of the health promotion programme such as exercise, weight control and nutrition programmes or participation in health and safety course, did not relate to change in health climate. Safety climate was not related to any intervention programmes but was marginally associated with smoking programmes (p=.055). More recently in a study tailored to the offshore industry, Mearns, Whitaker & Flin (2001, 2003) have carried out a health and safety benchmarking study. This study compared the health and safety performance of 13 offshore installations (including fixed production platforms, well-service vessels, FPSOs and drilling rigs) on a range of leading and lagging performance indicators. The leading indicators included safety climate surveys of the offshore installations in which respondents indicated their involvement in safety, safety behaviour, safety attitudes, satisfaction with safety measures and satisfaction with communication about health and safety. In addition, HSG 65 (HSE 1997) was used as a model for development of a Safety Management Questionnaire (SMQ), which recorded a range of safety performance indicators used in other health and safety benchmarking programmes. These covered six main areas: i) Health and safety policy; ii) Organising for health and safety; iii) Management Commitment; iv) Workforce Involvement; v) Health surveillance and promotion; vi) Health and safety auditing. Participating installations were also required to provide details of their management structure, including the position of safety professionals within the hierarchy, and their accident and incident statistics including RIDDOR (Reporting of Injuries, Diseases and Dangerous
17
Occurrences) data, near-misses, visits to the offshore medic and number of cards/ reports from behavioural modification programmes. Relevant documentation to support the answers provided to questions in the Safety Management Questionnaire (SMQ) was also requested. Analysis of data took the form of rank correlations between the six sub-sections of the SMQ, the total SMQ and four outcome measures. These outcome measures were LTI>3 days, RIDDOR data (although it is acknowledged that this indicator is an aggregate of other lagging indicators), Near misses and Dangerous Occurrences. A pattern of negative correlations was predicted and found: favourable scores on the entire SMQ were associated with lower accident and incident rates. All significant negative correlations involving sub-scale scores were confined to two areas of management strategy - health promotion and surveillance and health and safety auditing. In particular, high scores on the full sub-scale ‘Health promotion and surveillance’ (which included both quantitative and qualitative data) were significantly associated with lower lost time injury rates (rho -0.76). Responses to an abbreviated sub-scale including just quantitative data were significantly correlated with lower rates of dangerous occurrence (rho –0.79), near misses (rho –0.76) and RIDDOR (rho-.78). Again, these results appear to posit an association between organizational climate more generally and safety climate. Specifically, however, they serve to directly link health promotion and health surveillance with safety management. The current research aims to build on the existing literature outlined in this review and investigate this link further. However, before lauding organizational climate (and specifically health climate) as the sole facilitator of a successful health promotion plan which may or may not be capable of delivering an attendant improved safety climate, it is important to consider the individual level reasons by which occupational health programmes might also improve safety. 1.12 Health Promotion, Individual Behaviour and Safety There is only limited information present in the literature concerning the likelihood of occupational injury arising from personal risk factors. To address this, Forrester, Weaver, Brown, Phillips and Hilyer (1996) set out to compare occupational injury rates between employees who differed in terms of factors relating to personal health risk. Taking a number of health measures including Body Mass Index, level of physical activity, blood pressure, cholesterol, tobacco use and psychosocial risk factors, workers were grouped by their risk levels while sex, smoking habits, age and job classification were controlled in the analysis. Results indicated that known risk factors for cardiovascular-disease did not appear to exacerbate the incidence of occupational injury although the authors point to possible confounds in the design and/or sample, which might have led to this result. However, non-occupational risk-taking emerged as a significant predictor of occupational injury and thus was significantly associated with an increased risk of occupational injury. In this study, non-occupational risk-taking was measured by a small battery of items including exposure to violence, <90% use of seat belts, recent history of driving under the influence of alcohol, use of a motorcycle and consumption of more than two alcoholic drinks per day. Forrester et al (1996) conclude that this association results from continued risk-taking in the occupational environment by individuals who “participate in a lifestyle that involves frequent risk-taking” (p.518). Alternatively, they suggest that “risk-takers may be assigned to or volunteer for hazardous work more frequently than others within the same occupation, thus exposing themselves to greater risk of injury or illness” (ibid.). In a similar vein, Tsai, Bernacki and Dowd (1991) examined 914 injury compensation claims and concluded that individuals who suffered an occupational injury were also more likely to have sustained a previous non-occupational injury. Although Tsai et al (1991) point out possible sampling considerations in terms of the type of individuals who make insurance claims, they also refer to literature suggesting that individuals who have accidents tend to take more risks both at work and in the home (e.g. Verhaegen, Strubbe, Wonek & Van Den Abeele.
18
1985; Oleckno, 1987; Murd, Nans & Engler, 1966). They conclude that factors such as lifestyle as well as physical and psychological factors may predispose an individual to injuries both in and outside the workplace. A further body of research, which strongly supports this conclusion can be found in the literature on smoking and injuries. In addition to the risks posed by smoking for cancer, cardiovascular disease and other respiratory problems, less well reported risks of smoking include an increased risk of injury – not including any injuries relating to accidental fires. In a review of the literature on smoking and injury, Sacks and Nelson (1994) report that cigarette smokers are twice as likely as non-smokers to be injured in the workplace. In a petrochemical plant, smokers were 2.5 times more likely to sustain an occupational injury (Tsai, Cowles and Ross, 1990). Similarly, in a study of postal workers, smokers were 1.4 times more likely to be injured whilst at work than their non-smoking colleagues – even when the data were adjusted for a variety of potentially intermediary factors including age, sex, drug use, exercise and job classification (Ryan, Zwerling & Orav, 1992). Research also suggests that smoking is not just a marker or indicator for some underlying risk factor (e.g. a particular personality type) since former smokers exhibit a lower risk of injury than current smokers (Rogot & Murray, 1980; Tsai, Cowles & Ross, 1990). Sacks and Nelson (1994) suggest a number of explanations to account for this association between smoking and injuries such as direct toxicity, distractibility and associated medical conditions. However, the finding that the risks of injury are reduced for ex-smokers would suggest that smoking is directly related to risk of injury (Sacks & Nelson, 1994, p.517). Given the popularity of smoking in the offshore environment and the high rates of cigarette smoking present for particular sectors of the offshore workforce detailed earlier in this review, it may well be important to consider the relationship between smoking and potential occupational injury – particularly as smoking behaviour can be directly addressed and reduced by health promotion interventions. Indeed, smoking cessation programmes have been identified as one of the most successful health promotion interventions (e.g. Fielding, 1982; Pelletier, 1984). This review has identified two basic approaches to investigate why health promotion programmes may impact on and improve safety performance. At one level, an individual perspective has been offered identifying individual behaviours and risk factors which, if successfully attenuated by the health promotion intervention (e.g. a reduction in smoking behaviour, lower blood pressure and BMI), may lead to an improvement in safety. Hypotheses consistent with this view also contend that enhanced health and fitness may also be associated with an individual’s perceived ability to cope both physically and psychologically with the offshore working environment. In other words, increased feelings of physical and mental well-being may have a direct impact on physical and psycho-social stressors leading to improved ability to cope, greater attentiveness and ability to respond to potentially hazardous situations. An alternative explanation occurs at the organizational level. It may be the case that investment by the company in these areas fosters perceptions of company commitment and builds worker loyalty in areas such as safety behaviour through the development of an organizational culture of care and concern for employees. Finally, it may be the case that an installation good at heath promotion and health surveillance may also be good at safety risk assessment and exert optimal control over safety at both an individual and organizational level. Since safety has traditionally taken precedence over health affairs, it is likely that many organisations have now reached a developmental stage where the health of their workforce is becoming increasingly important and they perceive the need to re-dress the balance for a ‘Health’ and ‘Safety’ culture in equilibrium.
19
2 RESEARCH METHOD 2.1 Overview This study was carried out in three stages. The initial phase involved the development of the Health at Work questionnaire, the second phase involved the piloting and revision of the questionnaire while questionnaire deployment to all participating installations comprised the final phase. Each of these phases is described briefly below with full details of the questionnaire construction described in section 2.2 to follow. Stage 1: Development of the Health at Work Questionnaire The content and structure of the questionnaire evolved from information and feedback from a number of different sources. In the initial stages of development, the published research literature relating to health psychology, health promotion and health safety climate/management provided direction for development of the questionnaire. A comprehensive review of the literature was conducted and published scales and measures were collated to generate a sizeable questionnaire item pool. In addition, new questions and scales were developed consistent with our reading of the literature to address the key hypotheses of the study. Once a draft questionnaire had been formulated, individual meetings took place with the respective health and safety managers of each participating company to discuss the contents of the draft questionnaire. These sessions provided a considerable amount of feedback (e.g. useful avenues for investigation specific to the offshore oil industry were identified, question formats were clarified etc) and allowed further development of the questionnaire. One company, which did not participate in the actual survey, forwarded the workforce questionnaire to a number of offshore medics who provided extended and constructive comments based on their experience in the field relating to worker health, health promotion and management issues. New drafts of the questionnaire following significant development at this stage were again reviewed by the health and safety managers and, on the basis of comments received from all sources, final amendments were made to the draft questionnaire before it was piloted offshore. Stage 2: Pilot Study Following the revisions, the questionnaire was pilot tested offshore in April-May 2002 on an installation on the UKCS. A total of 140 questionnaires were dispatched to this installation of which 107 were returned, resulting in a response rate of 76%. The pilot survey was facilitated by the medics on the installation and full promotional materials were supplied for this purpose. A report of the findings was issued to the company. This report was well received by the participating medics. The pilot study resulted in some minor amendments to the Health at Work questionnaire. The pilot identified some areas within the questionnaire requiring alternative response formats to improve the clarity of the items. This was particularly true in relation to Section 3 Occupational Hazards and Your Health and as a result this section was amended following discussions with the HSE. The Scotland Health at Work (SHAW) team in Aberdeen also examined this version of the questionnaire and suggested some amendments to Section 4 Nutrition & Fitness in line with current conventions in worksite health promotion appraisal. A final version of the questionnaire was forwarded to all participating companies prior to offshore dissemination to solicit any final comments or amendments. Stage 3: Main Study
20
A survey schedule was negotiated with all participating companies allowing an eight-week survey phase (to cover all crew rotations where possible) on each installation. At the outset, the sample comprised 9 participating companies and a total of 41 installations. The schedule comprised a survey window from June 2002 through until October 2002 allowing for the summer shut-down period for some participating installations in July/August. For most of the participating companies, the medic was allocated the role of survey facilitator and was the focus point of all communication with the installation. Medics were issued with a brief synopsis of the purpose of the project and issued with posters introducing the survey 2-3 weeks in advance of the survey start date. Medics were also provided with slides to introduce the survey to the workforce in the more formal setting of a safety meeting or similar on the installation. The final questionnaire comprised an eight-page document (see Appendix I). The front cover provided respondents with a brief synopsis of the purpose of the study, instructions for completing the questionnaire, details of how the results would be reported back to the workforce and an assurance that responses were confidential. Each participating installation received a survey pack containing copies of the questionnaire, an instruction/advice letter for the medic detailing the preferred methods of questionnaire promotion, dissemination, collection and return and pre-addressed envelopes allowing the confidential return of individual questionnaires. Instructions advised that the questionnaire be distributed to all personnel on-board with the exception of very transitory or visiting staff who would not have had the requisite knowledge to comment on long-term health management on the installation. This pack also included the Health at Work Questionnaire for Medics (see Appendix II) After the survey had been underway on an installation for approximately four weeks, a reminder letter was issued to each participating installation along with a reminder poster re-iterating the importance and confidentiality of the study and the cash prize for charity. For three of the participating installations, the operating company requested that the researcher travel offshore to facilitate the survey. The researcher liased with the onshore management and medic offshore and made six trips offshore in October-November 2002. During each trip the researcher delivered a number of presentations to the workforce introducing the study and disseminating questionnaires. 2.2 Description of the Health at Work Questionnaire The Health at Work questionnaire contained seven separate sections identified by a title bar and an introductory paragraph. In each introduction paragraph, respondents were supplied with instructions for completing the section and reminded that their responses were strictly confidential. Respondents were also urged to answer as accurately as possible and carefully consider their responses in relation to the installation they work on. General Information (Section 1) This section was designed to glean some basic information about the respondents and incorporated eight questions. Respondents were required to indicate the name of the installation they were presently working on, the type of work they do, whether they were employed by an operating or contracting company, their supervisory status, whether or not they were a member of core crew on the installation, their age and the length of time they have worked on that particular installation. Respondents were also required to indicate whether they had been involved in an accident or incidents on the installation that required a trip to the sick bay in the past 12 months.
21
Your Work & Your Health (Section 2) The first part of this section required respondents to identify the extent to which twelve social, environmental, organizational and personal factors at work affect their personal health on a 4-point scale (1=Affects my health greatly/4=Does not affect my health). The factors listed were derived from a number of sources. In particular, we included aspects of the offshore lifestyle identified in previous research as likely to cause difficulty for some individuals such as fatigue due to shift work, worries about job insecurity, heavy smoking, poor diet, lack of exercise and stress. We also included more social aspects of the offshore location such as difficulties associated with being away from home for regular extended periods and disturbed family life. This section also sought to determine the extent to which respondents feel stressed or under pressure in their workplace. Initially, respondents were asked to indicate how often they felt stressed or under pressure with five available response options: never, rarely, a few times during each trip, at some point during every day of a trip or all the time. Respondents were then required to rate the extent to which they feel able to cope with any stress/pressure experiences on a five-point scale (1=Generally I cope very well), the extent to which difficulties outside work cause them stress (1=To a large extent) and whether they have received any support (in the form of advice, information guidance etc.) to help them cope with any stress experienced on the installation. Finally, respondents who had availed themselves of support on the installation were required to rate the extent to which this support helped them to reduce their stress levels. In an open-ended question, respondents were asked what action they personally take to reduce stress levels. Occupational Hazards & Your Health (Section 3) Section 3 focused on occupational hazards and the management of those hazards in the workplace. Within the questionnaire, this section was split into five shorter sections for ease of response. The initial section solicited respondents’ assessments of the management of health risks on the installation (How concerned does management seem to be about reducing your exposure to work hazards / To what extent are you satisfied with your employers’ assessment of the health risks you face at work / Are you satisfied that your employer keeps you well informed about the risks you face at work?). These items were based on health and safety criterion measures developed by Basen-Engquist, Hudson, Tripp and Chamberlain (1998). In order to assess the involvement of the workforce in risk assessments, respondents were asked to indicate whether they had been involved in identifying risks to their health present in their work. Finally, respondents were required to indicate whether they had ever discussed work-related health worries with the medic on-board. The following two sub-sections of Section 3 addressed the management of specific health hazards, namely the use of powered hand tools and exposure to chemicals or fumes. In relation to powered hand tools, respondents were required to indicate frequency of use (regularly, occasionally, never), whether they have had any checks in the past 12 months to detect vibration white finger (VWF) or other vibration related disease and finally, to determine levels of awareness and gaps in education on the topic, respondents were asked whether they knew what the physical symptoms of VWF were. In relation to chemical/fume exposure, respondents were asked whether they were exposed to solvents, epoxy resin paints, drilling muds, isocyanate paints, fumes from welding stainless steel or mineral oils. An ‘Other’ response was also available along with an instruction to describe this exposure. This list of common exposures was derived following discussions with health
22
and safety managers in participating companies, responses on the pilot study and advice from the HSE. Respondents were asked if they had received a health check at work relating to their exposure. To conclude these sub-sections, respondents were asked whether they felt adequate controls (other than PPE) were in place on the installation to counteract health hazards arising from exposure to chemicals, use of vibration tools, exposure to noise levels. The next sub-section of Section 3 focused on personal protective equipment (PPE) in terms of availability, usage and any associated difficulties. Specifically, respondents were required to identify any particular difficulties associated with the use of respiratory protection, ear defenders, eye protection and chemical gloves. Again, the 9 categories of difficulties that might be associated with these forms of PPE was developed from informed advice and pilot testing. An open-ended response box was also provided to allow respondents to express any concerns about the effectiveness of PPE available to them. Finally in this section, respondents were asked to indicate whether they had received formal training or instruction in the past 12 months in a number of key occupational health areas. Specifically, respondents were asked whether they had participated in training relating to manual handling, correct use of PPE, COSHH, safe use of tools, noise, and hand arm vibration (HAVS). Three response options were available: ‘Yes’, ‘No – but would be useful for my work’ and ‘No – would be irrelevant for my work’. Nutrition & Fitness (Section 4) The aim of Section 4 was to broadly uncover the lifestyle choices made by the workforce relating to diet, alcohol consumption, smoking behaviour, exercise, health improvement goals. This section also included an evaluation of the muscular pain experienced by respondents and a measurement of both colleague support for health and employer health orientation. At the outset, respondents were asked to rate their health as either excellent, very good, good, fair or poor. They were also asked to supply details of their weight and height for subsequent calculation of Body Mass Index (BMI). In relation to their diet they were asked to characterise their diet offshore and onshore in terms of the following descriptions; extremely healthy, very healthy, moderately healthy, not very healthy, unhealthy. They were asked to indicate whether they had received any information on the installation about healthy eating and whether they found it difficult to ensure their diet offshore was healthy. An open-box was also provided for further comments (see Appendix I). The following short sub-section addressed smoking behaviour (‘I am a smoker’, ‘I used to smoke but have given up completely’ or ‘I have never smoked’) and respondents were required to indicate the typical form this behaviour took (cigars, pipe tobacco, cigarettes). The next sub-section requested details of alcohol consumption including frequency of consumption and number of units consumed. Respondents were also asked whether they felt their present level of alcohol consumption was harmful to their health. Before the next sub-section concerning physical activity, a definition was supplied for each level of response. According to these definitions, while No/Little exercise was self explanatory, light-moderate exercise was defined as ‘regular moderate physical activity that leaves you a little out of breath, at least 30 minutes, three times a week’ and heavy exercise was defined as ‘regular vigorous physical exercise (such as running, rowing or swimming) several times a week’. SHAW Health Promotion professionals endorsed these definitions. Within this sub-section, respondents were required to identify their level of physical activity both on and offshore. Respondents who indicated little or no physical activity were required to indicate why this was the case and six possible options (‘Poor gym facilities offshore’; ‘Too tired after work’;
23
‘Dislike working out in gyms’; ‘Gym always too busy’; ‘Have no interest in exercise’; ‘Injury prevents exercise’) were provided in addition to a space for submitting other reasons. Respondents were then asked to indicate whether they were currently making an active attempt at health improvements in the following areas: weight loss, getting fit, smoking cessation, reducing alcohol consumption or other health improvement. Respondents attempting to improve their health were asked whether they felt enough support was available on the installation (in the form of advice, information, guidance etc) to help them make the necessary changes. An open box was provided for respondents to note what worksite provisions would help them make changes to improve their health and general well-being. Respondents were then questioned about their experience of muscular pain, specifically recurring muscular pain. They were asked to identify the body location of the pain and whether the pain was originally caused by an incident occurring at home, offshore while working or offshore while off shift. Participants were also given a “Don’t really know” response option. In this sub-section, respondents were also asked to indicate whether any aspect of their work offshore made this muscular pain worse and whether they had received any support (in the form of advice, information, guidance etc) on the installation to help them manage and reduce their muscular pain. The next sub-section concerned social support from colleagues in the work environment relating specifically to healthy or health improvement behaviours. The aim of this scale was to gauge the climate and support for healthy behaviours between colleagues in the workplace. This scale was originally sourced from Ribisl and Reischl’s (1993) Worksite Health Climate scale and comprised the subscale used to assess Support for Healthy Behaviours. This original scale required some modification for use within the offshore environment and these modifications were made following consultation with HSE managers and the original pilot test of the questionnaire. The resultant scale comprised nine-items and a five-point response scale (1= Strongly Disagree; 5 = Strongly Agree). Examples of these scale items include: “My colleagues would support me if I was trying to adopt good health habits”; “My colleagues would not ridicule anyone here for trying to look after or improve their health” and “My colleagues are interested in hearing about new health information or advice”. The final sub-section of Section 4 sought to measure employee perceptions of their employer’s commitment to workforce health. Again, this short scale (4 items) was derived from Ribisl and Reischl’s Worksite Health Climate Scale and comprised the four items contained in the Employer Health Orientation subsection. Again these items were slightly modified for use in the offshore workplace. Examples of the scale items include: “This operating company values healthy workers” and “It is easy to see that the operating company’s top management has a commitment to improving employee health”. Health Promotion in Your Workplace (Section 5) Section 5 Health Promotion in Your Workplace sought to examine employee awareness and assessment of any health promotion activities taking place on the installation. At the outset, respondents were asked if they had been aware of any organised health promotion activities taking place on the installation and whether they had taken part in any of these activities. Those who did not take part in any activities were required to indicate why this was the case. Five possible reasons for non-participation, based on earlier pilot work, were suggested along with a space for detailing another reason. The suggested reasons included: “Didn’t know about these activities”; “Too tired after work”; “Dislike organised activities”; “There were no activities of interest to me available” and “Too busy with work”.
24
The second part of this section addressed the perceived involvement of the medic in the general health and well being of the workforce. Respondents were asked whether they had ever asked the medic how they might improve their general health or fitness and whether the medic had ever offered them unsolicited advice on the matter during an unrelated consultation. Respondents were also asked whether they had ever felt ill but not reported to the medic in order to avoid a medical referral onshore. Finally, respondents were provided with an open space to suggest what could be done to improve their personal health on the installation. Perceptions of Health & Safety on this Installation (Section 6) The first part of Section 6 sought to determine the climate for both health and safety on the installation through the use of a scale developed by Basen-Engquist, Hudson, Tripp and Chamberlain (1998). These health and safety climate scales were originally developed to “provide useful instruments for measuring organizational change related to worksite health promotion activities” (ibid., p. 111). The original scale incorporated eighteen items, which subsequently factored into a 6-item Safety Climate scale and a 5-item Health climate scale. In the current study, we used the original eighteen items to determine whether the same factor structure was applicable to the offshore workforce. As with previous scales some of the items were slightly modified for use offshore, however, we retained the original questions where possible. Examples of questions included in the Safety Climate measure included: “Most people here are very safety conscious”, “Supervisors always enforce safety rules” and “Equipment is always kept in a safe operating condition”. Examples of Health Climate items included: “Most employees here are very health conscious”, “At my workplace, sometimes we talk to each other about improving our health and preventing disease” and “Health related rules (smoking policies, requirements about medical examinations etc.) are always enforced”. The second part of this section consisted of a risk-taking scale developed from a seven-item scale used by Rundmo (1992) in the Norwegian offshore industry. This scale has also been used previously in a number of UK Offshore Safety Climate Surveys (Mearns, Flin, Gordon & Fleming, 1998; Mearns, Whitaker & Flin, 2001, 2003). The scale measures respondents’ self-reports of how often they engage in potentially unsafe acts with the response options ‘Never’, ‘Sometimes’ and ‘Always’. The types of behaviour under consideration in the scale included “I take chances to get the job done”, “I bend the rules to achieve a target” and “I take shortcuts which involve little or no risk”. Working on this Installation (Section 7) This final section had the aim of identifying the level of workplace commitment demonstrated by the workforce. Workplace commitment is essentially a positive construct that integrates worker attachments and loyalty towards their workplace and their support of organizational goals in that workplace. The scale used to measure this construct comprised 7 items derived from two pre-existing scales. The first two items (“People here complain without a valid motive”; “People here try to bypass company regulations”) were developed from Simard and Marchand’s (1994) original scale in line with previous use with an offshore sample (O’Dea, 2001). An item from Simard and Marchand’s (1994) cohesion and co-operation scale (“People here co-operate with management to achieve organizational goals”) was also developed for inclusion. The workplace commitment scale also included four items from Kivimaki, Kalimo and Salminen’s (1995) scale. Examples of these items include: “I am willing to put in a great deal of effort in order to help this installation to be effective” and “I am motivated to achieve the goals set by management”. Respondents indicated their level of agreement with each statement on a 5-point scale (1 = Strongly disagree).
25
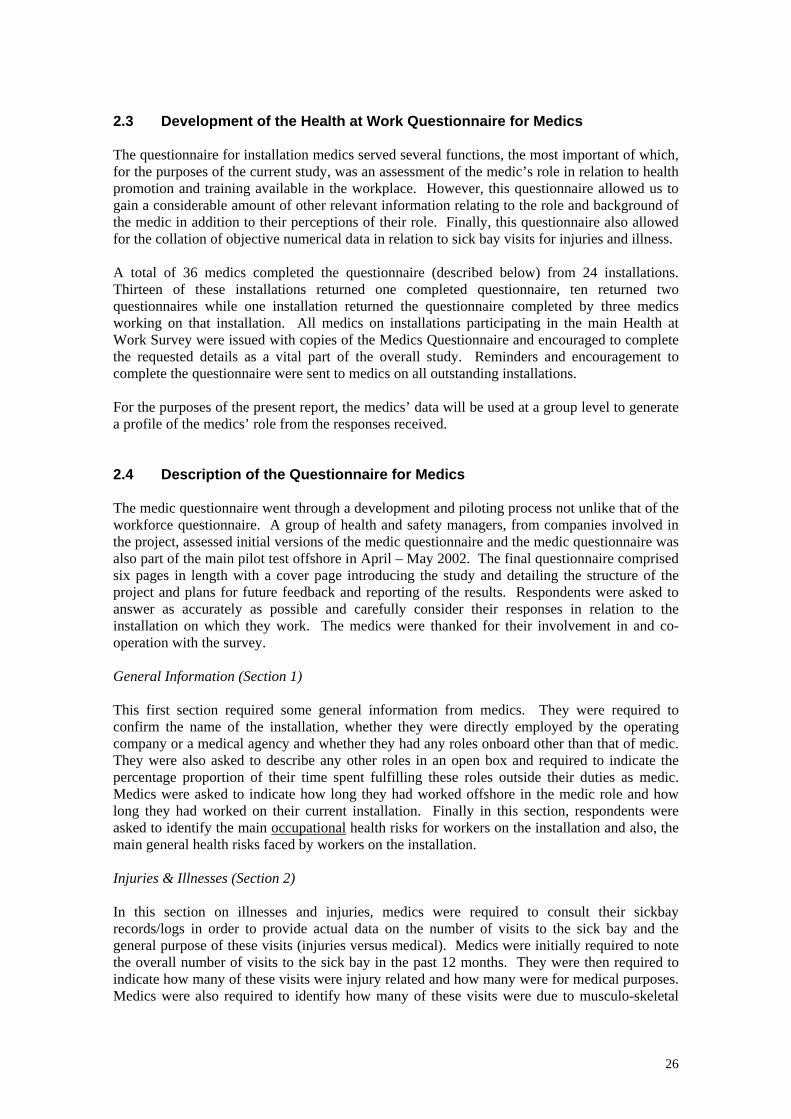
2.3 Development of the Health at Work Questionnaire for Medics The questionnaire for installation medics served several functions, the most important of which, for the purposes of the current study, was an assessment of the medic’s role in relation to health promotion and training available in the workplace. However, this questionnaire allowed us to gain a considerable amount of other relevant information relating to the role and background of the medic in addition to their perceptions of their role. Finally, this questionnaire also allowed for the collation of objective numerical data in relation to sick bay visits for injuries and illness. A total of 36 medics completed the questionnaire (described below) from 24 installations. Thirteen of these installations returned one completed questionnaire, ten returned two questionnaires while one installation returned the questionnaire completed by three medics working on that installation. All medics on installations participating in the main Health at Work Survey were issued with copies of the Medics Questionnaire and encouraged to complete the requested details as a vital part of the overall study. Reminders and encouragement to complete the questionnaire were sent to medics on all outstanding installations. For the purposes of the present report, the medics’ data will be used at a group level to generate a profile of the medics’ role from the responses received. 2.4 Description of the Questionnaire for Medics The medic questionnaire went through a development and piloting process not unlike that of the workforce questionnaire. A group of health and safety managers, from companies involved in the project, assessed initial versions of the medic questionnaire and the medic questionnaire was also part of the main pilot test offshore in April – May 2002. The final questionnaire comprised six pages in length with a cover page introducing the study and detailing the structure of the project and plans for future feedback and reporting of the results. Respondents were asked to answer as accurately as possible and carefully consider their responses in relation to the installation on which they work. The medics were thanked for their involvement in and co-operation with the survey. General Information (Section 1) This first section required some general information from medics. They were required to confirm the name of the installation, whether they were directly employed by the operating company or a medical agency and whether they had any roles onboard other than that of medic. They were also asked to describe any other roles in an open box and required to indicate the percentage proportion of their time spent fulfilling these roles outside their duties as medic. Medics were asked to indicate how long they had worked offshore in the medic role and how long they had worked on their current installation. Finally in this section, respondents were asked to identify the main occupational health risks for workers on the installation and also, the main general health risks faced by workers on the installation. Injuries & Illnesses (Section 2) In this section on illnesses and injuries, medics were required to consult their sickbay records/logs in order to provide actual data on the number of visits to the sick bay and the general purpose of these visits (injuries versus medical). Medics were initially required to note the overall number of visits to the sick bay in the past 12 months. They were then required to indicate how many of these visits were injury related and how many were for medical purposes. Medics were also required to identify how many of these visits were due to musculo-skeletal
26

pain and where possible they were asked to detail the percentage of these injuries resulting from any incident occurring at home, offshore while working and offshore while offshift. They were also required to detail how many of these musculo-skeletal injuries resulted in repeat visits to the sick bay following the initial visits. In this section, medics were required to note how many medevacs from the platform had taken place in the previous twelve months. Finally, medics were asked whether any of these medevacs involved cardiac problems. Health Surveillance (Section 3) This section sought to determine the health surveillance carried out on the installation. The first question in this section addressed the dissemination of information and the medic was asked to identify the main way in which employees are informed about the risks of their work to their health. Six response options were provided representing including: “Organised education/information meetings”, “Information leaflets/posters in the workplace”, “Information leaflets/posters in the recreation areas”, “By their supervisor”, “By the medic” or “No formal information procedure”. An open-box was provided for any further comments. Medics were then required to supply details of health checks (in addition to the required UKOOA medical and necessary health surveillance under COSHH) carried out on both operating and contracting employees. They were then required to indicate the number of individuals working with handheld power tools who had received health surveillance for related conditions and how often this health surveillance was carried out. The same information was requested in relation to skin surveillance and respiratory surveillance. Finally, respondents were asked how frequently levels of exposure to fumes/chemicals were re-assessed to detect changes in exposure. Health Education & Promotion (Section 4) The aim of Section 4 was to determine the actual level of health promotion activity on the installation, the role and knowledge of the medic in relation to that activity and the provision of workforce training in occupational health. Medics were required to indicate whether any organised personal health promotion programmes or initiatives had taken place on the installation in the previous twelve months. Four main areas for personal health promotion (Lose Weight, Stop Smoking, Get Fit and Healthy Eating) were indicated and respondents were required to identify any health promotion activities in these areas. Space was also provided for a full outline of all health promotion programmes taking place on the installation. The next sub-section consisted of a seven item scale designed to determine the medic’s involvement in health promotion from the designing of health promotion programmes, the implementation of these programmes, the evaluation of programmes and the securing of company resources for health promotion activities. The five-point response scale allowed medics to indicate a ‘Never’, ‘Rarely’, ‘Sometimes’, ‘Often’ and ‘Very often’ response. Medics were also asked to indicate the percentage of visits to the sickbay solely for advice relating to personal health improvement. With regard to knowledge and professional training for medics in the field of health promotion, respondents were asked to rate their own knowledge/interest as either ‘Good’ (have received training in nutrition and fitness and understand the most recent theories about the links between diet, fitness and heart disease); ‘Adequate’ (no formal training but am interested in nutrition and fitness issues and often read articles/books on nutrition, fitness & health) or ‘Poor’ (I am not particularly interested in nutrition and fitness issues). Medics were asked to indicate whether
27
they had ever received any formal training in health promotion, diet and nutrition, exercise and fitness, stress management, identifying occupational diseases or any other similar training. In relation to the provision of training courses for the workforce, respondents were asked whether there had been training in any of the following occupational health areas: stress, avoiding skin problems, safe manual handling, safe use of hand held power tools, maintaining a healthy back and proper use of PPE. Again, space was provided for details of any other relevant workforce training. Finally, respondents were asked to provide details of any facilities for health improvement available on the installation (e.g. gym, visits by health professionals, etc). Evaluation (Section 5) This final section of the medics questionnaire focused on the evaluation of existing health promotion initiatives and health management strategies. At the outset, respondents were asked to rate (separately) the extent to which both occupational and general health risks are adequately addressed by existing health management/health promotion strategies. Medics were also asked to indicate how (and by whom) health promotion programmes were evaluated on the installation. With regard to the workforce attitudes towards health promotion, medics were asked whether they had noted a change in workforce health since the introduction of health promotion programmes and also, whether they felt the workforce on the installation would be receptive to (further) health promotion initiatives. This section also sought details of any awards (e.g. SHAW awards) received by the installation for health promotion activities and/or current involvement in health award schemes. Finally, medics were required to rate (on a 5-point scale) the extent to which they believed the operating company is committed to improving the health of the workforce (1=Strongly committed). An open-box was provided for any concluding or additional comments. 2.5 Summary This chapter comprehensively describes the development and dissemination of two questionnaires: the Health at Work Questionnaire (targeting the workforce in general) and the Health at Work Questionnaire for Medics. Both questionnaires sought to gather self-reported attitudinal and behavioural data in addition to other objective data relating to personal and occupational health management on offshore installations. Both questionnaires were designed and developed to address various aspects of specific research questions concerned with the potential relationships between health promotion and health surveillance activities and the overall safety and well-being of the offshore worker. The following chapters deal with the in-depth analysis of results obtained using these measures. Chapter 3 details the full descriptive statistics for responses to the Health at Work Questionnaire while Chapter 4 presents the results of the Health at Work Questionnaires for Medics. Chapter 5 presents statistical analyses exploring the relationships between health promotion and health surveillance activities and the safety and well-being of the offshore worker.
28
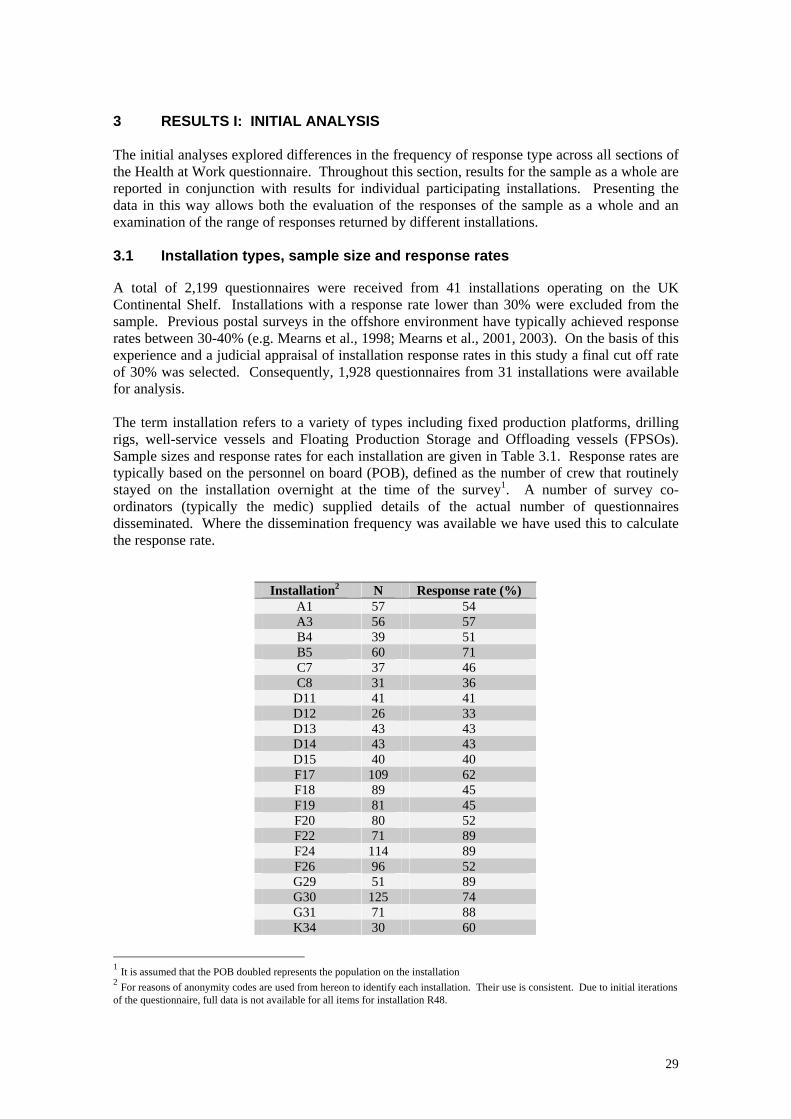
3 RESULTS I: INITIAL ANALYSIS The initial analyses explored differences in the frequency of response type across all sections of the Health at Work questionnaire. Throughout this section, results for the sample as a whole are reported in conjunction with results for individual participating installations. Presenting the data in this way allows both the evaluation of the responses of the sample as a whole and an examination of the range of responses returned by different installations. 3.1 Installation types, sample size and response rates A total of 2,199 questionnaires were received from 41 installations operating on the UK Continental Shelf. Installations with a response rate lower than 30% were excluded from the sample. Previous postal surveys in the offshore environment have typically achieved response rates between 30-40% (e.g. Mearns et al., 1998; Mearns et al., 2001, 2003). On the basis of this experience and a judicial appraisal of installation response rates in this study a final cut off rate of 30% was selected. Consequently, 1,928 questionnaires from 31 installations were available for analysis. The term installation refers to a variety of types including fixed production platforms, drilling rigs, well-service vessels and Floating Production Storage and Offloading vessels (FPSOs). Sample sizes and response rates for each installation are given in Table 3.1. Response rates are typically based on the personnel on board (POB), defined as the number of crew that routinely stayed on the installation overnight at the time of the survey1. A number of survey co-ordinators (typically the medic) supplied details of the actual number of questionnaires disseminated. Where the dissemination frequency was available we have used this to calculate the response rate.
Installation2 N Response rate (%) A1 57 54 A3 56 57 B4 39 51 B5 60 71 C7 37 46 C8 31 36
D11 41 41 D12 26 33 D13 43 43 D14 43 43 D15 40 40 F17 109 62 F18 89 45 F19 81 45 F20 80 52 F22 71 89 F24 114 89 F26 96 52 G29 51 89 G30 125 74 G31 71 88 K34 30 60
1 It is assumed that the POB doubled represents the population on the installation 2 For reasons of anonymity codes are used from hereon to identify each installation. Their use is consistent. Due to initial iterations of the questionnaire, full data is not available for all items for installation R48.
29

K35 73 83 R47 24 30 R48 107 76 R49 81 51 R51 54 60 R59 63 39 R65 21 42 R66 37 37 S68 78 96
Total 1928 57.23 Mean Table 3.1 Sample size and response rates across 31 installations
Following the exclusion of response rates lower than 30%, the rate for remaining installations ranged between 33% and 96% with a mean of 57.23%. Clearly the response rate may depend upon the style of administration of questionnaires on each platform, as well as motivation bias. In addition, a number of installations returning low response rates were in the process of decommissioning by the time the survey took place. 3.2 Demographic information Job responsibilities were varied. Table 3.2 provides percentages within each of the seven most common occupations. Installations differed considerably in the proportions within each occupation, reflecting the type of operations with which each installation is concerned. Overall, the largest contingent worked in the area of maintenance followed by drilling and administration/management.
Install Admin/ Mgmt
Drilling Maintenance Operations Deck Crew Catering Others
A1 13 0 46 7 4 6 0 A3 11 8 21 17 2 2 4 B4 8 0 47 3 0 5 8 B5 9 4 54 3 2 12 4 C7 14 44 14 3 3 3 19 C8 29 16 32 3 10 6 3
D11 17 27 35 2 2 7 10 D12 12 12 24 0 12 36 4 D13 20 27 23 2 5 10 13 D14 5 39 9 0 28 5 9 D15 20 27 23 2 5 10 13 F17 14 27 23 7 11 6 10 F18 14 33 9 4 11 6 8 F19 15 18 18 10 16 6 17 F20 6 31 10 13 5 10 22 F22 15 28 20 8 5 10 13 F24 10 28 22 7 14 7 12 F26 15 28 19 8 5 10 13 G29 10 0 27 17 4 12 6 G30 8 10 16 12 10 10 5 G31 10 0 35 7 4 14 3 K34 7 0 30 0 3 17 23 K35 14 1 32 7 7 16 6 R47 21 0 33 4 8 0 13 R48 14 0 18 23 9 5 4 R49 24 3 25 9 4 3 10 R51 23 2 20 10 4 8 15
30
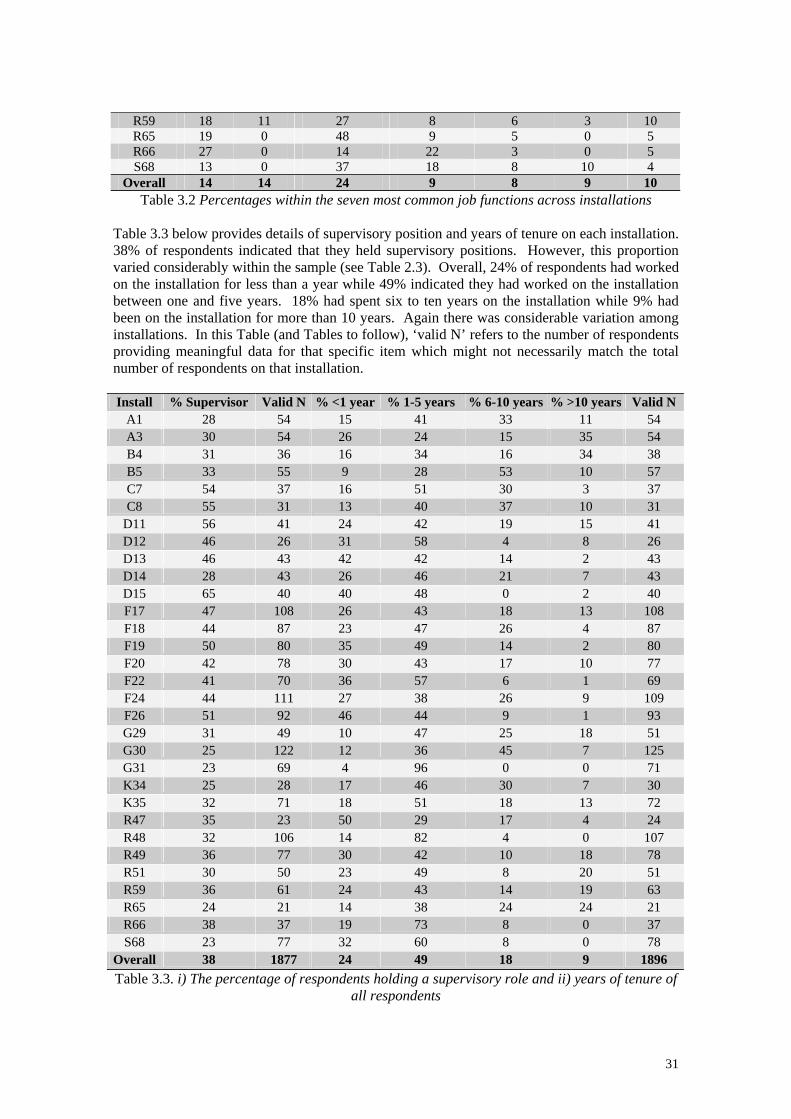
R59 18 11 27 8 6 3 10 R65 19 0 48 9 5 0 5 R66 27 0 14 22 3 0 5 S68 13 0 37 18 8 10 4
Overall 14 14 24 9 8 9 10 Table 3.2 Percentages within the seven most common job functions across installations
Table 3.3 below provides details of supervisory position and years of tenure on each installation. 38% of respondents indicated that they held supervisory positions. However, this proportion varied considerably within the sample (see Table 2.3). Overall, 24% of respondents had worked on the installation for less than a year while 49% indicated they had worked on the installation between one and five years. 18% had spent six to ten years on the installation while 9% had been on the installation for more than 10 years. Again there was considerable variation among installations. In this Table (and Tables to follow), ‘valid N’ refers to the number of respondents providing meaningful data for that specific item which might not necessarily match the total number of respondents on that installation. Install % Supervisor Valid N % <1 year % 1-5 years % 6-10 years % >10 years Valid N
A1 28 54 15 41 33 11 54 A3 30 54 26 24 15 35 54 B4 31 36 16 34 16 34 38 B5 33 55 9 28 53 10 57 C7 54 37 16 51 30 3 37 C8 55 31 13 40 37 10 31
D11 56 41 24 42 19 15 41 D12 46 26 31 58 4 8 26 D13 46 43 42 42 14 2 43 D14 28 43 26 46 21 7 43 D15 65 40 40 48 0 2 40 F17 47 108 26 43 18 13 108 F18 44 87 23 47 26 4 87 F19 50 80 35 49 14 2 80 F20 42 78 30 43 17 10 77 F22 41 70 36 57 6 1 69 F24 44 111 27 38 26 9 109 F26 51 92 46 44 9 1 93 G29 31 49 10 47 25 18 51 G30 25 122 12 36 45 7 125 G31 23 69 4 96 0 0 71 K34 25 28 17 46 30 7 30 K35 32 71 18 51 18 13 72 R47 35 23 50 29 17 4 24 R48 32 106 14 82 4 0 107 R49 36 77 30 42 10 18 78 R51 30 50 23 49 8 20 51 R59 36 61 24 43 14 19 63 R65 24 21 14 38 24 24 21 R66 38 37 19 73 8 0 37 S68 23 77 32 60 8 0 78
Overall 38 1877 24 49 18 9 1896 Table 3.3. i) The percentage of respondents holding a supervisory role and ii) years of tenure of
all respondents
31
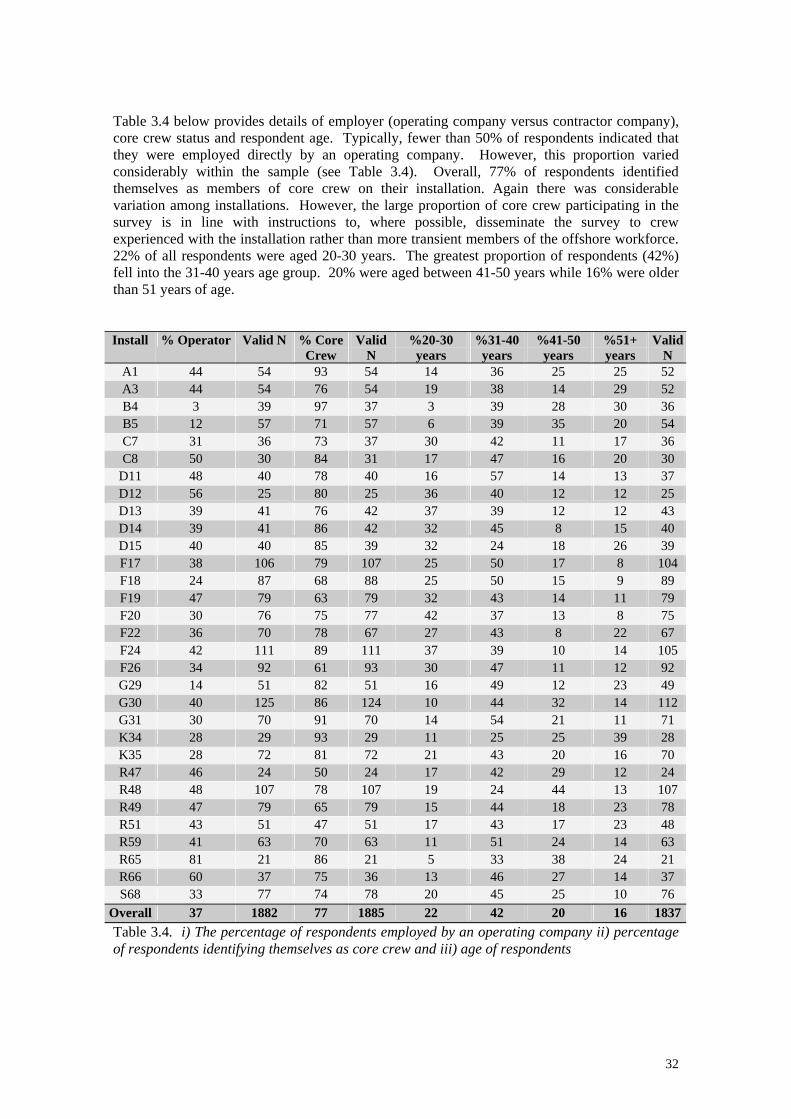
Table 3.4 below provides details of employer (operating company versus contractor company), core crew status and respondent age. Typically, fewer than 50% of respondents indicated that they were employed directly by an operating company. However, this proportion varied considerably within the sample (see Table 3.4). Overall, 77% of respondents identified themselves as members of core crew on their installation. Again there was considerable variation among installations. However, the large proportion of core crew participating in the survey is in line with instructions to, where possible, disseminate the survey to crew experienced with the installation rather than more transient members of the offshore workforce. 22% of all respondents were aged 20-30 years. The greatest proportion of respondents (42%) fell into the 31-40 years age group. 20% were aged between 41-50 years while 16% were older than 51 years of age. Install % Operator Valid N % Core
Crew Valid
N %20-30
years %31-40
years %41-50
years %51+ years
Valid N
A1 44 54 93 54 14 36 25 25 52 A3 44 54 76 54 19 38 14 29 52 B4 3 39 97 37 3 39 28 30 36 B5 12 57 71 57 6 39 35 20 54 C7 31 36 73 37 30 42 11 17 36 C8 50 30 84 31 17 47 16 20 30
D11 48 40 78 40 16 57 14 13 37 D12 56 25 80 25 36 40 12 12 25 D13 39 41 76 42 37 39 12 12 43 D14 39 41 86 42 32 45 8 15 40 D15 40 40 85 39 32 24 18 26 39 F17 38 106 79 107 25 50 17 8 104 F18 24 87 68 88 25 50 15 9 89 F19 47 79 63 79 32 43 14 11 79 F20 30 76 75 77 42 37 13 8 75 F22 36 70 78 67 27 43 8 22 67 F24 42 111 89 111 37 39 10 14 105 F26 34 92 61 93 30 47 11 12 92 G29 14 51 82 51 16 49 12 23 49 G30 40 125 86 124 10 44 32 14 112 G31 30 70 91 70 14 54 21 11 71 K34 28 29 93 29 11 25 25 39 28 K35 28 72 81 72 21 43 20 16 70 R47 46 24 50 24 17 42 29 12 24 R48 48 107 78 107 19 24 44 13 107 R49 47 79 65 79 15 44 18 23 78 R51 43 51 47 51 17 43 17 23 48 R59 41 63 70 63 11 51 24 14 63 R65 81 21 86 21 5 33 38 24 21 R66 60 37 75 36 13 46 27 14 37 S68 33 77 74 78 20 45 25 10 76
Overall 37 1882 77 1885 22 42 20 16 1837Table 3.4. i) The percentage of respondents employed by an operating company ii) percentage of respondents identifying themselves as core crew and iii) age of respondents
32
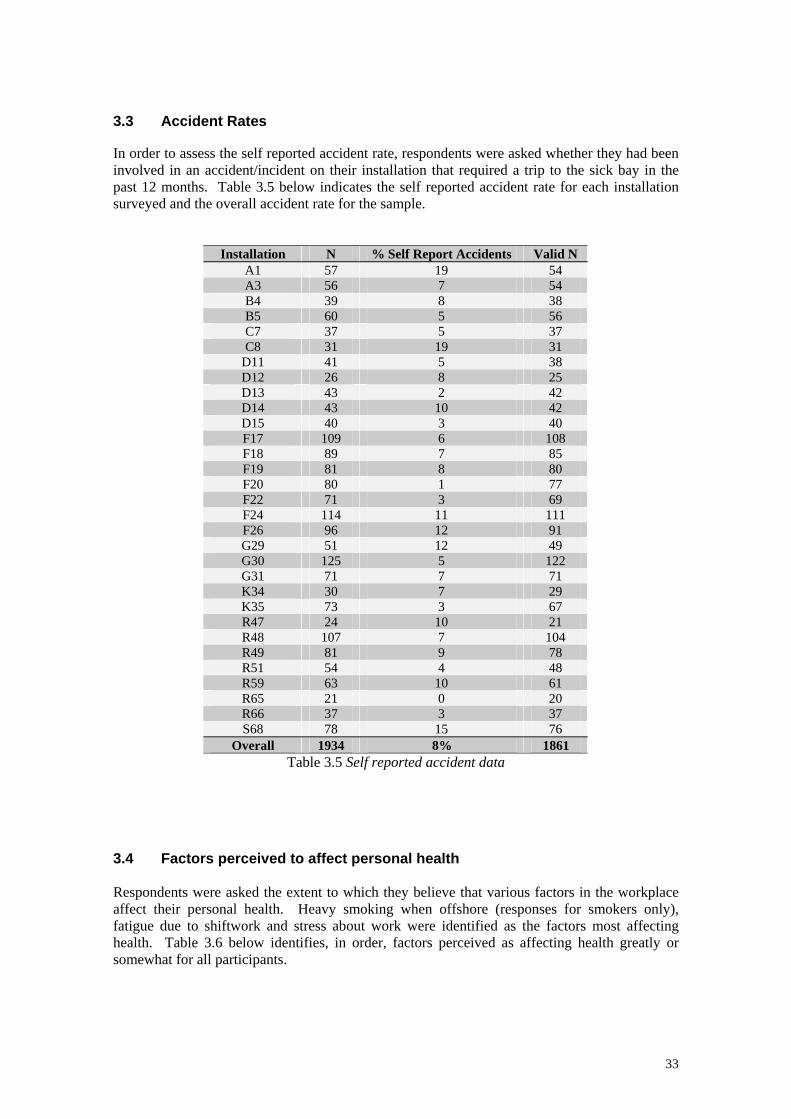
3.3 Accident Rates In order to assess the self reported accident rate, respondents were asked whether they had been involved in an accident/incident on their installation that required a trip to the sick bay in the past 12 months. Table 3.5 below indicates the self reported accident rate for each installation surveyed and the overall accident rate for the sample.
Installation N % Self Report Accidents Valid N A1 57 19 54 A3 56 7 54 B4 39 8 38 B5 60 5 56 C7 37 5 37 C8 31 19 31
D11 41 5 38 D12 26 8 25 D13 43 2 42 D14 43 10 42 D15 40 3 40 F17 109 6 108 F18 89 7 85 F19 81 8 80 F20 80 1 77 F22 71 3 69 F24 114 11 111 F26 96 12 91 G29 51 12 49 G30 125 5 122 G31 71 7 71 K34 30 7 29 K35 73 3 67 R47 24 10 21 R48 107 7 104 R49 81 9 78 R51 54 4 48 R59 63 10 61 R65 21 0 20 R66 37 3 37 S68 78 15 76
Overall 1934 8% 1861 Table 3.5 Self reported accident data
3.4 Factors perceived to affect personal health Respondents were asked the extent to which they believe that various factors in the workplace affect their personal health. Heavy smoking when offshore (responses for smokers only), fatigue due to shiftwork and stress about work were identified as the factors most affecting health. Table 3.6 below identifies, in order, factors perceived as affecting health greatly or somewhat for all participants.
33
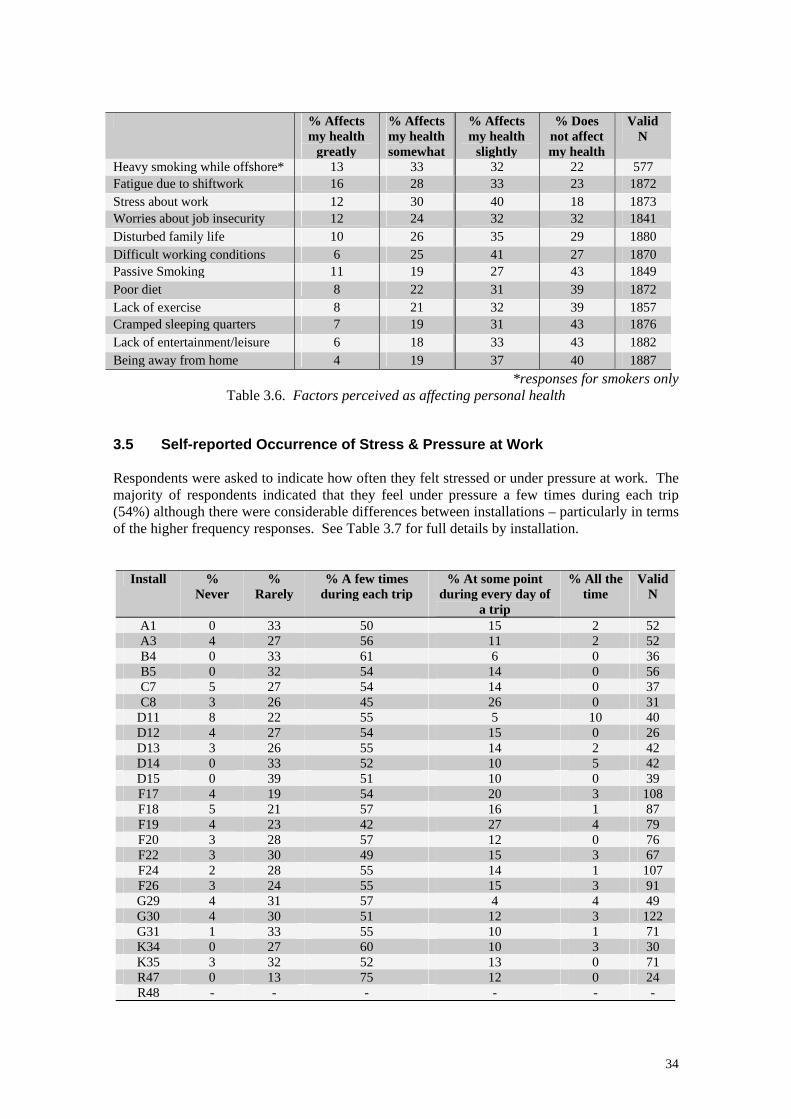
% Affects my health
greatly
% Affects my health somewhat
% Affects my health
slightly
% Does not affect my health
Valid N
Heavy smoking while offshore* 13 33 32 22 577 Fatigue due to shiftwork 16 28 33 23 1872 Stress about work 12 30 40 18 1873 Worries about job insecurity 12 24 32 32 1841 Disturbed family life 10 26 35 29 1880 Difficult working conditions 6 25 41 27 1870 Passive Smoking 11 19 27 43 1849 Poor diet 8 22 31 39 1872 Lack of exercise 8 21 32 39 1857 Cramped sleeping quarters 7 19 31 43 1876 Lack of entertainment/leisure 6 18 33 43 1882 Being away from home 4 19 37 40 1887
*responses for smokers only Table 3.6. Factors perceived as affecting personal health
3.5 Self-reported Occurrence of Stress & Pressure at Work Respondents were asked to indicate how often they felt stressed or under pressure at work. The majority of respondents indicated that they feel under pressure a few times during each trip (54%) although there were considerable differences between installations – particularly in terms of the higher frequency responses. See Table 3.7 for full details by installation.
Install % Never
% Rarely
% A few times during each trip
% At some point during every day of
a trip
% All the time
Valid N
A1 0 33 50 15 2 52 A3 4 27 56 11 2 52 B4 0 33 61 6 0 36 B5 0 32 54 14 0 56 C7 5 27 54 14 0 37 C8 3 26 45 26 0 31
D11 8 22 55 5 10 40 D12 4 27 54 15 0 26 D13 3 26 55 14 2 42 D14 0 33 52 10 5 42 D15 0 39 51 10 0 39 F17 4 19 54 20 3 108 F18 5 21 57 16 1 87 F19 4 23 42 27 4 79 F20 3 28 57 12 0 76 F22 3 30 49 15 3 67 F24 2 28 55 14 1 107 F26 3 24 55 15 3 91 G29 4 31 57 4 4 49 G30 4 30 51 12 3 122 G31 1 33 55 10 1 71 K34 0 27 60 10 3 30 K35 3 32 52 13 0 71 R47 0 13 75 12 0 24 R48 - - - - - -
34
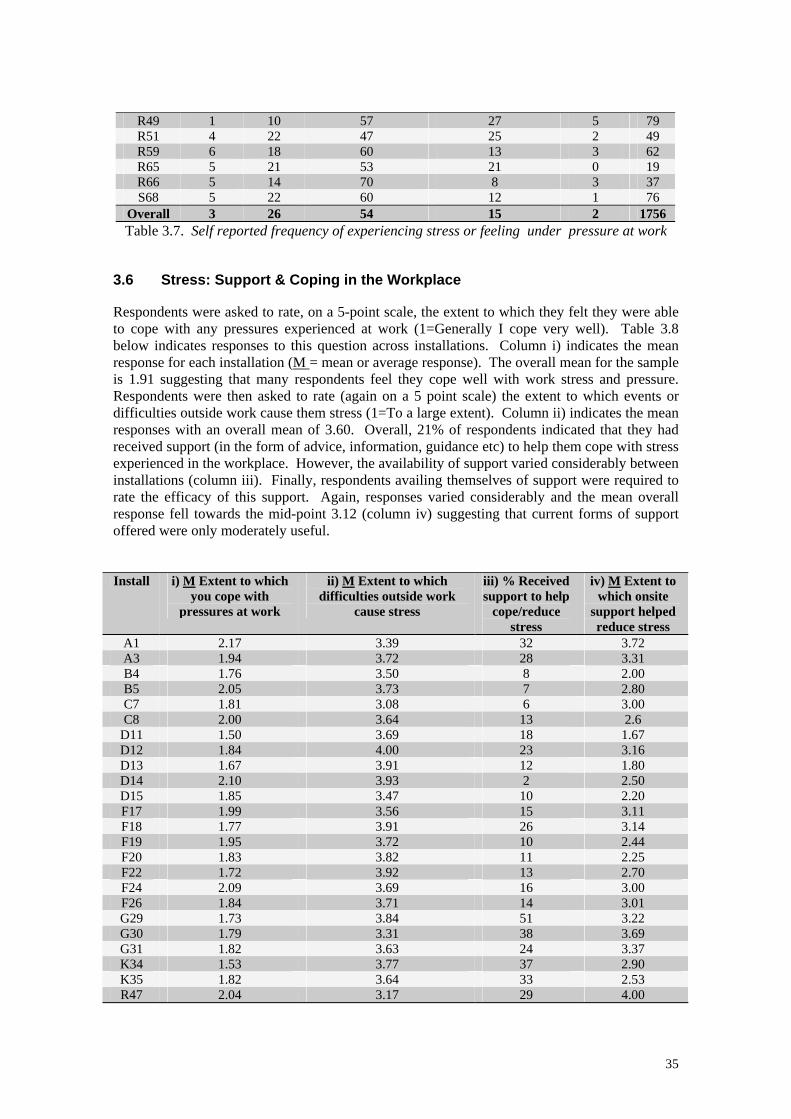
R49 1 10 57 27 5 79 R51 4 22 47 25 2 49 R59 6 18 60 13 3 62 R65 5 21 53 21 0 19 R66 5 14 70 8 3 37 S68 5 22 60 12 1 76
Overall 3 26 54 15 2 1756 Table 3.7. Self reported frequency of experiencing stress or feeling under pressure at work
3.6 Stress: Support & Coping in the Workplace Respondents were asked to rate, on a 5-point scale, the extent to which they felt they were able to cope with any pressures experienced at work (1=Generally I cope very well). Table 3.8 below indicates responses to this question across installations. Column i) indicates the mean response for each installation (M = mean or average response). The overall mean for the sample is 1.91 suggesting that many respondents feel they cope well with work stress and pressure. Respondents were then asked to rate (again on a 5 point scale) the extent to which events or difficulties outside work cause them stress (1=To a large extent). Column ii) indicates the mean responses with an overall mean of 3.60. Overall, 21% of respondents indicated that they had received support (in the form of advice, information, guidance etc) to help them cope with stress experienced in the workplace. However, the availability of support varied considerably between installations (column iii). Finally, respondents availing themselves of support were required to rate the efficacy of this support. Again, responses varied considerably and the mean overall response fell towards the mid-point 3.12 (column iv) suggesting that current forms of support offered were only moderately useful. Install i) M Extent to which
you cope with pressures at work
ii) M Extent to which difficulties outside work
cause stress
iii) % Received support to help
cope/reduce stress
iv) M Extent to which onsite
support helped reduce stress
A1 2.17 3.39 32 3.72 A3 1.94 3.72 28 3.31 B4 1.76 3.50 8 2.00 B5 2.05 3.73 7 2.80 C7 1.81 3.08 6 3.00 C8 2.00 3.64 13 2.6
D11 1.50 3.69 18 1.67 D12 1.84 4.00 23 3.16 D13 1.67 3.91 12 1.80 D14 2.10 3.93 2 2.50 D15 1.85 3.47 10 2.20 F17 1.99 3.56 15 3.11 F18 1.77 3.91 26 3.14 F19 1.95 3.72 10 2.44 F20 1.83 3.82 11 2.25 F22 1.72 3.92 13 2.70 F24 2.09 3.69 16 3.00 F26 1.84 3.71 14 3.01 G29 1.73 3.84 51 3.22 G30 1.79 3.31 38 3.69 G31 1.82 3.63 24 3.37 K34 1.53 3.77 37 2.90 K35 1.82 3.64 33 2.53 R47 2.04 3.17 29 4.00
35
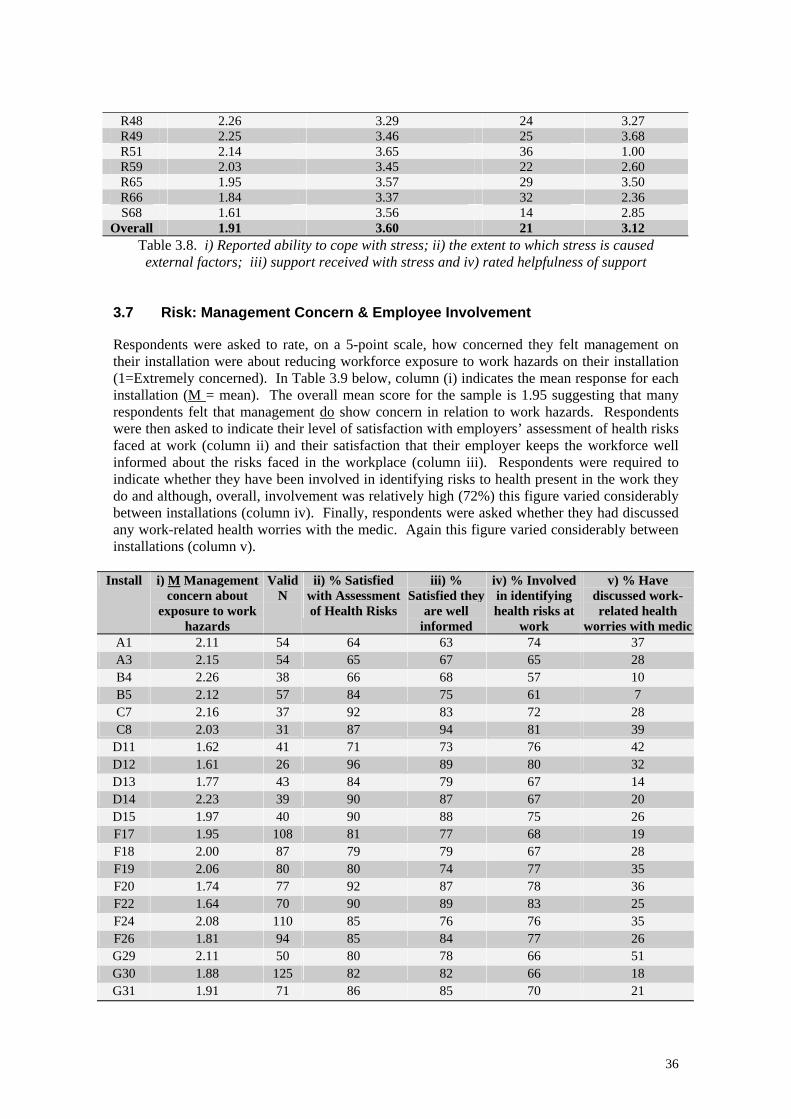
R48 2.26 3.29 24 3.27 R49 2.25 3.46 25 3.68 R51 2.14 3.65 36 1.00 R59 2.03 3.45 22 2.60 R65 1.95 3.57 29 3.50 R66 1.84 3.37 32 2.36 S68 1.61 3.56 14 2.85
Overall 1.91 3.60 21 3.12 Table 3.8. i) Reported ability to cope with stress; ii) the extent to which stress is caused external factors; iii) support received with stress and iv) rated helpfulness of support
3.7 Risk: Management Concern & Employee Involvement Respondents were asked to rate, on a 5-point scale, how concerned they felt management on their installation were about reducing workforce exposure to work hazards on their installation (1=Extremely concerned). In Table 3.9 below, column (i) indicates the mean response for each installation (M = mean). The overall mean score for the sample is 1.95 suggesting that many respondents felt that management do show concern in relation to work hazards. Respondents were then asked to indicate their level of satisfaction with employers’ assessment of health risks faced at work (column ii) and their satisfaction that their employer keeps the workforce well informed about the risks faced in the workplace (column iii). Respondents were required to indicate whether they have been involved in identifying risks to health present in the work they do and although, overall, involvement was relatively high (72%) this figure varied considerably between installations (column iv). Finally, respondents were asked whether they had discussed any work-related health worries with the medic. Again this figure varied considerably between installations (column v).
Install i) M Management concern about
exposure to work hazards
Valid N
ii) % Satisfied with Assessment of Health Risks
iii) % Satisfied they
are well informed
iv) % Involved in identifying health risks at
work
v) % Have discussed work-related health
worries with medicA1 2.11 54 64 63 74 37 A3 2.15 54 65 67 65 28 B4 2.26 38 66 68 57 10 B5 2.12 57 84 75 61 7 C7 2.16 37 92 83 72 28 C8 2.03 31 87 94 81 39
D11 1.62 41 71 73 76 42 D12 1.61 26 96 89 80 32 D13 1.77 43 84 79 67 14 D14 2.23 39 90 87 67 20 D15 1.97 40 90 88 75 26 F17 1.95 108 81 77 68 19 F18 2.00 87 79 79 67 28 F19 2.06 80 80 74 77 35 F20 1.74 77 92 87 78 36 F22 1.64 70 90 89 83 25 F24 2.08 110 85 76 76 35 F26 1.81 94 85 84 77 26 G29 2.11 50 80 78 66 51 G30 1.88 125 82 82 66 18 G31 1.91 71 86 85 70 21
36
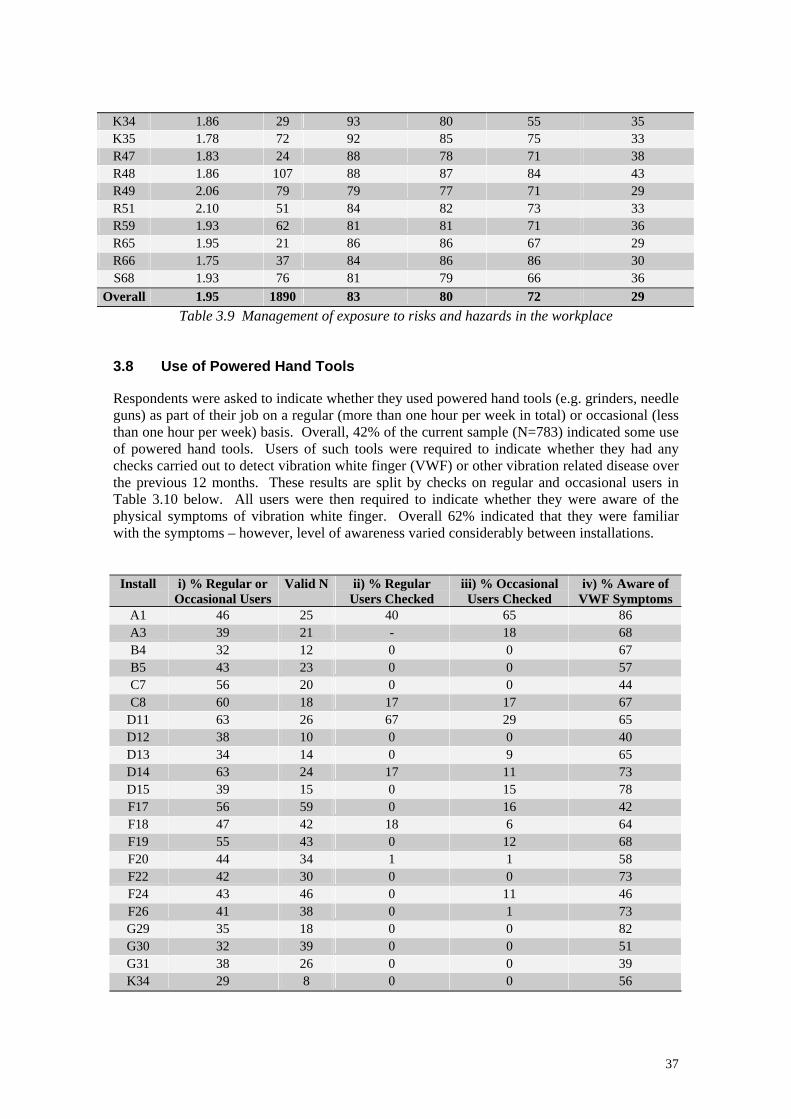
K34 1.86 29 93 80 55 35 K35 1.78 72 92 85 75 33 R47 1.83 24 88 78 71 38 R48 1.86 107 88 87 84 43 R49 2.06 79 79 77 71 29 R51 2.10 51 84 82 73 33 R59 1.93 62 81 81 71 36 R65 1.95 21 86 86 67 29 R66 1.75 37 84 86 86 30 S68 1.93 76 81 79 66 36
Overall 1.95 1890 83 80 72 29 Table 3.9 Management of exposure to risks and hazards in the workplace
3.8 Use of Powered Hand Tools Respondents were asked to indicate whether they used powered hand tools (e.g. grinders, needle guns) as part of their job on a regular (more than one hour per week in total) or occasional (less than one hour per week) basis. Overall, 42% of the current sample (N=783) indicated some use of powered hand tools. Users of such tools were required to indicate whether they had any checks carried out to detect vibration white finger (VWF) or other vibration related disease over the previous 12 months. These results are split by checks on regular and occasional users in Table 3.10 below. All users were then required to indicate whether they were aware of the physical symptoms of vibration white finger. Overall 62% indicated that they were familiar with the symptoms – however, level of awareness varied considerably between installations.
Install i) % Regular or Occasional Users
Valid N ii) % Regular Users Checked
iii) % Occasional Users Checked
iv) % Aware of VWF Symptoms
A1 46 25 40 65 86 A3 39 21 - 18 68 B4 32 12 0 0 67 B5 43 23 0 0 57 C7 56 20 0 0 44 C8 60 18 17 17 67
D11 63 26 67 29 65 D12 38 10 0 0 40 D13 34 14 0 9 65 D14 63 24 17 11 73 D15 39 15 0 15 78 F17 56 59 0 16 42 F18 47 42 18 6 64 F19 55 43 0 12 68 F20 44 34 1 1 58 F22 42 30 0 0 73 F24 43 46 0 11 46 F26 41 38 0 1 73 G29 35 18 0 0 82 G30 32 39 0 0 51 G31 38 26 0 0 39 K34 29 8 0 0 56
37
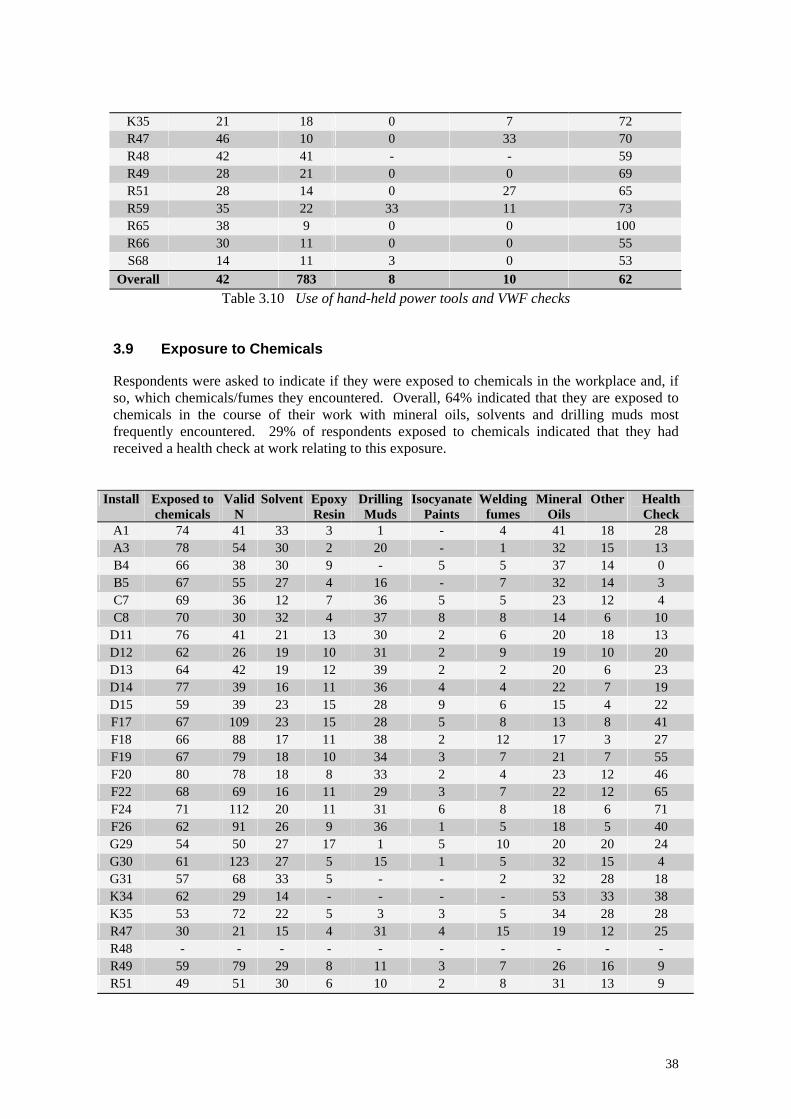
K35 21 18 0 7 72 R47 46 10 0 33 70 R48 42 41 - - 59 R49 28 21 0 0 69 R51 28 14 0 27 65 R59 35 22 33 11 73 R65 38 9 0 0 100 R66 30 11 0 0 55 S68 14 11 3 0 53
Overall 42 783 8 10 62 Table 3.10 Use of hand-held power tools and VWF checks
3.9 Exposure to Chemicals Respondents were asked to indicate if they were exposed to chemicals in the workplace and, if so, which chemicals/fumes they encountered. Overall, 64% indicated that they are exposed to chemicals in the course of their work with mineral oils, solvents and drilling muds most frequently encountered. 29% of respondents exposed to chemicals indicated that they had received a health check at work relating to this exposure.
Install Exposed to chemicals
Valid N
Solvent Epoxy Resin
Drilling Muds
Isocyanate Paints
Welding fumes
Mineral Oils
Other Health Check
A1 74 41 33 3 1 - 4 41 18 28 A3 78 54 30 2 20 - 1 32 15 13 B4 66 38 30 9 - 5 5 37 14 0 B5 67 55 27 4 16 - 7 32 14 3 C7 69 36 12 7 36 5 5 23 12 4 C8 70 30 32 4 37 8 8 14 6 10
D11 76 41 21 13 30 2 6 20 18 13 D12 62 26 19 10 31 2 9 19 10 20 D13 64 42 19 12 39 2 2 20 6 23 D14 77 39 16 11 36 4 4 22 7 19 D15 59 39 23 15 28 9 6 15 4 22 F17 67 109 23 15 28 5 8 13 8 41 F18 66 88 17 11 38 2 12 17 3 27 F19 67 79 18 10 34 3 7 21 7 55 F20 80 78 18 8 33 2 4 23 12 46 F22 68 69 16 11 29 3 7 22 12 65 F24 71 112 20 11 31 6 8 18 6 71 F26 62 91 26 9 36 1 5 18 5 40 G29 54 50 27 17 1 5 10 20 20 24 G30 61 123 27 5 15 1 5 32 15 4 G31 57 68 33 5 - - 2 32 28 18 K34 62 29 14 - - - - 53 33 38 K35 53 72 22 5 3 3 5 34 28 28 R47 30 21 15 4 31 4 15 19 12 25 R48 - - - - - - - - - - R49 59 79 29 8 11 3 7 26 16 9 R51 49 51 30 6 10 2 8 31 13 9
38
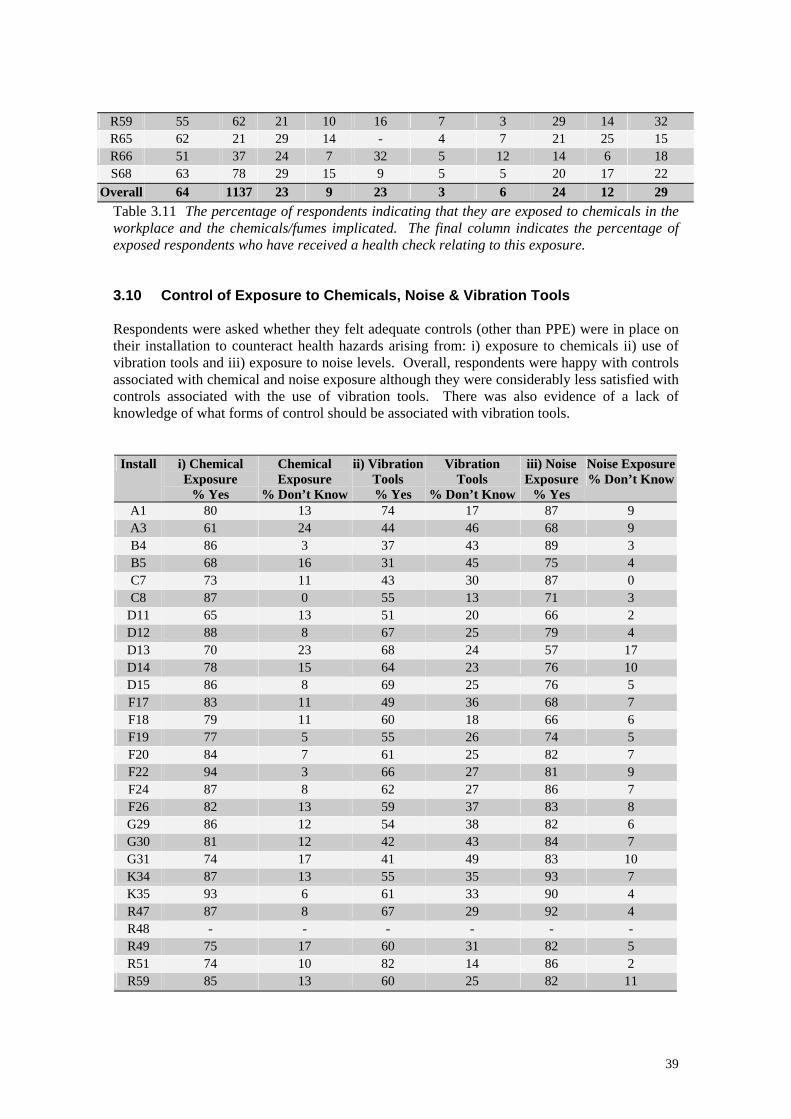
R59 55 62 21 10 16 7 3 29 14 32 R65 62 21 29 14 - 4 7 21 25 15 R66 51 37 24 7 32 5 12 14 6 18 S68 63 78 29 15 9 5 5 20 17 22
Overall 64 1137 23 9 23 3 6 24 12 29 Table 3.11 The percentage of respondents indicating that they are exposed to chemicals in the workplace and the chemicals/fumes implicated. The final column indicates the percentage of exposed respondents who have received a health check relating to this exposure. 3.10 Control of Exposure to Chemicals, Noise & Vibration Tools Respondents were asked whether they felt adequate controls (other than PPE) were in place on their installation to counteract health hazards arising from: i) exposure to chemicals ii) use of vibration tools and iii) exposure to noise levels. Overall, respondents were happy with controls associated with chemical and noise exposure although they were considerably less satisfied with controls associated with the use of vibration tools. There was also evidence of a lack of knowledge of what forms of control should be associated with vibration tools.
Install i) Chemical Exposure
% Yes
Chemical Exposure
% Don’t Know
ii) Vibration Tools
% Yes
Vibration Tools
% Don’t Know
iii) Noise Exposure
% Yes
Noise Exposure% Don’t Know
A1 80 13 74 17 87 9 A3 61 24 44 46 68 9 B4 86 3 37 43 89 3 B5 68 16 31 45 75 4 C7 73 11 43 30 87 0 C8 87 0 55 13 71 3
D11 65 13 51 20 66 2 D12 88 8 67 25 79 4 D13 70 23 68 24 57 17 D14 78 15 64 23 76 10 D15 86 8 69 25 76 5 F17 83 11 49 36 68 7 F18 79 11 60 18 66 6 F19 77 5 55 26 74 5 F20 84 7 61 25 82 7 F22 94 3 66 27 81 9 F24 87 8 62 27 86 7 F26 82 13 59 37 83 8 G29 86 12 54 38 82 6 G30 81 12 42 43 84 7 G31 74 17 41 49 83 10 K34 87 13 55 35 93 7 K35 93 6 61 33 90 4 R47 87 8 67 29 92 4 R48 - - - - - - R49 75 17 60 31 82 5 R51 74 10 82 14 86 2 R59 85 13 60 25 82 11
39
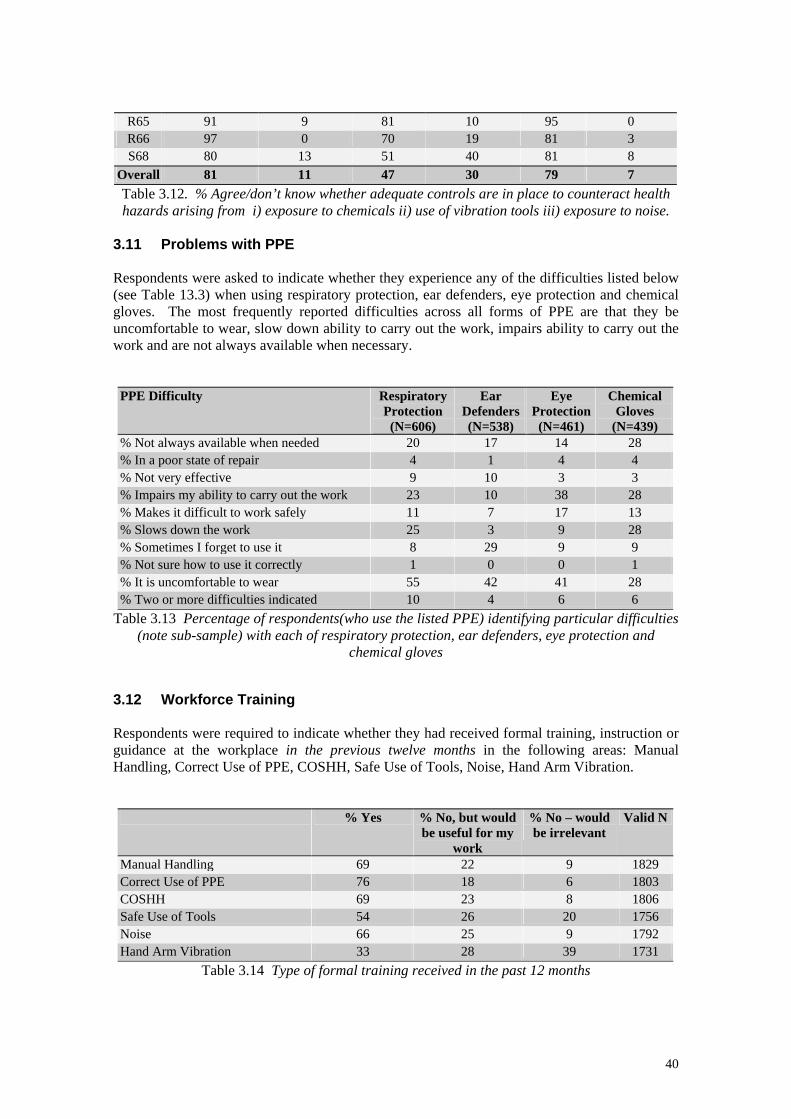
R65 91 9 81 10 95 0 R66 97 0 70 19 81 3 S68 80 13 51 40 81 8
Overall 81 11 47 30 79 7 Table 3.12. % Agree/don’t know whether adequate controls are in place to counteract health hazards arising from i) exposure to chemicals ii) use of vibration tools iii) exposure to noise.
3.11 Problems with PPE Respondents were asked to indicate whether they experience any of the difficulties listed below (see Table 13.3) when using respiratory protection, ear defenders, eye protection and chemical gloves. The most frequently reported difficulties across all forms of PPE are that they be uncomfortable to wear, slow down ability to carry out the work, impairs ability to carry out the work and are not always available when necessary.
PPE Difficulty Respiratory Protection (N=606)
Ear Defenders(N=538)
Eye Protection (N=461)
Chemical Gloves
(N=439) % Not always available when needed 20 17 14 28 % In a poor state of repair 4 1 4 4 % Not very effective 9 10 3 3 % Impairs my ability to carry out the work 23 10 38 28 % Makes it difficult to work safely 11 7 17 13 % Slows down the work 25 3 9 28 % Sometimes I forget to use it 8 29 9 9 % Not sure how to use it correctly 1 0 0 1 % It is uncomfortable to wear 55 42 41 28 % Two or more difficulties indicated 10 4 6 6
Table 3.13 Percentage of respondents(who use the listed PPE) identifying particular difficulties (note sub-sample) with each of respiratory protection, ear defenders, eye protection and
chemical gloves 3.12 Workforce Training Respondents were required to indicate whether they had received formal training, instruction or guidance at the workplace in the previous twelve months in the following areas: Manual Handling, Correct Use of PPE, COSHH, Safe Use of Tools, Noise, Hand Arm Vibration.
% Yes % No, but would be useful for my
work
% No – would be irrelevant
Valid N
Manual Handling 69 22 9 1829 Correct Use of PPE 76 18 6 1803 COSHH 69 23 8 1806 Safe Use of Tools 54 26 20 1756 Noise 66 25 9 1792 Hand Arm Vibration 33 28 39 1731
Table 3.14 Type of formal training received in the past 12 months
40
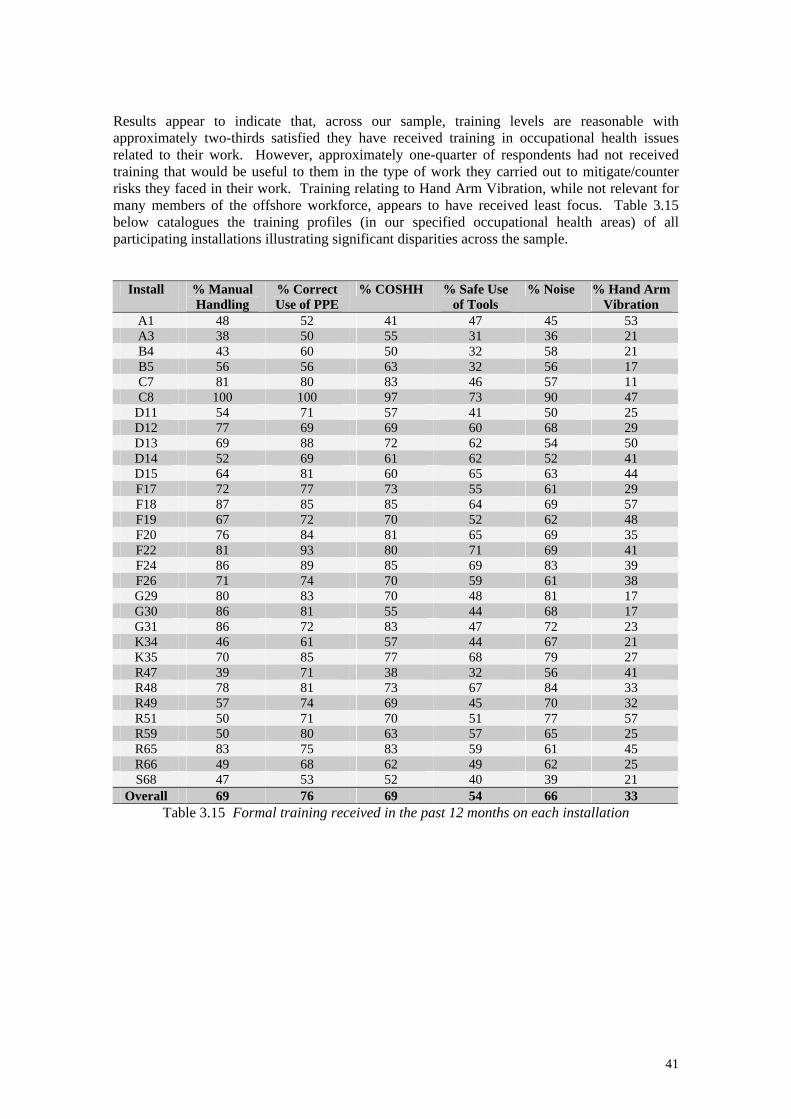
Results appear to indicate that, across our sample, training levels are reasonable with approximately two-thirds satisfied they have received training in occupational health issues related to their work. However, approximately one-quarter of respondents had not received training that would be useful to them in the type of work they carried out to mitigate/counter risks they faced in their work. Training relating to Hand Arm Vibration, while not relevant for many members of the offshore workforce, appears to have received least focus. Table 3.15 below catalogues the training profiles (in our specified occupational health areas) of all participating installations illustrating significant disparities across the sample.
Install % Manual Handling
% Correct Use of PPE
% COSHH % Safe Use of Tools
% Noise % Hand Arm Vibration
A1 48 52 41 47 45 53 A3 38 50 55 31 36 21 B4 43 60 50 32 58 21 B5 56 56 63 32 56 17 C7 81 80 83 46 57 11 C8 100 100 97 73 90 47
D11 54 71 57 41 50 25 D12 77 69 69 60 68 29 D13 69 88 72 62 54 50 D14 52 69 61 62 52 41 D15 64 81 60 65 63 44 F17 72 77 73 55 61 29 F18 87 85 85 64 69 57 F19 67 72 70 52 62 48 F20 76 84 81 65 69 35 F22 81 93 80 71 69 41 F24 86 89 85 69 83 39 F26 71 74 70 59 61 38 G29 80 83 70 48 81 17 G30 86 81 55 44 68 17 G31 86 72 83 47 72 23 K34 46 61 57 44 67 21 K35 70 85 77 68 79 27 R47 39 71 38 32 56 41 R48 78 81 73 67 84 33 R49 57 74 69 45 70 32 R51 50 71 70 51 77 57 R59 50 80 63 57 65 25 R65 83 75 83 59 61 45 R66 49 68 62 49 62 25 S68 47 53 52 40 39 21
Overall 69 76 69 54 66 33 Table 3.15 Formal training received in the past 12 months on each installation
41
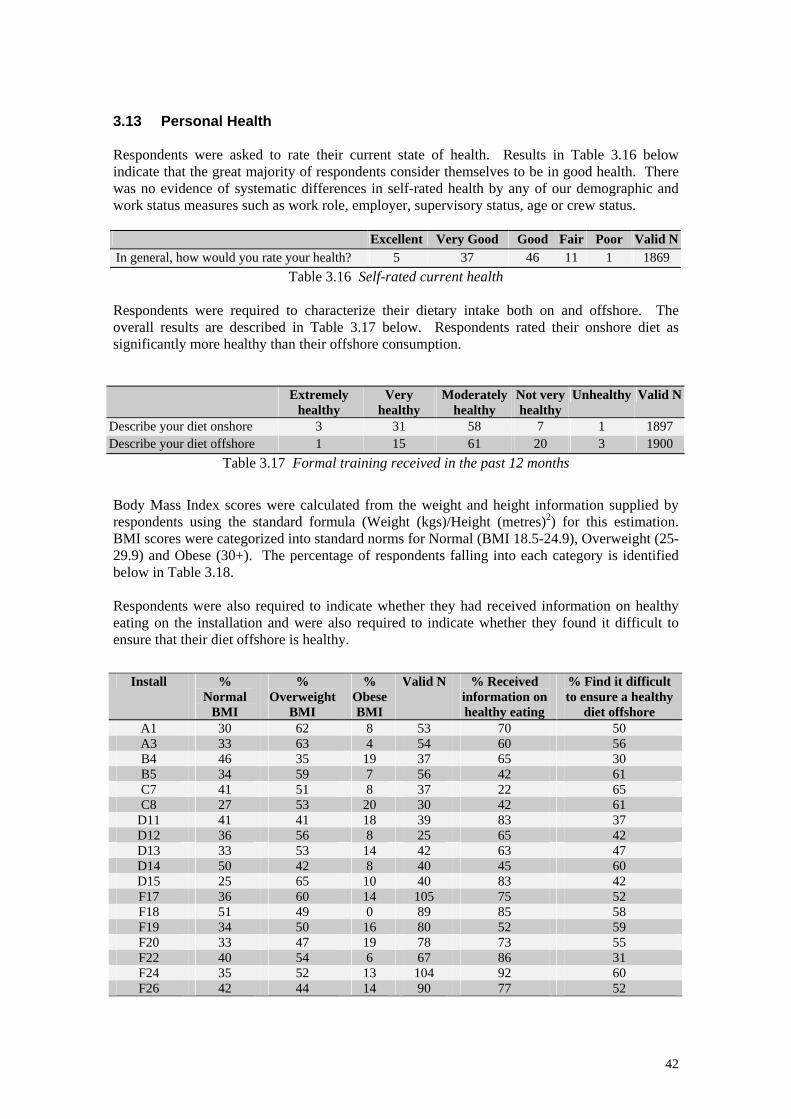
3.13 Personal Health Respondents were asked to rate their current state of health. Results in Table 3.16 below indicate that the great majority of respondents consider themselves to be in good health. There was no evidence of systematic differences in self-rated health by any of our demographic and work status measures such as work role, employer, supervisory status, age or crew status. Excellent Very Good Good Fair Poor Valid N In general, how would you rate your health? 5 37 46 11 1 1869
Table 3.16 Self-rated current health Respondents were required to characterize their dietary intake both on and offshore. The overall results are described in Table 3.17 below. Respondents rated their onshore diet as significantly more healthy than their offshore consumption.
Extremely healthy
Very healthy
Moderately healthy
Not very healthy
Unhealthy Valid N
Describe your diet onshore 3 31 58 7 1 1897 Describe your diet offshore 1 15 61 20 3 1900
Table 3.17 Formal training received in the past 12 months
Body Mass Index scores were calculated from the weight and height information supplied by respondents using the standard formula (Weight (kgs)/Height (metres)2) for this estimation. BMI scores were categorized into standard norms for Normal (BMI 18.5-24.9), Overweight (25-29.9) and Obese (30+). The percentage of respondents falling into each category is identified below in Table 3.18. Respondents were also required to indicate whether they had received information on healthy eating on the installation and were also required to indicate whether they found it difficult to ensure that their diet offshore is healthy.
Install % Normal
BMI
% Overweight
BMI
% Obese BMI
Valid N % Received information on healthy eating
% Find it difficult to ensure a healthy
diet offshore A1 30 62 8 53 70 50 A3 33 63 4 54 60 56 B4 46 35 19 37 65 30 B5 34 59 7 56 42 61 C7 41 51 8 37 22 65 C8 27 53 20 30 42 61
D11 41 41 18 39 83 37 D12 36 56 8 25 65 42 D13 33 53 14 42 63 47 D14 50 42 8 40 45 60 D15 25 65 10 40 83 42 F17 36 60 14 105 75 52 F18 51 49 0 89 85 58 F19 34 50 16 80 52 59 F20 33 47 19 78 73 55 F22 40 54 6 67 86 31 F24 35 52 13 104 92 60 F26 42 44 14 90 77 52
42
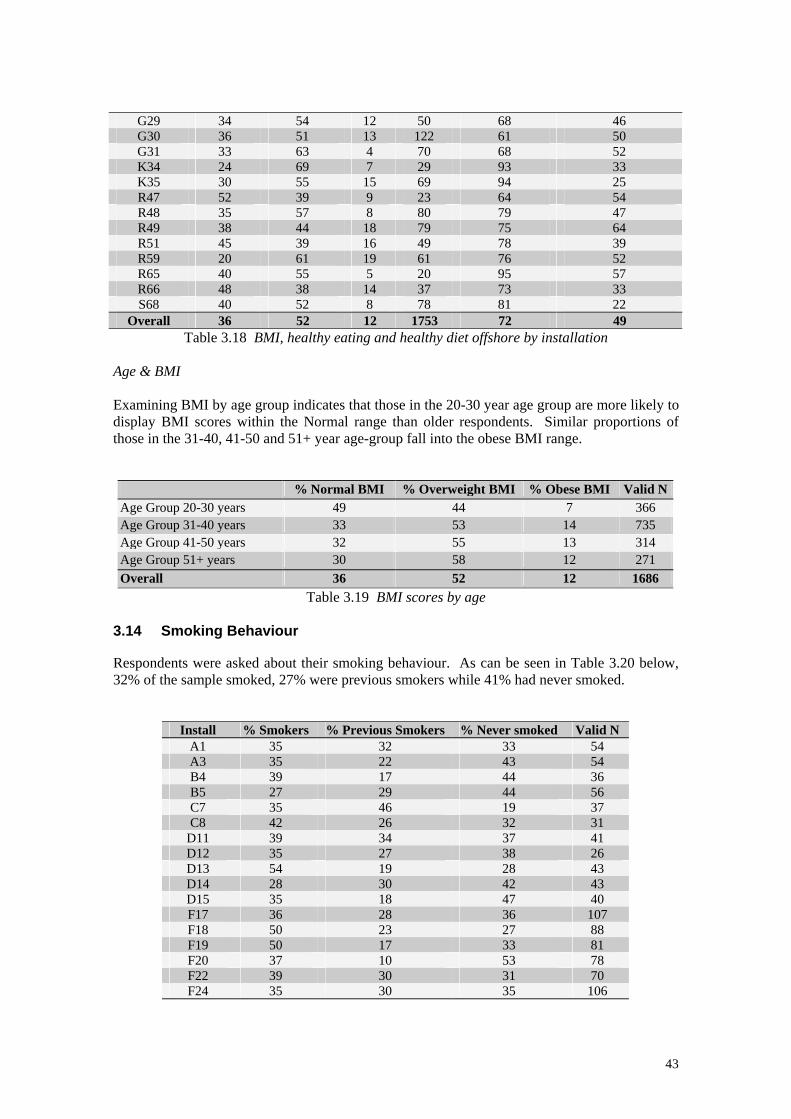
G29 34 54 12 50 68 46 G30 36 51 13 122 61 50 G31 33 63 4 70 68 52 K34 24 69 7 29 93 33 K35 30 55 15 69 94 25 R47 52 39 9 23 64 54 R48 35 57 8 80 79 47 R49 38 44 18 79 75 64 R51 45 39 16 49 78 39 R59 20 61 19 61 76 52 R65 40 55 5 20 95 57 R66 48 38 14 37 73 33 S68 40 52 8 78 81 22
Overall 36 52 12 1753 72 49 Table 3.18 BMI, healthy eating and healthy diet offshore by installation
Age & BMI Examining BMI by age group indicates that those in the 20-30 year age group are more likely to display BMI scores within the Normal range than older respondents. Similar proportions of those in the 31-40, 41-50 and 51+ year age-group fall into the obese BMI range.
% Normal BMI % Overweight BMI % Obese BMI Valid NAge Group 20-30 years 49 44 7 366 Age Group 31-40 years 33 53 14 735 Age Group 41-50 years 32 55 13 314 Age Group 51+ years 30 58 12 271 Overall 36 52 12 1686
Table 3.19 BMI scores by age 3.14 Smoking Behaviour Respondents were asked about their smoking behaviour. As can be seen in Table 3.20 below, 32% of the sample smoked, 27% were previous smokers while 41% had never smoked.
Install % Smokers % Previous Smokers % Never smoked Valid N A1 35 32 33 54 A3 35 22 43 54 B4 39 17 44 36 B5 27 29 44 56 C7 35 46 19 37 C8 42 26 32 31
D11 39 34 37 41 D12 35 27 38 26 D13 54 19 28 43 D14 28 30 42 43 D15 35 18 47 40 F17 36 28 36 107 F18 50 23 27 88 F19 50 17 33 81 F20 37 10 53 78 F22 39 30 31 70 F24 35 30 35 106
43
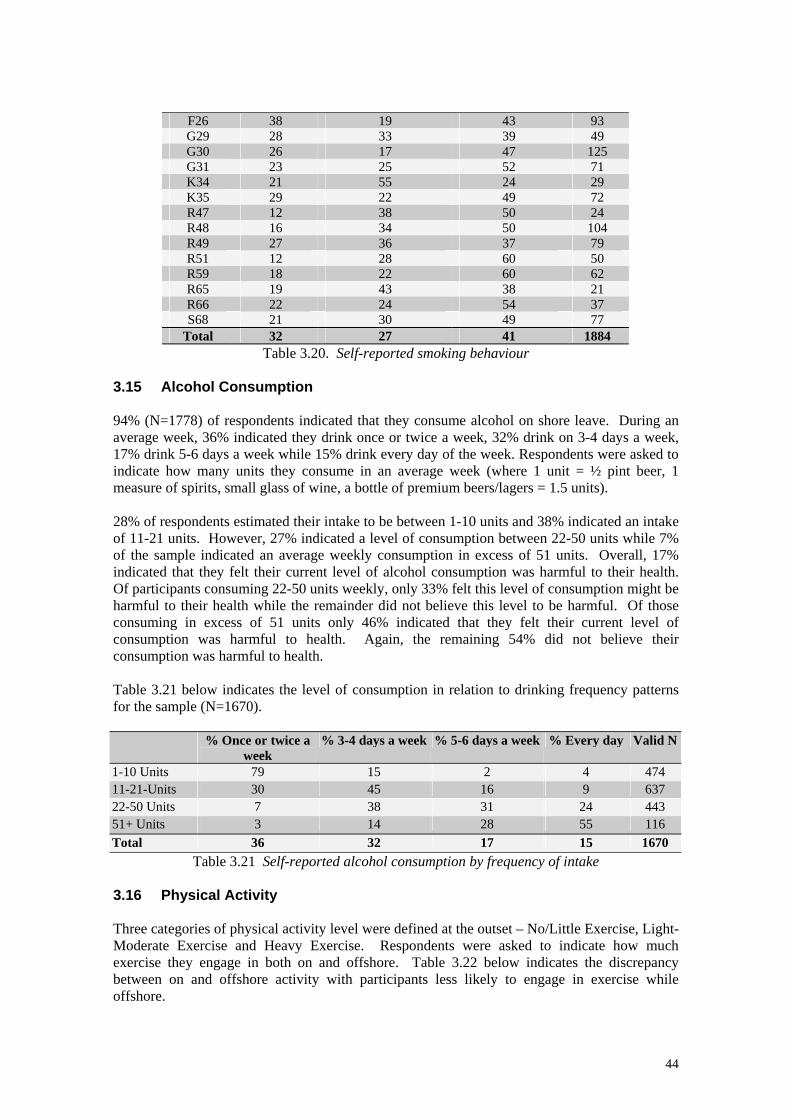
F26 38 19 43 93 G29 28 33 39 49 G30 26 17 47 125 G31 23 25 52 71 K34 21 55 24 29 K35 29 22 49 72 R47 12 38 50 24 R48 16 34 50 104 R49 27 36 37 79 R51 12 28 60 50 R59 18 22 60 62 R65 19 43 38 21 R66 22 24 54 37 S68 21 30 49 77
Total 32 27 41 1884 Table 3.20. Self-reported smoking behaviour
3.15 Alcohol Consumption 94% (N=1778) of respondents indicated that they consume alcohol on shore leave. During an average week, 36% indicated they drink once or twice a week, 32% drink on 3-4 days a week, 17% drink 5-6 days a week while 15% drink every day of the week. Respondents were asked to indicate how many units they consume in an average week (where 1 unit = ½ pint beer, 1 measure of spirits, small glass of wine, a bottle of premium beers/lagers = 1.5 units). 28% of respondents estimated their intake to be between 1-10 units and 38% indicated an intake of 11-21 units. However, 27% indicated a level of consumption between 22-50 units while 7% of the sample indicated an average weekly consumption in excess of 51 units. Overall, 17% indicated that they felt their current level of alcohol consumption was harmful to their health. Of participants consuming 22-50 units weekly, only 33% felt this level of consumption might be harmful to their health while the remainder did not believe this level to be harmful. Of those consuming in excess of 51 units only 46% indicated that they felt their current level of consumption was harmful to health. Again, the remaining 54% did not believe their consumption was harmful to health. Table 3.21 below indicates the level of consumption in relation to drinking frequency patterns for the sample (N=1670). % Once or twice a
week % 3-4 days a week % 5-6 days a week % Every day Valid N
1-10 Units 79 15 2 4 474 11-21-Units 30 45 16 9 637 22-50 Units 7 38 31 24 443 51+ Units 3 14 28 55 116 Total 36 32 17 15 1670
Table 3.21 Self-reported alcohol consumption by frequency of intake 3.16 Physical Activity Three categories of physical activity level were defined at the outset – No/Little Exercise, Light-Moderate Exercise and Heavy Exercise. Respondents were asked to indicate how much exercise they engage in both on and offshore. Table 3.22 below indicates the discrepancy between on and offshore activity with participants less likely to engage in exercise while offshore.
44
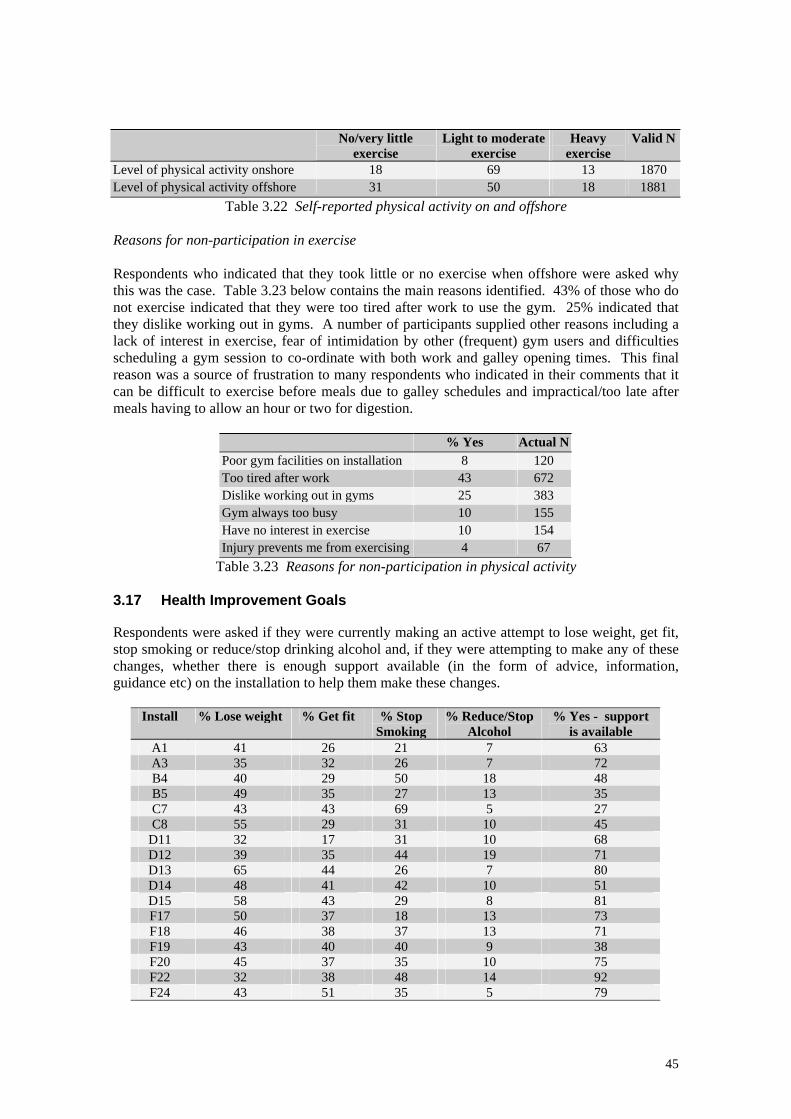
No/very little
exercise Light to moderate
exercise Heavy
exercise Valid N
Level of physical activity onshore 18 69 13 1870 Level of physical activity offshore 31 50 18 1881
Table 3.22 Self-reported physical activity on and offshore Reasons for non-participation in exercise Respondents who indicated that they took little or no exercise when offshore were asked why this was the case. Table 3.23 below contains the main reasons identified. 43% of those who do not exercise indicated that they were too tired after work to use the gym. 25% indicated that they dislike working out in gyms. A number of participants supplied other reasons including a lack of interest in exercise, fear of intimidation by other (frequent) gym users and difficulties scheduling a gym session to co-ordinate with both work and galley opening times. This final reason was a source of frustration to many respondents who indicated in their comments that it can be difficult to exercise before meals due to galley schedules and impractical/too late after meals having to allow an hour or two for digestion.
% Yes Actual N Poor gym facilities on installation 8 120 Too tired after work 43 672 Dislike working out in gyms 25 383 Gym always too busy 10 155 Have no interest in exercise 10 154 Injury prevents me from exercising 4 67
Table 3.23 Reasons for non-participation in physical activity 3.17 Health Improvement Goals Respondents were asked if they were currently making an active attempt to lose weight, get fit, stop smoking or reduce/stop drinking alcohol and, if they were attempting to make any of these changes, whether there is enough support available (in the form of advice, information, guidance etc) on the installation to help them make these changes.
Install % Lose weight % Get fit % Stop Smoking
% Reduce/Stop Alcohol
% Yes - support is available
A1 41 26 21 7 63 A3 35 32 26 7 72 B4 40 29 50 18 48 B5 49 35 27 13 35 C7 43 43 69 5 27 C8 55 29 31 10 45
D11 32 17 31 10 68 D12 39 35 44 19 71 D13 65 44 26 7 80 D14 48 41 42 10 51 D15 58 43 29 8 81 F17 50 37 18 13 73 F18 46 38 37 13 71 F19 43 40 40 9 38 F20 45 37 35 10 75 F22 32 38 48 14 92 F24 43 51 35 5 79
45

F26 34 29 49 3 82 G29 46 38 43 8 53 G30 39 33 34 8 51 G31 38 45 44 17 52 K34 57 40 33 10 100 K35 42 40 33 14 95 R47 33 38 67 8 74 R48 53 54 41 10 46 R49 46 44 43 6 66 R51 47 41 0 10 88 R59 57 51 27 11 75 R65 35 25 50 10 93 R66 43 54 63 19 75 S68 44 49 38 13 91
Overall 44 40 37 10 68
Table 3.24. Percentage of respondents actively attempting to lose weight, get fit, stop smoking(smokers only), stop/reduce alcohol intake; % Yes, enough support
available for health improvement Results overall suggest that a significant proportion of the workforce are actively involved in attempts to improve their health with a particular focus on weight loss. However, relatively few respondents indicated an interested in addressing drinking habits with only 10% of the sample indicating any attempt to reduce alcohol consumption. In light of our finding that 34% of respondents consume more than the recommended weekly units of alcohol when onshore, this outcome is less than encouraging. Finally, 68% of respondents were satisfied that adequate support to help them make changes to improve their health was available on their installation. 3.18 Muscular Pain 36% (N=679) of respondents (Valid N=1877) indicated that they suffered from recurring muscular pain with 36% of this group indicating muscular pain in at least two of the listed areas. Table 3.25 below indicates the body areas affected with clear prevalence of lower back pain.
% Yes Actual N Lower back 36 380 Neck 12 125 Shoulder 14 144 Knee 16 161 Upper limb (arm) 6 61 Lower limb (leg) 6 66 Other back area 3 35 Hand/wrist/finger 7 72
Table 3.25 Body areas affected by muscular pain Respondents experiencing muscular pain were asked to indicate where this pain originally came about – at home, offshore while working or offshore while offshift. Given the variability of muscular pain, respondents were also supplied with a ‘don’t know’ option. Respondents were also asked whether any aspect of their work offshore makes their muscular pain worse. Finally, respondents were asked whether they have received any support (in the form of advice, information, guidance etc) on the installation to help them manage and reduce their muscular pain.
46
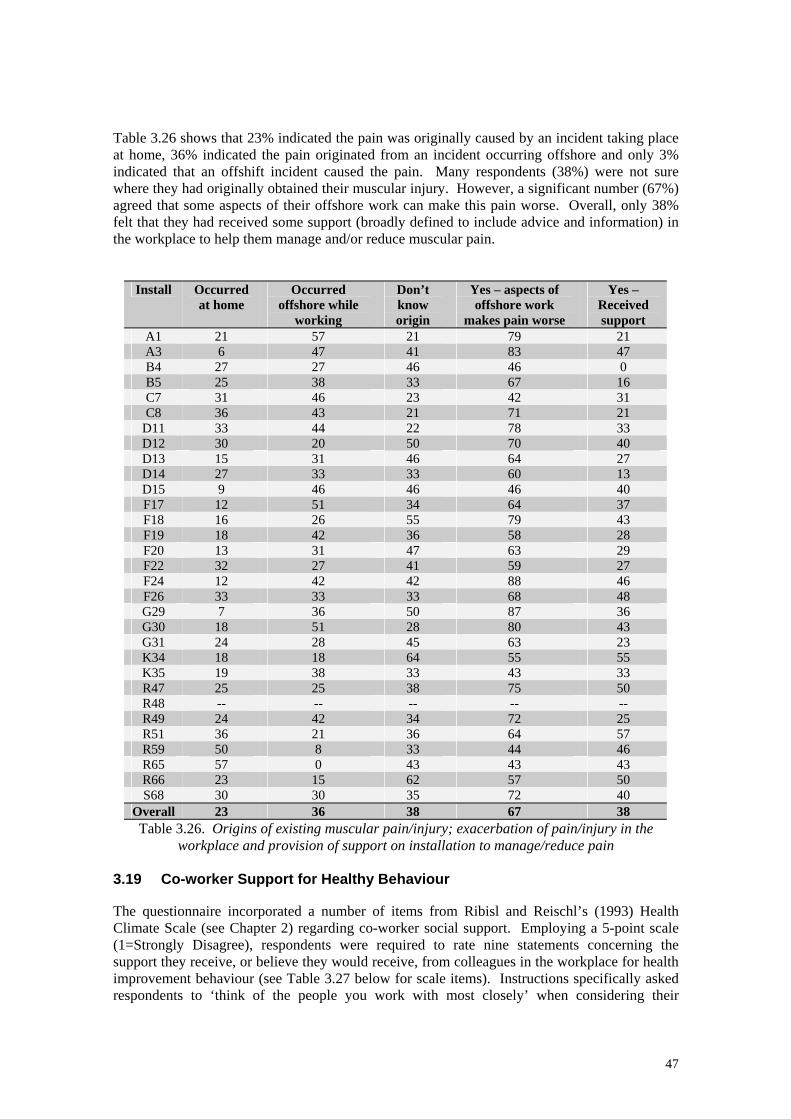
Table 3.26 shows that 23% indicated the pain was originally caused by an incident taking place at home, 36% indicated the pain originated from an incident occurring offshore and only 3% indicated that an offshift incident caused the pain. Many respondents (38%) were not sure where they had originally obtained their muscular injury. However, a significant number (67%) agreed that some aspects of their offshore work can make this pain worse. Overall, only 38% felt that they had received some support (broadly defined to include advice and information) in the workplace to help them manage and/or reduce muscular pain.
Install Occurred at home
Occurred offshore while
working
Don’t know origin
Yes – aspects of offshore work
makes pain worse
Yes – Received support
A1 21 57 21 79 21 A3 6 47 41 83 47 B4 27 27 46 46 0 B5 25 38 33 67 16 C7 31 46 23 42 31 C8 36 43 21 71 21
D11 33 44 22 78 33 D12 30 20 50 70 40 D13 15 31 46 64 27 D14 27 33 33 60 13 D15 9 46 46 46 40 F17 12 51 34 64 37 F18 16 26 55 79 43 F19 18 42 36 58 28 F20 13 31 47 63 29 F22 32 27 41 59 27 F24 12 42 42 88 46 F26 33 33 33 68 48 G29 7 36 50 87 36 G30 18 51 28 80 43 G31 24 28 45 63 23 K34 18 18 64 55 55 K35 19 38 33 43 33 R47 25 25 38 75 50 R48 -- -- -- -- -- R49 24 42 34 72 25 R51 36 21 36 64 57 R59 50 8 33 44 46 R65 57 0 43 43 43 R66 23 15 62 57 50 S68 30 30 35 72 40
Overall 23 36 38 67 38 Table 3.26. Origins of existing muscular pain/injury; exacerbation of pain/injury in the
workplace and provision of support on installation to manage/reduce pain 3.19 Co-worker Support for Healthy Behaviour The questionnaire incorporated a number of items from Ribisl and Reischl’s (1993) Health Climate Scale (see Chapter 2) regarding co-worker social support. Employing a 5-point scale (1=Strongly Disagree), respondents were required to rate nine statements concerning the support they receive, or believe they would receive, from colleagues in the workplace for health improvement behaviour (see Table 3.27 below for scale items). Instructions specifically asked respondents to ‘think of the people you work with most closely’ when considering their
47
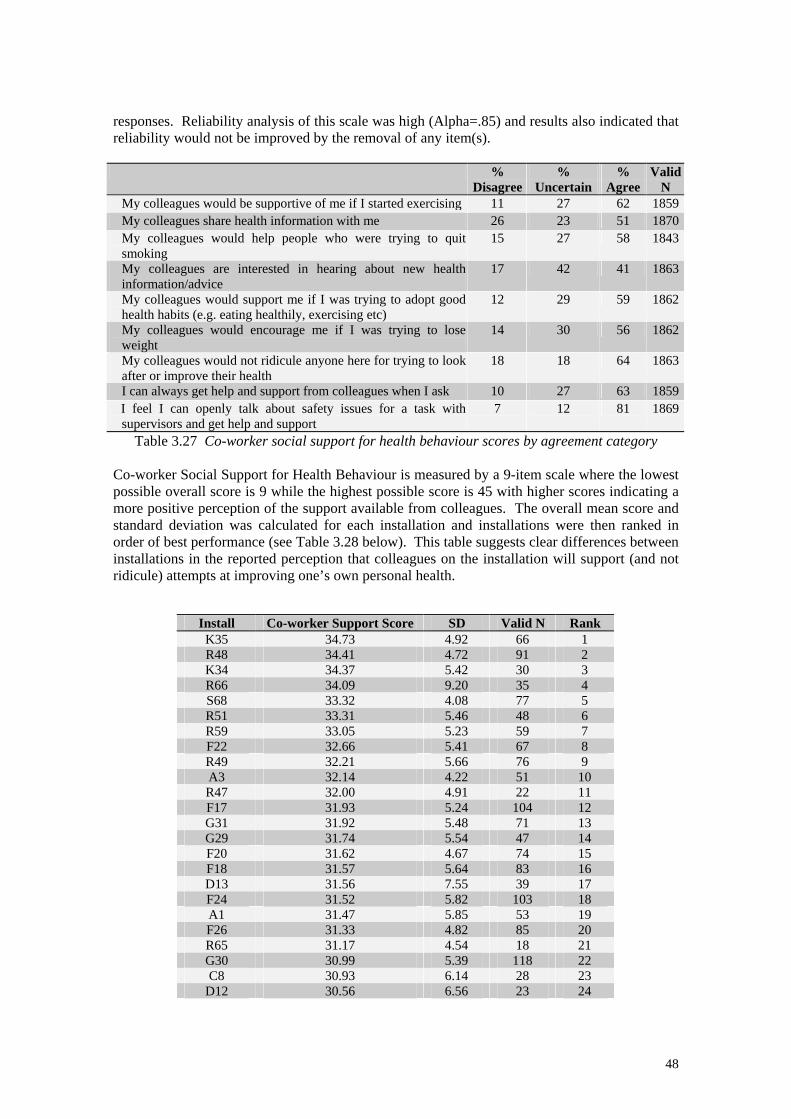
responses. Reliability analysis of this scale was high (Alpha=.85) and results also indicated that reliability would not be improved by the removal of any item(s).
% Disagree
% Uncertain
% Agree
Valid N
My colleagues would be supportive of me if I started exercising 11 27 62 1859My colleagues share health information with me 26 23 51 1870My colleagues would help people who were trying to quit smoking
15 27 58 1843
My colleagues are interested in hearing about new health information/advice
17 42 41 1863
My colleagues would support me if I was trying to adopt good health habits (e.g. eating healthily, exercising etc)
12 29 59 1862
My colleagues would encourage me if I was trying to lose weight
14 30 56 1862
My colleagues would not ridicule anyone here for trying to look after or improve their health
18 18 64 1863
I can always get help and support from colleagues when I ask 10 27 63 1859I feel I can openly talk about safety issues for a task with supervisors and get help and support
7 12 81 1869
Table 3.27 Co-worker social support for health behaviour scores by agreement category Co-worker Social Support for Health Behaviour is measured by a 9-item scale where the lowest possible overall score is 9 while the highest possible score is 45 with higher scores indicating a more positive perception of the support available from colleagues. The overall mean score and standard deviation was calculated for each installation and installations were then ranked in order of best performance (see Table 3.28 below). This table suggests clear differences between installations in the reported perception that colleagues on the installation will support (and not ridicule) attempts at improving one’s own personal health.
Install Co-worker Support Score SD Valid N Rank K35 34.73 4.92 66 1 R48 34.41 4.72 91 2 K34 34.37 5.42 30 3 R66 34.09 9.20 35 4 S68 33.32 4.08 77 5 R51 33.31 5.46 48 6 R59 33.05 5.23 59 7 F22 32.66 5.41 67 8 R49 32.21 5.66 76 9 A3 32.14 4.22 51 10 R47 32.00 4.91 22 11 F17 31.93 5.24 104 12 G31 31.92 5.48 71 13 G29 31.74 5.54 47 14 F20 31.62 4.67 74 15 F18 31.57 5.64 83 16 D13 31.56 7.55 39 17 F24 31.52 5.82 103 18 A1 31.47 5.85 53 19 F26 31.33 4.82 85 20 R65 31.17 4.54 18 21 G30 30.99 5.39 118 22 C8 30.93 6.14 28 23
D12 30.56 6.56 23 24
48
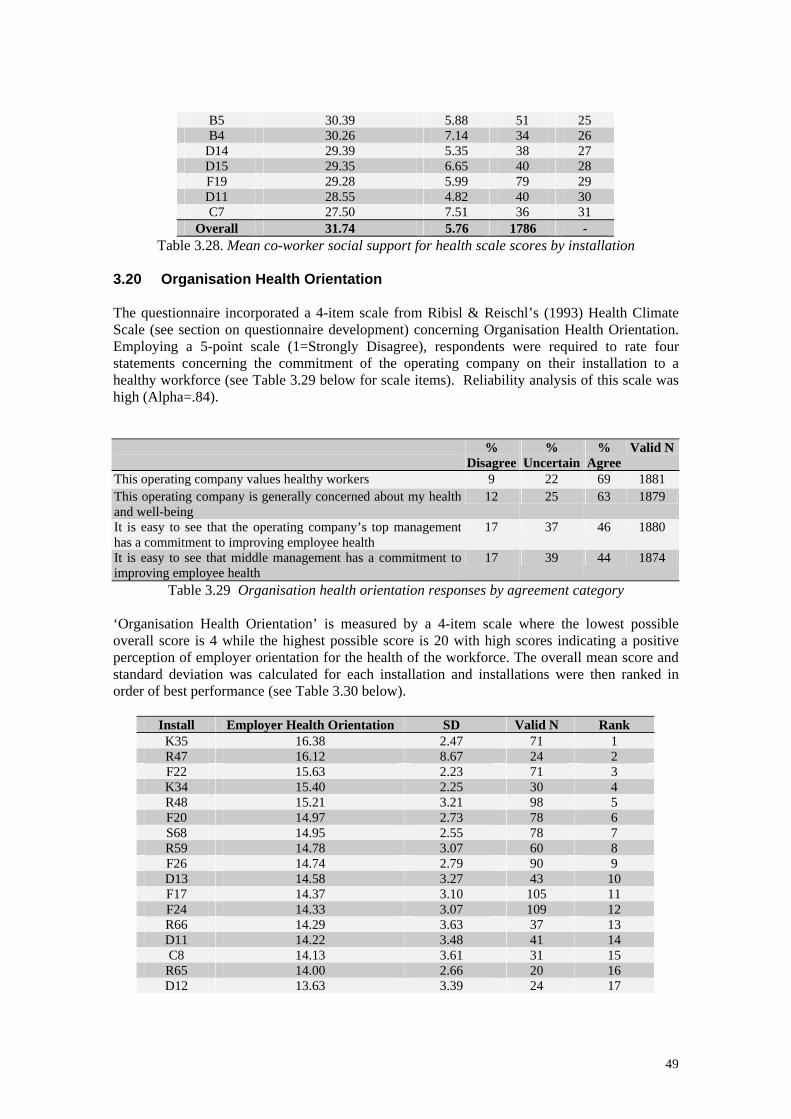
B5 30.39 5.88 51 25 B4 30.26 7.14 34 26
D14 29.39 5.35 38 27 D15 29.35 6.65 40 28 F19 29.28 5.99 79 29 D11 28.55 4.82 40 30 C7 27.50 7.51 36 31
Overall 31.74 5.76 1786 - Table 3.28. Mean co-worker social support for health scale scores by installation
3.20 Organisation Health Orientation The questionnaire incorporated a 4-item scale from Ribisl & Reischl’s (1993) Health Climate Scale (see section on questionnaire development) concerning Organisation Health Orientation. Employing a 5-point scale (1=Strongly Disagree), respondents were required to rate four statements concerning the commitment of the operating company on their installation to a healthy workforce (see Table 3.29 below for scale items). Reliability analysis of this scale was high (Alpha=.84). %
Disagree%
Uncertain %
Agree Valid N
This operating company values healthy workers 9 22 69 1881 This operating company is generally concerned about my health and well-being
12 25 63 1879
It is easy to see that the operating company’s top management has a commitment to improving employee health
17 37 46 1880
It is easy to see that middle management has a commitment to improving employee health
17 39 44 1874
Table 3.29 Organisation health orientation responses by agreement category ‘Organisation Health Orientation’ is measured by a 4-item scale where the lowest possible overall score is 4 while the highest possible score is 20 with high scores indicating a positive perception of employer orientation for the health of the workforce. The overall mean score and standard deviation was calculated for each installation and installations were then ranked in order of best performance (see Table 3.30 below).
Install Employer Health Orientation SD Valid N Rank K35 16.38 2.47 71 1 R47 16.12 8.67 24 2 F22 15.63 2.23 71 3 K34 15.40 2.25 30 4 R48 15.21 3.21 98 5 F20 14.97 2.73 78 6 S68 14.95 2.55 78 7 R59 14.78 3.07 60 8 F26 14.74 2.79 90 9 D13 14.58 3.27 43 10 F17 14.37 3.10 105 11 F24 14.33 3.07 109 12 R66 14.29 3.63 37 13 D11 14.22 3.48 41 14 C8 14.13 3.61 31 15
R65 14.00 2.66 20 16 D12 13.63 3.39 24 17
49
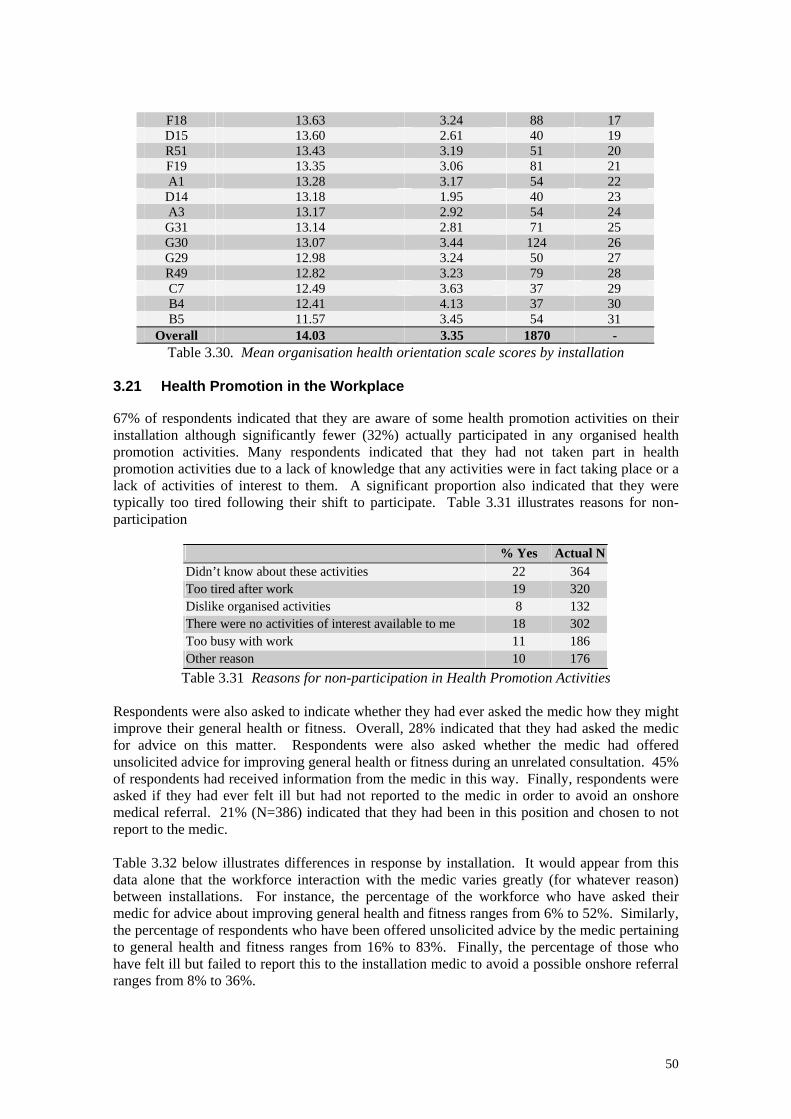
F18 13.63 3.24 88 17 D15 13.60 2.61 40 19 R51 13.43 3.19 51 20 F19 13.35 3.06 81 21 A1 13.28 3.17 54 22 D14 13.18 1.95 40 23 A3 13.17 2.92 54 24 G31 13.14 2.81 71 25 G30 13.07 3.44 124 26 G29 12.98 3.24 50 27 R49 12.82 3.23 79 28 C7 12.49 3.63 37 29 B4 12.41 4.13 37 30 B5 11.57 3.45 54 31
Overall 14.03 3.35 1870 - Table 3.30. Mean organisation health orientation scale scores by installation
3.21 Health Promotion in the Workplace 67% of respondents indicated that they are aware of some health promotion activities on their installation although significantly fewer (32%) actually participated in any organised health promotion activities. Many respondents indicated that they had not taken part in health promotion activities due to a lack of knowledge that any activities were in fact taking place or a lack of activities of interest to them. A significant proportion also indicated that they were typically too tired following their shift to participate. Table 3.31 illustrates reasons for non-participation
% Yes Actual N Didn’t know about these activities 22 364 Too tired after work 19 320 Dislike organised activities 8 132 There were no activities of interest available to me 18 302 Too busy with work 11 186 Other reason 10 176
Table 3.31 Reasons for non-participation in Health Promotion Activities
Respondents were also asked to indicate whether they had ever asked the medic how they might improve their general health or fitness. Overall, 28% indicated that they had asked the medic for advice on this matter. Respondents were also asked whether the medic had offered unsolicited advice for improving general health or fitness during an unrelated consultation. 45% of respondents had received information from the medic in this way. Finally, respondents were asked if they had ever felt ill but had not reported to the medic in order to avoid an onshore medical referral. 21% (N=386) indicated that they had been in this position and chosen to not report to the medic. Table 3.32 below illustrates differences in response by installation. It would appear from this data alone that the workforce interaction with the medic varies greatly (for whatever reason) between installations. For instance, the percentage of the workforce who have asked their medic for advice about improving general health and fitness ranges from 6% to 52%. Similarly, the percentage of respondents who have been offered unsolicited advice by the medic pertaining to general health and fitness ranges from 16% to 83%. Finally, the percentage of those who have felt ill but failed to report this to the installation medic to avoid a possible onshore referral ranges from 8% to 36%.
50
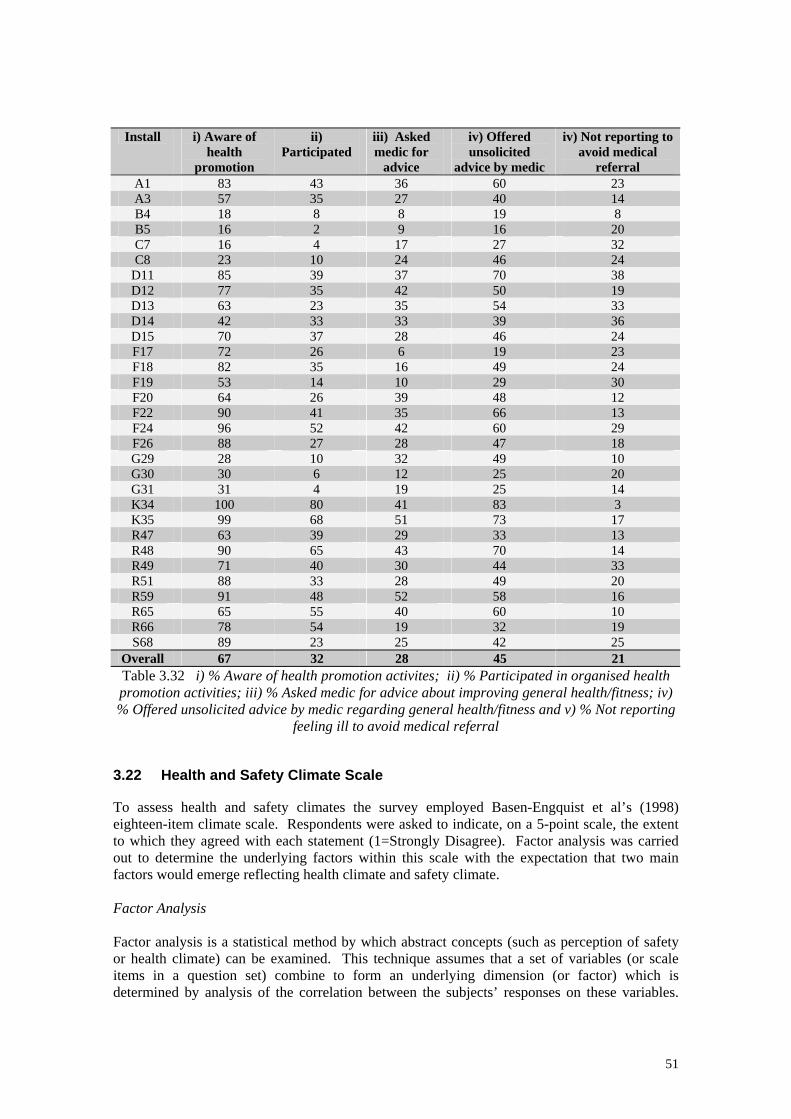
Install i) Aware of
health promotion
ii) Participated
iii) Asked medic for
advice
iv) Offered unsolicited
advice by medic
iv) Not reporting to avoid medical
referral A1 83 43 36 60 23 A3 57 35 27 40 14 B4 18 8 8 19 8 B5 16 2 9 16 20 C7 16 4 17 27 32 C8 23 10 24 46 24
D11 85 39 37 70 38 D12 77 35 42 50 19 D13 63 23 35 54 33 D14 42 33 33 39 36 D15 70 37 28 46 24 F17 72 26 6 19 23 F18 82 35 16 49 24 F19 53 14 10 29 30 F20 64 26 39 48 12 F22 90 41 35 66 13 F24 96 52 42 60 29 F26 88 27 28 47 18 G29 28 10 32 49 10 G30 30 6 12 25 20 G31 31 4 19 25 14 K34 100 80 41 83 3 K35 99 68 51 73 17 R47 63 39 29 33 13 R48 90 65 43 70 14 R49 71 40 30 44 33 R51 88 33 28 49 20 R59 91 48 52 58 16 R65 65 55 40 60 10 R66 78 54 19 32 19 S68 89 23 25 42 25
Overall 67 32 28 45 21 Table 3.32 i) % Aware of health promotion activites; ii) % Participated in organised health promotion activities; iii) % Asked medic for advice about improving general health/fitness; iv) % Offered unsolicited advice by medic regarding general health/fitness and v) % Not reporting
feeling ill to avoid medical referral 3.22 Health and Safety Climate Scale To assess health and safety climates the survey employed Basen-Engquist et al’s (1998) eighteen-item climate scale. Respondents were asked to indicate, on a 5-point scale, the extent to which they agreed with each statement (1=Strongly Disagree). Factor analysis was carried out to determine the underlying factors within this scale with the expectation that two main factors would emerge reflecting health climate and safety climate. Factor Analysis Factor analysis is a statistical method by which abstract concepts (such as perception of safety or health climate) can be examined. This technique assumes that a set of variables (or scale items in a question set) combine to form an underlying dimension (or factor) which is determined by analysis of the correlation between the subjects’ responses on these variables.
51
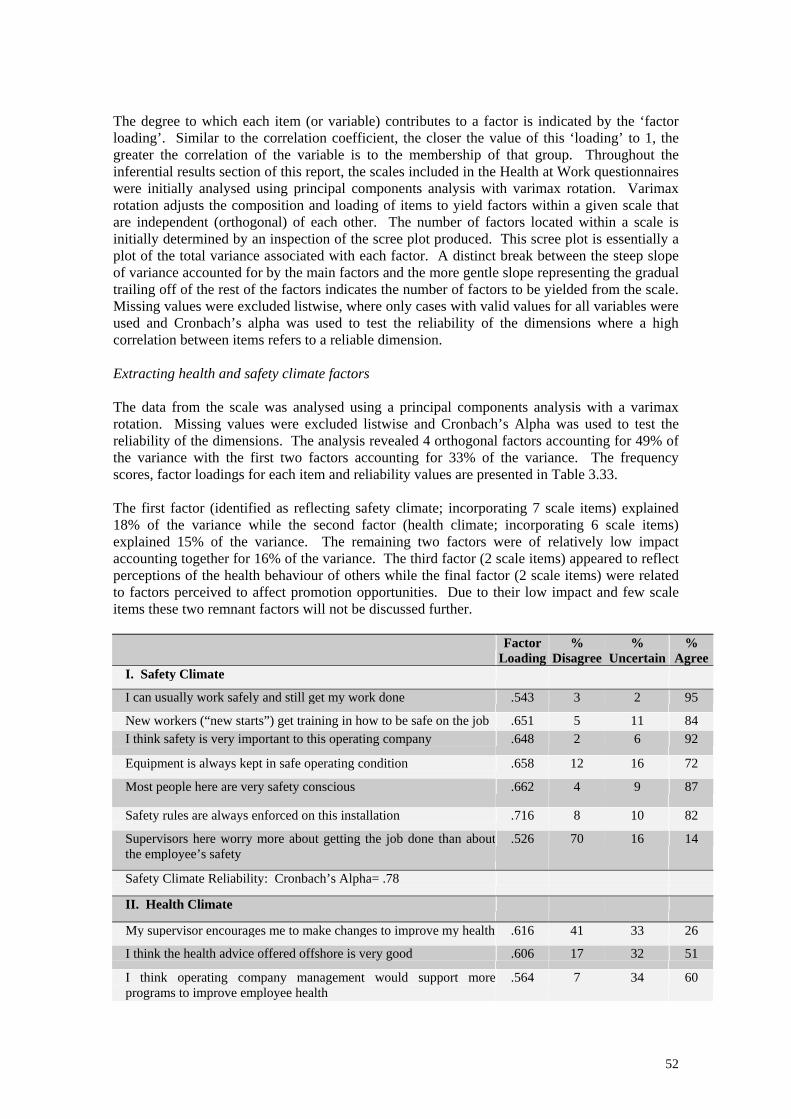
The degree to which each item (or variable) contributes to a factor is indicated by the ‘factor loading’. Similar to the correlation coefficient, the closer the value of this ‘loading’ to 1, the greater the correlation of the variable is to the membership of that group. Throughout the inferential results section of this report, the scales included in the Health at Work questionnaires were initially analysed using principal components analysis with varimax rotation. Varimax rotation adjusts the composition and loading of items to yield factors within a given scale that are independent (orthogonal) of each other. The number of factors located within a scale is initially determined by an inspection of the scree plot produced. This scree plot is essentially a plot of the total variance associated with each factor. A distinct break between the steep slope of variance accounted for by the main factors and the more gentle slope representing the gradual trailing off of the rest of the factors indicates the number of factors to be yielded from the scale. Missing values were excluded listwise, where only cases with valid values for all variables were used and Cronbach’s alpha was used to test the reliability of the dimensions where a high correlation between items refers to a reliable dimension. Extracting health and safety climate factors The data from the scale was analysed using a principal components analysis with a varimax rotation. Missing values were excluded listwise and Cronbach’s Alpha was used to test the reliability of the dimensions. The analysis revealed 4 orthogonal factors accounting for 49% of the variance with the first two factors accounting for 33% of the variance. The frequency scores, factor loadings for each item and reliability values are presented in Table 3.33. The first factor (identified as reflecting safety climate; incorporating 7 scale items) explained 18% of the variance while the second factor (health climate; incorporating 6 scale items) explained 15% of the variance. The remaining two factors were of relatively low impact accounting together for 16% of the variance. The third factor (2 scale items) appeared to reflect perceptions of the health behaviour of others while the final factor (2 scale items) were related to factors perceived to affect promotion opportunities. Due to their low impact and few scale items these two remnant factors will not be discussed further. Factor
Loading%
Disagree %
Uncertain%
AgreeI. Safety Climate
I can usually work safely and still get my work done .543 3 2 95
New workers (“new starts”) get training in how to be safe on the job .651 5 11 84 I think safety is very important to this operating company .648 2 6 92
Equipment is always kept in safe operating condition .658 12 16 72
Most people here are very safety conscious
.662 4 9 87
Safety rules are always enforced on this installation .716 8 10 82
Supervisors here worry more about getting the job done than about the employee’s safety
.526 70 16 14
Safety Climate Reliability: Cronbach’s Alpha= .78
II. Health Climate
My supervisor encourages me to make changes to improve my health .616 41 33 26
I think the health advice offered offshore is very good .606 17 32 51
I think operating company management would support more programs to improve employee health
.564 7 34 60
52
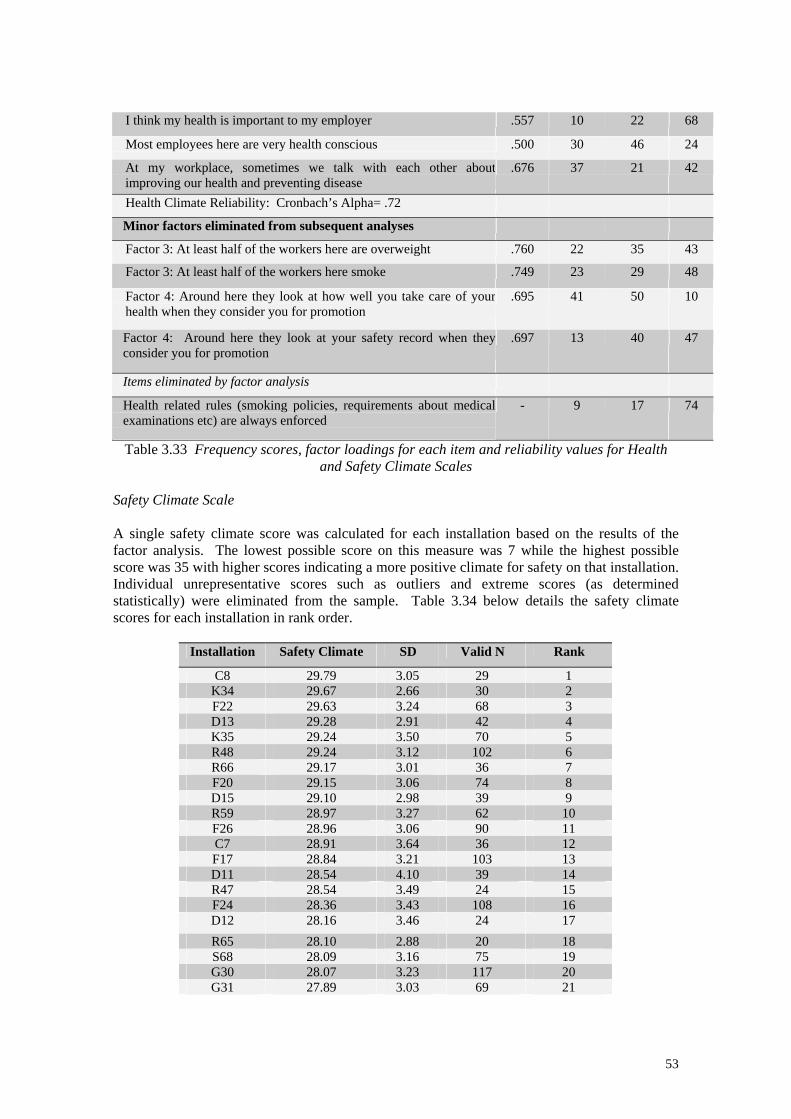
I think my health is important to my employer .557 10 22 68
Most employees here are very health conscious .500 30 46 24
At my workplace, sometimes we talk with each other about improving our health and preventing disease
.676 37 21 42
Health Climate Reliability: Cronbach’s Alpha= .72
Minor factors eliminated from subsequent analyses
Factor 3: At least half of the workers here are overweight .760 22 35 43
Factor 3: At least half of the workers here smoke .749 23 29 48
Factor 4: Around here they look at how well you take care of your health when they consider you for promotion
.695 41 50 10
Factor 4: Around here they look at your safety record when they consider you for promotion
.697 13 40 47
Items eliminated by factor analysis
Health related rules (smoking policies, requirements about medical examinations etc) are always enforced
- 9 17 74
Table 3.33 Frequency scores, factor loadings for each item and reliability values for Health and Safety Climate Scales
Safety Climate Scale A single safety climate score was calculated for each installation based on the results of the factor analysis. The lowest possible score on this measure was 7 while the highest possible score was 35 with higher scores indicating a more positive climate for safety on that installation. Individual unrepresentative scores such as outliers and extreme scores (as determined statistically) were eliminated from the sample. Table 3.34 below details the safety climate scores for each installation in rank order.
Installation Safety Climate SD Valid N Rank
C8 29.79 3.05 29 1 K34 29.67 2.66 30 2 F22 29.63 3.24 68 3 D13 29.28 2.91 42 4 K35 29.24 3.50 70 5 R48 29.24 3.12 102 6 R66 29.17 3.01 36 7 F20 29.15 3.06 74 8 D15 29.10 2.98 39 9 R59 28.97 3.27 62 10 F26 28.96 3.06 90 11 C7 28.91 3.64 36 12 F17 28.84 3.21 103 13 D11 28.54 4.10 39 14 R47 28.54 3.49 24 15 F24 28.36 3.43 108 16 D12 28.16 3.46 24 17 R65 28.10 2.88 20 18 S68 28.09 3.16 75 19 G30 28.07 3.23 117 20 G31 27.89 3.03 69 21
53
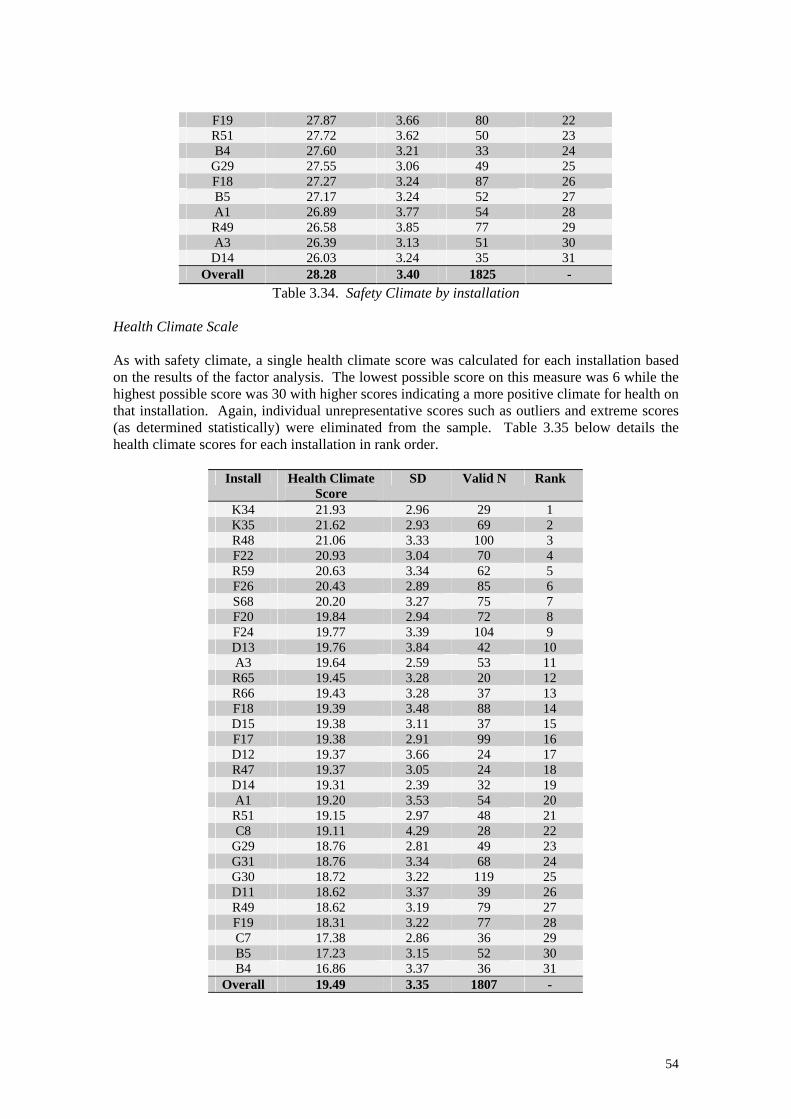
F19 27.87 3.66 80 22 R51 27.72 3.62 50 23 B4 27.60 3.21 33 24
G29 27.55 3.06 49 25 F18 27.27 3.24 87 26 B5 27.17 3.24 52 27 A1 26.89 3.77 54 28 R49 26.58 3.85 77 29 A3 26.39 3.13 51 30 D14 26.03 3.24 35 31
Overall 28.28 3.40 1825 - Table 3.34. Safety Climate by installation
Health Climate Scale As with safety climate, a single health climate score was calculated for each installation based on the results of the factor analysis. The lowest possible score on this measure was 6 while the highest possible score was 30 with higher scores indicating a more positive climate for health on that installation. Again, individual unrepresentative scores such as outliers and extreme scores (as determined statistically) were eliminated from the sample. Table 3.35 below details the health climate scores for each installation in rank order.
Install Health Climate Score
SD Valid N Rank
K34 21.93 2.96 29 1 K35 21.62 2.93 69 2 R48 21.06 3.33 100 3 F22 20.93 3.04 70 4 R59 20.63 3.34 62 5 F26 20.43 2.89 85 6 S68 20.20 3.27 75 7 F20 19.84 2.94 72 8 F24 19.77 3.39 104 9 D13 19.76 3.84 42 10 A3 19.64 2.59 53 11 R65 19.45 3.28 20 12 R66 19.43 3.28 37 13 F18 19.39 3.48 88 14 D15 19.38 3.11 37 15 F17 19.38 2.91 99 16 D12 19.37 3.66 24 17 R47 19.37 3.05 24 18 D14 19.31 2.39 32 19 A1 19.20 3.53 54 20 R51 19.15 2.97 48 21 C8 19.11 4.29 28 22
G29 18.76 2.81 49 23 G31 18.76 3.34 68 24 G30 18.72 3.22 119 25 D11 18.62 3.37 39 26 R49 18.62 3.19 79 27 F19 18.31 3.22 77 28 C7 17.38 2.86 36 29 B5 17.23 3.15 52 30 B4 16.86 3.37 36 31
Overall 19.49 3.35 1807 -
54
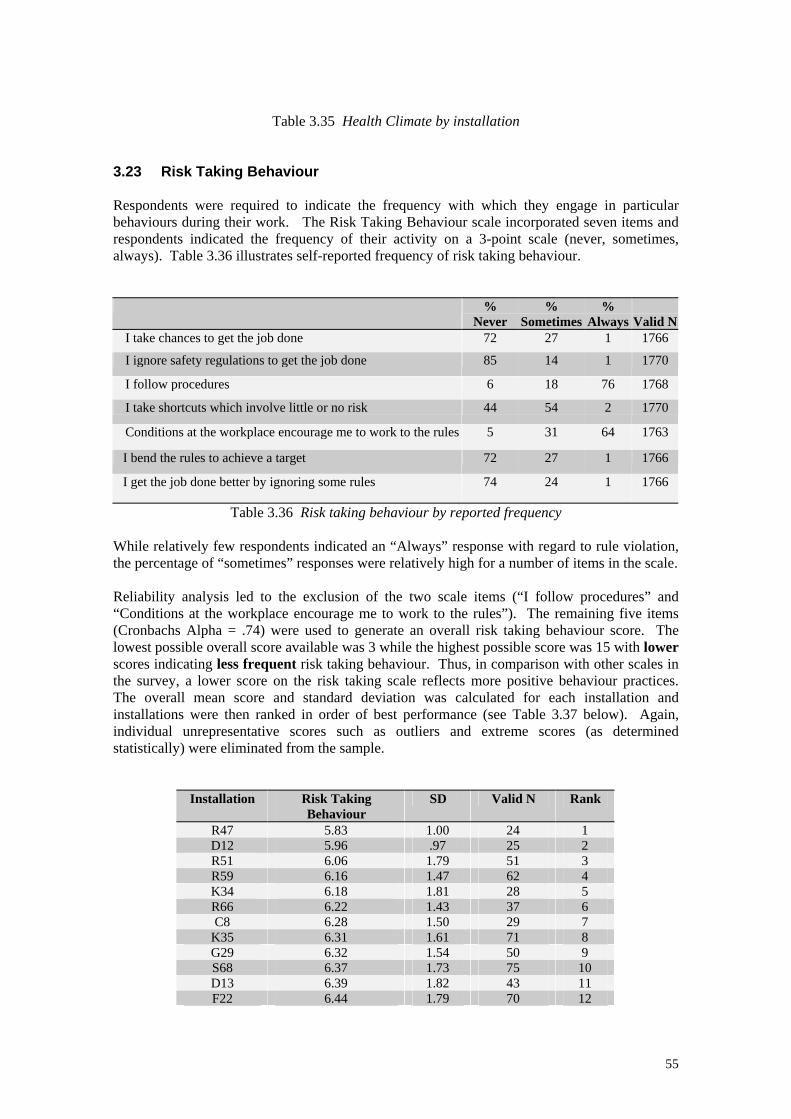
Table 3.35 Health Climate by installation 3.23 Risk Taking Behaviour Respondents were required to indicate the frequency with which they engage in particular behaviours during their work. The Risk Taking Behaviour scale incorporated seven items and respondents indicated the frequency of their activity on a 3-point scale (never, sometimes, always). Table 3.36 illustrates self-reported frequency of risk taking behaviour. %
Never %
Sometimes %
Always
Valid NI take chances to get the job done 72 27 1 1766
I ignore safety regulations to get the job done 85 14 1 1770
I follow procedures 6 18 76 1768
I take shortcuts which involve little or no risk 44 54 2 1770
Conditions at the workplace encourage me to work to the rules 5 31 64 1763
I bend the rules to achieve a target 72 27 1 1766
I get the job done better by ignoring some rules 74 24 1 1766
Table 3.36 Risk taking behaviour by reported frequency While relatively few respondents indicated an “Always” response with regard to rule violation, the percentage of “sometimes” responses were relatively high for a number of items in the scale. Reliability analysis led to the exclusion of the two scale items (“I follow procedures” and “Conditions at the workplace encourage me to work to the rules”). The remaining five items (Cronbachs Alpha = .74) were used to generate an overall risk taking behaviour score. The lowest possible overall score available was 3 while the highest possible score was 15 with lower scores indicating less frequent risk taking behaviour. Thus, in comparison with other scales in the survey, a lower score on the risk taking scale reflects more positive behaviour practices. The overall mean score and standard deviation was calculated for each installation and installations were then ranked in order of best performance (see Table 3.37 below). Again, individual unrepresentative scores such as outliers and extreme scores (as determined statistically) were eliminated from the sample.
Installation Risk Taking Behaviour
SD Valid N Rank
R47 5.83 1.00 24 1 D12 5.96 .97 25 2 R51 6.06 1.79 51 3 R59 6.16 1.47 62 4 K34 6.18 1.81 28 5 R66 6.22 1.43 37 6 C8 6.28 1.50 29 7
K35 6.31 1.61 71 8 G29 6.32 1.54 50 9 S68 6.37 1.73 75 10 D13 6.39 1.82 43 11 F22 6.44 1.79 70 12
55
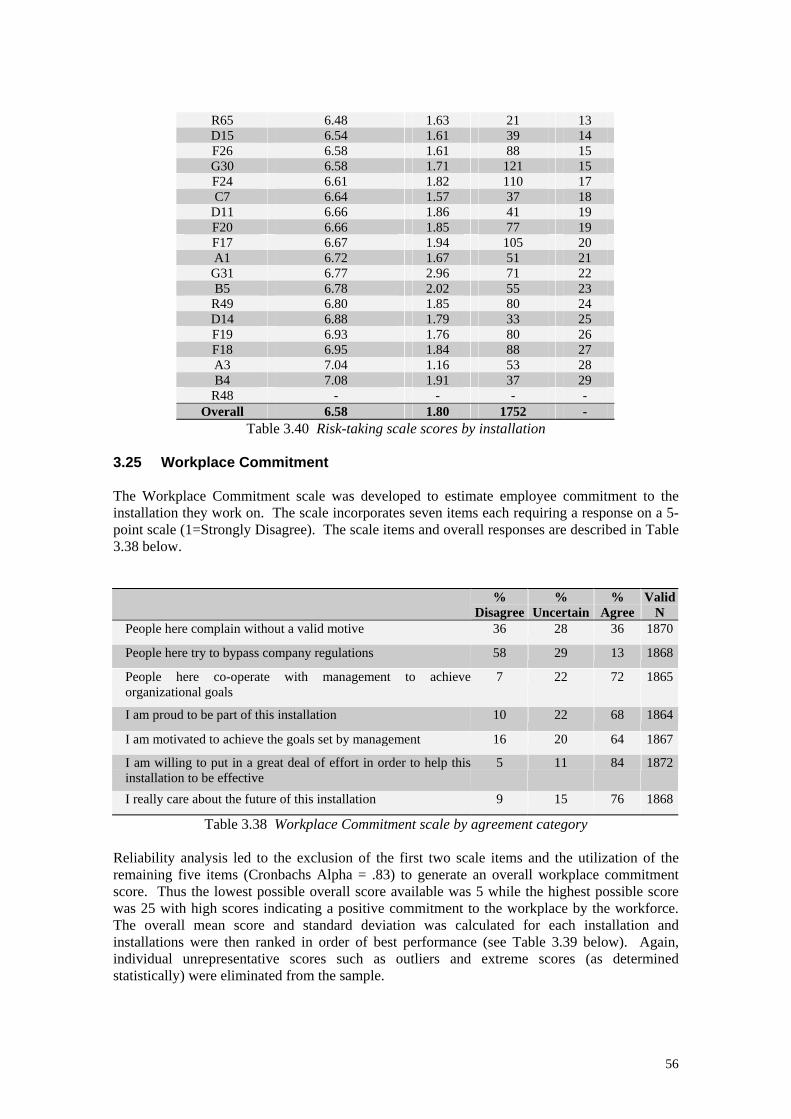
R65 6.48 1.63 21 13 D15 6.54 1.61 39 14 F26 6.58 1.61 88 15 G30 6.58 1.71 121 15 F24 6.61 1.82 110 17 C7 6.64 1.57 37 18
D11 6.66 1.86 41 19 F20 6.66 1.85 77 19 F17 6.67 1.94 105 20 A1 6.72 1.67 51 21 G31 6.77 2.96 71 22 B5 6.78 2.02 55 23
R49 6.80 1.85 80 24 D14 6.88 1.79 33 25 F19 6.93 1.76 80 26 F18 6.95 1.84 88 27 A3 7.04 1.16 53 28 B4 7.08 1.91 37 29
R48 - - - - Overall 6.58 1.80 1752 -
Table 3.40 Risk-taking scale scores by installation 3.25 Workplace Commitment The Workplace Commitment scale was developed to estimate employee commitment to the installation they work on. The scale incorporates seven items each requiring a response on a 5-point scale (1=Strongly Disagree). The scale items and overall responses are described in Table 3.38 below.
% Disagree
% Uncertain
% Agree
Valid N
People here complain without a valid motive 36 28 36 1870
People here try to bypass company regulations 58 29 13 1868
People here co-operate with management to achieve organizational goals
7 22 72 1865
I am proud to be part of this installation 10 22 68 1864
I am motivated to achieve the goals set by management 16 20 64 1867
I am willing to put in a great deal of effort in order to help this installation to be effective
5 11 84 1872
I really care about the future of this installation 9 15 76 1868
Table 3.38 Workplace Commitment scale by agreement category Reliability analysis led to the exclusion of the first two scale items and the utilization of the remaining five items (Cronbachs Alpha = .83) to generate an overall workplace commitment score. Thus the lowest possible overall score available was 5 while the highest possible score was 25 with high scores indicating a positive commitment to the workplace by the workforce. The overall mean score and standard deviation was calculated for each installation and installations were then ranked in order of best performance (see Table 3.39 below). Again, individual unrepresentative scores such as outliers and extreme scores (as determined statistically) were eliminated from the sample.
56
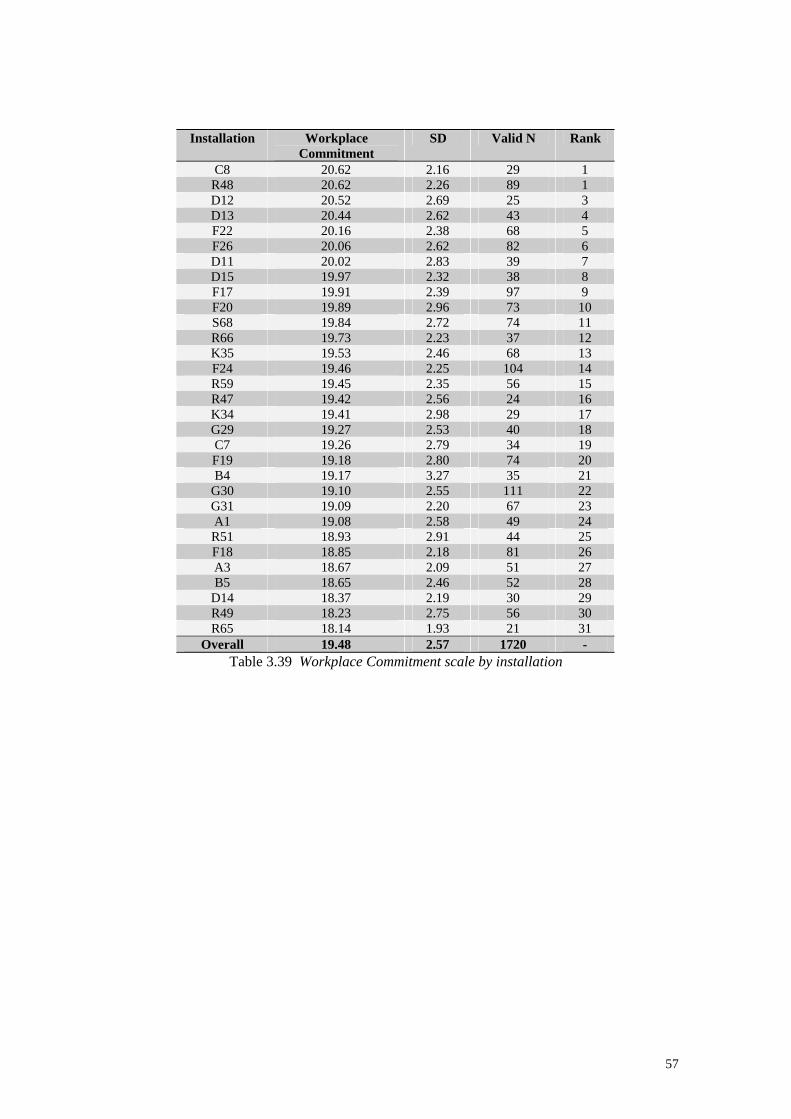
Installation Workplace
Commitment SD Valid N Rank
C8 20.62 2.16 29 1 R48 20.62 2.26 89 1 D12 20.52 2.69 25 3 D13 20.44 2.62 43 4 F22 20.16 2.38 68 5 F26 20.06 2.62 82 6 D11 20.02 2.83 39 7 D15 19.97 2.32 38 8 F17 19.91 2.39 97 9 F20 19.89 2.96 73 10 S68 19.84 2.72 74 11 R66 19.73 2.23 37 12 K35 19.53 2.46 68 13 F24 19.46 2.25 104 14 R59 19.45 2.35 56 15 R47 19.42 2.56 24 16 K34 19.41 2.98 29 17 G29 19.27 2.53 40 18 C7 19.26 2.79 34 19 F19 19.18 2.80 74 20 B4 19.17 3.27 35 21
G30 19.10 2.55 111 22 G31 19.09 2.20 67 23 A1 19.08 2.58 49 24 R51 18.93 2.91 44 25 F18 18.85 2.18 81 26 A3 18.67 2.09 51 27 B5 18.65 2.46 52 28
D14 18.37 2.19 30 29 R49 18.23 2.75 56 30 R65 18.14 1.93 21 31
Overall 19.48 2.57 1720 - Table 3.39 Workplace Commitment scale by installation
57
RESULTS I SUMMARY
The findings presented in this chapter essentially describe the overall pattern of responses provided by the workforce across all sections of the Health at Work questionnaire. From these responses, it has been possible to evaluate the overall pattern of responses for the entire sample and examine the pattern and range of these results for a large number of individual installations on the UKCS. The main findings in this section are summarised below. • Respondents identified heavy smoking while offshore, fatigue due to shift work and stress
about work as the factors most affecting their health in the offshore environment. 54% went on to indicate that they experienced feeling under stress or pressure ‘a few times during each trip’ but the majority of respondents believed they coped well with the stress they experienced. 21% indicated that they had received some degree of support on their installation to help them cope with stress experienced in the workplace.
• In terms of the management of health risks, 83% indicated that they were satisfied with their employer’s assessment of the health risks faced at work, 83% felt they were kept well informed about these health risks while 72% had been involved in identifying health risks in their work.
• Despite satisfaction with the management of health risks, a closer examination of hand-held power tool users indicated that only 8% of regular users and 10% of occasional users had been checked for vibration white finger and associated conditions. 62% of users indicated that they were familiar with the symptoms of VWF with disparity between installations perhaps reflecting the different activities engaged in by different installations. Similarly, 64% indicated exposure to chemicals with 29% receiving a health check in relation to this exposure.
• Training levels for occupational health issues such as manual handling, noise, safe use of tools, HAVS, correct use of PPE etc were reasonably high across the sample. However, approximately one-quarter of respondents had not received training in areas they believed would be useful to them given the health risks faced in their work.
• In terms of their personal health, the majority believed themselves to be in good health although, based on self-report height and weight data, 52% returned a BMI score in the overweight category with a further 12% falling into the obese category. There was a profile of increasing weight with age. 49% indicated that they find it difficult to eat a healthy diet offshore.
• 32% of the sample smoked and 27% indicated a weekly onshore consumption of alcohol between 22-50 units. A further 7% indicated an average weekly consumption in excess of 51 units. For both these samples, the majority did not believe that this level of alcohol consumption was detrimental to their health.
• 50% of respondents indicated that they engaged in light to moderate physical exercise offshore. The most common reason for non-participation in exercise was being too tired after work. Some respondents reported difficulties scheduling a gym session to co-ordinate with shifts and galley opening hours.
• 36% of the sample reported recurring muscular pain (mostly in the lower back). 67% indicated that their work offshore can exacerbate this pain but only 38% acknowledged that they have received support/advice on their installation to help them reduce or manage this pain.
• A majority of respondents believed they could rely on support from their colleagues if they were trying to improve their health – although the perceived support available from this source varied considerably by installation.
58
• 67% of respondents were aware of some form of health promotion activity on their installation but only about one third have participated. 28% have asked the medic for advice regarding their general health or fitness and 45% have received unsolicited advice from the medic with regard to the management of their personal health or fitness. However, approximately 20% of respondents indicated that they have felt ill while offshore but chose not to report to the medic in order to avoid an onshore referral.
• While a majority of respondents felt that the company values and is concerned about the health of the workforce, there was evidence of uncertainty that management is committed to improving employee health. Scores on the Organisation Health Orientation scale varied considerably between installations.
• Overall, scores on the safety climate scale were very positive while scores on the health climate scale were less positive, although scores on both scales varied considerably between participating installations. Scores on the self-reported risk-taking scale were mainly positive although the rates of rule/regulation violation were quite high for some items. For instance, 54% of respondents indicated that they sometimes take shortcuts which they perceive to involve little or no risk and 27% acknowledged that they sometimes ‘take chances to get the job done’.
• The commitment of the workforce to their workplace varied between installations. Overall, there was evidence of positive commitment to the organisation by the workforce with a high degree of willingness to work hard to ensure the success of the installation they work on.
59
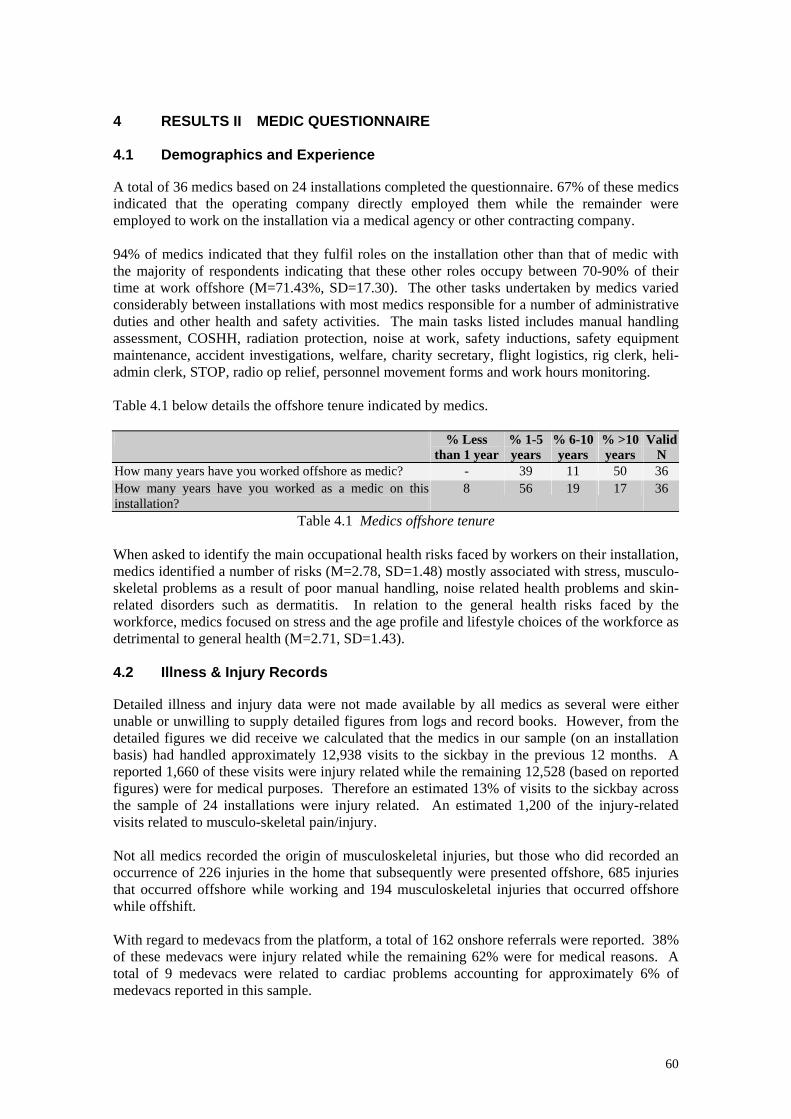
4 RESULTS II MEDIC QUESTIONNAIRE 4.1 Demographics and Experience A total of 36 medics based on 24 installations completed the questionnaire. 67% of these medics indicated that the operating company directly employed them while the remainder were employed to work on the installation via a medical agency or other contracting company. 94% of medics indicated that they fulfil roles on the installation other than that of medic with the majority of respondents indicating that these other roles occupy between 70-90% of their time at work offshore (M=71.43%, SD=17.30). The other tasks undertaken by medics varied considerably between installations with most medics responsible for a number of administrative duties and other health and safety activities. The main tasks listed includes manual handling assessment, COSHH, radiation protection, noise at work, safety inductions, safety equipment maintenance, accident investigations, welfare, charity secretary, flight logistics, rig clerk, heli-admin clerk, STOP, radio op relief, personnel movement forms and work hours monitoring. Table 4.1 below details the offshore tenure indicated by medics. % Less
than 1 year% 1-5 years
% 6-10 years
% >10 years
Valid N
How many years have you worked offshore as medic? - 39 11 50 36 How many years have you worked as a medic on this installation?
8 56 19 17 36
Table 4.1 Medics offshore tenure When asked to identify the main occupational health risks faced by workers on their installation, medics identified a number of risks (M=2.78, SD=1.48) mostly associated with stress, musculo-skeletal problems as a result of poor manual handling, noise related health problems and skin-related disorders such as dermatitis. In relation to the general health risks faced by the workforce, medics focused on stress and the age profile and lifestyle choices of the workforce as detrimental to general health (M=2.71, SD=1.43). 4.2 Illness & Injury Records Detailed illness and injury data were not made available by all medics as several were either unable or unwilling to supply detailed figures from logs and record books. However, from the detailed figures we did receive we calculated that the medics in our sample (on an installation basis) had handled approximately 12,938 visits to the sickbay in the previous 12 months. A reported 1,660 of these visits were injury related while the remaining 12,528 (based on reported figures) were for medical purposes. Therefore an estimated 13% of visits to the sickbay across the sample of 24 installations were injury related. An estimated 1,200 of the injury-related visits related to musculo-skeletal pain/injury. Not all medics recorded the origin of musculoskeletal injuries, but those who did recorded an occurrence of 226 injuries in the home that subsequently were presented offshore, 685 injuries that occurred offshore while working and 194 musculoskeletal injuries that occurred offshore while offshift. With regard to medevacs from the platform, a total of 162 onshore referrals were reported. 38% of these medevacs were injury related while the remaining 62% were for medical reasons. A total of 9 medevacs were related to cardiac problems accounting for approximately 6% of medevacs reported in this sample.
60
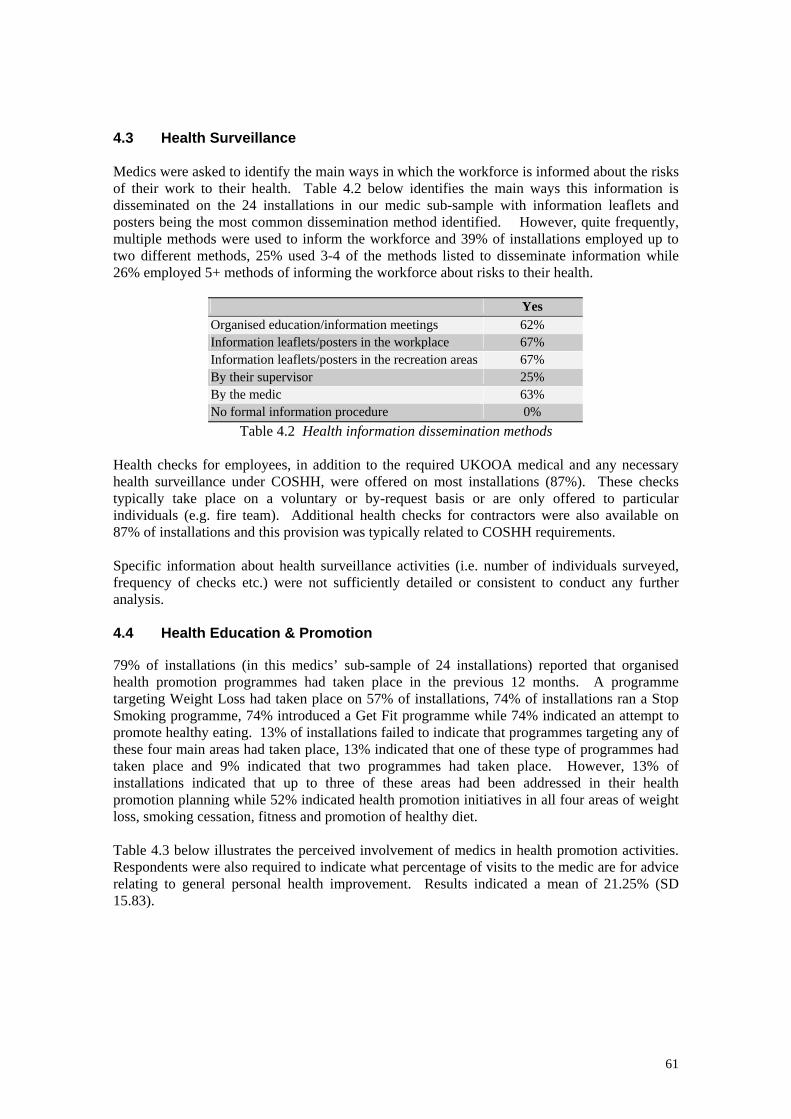
4.3 Health Surveillance Medics were asked to identify the main ways in which the workforce is informed about the risks of their work to their health. Table 4.2 below identifies the main ways this information is disseminated on the 24 installations in our medic sub-sample with information leaflets and posters being the most common dissemination method identified. However, quite frequently, multiple methods were used to inform the workforce and 39% of installations employed up to two different methods, 25% used 3-4 of the methods listed to disseminate information while 26% employed 5+ methods of informing the workforce about risks to their health.
Yes Organised education/information meetings 62% Information leaflets/posters in the workplace 67% Information leaflets/posters in the recreation areas 67% By their supervisor 25% By the medic 63% No formal information procedure 0%
Table 4.2 Health information dissemination methods Health checks for employees, in addition to the required UKOOA medical and any necessary health surveillance under COSHH, were offered on most installations (87%). These checks typically take place on a voluntary or by-request basis or are only offered to particular individuals (e.g. fire team). Additional health checks for contractors were also available on 87% of installations and this provision was typically related to COSHH requirements. Specific information about health surveillance activities (i.e. number of individuals surveyed, frequency of checks etc.) were not sufficiently detailed or consistent to conduct any further analysis. 4.4 Health Education & Promotion 79% of installations (in this medics’ sub-sample of 24 installations) reported that organised health promotion programmes had taken place in the previous 12 months. A programme targeting Weight Loss had taken place on 57% of installations, 74% of installations ran a Stop Smoking programme, 74% introduced a Get Fit programme while 74% indicated an attempt to promote healthy eating. 13% of installations failed to indicate that programmes targeting any of these four main areas had taken place, 13% indicated that one of these type of programmes had taken place and 9% indicated that two programmes had taken place. However, 13% of installations indicated that up to three of these areas had been addressed in their health promotion planning while 52% indicated health promotion initiatives in all four areas of weight loss, smoking cessation, fitness and promotion of healthy diet. Table 4.3 below illustrates the perceived involvement of medics in health promotion activities. Respondents were also required to indicate what percentage of visits to the medic are for advice relating to general personal health improvement. Results indicated a mean of 21.25% (SD 15.83).
61
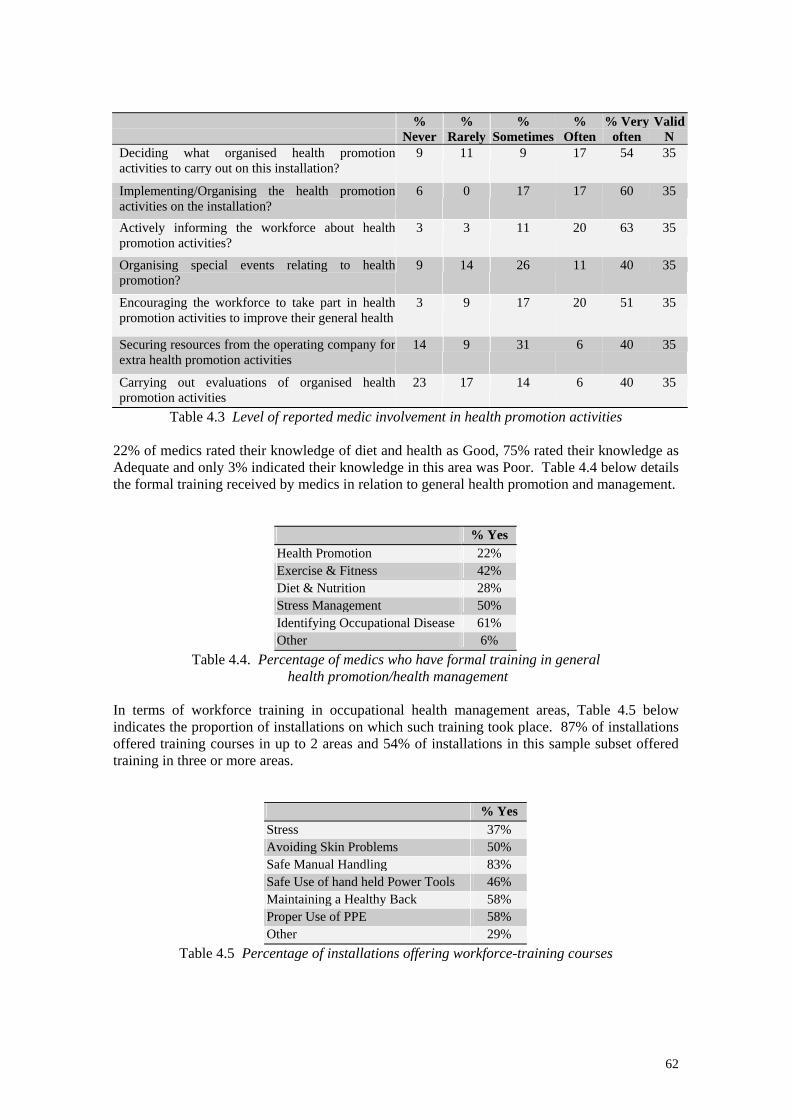
% Never
% Rarely
% Sometimes
% Often
% Very often
Valid N
Deciding what organised health promotion activities to carry out on this installation?
9 11 9 17 54 35
Implementing/Organising the health promotion activities on the installation?
6 0 17 17 60 35
Actively informing the workforce about health promotion activities?
3 3 11 20 63 35
Organising special events relating to health promotion?
9 14 26 11 40 35
Encouraging the workforce to take part in health promotion activities to improve their general health
3 9 17 20 51 35
Securing resources from the operating company for extra health promotion activities
14 9 31 6 40 35
Carrying out evaluations of organised health promotion activities
23 17 14 6 40 35
Table 4.3 Level of reported medic involvement in health promotion activities 22% of medics rated their knowledge of diet and health as Good, 75% rated their knowledge as Adequate and only 3% indicated their knowledge in this area was Poor. Table 4.4 below details the formal training received by medics in relation to general health promotion and management.
% Yes Health Promotion 22% Exercise & Fitness 42% Diet & Nutrition 28% Stress Management 50% Identifying Occupational Disease 61% Other 6%
Table 4.4. Percentage of medics who have formal training in general health promotion/health management
In terms of workforce training in occupational health management areas, Table 4.5 below indicates the proportion of installations on which such training took place. 87% of installations offered training courses in up to 2 areas and 54% of installations in this sample subset offered training in three or more areas.
% Yes Stress 37% Avoiding Skin Problems 50% Safe Manual Handling 83% Safe Use of hand held Power Tools 46% Maintaining a Healthy Back 58% Proper Use of PPE 58% Other 29%
Table 4.5 Percentage of installations offering workforce-training courses
62

4.5 Evaluation of Health Promotion Activities Medics were required to rate (on a five point scale; 1=Definitely yes) whether occupational health risks are adequately addressed by existing health management surveillance strategies. Results indicated a mean response of 2.51 (SD=.95). Similarly, medics were asked whether they thought general health risks were adequately addressed by existing health promotion programmes. Responses indicate a mean response of 2.74 (SD=1.12). Again, the level of agreement varied across installations. However, 78% of medics believed there had been a change in workforce health since the introduction of health promotion programmes (see reasons for this response in Appendix III). Medics were also required to indicate on a 5-point scale whether they thought the workforce would be receptive to health promotion initiatives (1=Definitely yes). A mean response of 2.28 (SD=1.04) was returned. 69% of installations in this sample had received an award for health promotion activities. 19% of the installations had attained the SHAW Gold Standard, 12% had achieved the SHAW Silver Award while 69% had received the Bronze Award status. Finally medics were asked to rate (on a five point scale, 1= Strongly committed) the operating company’s level of commitment to improving the health of the workforce on the installation. Respondents indicated a mean response of 2.59 (SD=.99).
63
RESULTS II SUMMARY The Health at Work Questionnaire for Medics aimed to assess the medic’s role in relation to health promotion and occupational health activities. The questionnaire also provided information relating to training available in the workplace and details relating to the role and background of the medic in addition to their perceptions of their role and the commitment of the organisations they work with. The problematic nature of collecting injury, illness and sickbay visit data became clearly apparent in the course of this analysis. Despite the careful piloting of this section of the questionnaire, responses proved extremely difficult to collate. For many installations, the data was either omitted, not within the requested date-range, only partly completed, approximated or not consistent with subsequent responses. Attempts were made to equate the data across installation but given the difficulties outlined above, it was finally decided to eliminate these data from further analysis. The main findings in this section are summarised below: • Almost all medics indicated that they fulfil roles on the installation other than that of
medic with these other roles/tasks occupying an estimated 70-90% of their time. • Medics identified stress and musculo-skeletal disorders as the main occupational health
risks facing the offshore workforce while the aging profile and unhealthy lifestyle choices of the workforce were also identified as increasingly problematic for health.
• According to the medics report, health promotion activities took place on 79% of installations with 52% offering initiatives in the following key areas: weight loss, smoking cessation, fitness and healthy eating.
• The training received by medics relating to health promotion and occupational health issues can best be described as patchy – only 22% have been trained specifically in health promotion whereas 50% indicated having received training in relation to stress management.
• Training offered to the workforce varied also – while 83% of installations offered training relating to safe manual handling only 46% offered training for the safe use of handheld power tools and 37% offered a training relating to stress management.
• An encouraging 78% of medics believed there had been a change in workforce health since the introduction of health promotion programmes and many responded positively regarding the company’s level of commitment to improving the health of the workforce.
64
5 RESULTS III: ADDRESSING RESEARCH QUESTIONS 5.1 Overview To recap, this project aimed to examine health behaviours and health management practices on offshore installations on the UKCS. The research also sought to initiate an investigation of a number of specific research questions concerned with the potential relationships between health promotion and health surveillance activities and the overall safety and well-being of the offshore worker. Specifically, this first phase of the project sought to explore the most likely explanations underpinning an hypothesized relationship between occupational health management (in the form of health promotion and health surveillance) and safety climate/behaviour. Previous findings in the literature indicated that the positive management of health promotion and health surveillance activities offshore were associated with lower lost time injury rates and lower rates of dangerous occurrence and near misses. The research questions (described below) were developed to assess what factors might underpin this association. The Health at Work questionnaire was designed to address these research questions as fully as possible using a survey methodology. • Research Question I: Do healthy employees cope better in the offshore environment? This research question sought to address the extent to which good health habits foster ability to work and live offshore. In other words, examine whether engaging in personal health and fitness management is associated with a perceived increase in ability to cope both physically and psychologically with the offshore working environment? For instance, it may be the case that increased physical and mental well-being (derived from exercise and other personal health management activities) have a direct impact on physical and psycho-social stressors leading to improved ability to cope, greater attentiveness and ability to respond to potentially hazardous situations. • Research Question II: Does investment in employee health foster perceptions of company
commitment and build worker loyalty in areas such as safety? Is increased investment in health promotion and surveillance perceived as indicative of higher levels of management commitment to the workforce and, if so, what is the effect of this additional investment? The research literature would appear to indicate that organizational support for the workforce promotes greater employee commitment to the goals, objectives and regulations of the organization they work for – and in particular, promotes organizational citizenship behaviours in areas such as safety and reporting culture (hazards, risks, sub-standard or damaged equipment, PPE etc). • Research Question III: Are positive health management practices also associated with
good risk assessments? Finally, it may simply be the case that an installation proficient in the management of occupational health issues will also be good at accident risk assessment. On these installations there may exist a stronger commitment to good safety climate and the facilitation of a culture of ‘care and concern’. 5.2 Data Coding and Analysis The data were analysed on computer using SPSS Windows (Statistical Package for Social Sciences) which allows a range of data management and statistical techniques. Statistical
65
methods used throughout include analysis of variance, chi-square, factor analysis, correlation and logistic, multiple and linear regressions.
Analysis of variance (ANOVA) is concerned with the testing of hypotheses about mean (or average) scores (Kinnear & Gray, 1994). In ANOVA, a group mean is taken as an estimate of performance under particular conditions. However, the performance of an individual within the group can vary considerably and deviate markedly from the group mean. This is known as within group variability or error. There may also be a high degree of variability between groups in that performance of one group may differ considerably from that of another group on the same variable, task or measurement. The ANOVA F statistic is calculated by dividing an estimate of the variability between groups by the within groups variability. If there are large differences between the group means, the numerator of F (and therefore the F value itself) will be inflated and the null hypothesis is likely to be rejected. The null hypothesis (H0) states equality between two population means. When H0 can be rejected, it is possible to conclude the presence of a significant difference between two (or more) population means. In terms of the F value, if there is no effect, the numerator and denominator of F should have similar values, resulting in an F value close to unity. If the ANOVA F test indicates significance, however, the difference between population means is confirmed. However, where there are three or more population groups, it may not be clear from a simple examination of group mean scores, which comparisons are in fact significantly different. Further analysis is therefore necessary to localise those differences to particular individual group means. In the current study, Tukey’s Honestly Significant Difference (HSD) test was used to carry out a posteriori comparisons between group means.
Chi-square statistic and correlation are both measures of association. A Pearson correlation is used for measuring the relationship between two sets of interval data. Kendall’s Tau is used as the measure of correlation when at least one set of data is categorical. The chi-square statistic (χ2) is used for determining the presence of an association between two variables. The rejection of H0 by means of chi-square, however, only determines the existence of a statistical association: it does not determine its strength (Kinnear & Gray, 1994). In correlation, the strength of association between variables is expressed as a single number known as the correlation coefficient. Regression, however, seeks to estimate or predict some characteristic from a knowledge of others by constructing a regression equation (Kinnear & Gray, 1994). Throughout the analysis, extreme scores and outlying scores on any of the scales were identified and eliminated from further analysis on the grounds that these scores are essentially unrepresentative, can misleadingly skew the findings and also violate the assumptions pertaining to normally distributed data associated with statistical techniques such as analysis of variance. To address our research questions, it was necessary to calculate indices or factors rather than analyses individual item scores which would have been rather simplistic and unlikely to contribute meaningfully to the analysis strategy. A version of this brief synopsis of statistical techniques also appears in Mearns, Flin, Fleming and Gordon (HSE OTH 543, 1997).
66
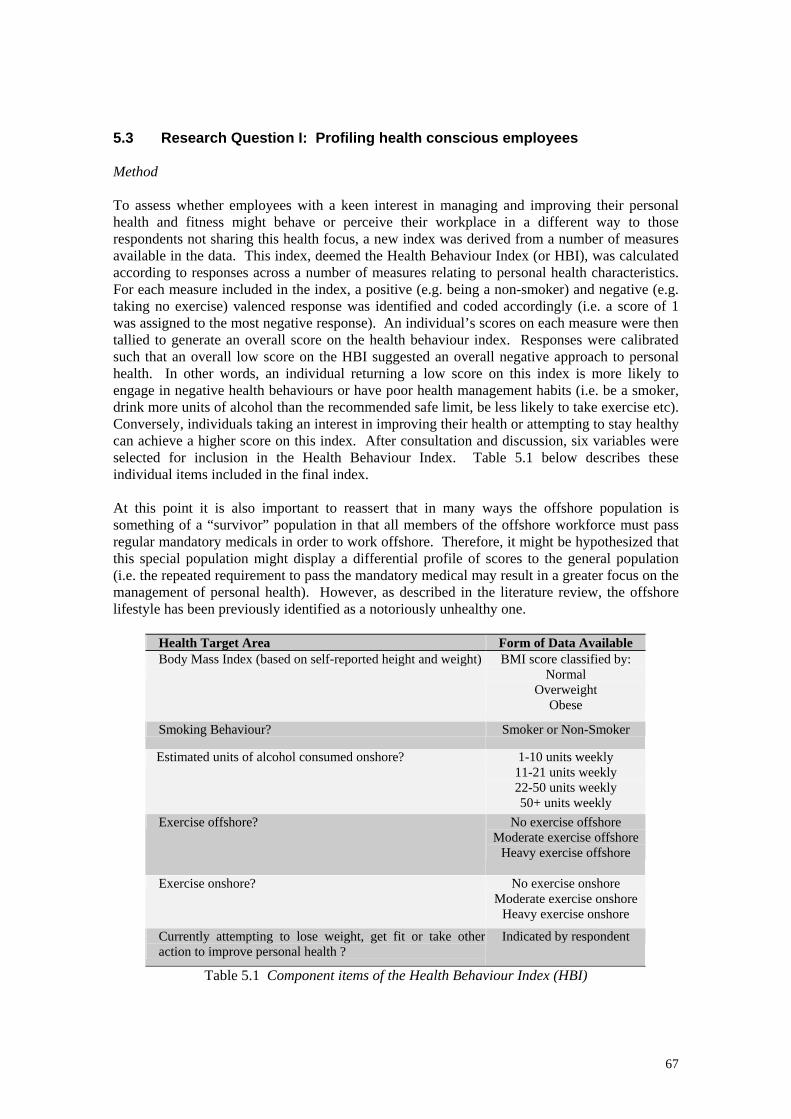
5.3 Research Question I: Profiling health conscious employees Method To assess whether employees with a keen interest in managing and improving their personal health and fitness might behave or perceive their workplace in a different way to those respondents not sharing this health focus, a new index was derived from a number of measures available in the data. This index, deemed the Health Behaviour Index (or HBI), was calculated according to responses across a number of measures relating to personal health characteristics. For each measure included in the index, a positive (e.g. being a non-smoker) and negative (e.g. taking no exercise) valenced response was identified and coded accordingly (i.e. a score of 1 was assigned to the most negative response). An individual’s scores on each measure were then tallied to generate an overall score on the health behaviour index. Responses were calibrated such that an overall low score on the HBI suggested an overall negative approach to personal health. In other words, an individual returning a low score on this index is more likely to engage in negative health behaviours or have poor health management habits (i.e. be a smoker, drink more units of alcohol than the recommended safe limit, be less likely to take exercise etc). Conversely, individuals taking an interest in improving their health or attempting to stay healthy can achieve a higher score on this index. After consultation and discussion, six variables were selected for inclusion in the Health Behaviour Index. Table 5.1 below describes these individual items included in the final index. At this point it is also important to reassert that in many ways the offshore population is something of a “survivor” population in that all members of the offshore workforce must pass regular mandatory medicals in order to work offshore. Therefore, it might be hypothesized that this special population might display a differential profile of scores to the general population (i.e. the repeated requirement to pass the mandatory medical may result in a greater focus on the management of personal health). However, as described in the literature review, the offshore lifestyle has been previously identified as a notoriously unhealthy one.
Health Target Area Form of Data Available Body Mass Index (based on self-reported height and weight)
BMI score classified by: Normal
Overweight Obese
Smoking Behaviour? Smoker or Non-Smoker
Estimated units of alcohol consumed onshore? 1-10 units weekly 11-21 units weekly 22-50 units weekly 50+ units weekly
Exercise offshore? No exercise offshore Moderate exercise offshore
Heavy exercise offshore
Exercise onshore? No exercise onshore Moderate exercise onshore
Heavy exercise onshore
Currently attempting to lose weight, get fit or take otheraction to improve personal health ?
Indicated by respondent
Table 5.1 Component items of the Health Behaviour Index (HBI)
67
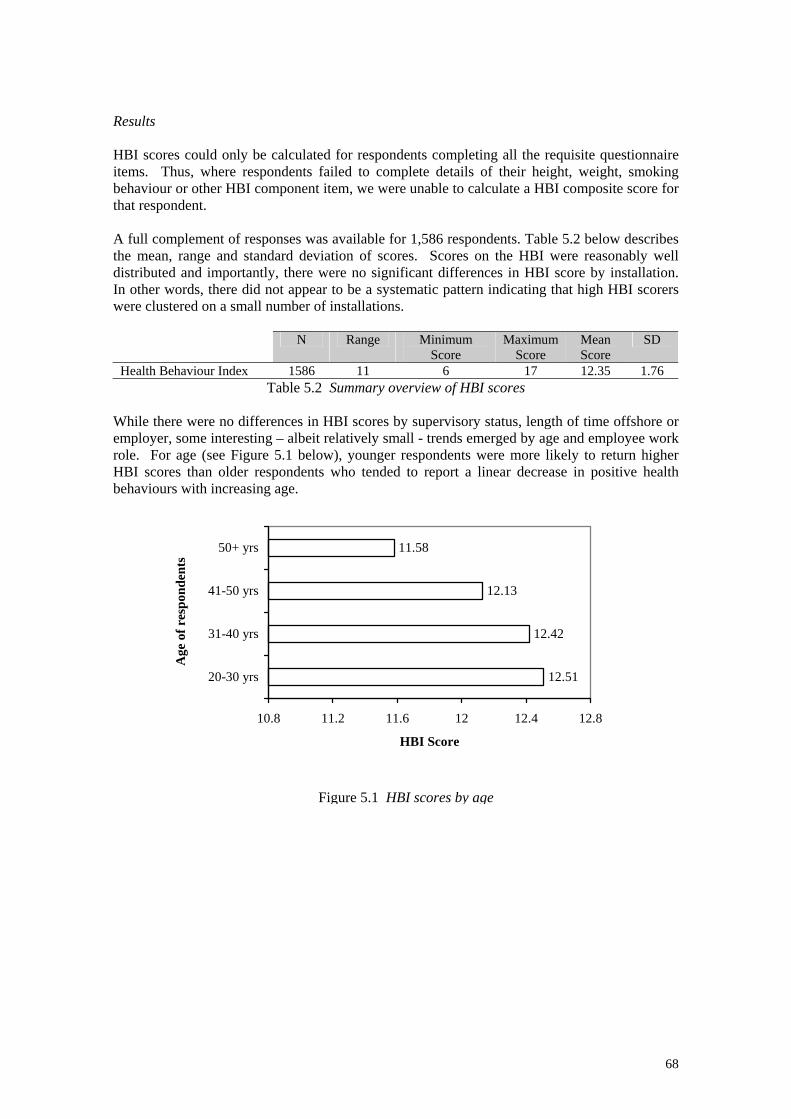
Results HBI scores could only be calculated for respondents completing all the requisite questionnaire items. Thus, where respondents failed to complete details of their height, weight, smoking behaviour or other HBI component item, we were unable to calculate a HBI composite score for that respondent. A full complement of responses was available for 1,586 respondents. Table 5.2 below describes the mean, range and standard deviation of scores. Scores on the HBI were reasonably well distributed and importantly, there were no significant differences in HBI score by installation. In other words, there did not appear to be a systematic pattern indicating that high HBI scorers were clustered on a small number of installations.
N Range Minimum Score
Maximum Score
Mean Score
SD
Health Behaviour Index 1586 11 6 17 12.35 1.76 Table 5.2 Summary overview of HBI scores
While there were no differences in HBI scores by supervisory status, length of time offshore or employer, some interesting – albeit relatively small - trends emerged by age and employee work role. For age (see Figure 5.1 below), younger respondents were more likely to return higher HBI scores than older respondents who tended to report a linear decrease in positive health behaviours with increasing age.
12.51
12.42
12.13
11.58
10.8 11.2 11.6 12 12.4 12.8
20-30 yrs
31-40 yrs
41-50 yrs
50+ yrs
Age
of r
espo
nden
ts
HBI Score
Figure 5.1 HBI scores by age
68
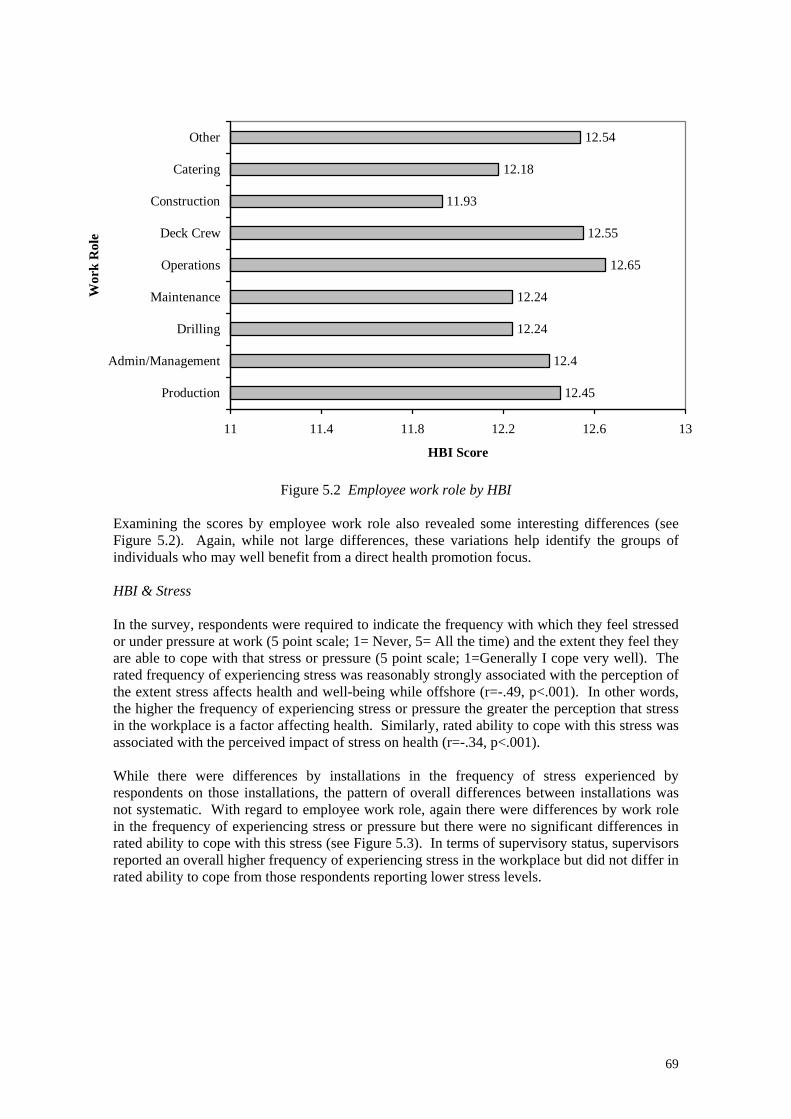
12.45
12.4
12.24
12.24
12.65
12.55
11.93
12.18
12.54
11 11.4 11.8 12.2 12.6 13
Production
Admin/Management
Drilling
Maintenance
Operations
Deck Crew
Construction
Catering
Other
Wor
k R
ole
HBI Score
Figure 5.2 Employee work role by HBI Examining the scores by employee work role also revealed some interesting differences (see Figure 5.2). Again, while not large differences, these variations help identify the groups of individuals who may well benefit from a direct health promotion focus. HBI & Stress In the survey, respondents were required to indicate the frequency with which they feel stressed or under pressure at work (5 point scale; 1= Never, 5= All the time) and the extent they feel they are able to cope with that stress or pressure (5 point scale; 1=Generally I cope very well). The rated frequency of experiencing stress was reasonably strongly associated with the perception of the extent stress affects health and well-being while offshore (r=-.49, p<.001). In other words, the higher the frequency of experiencing stress or pressure the greater the perception that stress in the workplace is a factor affecting health. Similarly, rated ability to cope with this stress was associated with the perceived impact of stress on health (r=-.34, p<.001). While there were differences by installations in the frequency of stress experienced by respondents on those installations, the pattern of overall differences between installations was not systematic. With regard to employee work role, again there were differences by work role in the frequency of experiencing stress or pressure but there were no significant differences in rated ability to cope with this stress (see Figure 5.3). In terms of supervisory status, supervisors reported an overall higher frequency of experiencing stress in the workplace but did not differ in rated ability to cope from those respondents reporting lower stress levels.
69
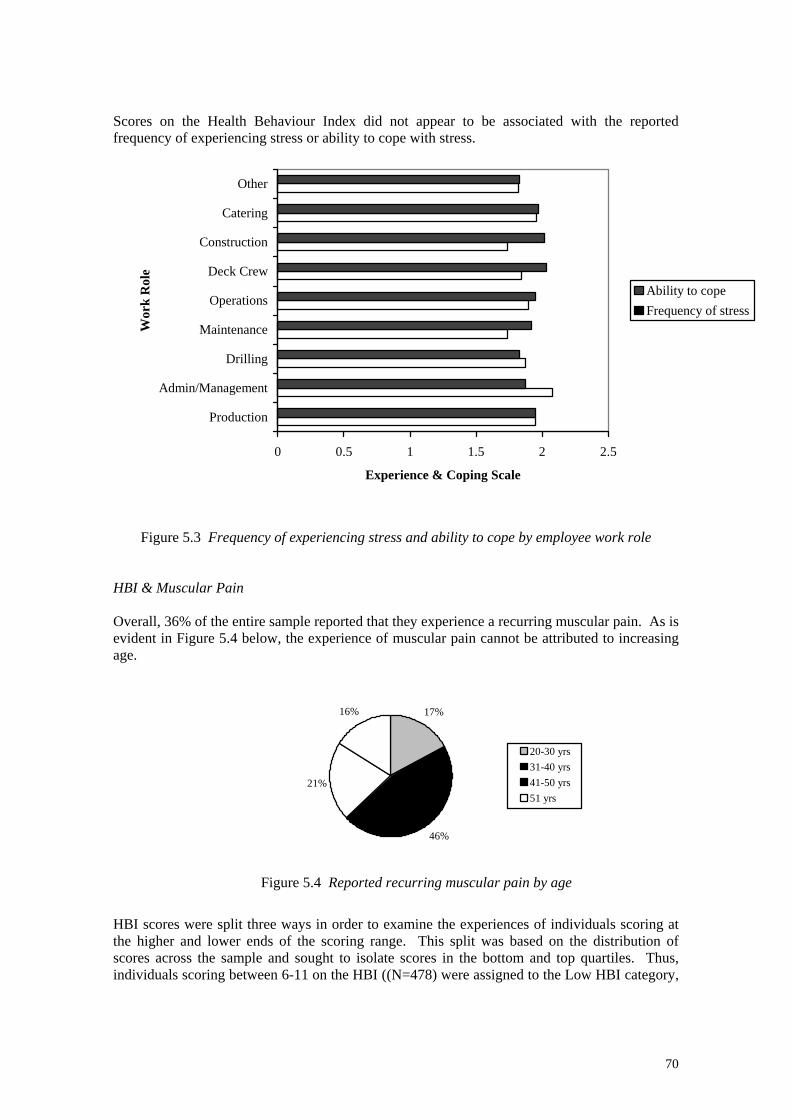
Scores on the Health Behaviour Index did not appear to be associated with the reported frequency of experiencing stress or ability to cope with stress.
0 0.5 1 1.5 2 2.5
Production
Admin/Management
Drilling
Maintenance
Operations
Deck Crew
Construction
Catering
Other
Wor
k R
ole
Experience & Coping Scale
Ability to copeFrequency of stress
Figure 5.3 Frequency of experiencing stress and ability to cope by employee work role HBI & Muscular Pain Overall, 36% of the entire sample reported that they experience a recurring muscular pain. As is evident in Figure 5.4 below, the experience of muscular pain cannot be attributed to increasing age. 17%
21%
16%
46%
20-30 yrs31-40 yrs41-50 yrs51 yrs
HBI scores were split tthe higher and lower escores across the sampindividuals scoring betw
Figure 5.4 Reported recurring muscular pain by age
hree ways in order to examine the experiences of individuals scoring at nds of the scoring range. This split was based on the distribution of le and sought to isolate scores in the bottom and top quartiles. Thus, een 6-11 on the HBI ((N=478) were assigned to the Low HBI category,
70
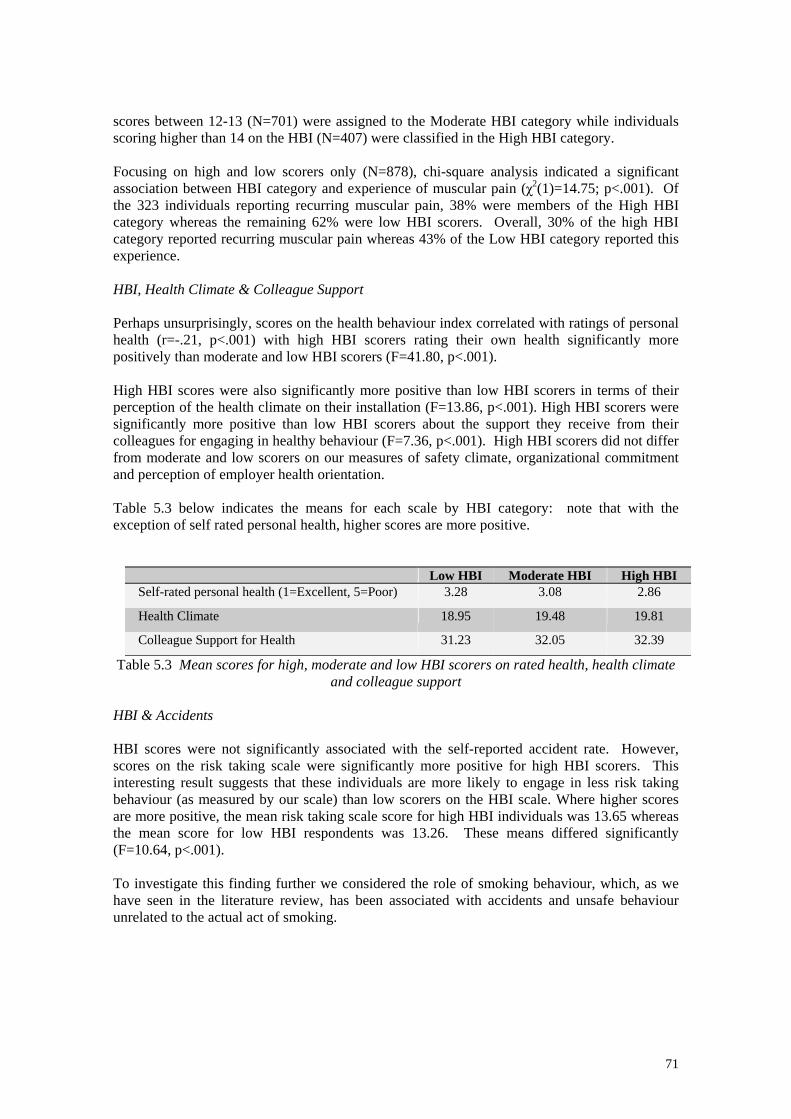
scores between 12-13 (N=701) were assigned to the Moderate HBI category while individuals scoring higher than 14 on the HBI (N=407) were classified in the High HBI category. Focusing on high and low scorers only (N=878), chi-square analysis indicated a significant association between HBI category and experience of muscular pain (χ2(1)=14.75; p<.001). Of the 323 individuals reporting recurring muscular pain, 38% were members of the High HBI category whereas the remaining 62% were low HBI scorers. Overall, 30% of the high HBI category reported recurring muscular pain whereas 43% of the Low HBI category reported this experience. HBI, Health Climate & Colleague Support Perhaps unsurprisingly, scores on the health behaviour index correlated with ratings of personal health (r=-.21, p<.001) with high HBI scorers rating their own health significantly more positively than moderate and low HBI scorers (F=41.80, p<.001). High HBI scores were also significantly more positive than low HBI scorers in terms of their perception of the health climate on their installation (F=13.86, p<.001). High HBI scorers were significantly more positive than low HBI scorers about the support they receive from their colleagues for engaging in healthy behaviour (F=7.36, p<.001). High HBI scorers did not differ from moderate and low scorers on our measures of safety climate, organizational commitment and perception of employer health orientation. Table 5.3 below indicates the means for each scale by HBI category: note that with the exception of self rated personal health, higher scores are more positive.
Low HBI Moderate HBI High HBI Self-rated personal health (1=Excellent, 5=Poor) 3.28 3.08 2.86
Health Climate 18.95 19.48 19.81
Colleague Support for Health 31.23 32.05 32.39
Table 5.3 Mean scores for high, moderate and low HBI scorers on rated health, health climate and colleague support
HBI & Accidents HBI scores were not significantly associated with the self-reported accident rate. However, scores on the risk taking scale were significantly more positive for high HBI scorers. This interesting result suggests that these individuals are more likely to engage in less risk taking behaviour (as measured by our scale) than low scorers on the HBI scale. Where higher scores are more positive, the mean risk taking scale score for high HBI individuals was 13.65 whereas the mean score for low HBI respondents was 13.26. These means differed significantly (F=10.64, p<.001). To investigate this finding further we considered the role of smoking behaviour, which, as we have seen in the literature review, has been associated with accidents and unsafe behaviour unrelated to the actual act of smoking.
71
The Role of Smoking Behaviour There were 593 smokers in our sample, representing 32% of our entire sample. 510 respondents (27%) indicated that they were former smokers who have now given up smoking completely while the remaining 781 respondents (41%) indicated they had never smoked. The vast majority of smokers (93%) indicated they smoked cigarettes as opposed to pipe tobacco or cigars. Rates of smoking by installation ranged from 12% to 54%.
In terms of self-reported risk taking behaviour there was no difference in scores between smokers and non-smokers. However, consistent with previously reported findings in the literature, results revealed an association between self-reported accidents and smoking (χ2(1)=6.23; p<.01). A closer examination of this association indicated that the self-reported accident rate for smokers in this sample was 9% whereas the rate for non-smokers was 5%.
This association was lessened for respondents indicating that they were former smokers although they still indicated an accident rate higher than that returned by non-smokers (8%). However, the health promotion literature also suggests that smoking cessation programmes are among the most effective and successful forms of intervention. Although we did not seek to test this association specifically our data allow some assessment of this conclusion. For those participants who chose to partake in health promotion activities on their installation there was a strongly significant association with smoking status (χ2(1)=30.29; p<.001). Looking at data for smokers and former smokers only, 59% of those who indicated that they took part in health promotion activities on their installation also indicated that they used to smoke but have now completely given up. This pattern was directly reversed for respondents who were not involved in health promotion activities (for whatever reason) such that 59% of these respondents were current smokers and only 41% have quit the habit.
72
Summary These results clearly suggest that high scorers on the health behaviour index – in other words, those individuals who most carefully manage their health in terms of personal behaviour choices – differ in several interesting ways from those individuals who pay less attention to their personal health. The key findings are summarized below: • There was an age related decrease in positive health behaviours suggesting that future
health promotion activities should perhaps focus on the middle-aged to older members of the workforce.
• Supervisors reported an overall higher frequency of experiencing stress in the workplace but did not differ in their rated ability to cope with this stress from respondents who reported lower levels of stress. The reported frequency or ability to cope with stress did not appear to be associated with scores on the Health Behaviour Index.
• 36% of respondents reported that they experience a recurring muscular pain. Individuals returning a high HBI score reported a lower instance of muscular pain than low HBI scorers. There was no evidence to suggest that muscular pain was associated with increasing age within this sample.
• High HBI scorers rated their health more positively than low HBI scorers and also reported a more positive perception of the health climate on the installation. High HBI scorers also appeared to benefit from a network of colleagues who supported their health behaviours.
• Although HBI scores were not associated with the self-reported accident rate, results suggest that high HBI scorers take fewer risks.
• Smoking habits were examined as a feature of personal health behaviour. 32% of the sample reported that they were smokers while 27% indicated that they had smoked previously but have now quit the habit.
• Replicating previous finding in the literature, smoking was significantly associated with the self-reported accident rate with smokers returning a higher rate of accidents.
73
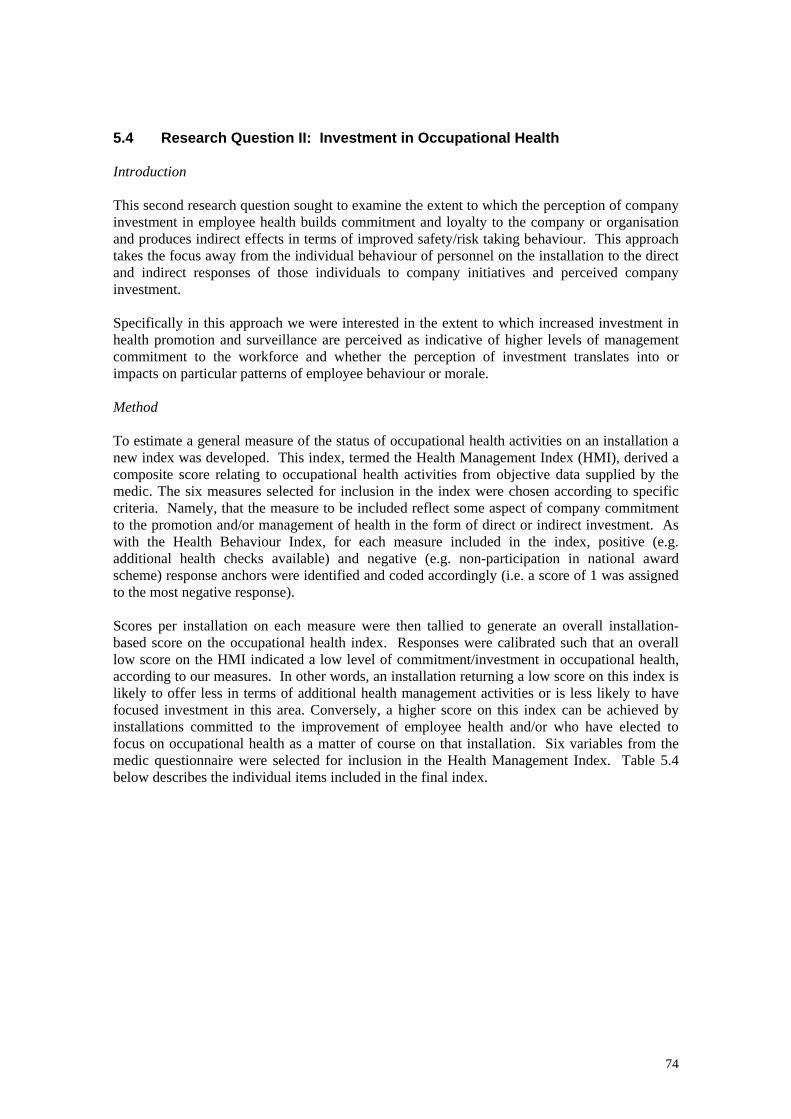
5.4 Research Question II: Investment in Occupational Health Introduction This second research question sought to examine the extent to which the perception of company investment in employee health builds commitment and loyalty to the company or organisation and produces indirect effects in terms of improved safety/risk taking behaviour. This approach takes the focus away from the individual behaviour of personnel on the installation to the direct and indirect responses of those individuals to company initiatives and perceived company investment. Specifically in this approach we were interested in the extent to which increased investment in health promotion and surveillance are perceived as indicative of higher levels of management commitment to the workforce and whether the perception of investment translates into or impacts on particular patterns of employee behaviour or morale. Method To estimate a general measure of the status of occupational health activities on an installation a new index was developed. This index, termed the Health Management Index (HMI), derived a composite score relating to occupational health activities from objective data supplied by the medic. The six measures selected for inclusion in the index were chosen according to specific criteria. Namely, that the measure to be included reflect some aspect of company commitment to the promotion and/or management of health in the form of direct or indirect investment. As with the Health Behaviour Index, for each measure included in the index, positive (e.g. additional health checks available) and negative (e.g. non-participation in national award scheme) response anchors were identified and coded accordingly (i.e. a score of 1 was assigned to the most negative response). Scores per installation on each measure were then tallied to generate an overall installation-based score on the occupational health index. Responses were calibrated such that an overall low score on the HMI indicated a low level of commitment/investment in occupational health, according to our measures. In other words, an installation returning a low score on this index is likely to offer less in terms of additional health management activities or is less likely to have focused investment in this area. Conversely, a higher score on this index can be achieved by installations committed to the improvement of employee health and/or who have elected to focus on occupational health as a matter of course on that installation. Six variables from the medic questionnaire were selected for inclusion in the Health Management Index. Table 5.4 below describes the individual items included in the final index.
74
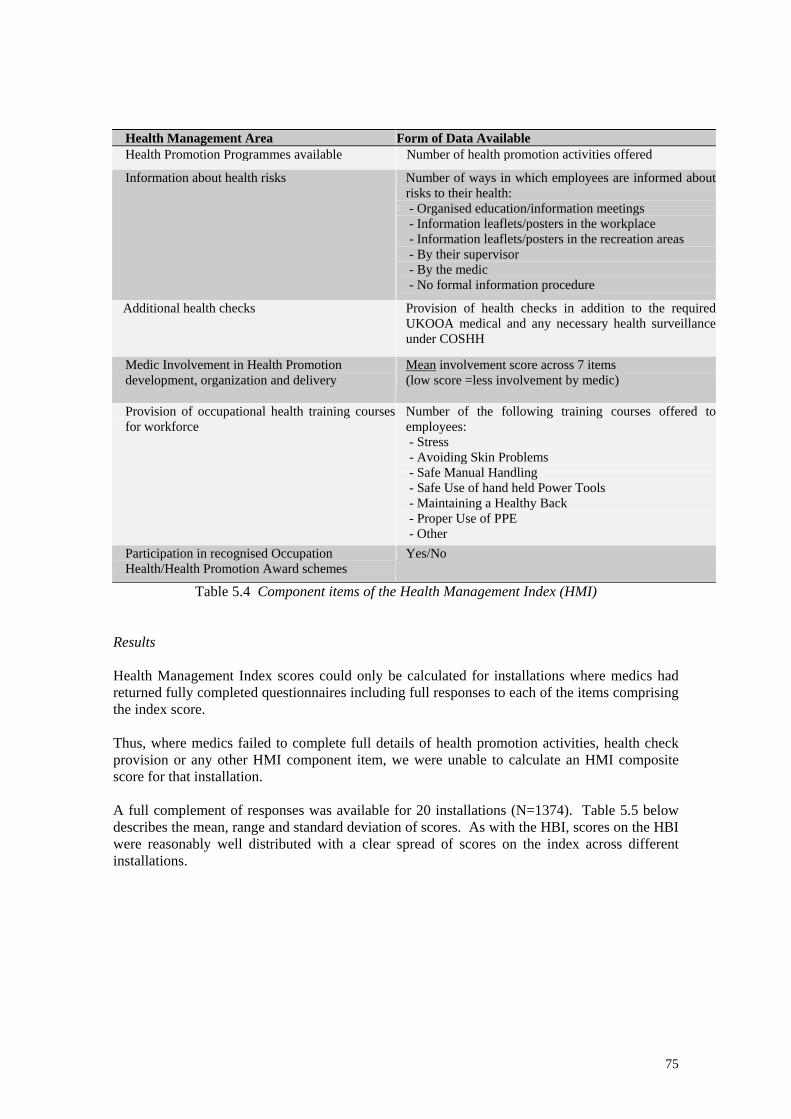
Health Management Area Form of Data Available Health Promotion Programmes available Number of health promotion activities offered
Information about health risks Number of ways in which employees are informed about risks to their health: - Organised education/information meetings - Information leaflets/posters in the workplace - Information leaflets/posters in the recreation areas - By their supervisor - By the medic - No formal information procedure
Additional health checks Provision of health checks in addition to the required UKOOA medical and any necessary health surveillance under COSHH
Medic Involvement in Health Promotion development, organization and delivery
Mean involvement score across 7 items (low score =less involvement by medic)
Provision of occupational health training courses for workforce
Number of the following training courses offered to employees: - Stress - Avoiding Skin Problems - Safe Manual Handling - Safe Use of hand held Power Tools - Maintaining a Healthy Back - Proper Use of PPE - Other
Participation in recognised Occupation Health/Health Promotion Award schemes
Yes/No
Table 5.4 Component items of the Health Management Index (HMI) Results Health Management Index scores could only be calculated for installations where medics had returned fully completed questionnaires including full responses to each of the items comprising the index score. Thus, where medics failed to complete full details of health promotion activities, health check provision or any other HMI component item, we were unable to calculate an HMI composite score for that installation. A full complement of responses was available for 20 installations (N=1374). Table 5.5 below describes the mean, range and standard deviation of scores. As with the HBI, scores on the HBI were reasonably well distributed with a clear spread of scores on the index across different installations.
75
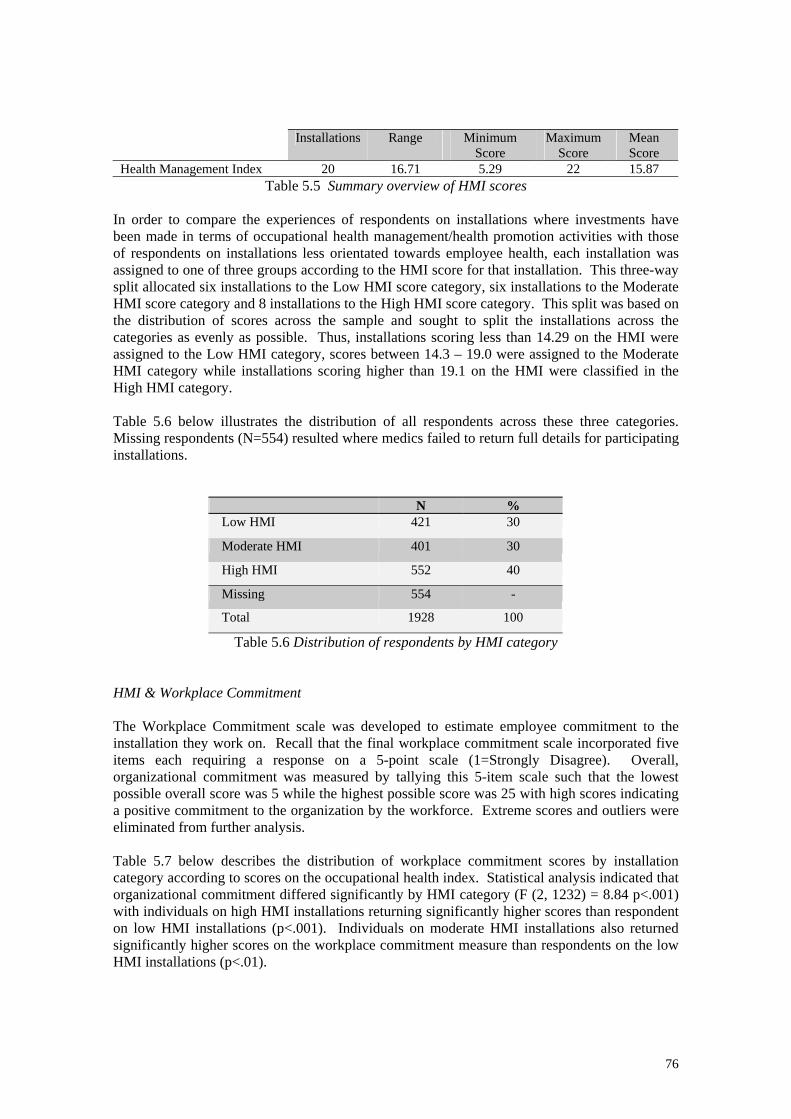
Installations Range Minimum
Score Maximum
Score Mean Score
Health Management Index 20 16.71 5.29 22 15.87 Table 5.5 Summary overview of HMI scores
In order to compare the experiences of respondents on installations where investments have been made in terms of occupational health management/health promotion activities with those of respondents on installations less orientated towards employee health, each installation was assigned to one of three groups according to the HMI score for that installation. This three-way split allocated six installations to the Low HMI score category, six installations to the Moderate HMI score category and 8 installations to the High HMI score category. This split was based on the distribution of scores across the sample and sought to split the installations across the categories as evenly as possible. Thus, installations scoring less than 14.29 on the HMI were assigned to the Low HMI category, scores between 14.3 – 19.0 were assigned to the Moderate HMI category while installations scoring higher than 19.1 on the HMI were classified in the High HMI category. Table 5.6 below illustrates the distribution of all respondents across these three categories. Missing respondents (N=554) resulted where medics failed to return full details for participating installations.
N % Low HMI 421 30
Moderate HMI 401 30
High HMI 552 40
Missing 554 -
Total 1928 100
Table 5.6 Distribution of respondents by HMI category HMI & Workplace Commitment The Workplace Commitment scale was developed to estimate employee commitment to the installation they work on. Recall that the final workplace commitment scale incorporated five items each requiring a response on a 5-point scale (1=Strongly Disagree). Overall, organizational commitment was measured by tallying this 5-item scale such that the lowest possible overall score was 5 while the highest possible score was 25 with high scores indicating a positive commitment to the organization by the workforce. Extreme scores and outliers were eliminated from further analysis. Table 5.7 below describes the distribution of workplace commitment scores by installation category according to scores on the occupational health index. Statistical analysis indicated that organizational commitment differed significantly by HMI category (F (2, 1232) = 8.84 p<.001) with individuals on high HMI installations returning significantly higher scores than respondent on low HMI installations (p<.001). Individuals on moderate HMI installations also returned significantly higher scores on the workplace commitment measure than respondents on the low HMI installations (p<.01).
76

N Mean Score SD Low HMI Installations 400 19.12 2.65 Moderate HMI Installations 378 19.62 2.59 High HMI Installations 515 19.90 2.45
Table 5.7 Workplace commitment by HMI category HMI & Safety Climate ‘Climate for Safety’ was determined using a subset of 7-items from the health and safety climate scale based on the results of factor analysis (see Chapter 3). Table 5.8 below indicates safety climate scores according to employer health management category. Recall that a higher score on the safety climate scale indicates a more positive perception of the safety climate on that installation. Statistical analysis indicated that safety climate differed significantly by HMI category (F(2, 1304) = 15.62, p<.001) with individuals on high HMI installations returning significantly higher scores than respondent on moderate HMI installations (p<.001) and low HMI installations (p<.001). Respondents’ perception of safety climate on moderate HMI installations did not differ significantly from that of respondents on low HMI installations (p=.315, ns.). N Mean Score SD Minimum
Score Maximum
Score Low HMI Installations 398 27.85 3.30 19 35 Moderate HMI Installations 380 28.20 3.47 19 35 High HMI Installations 527 29.03 3.21 19 35
Table 5.8 Safety Climate by HMI category HMI & Health Climate ‘Climate for Health’ was determined using a subset of 6-items from the health and safety climate scale. The lowest possible overall score is 6 while the highest possible score is 30 with high scores indicating a positive climate for health in that workplace. Table 5.9 below illustrates health climate scores according to employer health management category. Recall that a higher score on the health climate scale indicates a more positive perception of the health climate on that installation. Statistical analysis indicated that health climate differed significantly by HMI category (F(2, 1285) = 48.19 p<.001) with individuals on high HMI installations returning significantly higher scores than respondent on moderate HMI installations (p<.001) and low HMI installations (p<.001). Respondents’ perception of safety climate on moderate HMI installations was also significantly more positive than that of respondents on low HMI installations (p<.001.).
N Mean
Score SD Minimum
Score Maximum
Score Low HMI Installations 397 18.54 3.21 10 29 Moderate HMI Installations
375 19.37 3.24 10 28
High HMI Installations 514 20.62 3.22 10 29 Table 5.9 Health Climate by HMI category
77
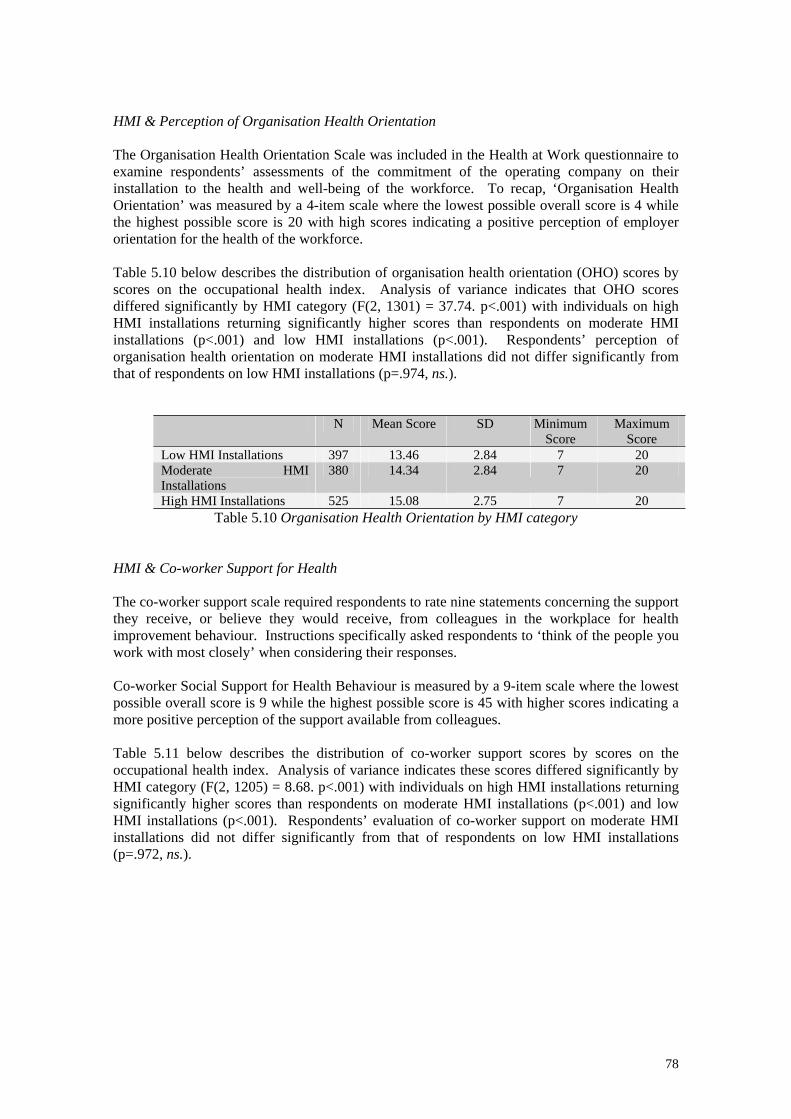
HMI & Perception of Organisation Health Orientation The Organisation Health Orientation Scale was included in the Health at Work questionnaire to examine respondents’ assessments of the commitment of the operating company on their installation to the health and well-being of the workforce. To recap, ‘Organisation Health Orientation’ was measured by a 4-item scale where the lowest possible overall score is 4 while the highest possible score is 20 with high scores indicating a positive perception of employer orientation for the health of the workforce. Table 5.10 below describes the distribution of organisation health orientation (OHO) scores by scores on the occupational health index. Analysis of variance indicates that OHO scores differed significantly by HMI category (F(2, 1301) = 37.74. p<.001) with individuals on high HMI installations returning significantly higher scores than respondents on moderate HMI installations (p<.001) and low HMI installations (p<.001). Respondents’ perception of organisation health orientation on moderate HMI installations did not differ significantly from that of respondents on low HMI installations (p=.974, ns.).
N Mean Score SD Minimum Score
Maximum Score
Low HMI Installations 397 13.46 2.84 7 20 Moderate HMI Installations
380 14.34 2.84 7 20
High HMI Installations 525 15.08 2.75 7 20 Table 5.10 Organisation Health Orientation by HMI category
HMI & Co-worker Support for Health The co-worker support scale required respondents to rate nine statements concerning the support they receive, or believe they would receive, from colleagues in the workplace for health improvement behaviour. Instructions specifically asked respondents to ‘think of the people you work with most closely’ when considering their responses. Co-worker Social Support for Health Behaviour is measured by a 9-item scale where the lowest possible overall score is 9 while the highest possible score is 45 with higher scores indicating a more positive perception of the support available from colleagues. Table 5.11 below describes the distribution of co-worker support scores by scores on the occupational health index. Analysis of variance indicates these scores differed significantly by HMI category (F(2, 1205) = 8.68. p<.001) with individuals on high HMI installations returning significantly higher scores than respondents on moderate HMI installations (p<.001) and low HMI installations (p<.001). Respondents’ evaluation of co-worker support on moderate HMI installations did not differ significantly from that of respondents on low HMI installations (p=.972, ns.).
78
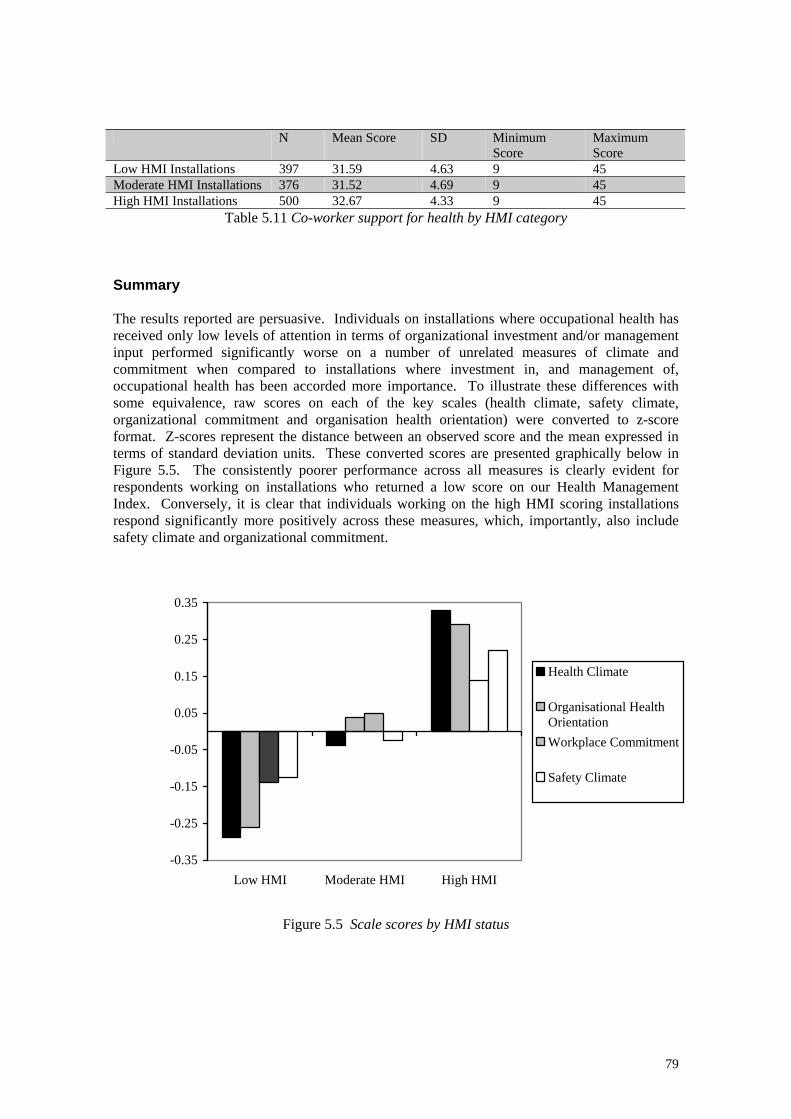
N Mean Score SD Minimum
Score Maximum Score
Low HMI Installations 397 31.59 4.63 9 45 Moderate HMI Installations 376 31.52 4.69 9 45 High HMI Installations 500 32.67 4.33 9 45
Table 5.11 Co-worker support for health by HMI category Summary The results reported are persuasive. Individuals on installations where occupational health has received only low levels of attention in terms of organizational investment and/or management input performed significantly worse on a number of unrelated measures of climate and commitment when compared to installations where investment in, and management of, occupational health has been accorded more importance. To illustrate these differences with some equivalence, raw scores on each of the key scales (health climate, safety climate, organizational commitment and organisation health orientation) were converted to z-score format. Z-scores represent the distance between an observed score and the mean expressed in terms of standard deviation units. These converted scores are presented graphically below in Figure 5.5. The consistently poorer performance across all measures is clearly evident for respondents working on installations who returned a low score on our Health Management Index. Conversely, it is clear that individuals working on the high HMI scoring installations respond significantly more positively across these measures, which, importantly, also include safety climate and organizational commitment.
-0.35
-0.25
-0.15
-0.05
0.05
0.15
0.25
0.35
Low HMI Moderate HMI High HMI
Health Climate
Organisational HealthOrientationWorkplace Commitment
Safety Climate
Figure 5.5 Scale scores by HMI status
79
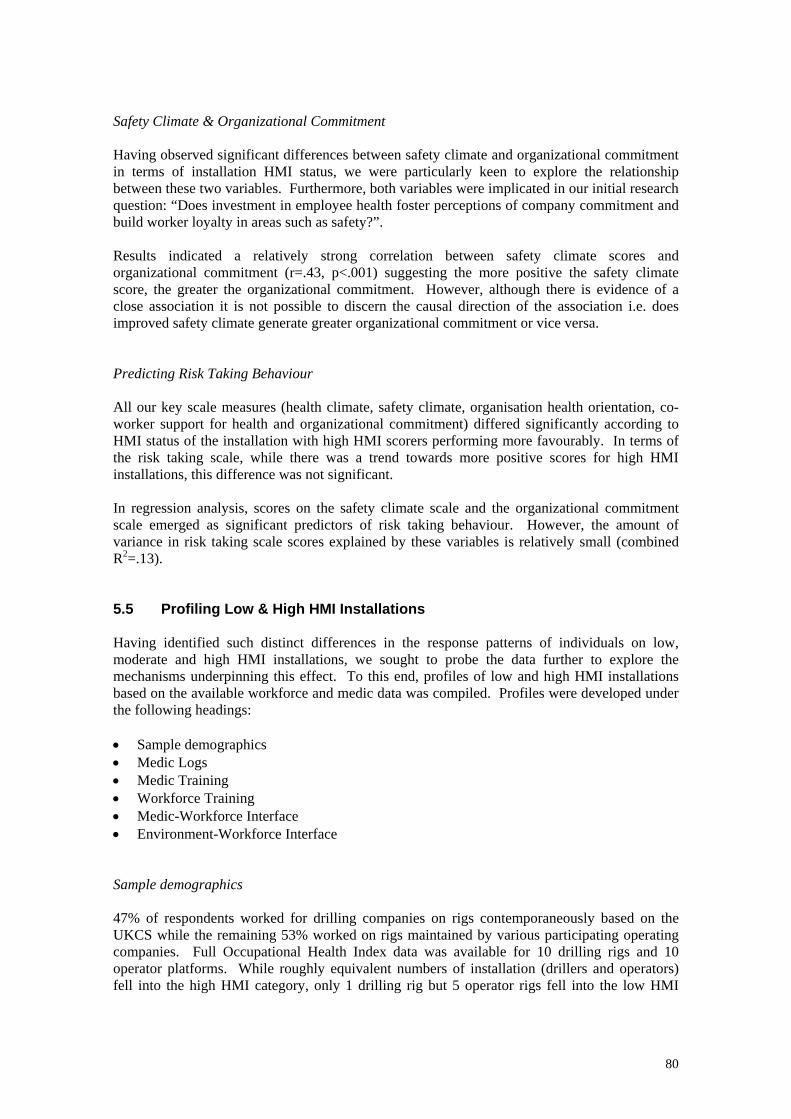
Safety Climate & Organizational Commitment Having observed significant differences between safety climate and organizational commitment in terms of installation HMI status, we were particularly keen to explore the relationship between these two variables. Furthermore, both variables were implicated in our initial research question: “Does investment in employee health foster perceptions of company commitment and build worker loyalty in areas such as safety?”. Results indicated a relatively strong correlation between safety climate scores and organizational commitment (r=.43, p<.001) suggesting the more positive the safety climate score, the greater the organizational commitment. However, although there is evidence of a close association it is not possible to discern the causal direction of the association i.e. does improved safety climate generate greater organizational commitment or vice versa. Predicting Risk Taking Behaviour All our key scale measures (health climate, safety climate, organisation health orientation, co-worker support for health and organizational commitment) differed significantly according to HMI status of the installation with high HMI scorers performing more favourably. In terms of the risk taking scale, while there was a trend towards more positive scores for high HMI installations, this difference was not significant. In regression analysis, scores on the safety climate scale and the organizational commitment scale emerged as significant predictors of risk taking behaviour. However, the amount of variance in risk taking scale scores explained by these variables is relatively small (combined R2=.13). 5.5 Profiling Low & High HMI Installations Having identified such distinct differences in the response patterns of individuals on low, moderate and high HMI installations, we sought to probe the data further to explore the mechanisms underpinning this effect. To this end, profiles of low and high HMI installations based on the available workforce and medic data was compiled. Profiles were developed under the following headings: • Sample demographics • Medic Logs • Medic Training • Workforce Training • Medic-Workforce Interface • Environment-Workforce Interface Sample demographics 47% of respondents worked for drilling companies on rigs contemporaneously based on the UKCS while the remaining 53% worked on rigs maintained by various participating operating companies. Full Occupational Health Index data was available for 10 drilling rigs and 10 operator platforms. While roughly equivalent numbers of installation (drillers and operators) fell into the high HMI category, only 1 drilling rig but 5 operator rigs fell into the low HMI
80
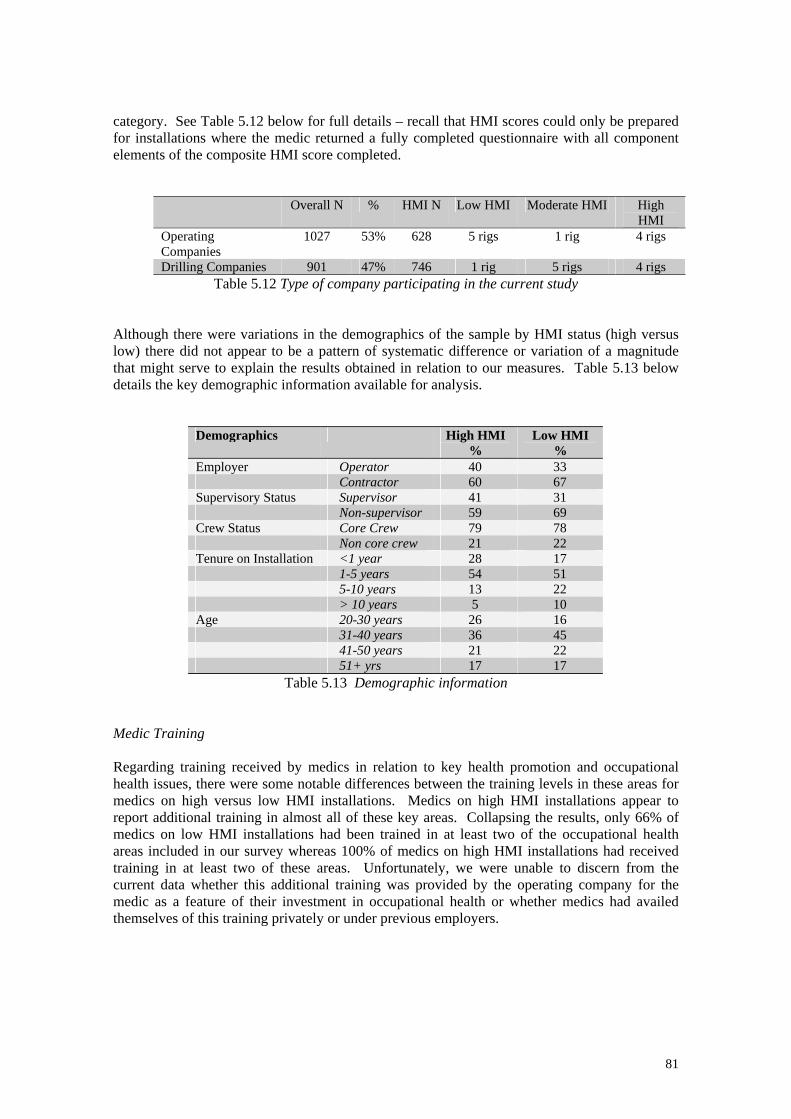
category. See Table 5.12 below for full details – recall that HMI scores could only be prepared for installations where the medic returned a fully completed questionnaire with all component elements of the composite HMI score completed.
Overall N % HMI N Low HMI Moderate HMI High HMI
Operating Companies
1027 53% 628 5 rigs 1 rig 4 rigs
Drilling Companies 901 47% 746 1 rig 5 rigs 4 rigs Table 5.12 Type of company participating in the current study
Although there were variations in the demographics of the sample by HMI status (high versus low) there did not appear to be a pattern of systematic difference or variation of a magnitude that might serve to explain the results obtained in relation to our measures. Table 5.13 below details the key demographic information available for analysis.
Demographics High HMI %
Low HMI %
Employer Operator 40 33 Contractor 60 67 Supervisory Status Supervisor 41 31 Non-supervisor 59 69 Crew Status Core Crew 79 78 Non core crew 21 22 Tenure on Installation <1 year 28 17 1-5 years 54 51 5-10 years 13 22 > 10 years 5 10 Age 20-30 years 26 16 31-40 years 36 45 41-50 years 21 22 51+ yrs 17 17
Table 5.13 Demographic information Medic Training Regarding training received by medics in relation to key health promotion and occupational health issues, there were some notable differences between the training levels in these areas for medics on high versus low HMI installations. Medics on high HMI installations appear to report additional training in almost all of these key areas. Collapsing the results, only 66% of medics on low HMI installations had been trained in at least two of the occupational health areas included in our survey whereas 100% of medics on high HMI installations had received training in at least two of these areas. Unfortunately, we were unable to discern from the current data whether this additional training was provided by the operating company for the medic as a feature of their investment in occupational health or whether medics had availed themselves of this training privately or under previous employers.
81
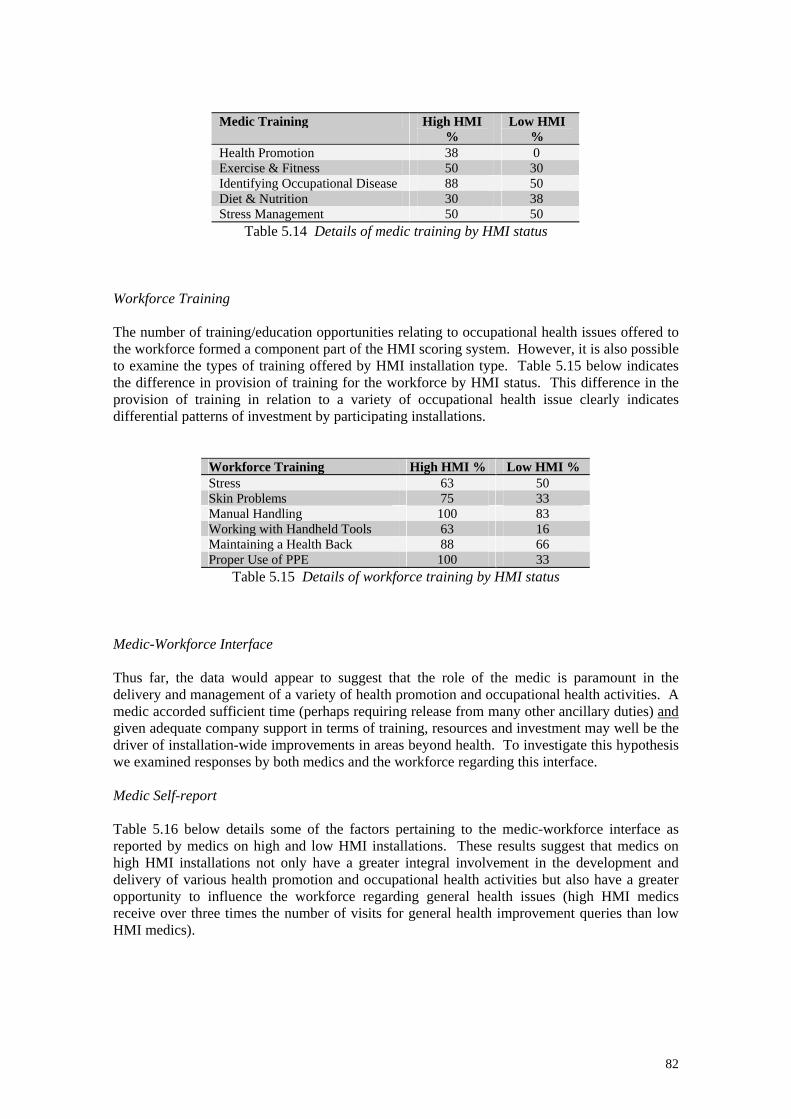
Medic Training High HMI %
Low HMI %
Health Promotion 38 0 Exercise & Fitness 50 30 Identifying Occupational Disease 88 50 Diet & Nutrition 30 38 Stress Management 50 50
Table 5.14 Details of medic training by HMI status Workforce Training The number of training/education opportunities relating to occupational health issues offered to the workforce formed a component part of the HMI scoring system. However, it is also possible to examine the types of training offered by HMI installation type. Table 5.15 below indicates the difference in provision of training for the workforce by HMI status. This difference in the provision of training in relation to a variety of occupational health issue clearly indicates differential patterns of investment by participating installations.
Workforce Training High HMI % Low HMI % Stress 63 50 Skin Problems 75 33 Manual Handling 100 83 Working with Handheld Tools 63 16 Maintaining a Health Back 88 66 Proper Use of PPE 100 33
Table 5.15 Details of workforce training by HMI status Medic-Workforce Interface Thus far, the data would appear to suggest that the role of the medic is paramount in the delivery and management of a variety of health promotion and occupational health activities. A medic accorded sufficient time (perhaps requiring release from many other ancillary duties) and given adequate company support in terms of training, resources and investment may well be the driver of installation-wide improvements in areas beyond health. To investigate this hypothesis we examined responses by both medics and the workforce regarding this interface. Medic Self-report Table 5.16 below details some of the factors pertaining to the medic-workforce interface as reported by medics on high and low HMI installations. These results suggest that medics on high HMI installations not only have a greater integral involvement in the development and delivery of various health promotion and occupational health activities but also have a greater opportunity to influence the workforce regarding general health issues (high HMI medics receive over three times the number of visits for general health improvement queries than low HMI medics).
82
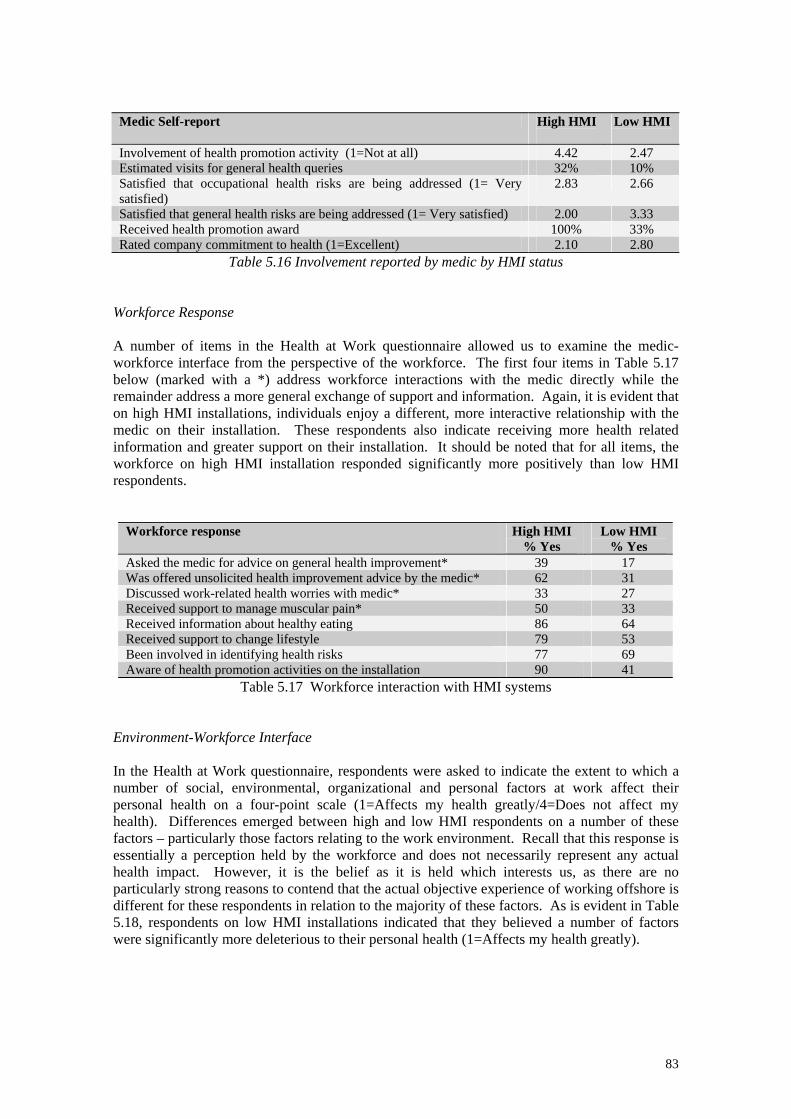
Medic Self-report High HMI
Low HMI
Involvement of health promotion activity (1=Not at all) 4.42 2.47 Estimated visits for general health queries 32% 10% Satisfied that occupational health risks are being addressed (1= Very satisfied)
2.83 2.66
Satisfied that general health risks are being addressed (1= Very satisfied) 2.00 3.33 Received health promotion award 100% 33% Rated company commitment to health (1=Excellent) 2.10 2.80
Table 5.16 Involvement reported by medic by HMI status
Workforce Response A number of items in the Health at Work questionnaire allowed us to examine the medic-workforce interface from the perspective of the workforce. The first four items in Table 5.17 below (marked with a *) address workforce interactions with the medic directly while the remainder address a more general exchange of support and information. Again, it is evident that on high HMI installations, individuals enjoy a different, more interactive relationship with the medic on their installation. These respondents also indicate receiving more health related information and greater support on their installation. It should be noted that for all items, the workforce on high HMI installation responded significantly more positively than low HMI respondents.
Workforce response High HMI % Yes
Low HMI % Yes
Asked the medic for advice on general health improvement* 39 17 Was offered unsolicited health improvement advice by the medic* 62 31 Discussed work-related health worries with medic* 33 27 Received support to manage muscular pain* 50 33 Received information about healthy eating 86 64 Received support to change lifestyle 79 53 Been involved in identifying health risks 77 69 Aware of health promotion activities on the installation 90 41
Table 5.17 Workforce interaction with HMI systems Environment-Workforce Interface In the Health at Work questionnaire, respondents were asked to indicate the extent to which a number of social, environmental, organizational and personal factors at work affect their personal health on a four-point scale (1=Affects my health greatly/4=Does not affect my health). Differences emerged between high and low HMI respondents on a number of these factors – particularly those factors relating to the work environment. Recall that this response is essentially a perception held by the workforce and does not necessarily represent any actual health impact. However, it is the belief as it is held which interests us, as there are no particularly strong reasons to contend that the actual objective experience of working offshore is different for these respondents in relation to the majority of these factors. As is evident in Table 5.18, respondents on low HMI installations indicated that they believed a number of factors were significantly more deleterious to their personal health (1=Affects my health greatly).
83
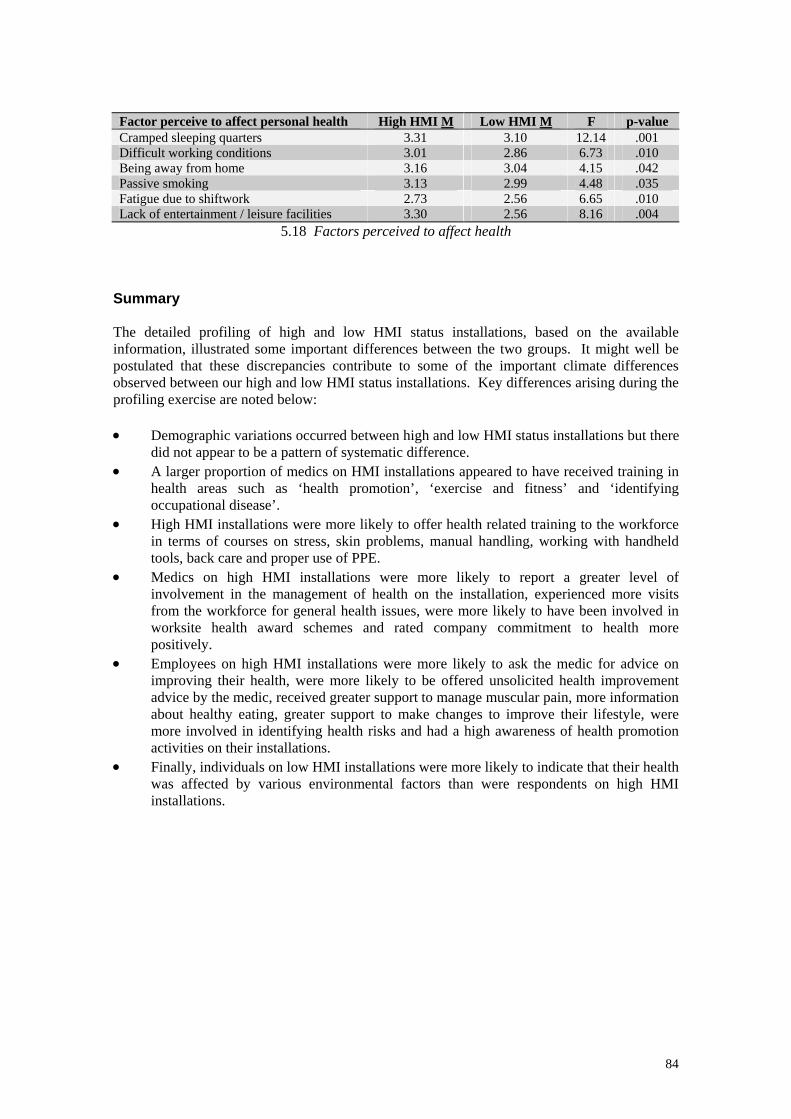
Factor perceive to affect personal health High HMI M Low HMI M F p-value Cramped sleeping quarters 3.31 3.10 12.14 .001 Difficult working conditions 3.01 2.86 6.73 .010 Being away from home 3.16 3.04 4.15 .042 Passive smoking 3.13 2.99 4.48 .035 Fatigue due to shiftwork 2.73 2.56 6.65 .010 Lack of entertainment / leisure facilities 3.30 2.56 8.16 .004
5.18 Factors perceived to affect health Summary The detailed profiling of high and low HMI status installations, based on the available information, illustrated some important differences between the two groups. It might well be postulated that these discrepancies contribute to some of the important climate differences observed between our high and low HMI status installations. Key differences arising during the profiling exercise are noted below: • Demographic variations occurred between high and low HMI status installations but there
did not appear to be a pattern of systematic difference. • A larger proportion of medics on HMI installations appeared to have received training in
health areas such as ‘health promotion’, ‘exercise and fitness’ and ‘identifying occupational disease’.
• High HMI installations were more likely to offer health related training to the workforce in terms of courses on stress, skin problems, manual handling, working with handheld tools, back care and proper use of PPE.
• Medics on high HMI installations were more likely to report a greater level of involvement in the management of health on the installation, experienced more visits from the workforce for general health issues, were more likely to have been involved in worksite health award schemes and rated company commitment to health more positively.
• Employees on high HMI installations were more likely to ask the medic for advice on improving their health, were more likely to be offered unsolicited health improvement advice by the medic, received greater support to manage muscular pain, more information about healthy eating, greater support to make changes to improve their lifestyle, were more involved in identifying health risks and had a high awareness of health promotion activities on their installations.
• Finally, individuals on low HMI installations were more likely to indicate that their health was affected by various environmental factors than were respondents on high HMI installations.
84
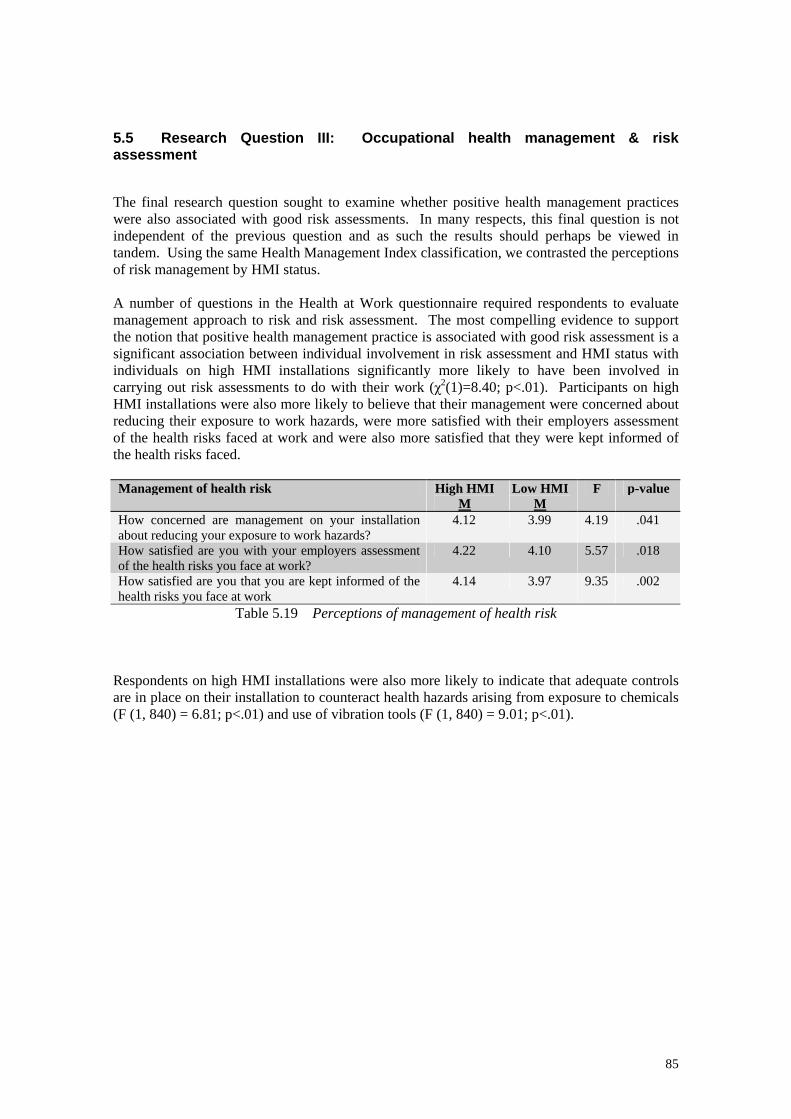
5.5 Research Question III: Occupational health management & risk assessment The final research question sought to examine whether positive health management practices were also associated with good risk assessments. In many respects, this final question is not independent of the previous question and as such the results should perhaps be viewed in tandem. Using the same Health Management Index classification, we contrasted the perceptions of risk management by HMI status. A number of questions in the Health at Work questionnaire required respondents to evaluate management approach to risk and risk assessment. The most compelling evidence to support the notion that positive health management practice is associated with good risk assessment is a significant association between individual involvement in risk assessment and HMI status with individuals on high HMI installations significantly more likely to have been involved in carrying out risk assessments to do with their work (χ2(1)=8.40; p<.01). Participants on high HMI installations were also more likely to believe that their management were concerned about reducing their exposure to work hazards, were more satisfied with their employers assessment of the health risks faced at work and were also more satisfied that they were kept informed of the health risks faced. Management of health risk High HMI
MLow HMI
MF p-value
How concerned are management on your installation about reducing your exposure to work hazards?
4.12 3.99 4.19 .041
How satisfied are you with your employers assessment of the health risks you face at work?
4.22 4.10 5.57 .018
How satisfied are you that you are kept informed of the health risks you face at work
4.14 3.97 9.35 .002
Table 5.19 Perceptions of management of health risk
Respondents on high HMI installations were also more likely to indicate that adequate controls are in place on their installation to counteract health hazards arising from exposure to chemicals (F (1, 840) = 6.81; p<.01) and use of vibration tools (F (1, 840) = 9.01; p<.01).
85
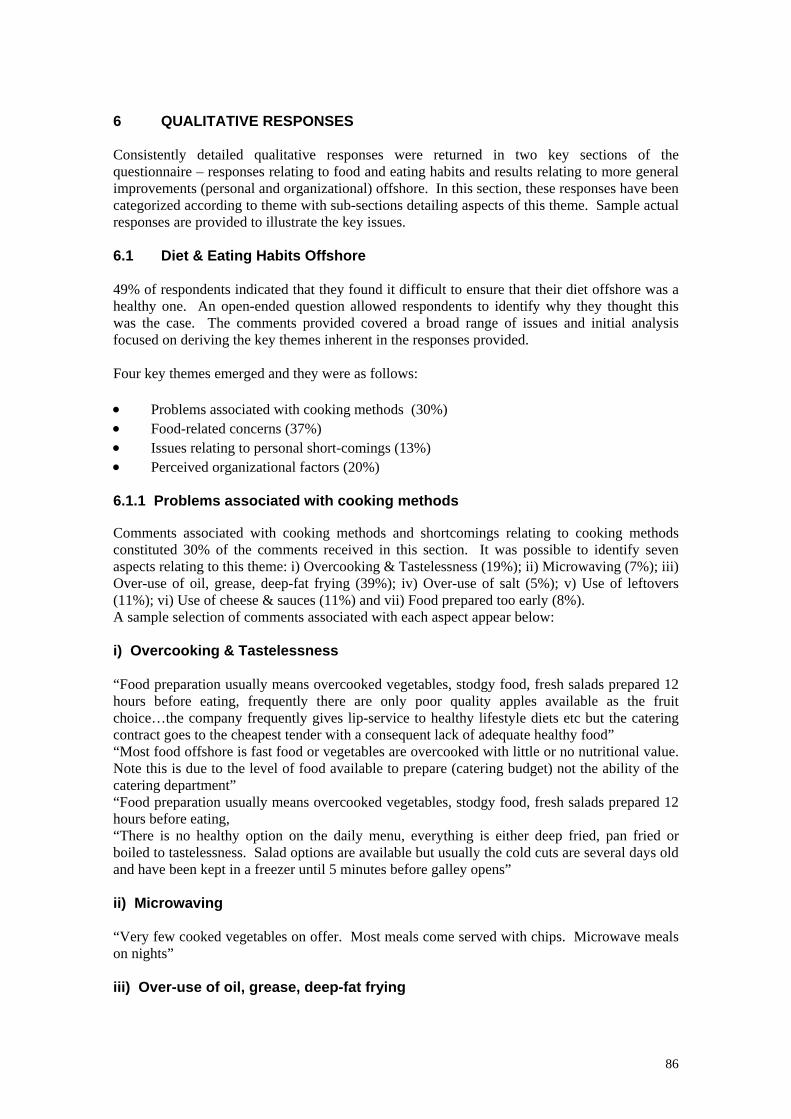
6 QUALITATIVE RESPONSES Consistently detailed qualitative responses were returned in two key sections of the questionnaire – responses relating to food and eating habits and results relating to more general improvements (personal and organizational) offshore. In this section, these responses have been categorized according to theme with sub-sections detailing aspects of this theme. Sample actual responses are provided to illustrate the key issues. 6.1 Diet & Eating Habits Offshore 49% of respondents indicated that they found it difficult to ensure that their diet offshore was a healthy one. An open-ended question allowed respondents to identify why they thought this was the case. The comments provided covered a broad range of issues and initial analysis focused on deriving the key themes inherent in the responses provided. Four key themes emerged and they were as follows: • Problems associated with cooking methods (30%) • Food-related concerns (37%) • Issues relating to personal short-comings (13%) • Perceived organizational factors (20%) 6.1.1 Problems associated with cooking methods Comments associated with cooking methods and shortcomings relating to cooking methods constituted 30% of the comments received in this section. It was possible to identify seven aspects relating to this theme: i) Overcooking & Tastelessness (19%); ii) Microwaving (7%); iii) Over-use of oil, grease, deep-fat frying (39%); iv) Over-use of salt (5%); v) Use of leftovers (11%); vi) Use of cheese & sauces (11%) and vii) Food prepared too early (8%). A sample selection of comments associated with each aspect appear below: i) Overcooking & Tastelessness “Food preparation usually means overcooked vegetables, stodgy food, fresh salads prepared 12 hours before eating, frequently there are only poor quality apples available as the fruit choice…the company frequently gives lip-service to healthy lifestyle diets etc but the catering contract goes to the cheapest tender with a consequent lack of adequate healthy food” “Most food offshore is fast food or vegetables are overcooked with little or no nutritional value. Note this is due to the level of food available to prepare (catering budget) not the ability of the catering department” “Food preparation usually means overcooked vegetables, stodgy food, fresh salads prepared 12 hours before eating, “There is no healthy option on the daily menu, everything is either deep fried, pan fried or boiled to tastelessness. Salad options are available but usually the cold cuts are several days old and have been kept in a freezer until 5 minutes before galley opens” ii) Microwaving “Very few cooked vegetables on offer. Most meals come served with chips. Microwave meals on nights” iii) Over-use of oil, grease, deep-fat frying
86
“Too much fried food, potatoes and veg prepared too early and boiled for too long” “Most meals are deep fried, poor quality food sent to the rigs, chefs don’t take the time to reduce the fat and grease content of your meal. “The chefs find it easier to deep fry things so we get more deep fried food. The midnight meal is the worst as in general all 3 choices on the menu are fried or deep fried, with chips and beans” “Most food is fried (nothing grilled), catering companies don’t really try to provide healthy options they just pay it lip service” “The galley has not got a grill to reduce the levels of fat. Apart from the salad bar, everything is either fried or covered in cheese” “Everything that is supposed to be healthy is covered in fat or oil so it lasts longer on the counter” “A lot of the food is cooked in fat or batter” iv) Over-use of salt “Most foods tend to have high salt content, also large amount of foods are deep fried” v) Use of leftovers “The food is of a very poor standard. Meals can sit for a long time before they are eaten. Too many meals are made from leftovers” “Never sure how many times the food has been reheated or leftovers made into another meal” “The food in general is poor, vegetables and meat can be reincarnated 3 or 4 times in different dishes. I know they have to keep cost down but food should be fresh at all times” vi) Use of cheese & sauces “The food is over cooked and recycled – not enough salad, everything is in a sauce to disguise it” “General menus do not cover healthy eating options, coating in sauce, mayo is considered healthy eating” vii) Advance preparation “Food is badly cooked and cooked up to 1.5 hours in advance of serving. Fresh, well cooked vegetables (i.e. not soggy mush) do not exist. Salads are dirty and old. Food is heavy on fat and red meat and far too salty”. 6.1.2 Food-related concerns Concerns about food quality and the provision of fresh food of a high standard constituted approximately 37% of comments. It was possible to classify these comments into five subcategories relating to i) lack of fresh fruit and vegetables (38%); ii) poor quality foods generally (21%); iii) poor quality meat (9%); iv) cheap meals (12%) and v) lack of healthy alternatives (20%). i) Lack of fresh food and vegetables “Poor choice of fruits and most of the time fruit is in poor condition” “Poor diet due to lack of fresh fruit and vegetables – a trip does not go by when we run out of simple fruit such as apples and there is limited salad…also quality of food is not good”
87
“Poor selection of fruit, should be enough for all and should be varied; only whole fat milk available; too much fried, greasy and fatty foods; no idea of origin of produce eg GM-free? BSE-free and certified?” “Better food, fresher vegetables and fruit. Pie, beans and chips twice a week because of a low budget is a disgrace” “Very limited choice of fresh vegetables and fruit, no grilled meat or fish” ii) Poor quality foods generally “Meat and chicken come from around the world where hygiene rules are not as stringent as ours” “Beef must be available on the cheap because they (caterers) use lots of it, and it isn’t good quality. A lot of salt is used still”. “Poor quality of meat (from Guatemala!), sometimes poor selection of raw and fresh vegetables, poor selection of vegetarian choices – macaroni cheese a standard!” iii) Poor quality meat “Most food is sourced from abroad and not to British standards” “Quality of food (raw materials) could be improved i.e. quality of fish, meat, vegetables not very good sometimes” “Poor quality food and a lack of varied meals – every week it’s the same thing and night shift food is usually daytime food reheated and stale” “Quality of the food is poor; mostly fried food, little fruit – any fruit is generally poor. Working night shift the food is awful!” iv) Cheap meals “Drilling contractors/operators too interested in costs for catering companies to provide healthy options – its always cheap which means fatty unhealthy food” “A lot of foods are just cheap and nasty and I feel they have no nutritional value whatsoever” “I have no idea where most of the food offshore is sourced but it is common knowledge that its bought on price not quality. There is far too much processed and pre-prepared food offshore” “Cheap food – catering company won bidding with cheapest price” v) Lack of healthy alternatives “Healthy eating choices extremely limited especially for shift workers. Choice and quality of fruit and veg poor. Too much fried food”. “Not enough healthy options available i.e. no healthy options available at morning and afternoon tea breaks” “Lack of healthy options for main course. Poor salad table i.e. salads covered in mayo” “There is not enough healthy foods – what they call healthy isn’t really – mainly it’s the healthy option which doesn’t mean healthy” “Healthy option is not always tasty. Food in salad bar not always appealing” “Not very healthy food available, half the food shown on ‘healthy food’ posters is not available plus all the options for food seem to get “healthy option” label when they are clearly not” “Most food is fried (nothing grilled), catering companies don’t really try to provide healthy options they just pay it lip service” “Lack of healthy hot meal options, junk food put out for tea breaks instead of fruit”. “The menu offshore very rarely contains dishes that I would describe as healthy – for example ‘macaroni cheese’ is described as a healthy option” “Availability of healthy options – very rarely any fresh veg available”
88

6.1.3 Personal Failing 13% of comments made some references to personal failings relating to food choices and intake. These comments could be split into three categories: i) Over-eating due to stress or boredom (15%); ii) Lack of discipline/temptation (80%) and iii) Consuming large portions (5%). i) Stress & Boredom “Stress – look forward to food” “Eating due to boredom” “Eating is highlight of the day” “You feel tired so try eating more or binge on sweets to keep your energy levels up” ii) Lack of self-discipline/temptation “Too much of the wrong food is so tempting and readily available – I love all the wrong type of food” “Meal times are one of few relaxing activities – I tend to go for comfort food” “Lack of will power to resist food I like” “Too many ‘bad things’ easily available” “Too many opportunities to snack on unhealthy foods” “Its too tempting to eat unhealthy foods!” “Because I like chips, chocolate, chocolate sponge and cheese – it takes a lot of will power to say No!” “The food is too good and it is too easy to overeat and indulge in too much of the wrong types of food. Utter lack of willpower” “Unhealthy food tastes better!” iii) Large portions “Too much food and generous portions!” “Catering staff are very heavy handed when serving i.e. big portions!” 6.1.4. Organizational Factors 20% of comments related to issues concerning catering provision and organizational structures in place for meal times and the provision of food and information relating to food and healthy eating. These comments fell into the following five categories: i) repetitive menus; ii) galley opening times/times available for eating; iii) caterers lack of knowledge & training related to healthy eating; iv) low budgets; v) information available about healthy eating. i) Repetitive menus “The selection and quality of food is very poor and repetitive” “Not enough variety, same salad stuff all trip” “Poor quality food and a lack of varied meals – every week it’s the same thing and night shift food is usually daytime food reheated and stale” ii) Galley Opening Times/Time available for meals “Quality of the food is poor; mostly fried food, little fruit – any fruit is generally poor. Working night shift the food is awful!”
89

“Poor opening times to galley, microwave meals”. “We do not get a good selection of food especially on nightshift. If they cannot fry it or get it from a tin – you end up with cereals”. “Working nightshift there are never proper meals in the morning – only cooked breakfast is available” “Sometimes when you have only 30 minutes to get in and eat and get back out again, you haven’t the time to properly digest food” “Meals on nightshift poor – very little effort made to cook fresh food” “The shifts we work are not consistent with the meals” iii) Caterers Lack of training/knowledge of healthy options “Not very healthy food available, half the food shown on ‘healthy food’ posters is not available plus all the options for food seem to get “healthy option” label when they are clearly not” “Health food choices – there is usually at least one option marked “healthy choice” on the menu but sometimes I don’t think it is as healthy as the chef perceives e.g. some high fat meals are termed healthy just because they have no meat” “The menu offshore very rarely contains dishes that I would describe as healthy – for example ‘macaroni cheese’ is described as a healthy option” “Need a greater choice of really healthy food – I think the catering company personnel lack the required knowledge e.g. sometimes the ‘healthy option’ is spag bol with fatty meat!” iv) Low budgets “When asked about healthy food and associated programmes etc we were told it costs more to feed us healthily and the operator would not pay for it” “Low budgets for catering have led to poorer quality food and quick cooking” “The victuals on this rig are the cheapest available and lack nutrition compared to the quality of food given to those on platforms where the budget is higher” “The budget for each person is very low per week so the quality of the food – not the cooking – is pretty bland” v) Information about healthy eating “Although a healthy option is generally available at mealtimes I feel more could be done to provide an ‘overall’ healthier selection of foodstuffs” “Poor choice at mealtimes - also lack of info on food offered” “Putting up posters in the mess-room about healthy eating is not enough – they need to serve it!” “No indication on menu of healthy choice” “Do not know what is used specifically in food preparation” “Don’t know if salad dressings etc are low fat or not” Summary The key areas identified in relation to “Diet and Eating Habits Offshore” are summarised in Table 6.1 below, along with associated basic organizational issues. It was clear that many respondents find it difficult to maintain a healthy dietary intake while working offshore for a number of reasons implicating both personal and organizational factors. Given the BMI profile of the offshore population identified in this and other studies, the availability of a healthy, low-fat balanced diet must be paramount to the maintenance of good health for the offshore worker. Responses in the current study indicate quite clearly that the
90

option of a healthy, appetising meal may not always be available. To this end it would appear from the comments received that catering contractors need to address training and awareness issues among their staff as to appropriate menus, cooking methods and preparation of actually healthy and tasty food while organisations may need to assess the budgets they require catering companies to work with in order to demonstrate commitment to the health of the offshore workforce. General Issues Main Response Categories Organizational Issues
Overcooking & tastelessness Microwaving Over-use of oil, grease, deep-fat frying Over-use of salt Use of left overs Use of cheese & sauces
Cooking methods
Advance preparation
• Caterer knowledge of healthy (or healthier alternative) methods of food preparation and cooking (additional training may be necessary)
• Equipment (e.g. grills) and time available to facilitate preparation of healthy meals
Lack of fresh fruit and vegetables Poor quality foods generally Poor quality meats Cheap meals
Food-related concerns
Lack of healthy alternatives
• Are budgets adequate to actually provide good quality healthy food choices?
• Are systems in place to monitor where food is sourced from?
Stress & boredom Lack of self-discipline/temptation
Personal failings
Large portions
• Recreational period facilities & activities
• Health promotion: Setting of individual goals/targets
Repetitive menus Galley hours/time available for meals Caterers lack of training/knowledge of healthy options Low budgets
Organizational factors
Information about healthy eating
• Caterer training & innovation • Budgetary Issues • Practical advice in relation to
healthy eating
Table 6.1. Issues identified by respondents relating to eating habits offshore
91
6.2 Improving personal health offshore 52% of respondents provided comments or suggestions in relation to managing and improving personal health offshore. The questionnaire afforded respondents this opportunity by means of an open-ended question (“In your opinion what could be done to improve your personal health on this installation?” and free response space. Four key themes emerged within these comments and they were as follows: • Personal health issues (34%) • Occupational health issues (16%) • Installation facilities (20%) • Organizational factors (30%) 6.2.1 Personal health issues Comments relating to personal health issues constituted 34% of the comments received in this section. Typically these comments indicated activities or initiatives respondents would welcome on-board their installations. It was possible to identify six aspects relating to this general theme including i) Smoking cessation (17%); ii) Personal Diet & Fitness programs (26%); iii) General health checks (10%); iv) Health Promotion Visits & Company Initiatives (33%); v) Personal behaviour (7%); vi) Sleep disturbance offshore (7%). i) Smoking cessation “Help and advice on Stopping Smoking” “Some rigs give press nicotine patches, tablets etc but not on here – the lads would be grateful for help in stopping smoking” “The Bond used to supply nicotine gum but not anymore” “The sale of cheap cigarettes encourages people to buy and smoke more” “I am very concerned about people smoking in all area: most of the installation smells of smoke…more room for non-smokers” ii) Tailored diet & fitness programmes “Exercise/diet plans tailored for individual needs” “Everything is aimed at fatties dieting, more trust needed for personal questions/talks” “Diet instructions, information on the correct exercise to be taken” “More flexible approach to working hours, meal times etc for people who would like to take up a program of exercise. More professional support with regards personal health, exercise and diet”. “Lifestyle fitness program – a woman from lifestyle came to the rig and went through a health check with me and gave me a program to work on- I fully enjoyed it and it prompted me to go to the gym but 12 months on am back to my own ways – could do with this push again” “An organised fitness plan, complete with suggested diet, have a calorie count on foods on the menu so crews can control their diet better” “More medical help available to lose weight, not enough support for losing weight” “We have a medic on board which covers minor health and injuries but has he got the training or experience to advise on fitness training or dietary needs? These are areas that need professionals to pass on good advice” “More information/weight loss classes. Special section in galley for healthy options” “More planned diets should be available and food should be available in weighed proportions”
92
iii) General health checks “Blood cholesterol test kits. General advice on health and voluntary health checks” “Health checks – active support from medic/company to improve health standards” “Medical consultation before going on a diet and health advice to help in weight loss” “The OPITO Guidelines on yearly medicals for over 50 year olds should be amended so that more account is taken of general health, ECG scan etc rather than drug testing with no history of users. Copies of thorough medicals (hearing/eyes/blood pressure etc) should be automatically transmitted to patients GP on regular basis rather then locked away in company files. Body mass index should be modified to reflect gains/losses over time rather than abstract relationship with average graph” “Regular check ups, conversation on health issues, improve catering, gym facilities, have a full medical examination and find out how lifestyle may be improved”. iv) Health promotions visits & initiatives “Initiatives concentrating on health and provision of resources should be supported in the same way as existing safety and environment issues (regulated by enforcing authorities). Equal times i.e. 2 weeks on/off to include travelling home/back to work and often delays due to weather etc. This reduces the actual time off so that workers are away from home for longer than they are at home. Some stress and difficulties are perceived by this over a long period. There is also an aging workforce and coping with long hours so often becomes more demanding. A realistic approach to health would be 2 on 3 off rota with health advice and initiatives whilst offshore”. “A fitness/diet instructor should be sent to the rig regularly to advise personnel and also to advise the catering crew about where they are going wrong” “Improve the food and get a fitness instructor or dietician out to the rig. The medic does his best but is not the best person for the job” “More health checks, programs – things like rig or crew programs to get people motivated in a common goal (i.e. health award schemes)” “Better written training exercise program, offshore medic to have a more proactive approach to physical exercise programs. Also would like to see the company promote health onshore in the form of gym membership for employees at local gyms or hotels with health studios – other companies do this”. “Charity fund raising for a good cause like the cycling campaign where companies donate money to participants’ good cause based on mileage” “Info on alcohol and internal damage to liver, kidneys etc” “Actively encourage exercise and healthy eating. Try to alleviate effects of shift working” v) Personal behaviour “I need to motivate myself after work – shift changes sap my will. Safety is certainly getting there, health has a long way to go” “I feel there is support – I only need the will power to commit fully” vi) Disturbed sleep “Lack of sleep due to noise levels” “Need anything to help get better quality sleep” “Health is affected when sharing with a snoring person causing sleep deprivation over long periods” “Sharing with a smoker whose clothes stink of tobacco making the room into a smoking shack prevents sleep”
93
6.2.2 Occupational Health 16% of comments related to occupational health issues and in particular the following six areas: i) Manual handling concerns (5%); ii) Risk assessment concerns (14%); iii) Stress (38%); iv) Exposure to fumes, chemicals, muds etc (10%); v) Concerns about PPE (17%); vi) Fatigue resulting from shiftwork (16%). i) Manual handling concerns “The lifting and carrying of materials is not controlled very well” “Manual handling hazards are not properly mitigated – especially if cost implications exist” ii) Risk assessment concerns “Lack of cleaning on deck, especially around chemical skids and production areas used by production operators. Storage of chemicals (skids) above our heads i.e. Pipe Deck and Turbine roof. The lack of appreciation of the danger of these chemicals by people who use them” iii) Stress “Information on how to reduce stress” “Could go with more stress busting activities” “Stress on some personnel due to our working reduced manpower to extremes” “Reduce stress levels, company expects more and more – just doing your job isn’t enough anymore” “There is a lot of stress offshore caused by poor work/home balance – this could be reduced greatly by changing to a 2 week on then 3 week off rota”. “People under ‘job threat’, which seems always to be a major factor, are also under stress resulting in health problems” “Stress – management need to recognize stress in the workforce and working time directive procedures to be implemented” iv) Exposure to fumes, chemicals, muds etc “Do the fumes from the well with all the chemicals that are added to drilling muds cause any kind of cancers when exposed to these fumes i.e. in pit room?” “Occasional diesel fumes getting into air intakes when wind is from a certain direction. Makes my eyes water and sting, have no idea what it is doing to my lungs” “Skin problems arising from clothes saturated in oil based muds and mineral oils”. “Dust. All chemicals, oils, paint, rust, asbestos will form dust which settles until disturbed…many jobs done by personnel may lift the surrounding dust exposing the person to contamination via inhalation (unbeknown to the person)” “Concerned about possible future effects of exposure to rockwool type insulation – remember, asbestos used to be ‘safe’”. v) Concerns about PPE “Work gloves not very good. Average hand size is Size 8. We get Size 10 90% of the time (“one size fits all”). Outer material is often slippery and not flexible. We have raised this issue numerous times with no effect. What we require and what we get are two different things” “Anti-fogging sprays are absolutely useless – how do you design goggles with demisting vents that will also stop any particles getting past the goggles?” “Lack of anti-vibration gloves available”
94
“Lack of hearing protection i.e. in shakers. Ear plugs – how long are they rated for working in a noisy area” “Working regularly in a noisy area concerns me, is it doing any long term damage to my hearing?” “Skin problems arising from clothes saturated in oil based muds and mineral oils. Lack of hearing protection i.e. in shakers. Ear plugs – how long are they rated for working in a noisy area” “As part of my standard PPE, I have to wear glasses at all times. When working in the rain, it becomes impossible to see and clean. They scratch easily and although its not proven I am sure that my sight deterioration is due to wearing them. I cannot remember ever getting an object in my eye during my working life until I started wearing glasses – the dust seems to be able to get past easily. Furthermore, the legs of the glasses reduce the seal on my ear defenders and I work in a high noise area” “Most PPE is available but requires knowledge and confidence to wear correctly. It’s ensuring that correct PPE for differing chemicals is used in sequence that is the problem. It is more a people/perception problem than actual equipment” “Before we wore specs all the time, the permit used to tell you what eye protection was needed for a particular job. I’ve since seen people use chemicals with just safety specs rather than full face protection thinking that’s alright” vi) Fatigue due to shift work “Shift work and shift patterns leave you extremely fatigued” “Not enough sleep/disturbed sleep” “Discontinue the mid week roll over from nights to days and work a straight 2 week days one trip and 2 weeks nights next trip. The sleep disruption on roll over lasts at least 4 days, often more. Working the decks, unloading boats etc requires full alertness, these duties were normally done by dedicated deck crews working constant days and are now done by shift workers – this practice is unsafe and should stop”. “We do far too much time offshore to be in good condition (mind and body)…I’m coming to the end of my trip and I’m very tired. I’ve lost lots of sleep due to shiftwork…there is still pressure to get things done fast on drilling rigs thereby causing stress and probably accidents” 6.2.3 Installation Facilities 20% of comments pertained to installation facilities, specifically the general upkeep and maintenance of these facilities and their impact on health. Five key categories of comments could be identified including i) water quality (9%); ii) cleanliness (6%); iii) ventilation/HVAC (17%); iv) Better gym/equipment (29%) and v) Living facilities/accommodation (39%). i) Water quality “Eczema /skin irritation /dry and cracked skin due to the water used for washing” “Very poor quality drinking water due to pipework corroding” ii) Cleanliness “Slack cleanliness around the work environment: floors not washed enough to get rid of oil mud carried on soles” iii) Ventilation/HVAC
95
“Platform HVAC – every time I come to the platform I have a sore/splitting headache for the first three days” “A better HVAC system – air supplied to cabins is contaminated. Always getting sore throats and nose infections”. iv) Better gym/equipment “Better facilities, tv’s provided in cabins, telephones in cabins and money provided to spend on what crew decided” “More gym facilities or larger premises – three people are lucky to fit in the gym at present. More personal health issues promoted at work” “A better equipped gym and better size gym. I feel that most people on this rig do not care about fitness – money is wasted on computers and games” “Obtain better mattresses to get a better sleep without feeling every spring” v) Living Facilities/Accommodation “Better temperature control of the accommodation during the extremes of weather and potable water temperature control for cooler showers during hot summers” “Improve living conditions, the conditions out here are appalling, the water out of the taps is brown” “I am willing to try to improve this installation if I could see an improvement on critical maintenance, improved living standards and fabric maintenance” “Better accommodation – sleeping/showering facilities. Water without brown rust. Heating and ventilation that works” 6.2.4. Organizational Factors 30% of comments were classified as pertaining to broader organizational factors. Sub-themes in this category included comments relating to i) working hours/rotation patterns (29%); ii) manning levels (4%); iii) lack of organizational integrity for H&S (26%); iv) Provision of healthy, high quality food (12%); v) lack of management support/commitment to employee health and vi) time for exercise after shift (7%). A number of respondent commented positively regarding the support for health on their installations. For example: “I think this installation, on balance, is very good”; “I’ve worked offshore for 20 years and find the management on here the best I have worked for (no kidding)” “The facilities are there to use but most people are not very health conscious – I am health conscious and am glad of the facilities which are good on this platform” “This is the best installation I have worked on regarding health and safety” i) Working hours/rotation “There is plenty of literature but it must be self motivated to do anything – all personnel seem too busy working long hours to think about anything else” “Resolve the issue regarding the working time directive and give the workforce 2 weeks on 3 weeks off rota – this could also reduce stress in the workplace” “Third party contractors…have health and welfare issues that are important such as working irregular hours, shifts, different installations, not part of the team, very irregular home life (not routine home periods) – these affect people’s health and well-being”
96
“The operating company could monitor more closely the amount of time (days) individuals do on the installation – too many people (contractors) do too many days per month. For too many years service companies have been abusing their workforce by the amount of days the offshore personnel are doing (i.e. 2-3- week offshore followed by 2-3 days shore leave)” “British offshore working hours to be brought in line with the Norwegians i.e. 2 on 3 off would help a lot of mental, physical and stress problems” “If the management was really concerned about our health and safety we would all be working the same shift patterns – by having the majority of employees on 2+3 they are discriminating against 2+2 employees and affecting our health” ii) Manning levels “Poor planning and reduced manning levels means that risk assessments are often rushed. The COSHH database is very poor and a reliance is still put on HSD sheets got from various sources such as the web” “There is far too much reduction in man power on this platform leading to more work and stress for the workforce that is left” “Manning levels are too low. More and more work is being placed on the workforce and short cuts are taken. Planned maintenance is cut short, more breakdowns, more pressure to get it fixed!” iii) Lack of organizational integrity for health and safety “Safety seems to revolve around masses of paperwork, forms and signatures – very little has changed at the worksite” “I have often been witness to work being carried out with the full knowledge of platform management that is deemed to be unsafe but because it is ‘too’ expensive to do the job in a safe manner or too time consuming it is carried out regardless” “Middle management are happy to ignore (health and safety) and expect me to ignore company policy” “People are still afraid of upper management telling them they are not fit enough to do their job - thus not referring everything to the medic”. “I believe that if I could do my job without taking shortcuts i.e. climbing, stretching etc I would but like all offshore installations, the construction of equipment makes it very hard to do this and most times scaffolding will not help because of the location of the equipment. I think safety has improved – most big jobs are well managed but for the small jobs e.g. fire and gas maintenance it is still expected to climb and hold on while testing and hope nothing happens” “Even minor accidents are viewed very dimly and are regarded as a ‘black mark’ against the employee – I would be reluctant to report a minor incident because of this” “Theoretical drill procedures and actual drill procedures often differ – emergency exits are not opened during drills, grab bags are not brought…there seems to be complacency brought about by performing the same drill at the same time in the same way every week. People are not warned if they perform badly…drills should be taken more seriously”. “It is a widely held opinion that the operating company concentrate on the easy/small things instead of the larger costlier items (e.g. plant maintenance – simple things like painting pipework containing oil and gas). We have also moved away from a no-blame culture which encourages people to report incidents/accidents to a culture in which people are reluctant to report minor incidents/accidents and not go to the medic for treatment for cuts, bruises etc…the company say this is not what they want but the present management policy has got us to this”. iv) Provision of healthy, high quality food “Current promotional activity is a half hearted attempt at improving the menu”
97
“More healthy options on the menu – main concern is with poor cooking habits – too much fat/deep frying” “Better variety of food and the way it is prepared…properly cooked and not reheated yesterday’s menu” “Correct the problem of poor meals whilst working night shift” “I would like to have someone show a balanced meal on a plate and see how it differs from my usual portions” v) Lack of management support/commitment to health “You are not encouraged to use the gym facilities by offshore management because they are worried that if you get an injury they would lose their LTA/RDC which it seems is more important to them – so a little support on that side would help” “No support for stopping smoking although smoking policy – no management incentive or support” “Safety is strongly emphasized on this rig but people’s health is not taken seriously by a lot of people here – management included”. “Information is not enough – there needs to be a complete stepchange in the health culture of working offshore – better overall environment, less noise, less hours worked at rigsite, food selection, better sleeping quarters” “More assistance from management and not just using it (health) as a paper exercise” “I would like to see the company I work for being sincerely concerned about my health instead of concentrating only on work and business. They do not see the “well being” (mind or body) as part of something that is important to business” “Management care about doing the job safely – there is no sign that they are interested in your health….the medicals you are asked to attend are just a paper exercise” “No active encouragement towards good health and exercise by the company. There is no direct monetary gain seen by the company spending money on such issues” vi) Time for exercise after shift “After 12 hour shift, too late at night after meal to exercise – time should be available during the day, like it is to management…if exercise is done late at night it is difficult to sleep after”. “Time should be allocated at more suitable periods during the day for exercise for those who wish to do so. “(Health Promotion) activities would have to take place after shift end (1900). We only have 20 mins to eat up! Any activities requiring moderate exercise would need a few hours period of digestion” “Better gym facilities, more time to go to gym, better access to food (galley shut after exercise – you cannot exercise after eating” “Allow people to use gym during slack periods at work” Summary Two final open-ended questions in the Health at Work Survey asked respondents to identify what might be done to improve their personal health on their installation and note any other comments regarding the management of health and safety on the installation. The key areas identified in returned responses are summarised in Table 6.2 below. Responses addressed many areas for improvement, however, there appeared to be some consistency across a number of installations in our sample in terms of the organizational issues identified, particularly in relation to occupational health issues and a perceived lack of management support or commitment to workforce health issues.
98
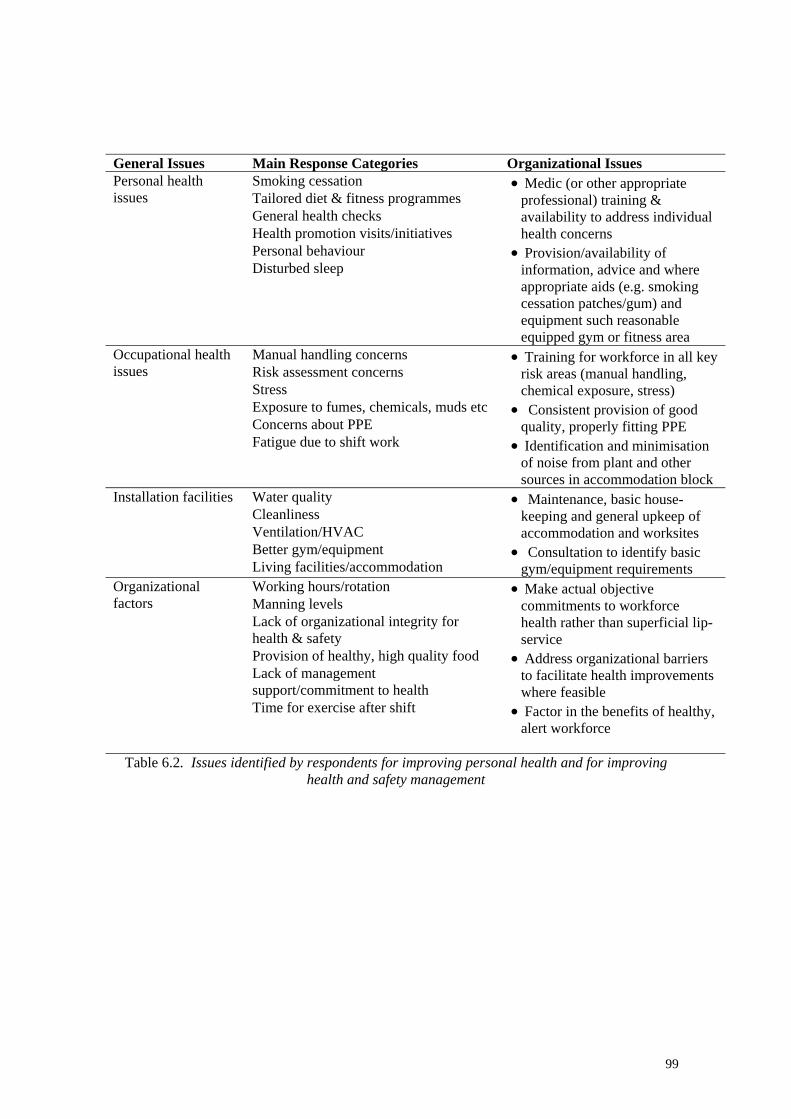
General Issues Main Response Categories Organizational Issues
Smoking cessation Tailored diet & fitness programmes General health checks Health promotion visits/initiatives Personal behaviour Disturbed sleep
Personal health issues
• Medic (or other appropriate professional) training & availability to address individual health concerns
• Provision/availability of information, advice and where appropriate aids (e.g. smoking cessation patches/gum) and equipment such reasonable equipped gym or fitness area
Manual handling concerns Risk assessment concerns Stress Exposure to fumes, chemicals, muds etc Concerns about PPE
Occupational health issues
Fatigue due to shift work
• Training for workforce in all key risk areas (manual handling, chemical exposure, stress)
• Consistent provision of good quality, properly fitting PPE
• Identification and minimisation of noise from plant and other sources in accommodation block
Water quality Cleanliness Ventilation/HVAC Better gym/equipment
Installation facilities
Living facilities/accommodation
• Maintenance, basic house-keeping and general upkeep of accommodation and worksites
• Consultation to identify basic gym/equipment requirements
Working hours/rotation Manning levels Lack of organizational integrity for health & safety Provision of healthy, high quality food Lack of management support/commitment to health
Organizational factors
Time for exercise after shift
• Make actual objective commitments to workforce health rather than superficial lip-service
• Address organizational barriers to facilitate health improvements where feasible
• Factor in the benefits of healthy, alert workforce
Table 6.2. Issues identified by respondents for improving personal health and for improving
health and safety management
99
7 OVERALL SUMMARY & GENERAL DISCUSSION The original objective of this research was to examine health promotion and health surveillance activities offshore in greater detail and examine potential relationships between health management and the overall safety and well-being of the offshore worker. We sought to document workforce perceptions in relation to personal health, occupational health, health climate, safety climate and the perceived concern of employers regarding the management of workforce health. The aim of this general discussion is to first of all summarise the main findings of the survey in relation to our overall objectives and then synthesize these findings in relation to the existing literature pertaining to worksite health promotion and surveillance and implications of the current findings. In line with the stated aims, the key results are summarised under the following headings i) Personal Health Management Offshore ii) Workplace Health Management Offshore iii) Investing in Workplace Health Offshore. 7.1 Personal Health Management Offshore While a number of studies have sought to document the actual physical health of the offshore population, few, if any, studies have undertaken to document the perceptions of the offshore workforce in relation to personal health concerns. We were also keen to document which factors the workforce perceived as affecting their health and well-being in a bid to understand the concerns the workforce may hold in relation to their health – concerns which may or may not match with those identified by occupational health specialists. The majority of our sample reported positively regarding their health. Respondents identified fatigue due to shift work and stress about work as the factors most affecting their health in the offshore environment. Over half of the respondents indicated that they feel under stress or pressure a few times during each trip but the majority also indicated that they cope well with the stress they experience. However, as documented previously, there was a profile of increasing weight with age with the majority (52%) of the sample categorised as ‘overweight’ according to standard BMI measurements. This would appear to be a slightly higher proportion than documented in the 1998 Scottish Health Survey (SHS) where approximately 43% of adult male respondents fell into the overweight category. However there would also appear to be a discrepancy between the 12% of respondents returning an ‘obese’ classification on the BMI measure in the current study and the 18% observed in the SHS (although this may be due to the various medical selection processes before personnel are allowed to work offshore). As in the general population the causes underlying this overweight profile is likely manifold. Within this study survey we explored patterns of physical activity and dietary consumptions and problems in these areas associated with the offshore lifestyle. In terms of physical activity only 50% of respondents indicated that they engaged in light to moderate physical exercise offshore, suggesting a relatively sedentary lifestyle while offshore for a considerable proportion of respondents. Echoing the perception of fatigue as the factor most likely to affect health, the most common reason for non-participation in exercise was being too tired after work. However, significant proportions of respondents also identified organizational level impediments regarding physical activity whilst working offshore. These impediments ranged from poor installation gym facilities to difficulties scheduling a gym session to co-ordinate with shifts and galley opening hours. Numerous comments suggested
100
that the workforce would be receptive to advice or information tailored to their needs and the available facilities. In terms of dietary consumption, 49% of respondents indicated that they found it difficult to eat a healthy diet offshore and provided extensive comments as to why this was the case. The key areas of concern identified related to the types of unhealthy food provided and associated cooking methods typically involving frying and the use of oil. These shortcomings were thought to reflect the low budgets available to contractors for food provision and preparation and the lack of appropriate training and knowledge regarding the preparation of tasty healthy meal options among caterers. However, respondents also identified a lack of self-discipline in terms of the dietary choices they make. On the whole, respondents appeared keen to take action to help them lose weight but felt they needed additional help and support on their installations to achieve this. Approximately one third of respondents smoked, replicating the proportion of observed smokers within the same (onshore) geographical region (Shaw, McMunn & Field, 2000). A significant proportion of these smokers felt that ‘heavy smoking when offshore’ adversely affected their health. An almost equal proportion of the sample constituted former smokers who have quit the habit. The most interesting finding in relation to smoking behaviour was the association between self-reported accidents and smoking. This association has been documented previously in the literature and, although the underlying causes are somewhat unclear, both the current results and extant literature suggest that smokers are at a greater risk of accident involvement (e.g. Sacks & Nelson, 1994). However, our data also indirectly revealed that smoking behaviour was also associated with participation in health promotion activities such that individuals who report being former smokers are more likely to have participated in health promotion activities on their installation and vice versa. While direct evidence of the causal impact of health promotion on smoking cessation is not available within data from the current study, the health promotion literature that smoking cessation programmes are among the most effective and successful forms of intervention (Fielding, 1982; Pelletier, 1984). Reported onshore alcohol consumption mirrored the ‘binge-drinking’ patterns observed for Scottish males in the 1998 Scottish Health Survey (Shaw, McMunn & Field, 2000). This survey reported that 33% of adult males (aged 16-74 years) exceeded the maximum consumption levels of 21 units of alcohol per week while in the current sample 34% of respondents reported an onshore consumption at this level. A worrying aspect of the current finding is that the majority of respondents reporting high levels of alcohol consumption did not believe that this consumption was detrimental to their health. It would appear that more health education regarding the detrimental effects of excessive alcohol consumption should be directed at the offshore worker. To conclude this section, the findings reported in the current study suggest that, in terms of their personal health as determined by BMI status, smoking behaviour and alcohol consumption, the offshore population do not appear to differ significantly from the general onshore population. Comments provided by respondents suggest that a more proactive approach to health promotion activities would be welcomed. 7.2 Workplace Health Management Offshore This section aims to summarise the findings relating specifically to perceptions and experience of the workforce in relation to occupational health in the form of health surveillance and health promotion activities in the workplace.
101
In terms of workplace health promotion initiatives, over two thirds of respondents in the current study were aware of some form of health promotion activity taking place on their installation but only about one third had actually participated. A majority of respondents believed they could rely on support from their colleagues if they were trying to improve their health – although the perceived support available from this source varied considerably by installation. Medics identified stress and musculo-skeletal disorders as the main occupational health risks facing the offshore workforce while the aging profile and unhealthy lifestyle choices of the workforce were also identified as increasingly problematic for health. Confirming the medic’s identification of musculoskeletal problems as a key occupational health concern for the offshore worker, the workforce data suggested that over a third of respondents report recurring muscular pain (mostly in the lower back) with the majority indicating that their work offshore can exacerbate this pain. However, despite the fact that medics identify musculoskeletal problems are one of the main problems facing the offshore workforce and the relatively high number of respondents reporting problems of this kind, only 38% of those experiencing musculoskeletal problems acknowledged that they have received support/advice on their installation to help them reduce or manage pain associated with their condition. The actual role of the medic on an installation was determined at an organizational level with other tasks and roles unrelated to their core function occupying an estimate 70-90% of their time. The training received by medics relating to health promotion and occupational health issues can best be described as patchy – only 22% have been trained specifically in health promotion whereas 50% indicated having received training in relation to stress management. At the interface between the general offshore workforce and the installation medic, just over one quarter of our respondents have asked the medic for advice regarding their general health or fitness and 45% have received unsolicited advice from the medic with regard to the management of their personal health or fitness. There was considerable variation between worksites regarding the level of interaction between medics and the workforce on general health matters. A number of worksites enjoyed considerable positive input from their medic relating to health improvement while on other installation the emphasis was less positive. It appeared that positive interactions were more likely to occur when installations were involved in organisation-level initiatives such as participation in official award schemes such as SHAW. Over three-quarters of medics believed there had been a change in workforce health since the introduction of health promotion programmes and many responded positively regarding the company’s level of commitment to improving the health of the workforce. In relation to health surveillance activities, despite relatively high levels of satisfaction with the management of work-related health risks, a closer examination of hand-held power tool users indicated that only 8% of regular users and 10% of occasional users had been checked for vibration white finger and associated conditions. 62% of users indicated that they were familiar with the symptoms of VWF with disparity between installations perhaps reflecting the different activities engaged in by different installations. Similarly, 64% indicated exposure to chemicals with 29% receiving a health check in relation to this exposure. Thus, in terms of our measures relating to health surveillance, the health surveillance in relation to VWF and chemical exposure appeared somewhat limited although of course we acknowledge the self-report limitations of the data and difficulties associated with the identification of degree of exposure to both dangerous chemicals and vibration tools. Training offered to the workforce varied also. Medics reported that the majority of installations offered training relating to safe manual handling but less than half offered training for the safe use of handheld power tools supporting the deficits observed in data obtained from the workforce respondents.
102
In conclusion, it would appear that installation medics do not always have the necessary training to deliver health promotion in the workplace. This is perhaps not surprising given the occupational background of many medics employed offshore who have historically been trained in military or psychiatric health settings. In the absence of this training and any organizational focus in this area, many medics were not viewed by the workforce as a source of health information and advice. However, where medics have the necessary training and interest in worksite health promotion in conjunction with organizational resources such as time and management support – and also, motivation at an organizational level through commitment to occupational health schemes or initiatives (e.g. SHAW), the current findings demonstrate positive interactions and outcomes between the workforce and medical personnel. The data in relation to particular aspects of health surveillance suggest broad variations between installations in the levels of health surveillance undertaken. Surveillance would appear to be particularly patchy in relation to the use of vibration tools. This is not unduly surprising in that there are currently no UK health and safety regulations that deal specifically with risks from vibration tools. These risks currently fall under general health and safety legislation while the associated HSE directive place a duty on employers to assess risks to employees from vibration, reduce exposure to vibration and provide requisite information and training regarding the hazard. The current data point to some shortcomings in this area. Although only a relatively small proportion of the sample encounter exposure to vibration in their work, the current results suggest that the health surveillance of this group may be at best irregular. Another important finding to emerge from the data is that approximately 20% of respondents indicated that they have felt ill while offshore but chose not to report to the medic in order to avoid an onshore referral. This finding should be addressed at an organizational level to allay employee fears in relation to onshore referrals and subsequent loss of earnings. That these workers may have been attempting to work in the high hazard offshore environment while in poor health may constitute a threat to both personal and worksite safety. 7.3 Investing in Workplace Health Offshore We found support for our initial hypothesis that greater investment in health-related activities would manifest in positive evaluations of both health and safety climates, and result in fewer risk taking behaviours and greater commitment to the workplace. In an exploration of the differences between installations obtaining low versus high scores according to the Health Management Index derived in the current study, several organizational level differences were pinpointed. For instances, a larger proportion of medics on HMI installations appeared to have received training in health areas such as ‘health promotion’, ‘exercise and fitness’ and ‘identifying occupational disease’. Medics on high HMI installations were more likely to report a greater level of involvement in the management of health on the installation, experienced more visits from the workforce for general health issues, were more likely to have been involved in worksite health award schemes and rated company commitment to health more positively. Similarly, employees on high HMI installations were more likely to ask the medic for advice on improving their health, were more likely to be offered unsolicited health improvement advice by the medic, received greater support to manage muscular pain, more information about healthy eating, greater support to make changes to improve their lifestyle, were more involved in identifying health risks and had a high awareness of health promotion activities on their installations. Finally, individuals on low HMI installations were more likely to indicate that
103
their health was affected by various environmental factors than were respondents on high HMI installations. Overall, individuals on installations where occupational health has received only low levels of attention in terms of organizational investment and/or management input performed significantly worse on a number of unrelated measures of climate and commitment when compared to installations where investment in, and management of, occupational health has been accorded more importance. This finding provides support for the hypothesis that organizational investment in workforce health builds commitment and loyalty to the company or organization and produces indirect effects in terms of improved safety behaviour and commitment.
The current results build on previous findings in both the safety climate and occupational health literatures and, in effect, highlight an important link between these two domains. The current data also replicate previous findings that safety climate is predictive of specific safety outcomes such as safety behaviour/risk-taking behaviour (e.g. Ostroff, Kinicki & Tamkins, 2003; Schneider, 1990; Zohar, 1980). Results also support Neal, Griffin and Hart’s (2002) conclusion that safety climate acts as “a mediator of the impact of general organizational climate on safety-related outcomes” (p.106) if the level of investment and ensuing perception of the employer as valuing the health of the workforce is viewed as contributing towards the more general organizational climate (c.f. the ‘broader change in organizational environment’ noted by Holzbach et al., 1990). Support for this position might be drawn from recent results reported by Piirainen, Rasanen and Kivimaki (2003) who noted an association between occupational health and organizational climate such that a more positive organizational climate is associated with a lower risk of work related health symptoms. Similarly, there is support for the positive relationship between climate and commitment demonstrated in previous research suggesting that when the workforce are treated with consideration or perceive a concern for their well-being higher levels of commitment ensue (DeCotiis & Summer, 1987). The most important contribution of the current work, however, lies in drawing together these elements and to demonstrate that investment in workforce health may have far reaching implications not typically associated with a more narrow definition of health. For organizations attempting to improve their safety climate or reduce turnover - one of the documented positive outcomes of increased workforce commitment (Carr, Schmidt, Ford & DeShon, 2003) - these results suggest that positive outcomes in these areas may be achieved by a focus on health and well-being in the workplace. A social exchange perspective (Eisenberger, Fasolo, & Davis-LaMastro, 1990) suggests that the perception of employer support and investment generates an implied obligation in employees towards future positive reciprocity favoring the organization (Dejoy, Schaffer, Wilson, Vandenberg & Butts, in press). The current results are at the very least suggestive that positive outcomes in these areas may be achieved by a focus on health and well-being in the workplace. These findings may be particularly beneficial for advanced organizations, particularly closely regulated high reliability industries, where efforts to improve safety climate and safety behaviour have resulted in low accident rates and an ensuing plateau in terms of improvements in safety. Clearly, further work is necessary to determine whether a more general improvement of the organizational climate might
104
continue to generate improvements in safety climate and safety behaviour. A second phase of work is underway to investigate the hypothesis that support provided by the organisation and management (both generally and specifically for health and well-being) builds a positive perception of health climate, which in turn impacts on personal health behaviours, citizenship behaviours, rule compliance. There is evidence that organizational support results in outcomes favourable to the employees and to the organization. A meta-analysis by Rhoades & Eisenberger (2002) indicated that three major categories of beneficial treatment received by employees (i.e., fairness, supervisor support, and organizational rewards and favourable job conditions) were associated with perceived organizational support. Oorganisational support, in turn, was related to outcomes favourable to employees (e.g., job satisfaction, positive mood) and the organization (e.g., affective commitment, performance, and lessened withdrawal behaviour). Research also indicates that the notion of organizational support hinges on employees' belief that the organization's actions are discretionary, feeling of obligation to aid the organization, fulfilment of socio-emotional needs, and performance-reward expectancies. Thus, this second study will enable us to explore a number of relationships between the general and health-related support provided by an organisation, supervisors and medics for employees and outcomes such as commitment and citizenship behaviours.
There are, of course, a number of limitations associated with the current study. One such limitation is the nature of the cross-sectional design employed. Limited access to remote worksites and the restrictive nature of a large-scale survey across many worksites and competing companies precluded the operationalisation of a more complicated design. Future research in this vein should be directed at the examination of the relationships examined in the current study under longitudinal conditions and seek to observe improvements across time in response to investment in workforce health within individual worksites. A second limitation, again associated with the nature of the industry-type and worksites involved in the current research, is that the offshore employees taking part in the current study are essentially a ‘captive audience’ in their workplace for extended periods. Moreover, the offshore work environment is remote and uniquely inhospitable and as Cox (1982) suggests “a rough and tough world” (p.97). In light of these possibly industry specific limitations, it would be beneficial to replicate the current research within different industries and also cross-culturally. A methodological criticism might also be leveled at the use of self-report data rather than objective performance-related criteria, such as accident and injury rate, turnover and financial investment data. Again, there are industry factors, which make the acquisition and use of such data extremely difficult. In addition, the definition and measurement of accidents in the workplace presents a number of problems. For example, accident rates can present highly skewed distributions, and, are often only associated with lost-days accidents or incidents at the organizational level. Similarly, the self-reported rate of accident involvement in the current sample was only 6.9% (range 2%-18%) providing relatively few data-points for analysis. Furthermore, previous attempts to collate objective data on visits to medical personnel for illness or injury have been severely thwarted by the incompatible recording systems operated by different organizations – indeed, even the nominally same organizations can operate different recording systems across worksites. Finally, company level data regarding financial investment in workforce health may not reflect actual manifestations of this reported investment at the worksite – particularly where worksites are remote and to some extent self-regulating with regard to what might be deemed ‘discretionary’ expenditure. These limitations aside, the data provide a preliminary indication that investing in employee health has important far-reaching implications both for safety outcomes and behaviours
105

associated with a committed workforce. The findings lend obvious support to the proposal that the introduction of employee-centered health improvement initiatives generates broader beneficial changes in the working environment (Holzbach et al., 1990) and fosters a positive general perception of the organization as a ‘caring’ place to work. Future research in this area should be directed towards documenting the precise mechanisms generating these organizational level improvements.
106
9 CONCLUSIONS & RECOMMENDATIONS The findings of the current study indicate interesting and persuasive differences in broader organizational climate between installations where organizational level commitment (in terms of time, resources and investment) has been made in respect of workforce health issues and those worksites where workforce health has been emphasized to a lesser degree. Although the data cannot implicate specific causal mechanisms, these results suggest that the health improvement outcomes typically (and intuitively) associated with investment in workforce health may not be the only benefits an employer could anticipate following investment in worksite health initiatives. Our findings document the health behaviours and health management practices on a large number of offshore installations on the UKCS. We also found support for our initial hypothesis that greater investment in health-related activities would manifest in positive evaluations of both health and safety climates, and result in fewer risk taking behaviours and greater commitment to the workplace. In light of these findings, we suggest that organisations look beyond the health-related costs when determining commitment to workforce health given the potential of positive knock-on effects of reduced risk-taking and improved workforce commitment. The following recommendations take into account the practices of high performing worksites and as such constitute best practice as determined within the current study. Given that investment in workforce health is key to eliciting more general organizational effect, more specific recommendations can also be identified. These recommendations can be summarised under three key areas: Management and investment in offshore medical personnel, Personal health management offshore and Occupational health management offshore. Clearly, these areas are closely related with several points of overlap. 9.1 Management & Investment in Offshore Medical Personnel The results of the current study would appear to indicate that the installation medic appears to play a pivotal role in the management of workforce health and where the medic (whether employed directly by the company or through an agency) has the support of the organisation the effectiveness of the medic in this role is greatly enhanced. The differences between medics on high and low performance installations are marked. Thus the results suggest that a medic accorded sufficient time (perhaps requiring release from other ancillary duties) and given adequate company support in terms of training, resources and investment may well be the driver of installation-wide improvements in areas beyond health. Any organisation attempting to improve the management of workforce health offshore might consider the following issues: • Facilitation of Medic-Workforce Interface Employees on high HMI installations were more likely to ask the medic for advice on improving their health, were more likely to be offered unsolicited health improvement advice by the medic, received greater support to manage muscular pain, more information about healthy eating, greater support to make changes to improve their lifestyle, were more involved in identifying health risks and had a high awareness of health promotion activities on their installations. High HMI medics report receiving over three times the number of visits for general health improvement queries than low HMI medics. In additional to more tangible resources, this level of medic involvement with the workforce for general health matters clearly requires the investment of medical personnel time. To this end, organisations wishing to
107
facilitate medic-workforce interface may need to consider the additional work unrelated to the management of health undertaken by their medics while offshore and determine the extent to which these supplementary roles constitute an effective and economical use of medical personnel time. • Training of Offshore Medical Personnel Medics on high performing installations indicated having received additional training in ancillary health issues such as health promotion, exercise and fitness and identifying occupational disease. • Medic Involvement in Health Management Initiatives Medics on high HMI installations were more likely to report a higher level of involvement in designing, developing and implementing any health promotion initiatives than those on low HMI installations (presumably reflecting the greater degree of training in these areas by these medics). As a result, it is likely that health promotion programmes developed with the input of the medic at the worksite level, will better reflect the particular needs and requirements of the workforce in that particular location than a more generic programme. By extension, a programme that better reflects the needs and requirements of a particular workforce is more likely to positively impact that workforce. Thus, organizations developing health promotion initiatives should draw on the local site knowledge of the medic when developing workforce health-related initiatives. 9.2 Personal Health Management Offshore In addition to the key role played by the medic at the interface between an organization and its workforce in relation to health-related issues, the current results suggest that there are a number of broader issues to be addressed with regard to the personal health of the workforce. These issues are identified below in conjunction with recommendations warranted by the current data. • Facilitation of Personal Health Improvement The study identified a number of issues relating to the way in which organizations might support the workforce in terms of personal health improvement and identified current gaps in the facilitation of personal health improvement offshore. Obviously, the provision of reasonable gym facilities with safe equipment and training for the use of that equipment is imperative to facilitate fitness improvement. Of course there may be limitations on space and difficulties associated with sending suitably qualified individuals offshore. However, many respondents also indicated more practical problems associated with organizational factors on their installation. One such problem for many respondents pertained to limited galley opening hours and scheduled meal-times. Specifically, for these respondents, they were unable to defer their main evening meal until after a post-shift exercise session as the galley would no longer be open. Thus, they were faced with the prospect of eating their meal and then waiting until later to exercise by which time initial positive intentions to exercise may have been weakened by other distractions and fatigue. Secondly, a number of respondents reported feeling intimidated by more experienced gym users. Health promotion initiatives relating to exercise and fitness need to take this into account and perhaps, facilitate training and use of the gym by less experienced gym-users. The data suggest that quite often these are older workers, who are keen to take better care of their health
108
but feel uncomfortable or unsure about what to do in the gym, particularly when surrounded by younger, fitter gym-users. On the whole, respondents were also keen to take part in organised initiatives and challenges but results suggest that these initiatives need to be carefully tailored to the needs, requirements and ability of individuals on the installation. • Healthy Eating: Awareness & Resources A large percentage of respondents had received information about health eating on their installation – although individuals on high scoring HMI installations were more likely to have received this information. In addition, a significant proportion of respondents (between 32%-65%) on each participating installation indicated that they were currently attempting to lose weight. However, the comments provided suggested that many respondents encounter difficulties when attempting to maintain a healthy diet offshore for a variety of reasons. Poor quality food, lack of fresh fruit and vegetables and the cooking methods employed by offshore caterers were identified as key impediments to maintaining a healthy diet. There was a general consensus that the caterers are frequently restricted in what they can deliver by extremely limited budgets, which simply do not allow for the provision of tasty, healthy food. There was also concern that supposedly ‘healthy options’ are far from healthy as, in the absence of critical nutrition knowledge or training, these options are frequently just meat-free dishes covered in cheese or rich sauces. Based on the information obtained in the course of this survey, we can make two direct recommendations: companies keen to support the health of their workforce in a meaningful way need to carefully examine the standard, variety and nutritional content of food on offer to the workforce and promote the provision of good quality healthy food. By the same token, catering companies contracted to supply a ‘healthy option’ at each meal-time may need to re-assess staff understanding of the term in relation to cooking methods and actual menus. Of course, individuals are themselves are also responsible for poor choices at mealtimes and also need to be educated as to positive health choices via health education or promotion initiatives. • Musculoskeletal Pain Over a third of the sample of offshore respondents reported recurring muscular pain, mostly in the lower back. Over two-thirds of those experiencing pain indicated that some aspects of their work offshore can exacerbate this pain. However, only 38% indicated that they had received support in the form of information or advice in the workplace to help them manage or reduce the muscular pain. Clearly, given the potential interaction of this pain with work tasks, greater levels of support and intervention in the worksite may be necessary. 9.3 Occupational Health Management Offshore For the purposes of the current work, occupational health in general has been quite broadly defined but for the purposes of the current recommendations, we are considering the impact of procedures, training and equipment to protect against occupational ill-health. • Workforce Training Training available to the workforce in relation to a variety of important occupational health issues varied considerably between participating installations. Our results suggest particular deficits in relation to advice and training for individuals working with handheld tools at
109

potential risk from various vibration-related conditions. For many installations, there also appeared to be some deficits in relation to training for the proper use of PPE, avoiding work-related skin problems and the management of work-related stress. Given the potential future costs to an organization of occupational illness, worksite training appropriate to the occupational health risks encountered at that worksite is to be recommended. • Risk Assessment, Surveillance, & PPE The results suggest some considerable variation in the extent to which the workforce is involved in identifying and assessing risks to their health present in their work, although it is noteworthy that individuals on installations scoring highly on the Health Management Index (HMI) were significantly more likely to be involved in this type of risk assessment. It was somewhat more difficult to assess the level of health surveillance for specific health risks underway among our offshore sample due to the apparent absence of standard recording systems – in our experience, medics appeared to have some difficulty in quantifying the surveillance undertaken. Our data did uncover however significant deficits in the surveillance of individuals working with handheld tools for symptoms of vibration white finger and other associated conditions. In a similar vein, only a small proportion of individuals reporting exposure to a range of chemicals indicated that they had received a health check in relation to that exposure. In addition, the health surveillance of contractor staff should be considered (i.e. are they receiving appropriate surveillance either from their direct employer or at the worksites they are contracted to?). In relation to PPE, participants were relatively positive regarding their experience of PPE availability and usage, with many stating explicitly that they recognized and appreciated the need for such equipment. However, many respondents felt that the PPE they are obliged to use is ill-fitting and uncomfortable and can impede their ability to carry out their work. Particular problems were identified as to the compatibility of some PPE (e.g. safety goggles that fit comfortably with ear protection and hard hats) and also the inappropriate use of some PPE in certain contexts and environments. We acknowledge the general and self-report nature of these data and appreciate that health surveillance activities should target very specific health risks. However, these data serve to identify potential gaps in health surveillance practices. • Organizational Integrity for both Health & Safety In many respects, the results suggest that the workforce need to see actual evidence of their employer’s commitment to their welfare and well-being in the workplace before any of the attendant benefits associated with investment in workforce health identified in the current study emerge. The offshore workforce are adept at identifying management ‘lip service’ or superficial initiatives in relation to both health and safety. Therefore, organizations seeking to improve performance in these areas need to demonstrate real and long-term commitment to generate organizational climate change and individual level change in terms of greater workforce commitment and reduced risk taking 9.4 Concluding Remarks Overall, our findings suggest that much beneficial work pertaining to the management of workforce health is underway on many of the participating installations. Throughout this report we have attempted to identify current best practice and suggest directions to generate further improvements. However, many worksites have a long way to go in terms of basic health
110
management practices. We appreciate the commercial realities of the offshore oil and gas industry and the associated limitations in investment potential – particularly for smaller operators. Nonetheless, the industry drive for improved safety implicates the positive management of workforce health although the close links between health and safety are rarely explicitly identified. One survey respondent expresses this point very clearly: “It is important to understand that there are a number of ways by which personnel are informed of how to stay safe or how to work safely but none of these mechanisms reach specifically to highlighting health i.e. there is no conscious or explicit link made between the relationship of safety and health. Much more could be done to educate and support the workforce to the relationship between safety and health. There is little evidence that management recognize that if workers are working in a manner that safeguards their health they will almost certainly be working safely. More requires to be done to ensure that supervisors see occupational health as something that their workers need to participate in and supervisors are responsible for”.
111
5. References
Aldana, S. G., & Pronk, N. P. (2001). Health promotion programs, modifiable health risks, and employee absenteeisn. Journal of Occupational and Environmental Medicine, 43(1), 36-46.
Ashby, S. G., & Diacon, S. R. (1996). Motives for occupational risk management in large UK companies. Safety Science, 22(1-3), 229-243.
Ballor, D. L., & Keesey, R. E. (1991). A Meta-analysis of the Factors Affecting Exercise-Induced Changes in Body-Mass, Fat Mass and Fat-Free Mass in Males and Females. International Journal of Obesity, 15(11), 717-726.
Basen-Engquist, K., Hudmon, K. S., Tripp, M., & Chamberlain, R. (1998). Worksite health and safety climate: Scale development and effects of a health promotion intervention. Preventive Medicine, 27(1), 111-119.
Bell, J. G., Bishop, C., Gann, M., Gilbert, M. J., Howe, W., Lamb, C. T., Leightondavies, G., McKie, N. I. P., Pictonrobinson, I., Prestage, A. M., Roythorne, C., & Turner, M. (1995). A Systematic-Approach to Health Surveillance in the Workplace. Occupational Medicine-Oxford, 45(6), 305-310.
Blair, S. N., Piserchia, P. V., Wilbur, C. S., & Crowder, J. H. (1986). A Public-Health Intervention Model for Work-Site Health Promotion - Impact on Exercise and Physical-Fitness in a Health Promotion Plan after 24 Months. Jama-Journal of the American Medical Association, 255(7), 921-926.
Bly, J. L., Jones, R. C., & Richardson, J. E. (1986). Impact of Worksite Health Promotion on Health-Care Costs and Utilization - Evaluation of Johnson-and-Johnson Live for Life Program. Jama-Journal of the American Medical Association, 256(23), 3235-3240.
Breslow, L., Fielding, J., Herrman, A. A., & Wilbur, C. S. (1990). Worksite Health Promotion - Its Evolution and the Johnson-and- Johnson Experience. Preventive Medicine, 19(1), 13-21.
Brown, R., & Holmes, H. (1986). The use of a factor-analytic procedure for assessing the validity of an employee safety climate model. Accident Analysis and Prevention, 18, 455-470.
Carr, J. Z., Schmidt, A. M., Ford, J. K., & DeShon, R. P. (2003). Climate perceptions matter: A meta-analytic path analysis relating molar climate, cognitive and affective states, and individual level work outcomes. Journal of Applied Psychology, 88(4), 605-619.
Chapman, L. (1987). Creating a wellness oriented workplace: policies, places and norms, Vol. 18. Seattle: Corporate Health Designs.
Cheyne, A., Tomas, J., Cox, S., & Oliver, A. (1999). Modelling employee attitudes to safety: a comparison across sectors. European Psychologist, 4, 1-10.
Coleshaw, S., & Harris, R. (1998). Assessment of Medical Status of the Offshore Population.: HSE OTO 97 057.
Corporate Cover (1994, 4 September). UK ignores health and safety laws. Corporate Cover.
Council Directive 96/82/EC of 9 December 1996: The Control of Major Accident Hazards Involving Dangerous Substances.
Cox, M., Shephard, R. J., & Corey, P. (1981). Influence of an Employee Fitness Program Upon Fitness, Productivity and Absenteeism. Ergonomics, 24(10), 795-806.
112

Cox, R. (1982). Offshore medicine - medical of employees in the offshore oil industry. Berlin: Springer Verlag.
Cox, R., & Norman, J. (1987). Some special problems. In C. RAF (Ed.), Offshore medicine: medical care of employees in the offshore oil industry. London: Springer-Verlag.
Crump, C. E., Earp, J. A. L., Kozma, C. M., & HertzPicciotto, I. (1996). Effect of organization-level variables on differential employee participation in 10 federal worksite health promotion programs. Health Education Quarterly, 23(2), 204-223.
Cullen, D. (1990) The Public Inquiry into the Piper Alpha Disaster. Department of Energy. London, England: HMSO.
Damberg, M. (1984). Worksite Health Promotion: Examples of Programs that Work. Washington DC: US Department of Health and human Services.
Decotiis, T. A., & Summers, T. P. (1987). A Path-Analysis of a Model of the Antecedents and Consequences of Organizational Commitment. Human Relations, 40(7), 445-470.
Dejoy, D. M. (1994). Managing Safety in the Workplace - an Attribution Theory Analysis and Model. Journal of Safety Research, 25(1), 3-17.
Dejoy, D. M., Schaffer, B. S., Wilson, M. G., Vandenbert, R. J., Butts, M. M. (In press). Creating safer workplaces: Assessing the determinants and role of safety climate. Journal of Safety Research.
Dejoy, D. M., & Southern, D. J. (1993). An Integrative Perspective on Work-Site Health Promotion. Journal of Occupational and Environmental Medicine, 35(12), 1221-1230.
Department for Health (1998). Our Healthier Nation: A Contract for Health. The Stationery Office, London.
Durbeck, D., Heinzelmann, F., & al, J. S. e. (1972). The National Aeronautics and Space Administration - US Public Health Service evaluation and enhancement program. Amercian Journal of Cardiology, 30, 784-790.
Everly, G., & Feldman, R. (1985). Occupational health promotion: health behaviour in a the workplace. New York: John Wiley and Sons.
Falkenberg, L. (1987). Employee fitness programs: Their impact on the employee and the organisation. Academy of Management Review, 12, 511-522.
Fenn, C., & Ballantine, B. (1991, 10-14 November). A dietary survey to measure energy and nutrient intakes in a group of offshore workers. Paper presented at the Paper presented at the Society of Petroleum Engineers, First International Conference on Health, Safety and Environment, The Hague, The Netherlands.
Feuer, D. (1985). Wellness programs: how do they shape up? Training, 22, 25-34.
Field, R., & Abelson, M. (1982). Climate: A reconceptualisation and proposed model. Human Relations, 35, 181-201.
Fielding, J. (1982). Effectiveness of employee health improvement programmes. Journal of Occupational Medicine, 24, 907-916.
Fielding, J. E. (1984). Health Promotion and Disease Prevention at the Worksite. Annual Review of Public Health, 5, 237-265.
Flin, R. (1998). Safety condition monitoring. Lessons from 'Man-made Disasters'. Journal of Contingencies and Crisis Management, 6, 88-92.
Flin, R., Mearns, O'Connor, P. & Bryden, R. (2000). Measuring safety climate: identifying the common features, Safety Science, 34, 177-192.
113
Forrester, B. G., Weaver, M. T., Brown, K. C., Phillips, J. A., & Hilyer, J. C. (1996). Personal health-risk predictors of occupational injury among 3415 municipal employees. Journal of Occupational and Environmental Medicine, 38(5), 515-521.
Gardner, R. (2001). Offshore Safety Division National Inspection Projects; Findings and Lessons On Occupational Health Management in the Offshore Sector. In Proceedings at the Occupational Health Offshore Conference, Offshore Technology Report 2001/041, 27-29 March, Aberdeen, p 47-60.
Gardner, R. (2003). Overview and characteristics of some occupational exposures and health risks, Annals of Occupational Hygiene, Vol. 47 (3), 201-210.
Gann, M. (1989). Coronary artery disease in an offshore workforce. Unpublished Thesis prepared for the Diploma of Membership of the Faculty of Occupational Medicine (MFOM), Royal College of Physicians.
Gerbing, D. W., & Anderson, J. C. (1993). Monte Carlo evaluations of goodness-of-fit indices for structural equation models. In K. A. Bollen & J. S. Long (Eds.), Testing structural equation models (pp. 40-65). Newbury Park, CA: Sage.
Griffin, M. A., & Mathieu, J. E. (1997). Modelling organizational processes across hierarchical levels: climate, leadership, and group process in work groups. Journal of Organizational Behaviour, 18(6), 731-744.
Griffin, M. A., Tesluk, P. E., & Jacobs, R. R. (1995). Bargaining cycles and work-related attitudes: Evidence for threat-rigidity effects. Academy of Management Journal, 38(6), 1709-1725.
Gun, R. (1993). The role of regulations in the prevention of occupational injury. Safety Science, 16, 47-66.
Harderwijk, E. (1991, 10-14 November). Retrospective field research of accident and illness data on the Dutch Continental Shelf. Paper presented at the Paper presented at the First International Conference on Health, Safety and Environment, The Hague, The Netherlands.
Harjono, D. (1991). Skin diseases among workers of exploration and production department, South Sumatra, Indonesia. Paper presented at the Proceedings of the First International Conference on Health, Safety and Environment, The Hague, Netherlands.
Hart, P., Wearing, A., & Griffin, M. (1996). Integrating personal and organizational factors into a coherent model of occupational well-being. Paper presented at the Paper presented at the 21st Annual Meeting of the Academy of Management, Cincinnati OH.
Health and Safety Executive (1997). Successful Health and Safety Management (HSG65), HSE Books, Sudbury.
Health and Safety Executive (1999). Reducing error and influencing behaviour (HSG 48). 2nd Edition. Norwich:HMSO.
Health and Safety Executive (2000). Securing Health Together: A long term occupational health strategy for England, Scotland and Wales. Suffolk: HSE Books.
Heinzelmann, F., & Bagley, R. (1970). Response to physical activity programs and their effects on health and behaviour. Public Health Rep, 85, 905-911.
Heirich, M., Cameron, V., Erfurt, J., Foote, A., & Gregg, W. (1989). Establishing communication networks for health promotion in industrial settings. American Journal of Health Promotion, 4, 108-117.
114
Heirich, M. A., Foote, A., Erfurt, J. C., & Konopka, B. (1993). Work-Site Physical-Fitness Programs - Comparing the Impact of Different Program Designs on Cardiovascular Risks. Journal of Occupational and Environmental Medicine, 35(5), 510-517.
Hellesøy, O. (1985). Work environment Statfjord Field. Work environment, health and safety on a North Sea oil platform. Bergen: Universitetsforlaget.
Hoffman, J., & Hobson, C. (1984). Physical fitness and employee effectiveness. Personnel Administrator, 29(4), 101-113.
Hofmann, D., & Stetzer, A. (1996). A cross-level investigation of factors influencing unsafe behavours and accidents. Personnel Psychology, 49, 307-339.
Holzbach, R. L., Piserchia, P. V., McFadden, D. W., Hartwell, T. D., Herrmann, A., & Fielding, J. E. (1990). Effect of a Comprehensive Health Promotion Program on Employee Attitudes. Journal of Occupational and Environmental Medicine, 32(10), 973-978.
Horsley, H., & MacKenzie, I. (1997). Lifestyle Survey amongst North Sea oil workers. Paper presented at the Proceedings of the Occupational Health Offshore Conference: Aberdeen 26-28 March 1996, Aberdeen.
Ilgen, D. R. (1990). Health Issues at Work - Opportunities for Industrial Organizational-Psychology. American Psychologist, 45(2), 273-283.
James, L. R. & James, L. R. (1989). Integrating work environment perceptions: Explorations into the measurement of meaning. Journal of Applied Psychology, 74, 739-751.
James, L., & McIntyre, M. (1996). Perceptions of organizational climate. In K. Murphy (Ed.), Individual differences and behaviour in organisations (pp. 40-84). San Francisco: Jossey-Bass.
Jones, R. C., Bly, J. L., & Richardson, J. E. (1990). A Study of a Work Site Health Promotion Program and Absenteeism. Journal of Occupational and Environmental Medicine, 32(2), 95-99.
Kannel, W. B. (1988). Cholesterol and Risk of Coronary Heart-Disease and Mortality in Men. Clinical Chemistry, 34(8B), B53-B59.
Kendrick, J. S., Williamson, D. F., & Caspersen, C. J. (1991). A Meta-analysis of Physical-Activity in the Prevention of Coronary Heart-Disease. American Journal of Epidemiology, 134(2), 232-233.
Kivimaki, M., Kalimo, R., & Salminen, S. (1995). Perceived nuclear risk, organizational commitment, and appraisals of management - a study of nuclear-power-plant personnel. Risk Analysis, 15, 391-396.
Kondrasuk, J. (1984). Corporate physical fitness programs: The role of the personnel department. Personnel Administrator, 29(12), 75-80.
Laurell, A. C., Noriega, M., Martinez, S., & Villegas, J. (1992). Participatory Research on Workers Health. Social Science & Medicine, 34(6), 603-613.
LaPorte W. (1970). La gymnastique de pause dans l'entreprise (gymnastic breaks in industry).. Brussels, Belgium: Ministére de la Culture Française. Lawton, R. (1998). Not working to rule: Understanding procedural violations at work. Safety Science, 28(2), 77-95.
Light, I., & Dingwall, R. (1985). Basic anthropometry of 419 offshore workers: RGIT Offshore Survival Centre Report.
Light, I., & Gibson, M. (1986). Percentage body fat and prevalence of obesity in UK offshore population. British Journal of Nutrition, 56, 97-104.
115
Logan, A. G., Milne, B. J., Achber, C., Campbell, W. P., & Haynes, R. B. (1981). Cost-Effectiveness of a Worksite Hypertension Treatment Program. Hypertension, 3(2), 211-218.
Marsh, H.W.; Balla, J.R.; and McDonald, R.P. (1988). Goodness of fit indexes in confirmatory factor analysis: The effect of sample size. Psychological Bulletin, 103, 391-410.
Marsh, H. W., Balla, J. R., & Hau, K. (1996). An evaluation of incremental fit indices: A clarification of mathematical and empirical properties. In G. A. Marcoulides & R. E. Schumacker (Eds.), Advanced structural equation modeling: Issues and techniques (pp. 315-353). Mahwah, New Jersey: LEA.
Matteson, M., & Ivancevich, J. (1988). Health Promotion at Work. In C. Cooper & I. Robertson (Eds.), International Review of Industrial and Organizational Psychology. New York: John Wiley & Sons Ltd.
McLeroy, K., Bibeau, D., Steckler, A., & Glanz, K. (1988). An ecological perspective on health promotion programs. Health Education Quarterly, 15, 351-377.
Mearns, K., & Fenn, C. (1994). Diet, Health and the Offshore Worker - A pilot study. Suffolk: HSE Books.
Mearns, K., Flin, R., Gordon, R. & Fleming, M. (1998). Measuring safety climate on offshore installations, Work and Stress, 12, 238-254.
Mearns, K., Whitaker, S. M., & Flin, R. (2001). Benchmarking safety climate in hazardous environments: A longitudinal, inter-organizational approach. Risk Analysis, 21(4), 771-786.
Mearns, K., Whitaker, S. M., & Flin, R. (2003). Safety climate, safety management practice and safety performance in offshore environments, Safety Science, 41, 641-680.
Michela, J., Lukaszewski, M., & Allegrante, J. (1995). Organizational climate and work stress: a general framework applied to inner-city schoolteachers. In S. Sauter & S. Murphy (Eds.), Organizational Risk Factors for Job Stress (pp. 61-80). Washington DC: American Psychological Association.
Moran, E., & Volkwein, J. (1992). The cultural approach to the formation of organizational climate. Human Relations, 45, 19-47.
Mudrack, P. E. (1992). Work or Leisure - the Protestant Work-Ethic and Participation in an Employee Fitness Program. Journal of Organizational Behaviour, 13(1), 81-88.
Murd, D., Nans, A., Engler, V., Hetychova, M., & Vavreckova, O. (1966). Work Injuries and Smoking. Ind Med and Surg, 35, 880-881.
Neal, A., Griffin, M. A., & Hart, P. M. (2000). The impact of organizational climate on safety climate and individual behaviour. Safety Science, 34(1-3), 99-109.
O'Dea, A. (2001). Site managers and safety leadership in the offshore oil and gas industry. Unpublished PhD Thesis, University of Aberdeen
Oleckno, W. (1987). Drinking, smoking and other factors in the epidemiology of unintentional non-motor vehicle injuries. Public Health, 101, 39-47.
Opatz, J. (1985). A primer of health promotion: creating health organizational cultures. Washington DC: Oryn Publications.
Oshaug, A., Ostgard, L., & Trygg, K. (1992). Diet among oil-workers on off-shore oil installations in the Norwegian sector of the North Sea. British Journal of Nutrition, 68, 11-19.
116
Ostgard, L. (1990). Food habits among Norwegian offshore oil workers: adaptation to spectrum and abundance of food choice. In J. Somogyi & E. Koskinen (Eds.), Nutrition Adaptation to New Lifestyle (Vol. 45, pp. 165-175). Basel: Karger.
Ostroff, C., Kinicki, A. J. & Tamkins, M. M. (2003). Organizational culture and climate. In W. C. Borman, D. R. Ilgen, & Klimoski, R. J. (Eds). Handbook of psychology: Industrial and organizational psychology. (Vol 12. pp. 565-593). New York, NY: John Wiley & Sons, Inc.
Ostwald, S. K. (1989). Changing employees; dietary and exercise practices: an experimental study in a small company. Journal of Occupational Medicine, 31, 90-97.
Ottoson, J., & Green, L. (1987). Reconciling concept and context: Theory of Implementation. Adv Health Educ Promotion, 2, 353-382.
Parkes, K. (1993). Human factors, shift work and alertness in the offshore oil industry. Part 1 A survey of onshore and offshore control-room operators and Part 2 Alertness, sleep and cognitive performance. London: HMSO.
Parkes, K., & Clark, M. (1997). Psychosocial aspects of work and health in the North Sea oil and gas industry: Part IV The offshore environment in the mid-1990's: A survey of psychosocial factors. Sudbury: HSE Books.
Parkes, K. R. (1992). Mental health in the oil industry: A comparative study of onshore and offshore emplyees. Psychological Medicine, 22, 997-1009.
Parkes, K. R. (1994). Sleep Patterns, Shiftwork, and Individual-Differences - a Comparison of Onshore and Offshore Control-Room Operators. Ergonomics, 37(5), 827-844.
Parkes, K. R. (1998). Psychosocial aspects of stress, health and safety on North Sea installations. Scandinavian Journal of Work Environment & Health, 24(5), 321-333.
Pelletier, K. (1984). Healthy people in unhealthy places. New York: Delacorte Press.
Pender, N. (1989). Health promotion in the workplace: Suggested directions for research. American Journal of Health Promotion, 3(3), 38-43.
Peterson, M., & Dunnagan, T. (1998). Analysis of a worksite health promotion program's impact on job satisfaction. Journal of Occupational and Environmental Medicine, 40(11), 973-979.
Piirainen, H., Rasanen, K., & Kivimaki, M. (2003). Organizational climate, perceived work-related symptoms and sickness absence: A population-based survey. Journal of Occupational and Environmental Medicine, 45, 175-184.
Reason, J., Manstead, A., Stradling, S., Baxter, J., & Campbell, K. (1990). Errors and violations on the roads: a real distinction? Ergonomics, 33, 1315-1332.
Rhoades, L, & Eisenberger, R. (2002). Perceived organizational support: A review of the literature. Journal of Applied Psychology, 87, 698-714.
Rhodes, E., & Dunwoody, D. (1980). Physiological and attitudinal changes in those involved in an employee fitness program. Canadian Journal of Public Health, 71, 331-336.
Ribisl, K. M., & Reischl, T. M. (1993). Measuring the Climate for Health at Organizations - Development of the Worksite Health Climate Scales. Journal of Occupational and Environmental Medicine, 35(8), 812-824.
Riedel, J. E., Lynch, W., Baase, C., Hymel, P., & Peterson, K. W. (2001). The effect of disease prevention and health promotion on workplace productivity: A literature review. American Journal of Health Promotion, 15(3), 167-.
117
Rogot, E., Murray, J.L. (1980). Smoking and causes of death among U.S. veterans: 16 years of observation. Public Health Reports, 95, 213-222.
Rost, K., Connell, C., Schechtman, K., Barzilai, B., & Fisher, E. (1990). Predictors of employee involvement in a worksite health promotion program. Health Education Quarterly, 17, 395-407.
Rundmo, T. (1992). Risk perception and safety on offshore petroleum platforms - Part II: Perceived risk, job stress and accidents. Safety Science, 15, 53-68.
Ryan, J., Zwerling, C., & Orav, E. J. (1992). Occupational Risks Associated with Cigarette-Smoking - a Prospective-Study. American Journal of Public Health, 82(1), 29-32.
Sacks, J. J., & Nelson, D. E. (1994). Smoking and Injuries - an Overview. Preventive Medicine, 23(4), 515-520.
Saving Lives: Our Healthier Nation (1999). Presented to Parliament by the Secretary of State for Health by Command of Her Majesty.
Schneider, B. (1990). Organizational climates and cultures. San Francisco: Josey-Bass
Scottish Office Home and Health Department (1991). Health Education in Scotland: a National Policy Statement. Edinburgh, The Scottish Office.
Shaw, A., McMunn, A. and Field, J. (eds.) (2000) "The Scottish Health Survey 1998: Volume 1: Findings & Volume 2: Technical Report", Edinburgh: The Stationery Office. Also available on the survey's web site.
Sheen, J. (1987) M.V. Herald of Free Enterprise. Report of Court No. 8074. Department of Energy. London, England: HMSO.
Shephard, R. J. (1996). Worksite fitness and exercise programs: A review of methodology and health impact. American Journal of Health Promotion, 10(6), 436-452.
Shephard, R. J., Corey, P., & Cox, M. (1982). Health-Hazard Appraisal - the Influence of an Employee Fitness Program. Canadian Journal of Public Health-Revue Canadienne De Sante Publique, 73(3), 183-187.
Shipley, R., Orleans, C., & Wilbur, C. (1988). Effect of the Johnson & Johnson LIVE FOR LIFE program on employee smoking. Preventive Medicine, 17, 25-34.
Simard, M. and Marchand, A. (1994). The behaviour of first line supervisors in accident prevention and effectiveness in occupational safety, Safety Science, 17, 169-185.
Sloan, R., & Gruman, J. (1988). Participation in workplace health promotion programs: The contribution of health and organizational factors. Health Education Quarterly, 15, 269-288.
Stokols, D. (1992). Establishing and Maintaining Healthy Environments - toward a Social Ecology of Health Promotion. American Psychologist, 47(1), 6-22.
Sutherland, K., & Flin, R. (1989). Stress at sea: a review of working conditions in the offshore oil and fishing industries. Work and Stress, 3(3), 269-285.
Tomas, J. M., Melia, J. L., & Oliver, A. (1999). A cross validation of a structural equation model of accidents: organizational and psychological variables as predictors of work safety. Work and Stress, 13, 49-58.
The Control of Substances Hazardous to Health Regulations (2002). The Stationery Office Limited (ISBN 0 11 0429192). The Noise at Work Regulations 1989. Statutory Instrument (1989) No. 1790.
The Offshore Electricity and Noise Regulations 1997. Statutory Instrument (1997) No. 1993
118
Thompson, R., Hilton, T., Witt, A. (1998) Where the rubber meets the shop floor: a confirmatory model of management influence on workplace safety. Journal of Safety Research, 29, 15-24.
Terborg, J. (1986). Health promotion at the worksite. In K. Rowland & G. Ferris (Eds.), Research in Personnel and Human Resources Management. Greenwich CT: JAI Press.
Tsai, S., Bernacki, E., & Dowd, C. (1991). The relationship between work-related and non-work related injuries. Journal of Community Health, 16, 205-212.
Tsai, S., Cowles, S., & Ross, C. (1990). Smoking and morbidity frequency in a working population. Journal of Occupational Medicine, 32, 245-249.
Tunstall-Pedoe, H., Clayton, D., Morris, J. N., Brigden, W. & MacDonald, L. (1975). Coronary heart attacks in east London. Lancet, 833-838.
Verhaegen, P., Strubbe, J., Vonek, R., & Abeele, J. V. D. (1985). Absenteeism, accidents and risk taking. Journal of Occupational Accidents, 7, 177-186.
Walsh, D. C., & Egdahl, R. H. (1989). Corporate Perspectives on Work Site Wellness Programs - a Report on the 7th Pew Fellows Conference. Journal of Occupational and Environmental Medicine, 31(6), 551-556.
Watt, M. (1992). An audit of offshore medicals. Unpublished MSc Thesis, University of Aberdeen.
WHO. (1991). Targets for Health for All. The Health Policy for Europe. Copenhagen: WHO Regional Office for Europe.
WHO. (1997). The Jakarta Declaration: Leading Health Promotion into the 21st Century. Geneva: WHO.
Wilbur, C., Hartwell, T., & Piserchia, P. (1986). The Johnson and Johnson LIVE FOR LIFE Program: Its organisation and evaluation plan. In H. Cataldo & T. Coates (Eds.), Health and Industry: A Behavioural Medical Perspective (pp. 338-350). New York: John Wiley and Sons.
Zohar, D. (1980). Safety climate in industrial organisations: theoretical and applied implications. Journal of Applied Psychology, 65, 96-102.
119

1
Appendix I HEALTH AT WORK QUESTIONNAIRE 2002
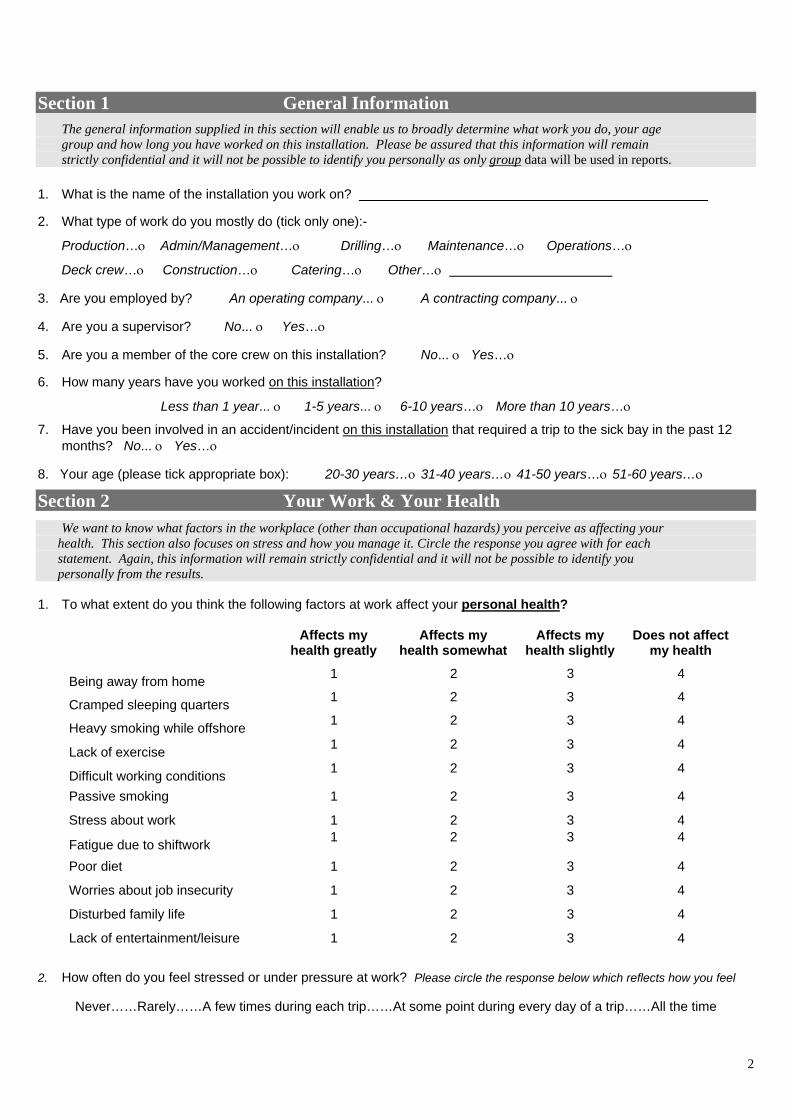
2
Section 1 General Information
The general information supplied in this section will enable us to broadly determine what work you do, your age group and how long you have worked on this installation. Please be assured that this information will remain strictly confidential and it will not be possible to identify you personally as only group data will be used in reports. 1. What is the name of the installation you work on?
2. What type of work do you mostly do (tick only one):-
Production…ο Admin/Management…ο Drilling…ο Maintenance…ο Operations…ο
Deck crew…ο Construction…ο Catering…ο Other…ο
3. Are you employed by? An operating company... ο A contracting company... ο
4. Are you a supervisor? No... ο Yes…ο
5.
6.
Are you a member of the core crew on this installation? No... ο Yes…ο
How many years have you worked on this installation?
Less than 1 year... ο 1-5 years... ο 6-10 years…ο More than 10 years…ο
7. Have you been involved in an accident/incident on this installation that required a trip to the sick bay in the past 12 months? No... ο Yes…ο
8. Your age (please tick appropriate box): 20-30 years…ο 31-40 years…ο 41-50 years…ο 51-60 years…ο
Section 2 Your Work & Your Health
We want to know what factors in the workplace (other than occupational hazards) you perceive as affecting your health. This section also focuses on stress and how you manage it. Circle the response you agree with for each statement. Again, this information will remain strictly confidential and it will not be possible to identify you personally from the results. 1. To what extent do you think the following factors at work affect your personal health?
Affects my health greatly
Affects my health somewhat
Affects my health slightly
Does not affect my health
Being away from home 1 2 3 4
Cramped sleeping quarters 1 2 3 4
Heavy smoking while offshore 1 2
4
3 4
Lack of exercise 1 2 3 4
Difficult working conditions 1 2 3 4
Passive smoking 1 2 3 4
Stress about work 1 2 3 4
Fatigue due to shiftwork 1 2 3 4
Poor diet 1 2 3
Worries about job insecurity 1 2 3 4
Disturbed family life 1 2 3 4
Lack of entertainment/leisure 1 2 3 4
2. How often do you feel stressed or under pressure at work? Please circle the response below which reflects how you feel
Never……Rarely……A few times during each trip……At some point during every day of a trip……All the time
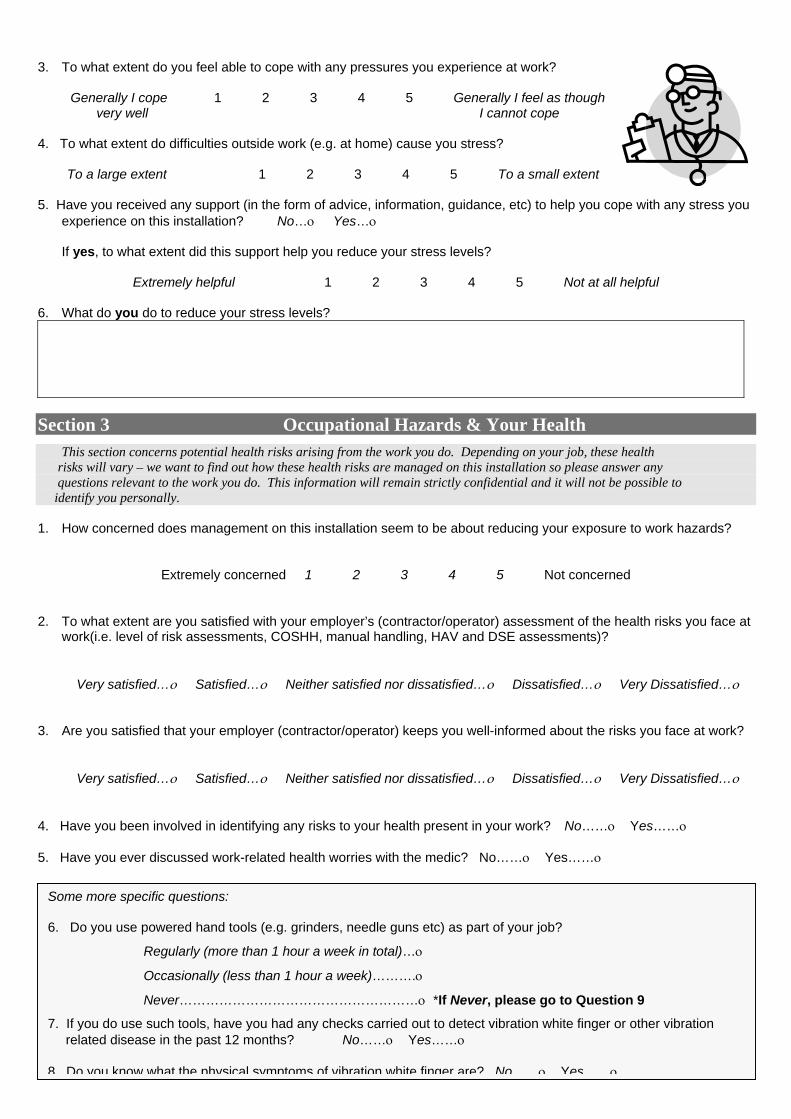
3
3. To what extent do you feel able to cope with any pressures you experience at work?
Generally I cope 1 2 3 4 5 Generally I feel as though very well I cannot cope
4. To what extent do difficulties outside work (e.g. at home) cause you stress?
To a large extent 1 2 3 4 5 To a small extent 5. Have you received any support (in the form of advice, information, guidance, etc) to help you cope with any stress you
experience on this installation? No…ο Yes…ο
If yes, to what extent did this support help you reduce your stress levels?
Extremely helpful 1 2 3 4 5 Not at all helpful 6. What do you do to reduce your stress levels?
Section 3 Occupational Hazards & Your Health
This section concerns potential health risks arising from the work you do. Depending on your job, these health risks will vary – we want to find out how these health risks are managed on this installation so please answer any questions relevant to the work you do. This information will remain strictly confidential and it will not be possible to identify you personally. 1. How concerned does management on this installation seem to be about reducing your exposure to work hazards?
Extremely concerned 1 2 3 4 5 Not concerned
2. To what extent are you satisfied with your employer’s (contractor/operator) assessment of the health risks you face at work(i.e. level of risk assessments, COSHH, manual handling, HAV and DSE assessments)?
Very satisfied…ο Satisfied…ο Neither satisfied nor dissatisfied…ο Dissatisfied…ο Very Dissatisfied…ο
3. Are you satisfied that your employer (contractor/operator) keeps you well-informed about the risks you face at work?
Very satisfied…ο Satisfied…ο Neither satisfied nor dissatisfied…ο Dissatisfied…ο Very Dissatisfied…ο
4. Have you been involved in identifying any risks to your health present in your work? No……ο Yes……ο 5. Have you ever discussed work-related health worries with the medic? No……ο Yes……ο
Some more specific questions:
6. Do you use powered hand tools (e.g. grinders, needle guns etc) as part of your job?
Regularly (more than 1 hour a week in total)…ο
Occasionally (less than 1 hour a week)……….ο
Never………………………………………………ο *If Never, please go to Question 9
7. If you do use such tools, have you had any checks carried out to detect vibration white finger or other vibration related disease in the past 12 months? No……ο Yes……ο
8 Do you know what the physical symptoms of vibration white finger are? No ο Yes ο
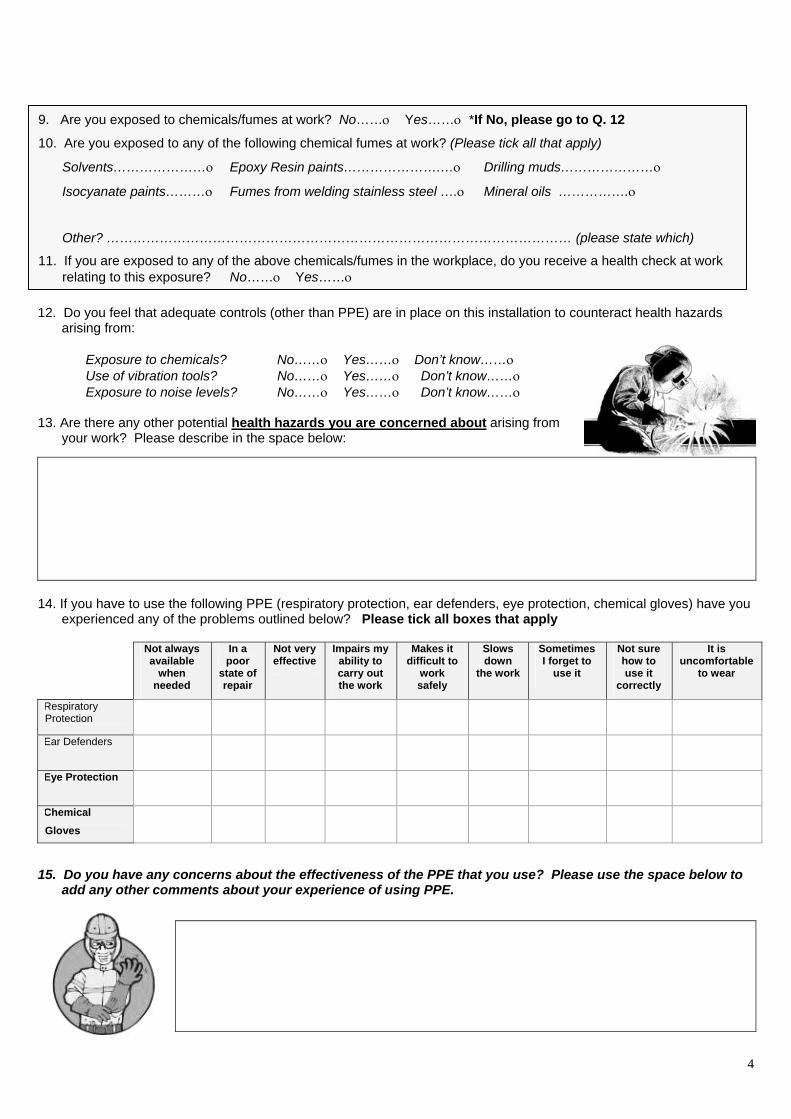
10. Are you exposed to any of the following chemical fumes at work? (Please tick all that apply)
Solvents…………………ο Epoxy Resin paints………………….…ο Drilling muds…………………ο
Isocyanate paints………ο Fumes from welding stainless steel ….ο Mineral oils …………….ο
Other? …………………………………………………………………………………………… (please state which)
11. If you are exposed to any of the above chemicals/fumes in the workplace, do you receive a health check at work relating to this exposure? No……ο Yes……ο
4
12. Do you feel that adequate controls (other than PPE) are in place on this installation to counteract health hazards
arising from:
Exposure to chemicals? No……ο Yes……ο Don’t know……ο Use of vibration tools? No……ο Yes……ο Don’t know……ο Exposure to noise levels? No……ο Yes……ο Don’t know……ο
13. Are there any other potential health hazards you are concerned about arising from
your work? Please describe in the space below:
14. If you have to use the following PPE (respiratory protection, ear defenders, eye protection, chemical gloves) have you
experienced any of the problems outlined below? Please tick all boxes that apply
Not always available
when needed
In a poor
state of repair
Not very effective
Impairs my ability to carry out the work
Makes it difficult to
work safely
Slows down
the work
Sometimes I forget to
use it
Not sure how to use it
correctly
It is uncomfortable
to wear
Respiratory Protection
Ear Defenders
Eye Protection
Chemical Gloves
15. Do you have any concerns about the effectiveness of the PPE that you use? Please use the space below to add any other comments about your experience of using PPE.
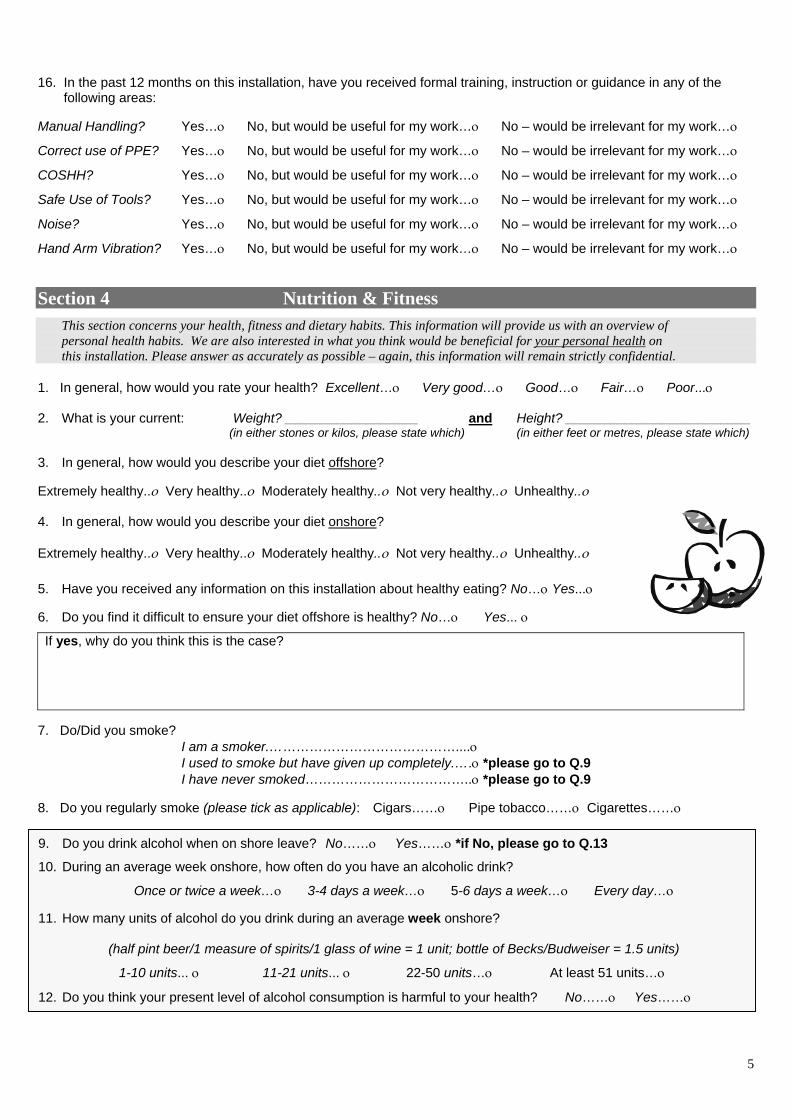
16. In the past 12 months on this installation, have you received formal training, instruction or guidance in any of the
following areas: Manual Handling? Yes…ο No, but would be useful for my work…ο No – would be irrelevant for my work…ο
Correct use of PPE? Yes…ο No, but would be useful for my work…ο No – would be irrelevant for my work…ο
COSHH? Yes…ο No, but would be useful for my work…ο No – would be irrelevant for my work…ο
Safe Use of Tools? Yes…ο No, but would be useful for my work…ο No – would be irrelevant for my work…ο
Noise? Yes…ο No, but would be useful for my work…ο No – would be irrelevant for my work…ο
Hand Arm Vibration? Yes…ο No, but would be useful for my work…ο No – would be irrelevant for my work…ο
Section 4 Nutrition & Fitness
This section concerns your health, fitness and dietary habits. This information will provide us with an overview of personal health habits. We are also interested in what you think would be beneficial for your personal health on this installation. Please answer as accurately as possible – again, this information will remain strictly confidential.
1. In general, how would you rate your health? Excellent…ο Very good…ο Good…ο Fair…ο Poor...ο 2. What is your current: Weight? __________________ and Height? _________________________
(in either stones or kilos, please state which) (in either feet or metres, please state which) 3. In general, how would you describe your diet offshore? Extremely healthy..ο Very healthy..ο Moderately healthy..ο Not very healthy..ο Unhealthy..ο 4. In general, how would you describe your diet onshore? Extremely healthy..ο Very healthy..ο Moderately healthy..ο Not very healthy..ο Unhealthy..ο
5. Have you received any information on this installation about healthy eating? No…ο Yes...ο
6. Do you find it difficult to ensure your diet offshore is healthy? No…ο Yes... ο
If yes, why do you think this is the case?
7. Do/Did you smoke?
I am a smoker.……………………………………....ο I used to smoke but have given up completely.….ο *please go to Q.9 I have never smoked………………………………..ο *please go to Q.9
8. Do you regularly smoke (please tick as applicable): Cigars……ο Pipe tobacco……ο Cigarettes……ο
9.
10.
11.
12.
Do you drink alcohol when on shore leave? No……ο Yes……ο *if No, please go to Q.13
During an average week onshore, how often do you have an alcoholic drink?
Once or twice a week…ο 3-4 days a week…ο 5-6 days a week…ο Every day…ο
How many units of alcohol do you drink during an average week onshore?
(half pint beer/1 measure of spirits/1 glass of wine = 1 unit; bottle of Becks/Budweiser = 1.5 units)
1-10 units... ο 11-21 units... ο 22-50 units…ο At least 51 units…ο
Do you think your present level of alcohol consumption is harmful to your health? No……ο Yes……ο
5
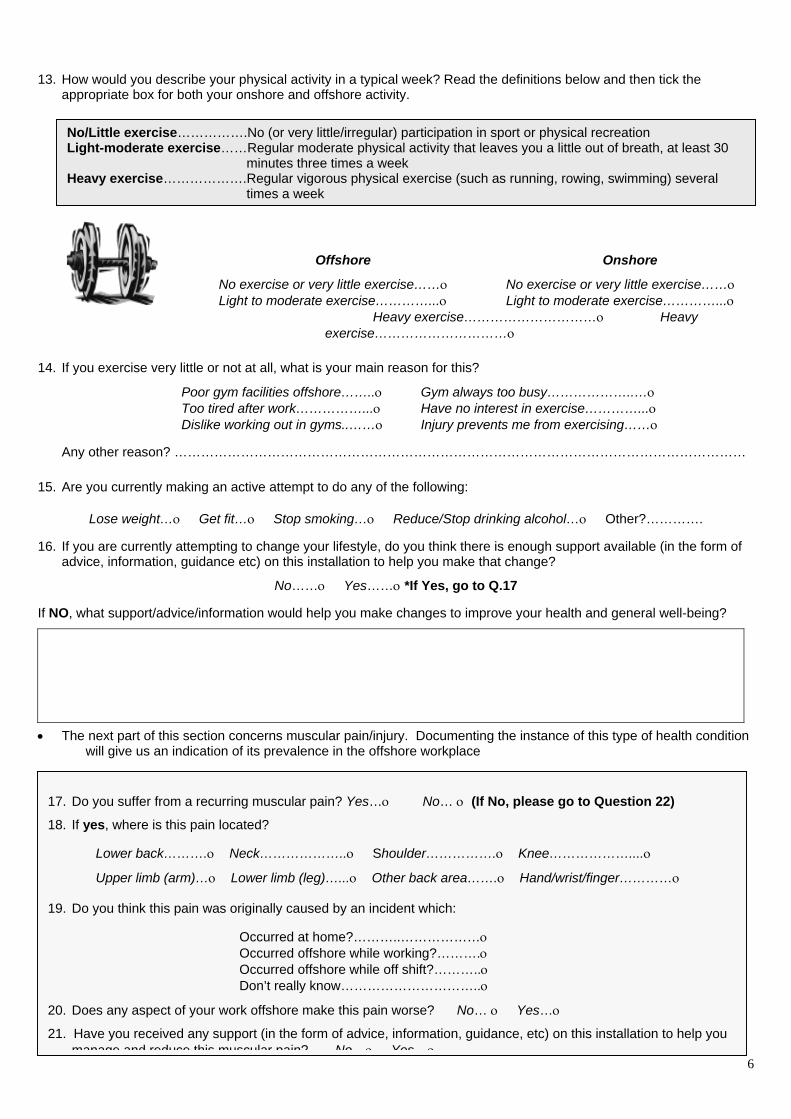
13. How would you describe your physical activity in a typical week? Read the definitions below and then tick the
appropriate box for both your onshore and offshore activity.
14.
15.
16.
If NO
•
No/Little exercise…………….No (or very little/irregular) participation in sport or physical recreation Light-moderate exercise……Regular moderate physical activity that leaves you a little out of breath, at least 30
minutes three times a week Heavy exercise……………….Regular vigorous physical exercise (such as running, rowing, swimming) several
times a week
6
Offshore Onshore
No exercise or very little exercise……ο No exercise or very little exercise……ο Light to moderate exercise…………...ο Light to moderate exercise…………...ο
Heavy exercise…………………………ο Heavy exercise…………………………ο
If you exercise very little or not at all, what is your main reason for this?
Poor gym facilities offshore……..ο Gym always too busy………………..…ο Too tired after work……………...ο Have no interest in exercise…………...ο Dislike working out in gyms..……ο Injury prevents me from exercising……ο
Any other reason? …………………………………………………………………………………………………………………
Are you currently making an active attempt to do any of the following:
Lose weight…ο Get fit…ο Stop smoking…ο Reduce/Stop drinking alcohol…ο Other?………….
If you are currently attempting to change your lifestyle, do you think there is enough support available (in the form of advice, information, guidance etc) on this installation to help you make that change?
No……ο Yes……ο *If Yes, go to Q.17
, what support/advice/information would help you make changes to improve your health and general well-being?
The next part of this section concerns muscular pain/injury. Documenting the instance of this type of health condition will give us an indication of its prevalence in the offshore workplace
17. Do you suffer from a recurring muscular pain? Yes…ο No… ο (If No, please go to Question 22)
18. If yes, where is this pain located? Lower back……….ο Neck………………..ο Shoulder…………….ο Knee………………....ο
Upper limb (arm)…ο Lower limb (leg)…...ο Other back area…….ο Hand/wrist/finger…………ο
19. Do you think this pain was originally caused by an incident which:
Occurred at home?………..………………ο Occurred offshore while working?……….ο Occurred offshore while off shift?………..ο Don’t really know…………………………..ο
20. Does any aspect of your work offshore make this pain worse? No… ο Yes…ο
21. Have you received any support (in the form of advice, information, guidance, etc) on this installation to help you manage and reduce this muscular pain? No ο Yes ο
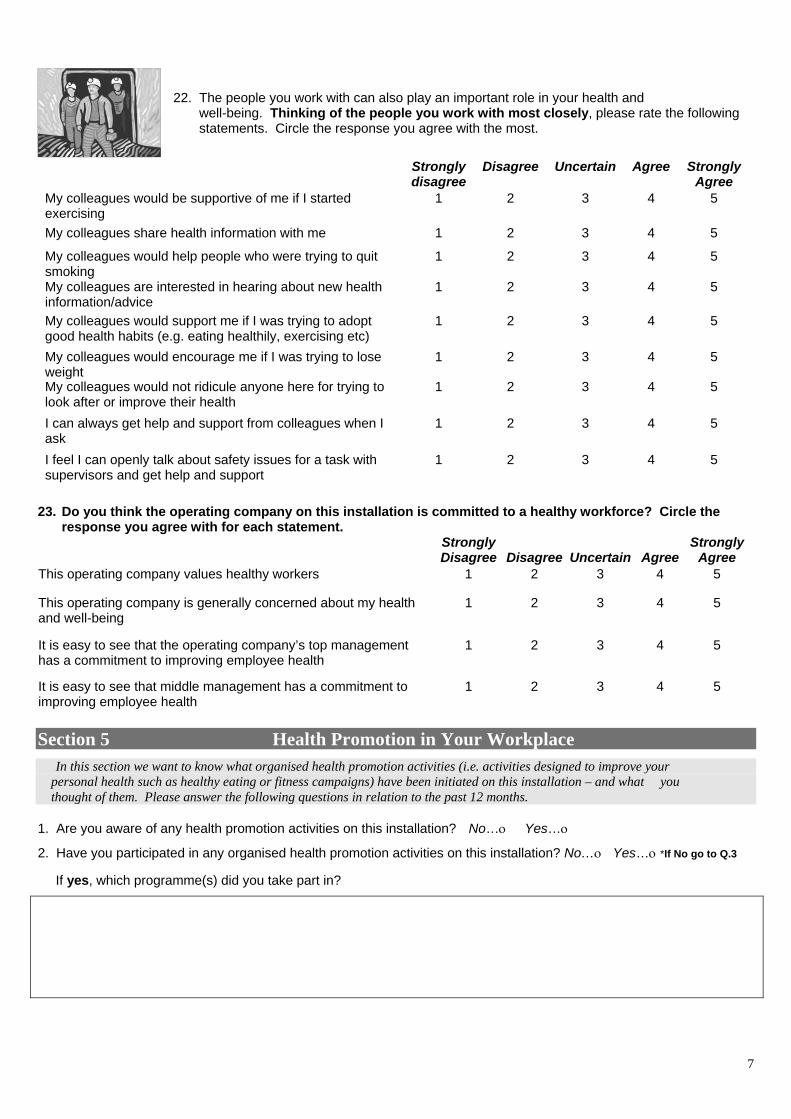
7
22. The people you work with can also play an important role in your health and well-being. Thinking of the people you work with most closely, please rate the following statements. Circle the response you agree with the most.
Strongly disagree
Disagree Uncertain Agree Strongly Agree
My colleagues would be supportive of me if I started exercising
1 2 3 4 5
My colleagues share health information with me 1 2 3 4 5
My colleagues would help people who were trying to quit smoking
1 2 3 4 5
My colleagues are interested in hearing about new health information/advice
1 2 3 4 5
My colleagues would support me if I was trying to adopt good health habits (e.g. eating healthily, exercising etc)
1 2 3 4 5
My colleagues would encourage me if I was trying to lose weight
1 2 3 4 5
My colleagues would not ridicule anyone here for trying to look after or improve their health
1 2 3 4 5
I can always get help and support from colleagues when I ask
1 2 3 4 5
I feel I can openly talk about safety issues for a task with supervisors and get help and support
1 2 3 4 5
23. Do you think the operating company on this installation is committed to a healthy workforce? Circle the
response you agree with for each statement. Strongly
Disagree
Disagree
Uncertain
AgreeStrongly
Agree This operating company values healthy workers 1 2 3 4 5
This operating company is generally concerned about my health and well-being
1 2 3 4 5
It is easy to see that the operating company’s top management has a commitment to improving employee health
1 2 3 4 5
It is easy to see that middle management has a commitment to improving employee health
1 2 3 4 5
Section 5 Health Promotion in Your Workplace
In this section we want to know what organised health promotion activities (i.e. activities designed to improve your personal health such as healthy eating or fitness campaigns) have been initiated on this installation – and what you thought of them. Please answer the following questions in relation to the past 12 months. 1. Are you aware of any health promotion activities on this installation? No…ο Yes…ο
2. Have you participated in any organised health promotion activities on this installation? No…ο Yes…ο *If No go to Q.3
If yes, which programme(s) did you take part in?
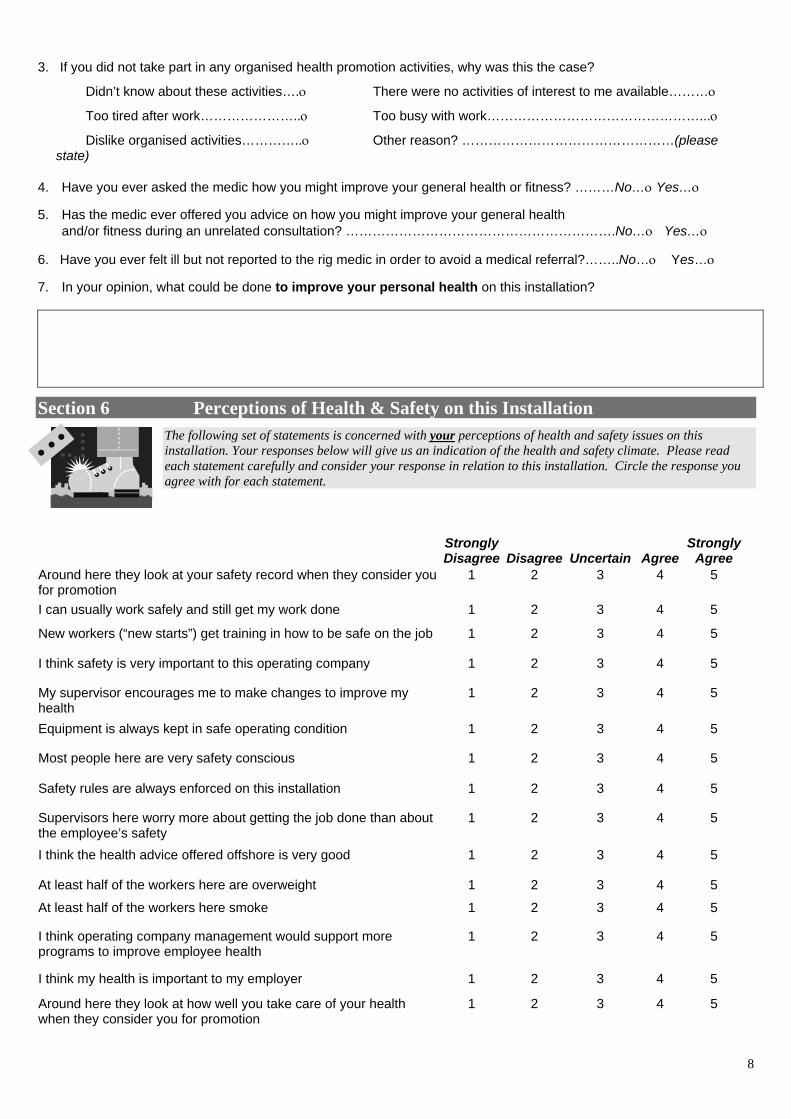
8
3. If you did not take part in any organised health promotion activities, why was this the case?
Didn’t know about these activities….ο There were no activities of interest to me available………ο
Too tired after work…………………..ο Too busy with work…………………………………………...ο
Dislike organised activities…………..ο Other reason? …………………………………………(please state)
4. Have you ever asked the medic how you might improve your general health or fitness? ………No…ο Yes…ο 5. Has the medic ever offered you advice on how you might improve your general health and/or fitness during an unrelated consultation? …………………………………………………….No…ο Yes…ο 6. Have you ever felt ill but not reported to the rig medic in order to avoid a medical referral?……..No…ο Yes…ο 7. In your opinion, what could be done to improve your personal health on this installation?
Section 6 Perceptions of Health & Safety on this Installation
The following set of statements is concerned with your perceptions of health and safety issues on this installation. Your responses below will give us an indication of the health and safety climate. Please read each statement carefully and consider your response in relation to this installation. Circle the response you agree with for each statement.
StronglyDisagree
Disagree
Uncertain
Agree
StronglyAgree
Around here they look at your safety record when they consider you for promotion
1 2 3 4 5
I can usually work safely and still get my work done 1 2 3 4 5
2
Safety rules are always enforced on this installation
5
New workers (“new starts”) get training in how to be safe on the job
1 2 3 4 5
I think safety is very important to this operating company
1 2 3 4 5
My supervisor encourages me to make changes to improve my health
1 3 4 5
Equipment is always kept in safe operating condition
1 2 3 4 5
Most people here are very safety conscious
1 2 3 4 5
1 2 3 4 5
Supervisors here worry more about getting the job done than about the employee’s safety
1 2 3 4 5
I think the health advice offered offshore is very good 1 2 3 4 5
At least half of the workers here are overweight 1 2 3 4 5
At least half of the workers here smoke 1 2 3 4 5
I think operating company management would support more programs to improve employee health
1 2 3 4
I think my health is important to my employer 1 2 3 4 5
Around here they look at how well you take care of your health when they consider you for promotion
1 2 3 4 5
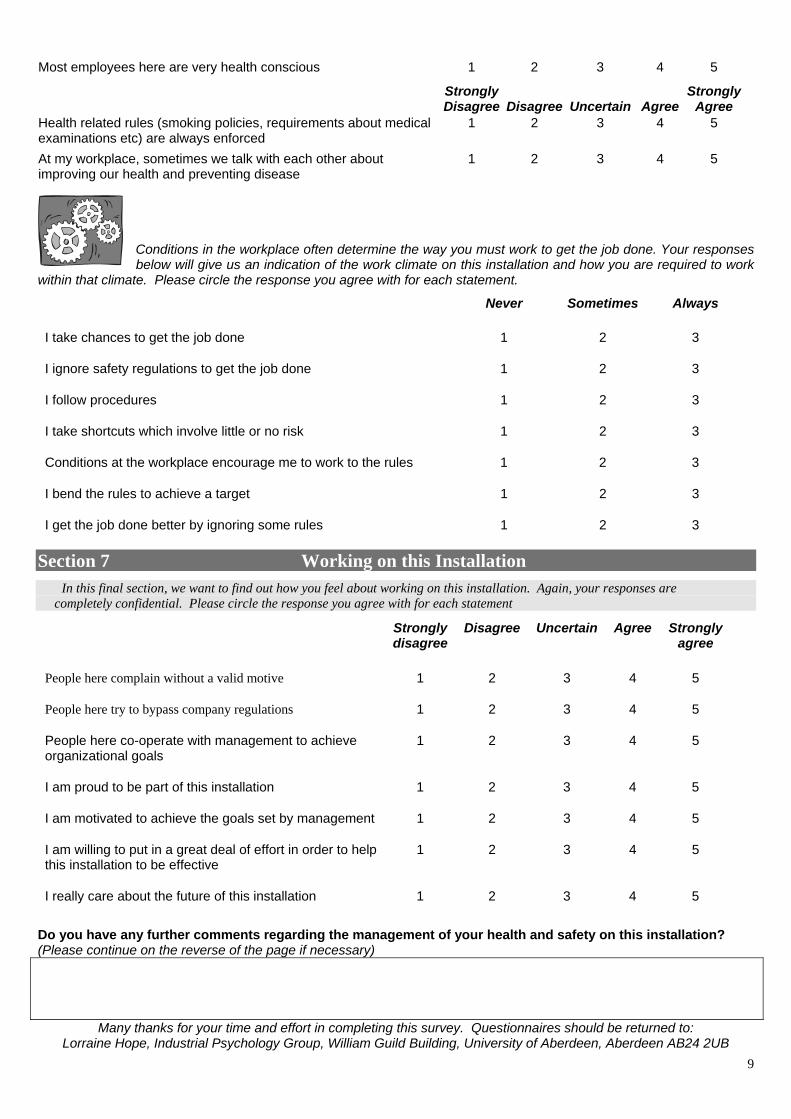
9
Most employees here are very health conscious 1 2 3 4 5
StronglyDisagree
Disagree
Uncertain
Agree
StronglyAgree
Health related rules (smoking policies, requirements about medical examinations etc) are always enforced
1 2 3 4 5
1
At my workplace, sometimes we talk with each other about improving our health and preventing disease
1 2 3 4 5
Conditions in the workplace often determine the way you must work to get the job done. Your responses below will give us an indication of the work climate on this installation and how you are required to work
within that climate. Please circle the response you agree with for each statement.
Never Sometimes Always
I take chances to get the job done 1 2 3
I ignore safety regulations to get the job done 1 2 3
I follow procedures 1 2 3
I take shortcuts which involve little or no risk 1 2 3
Conditions at the workplace encourage me to work to the rules 1 2 3
I bend the rules to achieve a target 2 3
I get the job done better by ignoring some rules 1 2 3
Section 7 Working on this Installation
In this final section, we want to find out how you feel about working on this installation. Again, your responses are completely confidential. Please circle the response you agree with for each statement
Strongly disagree
Disagree Uncertain Agree Strongly agree
People here complain without a valid motive 1 2 3 4 5
People here try to bypass company regulations 1 2 3 4 5
People here co-operate with management to achieve organizational goals
1 2 3 4 5
I am proud to be part of this installation 1 2 3 4 5
I am motivated to achieve the goals set by management 1 2 3 4 5
I am willing to put in a great deal of effort in order to help this installation to be effective
4
5
1 2 3 5
I really care about the future of this installation 1 2 3 4
Do you have any further comments regarding the management of your health and safety on this installation? (Please continue on the reverse of the page if necessary)
Many thanks for your time and effort in completing this survey. Questionnaires should be returned to: Lorraine Hope, Industrial Psychology Group, William Guild Building, University of Aberdeen, Aberdeen AB24 2UB

10
Appendix II HEALTH AT WORK QUESTIONNAIRE
FOR MEDICS 2002
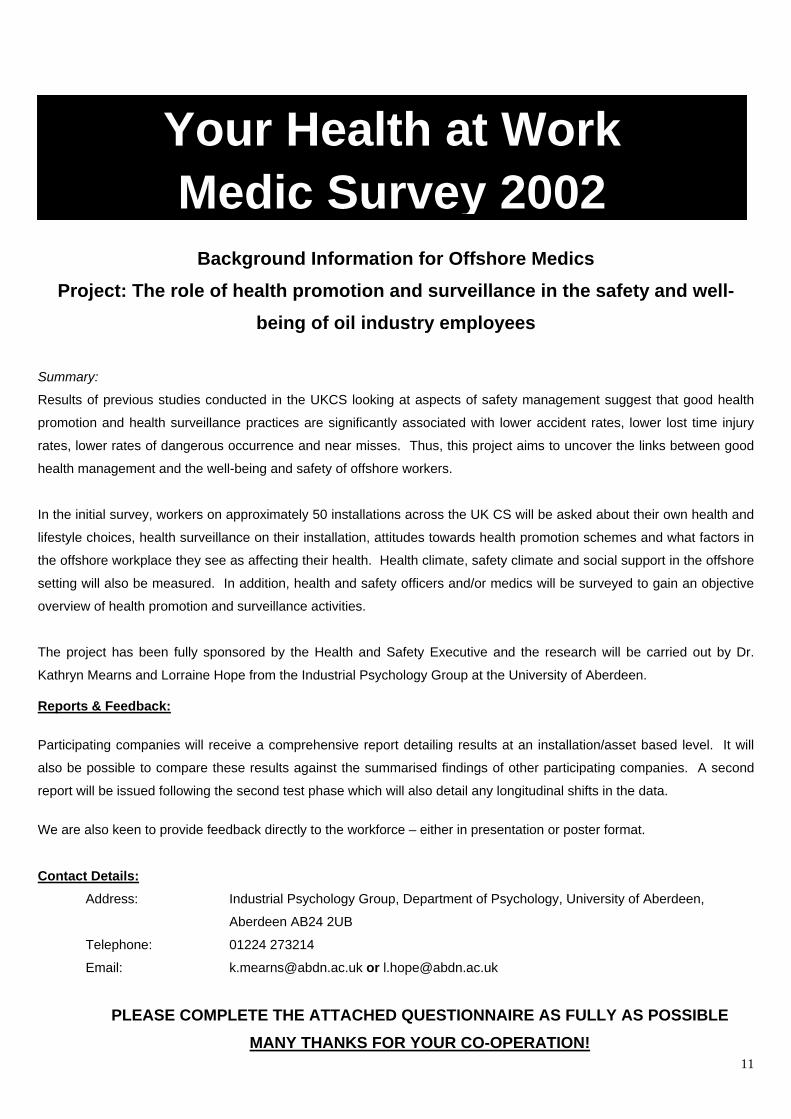
Project: Th
Summary:
Results of previous
promotion and heal
rates, lower rates of
health management
In the initial survey,
lifestyle choices, hea
the offshore workpla
setting will also be m
overview of health p
The project has bee
Kathryn Mearns and
Reports & Feedbac
Participating compa
also be possible to
report will be issued
We are also keen to
Contact Details:
Address:
Telephone:
Email:
PLEAS
Your Health at Work Medic Survey 2002
11
Background Information for Offshore Medics e role of health promotion and surveillance in the safety and well-
being of oil industry employees
studies conducted in the UKCS looking at aspects of safety management suggest that good health
th surveillance practices are significantly associated with lower accident rates, lower lost time injury
dangerous occurrence and near misses. Thus, this project aims to uncover the links between good
and the well-being and safety of offshore workers.
workers on approximately 50 installations across the UK CS will be asked about their own health and
lth surveillance on their installation, attitudes towards health promotion schemes and what factors in
ce they see as affecting their health. Health climate, safety climate and social support in the offshore
easured. In addition, health and safety officers and/or medics will be surveyed to gain an objective
romotion and surveillance activities.
n fully sponsored by the Health and Safety Executive and the research will be carried out by Dr.
Lorraine Hope from the Industrial Psychology Group at the University of Aberdeen.
k:
nies will receive a comprehensive report detailing results at an installation/asset based level. It will
compare these results against the summarised findings of other participating companies. A second
following the second test phase which will also detail any longitudinal shifts in the data.
provide feedback directly to the workforce – either in presentation or poster format.
Industrial Psychology Group, Department of Psychology, University of Aberdeen,
Aberdeen AB24 2UB
01224 273214
[email protected] or [email protected]
E COMPLETE THE ATTACHED QUESTIONNAIRE AS FULLY AS POSSIBLE MANY THANKS FOR YOUR CO-OPERATION!

12
Section 1 General Information The general information supplied in this section will enable us to broadly determine what work you do on this installation in
addition to your role as medic. Also, we are interested in your opinion of the health risks facing the offshore workforce.
1. Name of installation: _______________________________________________________________________
2. Are you directly employed by? The operating company... ο A medical agency... ο
3. Do you have any roles other than that of medic? Yes…ο No... ο
4. Please describe any other roles you have on this installation:
5. What proportion of your time do these other roles entail? (circle as appropriate)
10% 20% 30% 40% 50% 60% 70% 80% 90%
6. How many years have you worked offshore as a medic?
Less than 1 year... ο 1-5 years... ο 6-10 years…ο More than 10 years…ο
7. How many years have you worked as a medic on this installation?
Less than 1 year... ο 1-5 years... ο 6-10 years…ο More than 10 years…ο
8. As a medical professional, what do you think are the main occupational health risks for workers on this installation?
9. As a medical professional, what do you think are the main general health risks workers on this installation (unrelated
to particular occupational conditions)?
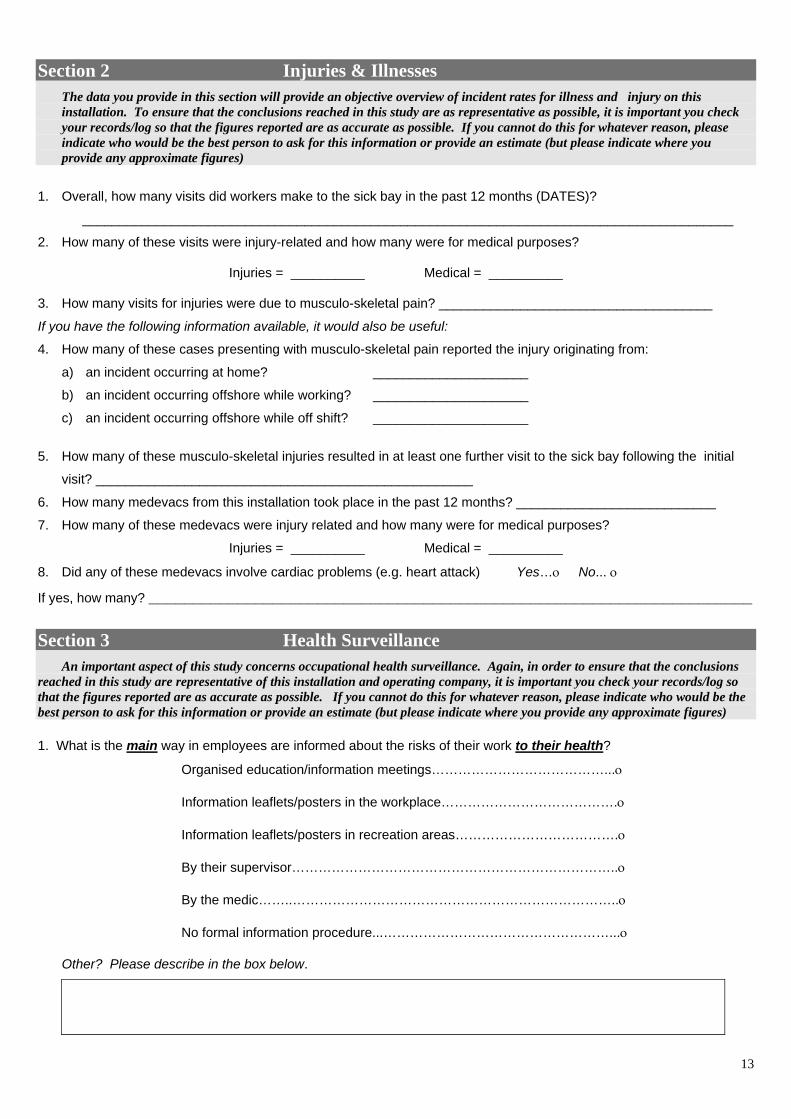
13
Section 2 Injuries & Illnesses The data you provide in this section will provide an objective overview of incident rates for illness and injury on this
installation. To ensure that the conclusions reached in this study are as representative as possible, it is important you check your records/log so that the figures reported are as accurate as possible. If you cannot do this for whatever reason, please indicate who would be the best person to ask for this information or provide an estimate (but please indicate where you provide any approximate figures)
1. Overall, how many visits did workers make to the sick bay in the past 12 months (DATES)?
________________________________________________________________________________________
2. How many of these visits were injury-related and how many were for medical purposes?
Injuries = __________ Medical = __________
3. How many visits for injuries were due to musculo-skeletal pain? _____________________________________
If you have the following information available, it would also be useful:
4. How many of these cases presenting with musculo-skeletal pain reported the injury originating from:
a) an incident occurring at home? _____________________
b) an incident occurring offshore while working? _____________________
c) an incident occurring offshore while off shift? _____________________
5. How many of these musculo-skeletal injuries resulted in at least one further visit to the sick bay following the initial
visit? ___________________________________________________
6. How many medevacs from this installation took place in the past 12 months? ___________________________
7. How many of these medevacs were injury related and how many were for medical purposes?
Injuries = __________ Medical = __________
8. Did any of these medevacs involve cardiac problems (e.g. heart attack) Yes…ο No... ο
If yes, how many? ____________________________________________________________________
Section 3 Health Surveillance An important aspect of this study concerns occupational health surveillance. Again, in order to ensure that the conclusions reached in this study are representative of this installation and operating company, it is important you check your records/log so that the figures reported are as accurate as possible. If you cannot do this for whatever reason, please indicate who would be the best person to ask for this information or provide an estimate (but please indicate where you provide any approximate figures)
1. What is the main way in employees are informed about the risks of their work to their health?
Organised education/information meetings…………………………………...ο
Information leaflets/posters in the workplace………………………………….ο
Information leaflets/posters in recreation areas……………………………….ο
By their supervisor………………………………………………………………..ο
By the medic……..………………………………………………………………..ο
No formal information procedure...……………………………………………...ο
Other? Please describe in the box below.
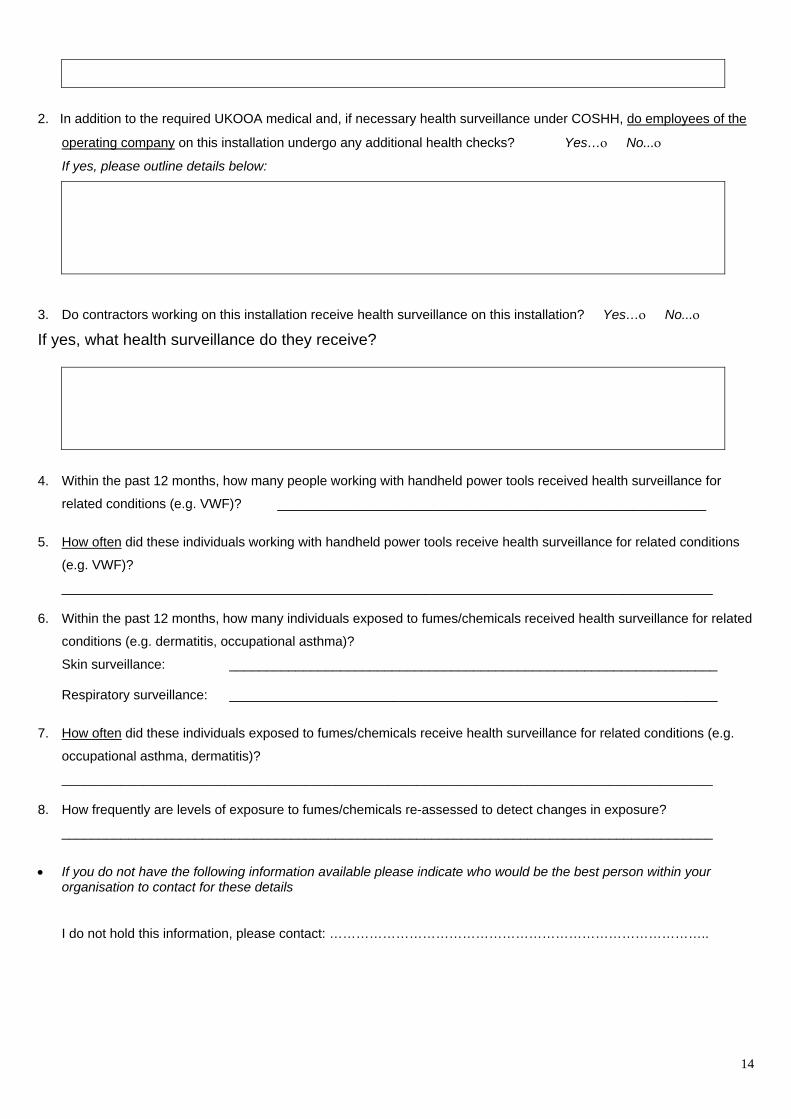
14
2. In addition to the required UKOOA medical and, if necessary health surveillance under COSHH, do employees of the
operating company on this installation undergo any additional health checks? Yes…ο No...ο
If yes, please outline details below:
3. Do contractors working on this installation receive health surveillance on this installation? Yes…ο No...ο
If yes, what health surveillance do they receive?
4. Within the past 12 months, how many people working with handheld power tools received health surveillance for
related conditions (e.g. VWF)? __________________________________________________________
5. How often did these individuals working with handheld power tools receive health surveillance for related conditions
(e.g. VWF)?
________________________________________________________________________________________
6. Within the past 12 months, how many individuals exposed to fumes/chemicals received health surveillance for related
conditions (e.g. dermatitis, occupational asthma)?
Skin surveillance: __________________________________________________________________ Respiratory surveillance: __________________________________________________________________
7. How often did these individuals exposed to fumes/chemicals receive health surveillance for related conditions (e.g.
occupational asthma, dermatitis)?
________________________________________________________________________________________
8. How frequently are levels of exposure to fumes/chemicals re-assessed to detect changes in exposure?
________________________________________________________________________________________
• If you do not have the following information available please indicate who would be the best person within your
organisation to contact for these details
I do not hold this information, please contact: …………………………………………………………………………..
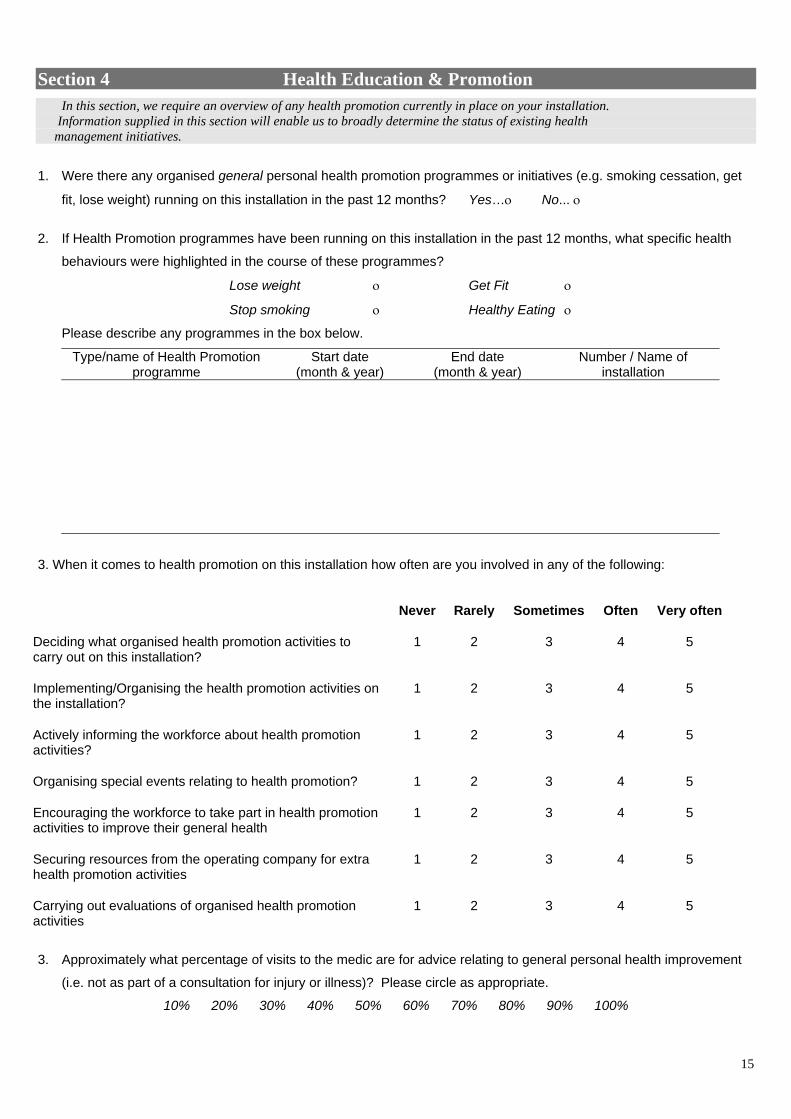
15
Section 4 Health Education & Promotion
In this section, we require an overview of any health promotion currently in place on your installation. Information supplied in this section will enable us to broadly determine the status of existing health management initiatives.
1. Were there any organised general personal health promotion programmes or initiatives (e.g. smoking cessation, get
fit, lose weight) running on this installation in the past 12 months? Yes…ο No... ο
2. If Health Promotion programmes have been running on this installation in the past 12 months, what specific health
behaviours were highlighted in the course of these programmes?
Lose weight ο Get Fit ο
Stop smoking ο Healthy Eating ο
Please describe any programmes in the box below.
Type/name of Health Promotion programme
Start date (month & year)
End date (month & year)
Number / Name of installation
3. When it comes to health promotion on this installation how often are you involved in any of the following:
Never Rarely Sometimes Often Very often
Deciding what organised health promotion activities to carry out on this installation?
1 2 3 4 5
Implementing/Organising the health promotion activities on the installation?
1 2 3 4 5
Actively informing the workforce about health promotion activities?
1 2 3 4 5
Organising special events relating to health promotion? 1 2 3 4 5
Encouraging the workforce to take part in health promotion activities to improve their general health
1 2 3 4 5
Securing resources from the operating company for extra health promotion activities
1 2 3 4 5
Carrying out evaluations of organised health promotion activities
1 2 3 4 5
3. Approximately what percentage of visits to the medic are for advice relating to general personal health improvement
(i.e. not as part of a consultation for injury or illness)? Please circle as appropriate.
10% 20% 30% 40% 50% 60% 70% 80% 90% 100%
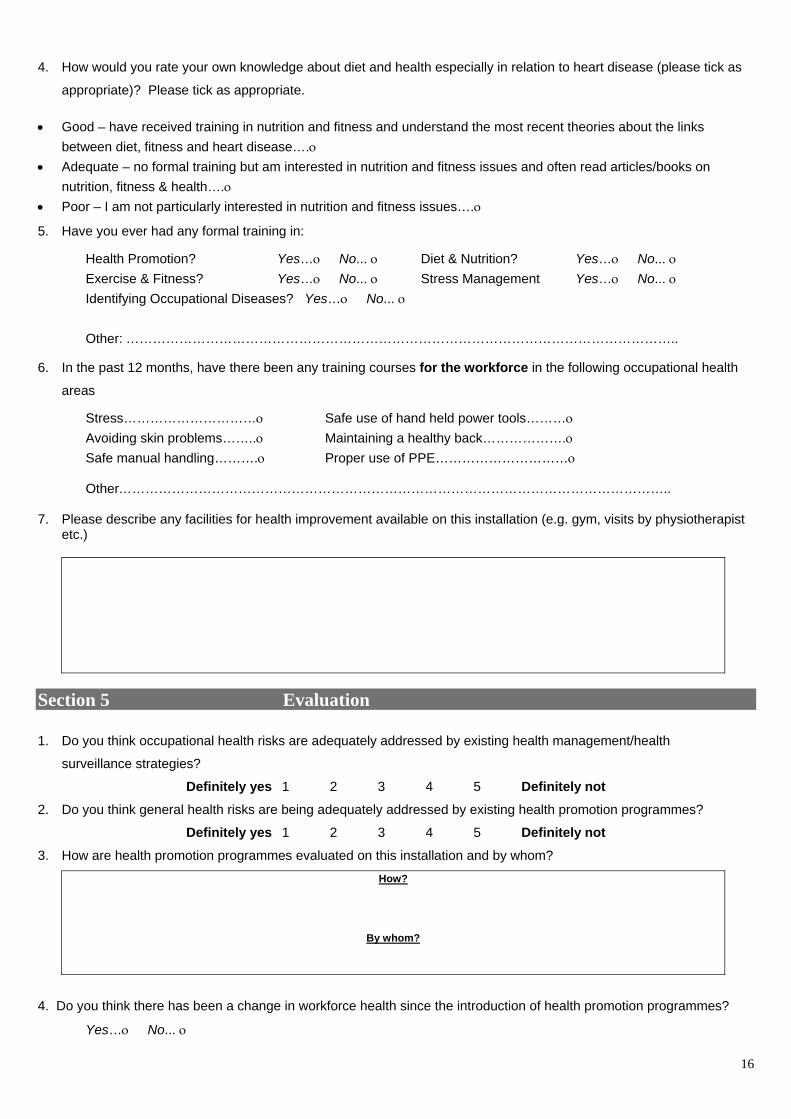
16
4. How would you rate your own knowledge about diet and health especially in relation to heart disease (please tick as
appropriate)? Please tick as appropriate.
• Good – have received training in nutrition and fitness and understand the most recent theories about the links between diet, fitness and heart disease….ο
• Adequate – no formal training but am interested in nutrition and fitness issues and often read articles/books on nutrition, fitness & health….ο
• Poor – I am not particularly interested in nutrition and fitness issues….ο
5. Have you ever had any formal training in:
Health Promotion? Yes…ο No... ο Diet & Nutrition? Yes…ο No... ο Exercise & Fitness? Yes…ο No... ο Stress Management Yes…ο No... ο Identifying Occupational Diseases? Yes…ο No... ο
Other: ……………………………………………………………………………………………………………..
6. In the past 12 months, have there been any training courses for the workforce in the following occupational health
areas
Stress…………………………ο Safe use of hand held power tools………ο Avoiding skin problems……..ο Maintaining a healthy back……………….ο Safe manual handling……….ο Proper use of PPE…………………………ο Other……………………………………………………………………………………………………………..
7. Please describe any facilities for health improvement available on this installation (e.g. gym, visits by physiotherapist
etc.)
Section 5 Evaluation
1. Do you think occupational health risks are adequately addressed by existing health management/health
surveillance strategies?
Definitely yes 1 2 3 4 5 Definitely not 2. Do you think general health risks are being adequately addressed by existing health promotion programmes?
Definitely yes 1 2 3 4 5 Definitely not 3. How are health promotion programmes evaluated on this installation and by whom?
How?
By whom?
4. Do you think there has been a change in workforce health since the introduction of health promotion programmes?
Yes…ο No... ο
17
Please give reasons for your answer:
5. Do you think the workforce on this installation would be (or are already) receptive to health promotion programmes?
Definitely yes 1 2 3 4 5 Definitely not
6 Has this installation received any awards for health promotion activities? Please give full details in the box below.
Title of award When awarded? Is this installation currently entered for any health awards? If yes, please state which?
7. Overall, how committed do you think this operating company is to improving the health of the workforce on this
installation?
Strongly committed 1 2 3 4 5 Not at all committed
Any further comments?

Printed and published by the Health and Safety ExecutiveC30 1/98
Printed and published by the Health and Safety ExecutiveC0.06 04/05

RR 305
£20.00 9 78071 7 629930
ISBN 0-7176-2993-7


![Journal of Hospitality & Tourism Research-2009-Lee-305-28[1] (1)](https://img.pdfslide.us/doc/110x75/577cc8721a28aba711a2d8d8/journal-of-hospitality-tourism-research-2009-lee-305-281-1.jpg)