Embed Size (px)
Citation preview
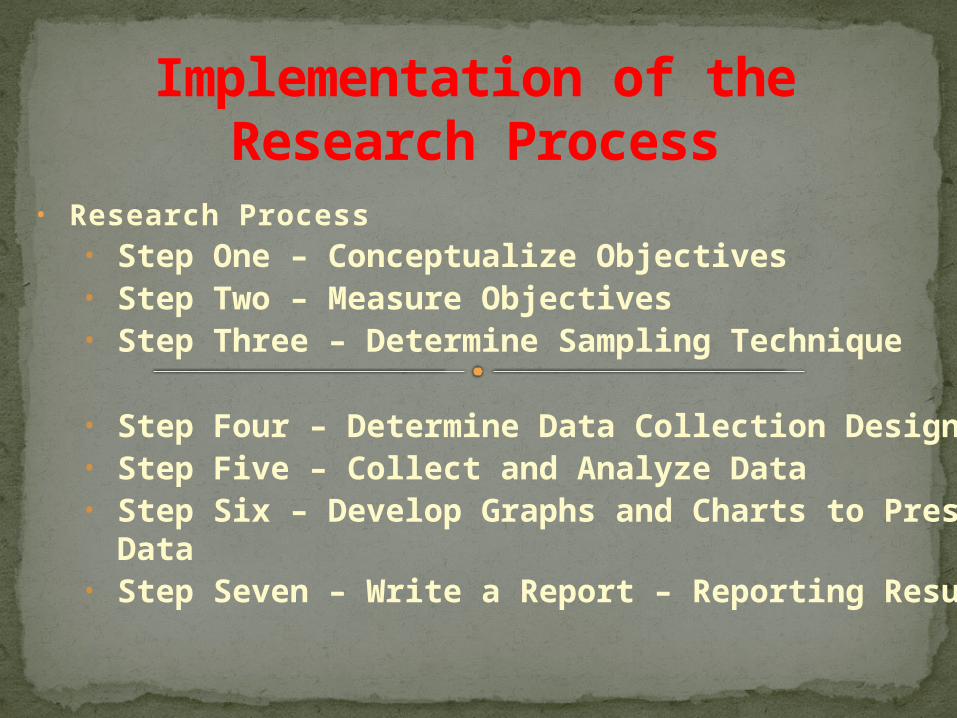
• Research Process• Step One – Conceptualize Objectives • Step Two – Measure Objectives• Step Three – Determine Sampling Technique
• Step Four – Determine Data Collection Design• Step Five – Collect and Analyze Data • Step Six – Develop Graphs and Charts to Present
Data• Step Seven – Write a Report – Reporting Results
Implementation of the Research Process
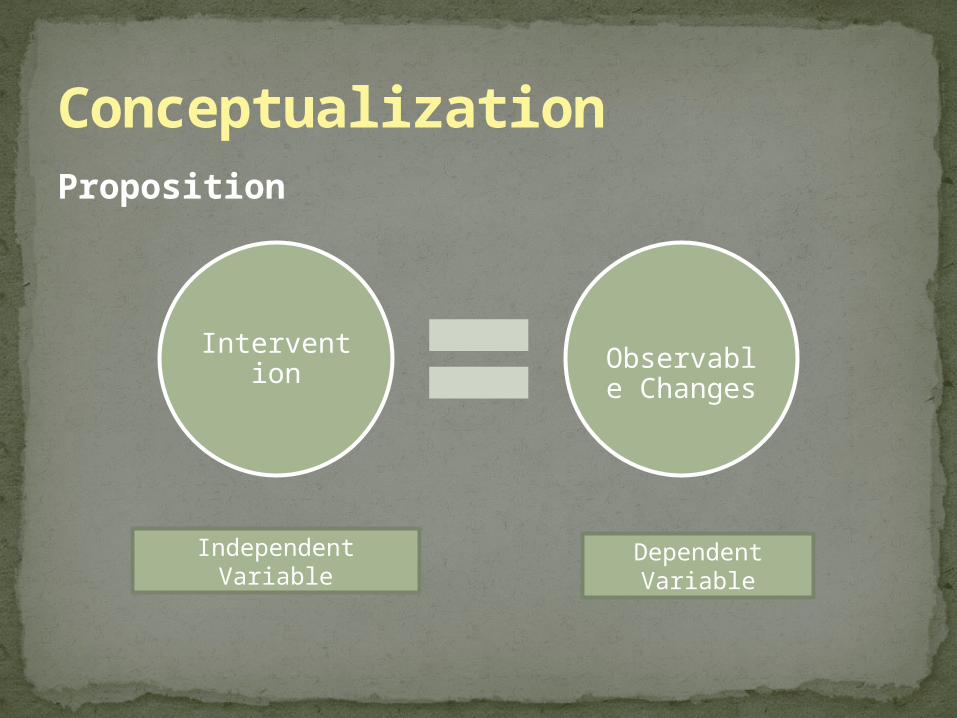
Proposition
Conceptualization
Intervention
Observable Changes
Dependent Variable
Independent Variable
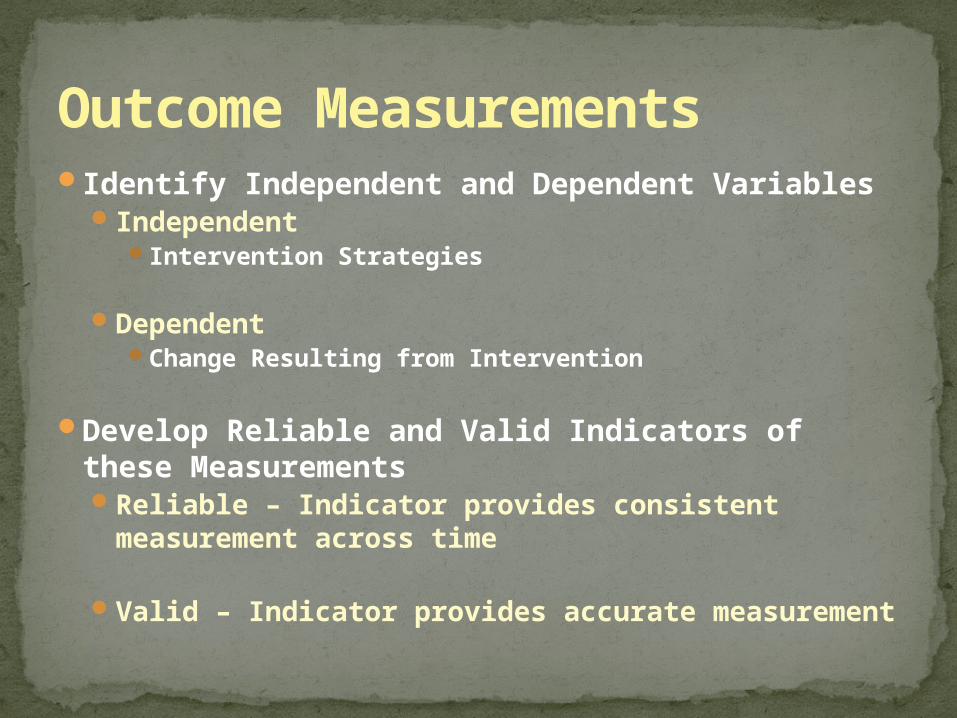
Identify Independent and Dependent VariablesIndependent
Intervention Strategies
DependentChange Resulting from Intervention
Develop Reliable and Valid Indicators of these MeasurementsReliable – Indicator provides consistent
measurement across time
Valid – Indicator provides accurate measurement
Outcome Measurements
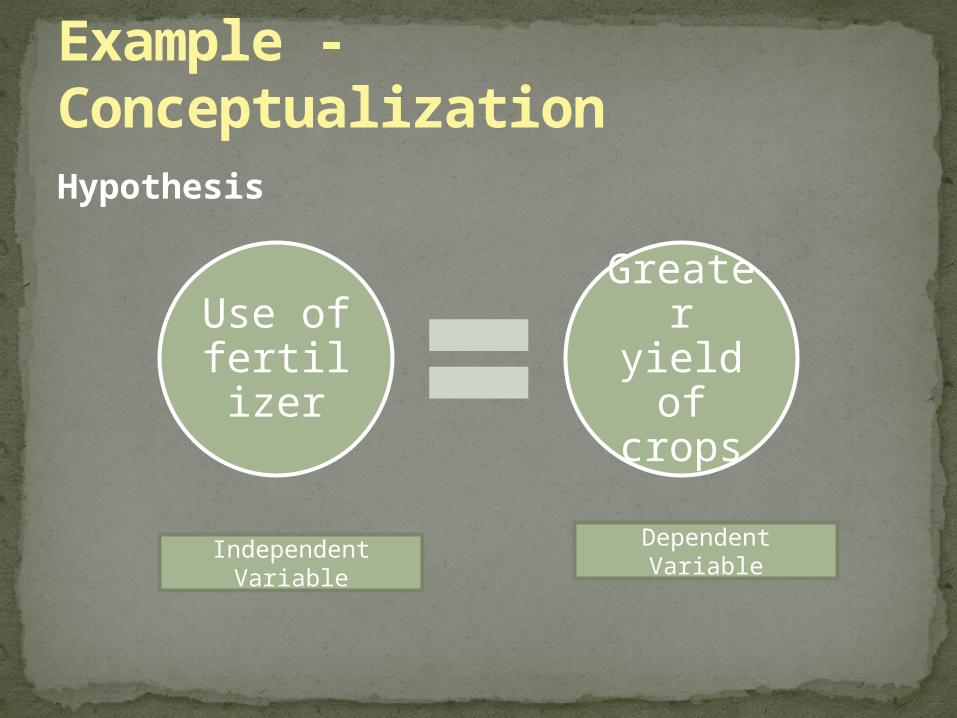
Hypothesis
Example - Conceptualization
Use of fertiliz
er
Greater yield
of crops
Independent Variable
Dependent Variable
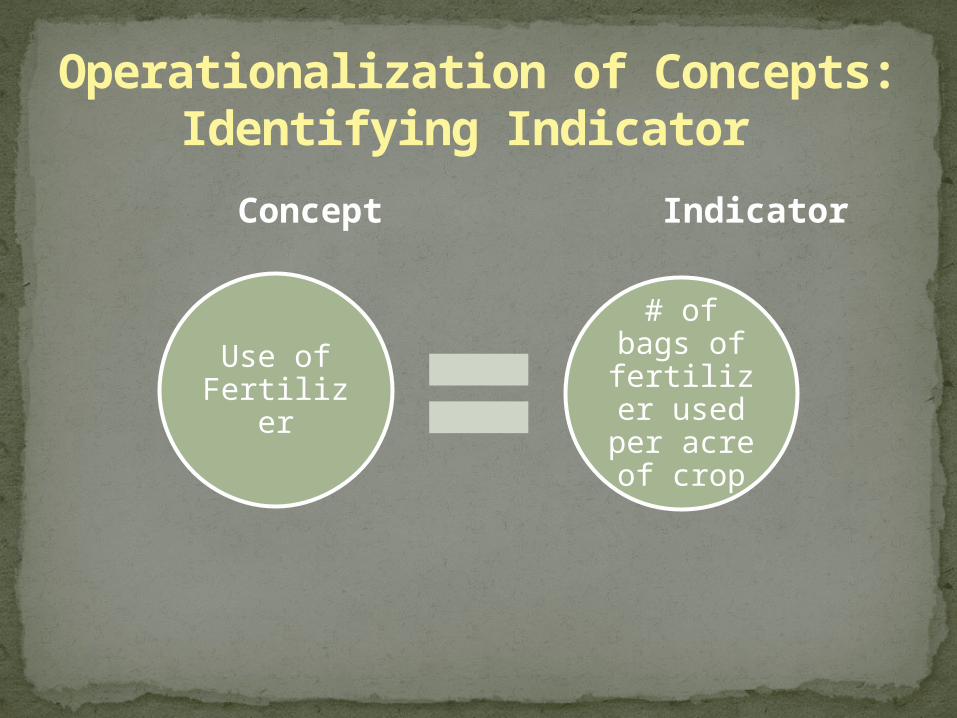
Concept Indicator
Operationalization of Concepts:Identifying Indicator
Use of Fertilizer
# of bags of
fertilizer used per acre of crop
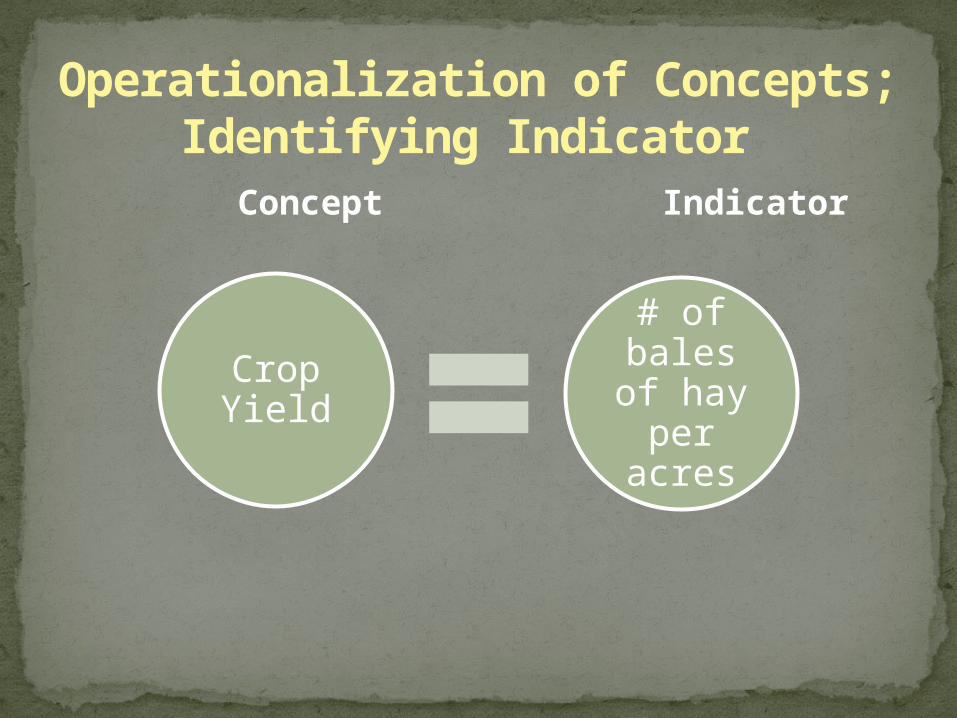
Concept Indicator
Operationalization of Concepts;Identifying Indicator
Crop Yield
# of bales of hay per acres
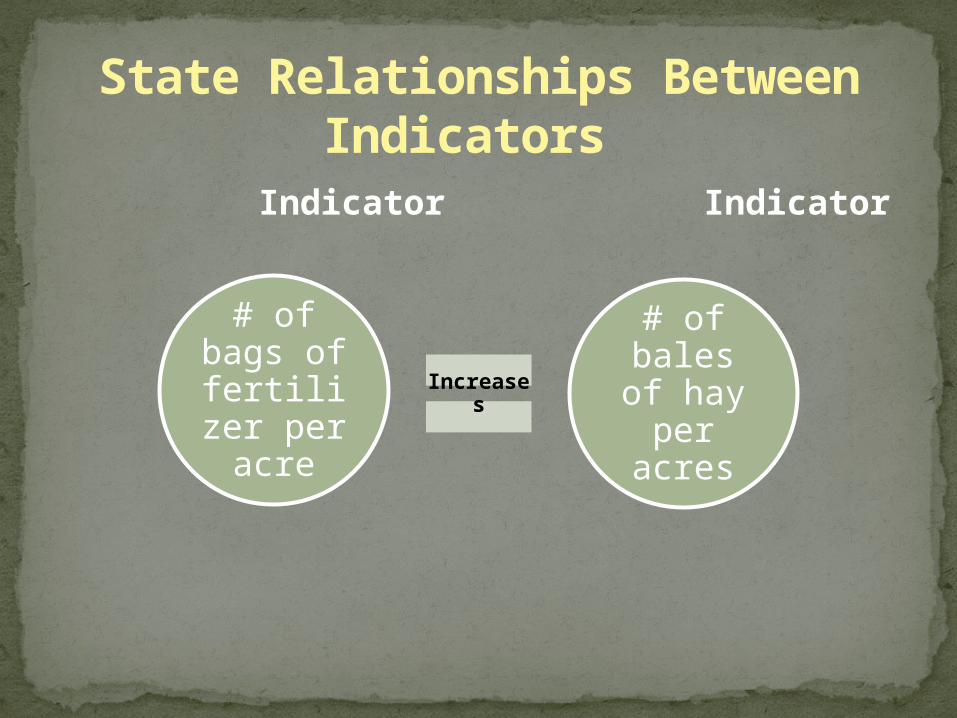
Indicator Indicator
State Relationships Between Indicators
# of bags of
fertilizer per acre
Increases
# of bales of hay per acres
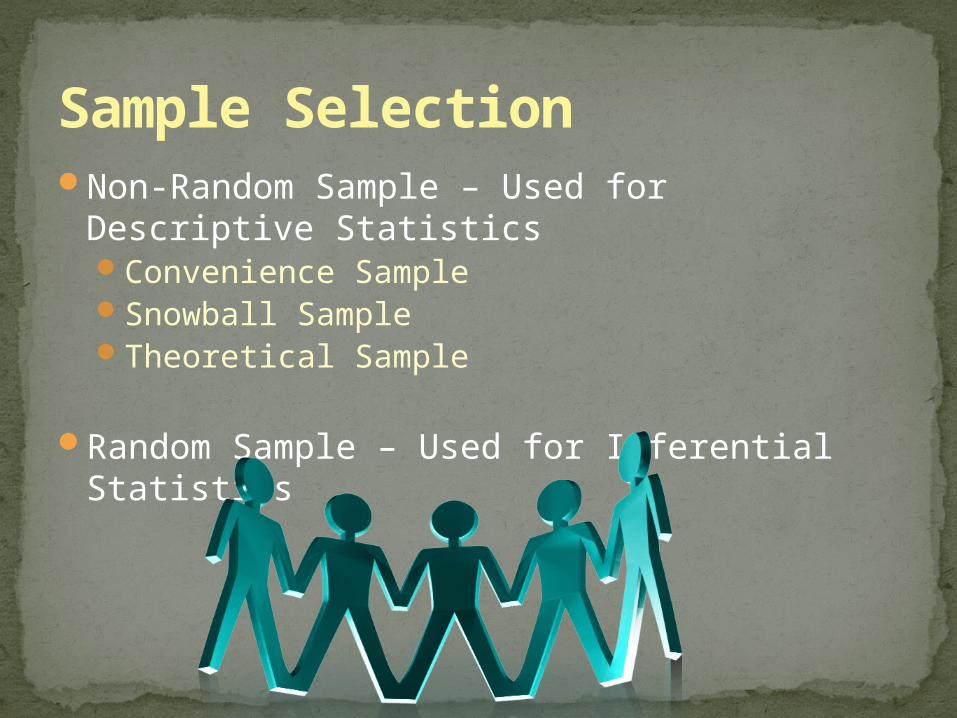
Non-Random Sample – Used for Descriptive StatisticsConvenience SampleSnowball SampleTheoretical Sample
Random Sample – Used for Inferential Statistics
Sample Selection
Non-Random Samples includeConvenience Sample – Select units that are
convenient (i.e., the nearest fields of crops)Snowball Sample – Have one farmer refer you
to another who will refer you to another, etc.
Theoretical Sample – Your theory states that this fertilizer only works for innovative farmers so you select only innovative farmers as your experimental group
Examples- Non-Random Sampling Techniques
Random SampleThis type of sample should be used when:
You want to publish in a peer-reviewed journalYou want to generalize to the population
Every unit (field or farmer) in your population has an equal probability of being selected for your study
Random Sampling Technique
Random Sample
Make a list of all the farmers in your county who plant this crop
Assign a number to each farmerPlace numbers in a bin/hat and blindly draw
out the number of farmers you need for your study
Example - Random Sampling Technique
QualitativeCase Studies
Gather detailed information from one or a small group of individuals
Intensive Interviews/Focus GroupsIn-depth Understanding of SubjectsDisadvantage – Bias of interviewer can impact interpretation of
results
Participant ObservationWatch ongoing processDisadvantage – Hawthorne Effect – People act differently when
they know they are being observed
Content AnalysisStudy materials, objects (e.g., content of fields themselves)
Data Collection Selecting a Collection Technique
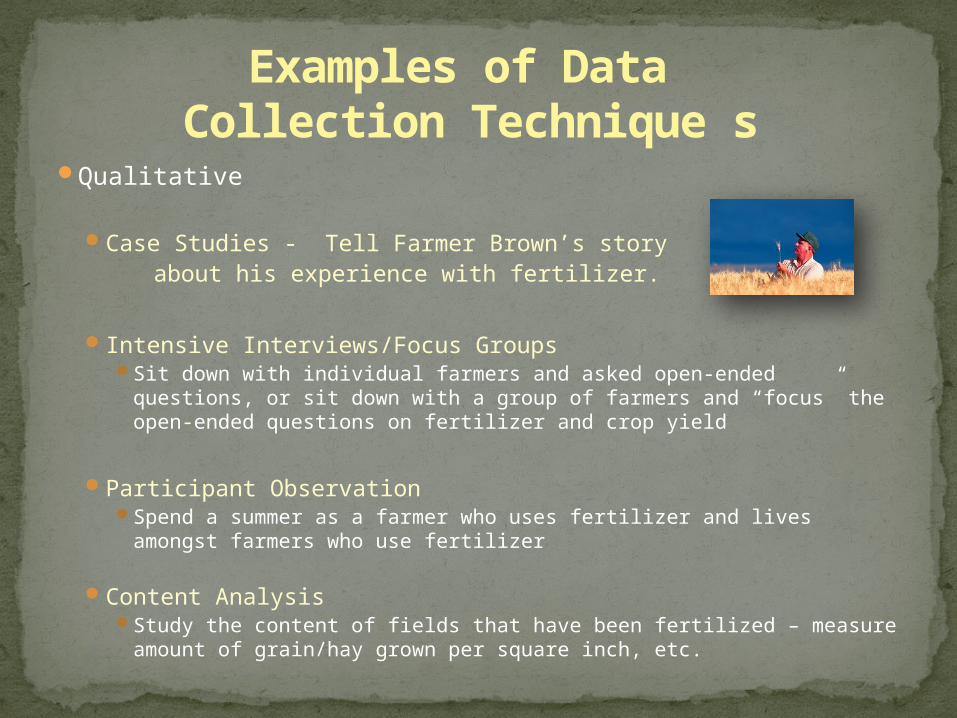
Qualitative
Case Studies - Tell Farmer Brown’s story about his experience with fertilizer.
Intensive Interviews/Focus GroupsSit down with individual farmers and asked open-ended questions,
or sit down with a group of farmers and “focus” the open-ended questions on fertilizer and crop yield
Participant ObservationSpend a summer as a farmer who uses fertilizer and lives amongst
farmers who use fertilizer
Content AnalysisStudy the content of fields that have been fertilized – measure
amount of grain/hay grown per square inch, etc.
Examples of Data Collection Technique s
QuantitativeLaboratory Experiment
Study experimental and control groups in a laboratory situation
Field TrialsStructure an experiment out in the field/community
Surveys
Construct questionnaires and mail/read to farmers
SecondaryUse information collected by someone else
Data Collection -Selecting a Technique
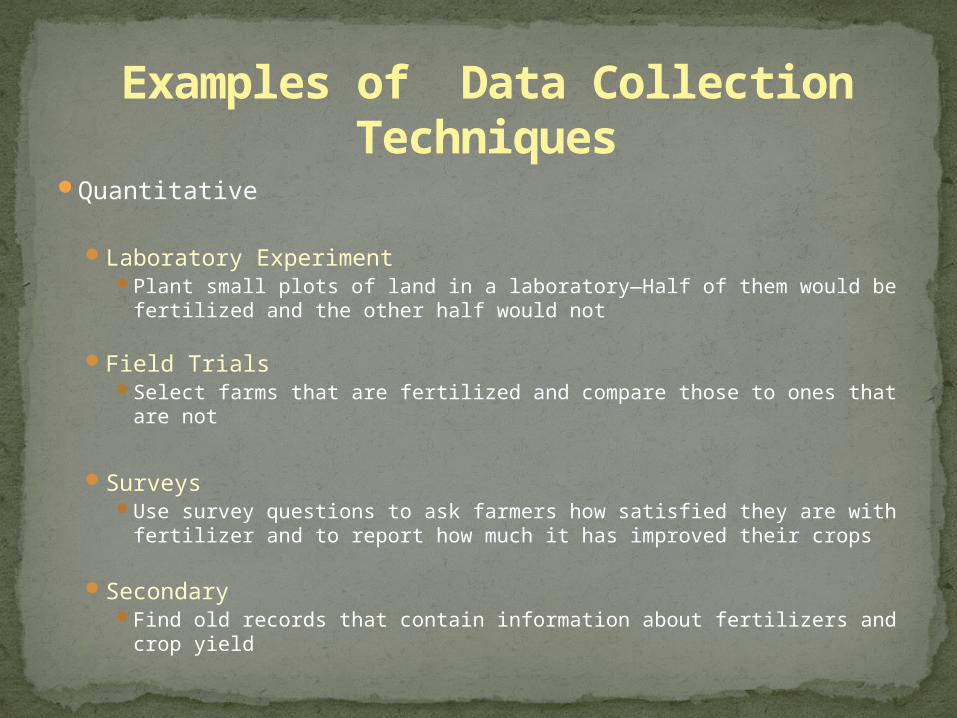
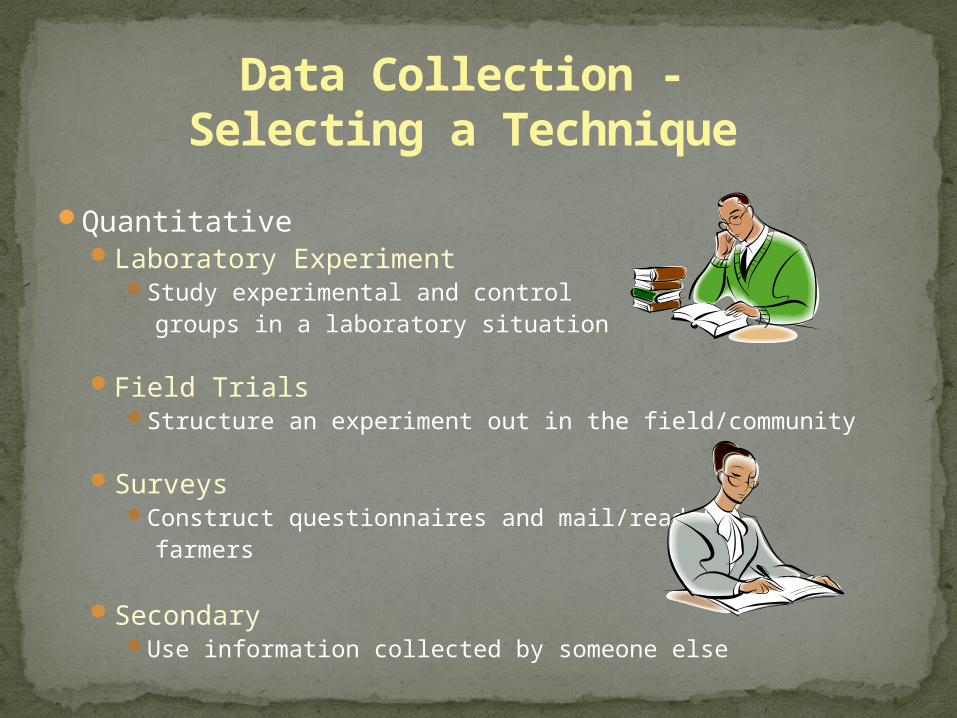
Quantitative
Laboratory Experiment Plant small plots of land in a laboratory—Half of them would be
fertilized and the other half would not
Field Trials Select farms that are fertilized and compare those to ones that are
not
Surveys Use survey questions to ask farmers how satisfied they are with
fertilizer and to report how much it has improved their crops
Secondary Find old records that contain information about fertilizers and crop
yield
Examples of Data Collection Techniques
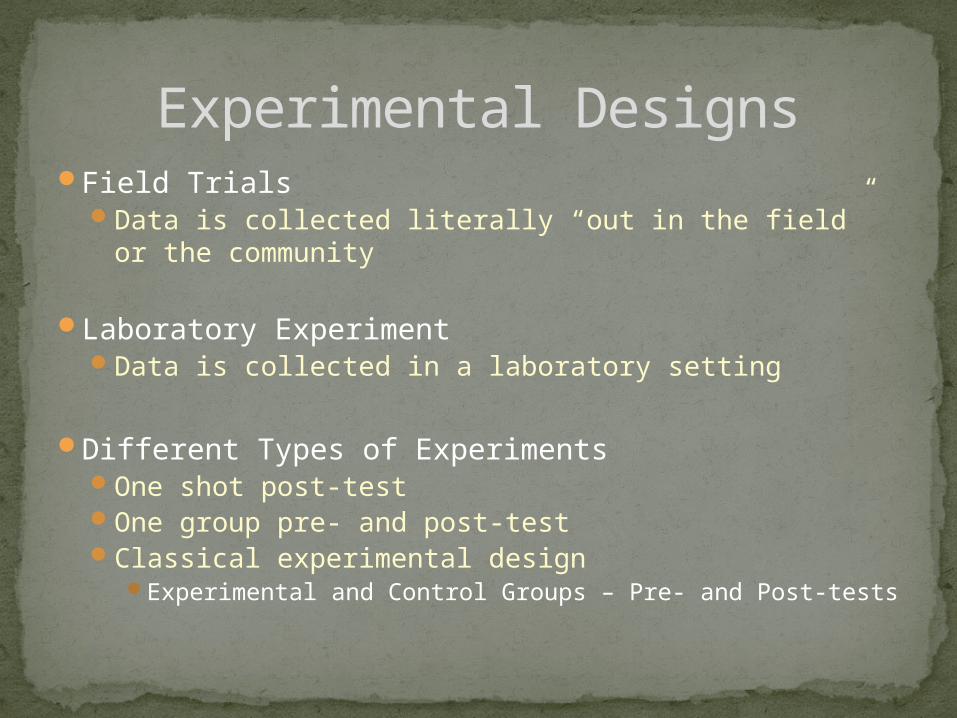
Field TrialsData is collected literally “out in the field” or the
community
Laboratory ExperimentData is collected in a laboratory setting
Different Types of ExperimentsOne shot post-testOne group pre- and post-testClassical experimental design
Experimental and Control Groups – Pre- and Post-tests
Experimental Designs
One Shot Post-Test
Weeks 1 and 2 are The Baseline
Intervention Begins Week 3
0
1
2
3
4
5
6
Week 1 week 2 Week 3 Week 4 Week 5 Week 6
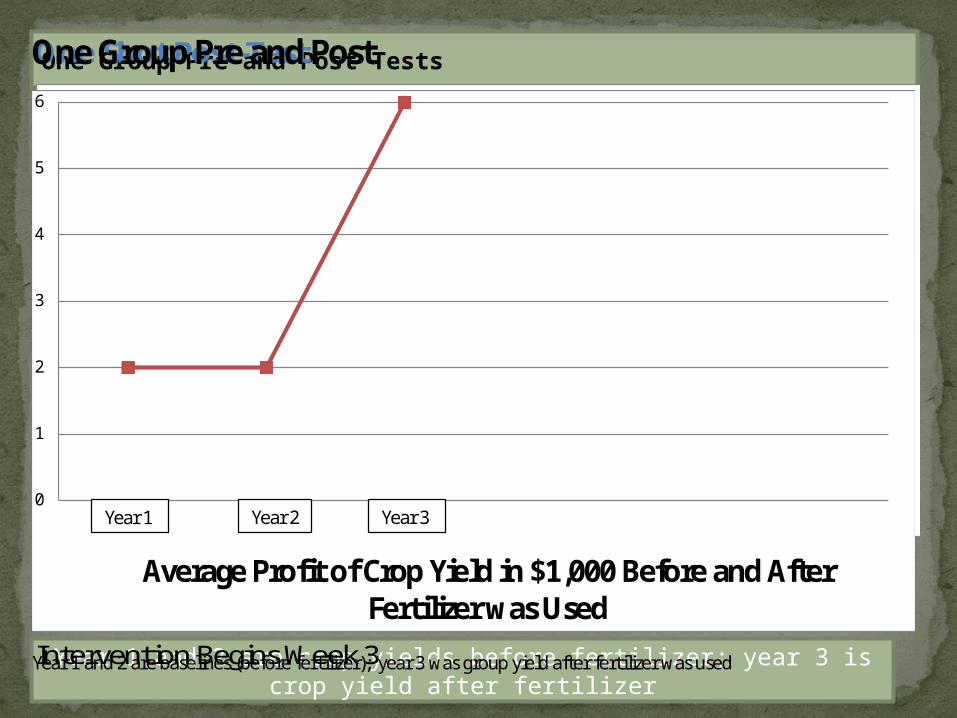
One Group Pre and Post
Year 1 and 2 are baselines (before fertilizer); year 3 was group yield after fertilizer was used
0
1
2
3
4
5
6
Average Profit of Crop Yield in $1,000 Before and After Fertilizer was Used
Year 2 Year 3 Year 1
Year 1 and 2 are crop yields before fertilizer; year 3 is crop yield after fertilizer
One Group Pre and Post Tests
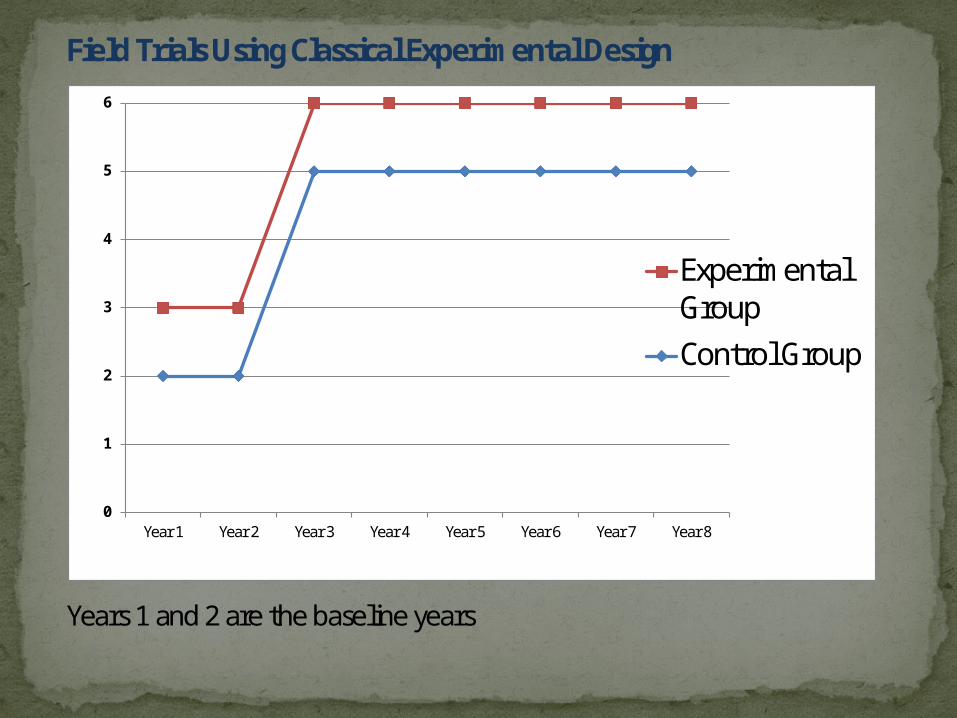
Field Trials Using Classical Experimental Design
Years 1 and 2 are the baseline years
0
1
2
3
4
5
6
Year 1 Year 2 Year 3 Year 4 Year 5 Year 6 Year 7 Year 8
ExperimentalGroupControl Group
When you use surveys you:Measure self-reported attitudes and behaviorsDevelop survey instrument Mail out survey
Face-to-face surveyOn-line surveyTelephone survey
Collect dataAnalyze data
Surveys
Descriptive Statistics (Describes Characteristics of sample group)
MeanMedianModeStandard Deviation
Inferential Statistics (Describes Relationships between variables)
Statistical Significance is reported Includes Chi Square, Regression Analysis and ANOVA
Data Analysis Includes:
Should Include the Following:
IntroductionLiterature ReviewMethods SectionResultsDiscussion – Summary and ConclusionReferences/Appendix
Data Presentation
Dr. Carol AlbrechtAssessment Specialist USU [email protected](979) 777-2421
Questions or Comments, Contact: