Embed Size (px)
Citation preview
Research PresentationSexual harassment of women in the workplace in Fiji
2016 follow up study
for Fiji Women’s Rights Movement
11
Introduction
Incidence
Types
Reporting
Workplace policy
Table of Contents
FWRMs role in giving advice
Attitudes

Introduction
About the study, background, objectives, methodology
3
The Fiji Women’s Rights Movement (FWRM) is an outstanding NGO that celebrates 30 years in 2016. With a focus on removing discrimination in all forms against women, FWRM has used innovative approaches and core programs to drive institutional reforms and attitudinal changes.
In 2002 FWRM commissioned Tebbutt Research to conduct ground-breaking research on the incidence and nature of sexual harassment of women in the workplace, funded by ADB. The results of that study were widely utilised, and assisted FWRM to lobby and advocate against sexual harassment in the workplace, and to provide input into a decision to adopt a broader definition of sexual harassment for legislation being developed at that time.
FWRM has continued to use the results of the study to inform its ongoing advocacy (for the ERP, for example), and to inform its regular training sessions in various sectors. The demand for such training is growing, possibly because of amendments to the ERP that mandate a Sexual Harassment Policy in the workplace.
FWRM has commissioned Tebbutt Research to update the findings by conducting a follow up study. The 2016 survey will assist FWRM to refine and inform its advocacy and training strategy on Sexual Harassment in the workplace and will also have input into the 3 year strategic plan being designed in June 2016.
Background to the study
FWRM’s website states its vision:The Movement’s vision is for the women of Fiji to be free from all forms of discrimination, have equal access to opportunities and to live in a healthy environment where the principles of feminism, democracy, good governance, multiculturalism and human rights prevail.
4
The core research objective is to replicate and update the key elements of the 2002 study, while incorporating some changes to make the project relevant to the 2016 workplace. The brief specified the following key topic areas for the 2016 survey:
the incidence and nature of sexual harassment in the workplace;
variation by industry sectors and job requirements;
socio-economic and demographic factors related to victim profiles;
the nature of sexual harassment experienced, type of harassment, actions taken, and offender profiles; and
awareness of a Sexual Harassment Policy in the work place.
The study asks the question, has the prevalence of sexual harassment in the workplace changed with the increasing number of women in the workforce and/or with the increasing number of women in decision- making roles?
Objectives
The study covered a range of topics including:• Incidence • Recency of sexual
harassment • Incidence of the different
types of harassment • Harassment experienced by
nature of harassment • Multiplicity in the
nature/frequency of harassment and in the perpetrators
• Location of the offence(s) • Offender profile – race,
gender, age, working relationship
• Threats and promises by the offender
• Victims’ feelings • Reporting and action taken • Discussing the harassment
with others • Harassment of another
witnessed/heard about in the workplace
5
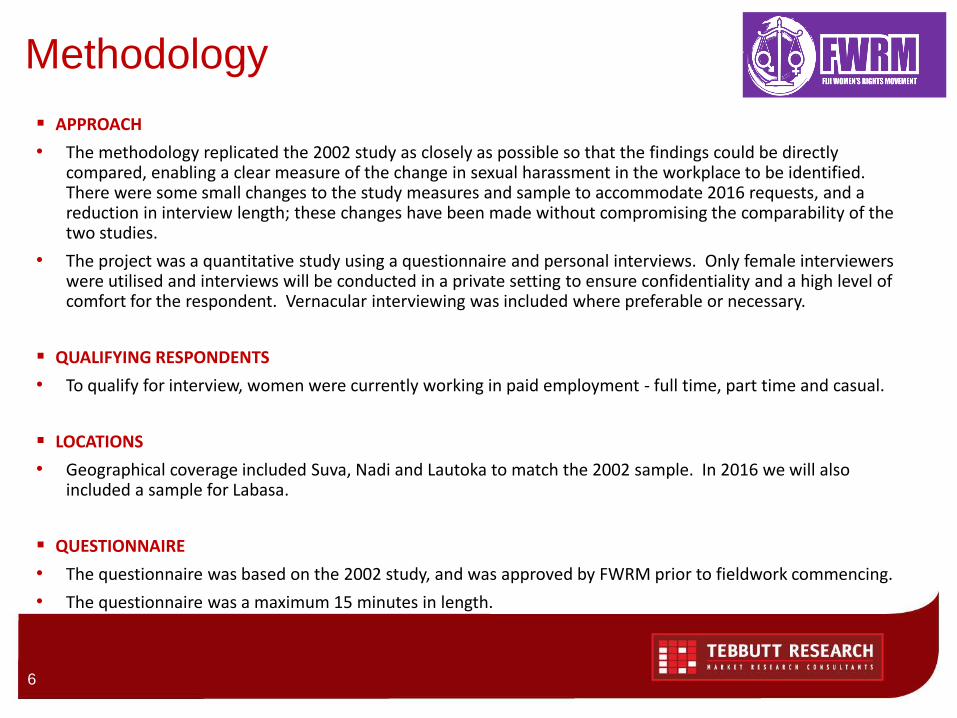
APPROACH
• The methodology replicated the 2002 study as closely as possible so that the findings could be directly compared, enabling a clear measure of the change in sexual harassment in the workplace to be identified. There were some small changes to the study measures and sample to accommodate 2016 requests, and a reduction in interview length; these changes have been made without compromising the comparability of the two studies.
• The project was a quantitative study using a questionnaire and personal interviews. Only female interviewers were utilised and interviews will be conducted in a private setting to ensure confidentiality and a high level of comfort for the respondent. Vernacular interviewing was included where preferable or necessary.
QUALIFYING RESPONDENTS
• To qualify for interview, women were currently working in paid employment - full time, part time and casual.
LOCATIONS
• Geographical coverage included Suva, Nadi and Lautoka to match the 2002 sample. In 2016 we will also included a sample for Labasa.
QUESTIONNAIRE
• The questionnaire was based on the 2002 study, and was approved by FWRM prior to fieldwork commencing.
• The questionnaire was a maximum 15 minutes in length.
Methodology
6
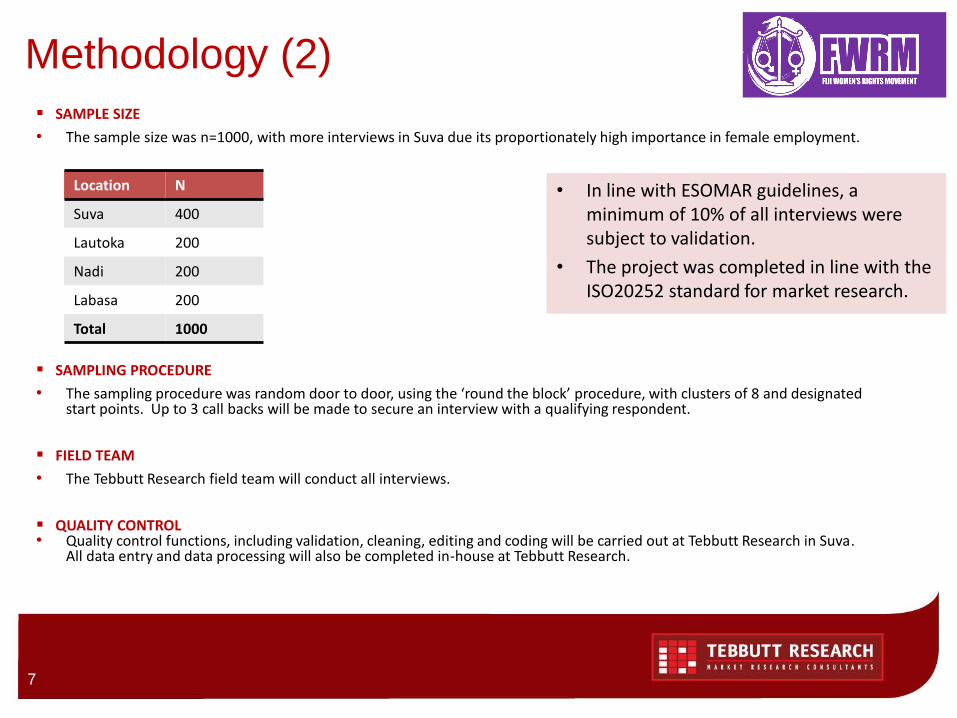
SAMPLE SIZE
• The sample size was n=1000, with more interviews in Suva due its proportionately high importance in female employment.
SAMPLING PROCEDURE
• The sampling procedure was random door to door, using the ‘round the block’ procedure, with clusters of 8 and designated start points. Up to 3 call backs will be made to secure an interview with a qualifying respondent.
FIELD TEAM
• The Tebbutt Research field team will conduct all interviews.
QUALITY CONTROL• Quality control functions, including validation, cleaning, editing and coding will be carried out at Tebbutt Research in Suva.
All data entry and data processing will also be completed in-house at Tebbutt Research.
Methodology (2)
Location N
Suva 400
Lautoka 200
Nadi 200
Labasa 200
Total 1000
• In line with ESOMAR guidelines, a minimum of 10% of all interviews were subject to validation.
• The project was completed in line with the ISO20252 standard for market research.
7
Incidence
Incidence by demographic, workplace and work
requirements
8
9
Incidence
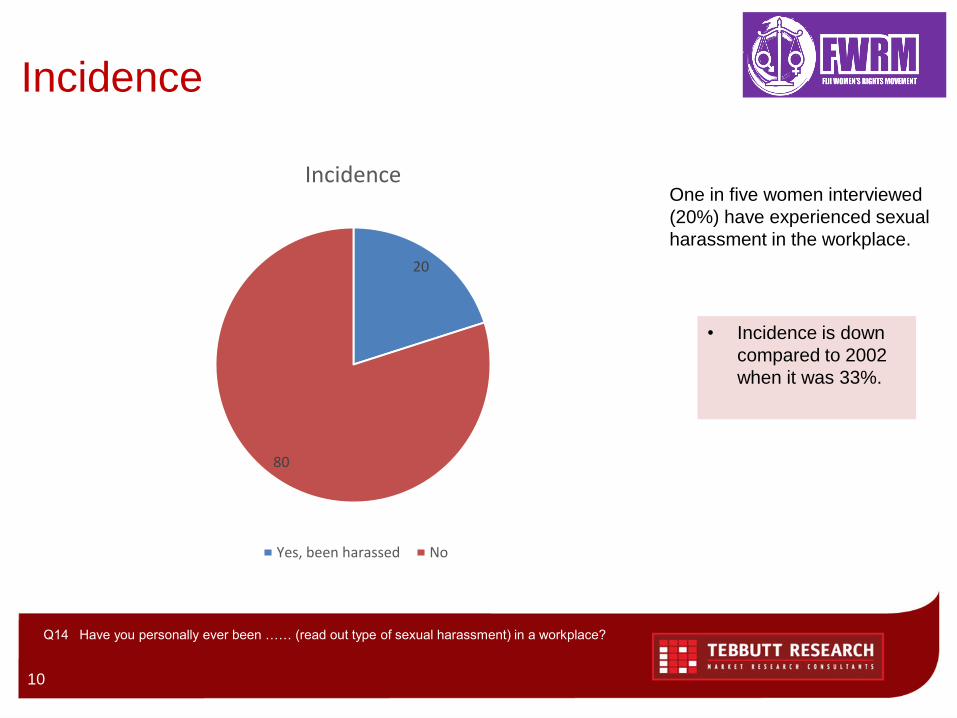
• One in five women interviewed (20%) have experienced sexual harassment in the workplace.
• Nadi looks to be a hotspot for this (35%) and it is highest in the accommodation/hotels/restaurants/bars
industry (also at 35%).
• Younger women (25% of under 30 year olds) and those women from i-Taukei (29%) and Other (25%)
ethnicity groupings are the most likely to have been harassed, as are casual (43%) and part-time (30%)
employees. Incidence is highest for those in shift work and for those changing into or out of their uniform
in the workplace. It is also higher for those working nights. This all points to those working in the
accommodation/hotels/restaurants/bars industry being especially affected.
• Other sectors showing higher incidence include Public Service (30%), Health (24%) and Retail (23%).
• The sector least likely to report harassment is Education (at 8%).
• Incidence compared to 2002: This is down in 2016, from 33% in 2002 to 20% in 2016. This is an
encouraging result.
10
Incidence
One in five women interviewed
(20%) have experienced sexual
harassment in the workplace.
Q14 Have you personally ever been …… (read out type of sexual harassment) in a workplace?
20
80
Incidence
Yes, been harassed No
• Incidence is down
compared to 2002
when it was 33%.
11
Incidence by age
Q14 Have you personally ever been …… (read out type of sexual harassment) in a workplace?
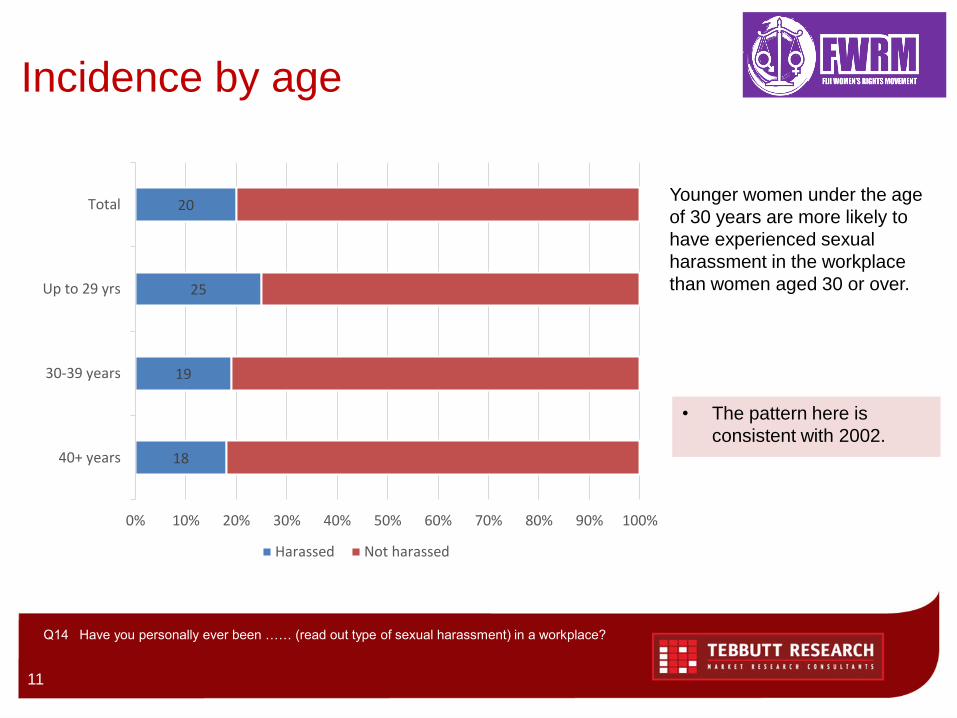
18
19
25
20
40+ years
30-39 years
Up to 29 yrs
Total
0% 10% 20% 30% 40% 50% 60% 70% 80% 90% 100%
Harassed Not harassed
Younger women under the age
of 30 years are more likely to
have experienced sexual
harassment in the workplace
than women aged 30 or over.
• The pattern here is
consistent with 2002.
12
Incidence by ethnicity
Q14 Have you personally ever been …… (read out type of sexual harassment) in a workplace?
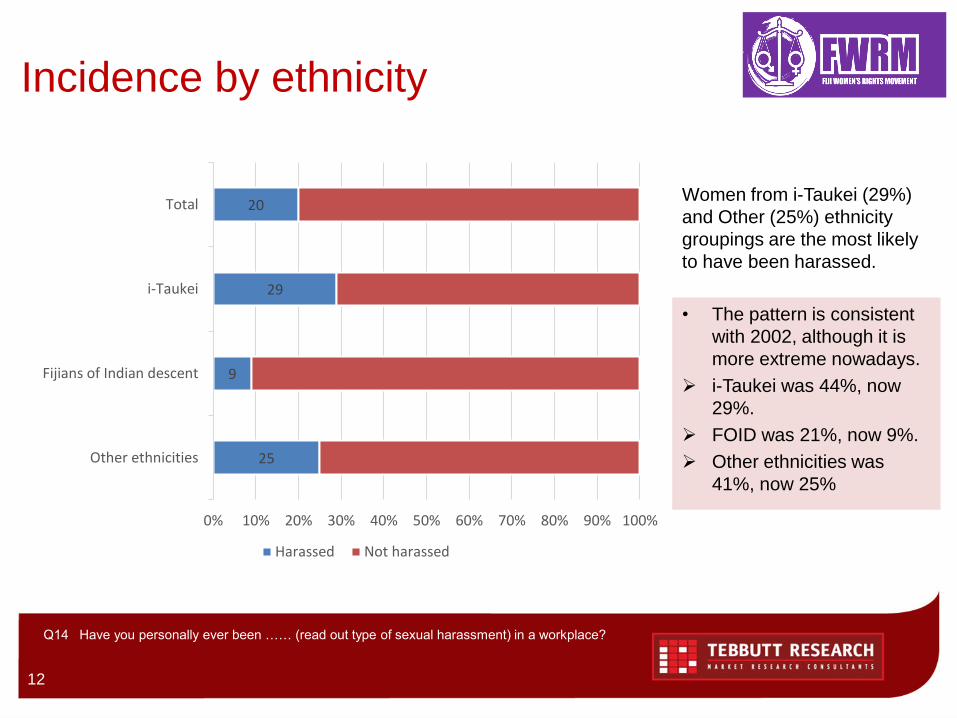
25
9
29
20
Other ethnicities
Fijians of Indian descent
i-Taukei
Total
0% 10% 20% 30% 40% 50% 60% 70% 80% 90% 100%
Harassed Not harassed
Women from i-Taukei (29%)
and Other (25%) ethnicity
groupings are the most likely
to have been harassed.
• The pattern is consistent
with 2002, although it is
more extreme nowadays.
i-Taukei was 44%, now
29%.
FOID was 21%, now 9%.
Other ethnicities was
41%, now 25%
13
Incidence by location
Q14 Have you personally ever been …… (read out type of sexual harassment) in a workplace?
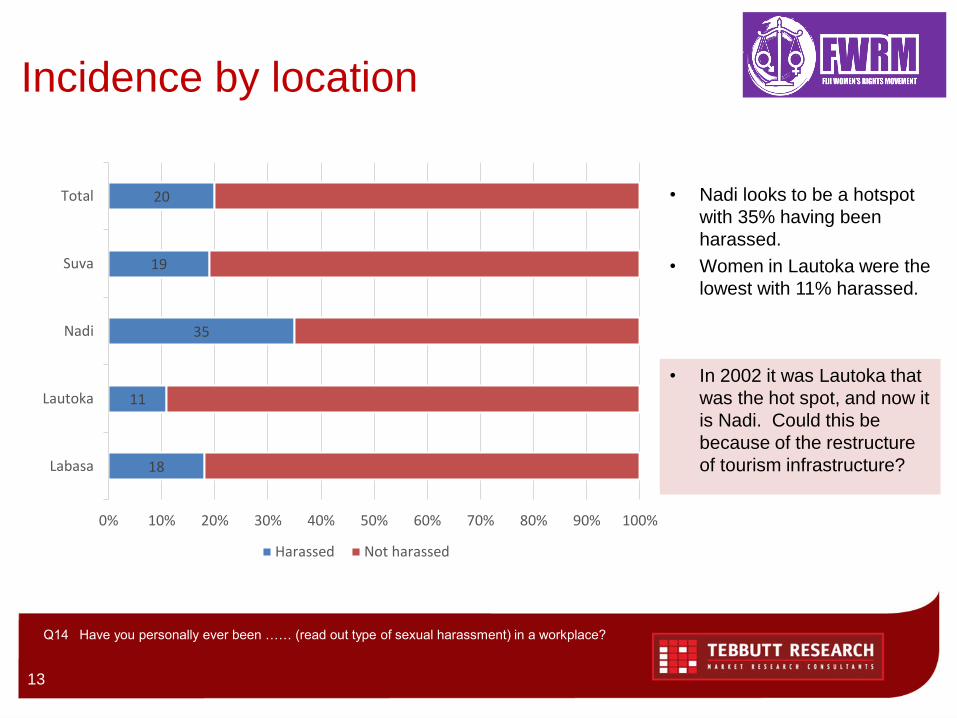
18
11
35
19
20
Labasa
Lautoka
Nadi
Suva
Total
0% 10% 20% 30% 40% 50% 60% 70% 80% 90% 100%
Harassed Not harassed
• Nadi looks to be a hotspot
with 35% having been
harassed.
• Women in Lautoka were the
lowest with 11% harassed.
• In 2002 it was Lautoka that
was the hot spot, and now it
is Nadi. Could this be
because of the restructure
of tourism infrastructure?
14
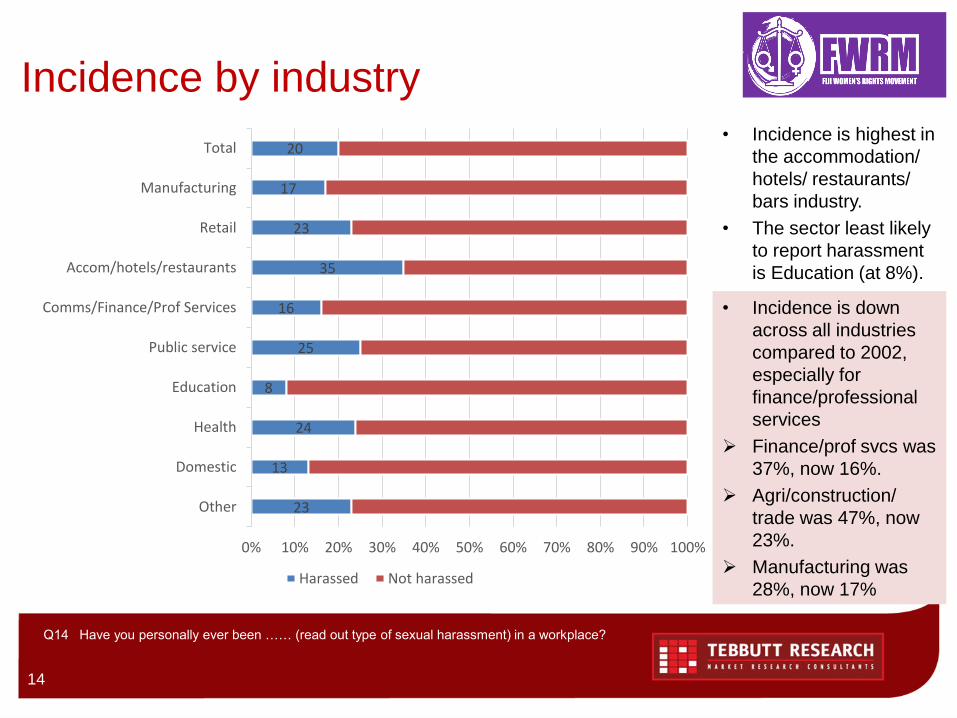
Incidence by industry
Q14 Have you personally ever been …… (read out type of sexual harassment) in a workplace?
23
13
24
8
25
16
35
23
17
20
Other
Domestic
Health
Education
Public service
Comms/Finance/Prof Services
Accom/hotels/restaurants
Retail
Manufacturing
Total
0% 10% 20% 30% 40% 50% 60% 70% 80% 90% 100%
Harassed Not harassed
• Incidence is highest in
the accommodation/
hotels/ restaurants/
bars industry.
• The sector least likely
to report harassment
is Education (at 8%).
• Incidence is down
across all industries
compared to 2002,
especially for
finance/professional
services
Finance/prof svcs was
37%, now 16%.
Agri/construction/
trade was 47%, now
23%.
Manufacturing was
28%, now 17%
15
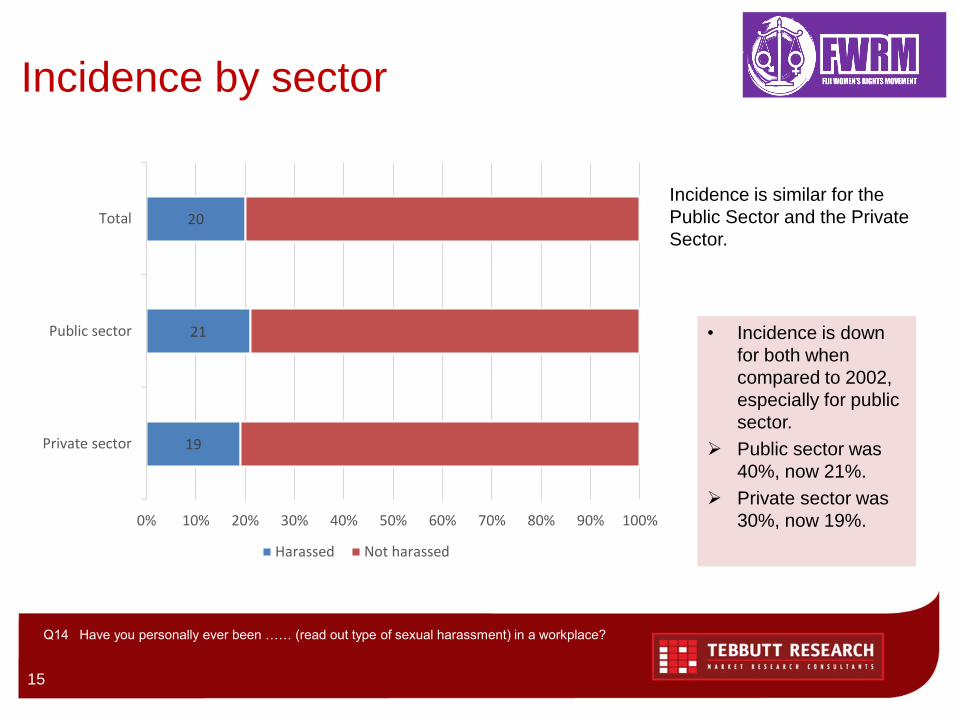
Incidence by sector
Q14 Have you personally ever been …… (read out type of sexual harassment) in a workplace?
19
21
20
Private sector
Public sector
Total
0% 10% 20% 30% 40% 50% 60% 70% 80% 90% 100%
Harassed Not harassed
Incidence is similar for the
Public Sector and the Private
Sector.
• Incidence is down
for both when
compared to 2002,
especially for public
sector.
Public sector was
40%, now 21%.
Private sector was
30%, now 19%.
16
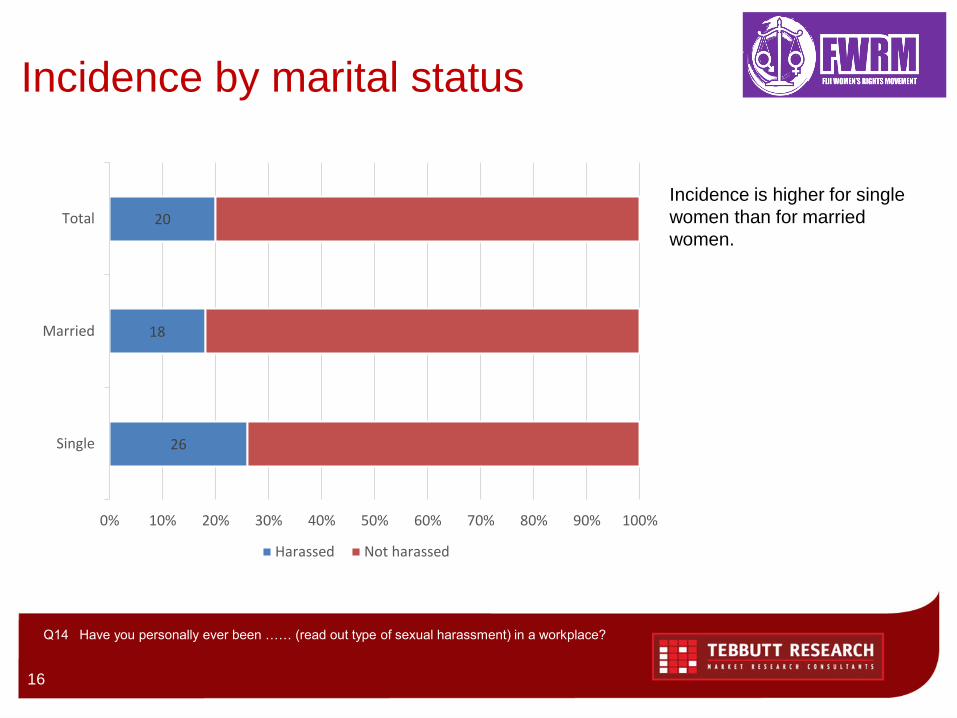
Incidence by marital status
Q14 Have you personally ever been …… (read out type of sexual harassment) in a workplace?
26
18
20
Single
Married
Total
0% 10% 20% 30% 40% 50% 60% 70% 80% 90% 100%
Harassed Not harassed
Incidence is higher for single
women than for married
women.
17
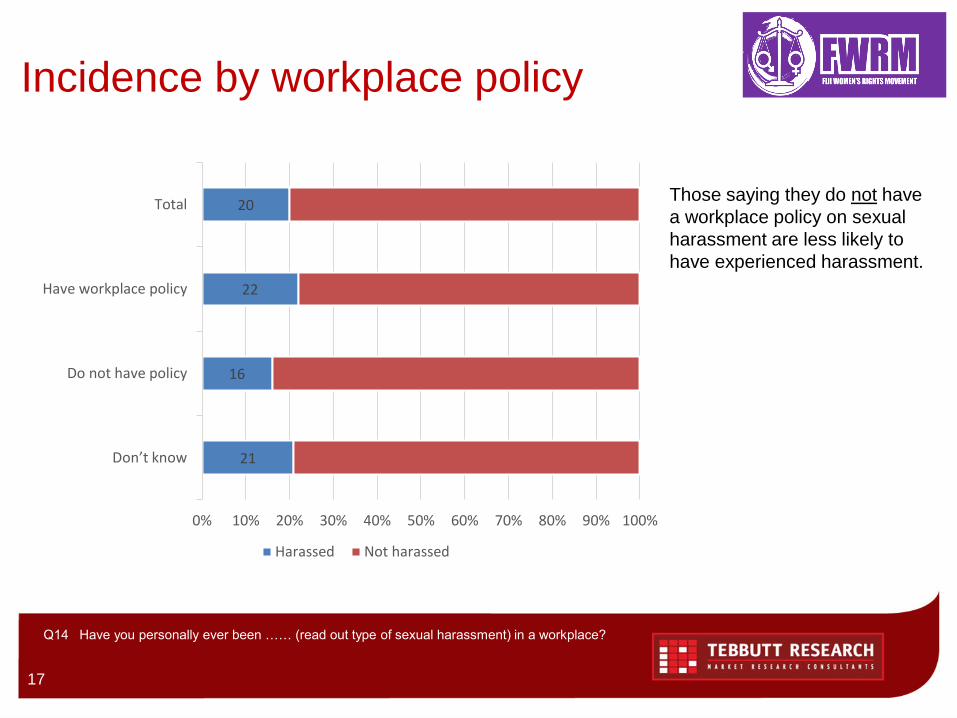
Incidence by workplace policy
Q14 Have you personally ever been …… (read out type of sexual harassment) in a workplace?
21
16
22
20
Don’t know
Do not have policy
Have workplace policy
Total
0% 10% 20% 30% 40% 50% 60% 70% 80% 90% 100%
Harassed Not harassed
Those saying they do not have
a workplace policy on sexual
harassment are less likely to
have experienced harassment.
18
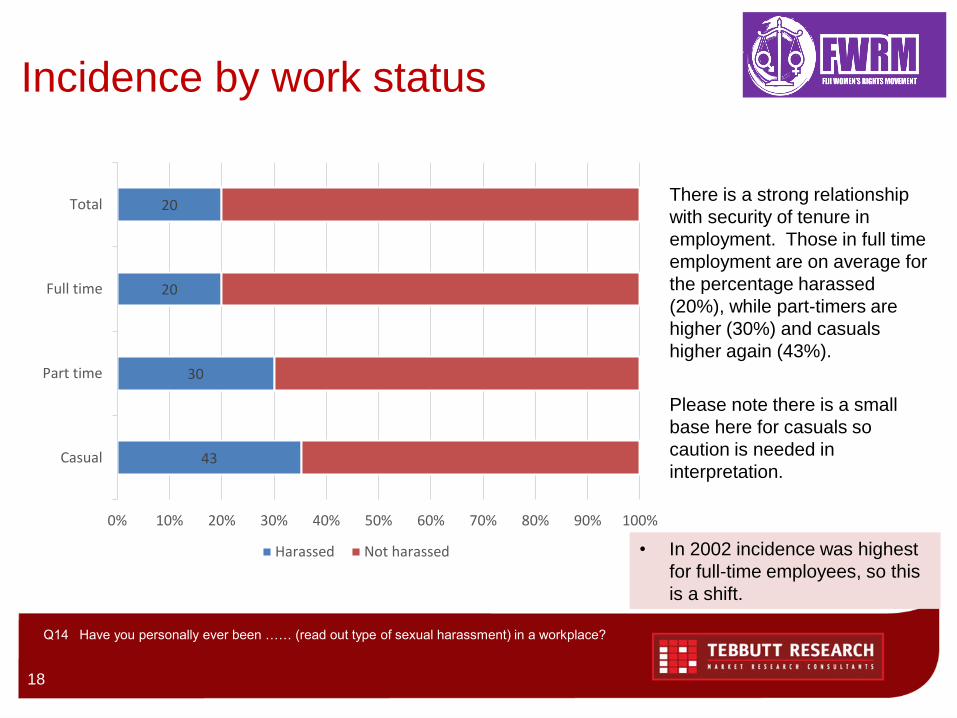
Incidence by work status
Q14 Have you personally ever been …… (read out type of sexual harassment) in a workplace?
43
30
20
20
Casual
Part time
Full time
Total
0% 10% 20% 30% 40% 50% 60% 70% 80% 90% 100%
Harassed Not harassed
There is a strong relationship
with security of tenure in
employment. Those in full time
employment are on average for
the percentage harassed
(20%), while part-timers are
higher (30%) and casuals
higher again (43%).
Please note there is a small
base here for casuals so
caution is needed in
interpretation.
• In 2002 incidence was highest
for full-time employees, so this
is a shift.
19
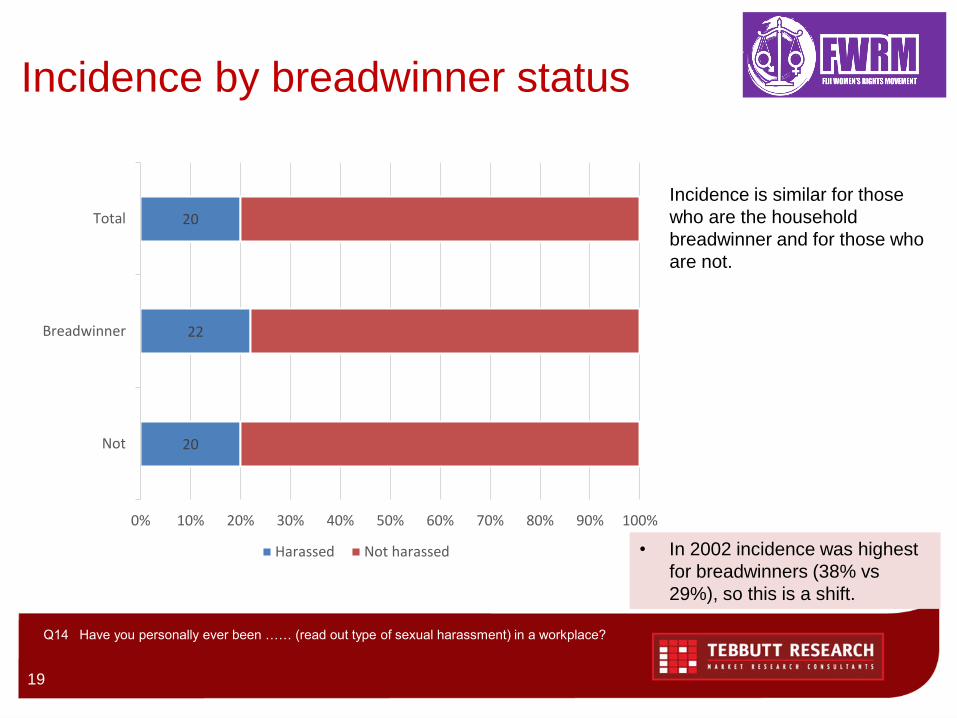
Incidence by breadwinner status
Q14 Have you personally ever been …… (read out type of sexual harassment) in a workplace?
20
22
20
Not
Breadwinner
Total
0% 10% 20% 30% 40% 50% 60% 70% 80% 90% 100%
Harassed Not harassed
Incidence is similar for those
who are the household
breadwinner and for those who
are not.
• In 2002 incidence was highest
for breadwinners (38% vs
29%), so this is a shift.
20
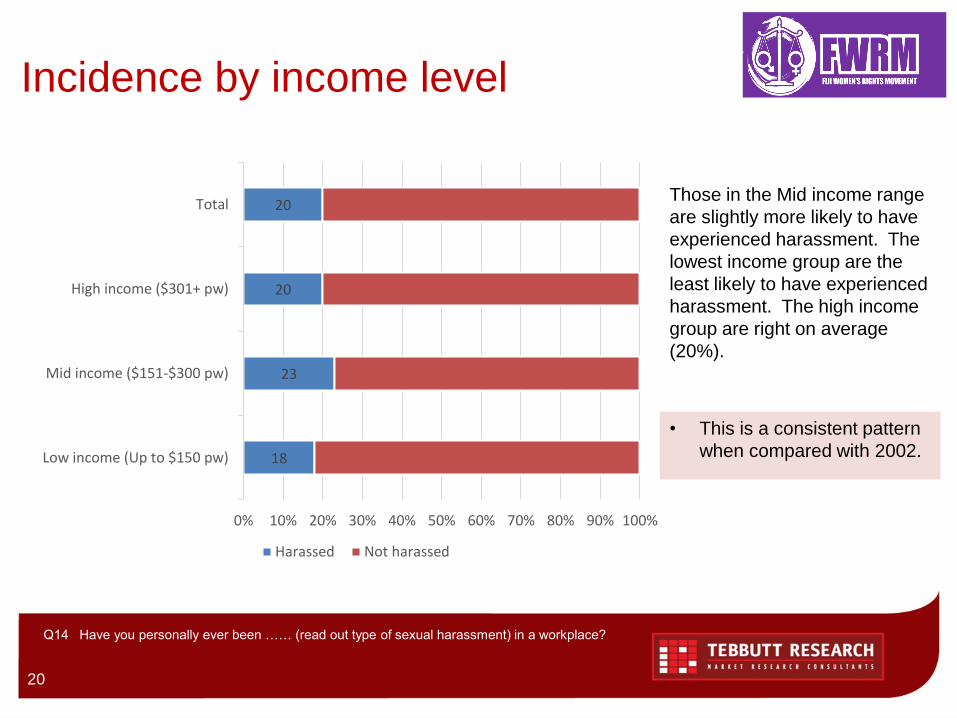
Incidence by income level
Q14 Have you personally ever been …… (read out type of sexual harassment) in a workplace?
18
23
20
20
Low income (Up to $150 pw)
Mid income ($151-$300 pw)
High income ($301+ pw)
Total
0% 10% 20% 30% 40% 50% 60% 70% 80% 90% 100%
Harassed Not harassed
Those in the Mid income range
are slightly more likely to have
experienced harassment. The
lowest income group are the
least likely to have experienced
harassment. The high income
group are right on average
(20%).
• This is a consistent pattern
when compared with 2002.
21
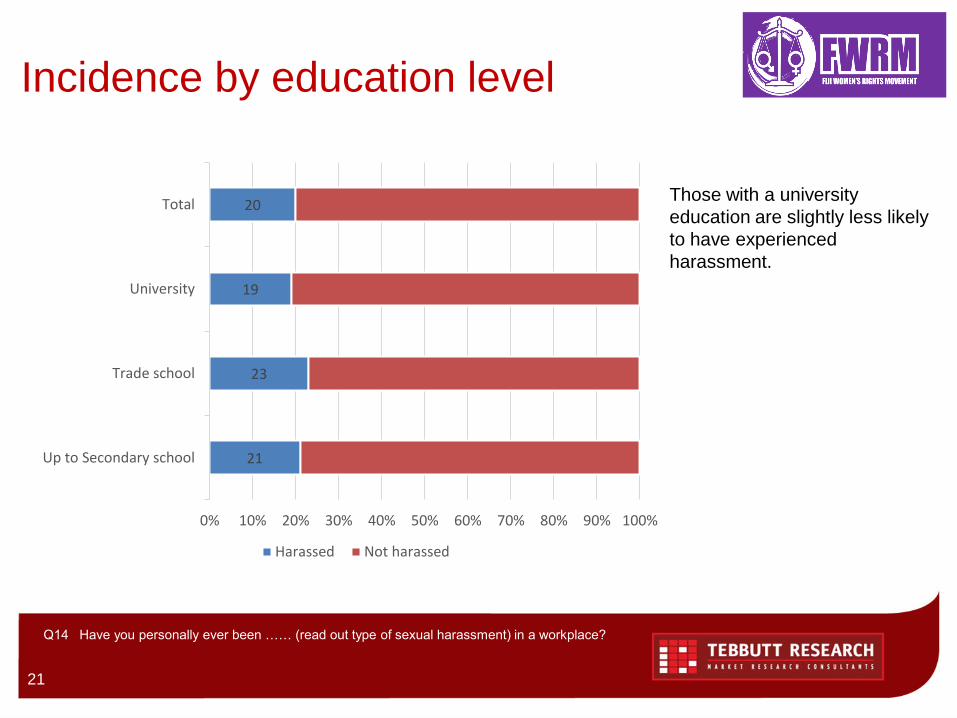
Incidence by education level
Q14 Have you personally ever been …… (read out type of sexual harassment) in a workplace?
21
23
19
20
Up to Secondary school
Trade school
University
Total
0% 10% 20% 30% 40% 50% 60% 70% 80% 90% 100%
Harassed Not harassed
Those with a university
education are slightly less likely
to have experienced
harassment.
22
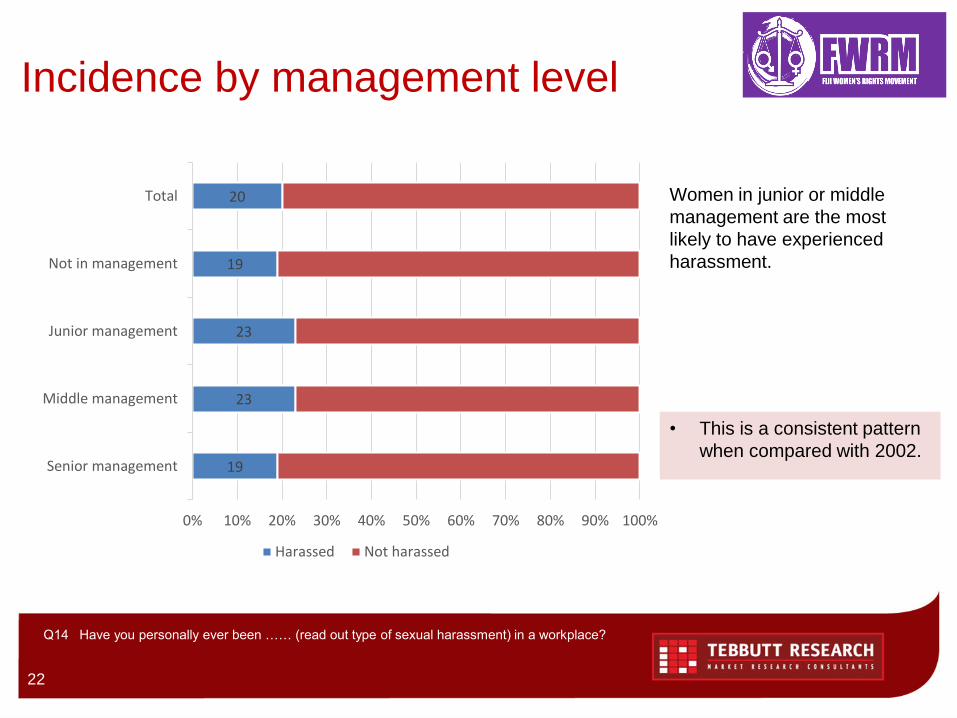
Incidence by management level
Q14 Have you personally ever been …… (read out type of sexual harassment) in a workplace?
19
23
23
19
20
Senior management
Middle management
Junior management
Not in management
Total
0% 10% 20% 30% 40% 50% 60% 70% 80% 90% 100%
Harassed Not harassed
Women in junior or middle
management are the most
likely to have experienced
harassment.
• This is a consistent pattern
when compared with 2002.
23
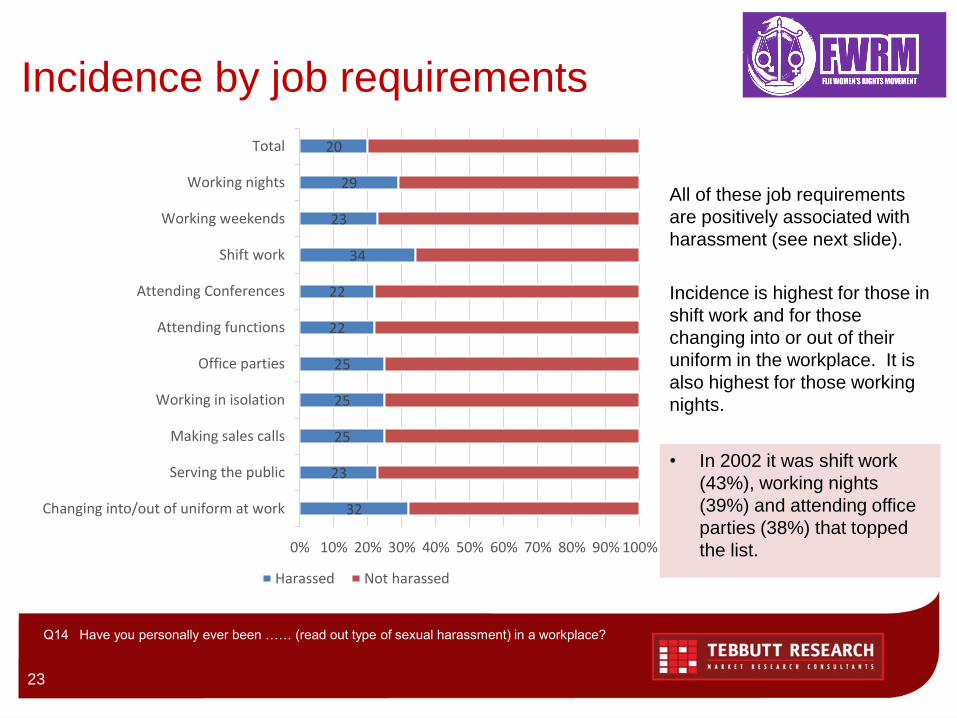
Incidence by job requirements
Q14 Have you personally ever been …… (read out type of sexual harassment) in a workplace?
32
23
25
25
25
22
22
34
23
29
20
Changing into/out of uniform at work
Serving the public
Making sales calls
Working in isolation
Office parties
Attending functions
Attending Conferences
Shift work
Working weekends
Working nights
Total
0% 10% 20% 30% 40% 50% 60% 70% 80% 90% 100%
Harassed Not harassed
All of these job requirements
are positively associated with
harassment (see next slide).
Incidence is highest for those in
shift work and for those
changing into or out of their
uniform in the workplace. It is
also highest for those working
nights.
• In 2002 it was shift work
(43%), working nights
(39%) and attending office
parties (38%) that topped
the list.
24
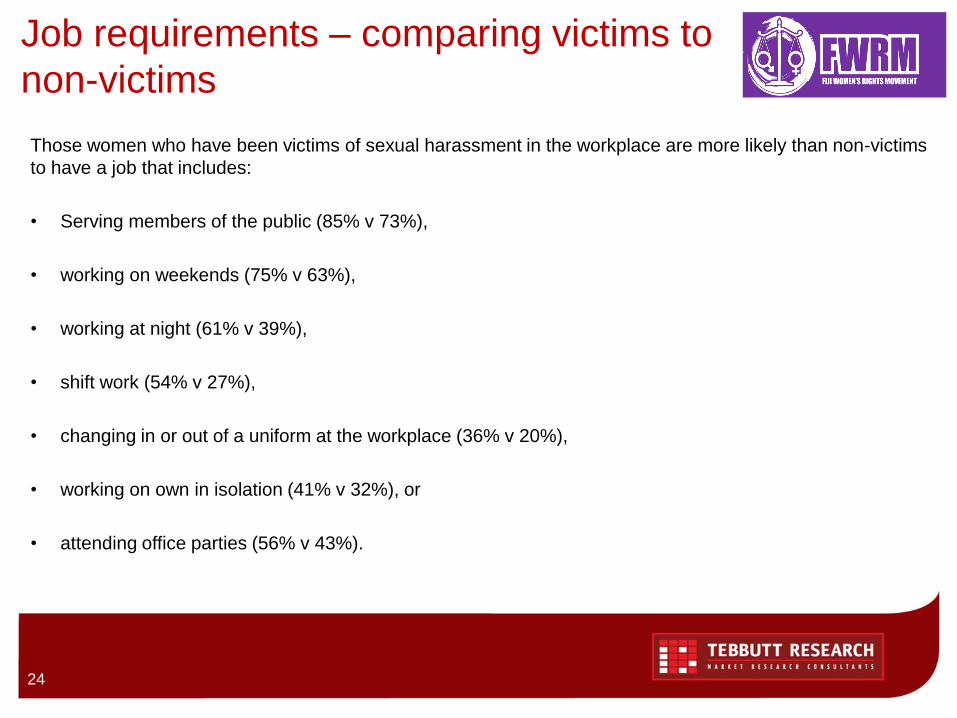
Job requirements – comparing victims to
non-victims
Those women who have been victims of sexual harassment in the workplace are more likely than non-victims
to have a job that includes:
• Serving members of the public (85% v 73%),
• working on weekends (75% v 63%),
• working at night (61% v 39%),
• shift work (54% v 27%),
• changing in or out of a uniform at the workplace (36% v 20%),
• working on own in isolation (41% v 32%), or
• attending office parties (56% v 43%).
25
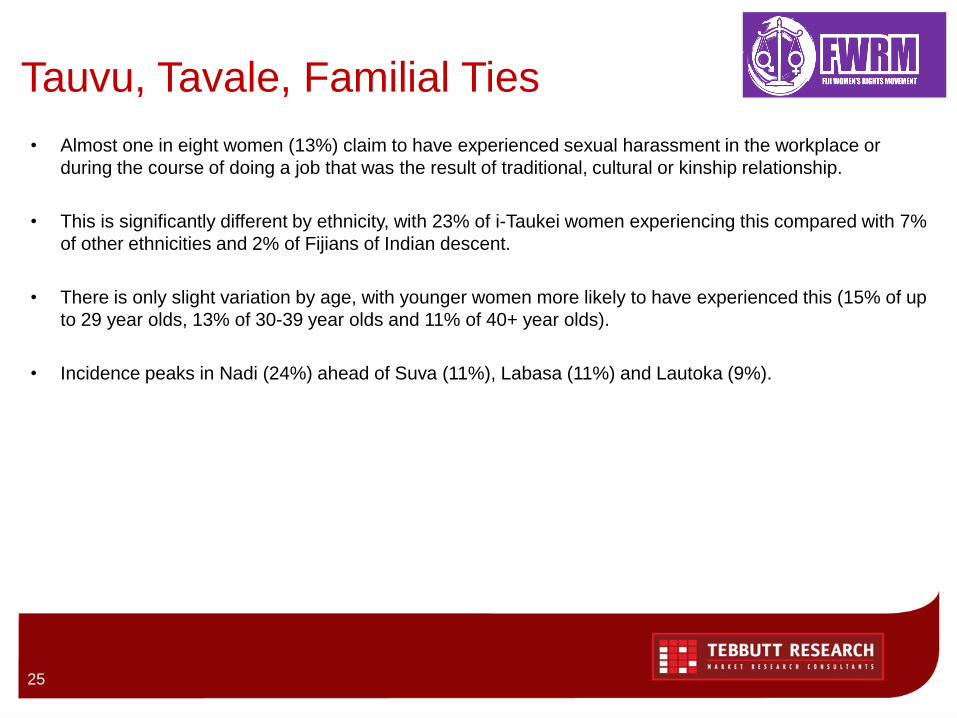
Tauvu, Tavale, Familial Ties
• Almost one in eight women (13%) claim to have experienced sexual harassment in the workplace or
during the course of doing a job that was the result of traditional, cultural or kinship relationship.
• This is significantly different by ethnicity, with 23% of i-Taukei women experiencing this compared with 7%
of other ethnicities and 2% of Fijians of Indian descent.
• There is only slight variation by age, with younger women more likely to have experienced this (15% of up
to 29 year olds, 13% of 30-39 year olds and 11% of 40+ year olds).
• Incidence peaks in Nadi (24%) ahead of Suva (11%), Labasa (11%) and Lautoka (9%).
Types
Incidence of the various types of harassment,
multiplicity, offender profiles
26
27
Types
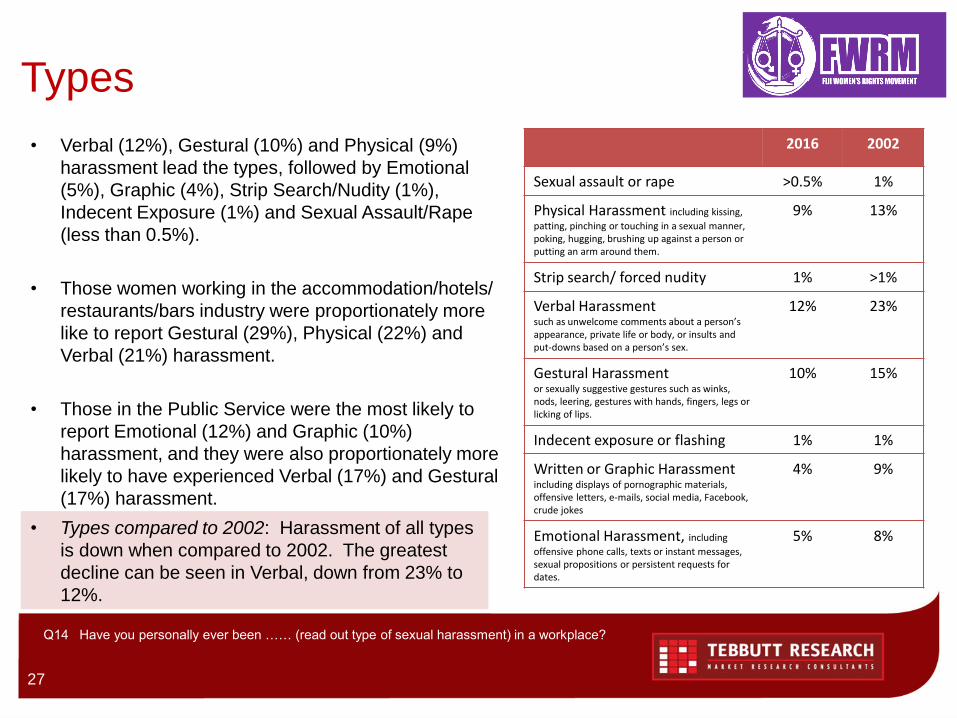
• Verbal (12%), Gestural (10%) and Physical (9%)
harassment lead the types, followed by Emotional
(5%), Graphic (4%), Strip Search/Nudity (1%),
Indecent Exposure (1%) and Sexual Assault/Rape
(less than 0.5%).
• Those women working in the accommodation/hotels/
restaurants/bars industry were proportionately more
like to report Gestural (29%), Physical (22%) and
Verbal (21%) harassment.
• Those in the Public Service were the most likely to
report Emotional (12%) and Graphic (10%)
harassment, and they were also proportionately more
likely to have experienced Verbal (17%) and Gestural
(17%) harassment.
2016 2002
Sexual assault or rape >0.5% 1%
Physical Harassment including kissing,
patting, pinching or touching in a sexual manner, poking, hugging, brushing up against a person or putting an arm around them.
9% 13%
Strip search/ forced nudity 1% >1%
Verbal Harassment such as unwelcome comments about a person’s appearance, private life or body, or insults and put-downs based on a person’s sex.
12% 23%
Gestural Harassment or sexually suggestive gestures such as winks, nods, leering, gestures with hands, fingers, legs or licking of lips.
10% 15%
Indecent exposure or flashing 1% 1%
Written or Graphic Harassment including displays of pornographic materials, offensive letters, e-mails, social media, Facebook, crude jokes
4% 9%
Emotional Harassment, including
offensive phone calls, texts or instant messages, sexual propositions or persistent requests for dates.
5% 8%
Q14 Have you personally ever been …… (read out type of sexual harassment) in a workplace?
• Types compared to 2002: Harassment of all types
is down when compared to 2002. The greatest
decline can be seen in Verbal, down from 23% to
12%.
28
Types and multiplicity
Q14 Have you personally ever been …… (read out type of sexual harassment) in a workplace?
20
80
Incidence
Yes, been harassed No
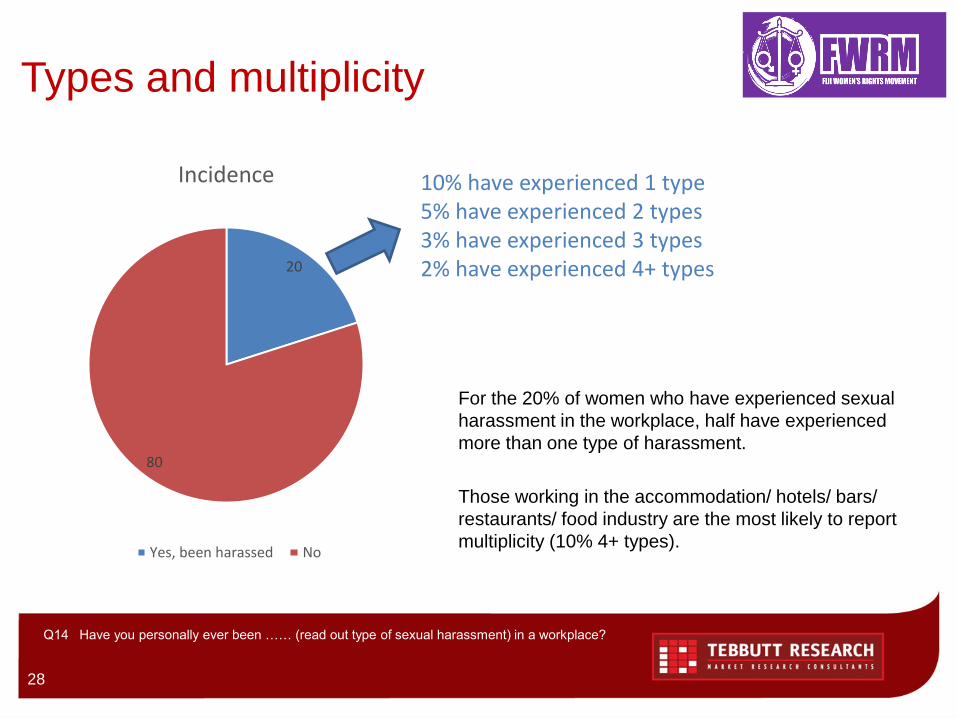
10% have experienced 1 type5% have experienced 2 types3% have experienced 3 types2% have experienced 4+ types
For the 20% of women who have experienced sexual
harassment in the workplace, half have experienced
more than one type of harassment.
Those working in the accommodation/ hotels/ bars/
restaurants/ food industry are the most likely to report
multiplicity (10% 4+ types).
29
Types – where & when
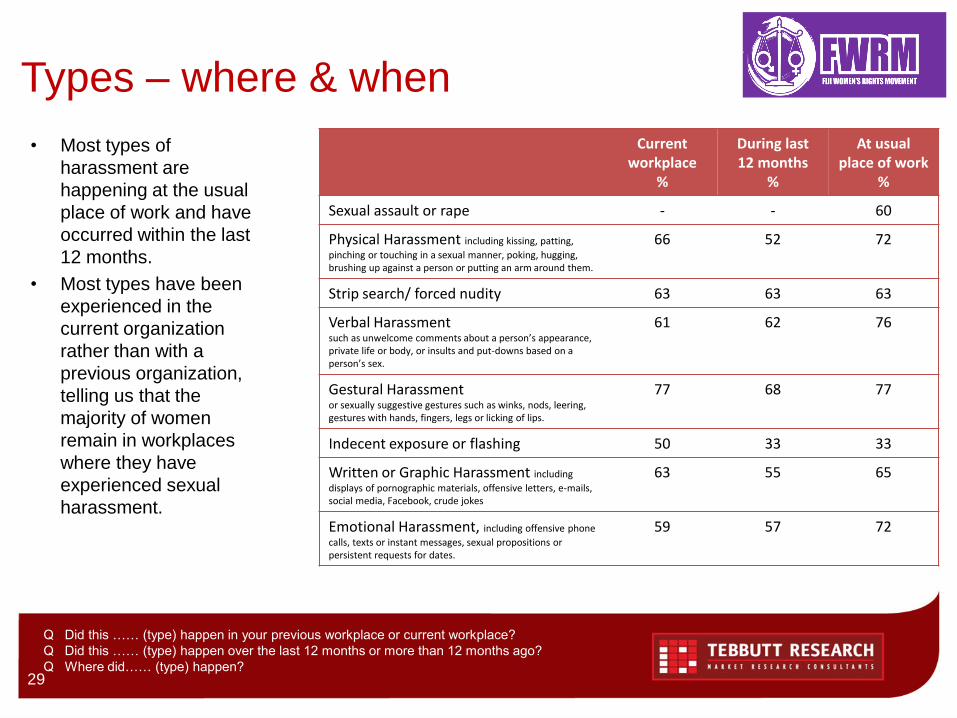
• Most types of
harassment are
happening at the usual
place of work and have
occurred within the last
12 months.
• Most types have been
experienced in the
current organization
rather than with a
previous organization,
telling us that the
majority of women
remain in workplaces
where they have
experienced sexual
harassment.
Current workplace
%
During last 12 months
%
At usualplace of work
%
Sexual assault or rape - - 60
Physical Harassment including kissing, patting,
pinching or touching in a sexual manner, poking, hugging, brushing up against a person or putting an arm around them.
66 52 72
Strip search/ forced nudity 63 63 63
Verbal Harassment such as unwelcome comments about a person’s appearance, private life or body, or insults and put-downs based on a person’s sex.
61 62 76
Gestural Harassment or sexually suggestive gestures such as winks, nods, leering, gestures with hands, fingers, legs or licking of lips.
77 68 77
Indecent exposure or flashing 50 33 33
Written or Graphic Harassment including
displays of pornographic materials, offensive letters, e-mails, social media, Facebook, crude jokes
63 55 65
Emotional Harassment, including offensive phone
calls, texts or instant messages, sexual propositions or persistent requests for dates.
59 57 72
Q Did this …… (type) happen in your previous workplace or current workplace?
Q Did this …… (type) happen over the last 12 months or more than 12 months ago?
Q Where did…… (type) happen?
30
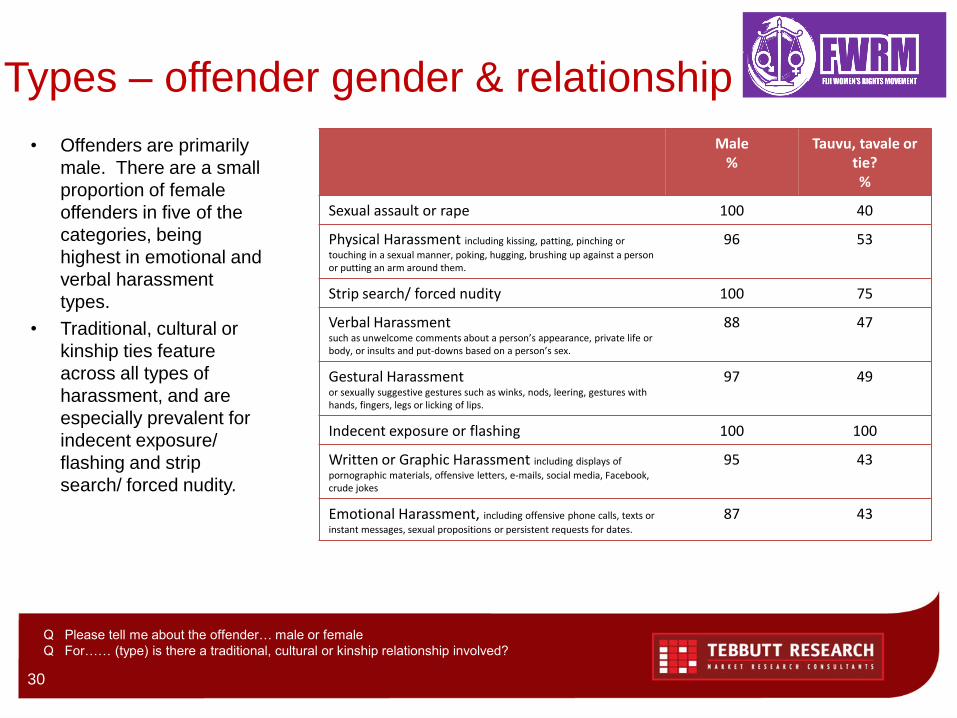
Types – offender gender & relationship
• Offenders are primarily
male. There are a small
proportion of female
offenders in five of the
categories, being
highest in emotional and
verbal harassment
types.
• Traditional, cultural or
kinship ties feature
across all types of
harassment, and are
especially prevalent for
indecent exposure/
flashing and strip
search/ forced nudity.
Male%
Tauvu, tavale or tie?%
Sexual assault or rape 100 40
Physical Harassment including kissing, patting, pinching or
touching in a sexual manner, poking, hugging, brushing up against a person or putting an arm around them.
96 53
Strip search/ forced nudity 100 75
Verbal Harassment such as unwelcome comments about a person’s appearance, private life or body, or insults and put-downs based on a person’s sex.
88 47
Gestural Harassment or sexually suggestive gestures such as winks, nods, leering, gestures with hands, fingers, legs or licking of lips.
97 49
Indecent exposure or flashing 100 100
Written or Graphic Harassment including displays of
pornographic materials, offensive letters, e-mails, social media, Facebook, crude jokes
95 43
Emotional Harassment, including offensive phone calls, texts or
instant messages, sexual propositions or persistent requests for dates.
87 43
Q Please tell me about the offender… male or female
Q For…… (type) is there a traditional, cultural or kinship relationship involved?
31
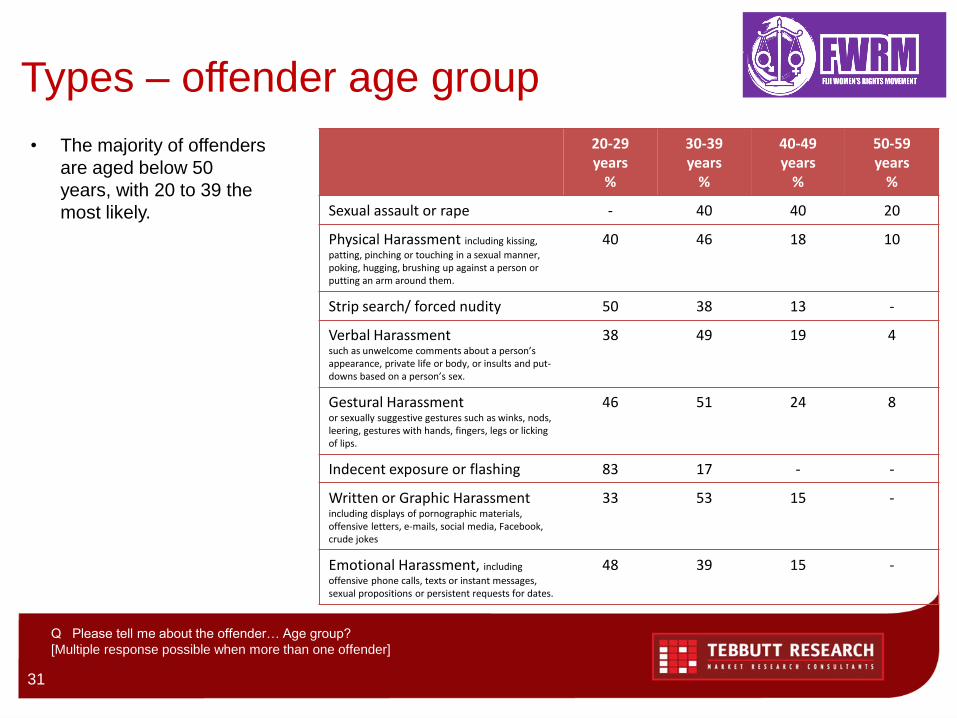
Types – offender age group
• The majority of offenders
are aged below 50
years, with 20 to 39 the
most likely.
20-29 years
%
30-39 years
%
40-49years
%
50-59years
%
Sexual assault or rape - 40 40 20
Physical Harassment including kissing,
patting, pinching or touching in a sexual manner, poking, hugging, brushing up against a person or putting an arm around them.
40 46 18 10
Strip search/ forced nudity 50 38 13 -
Verbal Harassment such as unwelcome comments about a person’s appearance, private life or body, or insults and put-downs based on a person’s sex.
38 49 19 4
Gestural Harassment or sexually suggestive gestures such as winks, nods, leering, gestures with hands, fingers, legs or licking of lips.
46 51 24 8
Indecent exposure or flashing 83 17 - -
Written or Graphic Harassment including displays of pornographic materials, offensive letters, e-mails, social media, Facebook, crude jokes
33 53 15 -
Emotional Harassment, including
offensive phone calls, texts or instant messages, sexual propositions or persistent requests for dates.
48 39 15 -
Q Please tell me about the offender… Age group?
[Multiple response possible when more than one offender]
32
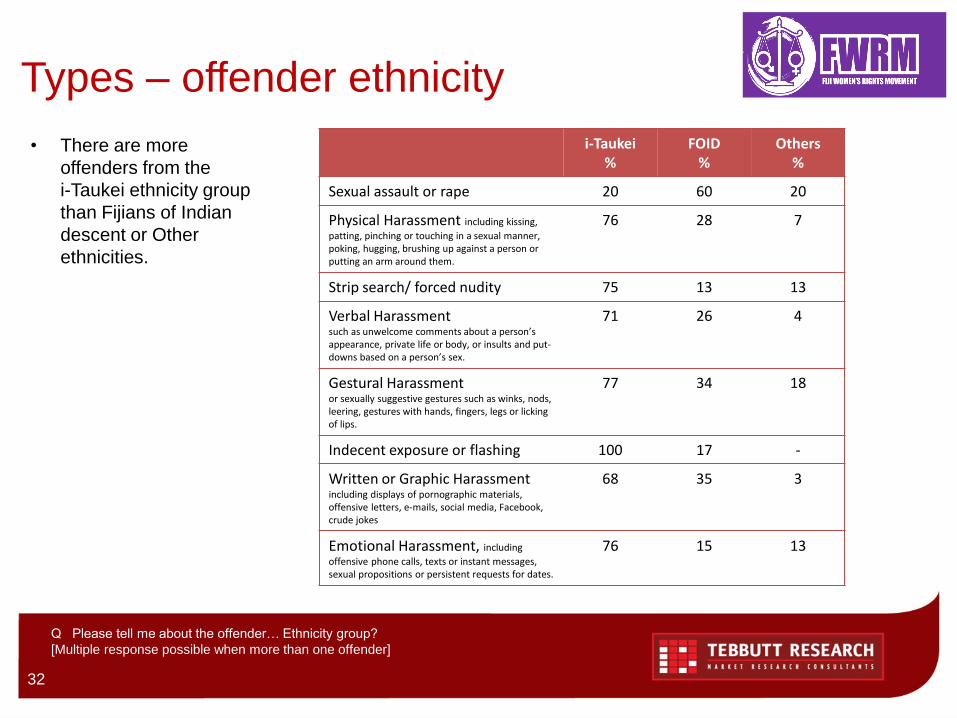
Types – offender ethnicity
• There are more
offenders from the
i-Taukei ethnicity group
than Fijians of Indian
descent or Other
ethnicities.
i-Taukei%
FOID%
Others%
Sexual assault or rape 20 60 20
Physical Harassment including kissing,
patting, pinching or touching in a sexual manner, poking, hugging, brushing up against a person or putting an arm around them.
76 28 7
Strip search/ forced nudity 75 13 13
Verbal Harassment such as unwelcome comments about a person’s appearance, private life or body, or insults and put-downs based on a person’s sex.
71 26 4
Gestural Harassment or sexually suggestive gestures such as winks, nods, leering, gestures with hands, fingers, legs or licking of lips.
77 34 18
Indecent exposure or flashing 100 17 -
Written or Graphic Harassment including displays of pornographic materials, offensive letters, e-mails, social media, Facebook, crude jokes
68 35 3
Emotional Harassment, including
offensive phone calls, texts or instant messages, sexual propositions or persistent requests for dates.
76 15 13
Q Please tell me about the offender… Ethnicity group?
[Multiple response possible when more than one offender]
33
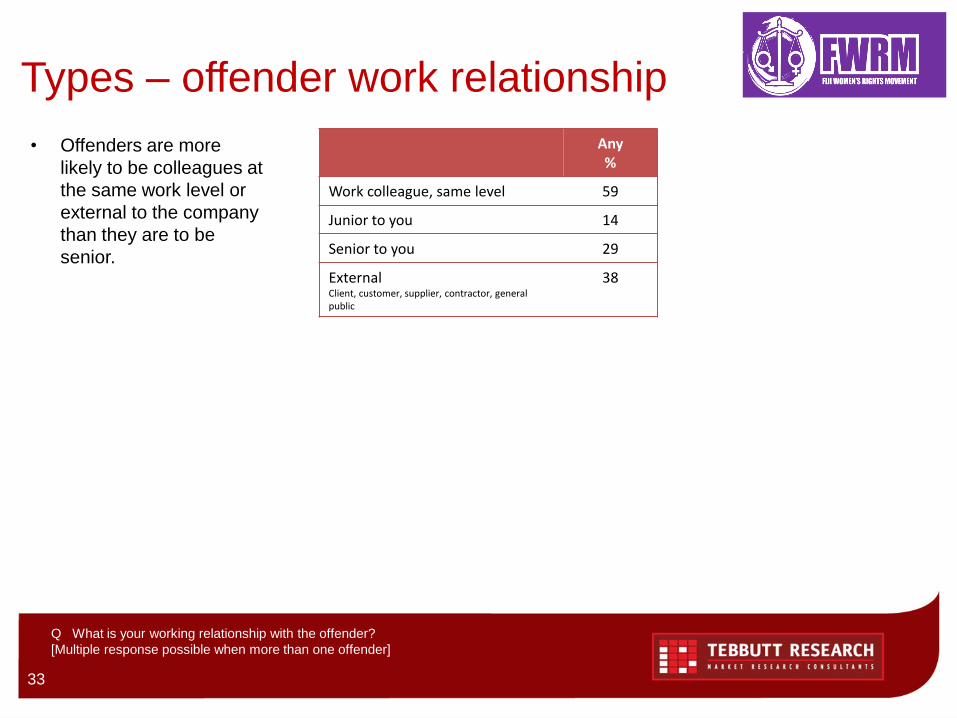
Types – offender work relationship
• Offenders are more
likely to be colleagues at
the same work level or
external to the company
than they are to be
senior.
Any%
Work colleague, same level 59
Junior to you 14
Senior to you 29
External Client, customer, supplier, contractor, general public
38
Q What is your working relationship with the offender?
[Multiple response possible when more than one offender]

Reporting
How many reported it? To whom? What happened?
Triggers and barriers to reporting?
34
35
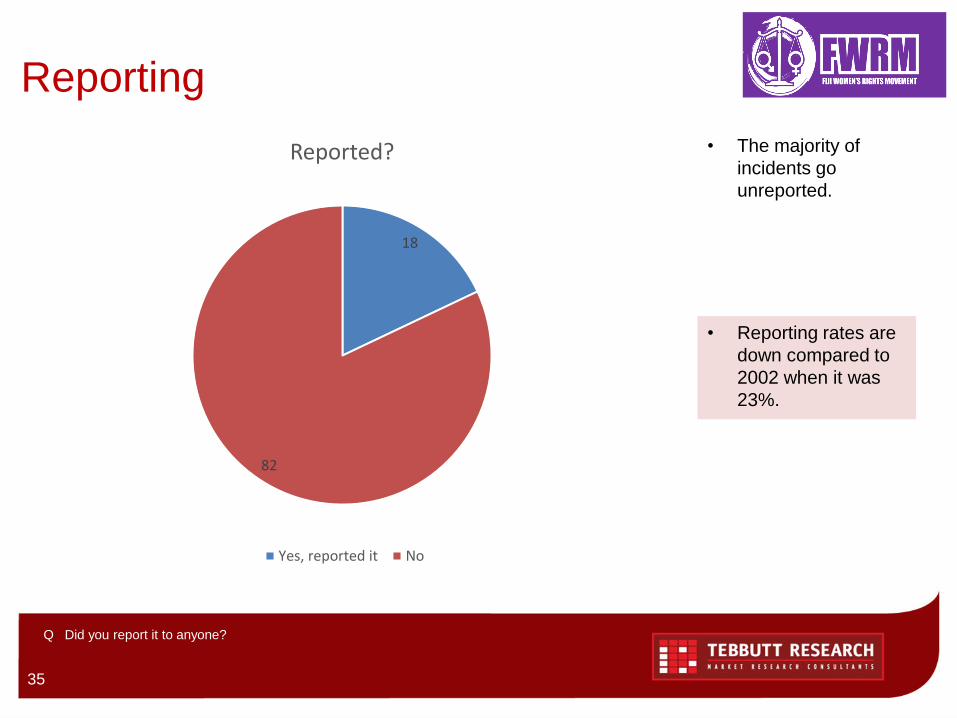
Reporting
• The majority of
incidents go
unreported.
Q Did you report it to anyone?
18
82
Reported?
Yes, reported it No
• Reporting rates are
down compared to
2002 when it was
23%.
36
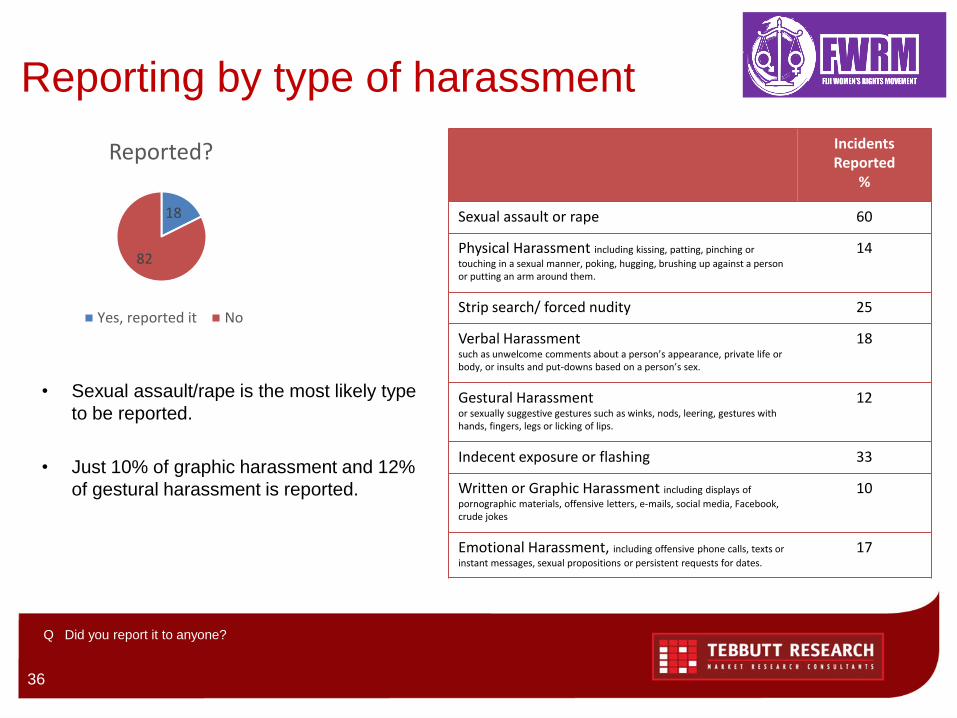
Reporting by type of harassment
• Sexual assault/rape is the most likely type
to be reported.
• Just 10% of graphic harassment and 12%
of gestural harassment is reported.
IncidentsReported
%
Sexual assault or rape 60
Physical Harassment including kissing, patting, pinching or
touching in a sexual manner, poking, hugging, brushing up against a person or putting an arm around them.
14
Strip search/ forced nudity 25
Verbal Harassment such as unwelcome comments about a person’s appearance, private life or body, or insults and put-downs based on a person’s sex.
18
Gestural Harassment or sexually suggestive gestures such as winks, nods, leering, gestures with hands, fingers, legs or licking of lips.
12
Indecent exposure or flashing 33
Written or Graphic Harassment including displays of
pornographic materials, offensive letters, e-mails, social media, Facebook, crude jokes
10
Emotional Harassment, including offensive phone calls, texts or
instant messages, sexual propositions or persistent requests for dates.
17
Q Did you report it to anyone?
18
82
Reported?
Yes, reported it No
37
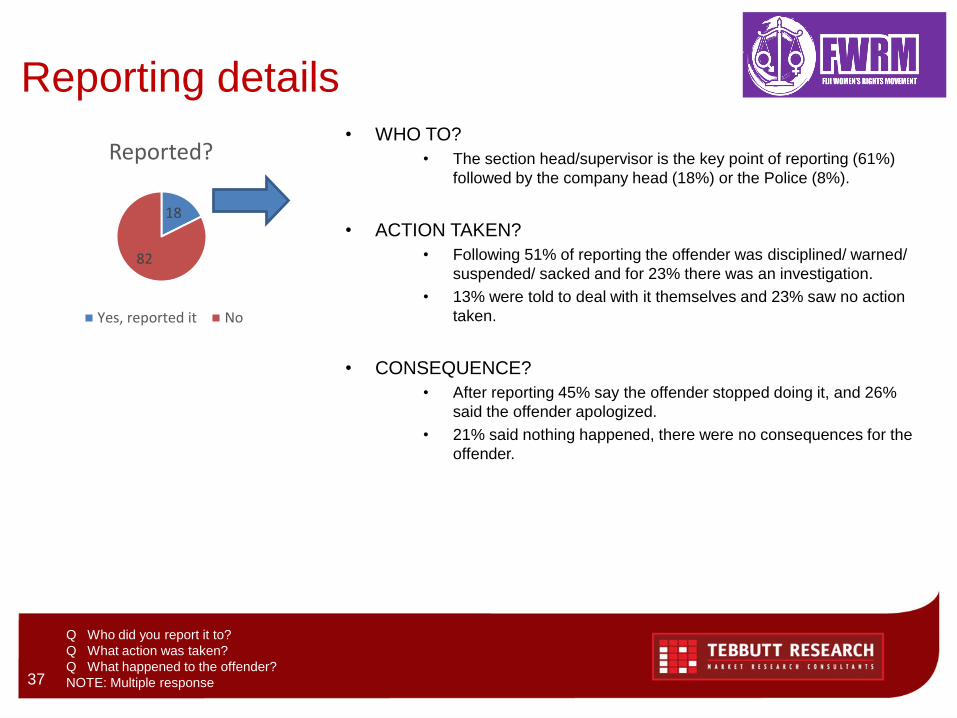
Reporting details• WHO TO?
• The section head/supervisor is the key point of reporting (61%)
followed by the company head (18%) or the Police (8%).
• ACTION TAKEN?
• Following 51% of reporting the offender was disciplined/ warned/
suspended/ sacked and for 23% there was an investigation.
• 13% were told to deal with it themselves and 23% saw no action
taken.
• CONSEQUENCE?
• After reporting 45% say the offender stopped doing it, and 26%
said the offender apologized.
• 21% said nothing happened, there were no consequences for the
offender.
Q Who did you report it to?
Q What action was taken?
Q What happened to the offender?
NOTE: Multiple response
18
82
Reported?
Yes, reported it No
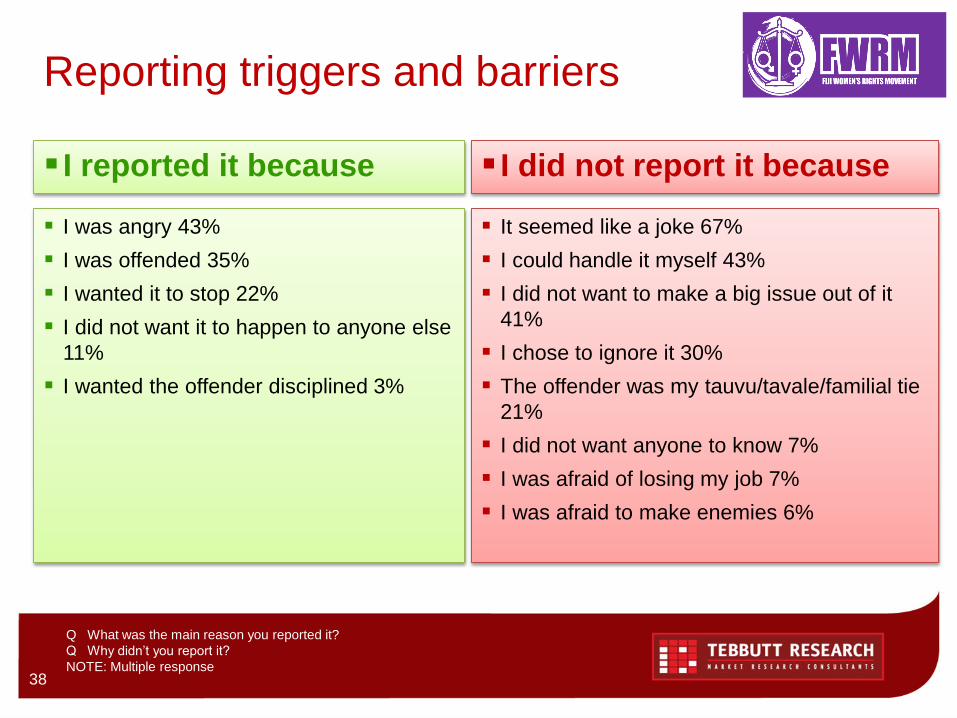
Reporting triggers and barriers
38
I was angry 43%
I was offended 35%
I wanted it to stop 22%
I did not want it to happen to anyone else
11%
I wanted the offender disciplined 3%
It seemed like a joke 67%
I could handle it myself 43%
I did not want to make a big issue out of it
41%
I chose to ignore it 30%
The offender was my tauvu/tavale/familial tie
21%
I did not want anyone to know 7%
I was afraid of losing my job 7%
I was afraid to make enemies 6%
Q What was the main reason you reported it?
Q Why didn’t you report it?
NOTE: Multiple response
I reported it because I did not report it because
Workplace Policy
Do workplaces have a policy? Which types of
workplaces have a policy?
39
40
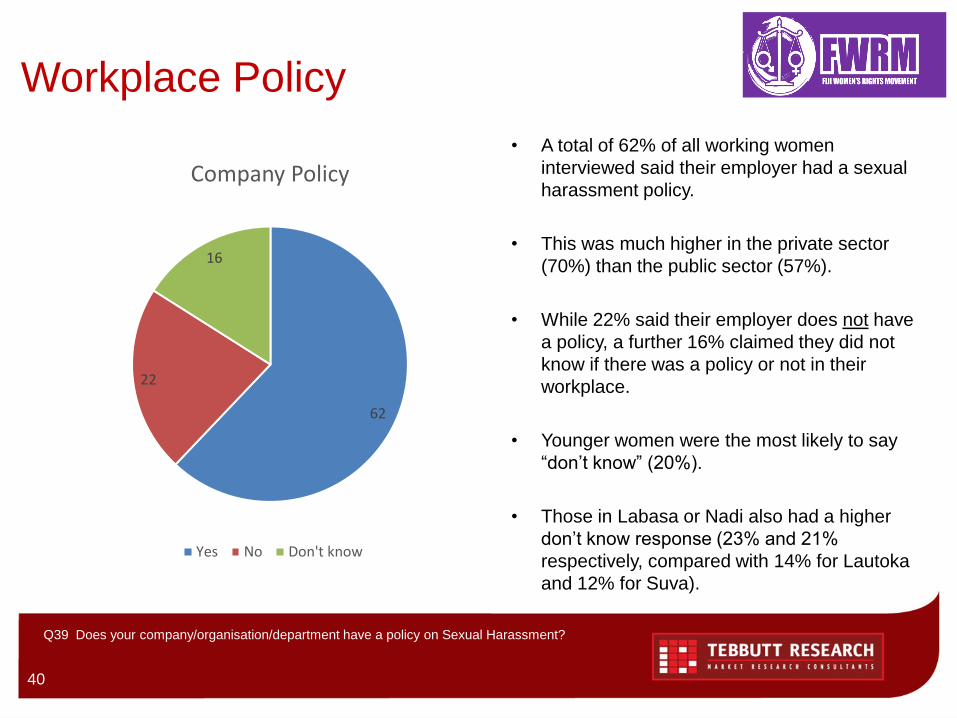
Workplace Policy
• A total of 62% of all working women
interviewed said their employer had a sexual
harassment policy.
• This was much higher in the private sector
(70%) than the public sector (57%).
• While 22% said their employer does not have
a policy, a further 16% claimed they did not
know if there was a policy or not in their
workplace.
• Younger women were the most likely to say
“don’t know” (20%).
• Those in Labasa or Nadi also had a higher
don’t know response (23% and 21%
respectively, compared with 14% for Lautoka
and 12% for Suva).
62
22
16
Company Policy
Yes No Don't know
Q39 Does your company/organisation/department have a policy on Sexual Harassment?
Attitudes
Have attitudes changed?
41
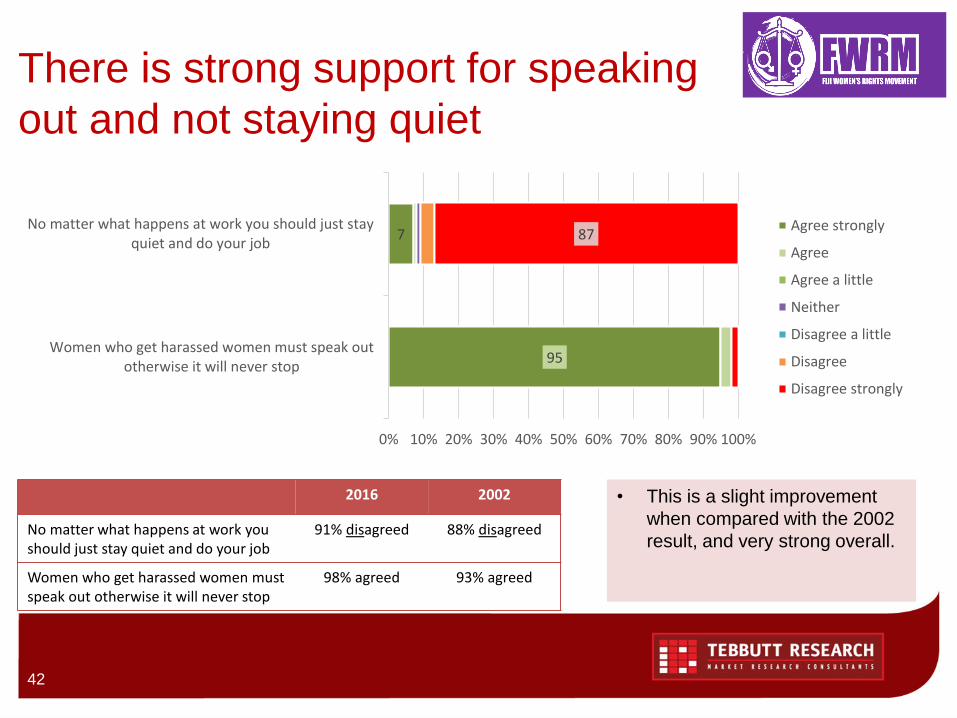
There is strong support for speaking
out and not staying quiet
95
7 87
Women who get harassed women must speak outotherwise it will never stop
No matter what happens at work you should just stayquiet and do your job
0% 10% 20% 30% 40% 50% 60% 70% 80% 90% 100%
Agree strongly
Agree
Agree a little
Neither
Disagree a little
Disagree
Disagree strongly
42
2016 2002
No matter what happens at work you should just stay quiet and do your job
91% disagreed 88% disagreed
Women who get harassed women must speak out otherwise it will never stop
98% agreed 93% agreed
• This is a slight improvement
when compared with the 2002
result, and very strong overall.
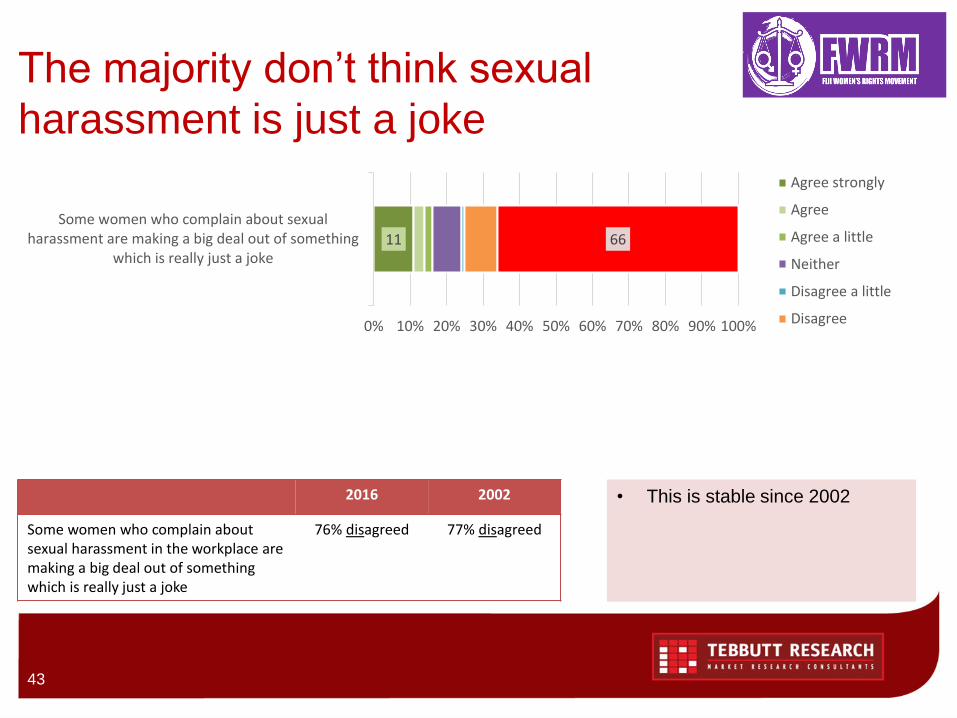
The majority don’t think sexual
harassment is just a joke
11 66
Some women who complain about sexualharassment are making a big deal out of something
which is really just a joke
0% 10% 20% 30% 40% 50% 60% 70% 80% 90% 100%
Agree strongly
Agree
Agree a little
Neither
Disagree a little
Disagree
43
2016 2002
Some women who complain about sexual harassment in the workplace are making a big deal out of something which is really just a joke
76% disagreed 77% disagreed
• This is stable since 2002
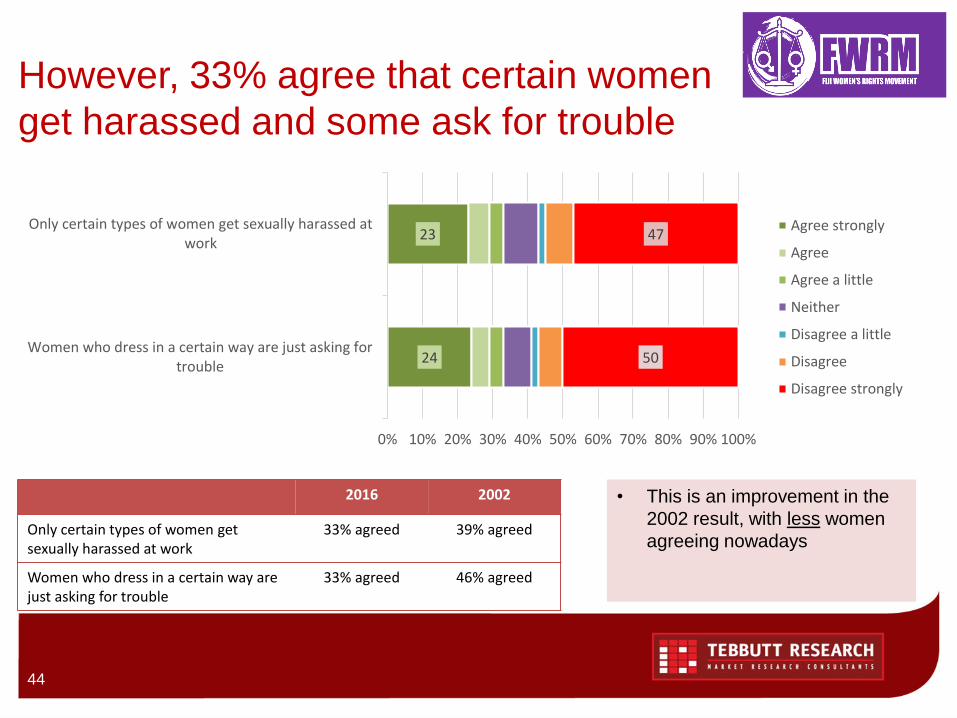
However, 33% agree that certain women
get harassed and some ask for trouble
24
23
50
47
Women who dress in a certain way are just asking fortrouble
Only certain types of women get sexually harassed atwork
0% 10% 20% 30% 40% 50% 60% 70% 80% 90% 100%
Agree strongly
Agree
Agree a little
Neither
Disagree a little
Disagree
Disagree strongly
44
2016 2002
Only certain types of women get sexually harassed at work
33% agreed 39% agreed
Women who dress in a certain way are just asking for trouble
33% agreed 46% agreed
• This is an improvement in the
2002 result, with less women
agreeing nowadays
Thank you!
45
TEBBUTT RESEARCH Tel +617 55324666AUSTRALIA: Level 6, Tower 3, 9 Lawson St, Southport QLD 4215FIJI: Tebbutt House, 18 Suva Street, ToorakPAPUA NEW GUINEA: Level 5, Harbourside West, Stanley Esp, Port Moresby
45


![COGIC Harassment Presentation[1]](https://img.pdfslide.us/doc/110x75/54784a205906b58c318b47ed/cogic-harassment-presentation1.jpg)