Embed Size (px)
Citation preview
RESEARCH PAPER
SnO2 nanocrystals synthesized by microwave-assistedhydrothermal method: towards a relationshipbetween structural and optical properties
Paulo G. Mendes • Mario L. Moreira • Sergio M. Tebcherani •
Marcelo O. Orlandi • J. Andres • Maximu S. Li •
Nora Diaz-Mora • Jose A. Varela • Elson Longo
Received: 30 November 2010 / Accepted: 17 January 2012 / Published online: 12 February 2012
� Springer Science+Business Media B.V. 2012
Abstract The exploration of novel synthetic meth-
odologies that control both size and shape of func-
tional nanostructure opens new avenues for the
functional application of nanomaterials. Here, we
report a new and versatile approach to synthesize
SnO2 nanocrystals (rutile-type structure) using micro-
wave-assisted hydrothermal method. Broad peaks in
the X-ray diffraction spectra indicate the nanosized
nature of the samples which were indexed as a pure
cassiterite tetragonal phase. Chemically and physi-
cally adsorbed water was estimated by TGA data and
FT-Raman spectra to account for a new broad peak
around 560 cm-1 which is related to defective surface
modes. In addition, the spherical-like morphology and
low dispersed distribution size around 3–5 nm were
investigated by HR-TEM and FE-SEM microscopies.
Room temperature PL emission presents two broad
bands at 438 and 764 nm, indicating the existence of
different recombination centers. When the size of the
nanospheres decreases, the relative intensity of
513 nm emission increases and the 393 nm one
decreases. UV–Visible spectra show substantial
changes in the optical absorbance of crystalline
SnO2 nanoparticles while the existence of a small tail
points out the presence of localized levels inside the
forbidden band gap and supplies the necessary condi-
tion for the PL emission.
Keywords SnO2 � Nanoparticles � Microwave-
assisted hydrothermal � Luminescence � Quantum
confinement
Introduction
The continuing trend toward miniaturization associ-
ated with low cost techniques requires preparation
methods with refined control on the size and the shape
of particles (Mao and Wong 2005). Therefore, it will
P. G. Mendes � S. M. Tebcherani
Department of Materials Science, INCTMN, LIMAC,
CIPP, UEPG-Universidade Estadual de Ponta Grossa, Av.
Gal. Carlos Cavalcanti, 4748, Campus, Uvaranas, Ponta
Grossa, PR CEP 84035-900, Brazil
M. L. Moreira (&) � M. O. Orlandi � J. A. Varela �E. Longo
Department of Physical Chemistry, Institute of Chemistry,
INCTMN, LIEC, UNESP-Universidade Estadual Paulista,
Prof. Francisco Degni Street, s/no, Quitandinha,
Araraquara, SP 14800-900, Brazil
e-mail: [email protected]
J. Andres
Department of Experimental Sciences, University
of Jaume I, 12071 Castellon de la Plana, Spain
M. S. Li
Instituto de Fısica, INCTMN, USP, P.O. Box 369,
Sao Carlos, SP 13560-970, Brazil
N. Diaz-Mora
Parque Tecnologico de Itaipu (PTI), Laboratorio de
Materiais (LAMAT/UNIOESTE), Foz do Iguacu, Brazil
123
J Nanopart Res (2012) 14:750
DOI 10.1007/s11051-012-0750-7
be of fundamental and technological interest to
develop facile and effective methods to get ready
metal oxide nanostructures with fine shape and size
control. Tin oxide (SnO2) is perhaps one of the most
intriguing materials to be investigated today, possess-
ing many unique properties for various cutting-edge
applications ranging from gas sensing to catalyst and
optical electronic devices (Epifani et al. 2006; Pianaro
et al. 1995, 1998; Jiang et al. 2005; Batzill 2006;
Moreira et al. 2006). SnO2 is an important n-type
metallic oxide semiconductor with a wide band gap
(3.6 eV) at room temperature. At the nanoscale level,
this materials exhibit fascinating properties that differ
drastically from their bulk counterparts (Alivisatos
1996 #47; El-Sayed 2004 #27; Huang et al. 2005#20;
Roduner 2006 #13).
It is well known that the size and the morphology of
the nanomaterials greatly affect their properties as well
their further applications due to their high surface-to-
volume ratio, enhanced characteristics of quantum size
effects, and high fraction of chemically similar surface
sites (Zhu et al. 2006). However, the diameter of SnO2
nanocrystals is required to be smaller or comparable to
its exciton Bohr radius (2.7 nm) for the emergence of
the quantum confinement effect and this limits their
applications to some extent. If this limitation can be
overcome, unique properties such as a blue shift of the
band edge transition energy, unusual structural and
optical properties can be sensed (Leite et al. 2000).
Bulk SnO2 is not very luminescent (Her et al. 2006)
while nanosized SnO2 nanoparticles and nanoribbons
have been shown to exhibit an intense broad lumines-
cence (400–600 nm) when they are excited by ultra-
violet (UV) light (Hu et al. 2003a; Cai et al. 2005; Luo
et al. 2006), X-ray (Zhou et al. 2006b), or high-energy
electrons. Nanosized SnO2 structures such as nano-
belts (Orlandi et al. 2008), nanotubes (Zhao et al.
2007), and nanodisks (Dai et al. 2002b) has been
prepared with moderate success. Some methods, such
as hydrothermal (Fang et al. 2009) and solvothermal
(Zhu et al. 2006; Liu et al. 2008; Cheng et al. 2004),
chemical vapor condensation (Liu et al. 2001b), spark
processing (Chang and Park 2002), sputtering and
laser ablation (Wang 2003 #32; Gole and Wang
2001#37; Sun et al. 2003 #33; Hu et al. 2003a, b #30)
as well as colloidal growth (Ribeiro et al. 2004)
assisted by a dialysis process have been employed.
Also, the sol–gel (Cao et al. 2006), chemical vapor
deposition (Liu et al. 2001b), rapid oxidation of metal
tin (Hu et al. 2003a), spray pyrolysis (Paraguay-
Delgado et al. 2005), thermal evaporation of oxide
powders (Dai et al. 2002a), and molten salt methods
have been applied (Liu et al. 2001a). To obtain
quantum size SnO2 nanocrystallites, the sol–gel
method (Del Castillo et al. 2005) and hydrolysis of
SnCl2�2H2O have been reported in the literature
(Zhu et al. 2006). Recently, SnO2 quantum dots were
also fabricated using hydrazine hydrate as the miner-
alizer instead of NaOH by a hydrothermal route
(Paraguay-Delgado et al. 2005). However, relatively
high temperatures and/or elaborated stages during the
synthesis are necessary for these methods and further
thermal annealing is usually necessary to obtain good
crystalline samples (Jouhannaud et al. 2008). There-
fore, the development of synthetic routes for the
production of SnO2 nanostructures with controlled size
and tunable shapes by wet chemical methods (Jiang
et al. 2005; Chen and Gao 2004) remains a challenge.
Recently, several efforts devoted to the synthesis of
metal oxide nanostructures with controlled morpholo-
gies have produced promising results.(Patzke et al.
2010) Microwave-mediated synthesis for organic mol-
ecules and inorganic nanomaterials is of broad interest
during the past decade. In particular, an alternative
method using a hydrothermal route assisted by micro-
wave radiation heating has emerged in the field of
powder preparation with both expected and unexpected
merits, e.g., kinetic enhancement, reaction temperature,
time reduction, and homogeneous temperature during
all annealing processes with controllability over parti-
cle sizes (Mao and Wong 2005 #80; Volanti et al. 2008
#84; Rao et al. 1999 #88; Komarneni et al. 1992 #49;
Krishna and Komarneni 2009 #95). In 1992, Komarn-
eni et al. (1992) introduced the microwave-assisted
hydrothermal (MAH) method for the synthesis of
electroceramic powders, a genuine low temperature and
fast reacting rate method (Komarneni et al. 1992;
Krishna and Komarneni 2009). In particular, these
authors have also reported the synthesis of SnO2 by
conventional hydrothermal and MAH methods using
different temperatures and additives. In this respect,
microwave heating is emerging as a rapid and envi-
ronmentally friendly mode of heating for the generation
of nanomaterials and very recently different reviews
have been published where clean, fast, and high
yielding reactions under microwave conditions have
been emphasized (Baruwati et al. 2009; Bilecka and
Niederberger 2010; Strauss and Rooney 2010).
Page 2 of 13 J Nanopart Res (2012) 14:750
123
Therefore, microwave irradiation is now recog-
nized as an attractive method for the synthesis of
nanocrystals and has the advantages of short reaction
time, small particle size, narrow particle size distri-
bution, and high purity.(Raghuveer et al. 2006; Gallis
and Landry 2001; Gerbec et al. 2005; Panda et al.
2006). Their main advantage over other conventional
heating methods is rapid and uniform heating of the
reaction mixture. Despite these hydrothermal strate-
gies, the direct synthesis of metal oxide nanostructures
with designed chemical components and controlled
morphologies is still considerably difficult. In spite of
the potential for technological applications of SnO2
nanopowders (Jouhannaud et al. 2008; Pires et al.
2008; Wu et al. 2002), the role of heating rates and
favorable conditions in the MAH method for the
synthesis of SnO2 powders was not fully reported in
the literature. Our group has been able to synthesized,
by means of MAH method, different crystalline,
micro-, and/or nanoscale materials.(Moreira et al.
2011; Volanti et al. 2011; Macario et al. 2010).
Understanding the structural, physical, and chem-
ical properties of SnO2 and the changes that can be
induced in its structure and consequently its other
properties can offer new routes to address the
challenges associated with this material. In this study,
we report a direct process to obtain nanostructured
SnO2 powders through the MAH method, using low
temperatures and short annealing times in an environ-
mental synthesis. The powders were investigated and
characterized by different techniques which were used
as tools to investigate the structural order–disorder
degree of crystalline SnO2 samples. A friendly model
to establish the relationship between quantum con-
finement model and order–disorder features are used
to describe the optical property of tin oxide. The
remainder of this article is organized as follows: the
next two sections address the experimental procedures
and characterization techniques. In the next section,
the results are presented and discussed in detail.
Finally, our main conclusions are summarized.
Experimental section
The desirable SnO2 samples were prepared using
SnCl4�5H2O (98\%, Aldrich) at 0.14 M as a precursor
due their higher solubility if compared to SnCl2. This
reagent was slowly added into 200 mL of deionized
water at room temperature under stirring to produce a
transparent colloidal solution. In our experiments,
hydrochloric acid formed after tin chloride dissolution
was used as a means to dose OH- ions slowly and
uniformly throughout the reaction. We found that the
concentration of HCl was enhanced. Portions (100 mL)
were prepared for each sample and loaded into a
110-mL sealed polytetrafluoroethene (PTFE) auto-
clave reaching approximately 90% of the total volume
and thus providing maximum pressure efficiency to the
system (Walton 2002). The product was placed in a
MAH system using 2.45 GHz of microwave radiation
with a maximum output power of 800 W. The reaction
mixture was heated to 160 �C in 1 min (at 800 W) and
was kept at that temperature for 10 (S10) and 60
(S60) min without stirring under a constant pressure of
5 bar. After the reaction, the autoclave was naturally
cooled to room temperature. The solid product was
washed with deionized water several times until the
effluent pH was neutral and then dried at 80 �C for 12 h.
Characterizations
X-ray diffraction (XRD) powder spectra were
obtained using a Rigaku DMax 2500PC instrument
with Cu Ka radiation. Data were collected from 20� to
110� in 2h range with a 0.5� divergence slit and a 0.3-
mm receiving slit. Data were collected in a fixed-time
mode with a 0.02� step size and a 2 s/point. The
surface areas were analyzed by adsorption/desorption
isotherms of N2 employing the Brunauer–Emmett–
Teller (BET) method was using Micromeritics ASAP
2000 equipment.
Thermal properties of samples were examined by
TGA measurements (NEZTSCH Thermische Analyze
STA409 Cell) with a heating rate of 10 �C/min up to
1,000 �C under flowing N2 gas initially. Microstruc-
tural analyses were made by Transmission Electron
Microscopy (TEM) Philips CM 200 and Field Emis-
sion Scanning Electron Microscopy (FE-SEM) Zeiss
SupraTM
35. FT-Raman spectra were recorded on
a RFS/100/S Bruker Fourier Transform Raman
(FT-Raman) spectrometer with a Nd:YAG laser
providing an excitation light at 1,064 nm having a
spectral resolution of 4 cm-1. UV–Visible absorption
coefficients were measured with Varian Cary 5 G
using an integration sphere through a total reflectance
mode. PL spectra were collected with a Thermal
Jarrel-Ash Monospec 27 monochromator and a
J Nanopart Res (2012) 14:750 Page 3 of 13
123
Hamamatsu R446 photomultiplier. The 350.7 nm
exciting wavelength of a krypton ion laser (Coherent
Innova) with the nominal output power maintained at
200 mW. All characterizations were recorded at room
temperature.
Results and discussion
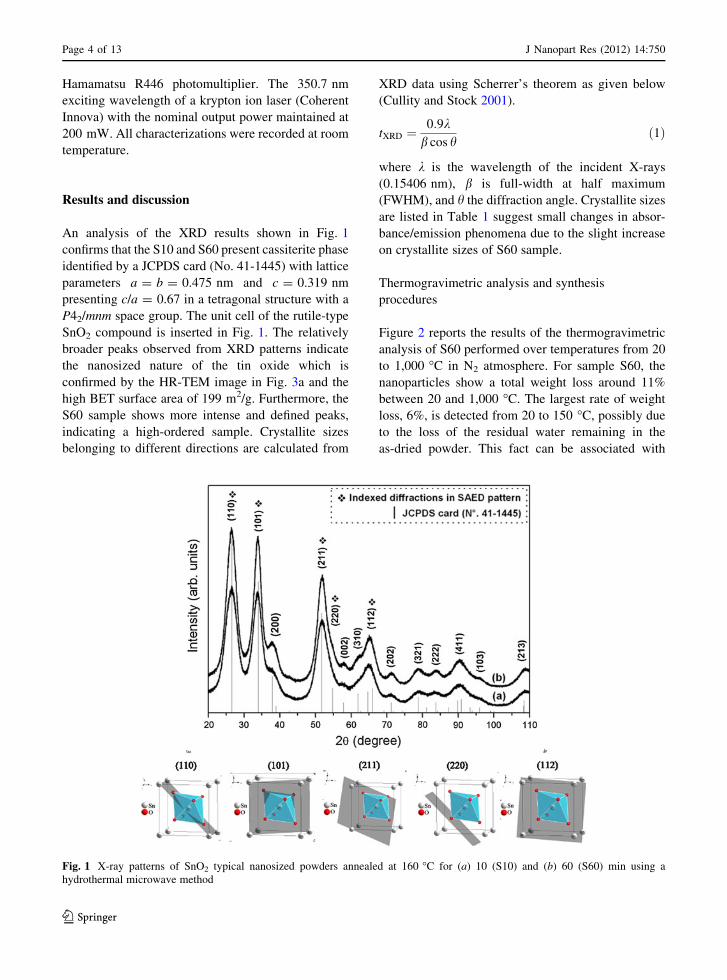
An analysis of the XRD results shown in Fig. 1
confirms that the S10 and S60 present cassiterite phase
identified by a JCPDS card (No. 41-1445) with lattice
parameters a = b = 0.475 nm and c = 0.319 nm
presenting c/a = 0.67 in a tetragonal structure with a
P42/mnm space group. The unit cell of the rutile-type
SnO2 compound is inserted in Fig. 1. The relatively
broader peaks observed from XRD patterns indicate
the nanosized nature of the tin oxide which is
confirmed by the HR-TEM image in Fig. 3a and the
high BET surface area of 199 m2/g. Furthermore, the
S60 sample shows more intense and defined peaks,
indicating a high-ordered sample. Crystallite sizes
belonging to different directions are calculated from
XRD data using Scherrer’s theorem as given below
(Cullity and Stock 2001).
tXRD ¼0:9k
b cos hð1Þ
where k is the wavelength of the incident X-rays
(0.15406 nm), b is full-width at half maximum
(FWHM), and h the diffraction angle. Crystallite sizes
are listed in Table 1 suggest small changes in absor-
bance/emission phenomena due to the slight increase
on crystallite sizes of S60 sample.
Thermogravimetric analysis and synthesis
procedures
Figure 2 reports the results of the thermogravimetric
analysis of S60 performed over temperatures from 20
to 1,000 �C in N2 atmosphere. For sample S60, the
nanoparticles show a total weight loss around 11%
between 20 and 1,000 �C. The largest rate of weight
loss, 6%, is detected from 20 to 150 �C, possibly due
to the loss of the residual water remaining in the
as-dried powder. This fact can be associated with
Fig. 1 X-ray patterns of SnO2 typical nanosized powders annealed at 160 �C for (a) 10 (S10) and (b) 60 (S60) min using a
hydrothermal microwave method
Page 4 of 13 J Nanopart Res (2012) 14:750
123
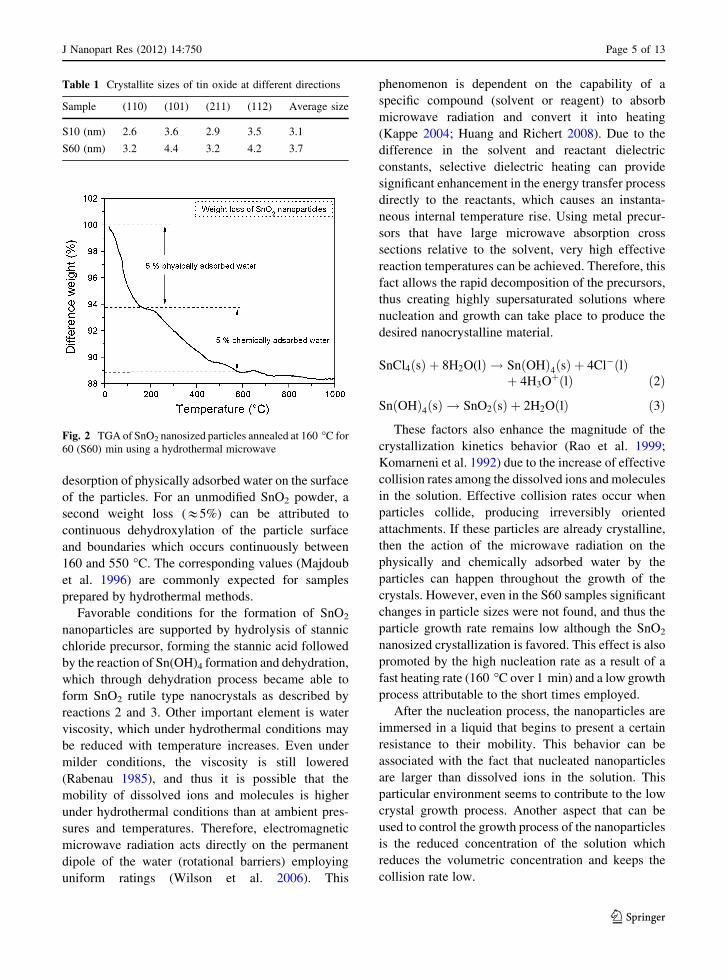
desorption of physically adsorbed water on the surface
of the particles. For an unmodified SnO2 powder, a
second weight loss (&5%) can be attributed to
continuous dehydroxylation of the particle surface
and boundaries which occurs continuously between
160 and 550 �C. The corresponding values (Majdoub
et al. 1996) are commonly expected for samples
prepared by hydrothermal methods.
Favorable conditions for the formation of SnO2
nanoparticles are supported by hydrolysis of stannic
chloride precursor, forming the stannic acid followed
by the reaction of Sn(OH)4 formation and dehydration,
which through dehydration process became able to
form SnO2 rutile type nanocrystals as described by
reactions 2 and 3. Other important element is water
viscosity, which under hydrothermal conditions may
be reduced with temperature increases. Even under
milder conditions, the viscosity is still lowered
(Rabenau 1985), and thus it is possible that the
mobility of dissolved ions and molecules is higher
under hydrothermal conditions than at ambient pres-
sures and temperatures. Therefore, electromagnetic
microwave radiation acts directly on the permanent
dipole of the water (rotational barriers) employing
uniform ratings (Wilson et al. 2006). This
phenomenon is dependent on the capability of a
specific compound (solvent or reagent) to absorb
microwave radiation and convert it into heating
(Kappe 2004; Huang and Richert 2008). Due to the
difference in the solvent and reactant dielectric
constants, selective dielectric heating can provide
significant enhancement in the energy transfer process
directly to the reactants, which causes an instanta-
neous internal temperature rise. Using metal precur-
sors that have large microwave absorption cross
sections relative to the solvent, very high effective
reaction temperatures can be achieved. Therefore, this
fact allows the rapid decomposition of the precursors,
thus creating highly supersaturated solutions where
nucleation and growth can take place to produce the
desired nanocrystalline material.
SnCl4ðsÞ þ 8H2O(lÞ ! SnðOHÞ4ðsÞ þ 4Cl�ðlÞþ 4H3OþðlÞ ð2Þ
SnðOHÞ4ðsÞ ! SnO2ðsÞ þ 2H2OðlÞ ð3Þ
These factors also enhance the magnitude of the
crystallization kinetics behavior (Rao et al. 1999;
Komarneni et al. 1992) due to the increase of effective
collision rates among the dissolved ions and molecules
in the solution. Effective collision rates occur when
particles collide, producing irreversibly oriented
attachments. If these particles are already crystalline,
then the action of the microwave radiation on the
physically and chemically adsorbed water by the
particles can happen throughout the growth of the
crystals. However, even in the S60 samples significant
changes in particle sizes were not found, and thus the
particle growth rate remains low although the SnO2
nanosized crystallization is favored. This effect is also
promoted by the high nucleation rate as a result of a
fast heating rate (160 �C over 1 min) and a low growth
process attributable to the short times employed.
After the nucleation process, the nanoparticles are
immersed in a liquid that begins to present a certain
resistance to their mobility. This behavior can be
associated with the fact that nucleated nanoparticles
are larger than dissolved ions in the solution. This
particular environment seems to contribute to the low
crystal growth process. Another aspect that can be
used to control the growth process of the nanoparticles
is the reduced concentration of the solution which
reduces the volumetric concentration and keeps the
collision rate low.
Table 1 Crystallite sizes of tin oxide at different directions
Sample (110) (101) (211) (112) Average size
S10 (nm) 2.6 3.6 2.9 3.5 3.1
S60 (nm) 3.2 4.4 3.2 4.2 3.7
Fig. 2 TGA of SnO2 nanosized particles annealed at 160 �C for
60 (S60) min using a hydrothermal microwave
J Nanopart Res (2012) 14:750 Page 5 of 13
123
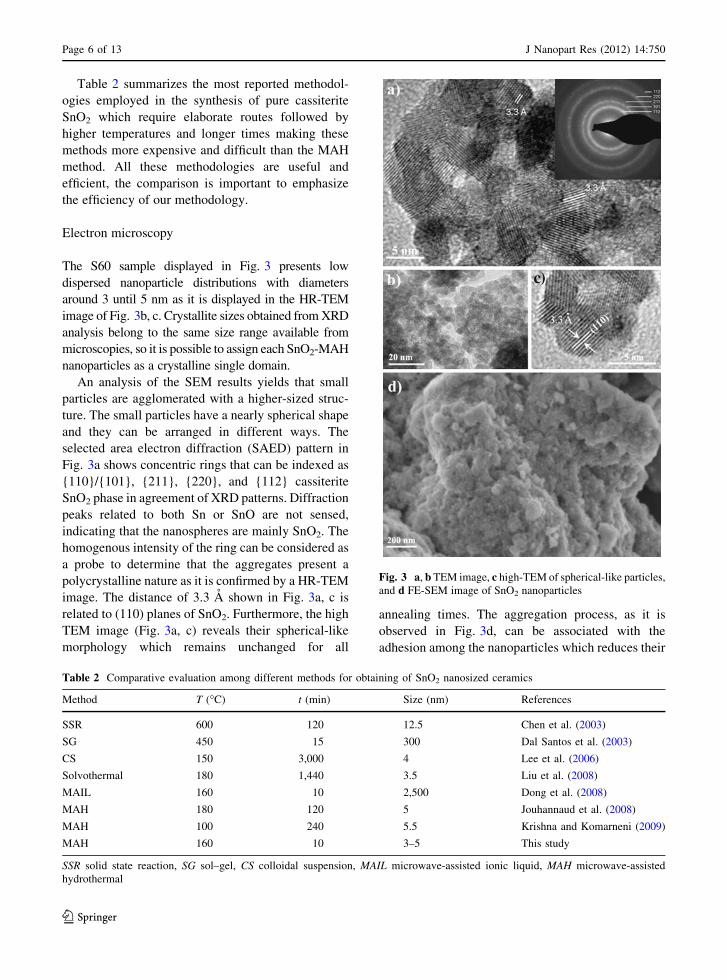
Table 2 summarizes the most reported methodol-
ogies employed in the synthesis of pure cassiterite
SnO2 which require elaborate routes followed by
higher temperatures and longer times making these
methods more expensive and difficult than the MAH
method. All these methodologies are useful and
efficient, the comparison is important to emphasize
the efficiency of our methodology.
Electron microscopy
The S60 sample displayed in Fig. 3 presents low
dispersed nanoparticle distributions with diameters
around 3 until 5 nm as it is displayed in the HR-TEM
image of Fig. 3b, c. Crystallite sizes obtained from XRD
analysis belong to the same size range available from
microscopies, so it is possible to assign each SnO2-MAH
nanoparticles as a crystalline single domain.
An analysis of the SEM results yields that small
particles are agglomerated with a higher-sized struc-
ture. The small particles have a nearly spherical shape
and they can be arranged in different ways. The
selected area electron diffraction (SAED) pattern in
Fig. 3a shows concentric rings that can be indexed as
{110}/{101}, {211}, {220}, and {112} cassiterite
SnO2 phase in agreement of XRD patterns. Diffraction
peaks related to both Sn or SnO are not sensed,
indicating that the nanospheres are mainly SnO2. The
homogenous intensity of the ring can be considered as
a probe to determine that the aggregates present a
polycrystalline nature as it is confirmed by a HR-TEM
image. The distance of 3.3 A shown in Fig. 3a, c is
related to (110) planes of SnO2. Furthermore, the high
TEM image (Fig. 3a, c) reveals their spherical-like
morphology which remains unchanged for all
annealing times. The aggregation process, as it is
observed in Fig. 3d, can be associated with the
adhesion among the nanoparticles which reduces their
Table 2 Comparative evaluation among different methods for obtaining of SnO2 nanosized ceramics
Method T (�C) t (min) Size (nm) References
SSR 600 120 12.5 Chen et al. (2003)
SG 450 15 300 Dal Santos et al. (2003)
CS 150 3,000 4 Lee et al. (2006)
Solvothermal 180 1,440 3.5 Liu et al. (2008)
MAIL 160 10 2,500 Dong et al. (2008)
MAH 180 120 5 Jouhannaud et al. (2008)
MAH 100 240 5.5 Krishna and Komarneni (2009)
MAH 160 10 3–5 This study
SSR solid state reaction, SG sol–gel, CS colloidal suspension, MAIL microwave-assisted ionic liquid, MAH microwave-assisted
hydrothermal
Fig. 3 a, b TEM image, c high-TEM of spherical-like particles,
and d FE-SEM image of SnO2 nanoparticles
Page 6 of 13 J Nanopart Res (2012) 14:750
123
surface energy because primary particles have ten-
dency to form small aggregations. By forming a nearly
spherical or equi-axed arrangement, a minimum
surface free energy can be achieved (Gervais and
Kress 1985).
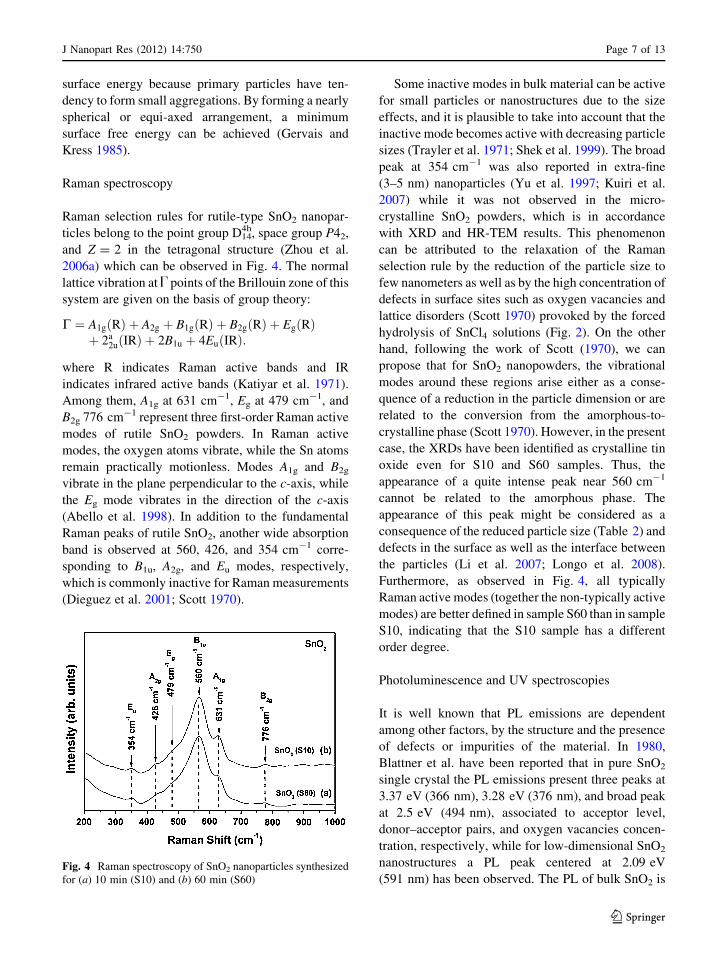
Raman spectroscopy
Raman selection rules for rutile-type SnO2 nanopar-
ticles belong to the point group D144h, space group P42,
and Z = 2 in the tetragonal structure (Zhou et al.
2006a) which can be observed in Fig. 4. The normal
lattice vibration at U points of the Brillouin zone of this
system are given on the basis of group theory:
C ¼ A1g Rð Þ þ A2g þ B1g Rð Þ þ B2g Rð Þ þ Eg Rð Þþ 2a
2u IRð Þ þ 2B1u þ 4Eu IRð Þ:
where R indicates Raman active bands and IR
indicates infrared active bands (Katiyar et al. 1971).
Among them, A1g at 631 cm-1, Eg at 479 cm-1, and
B2g 776 cm-1 represent three first-order Raman active
modes of rutile SnO2 powders. In Raman active
modes, the oxygen atoms vibrate, while the Sn atoms
remain practically motionless. Modes A1g and B2g
vibrate in the plane perpendicular to the c-axis, while
the Eg mode vibrates in the direction of the c-axis
(Abello et al. 1998). In addition to the fundamental
Raman peaks of rutile SnO2, another wide absorption
band is observed at 560, 426, and 354 cm-1 corre-
sponding to B1u, A2g, and Eu modes, respectively,
which is commonly inactive for Raman measurements
(Dieguez et al. 2001; Scott 1970).
Some inactive modes in bulk material can be active
for small particles or nanostructures due to the size
effects, and it is plausible to take into account that the
inactive mode becomes active with decreasing particle
sizes (Trayler et al. 1971; Shek et al. 1999). The broad
peak at 354 cm-1 was also reported in extra-fine
(3–5 nm) nanoparticles (Yu et al. 1997; Kuiri et al.
2007) while it was not observed in the micro-
crystalline SnO2 powders, which is in accordance
with XRD and HR-TEM results. This phenomenon
can be attributed to the relaxation of the Raman
selection rule by the reduction of the particle size to
few nanometers as well as by the high concentration of
defects in surface sites such as oxygen vacancies and
lattice disorders (Scott 1970) provoked by the forced
hydrolysis of SnCl4 solutions (Fig. 2). On the other
hand, following the work of Scott (1970), we can
propose that for SnO2 nanopowders, the vibrational
modes around these regions arise either as a conse-
quence of a reduction in the particle dimension or are
related to the conversion from the amorphous-to-
crystalline phase (Scott 1970). However, in the present
case, the XRDs have been identified as crystalline tin
oxide even for S10 and S60 samples. Thus, the
appearance of a quite intense peak near 560 cm-1
cannot be related to the amorphous phase. The
appearance of this peak might be considered as a
consequence of the reduced particle size (Table 2) and
defects in the surface as well as the interface between
the particles (Li et al. 2007; Longo et al. 2008).
Furthermore, as observed in Fig. 4, all typically
Raman active modes (together the non-typically active
modes) are better defined in sample S60 than in sample
S10, indicating that the S10 sample has a different
order degree.
Photoluminescence and UV spectroscopies
It is well known that PL emissions are dependent
among other factors, by the structure and the presence
of defects or impurities of the material. In 1980,
Blattner et al. have been reported that in pure SnO2
single crystal the PL emissions present three peaks at
3.37 eV (366 nm), 3.28 eV (376 nm), and broad peak
at 2.5 eV (494 nm), associated to acceptor level,
donor–acceptor pairs, and oxygen vacancies concen-
tration, respectively, while for low-dimensional SnO2
nanostructures a PL peak centered at 2.09 eV
(591 nm) has been observed. The PL of bulk SnO2 isFig. 4 Raman spectroscopy of SnO2 nanoparticles synthesized
for (a) 10 min (S10) and (b) 60 min (S60)
J Nanopart Res (2012) 14:750 Page 7 of 13
123
generally attributed to defect levels within the band
gap, associated with oxygen vacancies or Sn intersti-
tials in the crystalline structure (Pan et al. 2008);
however, its origin in nanostructured SnO2 is far from
being clearly established due to the variety of struc-
tures, which yield various PL emission patterns.
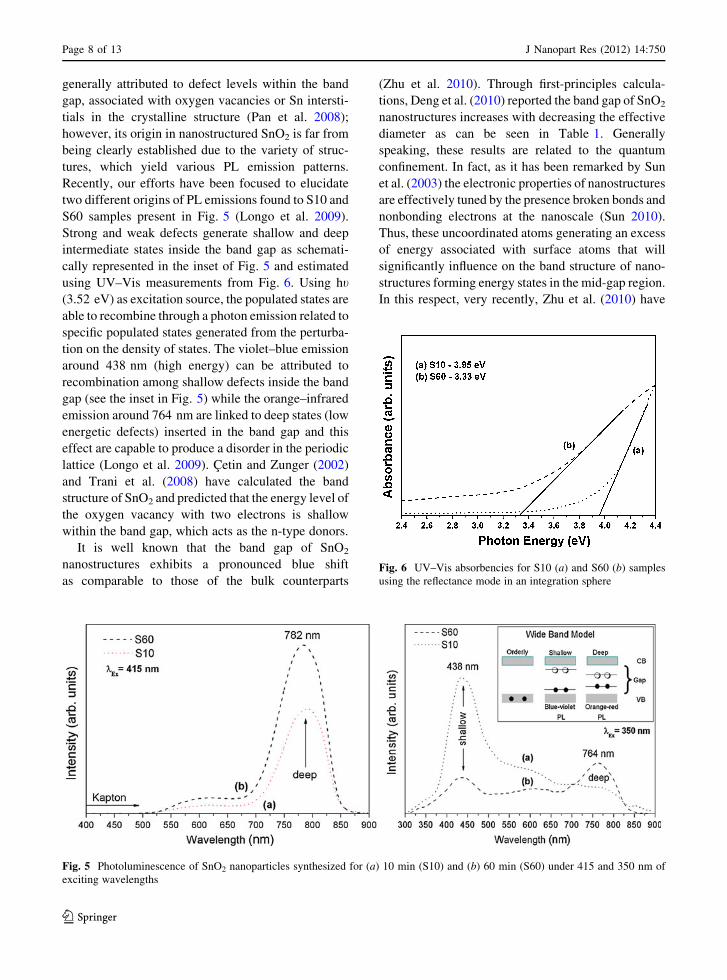
Recently, our efforts have been focused to elucidate
two different origins of PL emissions found to S10 and
S60 samples present in Fig. 5 (Longo et al. 2009).
Strong and weak defects generate shallow and deep
intermediate states inside the band gap as schemati-
cally represented in the inset of Fig. 5 and estimated
using UV–Vis measurements from Fig. 6. Using ht(3.52 eV) as excitation source, the populated states are
able to recombine through a photon emission related to
specific populated states generated from the perturba-
tion on the density of states. The violet–blue emission
around 438 nm (high energy) can be attributed to
recombination among shallow defects inside the band
gap (see the inset in Fig. 5) while the orange–infrared
emission around 764 nm are linked to deep states (low
energetic defects) inserted in the band gap and this
effect are capable to produce a disorder in the periodic
lattice (Longo et al. 2009). Cetin and Zunger (2002)
and Trani et al. (2008) have calculated the band
structure of SnO2 and predicted that the energy level of
the oxygen vacancy with two electrons is shallow
within the band gap, which acts as the n-type donors.
It is well known that the band gap of SnO2
nanostructures exhibits a pronounced blue shift
as comparable to those of the bulk counterparts
(Zhu et al. 2010). Through first-principles calcula-
tions, Deng et al. (2010) reported the band gap of SnO2
nanostructures increases with decreasing the effective
diameter as can be seen in Table 1. Generally
speaking, these results are related to the quantum
confinement. In fact, as it has been remarked by Sun
et al. (2003) the electronic properties of nanostructures
are effectively tuned by the presence broken bonds and
nonbonding electrons at the nanoscale (Sun 2010).
Thus, these uncoordinated atoms generating an excess
of energy associated with surface atoms that will
significantly influence on the band structure of nano-
structures forming energy states in the mid-gap region.
In this respect, very recently, Zhu et al. (2010) have
Fig. 5 Photoluminescence of SnO2 nanoparticles synthesized for (a) 10 min (S10) and (b) 60 min (S60) under 415 and 350 nm of
exciting wavelengths
Fig. 6 UV–Vis absorbencies for S10 (a) and S60 (b) samples
using the reflectance mode in an integration sphere
Page 8 of 13 J Nanopart Res (2012) 14:750
123
established an analytical model to address the band
gap shift in SnO2 nanostructures in self-equilibrium
state on the basis of bond length and bond energy
correlations and this band gap shift is attributed to the
lattice strain and coordination imperfection in the
surfaces of SnO2 nanostructures.
The wide band model (Pontes et al. 2003) (see the
inset in Fig. 5) shows the most important events
occurring along the excitation. The emission profile
occurs by several paths involving numerous states
within the forbidden band gap (Moreira et al. 2009) via
a multiphonon process through shallow and deep
states generated by different types of defects related to
the synthesis methods employed.
PL results indicate the existence of two specific
emission centers promoted by shallow (high energy) and
deep (low energy) defects, respectively. These defects
were not significantly influenced by the decreasing in the
excitation energy, i.e., if the wavelength is changed from
350 to 415 nm. In the excitation of 415 nm the fist PL
peak was completely quenched due to the use of Kapton
filter, which is necessary because this is appropriated to
cut the excitation line (415 nm). Thus, the high-energy
defects are suppressed and orange emission is enhanced,
favored by low-energy excitation. Under high-energy
excitation (350 nm) the shallow defects appear to be
suppressed with synthesis time increases from 10 to
60 min. The fraction of defects related with surface
states and random oxygen vacancies decreases signifi-
cantly while defects related to structural distortions
become more evident. In this context, it is important to
cite the very recent study of Zhou (2010) in which
reversed crystal growth process can be operative in our
case. From this study, the PL behavior can be explained
due to crystallization extends from surface to the core,
and, therefore the surface defects decreases as the
synthetic time increases. In addition, a somewhat similar
behavior has been also observed by Gaidi et al. (2010)
for ultrathin films of SnO2 nanoparticles synthesized by
means of pulsed laser deposition. These authors shows
that surface state, e.g., oxygen vacancies dominate
completely the PL emission of SnO2 nanoparticles,
which becomes more luminescent as the nanoparticles
size decreases while the PL energy remains unchanged.
For S10 samples, the q(s) (shallow defects density) is
larger than q(d) (deep defects density), while for S60 an
opposite behavior is evident. This remark may be
supported by XRD and Raman features. The PL band is
red-shifted while the crystallite D value increases and
ultimately favors an increase in the visible orange
emission. A similar trend of the band shift with D values
has been reported in ZnO nanocrystals and is attributed
to a quantum size effect like a quantum confinement
(Kim and Fujita 2002).
These results are confirmed by an analysis of the
results of UV–Vis optical absorbance presented in
Fig. 6. The decreases of defect q(s) yield a reduction of
states within the band gap for the S60 sample. On the
other hand, the improved crystallization and conse-
quently the whole redistribution on the density of states,
leads the band gap value more closely to SnO2 bulk
samples as can be seen follow. The optical band gap
(Eg) of nanocrystals was estimated using the classical
Wood and Tauc equation. For instance, the extrapolated
linear portion of the curve in Fig. 6 (the straight lines to
the x axis) of Ephoton at a = 0; Eq. 4 gives absorption
edge energies corresponding to Eg = 3.95 and 3.33 eV
for the S10 and S60 samples, respectively. a is obtained
directly from the Munk–Kubelka equation.
ahmð Þ ¼ A hv� Eg
� �n ð4Þ
where t is the frequency, A is a constant, and n can
assume different values depending upon the mode of
interband transition as follows: 1/2 for direct allowed,
3/2 direct forbidden, 2 for indirect allowed, and 3 for
indirect forbidden. Radiative recombination between
shallow and deep trapped electrons and trapped holes in
tail and gap states are mainly responsible for PL
emission (Leite et al. 2003; Chen et al. 2003; Zhou et al.
2006b). The absence of an intense emission related to
direct recombination from the conduction band (CB) to
the valence band (VB) as a free exciton decay indicates
that part of the excitation energy (3.52 eV) is lost by
electron phonon interaction. Although, slight contribu-
tions of this band-to-band transition (347 nm) comprise
the violet–blue emission region mainly for S60 sample,
as a slight shoulder at this region. These results point
out that the hydrothermal method assisted by micro-
wave radiation can be considered as a synthetic
procedure to obtain a highly ordered cassiterite phase
at short times and discharge heating rates.
Conclusion
The main results of this study can be summarized as
follows: (i) uniform nanopowders of SnO2 (rutile-type
structure) were successfully synthesized by the MAH
J Nanopart Res (2012) 14:750 Page 9 of 13
123
method at 160 �C using time ranges from 10 (S10) and
60 (S60) min. Pure cassiterite tetragonal phase was
formed by previous hydrolysis of chloride precursor
followed by dehydration of Sn(OH)4 and finally SnO2
nanoparticles crystallization as evidenced by a well-
defined XRD pattern. Spherical-like morphology with
mono-dispersed nanosized distribution around 5 nm
was obtained. These results point out that MAH can be
considered as a synthetic procedure to obtain a highly
ordered cassiterite phase at short times and discharge
heating rates. (ii) TGA data have been obtained to
quantify the chemical and physically adsorbed water
by the nanoparticles. These results were completed by
FT-Raman spectra which showed a new broad peak
around 560 cm-1 related to induced defective surface
modes. Structural distortions in SnO2 nanoparticles at
short- and medium-range order yield a redistribution
of the density of states into the material band gap. (iii)
SnO2 nanoparticles exhibit a markedly enhanced room
temperature PL emission at a wavelength excitation of
350 nm can be considered as an example of the
reduced defect-related behavior. Their two broad
bands at 438 and 764 nm can be associated to possible
confinement effects. In addition, the change of the
excitation energy to 415 nm does not modify signif-
icantly the profile for the PL emission, indicating a
weak dependence of excitation and emission for tin
oxide nanoparticles. UV–Vis spectra shows substan-
tial changes in the optical absorbance of crystalline
SnO2 nanoparticles while the existence of a small tail
points out the presence of localized levels inside the
forbidden band gap which supply the necessary
conditions for the PL emission. (iv) Following the
seminal works of Sun, we can propose that the
structural organization at the nanoscale with the
presence of uncoordinated atoms, i.e., broken bonds
and nonbonding electrons, are responsible for the band
gap shift in SnO2 nanostructures, as it can be found in
the corresponding PL spectra.
Acknowledgments The authors acknowledge the financial
support of the Brazilian research institutions: CAPES, FAPESP,
FPTI (Foundation Technological Park of ITAIPU), CNPq, and
TEM facilities supplied by LMA-UNESP-Araraquara.
References
Abello L, Bochu B, Gaskov A, Koudryavtseva S, Lucazeau G,
Roumyantseva M (1998) Structural characterization of
nanocrystalline SnO2 by X-ray and Raman spectroscopy.
J Solid State Chem 135(1):78–85
Alivisatos AP (1996) Semiconductor clusters, nanocrystals, and
quantum dots. Science 271(5251):933–937
Baruwati B, Polshettiwar V, Varma RS (2009) Glutathione pro-
moted expeditious green synthesis of silver nanoparticles in
water using microwaves. Green Chem 11(7):926–930
Batzill M (2006) Surface science studies of gas sensing mate-
rials: SnO2. Sensors 6(10):1345–1366
Bilecka I, Niederberger M (2010) Microwave chemistry for
inorganic nanomaterials synthesis. Nanoscale 2(8):1358–
1374
Blattner G, Klingshirn C, Helbig R (1980) Impurity transitions
in the photoluminescence spectra of SnO2. Solid State
Commun 33(3):341–344
Cai D, Su Y, Chen YQ, Jiang J, He ZY, Chen L (2005) Synthesis
and photoluminescence properties of novel SnO2 asterisk-
like nanostructures. Mater Lett 59(16):1984–1988. doi:
10.1016/j.matlet.2005.01.045
Cao HQ, Qiu XQ, Liang Y, Zhang L, Zhao MJ, Zhu QM (2006)
Sol-gel template synthesis and photoluminescence of n-
and p-type semiconductor oxide nanowires. ChemPhy-
sChem 7(2):497–501. doi:10.1002/cphc.200500452
Cetin K, Zunger A (2002) Origins of coexistence of conductivity
and transparency in SnO2. Phys Rev Lett 88(9):095501
Chang SS, Park DK (2002) Novel Sn powder preparation by
spark processing and luminescence properties. Mater Sci
Eng B 95(1):55–60
Chen DL, Gao L (2004) Facile synthesis of single-crystal tin
oxide nanorods with tunable dimensions via hydrothermal
process. Chem Phys Lett 398(1–3):201–206. doi:10.1016/
j.cplett.2004.09.055
Chen Y, Zhu J, Zhu X, Ma G, Liu Z, Min N (2003) Gas sensing
property and microstructure of SnO2 nanocrystalline pre-
pared by solid state reaction–thermal oxidation. Mater Sci
Eng B 99(1–3):52–55
Cheng B, Russell JM, Shi WS, Zhang L, Samulski ET (2004)
Large-scale, solution-phase growth of single-crystalline
SnO2 nanorods. J Am Chem Soc 126(19):5972–5973
Cullity BD, Stock SR (2001) Elements of X-ray diffraction, 3rd
edn. Prentice Hall, Upper Saddle River
Dai ZR, Gole JL, Stout JD, Wang ZL (2002a) Tin oxide nano-
wires, nanoribbons, and nanotubes. J Phys Chem B
106(6):1274–1279. doi:10.1021/jp013214r
Dai ZR, Pan ZW, Wang ZL (2002b) Growth and structure
evolution of novel tin oxide diskettes. J Am Chem Soc
124(29):8673–8680. doi:10.1021/ja026262d
Dal Santos MA, Antunes AC, Ribeiro C, Borges CPF, Antunes
SRM, Zara AJ, Pianaro SA (2003) Electric and morpho-
logic properties of SnO2 films prepared by modified sol-gel
process. Mater Lett 57(28):4378–4381. doi:10.1016/
s0167-577x(03)00328-8
Del Castillo J, Rodriguez VD, Yanes AC, Mendez-Ramos J,
Torres ME (2005) Luminescent properties of transparent
nanostructured Eu3? doped SnO2–SiO2 glass–ceramics
prepared by the sol–gel method. Nanotechnology
16(5):S300–S303. doi:10.1088/0957-4484/16/5/031
Deng H-X, Li S–S, Li J (2010) Quantum confinement effects
and electronic properties of SnO2 quantum wires and dots.
J Phys Chem C 114(11):4841–4845. doi:10.1021/jp91
1035z
Page 10 of 13 J Nanopart Res (2012) 14:750
123
Dieguez A, Romano-Rodriguez A, Vila A, Morante JR (2001)
The complete Raman spectrum of nanometric SnO2 parti-
cles. J Appl Phys 90(3):1550–1557
Dong WS, Li MY, Liu CL, Lin FQ, Liu ZT (2008) Novel ionic
liquid assisted synthesis of SnO2 microspheres. J Colloid
Interface Sci 319(1):115–122. doi:10.1016/j.jcis.2007.08.031
El-Sayed MA (2004) Small is different: shape-, size-, and
composition-dependent properties of some colloidal
semiconductor nanocrystals. Acc Chem Res 37(5):326–
333. doi:10.1021/ar020204f
Epifani M, Diaz R, Arbiol J, Comini E, Sergent N, Pagnier T,
Siciliano P, Taglia G, Morante JR (2006) Nanocrystalline
metal oxides from the injection of metal oxide sols in
coordinating solutions: Synthesis, characterization, ther-
mal stabilization, device processing, and gas-sensing
properties. Adv Funct Mater 16(11):1488–1498. doi:
10.1002/adfm.200500652
Fang M, Tan XL, Cheng BC, Zhang LD (2009) SnO2 hierar-
chical nanostructure and its strong narrow-band photolu-
minescence. J Mater Chem 19(9):1320–1324. doi:10.1039/
b817530f
Gaidi M, Hajjaji A, Smirani R, Bessais B, El Khakani MA
(2010) Structure and photoluminescence of ultrathin films
of SnO2 nanoparticles synthesized by means of pulsed laser
deposition. J Appl Phys 108(6):063537
Gallis KW, Landry CC (2001) Rapid calcination of nanostruc-
tured silicate composites by microwave irradiation. Adv
Mater 13(1):23–26. doi:10.1002/1521-4095(200101)13:
1\23:aid-adma23[3.0.co;2-9
Gerbec JA, Magana D, Washington A, Strouse GF (2005)
Microwave-enhanced reaction rates for nanoparticle syn-
thesis. J Am Chem Soc 127(45):15791–15800. doi:
10.1021/ja052463g
Gervais F, Kress W (1985) Lattice-dynamics of oxides with
rutile structure and instabilities at the metal-semiconductor
phase-Transitions of NbO2 and VO2. Phys Rev B 31(8):
4809–4814
Gole JL, Wang ZL (2001) SnOx nanocrystallites supported
by silica nanostructures. Nano Lett 1(8):449–451. doi:
10.1021/nl010048q
Her YC, Wu JY, Lin YR, Tsai SY (2006) Low-temperature
growth and blue luminescence of SnO2 nanoblades. Appl
Phys Lett 89(4):3. doi:04311510.1063/1.2235925
Hu JQ, Bando Y, Golberg D (2003a) Self-catalyst growth and
optical properties of novel SnO2 fishbone-like nanorib-
bons. Chem Phys Lett 372(5–6):758–762. doi:10.1016/
s0009-2614(03)00503-7
Hu JQ, Bando Y, Liu QL, Golberg D (2003b) Laser-ablation
growth and optical properties of wide and long single-
crystal SnO2 ribbons. Adv Funct Mater 13(6):493–496.
doi:10.1002/adfm.200304327
Huang W, Richert R (2008) The physics of heating by time-
dependent fields: microwaves and water revisited. J Phys
Chem B 112(32):9909–9913. doi:10.1021/jp8038187
Huang Y, Duan XF, Lieber CM (2005) Nanowires for integrated
multicolor nanophotonics. Small 1(1):142–147. doi:10.1002/
smll.200400030
Jiang LH, Sun GQ, Zhou ZH, Sun SG, Wang Q, Yan SY, Li HQ,
Tian J, Guo JS, Zhou B, Xin Q (2005) Size-controllable
synthesis of monodispersed SnO2 nanoparticles and
application in electrocatalysts. J Phys Chem B
109(18):8774–8778. doi:10.1021/jp050334g
Jouhannaud J, Rossignol J, Stuerga D (2008) Rapid synthesis of
tin (IV) oxide nanoparticles by microwave induced ther-
mohydrolysis. J Solid State Chem 181(6):1439–1444. doi:
10.1016/j.jssc.2008.02.040
Kappe CO (2004) Controlled microwave heating in modern
organic synthesis. Angew Chem Int Ed 43(46):6250–6284.
doi:10.1002/anie.200400655
Katiyar RS, Dawson P, Hargreav MM, Wilkinso GRJ (1971)
Dynamics of rutile structure 3. Lattice dynamics, infrared
and Raman spectra of SnO2. J Phys C 4(15):2421–2431
Kim SW, Fujita S (2002) Self-organized ZnO quantum dots on
SiO2/Si substrates by metal organic chemical vapor depo-
sition. Appl Phys Lett 81(26):5036–5038. doi:10.1063/
1.1527690
Komarneni S, Roy R, Li QH (1992) Microwave-hydrothermal
synthesis of ceramic powders. Mater Res Bull 27(12):
1393–1405
Krishna M, Komarneni S (2009) Conventional- vs microwave-
hydrothermal synthesis of tin oxide, SnO2 nanoparticles.
Ceram Int 35(8):3375–3379. doi:10.1016/j.ceramint.2009.
06.010
Kuiri PK, Lenka HP, Ghatak J, Sahu G, Joseph B, Mahapatraa
DP (2007) Formation and growth of SnO2 nanoparticles in
silica glass by Sn implantation and annealing. J Appl Phys
102(2):5. doi:02431510.1063/1.2761778
Lee EJH, Ribeiro C, Longo E, Leite ER (2006) Growth kinetics
of tin oxide nanocrystals in colloidal suspensions under
hydrothermal conditions. Chem Phys 328(1–3):229–235.
doi:10.1016/j.chemphys.2006.06.032
Leite ER, Weber IT, Longo E, Varela JA (2000) A new method
to control particle size and particle size distribution of
SnO2 nanoparticles for gas sensor applications. Adv Mater
12(13):965–968
Leite ER, Paris EC, Pontes FM, Paskocimas CA, Longo E,
Sensato F, Pinheiro CD, Varela JA, Pizani PS, Campos
CEM, Lanciotti F (2003) The origin of photoluminescence
in amorphous lead titanate. J Mater Sci 38(6):1175–1178
Li LJ, Zong FJ, Cui XD, Ma HL, Wu XH, Zhang QD, Wang YL,
Yang F, Zhao JZ (2007) Structure and field emission
properties of SnO2 nanowires. Mater Lett 61(19–20):
4152–4155. doi:10.1016/j.matlet.2007.01.044
Liu YK, Zheng CL, Wang WZ, Yin CR, Wang GH (2001a)
Synthesis and characterization of rutile SnO2 nanorods.
Adv Mater 13(24):1883–1887
Liu YK, Zheng CL, Wang WZ, Zhan YJ, Wang GH (2001b)
Production of SnO2 nanorods by redox reaction. J Cryst
Growth 233(1–2):8–12
Liu Y, Yang F, Yang X (2008) Size-controlled synthesis and
characterization of quantum-size SnO2 nanocrystallites by
a solvothermal route. Colloid Surf A 312(2–3):219–225.
doi:10.1016/j.colsurfa.2007.06.054
Longo VM, Cavalcante LS, Erlo R, Mastelaro VR, de Figuei-
redo AT, Sambrano JR, de Lazaro S, Freitas AZ, Gomes L,
Vieira ND, Varela JA, Longo E (2008) Strong violet-blue
light photoluminescence emission at room temperature in
SrZrO3: joint experimental and theoretical study. Acta
Mater 56(10):2191–2202. doi:10.1016/j.actamat.2007.
12.059
J Nanopart Res (2012) 14:750 Page 11 of 13
123
Longo VM, Cavalcante LS, Costa MGS, Moreira ML, de Fi-
gueiredo AT, Andres J, Varela JA, Longo E (2009) First
principles calculations on the origin of violet–blue and
green light photoluminescence emission in SrZrO3 and
SrTiO3 perovskites. Theor Chem Acc 124(5–6):385–394.
doi:10.1007/s00214-009-0628-7
Luo SH, Chu PK, Liu WL, Zhang M, Lin CL (2006) Origin of
low-temperature photoluminescence from SnO2 nanowires
fabricated by thermal evaporation and annealed in different
ambients. Appl Phys Lett 88(18):3. doi:18311210.1063/
1.2201617
Macario LR, Moreira ML, Andres J, Longo E (2010) An effi-
cient microwave-assisted hydrothermal synthesis of
BaZrO3 microcrystals: growth mechanism and photo-
luminescence emissions. CrystEngCommunity 12(11):
3612–3619
Majdoub M, Loupy A, Petit A, Roudesli S (1996) Coupling
focused microwaves and solvent-free phase transfer
catalysis: application to the synthesis of new furanic die-
thers. Tetrahedron 52(2):617–628
Mao YB, Wong SS (2005) Composition and shape control of
crystalline Ca1–xSrxTiO3 perovskite nanoparticles. Adv
Mater 17(18):2194–2199. doi:10.1002/adma.200500437
Moreira ML, Pianaro SA, Andrade AVC, Zara AJ (2006)
Crystal phase analysis of SnO2-based varistor ceramic
using the Rietveld method. Mater Charact 57(3):193–198.
doi:10.1016/j.matchar.2006.01.012
Moreira ML, Andres J, Longo VM, Li MS, Varela JA, Longo E
(2009) Photoluminescent behavior of SrZrO3/SrTiO3
multilayer thin films. Chem Phys Lett 473(4–6):293–298.
doi:10.1016/j.cplett.2009.03.021
Moreira ML, Volanti DP, Andres J, Montes PJR, Valerio MEG,
Varela JA, Longo E (2011) Radioluminescence properties
of decaoctahedral BaZrO3. Scripta Mater 64(2):118–121
Orlandi MO, Ramirez AJ, Leite ER, Longo E (2008) Morpho-
logical evolution of tin oxide nanobelts after phase transi-
tion. Cryst Growth Des 8(3):1067–1072. doi:10.1021/
cg7009379
Pan SS, Zhang YX, Teng XM, Li GH, Li L (2008) Optical
properties of nitrogen-doped SnO2 films: effect of the
electronegativity on refractive index and band gap. J Appl
Phys 103(9):093103–093104
Panda AB, Glaspell G, El-Shall MS (2006) Microwave syn-
thesis of highly aligned ultra narrow semiconductor rods
and wires. J Am Chem Soc 128(9):2790–2791. doi:
10.1021/ja058148b
Paraguay-Delgado F, Antunez-Flores W, Miki-Yoshida M,
Aguilar-Elguezaba A, Santiago P, Diaz R, Ascencio JA
(2005) Structural analysis and growing mechanisms for
long SnO2 nanorods synthesized by spray pyrolysis.
Nanotechnology 16(6):688–694. doi:10.1088/0957-4484/
16/6/011
Patzke GR, Zhou Y, Kontic R, Conrad F (2010) Oxide
nanomaterials: synthetic developments, mechanistic stud-
ies, and technological innovations. Angew Chem Int Ed.
doi:10.1002/anie.201000235
Pianaro SA, Bueno PR, Longo E, Varela JA (1995) A new SnO2-
based varistor system. J Mater Sci Lett 14(10):692–694
Pianaro SA, Bueno PR, Olivi P, Longo E, Varela JA (1998)
Electrical properties of the SnO2-based varistor. J Mater
Sci Mater Electron 9(2):159–165
Pires FI, Joanni E, Savu R, Zaghete MA, Longo E, Varela JA
(2008) Microwave-assisted hydrothermal synthesis of
nanocrystalline SnO powders. Mater Lett 62(2):239–242.
doi:10.1016/j.matlet.2007.05.006
Pontes FM, Pinheiro CD, Longo E, Leite ER, de Lazaro SR,
Magnani R, Pizani PS, Boschi TM, Lanciotti F (2003)
Theoretical and experimental study on the photolumines-
cence in BaTiO3 amorphous thin films prepared by the
chemical route. J Lumines 104(3):175–185. doi:10.1016/
s0022-2313(03)00014-0
Rabenau A (1985) The role of hydrothermal synthesis in pre-
parative chemistry. Angew Chem Int Ed Engl 24(12):
1026–1040
Raghuveer MS, Agrawal S, Bishop N, Ramanath G (2006)
Microwave-assisted single-step functionalization and in situ
derivatization of carbon nanotubes with gold nanoparticles.
Chem Mat 18(6):1390–1393. doi:10.1021/cm051911g
Rao KJ, Vaidhyanathan B, Ganguli M, Ramakrishnan PA
(1999) Synthesis of inorganic solids using microwaves.
Chem Mat 11(4):882–895
Ribeiro C, Lee EJH, Giraldi TR, Longo E, Varela JA, Leite ER
(2004) Study of synthesis variables in the nanocrystal
growth behavior of tin oxide processed by controlled
hydrolysis. J Phys Chem B 108(40):15612–15617. doi:
10.1021/jp0473669
Roduner E (2006) Size matters: why nanomaterials are different.
Chem Soc Rev 35(7):583–592. doi:10.1039/b502142c
Scott JF (1970) Raman spectrum of SnO2. J Chem Phys
53(2):852–853
Shek CH, Lin GM, Lai JKL (1999) Effect of oxygen deficiency
on the Raman spectra and hyperfine interactions of nano-
meter SnO2. Nanostruct Mater 11(7):831–835
Strauss CR, Rooney DW (2010) Accounting for clean, fast and
high yielding reactions under microwave conditions. Green
Chem 12(8):1340–1344
Sun CQ (2010) Dominance of broken bonds and nonbonding
electrons at the nanoscale. Nanoscale 2(10):1930–1961.
doi:10.1039/c0nr00245c
Sun SH, Meng GW, Wang YW, Gao T, Zhang MG, Tian YT,
Peng XS, Zhang LD (2003) Large-scale synthesis of SnO2
nanobelts. Appl Phys A 76(2):287–289. doi:10.1007/
s00339-002-1506-5
Trani F, Causa M, Ninno D, Cantele G, Barone V (2008) Den-
sity functional study of oxygen vacancies at the SnO2
surface and subsurface sites. Phys Rev B 77(24):245410
Trayler JG, Smith HG, Nicklow RM, Wilkinso MK (1971)
Lattice dynamics of rutile. Phys Rev B 3(10):3457–3472
Volanti DP, Keyson D, Cavalcante LS, Simoes AZ, Joya MR,
Longo E, Varela JA, Pizani PS, Souza AG (2008) Synthesis
and characterization of CuO flower-nanostructure process-
ing by a domestic hydrothermal microwave. J Alloy Compd
459(1–2):537–542. doi:10.1016/j.jallcom.2007.05.023
Volanti DP, Orlandi MO, Andres J, Longo E (2011) Efficient
microwave-assisted hydrothermal synthesis of CuO sea urchin-
like architectures via a mesoscale self-assembly. CrystEng-
Community 12(6):1696–1699. doi:10.1039/b922978g
Walton RI (2002) Subcritical solvothermal synthesis of con-
densed inorganic materials. Chem Soc Rev 31:230–238.
Wang ZL (2003) Nanobelts, nanowires, and nanodiskettes of
semiconducting oxides—from materials to nanodevices.
Adv Mater 15(5):432–436
Page 12 of 13 J Nanopart Res (2012) 14:750
123

Wilson GJ, Matijasevich AS, Mitchell DRG, Schulz JC, Will
GD (2006) Modification of TiO2 for enhanced surface
properties: finite Ostwald ripening by a microwave
hydrothermal process. Langmuir 22(5):2016–2027. doi:
10.1021/la052716j
Wu DS, Han CY, Wang SY, Wu NL, Rusakova IA (2002)
Microwave-assisted solution synthesis of SnO nanocrys-
tallites. Mater Lett 53(3):155–159
Yu KN, Xiong YH, Liu YL, Xiong CS (1997) Microstructural
change of nano-SnO2 grain assemblages with the anneal-
ing, temperature. Phys Rev B 55(4):2666–2671
Zhao L, Choi M, Kim HS, Hong SH (2007) The effect of mul-
tiwalled carbon nanotube doping on the CO gas sensitivity
of SnO2-based nanomaterials. Nanotechnology 18(44):5.
doi:44550110.1088/0957-4484/18/44/445501
Zhou WZ (2010) Reversed crystal growth: implications for
crystal engineering. Adv Mater 22(28):3086–3092. doi:
10.1002/adma.200904320
Zhou JX, Zhang MS, Hong JM, Yin Z (2006a) Raman spec-
troscopic and photoluminescence study of single-crystal-
line SnO2 nanowires. Solid State Commun 138(5):
242–246. doi:10.1016/j.ssc.2006.03.007
Zhou XT, Heigl F, Murphy MW, Sham TK, Regier T, Coulthard I,
Blyth RIR (2006b) Time-resolved x-ray excited optical
luminescence from SnO2 nanoribbons: direct evidence for the
origin of the blue luminescence and the role of surface states.
Appl Phys Lett 89(21):3. doi:21310910.1063/1.2387476
Zhu HL, Yang DR, Yu GX, Zhang H, Yao KH (2006) A simple
hydrothermal route for synthesizing SnO2 quantum dots.
Nanotechnology 17(9):2386–2389. doi:10.1088/0957-
4484/17/9/052
Zhu Z, Ouyang G, Yang G (2010) Bandgap shift in SnO2
nanostructures induced by lattice strain and coordination
imperfection. J Appl Phys 108(8):083511–083514
J Nanopart Res (2012) 14:750 Page 13 of 13
123


![Impact of oxygen atmosphere on piezoelectric properties of ...cmdmc.com.br/redecmdmc/lab/arquivos_publicacoes/1999_Impact of oxygen...tors. In our previous work [13], polar-axis-oriented](https://img.pdfslide.us/doc/110x75/5e0c38d259087b7a8d785ed1/impact-of-oxygen-atmosphere-on-piezoelectric-properties-of-cmdmccombrredecmdmclabarquivospublicacoes1999impact.jpg)