Embed Size (px)
Citation preview

researchpaperconflictinBritain.i1 1 21/07/2008 16:33:07
Britain since 1980
2008Prepared by:Gill Dix, Acas Research and Evaluation Section,John Forth, National Institute of Economic and Social Research and Keith Sisson, University of Warwick
Research Paper Conflict at work: The pattern of disputes inutes inutes in Britain since 1980
Ref: 03/08
2008 Prepared by: Gill Dix, Acas Research and Evaluation Section, John Forth, National Institute of Economic and Social Research and Keith Sisson, University of Warwick

researchpaperconflictinBritain.i2 2 21/07/2008 16:33:14
For any further information on this study, or other aspects of the Acas Research and Evaluation programme, please telephone 020 7210 3673 or email [email protected]
Acas research publications can be found at www.acas.org.uk/researchpapers
ISBN 0-9554830-9-3 ISBN 978-0-9554830-9-7

Conflict at Work: The pattern of disputes in Britain since 1980 Gill Dix Advisory, Conciliation and Arbitration Service (Acas) John Forth National Institute of Economic and Social Research (NIESR) Keith Sisson Emeritus Professor of Industrial Relations, University of Warwick July 2008

CONTENTS
Acknowledgements 1
Note on the paper 1
Abstract 2
1. INTRODUCTION 3
2. THE PATTERN OF DISPUTES 4
2.1 Collective disputes 4 2.2 Individual disputes 8 2.3 Reflections on the changing pattern of disputes 11
3. EVIDENCE ON THE BROADER INCIDENCE OF DISCONTENT 14
4. THE ROLE OF INSTITUTIONS 18
5. CONCLUSIONS 21
References 23
Endnotes 27
List of figures Figure 1 Work stoppages and working days lost, 1960-2006 5
Figure 2 Total number of Employment Tribunal applications registered 9
Figure 3 Number of employment-related problems raised with Citizens 15 Advice Bureaux, 1980-2007
Figure 4 Levels of discontent at work 16
List of tables
Table 1 Industrial action within workplaces, 1980-2004 6
Table 2 Industrial action within workplaces, 1980-2004, by sector of ownership
7
Table 3 Expressions of conflict, by type of ‘voice’ 20

1
1
Note on the paper
Acknowledgements John Forth gratefully acknowledges the support of the ESRC (grant number RES-000-23-1603) for its funding of a broader investigation into the evolution of the modern workplace, of which this study is one part.
The authors acknowledge the Department of Trade and Industry, the Economic and Social Research Council, the Advisory, Conciliation and Arbitration Service and the Policy Studies Institute as the originators of the Workplace Industrial / Employment Relations Survey data, and the Data Archive at the University of Essex as the distributor of the data. The National Centre for Social Research conducted the survey fieldwork on behalf of the sponsors.
We are also grateful to Alex Bryson for providing the estimates from the British Social Attitudes Survey and to the National Centre for Social Research for providing access to these data. We are also grateful to Marco Ercolani for providing data on annual rates of absenteeism from the Labour Force Survey. We gratefully acknowledge the Institute for Social and Economic Research at the University of Essex as the originators of the British Household Panel Survey data, the Office for National Statistics as the originators of the Labour Force Survey, and the Economic and Social Data Service as the distributors of both datasets. We are also grateful to John Kelly and Citizens Advice for providing data on numbers of employment-related problems raised by visitors to Citizens Advice Bureaux.
None of these individuals or institutions bears any responsibility for our analysis or interpretation of the data.
This paper forms part of a broader investigation into the evolution of the modern workplace, funded by the Economic and Social Research Council (grant number RES-000-23-1603). The project focuses on changes in a variety of aspects of workplace employment relations – including employee representation, pay determination and employee involvement - over the quarter century from 1980 to the present. A book will be published by Cambridge University Press in 2009.

2
Abstract The past quarter century in Britain has seen a concurrent decline in collective expressions of conflict and growth in the individualised expression of conflict, most transparently manifest in a dramatic fall in the incidence of strikes and a rising tide of claims to the Employment Tribunal. This paper investigates the scale of the changes and discusses its causes. It also draws upon a wider range of indicators and sources to investigate changes in the overall level of workplace discontent. A further concern is the role of workplace institutions, including procedures for dealing with disputes as well as arrangements for employee representation and involvement.
2

3
1. INTRODUCTION
Notions of conflict at work conjure up strong images in the popular imagination. The more familiar images are of large-scale, disruptive industrial disputes; the less common are of individual grievances, most dramatically illustrated by high profile tribunal cases. The past quarter century has seen a concurrent decline in collective expressions of conflict and growth in the individualised expression of conflict, most transparently manifest in a dramatic fall in the incidence of strikes and a rising tide of claims to the Employment Tribunal. What was the scale of the changes, and what were the causes? This paper draws upon a variety of indicators and sources to investigate the changing pattern of workplace conflict over the twenty-five year period.
Irrespective of how it manifests and how it is measured, conflict is an inherent feature of the employment relationship. This is because the employment relationship is a special type of exchange, with the distinguishing feature being that it involves both market and managerial relations (Edwards, 2003: 8). Employees receive tangible and intangible rewards in return for selling their labour and/or knowledge power to be used largely at the employer's discretion. The contract cannot fully specify the rights and responsibilities of either party and is thus “incomplete by design” (Collins, 1999: 161). This means there is great uncertainty, fuelling the prospect of divergent goals and interpretation. The relationship is also on-going, which means that there are more or less constant pressures on - and opportunities for - both parties to seek to adjust the exchange in their favour, and it is contradictory, in so far as employees cannot be ‘commodified’ and employers have to pursue the potentially mutually-exclusive strategies of control and commitment. It also involves a complex ‘governance’ regime of institutions or rules, with scope for differences over both substance and process. Alongside a hierarchically-based structure dealing with work organisation and ‘performance management’ will be found statutory employment rights and collective agreement provisions (where trade unions are recognised), along with a raft of local informal norms (‘custom and practice’) and expectations of behaviour imported from the wider society. Encompassing such divergent paradigms, the relationship is by its very nature given to conflict as well as cooperation.
Notwithstanding these points, conflict – which might be defined as the discontent arising from a perceived clash of interests – can only be measured when it results in a transparent and overt manifestation. In practice it may not always be measurable since some discontent may be hidden or suppressed. The most manifest expressions are disputes, which may be collective or individual, involving action such as a strike, raising a grievance or taking disciplinary measures. Other expressions embrace ‘organisational misbehaviour’ (Ackroyd and Thompson 1999), for example theft and sabotage, absence and resignation, which can viewed as forms of ‘exit’ from unsatisfactorily-regarded relationships; and levels of discontent reported in attitude surveys. Any attempt to obtain a valid indication of the overall extent or nature of conflict at work must therefore explore as comprehensive a set of indicators as possible. This paper adopts that broad framework. It considers both collective and individual disputes. Other expressions of conflict are considered in as much as the data allow. As indicated, the overall pattern is well-established: although collective disputes have declined, individual ones have on some measures, increased. Less clear is the pattern’s composition: whether there have been changes in the types of workplaces and issues involved. Also of interest is the association between different forms of conflict – whether, for example, lower levels of collective disputes are accompanied by higher levels of absenteeism. And a further concern is the role of workplace institutions, including procedures for dealing with disputes as well as arrangements for employee representation and involvement.
3

4
2. THE PATTERN OF DISPUTES
Discussions of conflict have traditionally focused on the incidence of disputes and principally on strikes and the rate of applications to the Employment Tribunal (ET). There is a lot to be said for this approach: official statistics on strikes and Employment Tribunal claims have been collated and published throughout the twenty-five year period that is our focus, and indeed strike data in the UK extend back to 1893. Nevertheless, official strike statistics tell us nothing about the incidence of either very short strikes that fall below the threshold for inclusion in official statistics or other forms of industrial action such as ‘working to rule’, whilst numbers of ET claims tell us nothing about the overall extent to which employees raise formal grievances at work. In the sections which follow, we examine the pattern of disputes using this broader set of indicators. We first map out the pattern of collective and individual disputes, drawing variously upon data from the official data series, the Workplace Industrial / Employment Relations Survey (WIRS / WERS) and other sources. We then go on to provide some reflections on the changing patterns of disputes and the inter-relationships between different types of dispute.
However, there is a further concern that statistics on such phenomena provide only a partial insight into the quality of workplace relations. This is because strikes, formal grievances and ET applications are each ‘institutional expressions’ of discontent, with the incidence of each being determined, in turn, by the strength of trade union organisation, the presence of workplace grievance procedures and the legislative framework of the tribunal system. Accordingly, a further section then goes on to present evidence on the broader incidence of conflict, drawing upon a number of direct and indirect measures of the state of workplace relations. The overall aim is to develop a multi-dimensional picture of the changing nature and extent of workplace conflict over the period from the late 1970s to the present. We return to the issue of institutional effects on manifestations of conflict later in the paper.
2.1 Collective disputes
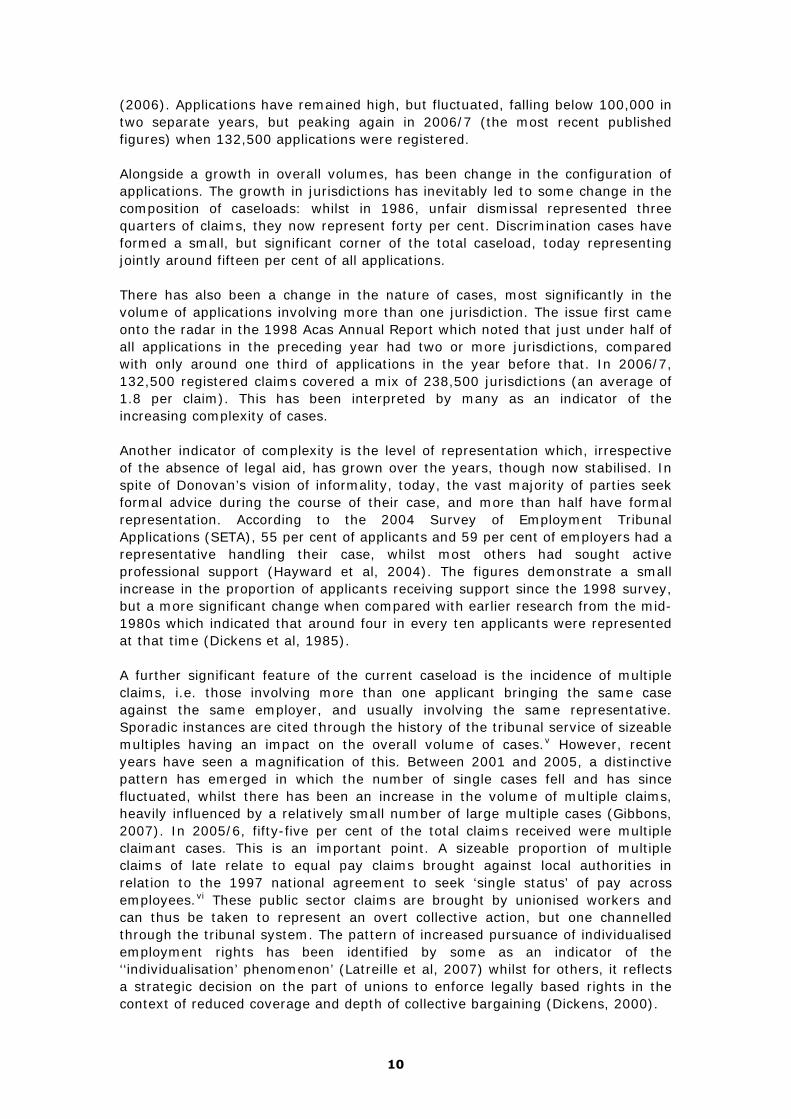
Even the most casual observer of employment relations would be aware of the substantial decline in strike action since the early 1980s. Figure 1 shows a longer time series extending back to 1960 to demonstrate that the decline in the number of stoppages was part of a longer trend which began in the 1970s. However, that is not to suggest that industrial action was a declining problem in that decade. Large disputes kept the number of days lost high and these increased at the end of the 1970s, culminating in the so-called ‘winter of discontent’.i This shifted the public focus from small unofficial strikes – the major concern of the 1960s – to large official stoppages. The average number of days lost per year in the late 1970s and early 1980s stood at around 7 million working days in official records, or 300 days per thousand employees (Figure 1). Contrast this with the latter half of the 1990s and early years of the twenty-first century, when days lost to officially-recorded stoppages stood at around 0.5 million per annum - just 20 days per thousand employees.
4

Figure 1: Work stoppages and working days lost, 1960-2006
0
500
1000
1500
2000
2500
3000
3500
4000
4500
0
1000
2000
3000
4000
5000
6000
7000
1960
1961
1962
1963
1964
1965
1966
1967
1968
1969
1970
1971
1972
1973
1974
1975
1976
1977
1978
1979
1980
1981
1982
1983
1984
1985
1986
1987
1988
1989
1990
1991
1992
1993
1994
1995
1996
1997
1998
1999
2000
2001
2002
2003
2004
2005
2006
Stoppages (LH axis) Working days lost per thousand employees (LH axis) Workers involved per stoppage (RH axis)
5
Sources: Numbers of stoppages and workers involved - Office for National Statistics Time-Series Databank; Working days lost per thousand employees – 1960-1979: Employment Gazette (1986); 1980-1986: Davies (2001); 1987-2006: (Hale 2007).
To examine the trend in collective disputes in more detail, we can divide the twenty-five years into two broadly distinct periods characterised by changes in the level of activity, focusing first on the experience of the late 1970s and the 1980s and then on the more recent period. Official statistics showed a decline in strike activity through the late 1970s and the 1980s, with this being seen most obviously in the falling number of stoppages. The number of working days lost also shows a decline, albeit with a shallower gradient, if one excludes the spikes in the series on working days lost caused by the ‘winter of discontent’ and the miners’ dispute (which alone accounted for over 80 per cent of days lost in 1984).
The first two surveys in the WIRS series added to this body of evidence in the 1980s by showing the extent to which strikes were either concentrated or dispersed across workplaces in the economy. Surveys undertaken in the late 1960s and 1970s had already provided some insight (Government Social Survey, 1968; Parker, 1974, 1975; Daniel, 1976; Brown, 1981) but their coverage was typically limited to large manufacturing workplaces.ii The WIRS series, by contrast, covered manufacturing, private services and the public sector and extended its coverage to include workplaces with at least twenty five employees thereby accounting for roughly two-thirds of all employees in the economy. The first survey showed that one in ten workplaces (11 per cent) had experienced some strike action in the year 1979-1980 (Table 1).iii The proportions experiencing strike action were one in five in the private manufacturing and one in seven in the public sector, but fewer than one in twenty in private services (Table 2). The survey data also allowed a better understanding of the types of workplaces the experienced strikes. Blanchflower and Cubbin’s (1986) analysis,
5

6
for example, challenged the views of those who saw strikes as ‘accidents’ (Siebert and Addison, 1981) or ‘random processes’ (Prais, 1978), showing instead that their occurrence could typically be explained by the presence of certain organisational characteristics, procedural arrangements and incentives.
Table 1: Industrial action within workplaces, 1980-2004
1980 1984 1990 1998 2004 Summary: Strike action 11 15 11 1 3 Non-strike action 11 13 5 1 3 Either strike or non-strike action 17 21 13 2 5
Strike action lasting: Less than one day 4 10 4 * 1 At least one day 7 8 7 1 2
One day but less than one - 8 7 1 2 week One week or more - 1 1 * *
Non-strike action: Overtime ban/restriction 7 7 3 1 2 Work to rule 4 6 2 * 2 Blacking of work 3 2 1 * * Go-slow 1 * * * * Work-in / sit-in * * * * * Other action * 1 1 * *
Picketing 8 4 6 1 2
Employer action: Lock-out 1 * 0 0 0
Base: all establishments with 25 or more employees Weighted 2000 2000 1892 2000 1999 Unweighted 2040 2019 1977 1929 1646
Note: Relies solely on reports from management respondents – see endnote 3. * less than 0.5 per cent but not zero Source: Workplace Industrial/Employment Relations Surveys
6

7
Table 2: Industrial action within workplaces, 1980-2004, by sector of ownership
1980 1984 1990 1998 2004 Private manufacturing: Strike action 19 9 4 0 * Non-strike action 16 12 7 1 2 Either strike or non-strike action 26 17 10 1 2
Private services: Strike action 3 5 2 1 1 Non-strike action 3 3 2 * 2 Either strike or non-strike action 6 7 3 1 2
Public sector: Strike action 15 31 31 3 9 Non-strike action 19 24 8 2 7 Either strike or non-strike action 26 38 34 5 14
Base: all establishments with 25 or more employees Note: Relies solely on reports from management respondents – see footnote 3. * less than 0.5 per cent but not zero
Source: Workplace Industrial/Employment Relations Surveys
The early data also provided interesting insights into the distribution of strikes across different sectors of the economy. The decline in manufacturing industry (Millward et al, 2000: 19-20), along with reduction in the incidence of industrial action in that sector in the first half of the 1980s (Table 2), meant that manufacturing establishments accounted for almost two-fifths of all workplaces experiencing strike or non-strike action in 1980, but less than one fifth in 1984. Public sector workplaces, in contrast, had become both more numerous and more prone to industrial action. Having accounted for one half of all workplaces experiencing strike or non-strike action in 1980, they accounted for over two-thirds in 1984 – a dominance that they retain to the present day. This pattern prompted Dickerson and Stewart (1993) to investigate the possible reasons as to why the public sector appeared ‘strike prone’. They concluded that the lack of product market competition was an important factor, along with the higher rates of unionisation and the larger average size of establishments.
A third contribution of WIRS in the 1980s was to highlight the incidence of non-strike action. Official statistics were silent on this issue and statistics available elsewhere only covered manufacturing (Milner, 1993). However WIRS showed that, in the early 1980s, non-strike action occurred in as many workplaces as strike action. The two forms of action were also shown to be independent to some degree: there were many strongly-unionised workplaces where workers resorted only to one of the two forms of collective expression. Non-strike action, for its part, was most common in the public sector, where around one quarter of all workplaces were affected in 1984 (compared with one in eight in private manufacturing and only three per cent in private services), the most common forms being overtime bans or instances of employees ‘working to rule’. Non-strike action was to see a sharp decline in the latter half of the 1980s, particularly in the public sector where less than one in ten workplaces were affected in 1990. This combined with the decline in strike action to bring the overall incidence of industrial action – as indicated by WIRS – back to the level seen in 1980. However, a more dramatic change was to occur in the next period.
7

8
2.2 Individual disputes
The late 1980s and early 1990s saw a dramatic fall in number of officially-recorded stoppages. Each successive year between 1986 and 1994 registered the lowest number of stoppages since the second world war, and since 1994 the numbers of stoppages and working days lost have stabilised at these historically low levels. Comparisons between the third WIRS in 1990 and the fourth survey in 1998 showed a precipitous decline in strike action that combined with a further decline in non-strike action to bring the overall proportion of workplaces experiencing any form of industrial action down from one in eight to just one in fifty. The receding power of trade unions in the private sector was one part of the story, but not obviously to any greater extent than in previous periods. More notable in the 1990s, it seemed, was the changing experience of the public sector. Here, 34 per cent of workplaces reported some form industrial action in 1990, but in 1998 that figure stood at just five per cent, a change which might be attributed in part to the increasing fragmentation and marketisation of the sector, along with the more generalised threats of legislation and unemployment.
The period since 1998 has seen stability in the official statistics on stoppages. There has also been stability in the survey estimates of the incidence of strike and non-strike action among private sector workplaces, with the percentages experiencing either form of action standing at or below two per cent in both private manufacturing and private services. There was, however, a rise in industrial action in the public sector between 1998 and 2004. This reflected the reactions of public sector trade unions and their members to government or government-inspired attempts to impose limits on the pay increases of particular public sector groups, and/or efforts to implement the change programmes that became a increasingly prominent feature throughout the period (for further details, see Prowse and Prowse, 2007). One in seven public sector workplaces experienced industrial action in the year preceding the 2004 survey, commonly a strike or employees ‘working to rule’, compared with one in twenty in 1998 (Table 2). This helps to explain the most notable trend in official statistics in recent years, which has been the rise in the number of workers involved per stoppage (Figure 1). This seems to have arisen as the result of the decline in private sector stoppages, with national public sector disputes now dominating the statistics to a greater degree than ever before.
The pattern since 2004 can be observed only from official strike statistics, but these show that 2005 recorded the lowest number of stoppages and working days lost in the post-war period, with only six days lost per thousand employees. Stoppages and days lost both rose again in 2006, but both series are now fluctuating around very low averages by historical standards. The same cannot be said of claims to Employment Tribunals.
Mindful of the particular nature of matters of dispute that had a foundation in statutory or contractual rights, the Donovan Commission (reporting in June 1968) addressed the need for new arrangements for dealing with disputes between individual employees and employers. The Commission proposed that the industrial tribunals that already handled disputes arising under the Redundancy Payments Act 1965 be given an enhanced role in the administration of labour law to address ‘all disputes between individual workers and his employer’ and so provide an ‘easily accessible, speedy, informal and inexpensive procedure’ for
8

9
achieving an amicable settlement of disputes (Donovan, 1968: para 577). The same Commission proposed the right not to be unfairly dismissed and the Industrial Relations Act 1971 which enacted this right broadened the role of the Industrial Tribunals (renamed Employment Tribunals by the Employment Rights (Dispute Resolution) Act in 1998) to include unfair dismissal claims.iv
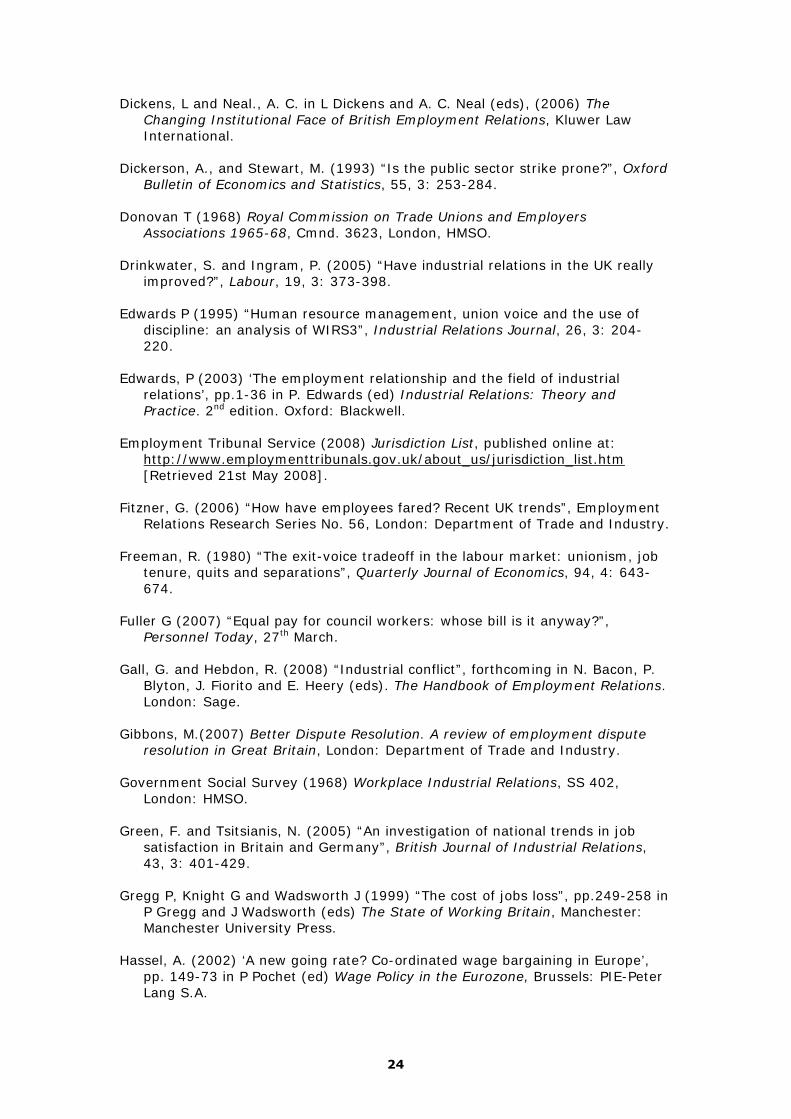
The introduction of unfair dismissal legislation was followed by a growth in the case load, with the volume of cases increasing further with the reduction in the qualifying period for bringing unfair dismissal claims (from two years to one year in 1974 and to six months in 1975), as well as increase in time limits for claiming (from four to thirteen weeks in 1974) from the dismissal. By 1980, the total volume of applications to Industrial Tribunals had grown four-fold to just over 41,000 (Figure 2). These were located largely under unfair dismissal and redundancy pay jurisdictions, though claims relating to equal pay, and to sex and race discrimination were also within the scope of the Tribunals.
Figure 2: Total number of Employment Tribunal applications registered
140,000
120,000
100,000
80,000
60,000
40,000
20,000
0
1972
1973
1974
1975
1976
1977
1978
1979
1980
1981
1982
1983
1984
1985
1986
1987
1988
1989
1990
1991
1992
1993
1994
1995
1996
1997
1998
1999
2000
2001
2002
2003
2004
2005
2006
Sources: 1972-1979 – Employment Gazette (1984); 1980-1998 – Hawes (2000); 1998-2006 – Employment Tribunal Service Annual Reports.
The 1980s saw a small downward trend with applications falling to 29,000 in 1988. Here the steady growth in cases relating to equality issues plus a new right to claim against infringement of wages payments was offset by a small decline in unfair dismissal cases following a further change to the qualifying period (from one to two years, though in 1999 it again returned to one year). The picture changed again in 1989 when in excess of 34,000 applications were submitted and the 1990s heralded a new era of considerable growth, with tribunal cases soaring to in excess of 100,000 by 1999 and reaching 130,000 cases in 2000/2001. Since the 1990s, employees have been given new rights to bring cases relating to Breach of Contract (transferred from the courts in 1994), and discrimination on grounds of disability (1995) and age, sexual orientation and religion or belief
9
10
(2006). Applications have remained high, but fluctuated, falling below 100,000 in two separate years, but peaking again in 2006/7 (the most recent published figures) when 132,500 applications were registered.
Alongside a growth in overall volumes, has been change in the configuration of applications. The growth in jurisdictions has inevitably led to some change in the composition of caseloads: whilst in 1986, unfair dismissal represented three quarters of claims, they now represent forty per cent. Discrimination cases have formed a small, but significant corner of the total caseload, today representing jointly around fifteen per cent of all applications.
There has also been a change in the nature of cases, most significantly in the volume of applications involving more than one jurisdiction. The issue first came onto the radar in the 1998 Acas Annual Report which noted that just under half of all applications in the preceding year had two or more jurisdictions, compared with only around one third of applications in the year before that. In 2006/7, 132,500 registered claims covered a mix of 238,500 jurisdictions (an average of 1.8 per claim). This has been interpreted by many as an indicator of the increasing complexity of cases.
Another indicator of complexity is the level of representation which, irrespective of the absence of legal aid, has grown over the years, though now stabilised. In spite of Donovan’s vision of informality, today, the vast majority of parties seek formal advice during the course of their case, and more than half have formal representation. According to the 2004 Survey of Employment Tribunal Applications (SETA), 55 per cent of applicants and 59 per cent of employers had a representative handling their case, whilst most others had sought active professional support (Hayward et al, 2004). The figures demonstrate a small increase in the proportion of applicants receiving support since the 1998 survey, but a more significant change when compared with earlier research from the mid-1980s which indicated that around four in every ten applicants were represented at that time (Dickens et al, 1985).
A further significant feature of the current caseload is the incidence of multiple claims, i.e. those involving more than one applicant bringing the same case against the same employer, and usually involving the same representative. Sporadic instances are cited through the history of the tribunal service of sizeable multiples having an impact on the overall volume of cases.v However, recent years have seen a magnification of this. Between 2001 and 2005, a distinctive pattern has emerged in which the number of single cases fell and has since fluctuated, whilst there has been an increase in the volume of multiple claims, heavily influenced by a relatively small number of large multiple cases (Gibbons, 2007). In 2005/6, fifty-five per cent of the total claims received were multiple claimant cases. This is an important point. A sizeable proportion of multiple claims of late relate to equal pay claims brought against local authorities in relation to the 1997 national agreement to seek ‘single status’ of pay across employees.vi These public sector claims are brought by unionised workers and can thus be taken to represent an overt collective action, but one channelled through the tribunal system. The pattern of increased pursuance of individualised employment rights has been identified by some as an indicator of the ‘‘individualisation’ phenomenon’ (Latreille et al, 2007) whilst for others, it reflects a strategic decision on the part of unions to enforce legally based rights in the context of reduced coverage and depth of collective bargaining (Dickens, 2000).
10

11
The periodic nature of the WERS series means that no light can be thrown on the considerable volatility in the annual rate of ET applications. Its design nonetheless provides a unique insight into how pervasive this rising volume of tribunal cases has been across British workplaces. Overall, it shows that in spite of the significant growth in cases, in practice, they impact upon a minority of workplaces. Between 1980 and 1990, around 10 per cent of workplaces (with twenty five or more employees) had experienced an employment tribunal case in the year preceding the survey, the figure rising slightly to 13 per cent and 15 per cent in subsequent WERS. When workplaces with ten or more employees are taken into account, the equivalent figures are 6 per cent in 1998 and 8 per cent in 2004.vii
WERS data also accords with other sources in suggesting that, while many claims arise in small businesses, it is medium-sized businesses in particular that generate a disproportionate share of claims. The 2004 SETA showed that 21 per cent of tribunal applications were brought by employees in organisations with 50-249 employees, although these organisations accounted for only four per cent of aggregate employment (Hayward et al., 2004; for further discussion see Gibbons, 2007:16). It may be that medium-sized organisations are effectively caught between two posts, being disadvantaged by the absence of the close working relationships that characterise small firms yet at the same time not benefiting from the full formality of the larger organisation.
2.3 Reflections on the changing pattern of disputes
An initial question that is begged by the preceding discussion is whether the different forms of dispute are substitutes for one another. Indeed, some commentators see the rise in individualised conflict as ‘the flipside’ of the decline in union power and with it, collective action (Shackleton, 2002); a ‘reaction’ to the ‘cathartic aspect of collective disputes’ as unions found it more difficult to organise. (Drinkwater and Ingram, 2005). One question is whether Employment Tribunal claims represent a new manifestation of the same conflict, previously voiced through collective action? Certainly, Figures 1 and 2 appear to suggest that the growth in ET applications is the mirror image of the decline in collective disputes. Moreover, these trends taken together bolster prevailing arguments that the fall in trade union membership and coverage of collective bargaining has refracted in the wider individualisation of the employment relationship (see, for example, Kelly 1998; Brown et al, 1998; Hawes, 2000). Yet closer inspection of the data suggests that this pastiche may be over-simplistic. For it is not just a case of the actors being different, but also the issues. Except in rare cases such as a walkout in support of sacked colleagues, collective action has typically been prompted by concerns about pay levels, other general terms and conditions, and redundancies. In contrast, ET claims have typically been concerned with underpayment (rather than levels) of wages, unfair selection for dismissal or discriminatory behaviour. Furthermore, ET claims are rarely brought in the context of a continuing employment relationship: in the case of unfair dismissal claims, for example, re-employment has long been regarded as the ‘lost remedy’ (Dickens, 1981). Looking back across the period, it is therefore difficult on a number of counts to perceive ET claims in the same framework as Batstone’s take on strikes as a ‘tactical extension’ to collective organised opposition through which the frontier of control in a workplace is either changed or maintained (Batstone et al, 1978: 218).
11

12
It remains to be seen whether this pattern is changing. The recent growth in multiple ET cases involving a single issue (or set of issues) affecting a number of people in the same workplace or organisation suggests it might be. Indeed, Gibbons (2007) attributes the growth in multiple cases directly to collective issues, commenting that the rate of such cases ‘fluctuates substantially because it is heavily influenced by large scale disputes’. The equal pay 'multiples' described earlier, many of which are union led, are the most notable example.viii Acas, which is responsible for handling such claims, expects the figure to rise higher in future years, particularly as the NHS tackles its pay anomalies emerging from its ‘Agenda For Change’ review (Acas, 2007).
The more challenging question the discussion raises is why the trends in disputes have taken the pattern they have and why, in particular, there has been such a significant decline in collective disputes from the early 1990s. Undoubtedly, successive governments had a role to play through the programme of legislative change to restrict the activities of trade unions instituted in the UK under Margaret Thatcher. As Metcalf (2003: 175) reminds us, 'the strike threat ... was weakened by a succession of laws which permitted a union to be sued, introduced ballots prior to a strike, and outlawed both secondary and unofficial action'. Post 1997, New Labour’s first White Paper Fairness at Work elected to maintain such a position, declaring that ‘There will be no going back. The days of strikes without ballots, mass picketing, closed shops and secondary action are over’ (Department of Trade and Industry, 1998). However, whilst legislative change may have played some part, the fact that most countries experienced similar falls in collective disputes over this period (Scheuer, 2006; Gall and Hebdon, 2008) suggests that other factors were also at work. Recent overviews by Waddington (2003: 250) and Scheuer (2006) summarise a more complex set of explanations which, together, brought about considerable changes in the way employment relations was run. These factors include: the cyclical pattern of economic activity (so-called ‘long wave’ theory); shifts in the distribution of employment between sectors and occupations; a weakening in the structure for collective organisation, seen in reduced union density and bargaining coverage; an increase in HR professionalism and proceduralisation; and increasing trade liberalisation and globalization.
In the case of the UK, trade liberalisation and globalisation would appear to have been especially important in accounting for the decline of collective disputes in manufacturing. Intensifying competitive pressures in an increasingly global market place not only helps to explain the demise of many of the larger workplaces where collective action took place, for example, in the automotive sector, but also a decline in such action in the workplaces that remain. Put simply, survival has become the name of the game, raising the cost of collective disputes to both employers and employees.
Overall, however, it was arguably fundamental changes in macroeconomic policy regimes that made the difference, with the fact that these were common in most industrialised economies giving them added force. In the light of the failure of Keynesian polices to deal with the external shocks of the 1970s, the accumulating burden of public debt and the relative success of the German Bundesbank's example, most countries, including the UK, moved towards a monetary regime in the 1980s that involved central bank targeting of relatively low rates of inflation with corresponding borrowing rates. The intention and effect was not only to help bring down the rate of inflation – a major consideration in the pay bargaining that
12

13
figured so prominently among the causes of disputes – but also to make pay bargainers recognise that attempt to reach above-inflation settlements would now result in unemployment. In the light of so-called ‘non-accommodating’ monetary regimes, trade unions adjusted the point of resistance to the prevailing level of inflation in the attempt to maintain living standards, while employers did everything they could to minimise the impact on unit costs by insisting on major changes in working practices. The result was a convergence of pay settlements around the level of inflation (a 'European going rate' in the words of Hassel (2002)), increases in productivity, lower unit labour costs and, most obviously, reductions in manufacturing employment (see Marginson and Sisson, 2004: 252-61).ix
A ‘non-accommodating’ monetary regime also affects the public sector, whose disputes now dominate the statistics to a greater degree than ever before. But the political considerations which encircle the public sector mean that the ability to pay is less constrained than in the private sector. Moreover, the implications of the withdrawal of essential public services, coupled with their widespread coverage when disputes take place, raises the stakes considerably – life and death can be involved in some situations. All of this gives trade unions and their public sector members considerable bargaining power.
Turning to individual disputes, the starting point has to be what Dickens (2000) has termed the ‘explosion’ in individual employment rights, with the effect of legality gradually extending into areas of the employment relationships which had previously been a matter of voluntary determination (Dickens and Neal, 2006: 7). The expansion, which reflects developments in the EU's social dimension as well as UK governments' domestic agendas, means that more areas of working life are covered by the law, as are more employees. At the beginning of the period, there were around 20 individual employment rights under which an employee may bring a claim. By 2008, there were in excess of 60 (Employment Tribunal Service, 2008). Shackleton (2002) has also argued that it is not just the growth in rights but frequent changes in the law that has contributed to the rise in claims as a result of the ‘uncertainty’ experienced by employees and employers about their respective rights and obligations. And as Dickens (2002) reminds us, those rights which have been introduced also rarely involved a collective representation role in their enforcement, thereby contributing to the individualisation of the employment relationship.x
In the short run, widening the coverage of protection as well as changes in qualification periods, have clearly had some impact. Earlier analysis showed the impact of reducing the qualifying period and increasing the time limits for unfair dismissal claims. But underlying considerations were almost certainly also of relevance. These include a greater awareness of the system encouraged by landmark cases attracting considerable press attention.xi Telling here is that the rise in applications does not just reflect an increase in the number of employment rights: the incidence of those claims against underpayment of wages, breach of contract and unfair dismissal (though the latter is subject to greater fluctuation) which continue to be the main issues of contention, has risen even if their overall proportion has fallen. As Burgess et al (2000) suggest, it is difficult to escape the conclusion that a key factor has been an increase in the average value of awards over the period - in part due to the raising of the ceiling of awards and, in the case of discrimination, the lifting of any ceiling to comply with European law (1993 for sex and 1994 for race cases).xii
13

14
3. EVIDENCE ON THE BROADER INCIDENCE OF DISCONTENT
One clear conclusion from the foregoing discussion is that the level of disputes – whether collective or individual – can be heavily affected by factors other than the underlying degree of conflict at work. This raises a further question as to how levels of discontent – as opposed to levels of overt disputes – have changed over time?
First, it is clear that only a minority of employees experiencing problem at work choose any kind of formal approach to addressing their complaint. For instance, Casebourne et al (2006) report that only a quarter (24 per cent) of those who had experienced a problem at work had put their concern in writing to their employer and just three per cent had brought a tribunal case as a result of their complaints. There are no data available that allow us to chart directly the changing incidence of problems at work among employees across our twenty-five year period. The closest objective indicator is perhaps provided by Citizens Advice, who record the number of employment-related problems raised with Citizens Advice Bureaux each year. This series shows an increase in the number of reported problems through the 1980s and early 1990s, from 312,000 in 1980 to a peak of 882,000 in 1993 (Figure 3). The number has fallen back since that time, albeit with some fluctuations; the most recent available figure (for 2007) stood at 505,000. However, one must treat this series with some degree of caution since it is plausible that the increase in volumes in the 1980s could partly be explained by some expansion of the network of Citizens Advice Bureaux following the introduction of government funding in the mid-1970s, whilst the broad downward trend since 2000 may be partly determined by the introduction of a web-based enquiry service in 1999. As an alternative, one can express the total number of employment-related problems as a percentage of all problems reported to the Bureaux, and this series is also shown in Figure 3. It has its own limitations, since fluctuations in the series may be prompted by the changing incidence of problems in areas other than employment (e.g. social security or housing). However, whilst the mid-1990s peak in the number of problems stands out less in this alternative series, one nonetheless retains the impression of improvements since 2000.
14

15
Figure 3: Number of employment-related problems raised with Citizens Advice Bureaux, 1980-2007
1980
1981
1982
1983
1984
1985
1986
1987
1988
1989
1990
1991
1992
1993
1994
1995
1996
1997
1998
1999
2000
2001
2002
2003
2004
2005
2006
2007
0
100,000
200,000
300,000
400,000
500,000
600,000
700,000
800,000
900,000
1,000,000
0.0%
2.0%
4.0%
6.0%
8.0%
10.0%
12.0% N
umbe
r
Number As % of total
Per c
ent o
f tot
al
Source: Citizens Advice Annual Reports. Note: A change in the recording system introduces a discontinuity into the series in 1994/5.
If we cast the net more widely, there are other indicators which provide some further insight into the changing quality of management-employee relations over the period since the early 1980s. Since 1983 the British Social Attitudes Survey (BSAS) has asked employees working 10 or more hours per week to rate relations between management and other employees at their workplace. WERS has asked a similar question of workplace managers in each of its five surveys. The proportions of respondents giving negative ratings in each case are charted in Figure 4.xiii Whilst there are some fluctuations in the BSAS series from year to year, the prevalence of poor relations seemed to have risen in both BSAS and WERS through the 1980s and early 1990s to reach a high point in the mid to late-1990s. Relations appear to have improved somewhat since that time. Indeed, Drinkwater and Ingram (2005) show that the broad time-trend in the BSAS series remains after controlling for a number of individual and job-related characteristics.
15

16
Figure 4: Levels of discontent at work
30 80
70 25
60
20 50
1980 1981 1982 1983 1984 1985 1986 1987 1988 1989 1990 1991 1992 1993 1994 1995 1996 1997 1998 1999 2000 2001 2002 2003 2004 2005
Management-employee relations not good (BSAS, LH axis)Not satisfied with job (BHPS, LH axis)Manager does not consider relations good (WERS, LH axis)Management try to get the better of employees (BSAS, RH axis)
Per c
ent
15 40
30 10
20
5 10
0 0
Per c
ent
Sources: British Social Attitudes Survey (‘Management-employee relations not good’ and ‘Management try to get the better of employees’); British Household Panel Survey (‘Not satisfied with job’); and Workplace Employment Relations Survey (‘Manager does not consider relations good’).
One can, of course, argue about the validity of tracking such attitudinal ratings of the employment relations climate over time. Respondents must use a reference point to make their comparison and, since that reference point is not fixed, one cannot expect them necessarily to evaluate the climate of employee relations in their workplace using the same reference point some 20 years apart: the broader context within which their evaluation is made is patently not the same. Nonetheless, comparisons across shorter time periods may be considered less contentious. It is also striking that the trends in perceptions of the employment relations climate from the BSAS and WERS series have echoes in the ratings associated with other work environment measures. For instance, a measure of overall job satisfaction, available from the British Household Panel Survey each year since 1991, also shows a peak in dissatisfaction in the mid-1990s, with another following in the late 1990s (Figure 4). Levels of satisfaction have improved since the late 1990s, in tandem with employees’ ratings of climate.
It is difficult to find objective measures to corroborate this story. A measure of the incidence of employee grievances is available only in the 1998 and 2004 WERS surveys, although the estimates do suggest a small decline in the incidence of workplace grievances over that period: the percentage of workplaces reporting that employees had raised grievances (formal or informal) in the previous year fell from 56 per cent in 1998 to 47 per cent in 2004 (Kersley et al, 2006: 255). Measures of the incidence of dismissals are available over a longer time period but changes in question wording mean that they are generally not comparable over the series, whilst indicators of the incidence of other disciplinary sanctions
16

17
(available since 1990) show a mixed picture, comprising a slight fall in proportion of workplaces issuing formal written warnings (from 59 per cent in 1990 to 54 per cent in 2004), stability in the proportion making deductions from pay (around 6 per cent) and a rise in those suspending employees from work (from 20 per cent in 1990 to 30 per cent in 2004).
Labour turnover can be expected to correlate positively with employee discontent but its value in contributing to the debate is compromised since it represents the sum of various push and pull factors, and is also strongly associated with the economic cycle. In addition, whilst Gregg et al (1999) show an increase in involuntary quits over the period 1990-1996, consistent estimates do not appear to be readily available for other periods. Rates of absenteeism, for their part, showed a small rise from around 3 per cent in the late 1980s to around 3.2 per cent in the mid 1990s, since which time they have returned to previous levels (Barmby et al, 2004). However, non-genuine absenteeism – which should signal discontent – is estimated to account for only a small proportion of all absence (Confederation of British Industry, 2004) and so it is impossible to make any firm conclusions from the aggregate series. Accordingly, one is left to rely primarily on the CAB series and the subjective perceptions of employees and managers. The story emerging from these measures is that relations appear to have reached a low point in the mid to late-1990s, but may since have experienced something of a recovery.
The reasons for this trend have not been firmly established. Careful analysis by Green and Tsitsianis (2005) leads them to attribute the decline in job satisfaction in the mid to late-1990s to a decrease in task discretion and an increase in work intensification, but similar in-depth analysis of the other measures of discontent discussed here is lacking. Data from BSAS point towards improvements in management style since the mid-1990s, which may well have contributed to better relations. A question which asks employees whether ‘management always try to get the better of employees if they get the chance’ is available only intermittently since 1984 but follows a broadly similar pattern to ratings of climate, showing a peak of discontent in mid to late 1990s. Responses to a question asking whether ‘the workplace is well managed’ follow the same broad pattern with ratings falling between 1983 and 1993/4 and rising thereafter. There is also some evidence to suggest that material features of people’s jobs – and thus some potential sources of discontent – have been improving since the mid-1990s. Fitzner (2006), for example, presents evidence of a decline in the risk of redundancy, a reduction in average working hours and widespread gains in real wages over the past ten years. But whether – and to what extent - these material factors may have contributed materially to changes in levels of discontent remains to be shown.
17

18
4. THE ROLE OF INSTITUTIONS Our attention turns, finally, to the role of different institutional arrangements in either promoting or resolving underlying feelings of discontent. Following Lipskey (2003) conflict can be ignored, suppressed or resolved as well as lead to disputes. Other things being equal, though, it is more likely to evolve into a dispute when there is a recognised vehicle for articulating concerns that employees believe offers the prospect of resolving the issue at stake. As Kersley et al (2006: 211) point out, “The formalising of procedures to manage disputes between employees and managers has been a feature of workplace change in the past twenty five years, with a growth in arrangements to respond to individual and collective conflict”. By 2004, 78 per cent of workplaces recognising a trade union had a formal procedure for handling collective disputes. Even greater proportions of workplaces had formal procedures for dealing with individual grievances (88 per cent) and disciplinary matters (91 per cent) and, furthermore, both types of procedure were universal in workplaces with one or more recognized union.
In the case of collective disputes, there is little evidence to suggest that the increased availability of institutional procedures has been a major factor in determining either the level or form that conflict has taken. Most workplaces exhibiting high levels of collective action in the earlier part of our period, above all in the metalworking sectors, were well-known for their disputes procedures. The same is true of the public sector organizations that have made the major contribution to the pattern in recent years. Formal procedures may not prevent strikes occurring, though they may well be a necessary feature in resolving disputes once they occur (Blanchflower and Cubbin, 1986: 37). Similarly, the presence of individual disputes procedures does not appear to help in the avoidance of disputes, but instead provides a means by which discontent can be articulated and the resulting conflict addressed. Knight and Latreille, for instance, found that the presence of a formal disciplinary procedure had little bearing on whether or not a workplace had been subject to an Employment Tribunal claim (Knight and Latreille, 2000: 549) Accordingly, sectors with a high incidence of grievance and disciplinary procedures will not necessarily see low levels of individual disputes.
Nevertheless, procedures are an important, if not sufficient, condition for the formal expression and resolution of conflict by employees. If there are no collective disputes or grievance procedures, workers are less likely to be able to raise their concerns within the workplace and so are more likely to ‘resolve’ the conflictual situation by quitting. The evidence from sectors such as 'Hotels and restaurants' and 'Other business services' supports this point: workplaces here not only register the lowest levels of grievances and ET claims along with the lowest levels of grievance procedures, but also report above average rates of voluntary resignations (Kersley et al, 2006). In Head and Lucas’ (2004: 249) words, the absence of dispute resolution procedures may in practice ‘constrain the ability of aggrieved workers from taking action’ in such sectors.
Of course, institutions comprise far more than procedures for handling disputes. Institutions are the stuff of work organisations. There are institutions that deal with the organisation of work, recruitment and selection, training and development and ‘performance management’, i.e. the type of payment system and the level of wages, the working time arrangements, the disciplinary arrangements and so on. Links with such diverse arrangements are difficult to
18

19
establish. However, authors have particularly stressed the importance of institutions that provide a ‘voice’ for employees (Freeman, 1980) or which serve as their agents in bargaining over change (Martin, 2003).
Institutions such as trade unions or joint consultative committees clearly provide a means of articulating the varied concerns of those they represent. They also perform an agency function which can lead directly to improvements in terms and conditions, working arrangements or even strategic direction thus - at least in theory - reducing the areas for conflict. In principle, direct forms of 'voice' (such as face-to-face meetings, two-way communication and problem-solving groups) can also bring about change, although the outcome may be less transparent to the workforce as a whole.
In their examination of the variations in the nature of conflict across industries, Kersley et al (2006: 233) noted that industries with higher levels of industrial action generally also experienced a high level of grievances, but tended to experience comparatively low rates of disciplinary sanctions and resignations, and vice versa. It was suggested that the presence or absence of institutional arrangements for employee voice was one common thread linking these patterns. In common with Kersley et al, Table 3 also draws on data from WERS 2004, but draws a distinction between union and non-union voice in an attempt to shed further light on any connections. It suggests, not surprisingly, that workplaces with representative ‘voice’ arrangements involving trade unions report much higher levels of collective disputes and grievances than those that do not.xiv By contrast, the average rate for ET claims per 1000 employees is much lower in unionised workplaces than non-unionised ones.xv The evidence supports the idea that workplace representation encourages the internal resolution of disputes. The notion that collective representatives serve as ‘the custodians of individual rights’ (Brown et al, 2000: 627) thus appears to have strong support.
As for the association between ‘voice’/‘agency’ mechanisms and other expressions of conflict, Table 3 shows that representative ‘voice’ arrangements are associated with comparatively low rates of disciplinary sanctions and resignations (following Edwards, 1995, and Knight and Latreille, 2000), whereas the opposite is true of workplaces with no voice or non-union ‘voice’. On the other hand, perhaps more surprisingly, workplaces with no voice or non-union ‘voice’ report lower levels of absenteeism. Arguably, it is the greater exposure to the dynamics of workplace debates, together with their awareness of the possibility of conflict and disputes, that also helps to explain the higher proportion of employees in these ‘voice’ workplaces reporting ‘poor’ or ‘very poor’ relations between managers and employees.xvi Overall, it seems that, in keeping with the proposals of Freeman (1980), workplaces with no voice mechanism are characterised by strong disciplinary regimes in which the main expression of conflict takes the form of employees exiting from the organisation.
19

20
Table 3: Expressions of conflict, by type of ‘voice’
Any industrial
action
% of workplaces
Any grievances
% of workplaces
Employment Tribunal claims
Claims per 1,000
employees
Disciplinary sanctions
Sanctions per 100
employees
Absenteeism
% of working days lost per
workplace
Voluntaryresignations
Resignations per 100
employees
Relations between
managers and employees
% of employees rating ‘poor’ or
‘very poor’
Union voice only Union and non-union voice Non-union voice only No voice
9 7
1 *
45 44
40 31
1.3 2.1
2.7 2.9
2.5 4.2
7.8 6.1
5.5 6.9
4.3 3.2
9.0 8.8
17.2 18.3
17 19
11 11
All workplaces 2 38 2.4 5.9 4.5 13.8 15
Number of observations 2,223 2,191 2,115 2,020 1,838 2,055 21,295
Base: all workplaces with 5 or more employees (columns 1-6); all employees in workplaces with 5 or more (column 7).
Note: ‘Union voice’ comprises: the presence/recognition of a trade union; or the involvement of a union shop steward on a workplace consultative committee. ‘Non-union voice’ comprises: the involvement of a non-union employee representative on a workplace consultative committee; regular meetings between senior managers and the workforce; or regular team briefings.
Source: Workplace Industrial/Employment Relations Surveys
20

21
5. CONCLUSIONS
Collective disputes in Britain have declined significantly over the last twenty five years as they have in other OECD countries. By contrast, individual disputes remain a prominent feature with measures such as ET claims increasing significantly though still affecting a relatively small percentage of workplaces. Meanwhile, other possible expressions of conflict such as absenteeism and resignations have shown no signs of reducing. Yet, contrary to the relationship that this suggests, the different forms of conflict are not, in the most part, substitutes to one another, with the issues as well as the parties being different. The more opportunities employees have to air their grievances, especially through employee ‘voice’ mechanisms, the more they are likely to do so. In the absence of these opportunities and mechanisms, conflict is likely to manifest itself in much higher levels of employee turnover. This means that the question of whether or not relations are better cannot be answered with any confidence using the measures of disputes discussed in this paper. Fewer strikes or ET claims does not mean that relations are better. At best, on the basis of the indicators of climate, it can be said that the early to mid 1990s were a low point on a number of measures, with some improvement since that time. As for future trends, much depends on the immediate context, as the ‘spikes’ in public sector strikes clearly demonstrate. If, more generally, there was to be a return to the job insecurity and extensive downsizing of the mid-1990s, the climate, along with the indicators of conflict, is likely to change again.
The paper has been able to arrive at such conclusions because of the distinction that it draws between disputes and other expressions of conflict. Such a framework not only means that it is possible to put disputes into the wider context of conflict, but also offers opportunities to ‘map’ the connections with the various institutions involved in managing the employment relationship. At the same time, it forces us to recognise that there are no ‘pure’ indicators of the extent of conflict at work that can be captured on the basis of survey evidence alone. A framework for understanding the nature and the extent of such conflict requires an appreciation of context, explored in this paper through aspects such as procedural arrangements and voice mechanisms.
Focusing on WERS, the value of collecting data on a number of indicators of conflict, and not just strikes, has also been demonstrated. The ability to analyse such data by size, sector and institutions, which is not available in most other surveys dealing with the issue, is a very particular strength. Lacking in WERS is depth evidence on the processes and negotiations that underlie disputes; and broader indicators of both employee discontent and whether or not there is a environment in which employees may express their concerns. Moreover the limitations imposed by the periodic nature of the survey – and the focus on a single year in question - is perhaps most keenly felt in relation to measurement of conflict which can be subject to year on year volatility.
Finally, the analysis touches on several policy matters. One is the reform of the institutional arrangements of the ET system. Such changes clearly have a considerable impact on the ET claim rate and so need to be thought through with great care. The second is reducing the number of disputes that result in strikes in the public sector. Here further consideration might be given to the Local Government Pay Commission proposal for ‘assisted negotiation’ as a means of helping the parties to resolve the issues between them. More generally, the
21

22
22
analysis suggests the value of thinking in terms of conflict management rather than dispute resolution, i.e. encouraging the view that ‘disputes’ are a warning of underlying issues that need to be addressed through a wider, strategic approach to management-employee relations. Here the proposed abolition of legislation relating to the so called ‘three step’ statutory discipline and grievance procedures reinforces this perspective: procedures alone provide neither the deterrent nor the solution to conflictual relations in the workplace. Arguably a range of opportunities for employees to ‘voice’ their grievances merit consideration, ranging from training line managers to better handle conflict, to internal mediation arrangements, as well as revisiting the adequacy of representational arrangements. Outside the workplace, solutions may be found in the establishment of an agency dedicated to the enforcement of the full range of employment rights such as a ‘Fair Employment Commission’ most recently recommended by the Commission on Vulnerable Employment (Trades Union Congress, 2008: 160-1).

23
References
Ackroyd, S. and Thompson, P. (1999) Organisational Misbehaviour. London: Sage.
Acas (2007) Advisory, Conciliation and Arbitration Service 2007 Annual Report 2006/7, London: Acas.
Barmby, T., Ercolani, M. and Treble, J. (2004) “Sickness absence in the UK 1984-2002”, Swedish Economic Policy Review, 11, 1: 65-88.
Blanchflower, D. and Cubbin, J. (1986) “Strike propensities at the British workplace”, Oxford Bulletin of Economics and Statistics, 48, 1: 19-40.
Brown, W. (ed) (1981) The Changing Contours of British Industrial Relations: A Survey of Manufacturing Industry, Oxford: Basil Blackwell.
Brown, W., Deakin, S., Hudson, M., Pratten, C. and Ryan, P (1998) The Individualisation of the Employment Contract in Britain, London: Department of Trade and Industry.
Bryson, A. (2005) ‘Union effects on employee relations in Britain’. Human Relations. 58, 9: 1111-1139.
Burgess, S. Propper, C. and Wilson, D. (2000) Explaining the Growth in the Number of Applications to Industrial Tribunals 1972-1997, Employment Relations Research Series No 10, London: Department of Trade and Industry.
Casebourne J, Regan J, Neathey F, Tuohy S (2006) Employment Rights at Work: Survey of Employees 2005, Employment Relations Research Series No. 51, London: Department of Trade and Industry.
Collins, H. (1991) Regulating Contracts. Oxford: Oxford University Press.
Confederation of British Industry (2004) Room for Improvement: Absence and Labour Turnover 2004, London: Confederation of British Industry.
Daniel, W.W. (1976) Wage Determination in Industry, London: PEP.
Department of Trade and Industry (1998) Fairness at Work, Cm 3968, London: HMSO.
Dickens, L. (2000) ‘Doing more with less: Acas and individual conciliation’, pp.67-92 in W. Brown and B. Towers (2000) Employment Relations in Britain: 25 years of the Advisory, Conciliation and Arbitration Service, Oxford: Blackwell.
Dickens, L. (2002), “Individual statutory employment rights since 1997: Constrained Expansion”, Employee Relations, 24, 6: 619-637.
Dickens, L, Hart, M., Jones, M. and Weekes, B. (1981) “Re-employment of unfairly dismissed workers: the lost remedy”, Industrial Law Journal, 10, 3: 160-175.
Dickens, L., Jones, M., Weekes, B. and Hart, M. (1985) Dismissed: A Study of Unfair Dismissal and the Industrial Tribunal System, Oxford, Blackwell
23
24
Dickens, L and Neal., A. C. in L Dickens and A. C. Neal (eds), (2006) The Changing Institutional Face of British Employment Relations, Kluwer Law International.
Dickerson, A., and Stewart, M. (1993) “Is the public sector strike prone?”, Oxford Bulletin of Economics and Statistics, 55, 3: 253-284.
Donovan T (1968) Royal Commission on Trade Unions and Employers Associations 1965-68, Cmnd. 3623, London, HMSO.
Drinkwater, S. and Ingram, P. (2005) “Have industrial relations in the UK really improved?”, Labour, 19, 3: 373-398.
Edwards P (1995) “Human resource management, union voice and the use of discipline: an analysis of WIRS3”, Industrial Relations Journal, 26, 3: 204-220.
Edwards, P (2003) ‘The employment relationship and the field of industrial relations’, pp.1-36 in P. Edwards (ed) Industrial Relations: Theory and Practice. 2nd edition. Oxford: Blackwell.
Employment Tribunal Service (2008) Jurisdiction List, published online at: http://www.employmenttribunals.gov.uk/about_us/jurisdiction_list.htm [Retrieved 21st May 2008].
Fitzner, G. (2006) “How have employees fared? Recent UK trends”, Employment Relations Research Series No. 56, London: Department of Trade and Industry.
Freeman, R. (1980) “The exit-voice tradeoff in the labour market: unionism, job tenure, quits and separations”, Quarterly Journal of Economics, 94, 4: 643-674.
Fuller G (2007) “Equal pay for council workers: whose bill is it anyway?”, Personnel Today, 27th March.
Gall, G. and Hebdon, R. (2008) “Industrial conflict”, forthcoming in N. Bacon, P. Blyton, J. Fiorito and E. Heery (eds). The Handbook of Employment Relations. London: Sage.
Gibbons, M.(2007) Better Dispute Resolution. A review of employment dispute resolution in Great Britain, London: Department of Trade and Industry.
Government Social Survey (1968) Workplace Industrial Relations, SS 402, London: HMSO.
Green, F. and Tsitsianis, N. (2005) “An investigation of national trends in job satisfaction in Britain and Germany”, British Journal of Industrial Relations, 43, 3: 401-429.
Gregg P, Knight G and Wadsworth J (1999) “The cost of jobs loss”, pp.249-258 in P Gregg and J Wadsworth (eds) The State of Working Britain, Manchester: Manchester University Press.
Hassel, A. (2002) ‘A new going rate? Co-ordinated wage bargaining in Europe’, pp. 149-73 in P Pochet (ed) Wage Policy in the Eurozone, Brussels: PIE-Peter Lang S.A.
24

25
Hawes, W. R. (2000) “Setting the pace or running alongside? ACAS and the changing employment relationship”, pp.1-30 in B Towers and W Brown (eds) Employment Relations in Britain: 25 Years of the Advisory, Conciliation and Arbitration Service, Oxford: Blackwell.
Hayward, B., Peters, M., Rousseau, N. and Seeds, K. (2004) Findings from the Survey of Employment Tribunal Applications 2003, Employment Relations Research Series No. 33, London: Department of Trade and Industry.
Head, J. and Lucas, R. E. (2004) “Does individual employment legislation constrain the ability of hospitality employers to hire and fire?”, International Journal of Hospitality Management, 23, 2: 239-54.
Kelly J (1998) Rethinking Industrial Relations: Mobilization, Collectivism and Long Waves, London: Routledge.
Kersley B, Alpin C, Forth J, Bryson A, Bewley H, Dix G and Oxenbridge S (2006) Inside the Workplace: Findings from the 2004 Workplace Employment Relations Survey, London: Routledge.
Knight, K.G. and Latreille, P. (2000) ‘Discipline, Dismissals and Complaints to Employment Tribunals’. British Journal of Industrial Relations 38, 4: 533-555.
Latreille, P., Latreille, J. A. and Knight, K., G. (2007) “Employment Tribunals and Acas: evidence from a survey of representatives” Industrial Relations Journal 38:2, 136-154
Lipsky, D., Seeber, R. and Fincher, R. (2003) Emerging Systems for Managing Workplace Conflict, San Francisco: Jossey-Bass.
Marginson, P. and Sisson, K. (2004) European Integration and Industrial Relations. Multi-level Governance in the Making. Basingstoke: Palgrave.
Martin, C. (2003) 'Explaining labour turnover: empirical evidence from UK establishments'. Labour, 17, 3: 391-412.
Metcalf, D. 2003. 'Trade unions', pp.170-190 in R Dickens, P Gregg and J Wadsworth (eds). The Labour Market Under New Labour. Basingstoke: Palgrave-Macmillan.
Milner, S. (1993) “Overtime bands and strikes: evidence on relative incidence”, Industrial Relations Journal, 24, 3: 201-210.
Parker, S. (1974) Workplace Industrial Relations 1972, London: HMSO.
Parker, S. (1975) Workplace Industrial Relations 1973, London: HMSO.
Prais, S. (1978) “The strike-proneness of large plants in Britain”, Journal of the Royal Statistical Society, Series A, 141, 3: 363-84.
Prowse, P. and Prowse, P. (2007) 'Is there still a public sector model of employment relations in the United Kingdom?' International Journal of Public Sector Management, 20, 1: 48-62.
Scheuer, S. (2006) ‘A Novel Calculus? Institutional Change, Globalization and Industrial Conflict in Europe’. European Journal of Industrial Relations, 12, 2: 143-164.
25

26
Shackleton, J. R. (2002) Employment tribunals: their growth and the case for radical reform, London: The Institute of Economic Affairs.
Siebert, W. S. and Addison, J. .T. (1981) “Are strikes accidental?”, Economic Journal, 91: 389-404.
Sinclair, A. and Botten, N., (1995) ‘ Compensation for discrimination: cause for concern’ Employee Relations, 17, 8: 46-59.
Sisson, K. 2005. 'Personnel management and European integration: a case of indelible imprint?', pp.45-67 In Bach, S. (ed). Managing human resources: personnel management in transition. Oxford: Blackwell.
Trades Union Congress (2008) Hard Work, Hidden Lives. The Full Report of the Commission on Vulnerable Employment. London: Trades Union Congress.
Waddington, J. (2003) 'Trade union organisation', pp.214-256 in P. Edwards (ed) Industrial Relations: Theory and Practice. 2nd edition. Oxford: Blackwell.
26
27
Endnotes
i The widespread stoppages in the winter of 1978/9 in response to government attempts to enforce limits on pay rises to curb inflation. In the period 1977-79 there were twenty one stoppages that each accounted for at least 200,000 working days lost. ii Brown’s survey had the most extensive coverage, extending to all manufacturing workplaces with 50 or more employees. Brown used his survey data to estimate that, in 1977/8, the official statistics captured only one quarter of all strikes in manufacturing. However, the official statistics’ coverage of large strikes meant that they captured an estimated 94 per cent of all days lost (Brown, 1981: 100). iii Estimates reported here differ from those in early WIRS sourcebooks since the latter used a combined measure of industrial action based on management and worker representative respondents. Sampling strategies for worker representatives differed across the WERS series and so their responses are not included in this discussion. Estimates in Millward et al (1992) on the incidence of strike or non-strike action for 1980 (22 per cent), 1984 (25 per cent) and 1990 (12 per cent) use the combined measure; these indicate that we may be understating the scale of decline in industrial action, but we are certainly not mistaking the direction of change. iv A new conciliation service was also created within government to assist parties towards voluntary settlement of cases, and as a less costly alternative to tribunal adjudication. This role was later adopted by the Conciliation and Arbitration Service (established in 1974), later renamed the Advisory Conciliation and Arbitration Service (Acas) and established as an independent, tripartite statutory body under the Employment Protection Act (1975). To this date Acas has continued to hold a statutory duty to conciliate and promote a voluntary settlement in cases submitted to the now named Employment Tribunals in order to avoid costly formal hearings. v Notable examples have been in 1986, 5000 claims brought by News International workers, and in 1995, 25,000 claims from part time employees claiming retrospective membership of their employer pension schemes. vi In its 2006/7 Annual Report, Acas reported that 10,000 claims relating to equal pay had been lodged in the tribunal against local authorities and 15,000 had been presented against NHS employers. In addition, using its statutory duty, during 2006/7 Acas brokered settlements in 56,000 potential claims against local authorities. Setting aside these very large multiples, in 2007, 1,580 multiple cases were submitted representing just under 17,000 claims (mean rate of 10 claims per case; 66 cases contained in excess of 50 claims) (Acas statistics). vii In 2004, the figure among the wider population of workplaces with 5 or more employees was 5 per cent. viii The cost of such ‘semi-collective action’(Gall and Hebdon, 2008) is significant – estimated at around £3billion - and predicted to escalate potentially to £5bn in back-pay liabilities and future wage bills (Fuller, 2007). ix Despite starting with one of the lowest proportions of employment in manufacturing, the UK experienced the largest rate of decline of major EU countries. As a percentage of total employment UK, manufacturing employment declined from 20.7 per cent to 15.6 per cent between 1993 and 2002. In Germany, it declined from 27.8 per cent to 23.5 per cent. France saw a decline of 1.5 per cent, while Italy experienced a small increase. (Sisson: 2005: 59) x Arguably, statutory recognition and legal rights to information and consultation offered an opportunity to incorporate the handling of individual complaints and so reduce the reliance on ETs, The idea was not accepted at the policy level, however.
27

28
xi See for instance Sinclair and Botten (1995) on the effects of claims relating to pregnancy discrimination in the Ministry of Defence. xii In 2006/7, the median awards for unfair dismissal cases was £3,800, for race discrimination cases was £7,000 and was £6,724 for sex discrimination. Analysis across a 14 year period, 1993-2006, shows considerable fluctuation in median awards particularly in the area of race and sex discrimination. Across the period, adjusting for inflation, there was a 10 per cent rise in median awards for unfair dismissal, 61 per cent rise in sex discrimination cases, and 80 per cent rise in race discrimination median awards. xiii The BSAS series in Figure 3 charts the proportion of employees that rated management-employee relations as ‘not very good’ or ‘not at all good’; other possible responses were ‘very good’ and ‘quite good’. BSAS did not take place in 1988 or 1992. The WERS series in Figure 3 charts the proportion of managers that rated management-employee relations as ‘very poor’, ‘poor’ or ‘neither good nor poor’; other possible responses were ‘good’ or ‘very good’. We treat the central category as a negative rating since very few managers (no more than 2 per cent in any one year) admit to relations being poor. xiv Controlling for workplace size in the analysis of strikes and grievances (since one can naturally expect either to be more prevalent in larger workplaces, simply by weight of numbers of staff) means that the union / no union distinction remains in both cases, but becomes less clear cut in respect of grievances. xv Burgess and colleagues (2000) also found that declining union membership is associated with rise in claims. xvi On the basis of his analysis of the 1998 WERS data, Bryson (2005) suggests that ‘The only union effect common across employers and employees is poorer perceptions of employment relations where union coverage is at the level known to generate a union wage premium’.
28

researchpaperconflictinBritain.i3 3 21/07/2008 16:33:14

researchpaperconflictinBritain.i4 4 21/07/2008 16:33:14
Published by Acas Copyright © Acas