Embed Size (px)
Citation preview
RESEARCH Open Access
The genomic landscape shaped by selection ontransposable elements across 18 mouse strainsChristoffer Nellåker1*†, Thomas M Keane2†, Binnaz Yalcin3, Kim Wong2, Avigail Agam1,3, T Grant Belgard1,4,5,Jonathan Flint3, David J Adams2, Wayne N Frankel6 and Chris P Ponting1,2*
Abstract
Background: Transposable element (TE)-derived sequence dominates the landscape of mammalian genomes andcan modulate gene function by dysregulating transcription and translation. Our current knowledge of TEs inlaboratory mouse strains is limited primarily to those present in the C57BL/6J reference genome, with most mouseTEs being drawn from three distinct classes, namely short interspersed nuclear elements (SINEs), long interspersednuclear elements (LINEs) and the endogenous retrovirus (ERV) superfamily. Despite their high prevalence, thedifferent genomic and gene properties controlling whether TEs are preferentially purged from, or are retained by,genetic drift or positive selection in mammalian genomes remain poorly defined.
Results: Using whole genome sequencing data from 13 classical laboratory and 4 wild-derived mouse inbredstrains, we developed a comprehensive catalogue of 103,798 polymorphic TE variants. We employ this extensivedata set to characterize TE variants across the Mus lineage, and to infer neutral and selective processes that haveacted over 2 million years. Our results indicate that the majority of TE variants are introduced though the malegermline and that only a minority of TE variants exert detectable changes in gene expression. However, amonggenes with differential expression across the strains there are twice as many TE variants identified as being putativecausal variants as expected.
Conclusions: Most TE variants that cause gene expression changes appear to be purged rapidly by purifyingselection. Our findings demonstrate that past TE insertions have often been highly deleterious, and help toprioritize TE variants according to their likely contribution to gene expression or phenotype variation.
BackgroundTransposable elements (TEs) have been highly influentialin shaping the structure and evolution of mammaliangenomes, as exemplified by TE-derived sequence contri-buting between 38 and 69% of genomic sequence [1-8].TE insertions also can influence the transcription, trans-lation or function of genes [1-7]. Functional effects of TEinsertions include their regulation of transcription by act-ing as alternative promoters or as enhancer elements andvia the generation of antisense transcripts, or of tran-scriptional silencers. TEs can alter splice sites or RNAediting, provide alternative poly-adenylation signals or
exons, modify chromatin structure or alter translation.Furthermore, TE insertion has been suggested to be amechanism by which new co-regulatory networks arise[1-7].TEs are classified on the basis of their transposition
mechanism [9]. A class I retrotransposon propagates inthe host genome through an intermediate RNA step,requiring a reverse transcriptase to revert it to DNA beforeinsertion into the genome. Class II DNA transposons donot have an RNA intermediate, and translocate with theaid of transposases and DNA polymerase. The overwhelm-ing majority, over 96%, of TEs in the mouse genome are ofthe retrotransposon type [10]. These are further classifiedinto three distinct classes: short interspersed nuclear ele-ments (SINEs), long interspersed nuclear elements(LINEs) and the endogenous retrovirus (ERV) superfamily.The ERVs are ancient remnants of exogenous virus infec-tions, consisting of internal sequence that encodes viral
* Correspondence: [email protected]; [email protected]† Contributed equally1MRC Functional Genomics Unit, Department of Physiology, Anatomy andGenetics, University of Oxford, South Parks Road, Oxford, OX1 3PT, UKFull list of author information is available at the end of the article
Nellåker et al. Genome Biology 2012, 13:R45http://genomebiology.com/2012/13/6/R45
© 2012 Nellåker et al.; licensee BioMed Central Ltd. This is an open access article distributed under the terms of the Creative CommonsAttribution License (http://creativecommons.org/licenses/by/2.0), which permits unrestricted use, distribution, and reproduction inany medium, provided the original work is properly cited.
genes that are flanked by long terminal repeats (LTRs)[11].TEs provide a potential source of variants that are det-
rimental to host viability and that promote disease. Forexample, an allele of the agouti locus in mouse containsan intra-cisternal A particle (IAP) retrotransposonupstream of the promoter that causes ectopic expressionof the agouti protein leading to variation in fur color,obesity, diabetes and tumor susceptibility [12-14]. Themurine leukemia virus (MuLV)-like family of ERVs is apotent source of mutagenesis. The first MuLV elementinsertion was observed to result in hairless and pleiotro-pic phenotypes [15,16]. That TEs are frequently detri-mental can also be inferred from the strong bias inorientation of TEs found in introns of genes. Humanintronic ERVs and LINEs, but not SINEs, show a ten-dency to disrupt expression when inserted into introns inthe gene’s transcriptional sense orientation [17-21]. Inmice there are over 50 examples of phenotypes attributedto spontaneous insertional mutagenesis by ERVs, withone class of functional variants, early transposon (ETn),showing a strong bias to be in the sense transcriptionalorientation [6]. This orientation bias is attributed to cryp-tic splice acceptor usage and/or inefficient read-throughof the ERV LTR, which contains its own regulatorysignals [6].TEs that are present in the C57BL/6J reference genome
assembly exhibit this orientation bias [17,19-22], whichindicates that TE insertions have often been deleteriousover tens of millions of years of rodent evolution. By con-trast, our knowledge of the intronic distribution and thestructure of TE variants (TEVs) inserted during the recentMus lineage has been largely derived from targetedapproaches. Previous studies examined two ERV familiesin eight strains (IAP or ETn/MusD elements in C57BL/6J,A/J, DBA/2J, SPRET/EiJ, CAST/EiJ, MOLF/EiJ, WSB/EiJand 129X1/SvJ) [18,21,23], with one study in particularfocusing on intronic insertions [22] and another exploringLINE variation in four strains (129S1, 129X1, A/J andDBA/2J) [24]. Such TEVs may exhibit a reduced orienta-tion bias because weakly detrimental TEVs that have beeninserted, in the sense orientation, during recent evolutionmay not have had sufficient numbers of generations to beeffectively purged from the population. In addition, dele-terious TEVs present in laboratory mice might have beenmaintained owing to their artificial inbreeding. It is thusplausible that TEVs contribute substantially to the geneticload and gene expression variation among inbred and wildmice.We previously reported the generation and analysis of
over a terabase of raw sequence from the genomes of 17mouse strains [25], and the structural variations calledbetween these strains [26]. In this study we present exten-sive analyses of a set of TEVs that were subsequently
derived from these sequence reads using an updated pipe-line that was specifically designed to counter the difficul-ties inherent in identifying transposition events. We alsopresent this new genome-wide catalogue of ERV, LINE,and SINE TEVs with deep TE subfamily, structural andorientation classifications across 18 (17 newly sequencedplus 1 reference) mouse strains.This mouse genome project examined 13 classical
laboratory (129P2/OlaHsd, 129S1/SvImJ, 129S5/SvEvBrd,A/J, AKR/J, BALB/cJ, C3H/HeJ, C57BL/6NJ, CBA/J, DBA/2J, LP/J, NOD/ShiLtJ and NZO/HiLtJ) and 4 wild-derivedmouse inbred strains (CAST/EiJ, PWK/PhJ, WSB/EiJ andSPRET/EiJ), and each was compared to the C57BL/6Jreference sequence. Altogether, this group encompassesapproximately 2 million years (My) of evolutionary diver-gence [27]. Concomitantly, RNA-Seq data were generatedfrom whole brain tissue from 14 of the 17 mouse strains,thereby allowing us to consider the impact of genotypicdifferences on gene expression levels.By taking advantage of these new data we provide a
comprehensive analysis of the patterns of variation of allthree TE classes across the Mus genus, and use these datato examine the extent to which genomic location influ-ences the retention or purifying selection of TEVs amonga large number of mouse strains. We first show variableERV, LINE and SINE variant densities across the 18mouse genomes, within chromosomal, intergenic andgenic locations, and for different gene classes, and thenaccount for these variable densities by invoking processesof neutral evolution and purifying or positive selection.
ResultsGenome landscape of recently inserted TEVsWe computationally predicted 103,798 TEVs (28,951SINEs, 40,074 LINEs and 34,773 ERVs) among the 17sequenced mouse strains in addition to the C57BL/6Jreference strain; 6 of these have previously been exam-ined in some respects (129S1/SvImJ, A/J, DBA/2J, CAST/EiJ, WSB/EiJ and SPRET/EiJ), whereas others have, toour knowledge, not been systematically examined forTEVs (129P2/OlaHsd, 129S5/SvEvBrd, AKR/J, BALB/cJ,C3H/HeJ, C57BL/6NJ, CBA/J, LP/J, NOD/ShiLtJ, NZO/HiLtJ and PWK/PhJ) (Additional file 1). This number ofTEVs is over four times higher than for all previous stu-dies combined [18,21,23,24]. We employed twoapproaches for TEV discovery, SVMerge, which com-bines the results of four methods of structural variantprediction [28], and RetroSeq (Additional file 2). After fil-tering (Materials and methods), SVMerge predicted44,401 non-redundant insertions within the lineage ofthe C57BL/6J reference strain, whereas the RetroSeqmethod inferred 59,397 TEV insertions occurring outsideof this lineage (Figure 1a). We refer to these insertions, inthe reference strain lineage and outside the reference
Nellåker et al. Genome Biology 2012, 13:R45http://genomebiology.com/2012/13/6/R45
Page 2 of 21
VL30RLTR45RLTR1BRLTR10MuLVMaLRIS2IAPETn
(b) (c)
(d) (e)
B6 TEVs+B6 TEVs-115
12354151181392913814126241383414004136611391714720118951462717661385124083362839
0
AB
C
D
E
F
GH
IJ
K
L
MN
OQ
P
C57BL/6JC57BL/6NJNZO/HlLtJNOD/ShiLtJAKR/JA/JBALB/cJC3H/HeJCBA/JDBA/2J129S1/SvlmJ129P2/OlaHsd129S5/SvEvBrdLP/JWSB/EiJCAST/EiJPWK/PhJSPRET/EiJ
(a)
AB BC CD DE EF FG GH13,317 4,050 9,587 1,640 8,711 6,7722,193
100%
80%
60%
40%
20%
0%
ERV
SINE
LINE_frag
LINE
AB BC CD DE EF FL LM MN1,255 142 12013,317 4,050 9,587 1,6402,193
100%
80%
60%
40%
20%
0%
AB BC CD DE EF FG GH1,733 602 1,618 496 340 2,023 1,859
100%
80%
60%
40%
20%
0%
AB BC CD DE EF FL LM MN610 77 701,733 602 1,618 496 340
100%
80%
60%
40%
20%
0%
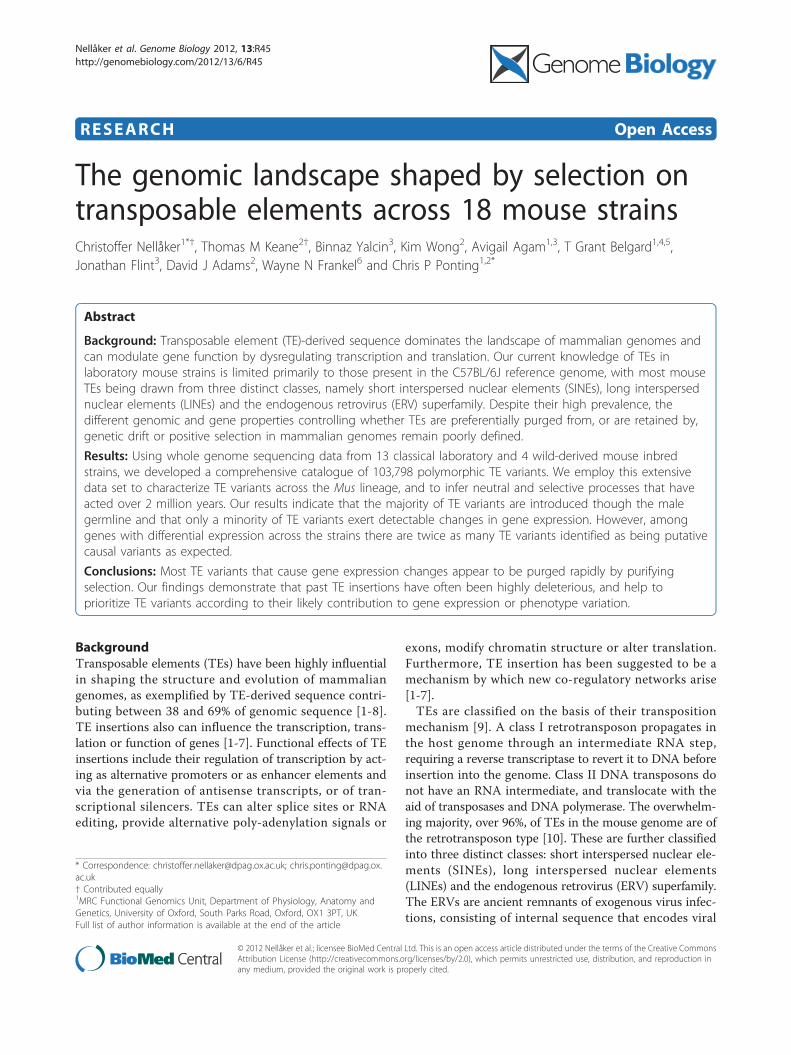
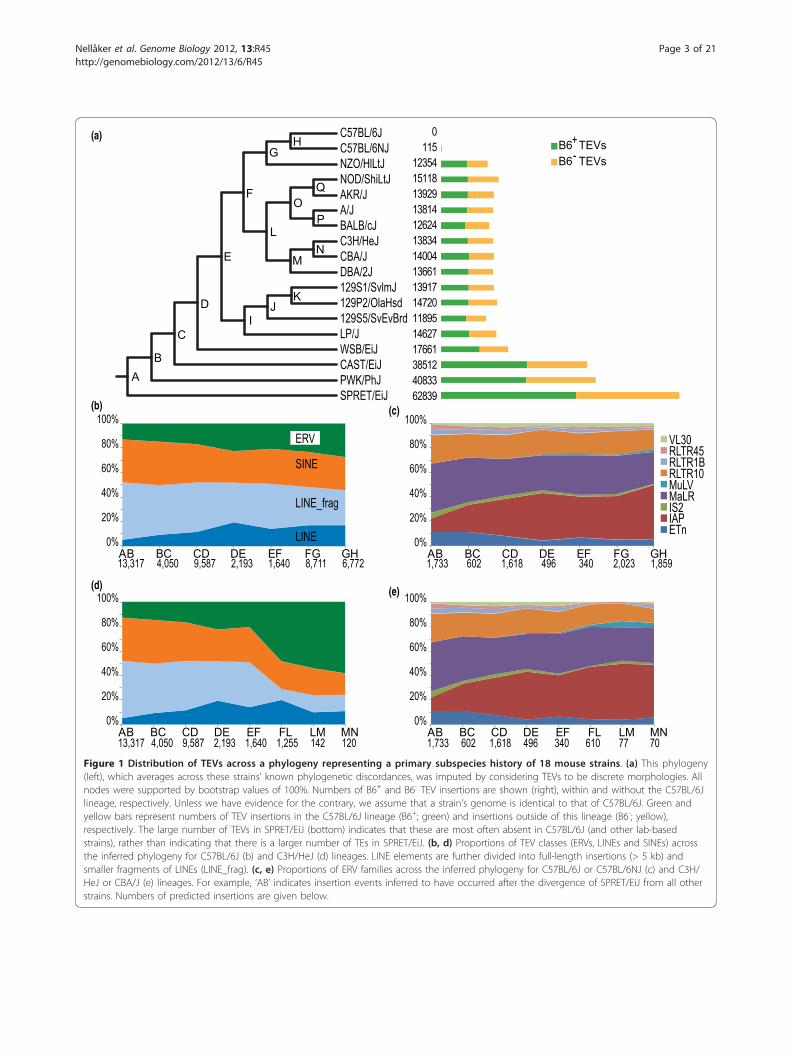
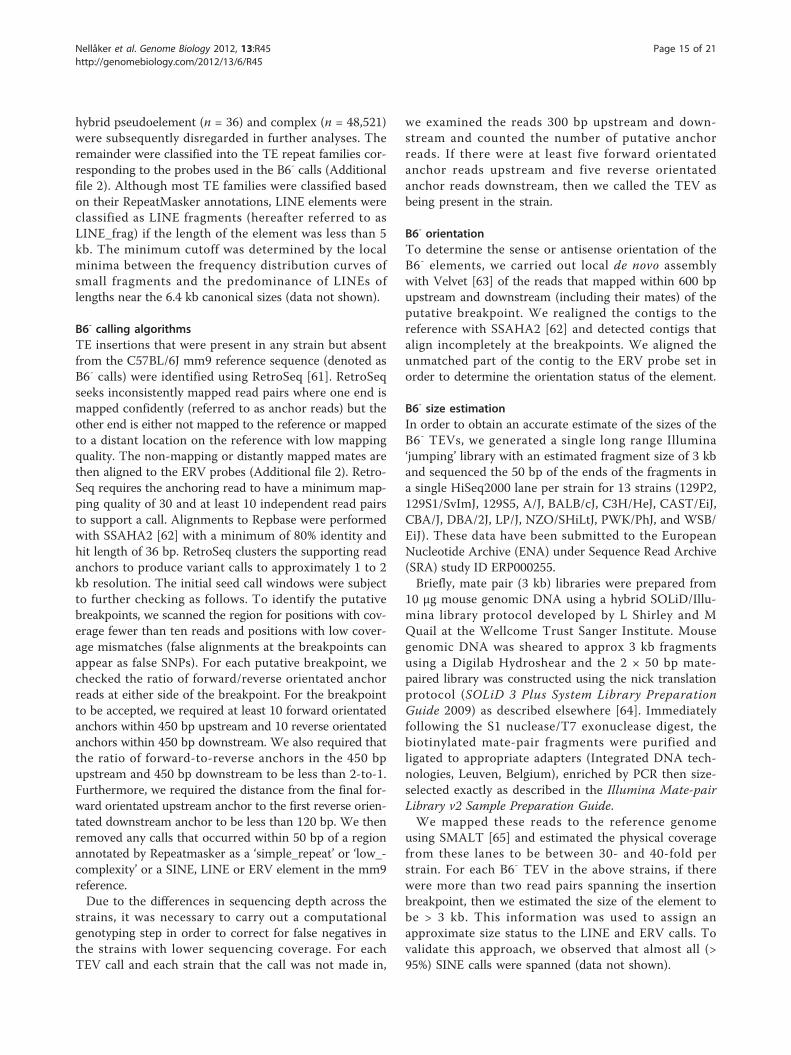
Figure 1 Distribution of TEVs across a phylogeny representing a primary subspecies history of 18 mouse strains. (a) This phylogeny(left), which averages across these strains’ known phylogenetic discordances, was imputed by considering TEVs to be discrete morphologies. Allnodes were supported by bootstrap values of 100%. Numbers of B6+ and B6- TEV insertions are shown (right), within and without the C57BL/6Jlineage, respectively. Unless we have evidence for the contrary, we assume that a strain’s genome is identical to that of C57BL/6J. Green andyellow bars represent numbers of TEV insertions in the C57BL/6J lineage (B6+; green) and insertions outside of this lineage (B6-; yellow),respectively. The large number of TEVs in SPRET/EiJ (bottom) indicates that these are most often absent in C57BL/6J (and other lab-basedstrains), rather than indicating that there is a larger number of TEs in SPRET/EiJ. (b, d) Proportions of TEV classes (ERVs, LINEs and SINEs) acrossthe inferred phylogeny for C57BL/6J (b) and C3H/HeJ (d) lineages. LINE elements are further divided into full-length insertions (> 5 kb) andsmaller fragments of LINEs (LINE_frag). (c, e) Proportions of ERV families across the inferred phylogeny for C57BL/6J or C57BL/6NJ (c) and C3H/HeJ or CBA/J (e) lineages. For example, ‘AB’ indicates insertion events inferred to have occurred after the divergence of SPRET/EiJ from all otherstrains. Numbers of predicted insertions are given below.
Nellåker et al. Genome Biology 2012, 13:R45http://genomebiology.com/2012/13/6/R45
Page 3 of 21
lineage, as B6+ and B6- TEVs, respectively (B6+, TE pre-sent in C57BL/6J; B6-, not present in C57BL/6J). Byfurther classifying TEVs according to type and class, wedetermined that virtually all mouse strain TEVs aredrawn from subfamilies that were previously observed tobe active [9] (Figure 1; Additional file 3). Each strain hasapproximately equal numbers of B6+ and B6- variants, asone might expect if TEVs accumulated at similar rates.There are higher numbers of TEVs relative to C57BL/6Jin the wild-derived strains (SPRET/EiJ, PWK/PhJ andCAST/EiJ; 13.8 to 22.4 per Mb) than in the laboratorystrains (4.2 to 6.3 per Mb; Figure 1a). By examining thestrain distribution patterns derived from 688 PCR valida-tion of TEVs across 8 strains, we find relatively low falsepositive rates (11 to 22%); furthermore, by conservativelyassuming the genomes of the three 129-derived sub-strains (129S1/SvImJ, 129P2/OlaHsd and 129S5/SvEvBrd) to be identical, we estimated false negativerates to be 5 to 28% across the classes (Additional files 4,5 and 6). Given the available read length, insert size andcoverage, there were limits to the degree to which subfa-milies of TEVs could be reliably stratified. Differences inour ability to distinguish TEV subfamilies are attributableto contrasting sequence divergence in their first and last300 bp. SINE subfamilies could not be distinguished,LINEs were classified as either full-length LINEs or LINEfragments, and ERVs were placed into subfamilies VL30,RLTR45, RLTR1B, RLTR10, MuLV, MaLR, IS2, IAP andETn. However, the range of classes and families we inves-tigated, to our knowledge, represents the broadest studyof TEVs in the Mus lineage to date.In order to interpret this vast catalog, we placed the TEinsertions within a primary phylogeny of these mousestrains, which permitted an initial overview of the relativeexpansions of all the TE families over an approximate 2My time period (Figure 1a). This primary phylogenymatched the phylogeny expected from the heritage of themouse strains [29]. This analysis revealed the historicexpansion of ERV families, most notably IAPs, in labora-tory strains (Figure 1b-e). ERVs were seen to contributebetween 29 and 39% of all TEVs in the sequenced strains(Figure 1b-e).Different ERV families contribute, in sequence length, to
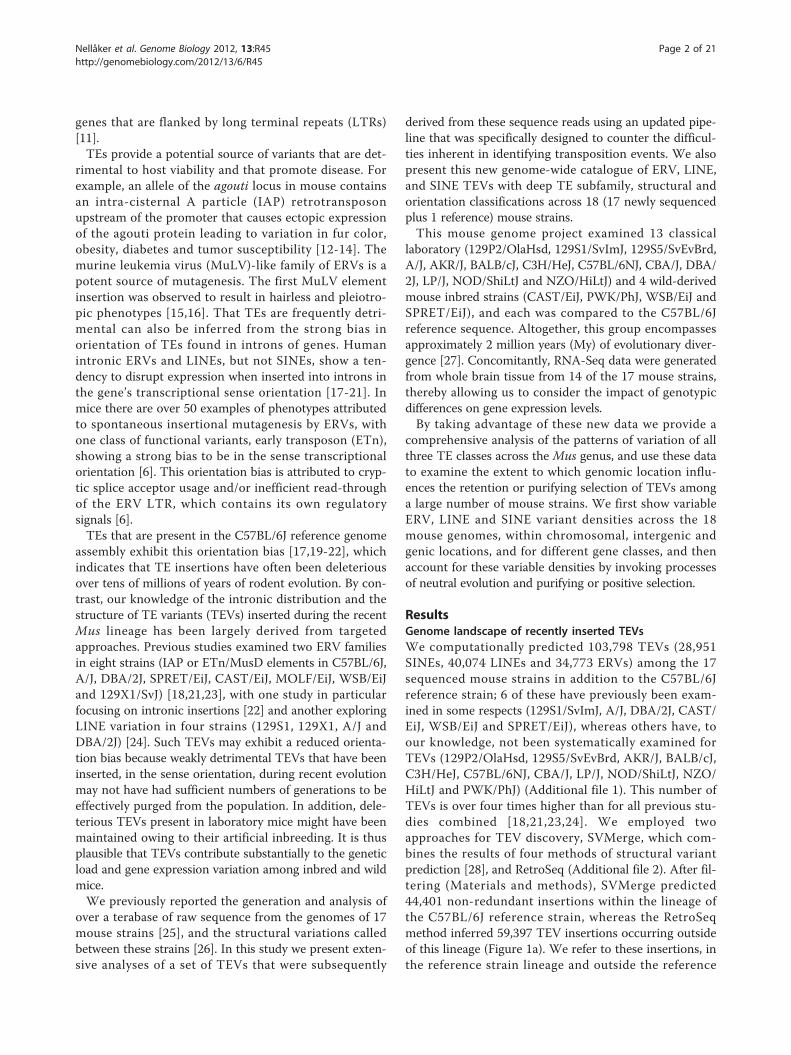
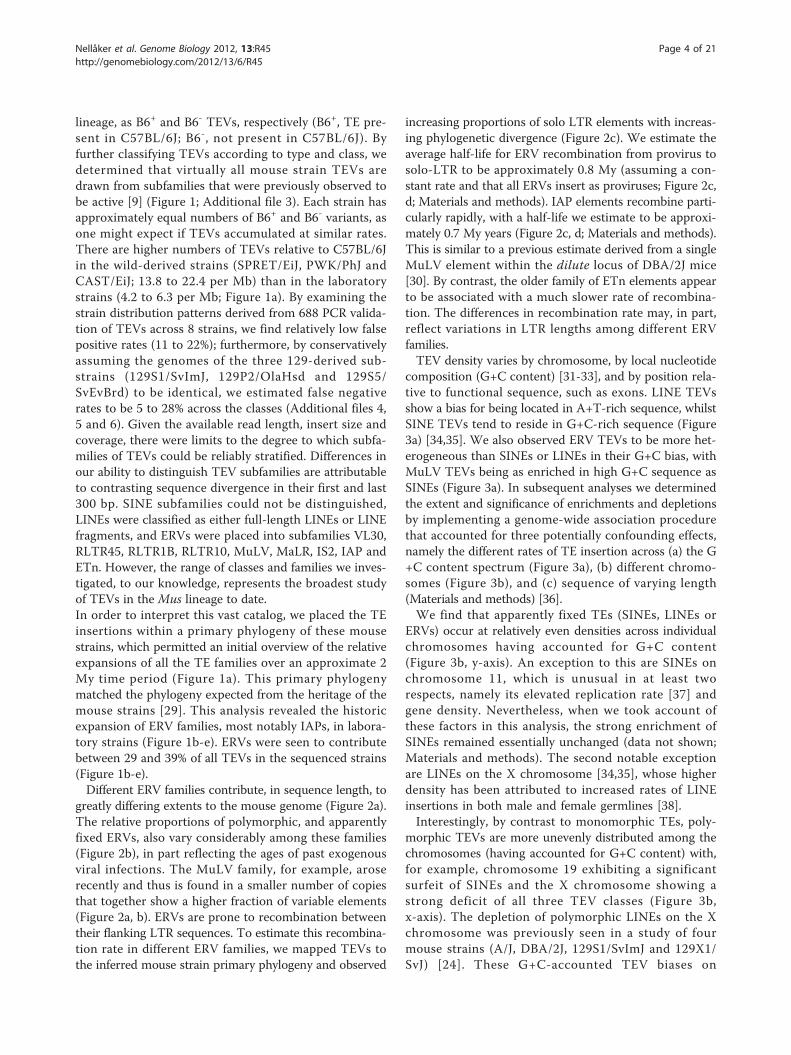
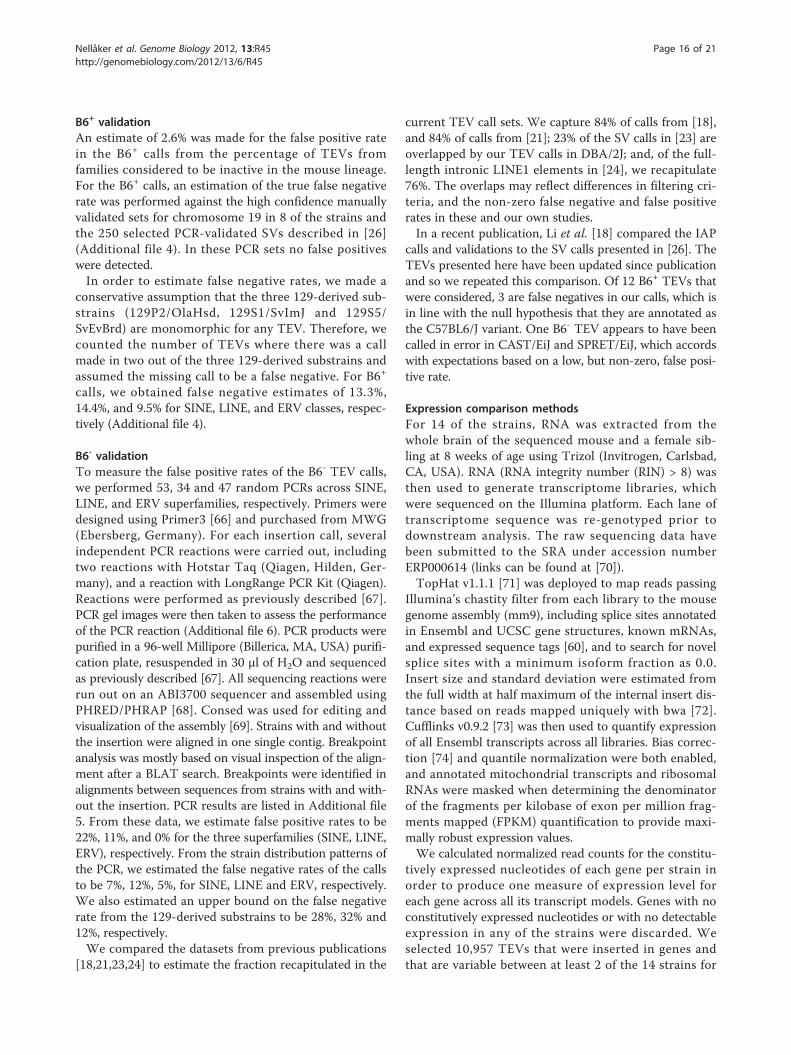
greatly differing extents to the mouse genome (Figure 2a).The relative proportions of polymorphic, and apparentlyfixed ERVs, also vary considerably among these families(Figure 2b), in part reflecting the ages of past exogenousviral infections. The MuLV family, for example, aroserecently and thus is found in a smaller number of copiesthat together show a higher fraction of variable elements(Figure 2a, b). ERVs are prone to recombination betweentheir flanking LTR sequences. To estimate this recombina-tion rate in different ERV families, we mapped TEVs tothe inferred mouse strain primary phylogeny and observed
increasing proportions of solo LTR elements with increas-ing phylogenetic divergence (Figure 2c). We estimate theaverage half-life for ERV recombination from provirus tosolo-LTR to be approximately 0.8 My (assuming a con-stant rate and that all ERVs insert as proviruses; Figure 2c,d; Materials and methods). IAP elements recombine parti-cularly rapidly, with a half-life we estimate to be approxi-mately 0.7 My years (Figure 2c, d; Materials and methods).This is similar to a previous estimate derived from a singleMuLV element within the dilute locus of DBA/2J mice[30]. By contrast, the older family of ETn elements appearto be associated with a much slower rate of recombina-tion. The differences in recombination rate may, in part,reflect variations in LTR lengths among different ERVfamilies.TEV density varies by chromosome, by local nucleotide
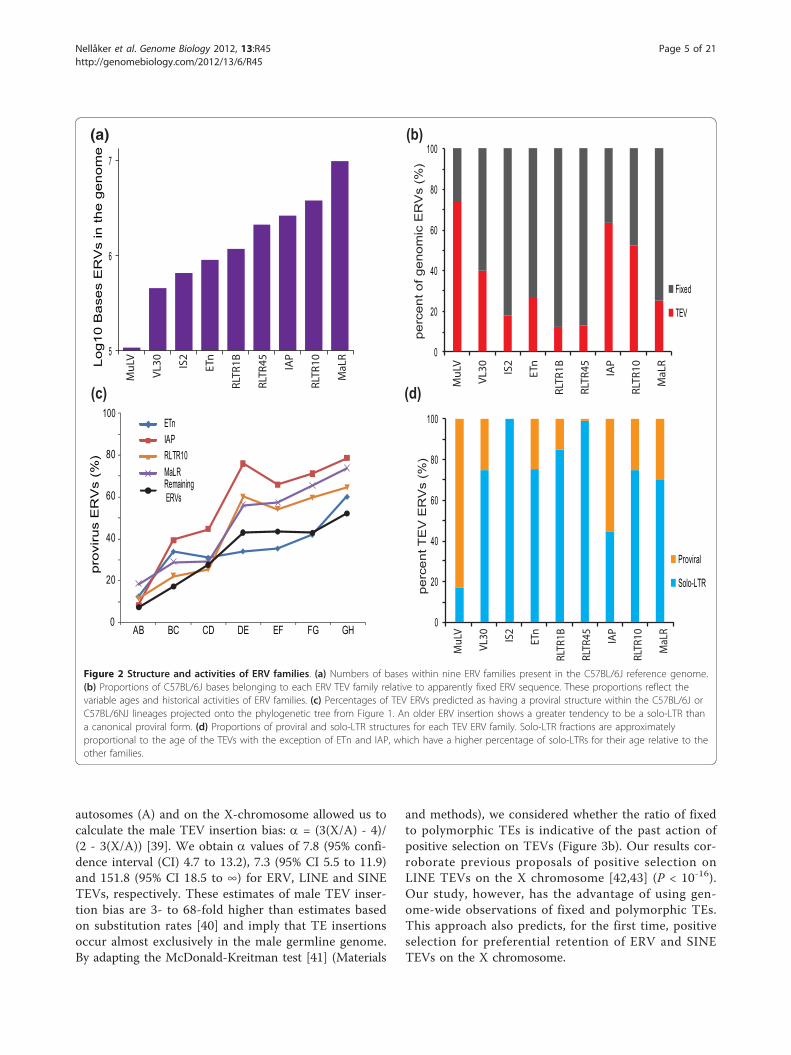
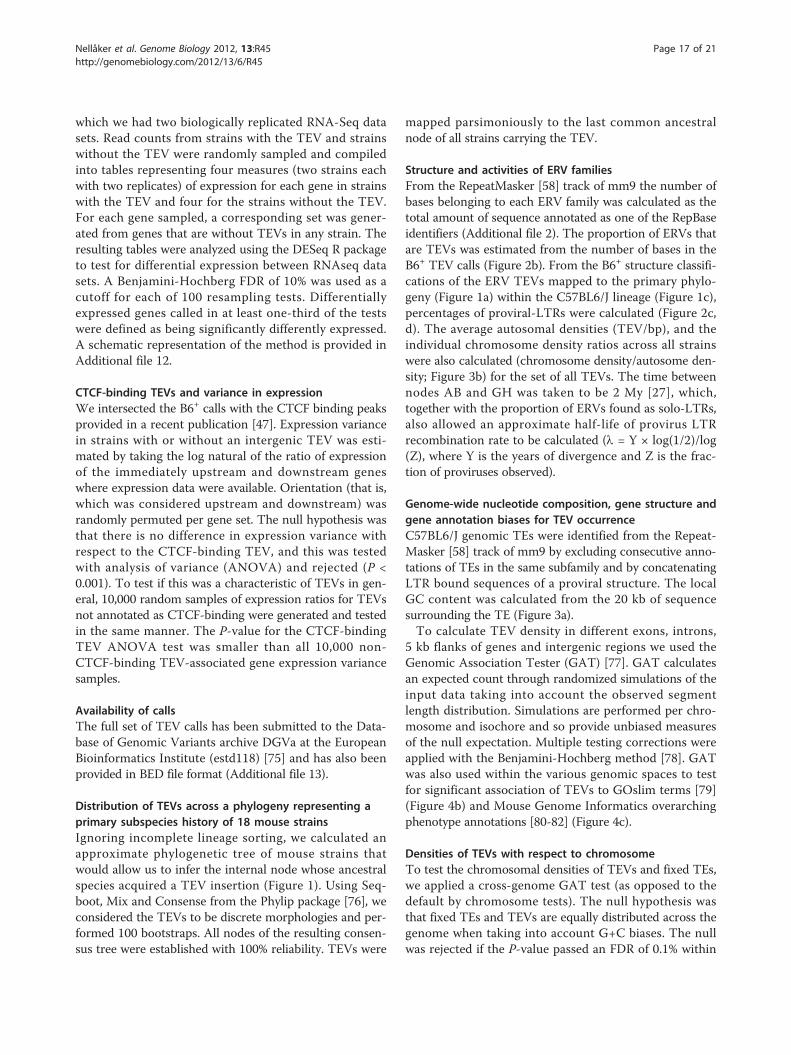
composition (G+C content) [31-33], and by position rela-tive to functional sequence, such as exons. LINE TEVsshow a bias for being located in A+T-rich sequence, whilstSINE TEVs tend to reside in G+C-rich sequence (Figure3a) [34,35]. We also observed ERV TEVs to be more het-erogeneous than SINEs or LINEs in their G+C bias, withMuLV TEVs being as enriched in high G+C sequence asSINEs (Figure 3a). In subsequent analyses we determinedthe extent and significance of enrichments and depletionsby implementing a genome-wide association procedurethat accounted for three potentially confounding effects,namely the different rates of TE insertion across (a) the G+C content spectrum (Figure 3a), (b) different chromo-somes (Figure 3b), and (c) sequence of varying length(Materials and methods) [36].We find that apparently fixed TEs (SINEs, LINEs or
ERVs) occur at relatively even densities across individualchromosomes having accounted for G+C content(Figure 3b, y-axis). An exception to this are SINEs onchromosome 11, which is unusual in at least tworespects, namely its elevated replication rate [37] andgene density. Nevertheless, when we took account ofthese factors in this analysis, the strong enrichment ofSINEs remained essentially unchanged (data not shown;Materials and methods). The second notable exceptionare LINEs on the X chromosome [34,35], whose higherdensity has been attributed to increased rates of LINEinsertions in both male and female germlines [38].Interestingly, by contrast to monomorphic TEs, poly-
morphic TEVs are more unevenly distributed among thechromosomes (having accounted for G+C content) with,for example, chromosome 19 exhibiting a significantsurfeit of SINEs and the X chromosome showing astrong deficit of all three TEV classes (Figure 3b,x-axis). The depletion of polymorphic LINEs on the Xchromosome was previously seen in a study of fourmouse strains (A/J, DBA/2J, 129S1/SvImJ and 129X1/SvJ) [24]. These G+C-accounted TEV biases on
Nellåker et al. Genome Biology 2012, 13:R45http://genomebiology.com/2012/13/6/R45
Page 4 of 21
autosomes (A) and on the X-chromosome allowed us tocalculate the male TEV insertion bias: a = (3(X/A) - 4)/(2 - 3(X/A)) [39]. We obtain a values of 7.8 (95% confi-dence interval (CI) 4.7 to 13.2), 7.3 (95% CI 5.5 to 11.9)and 151.8 (95% CI 18.5 to ∞) for ERV, LINE and SINETEVs, respectively. These estimates of male TEV inser-tion bias are 3- to 68-fold higher than estimates basedon substitution rates [40] and imply that TE insertionsoccur almost exclusively in the male germline genome.By adapting the McDonald-Kreitman test [41] (Materials
and methods), we considered whether the ratio of fixedto polymorphic TEs is indicative of the past action ofpositive selection on TEVs (Figure 3b). Our results cor-roborate previous proposals of positive selection onLINE TEVs on the X chromosome [42,43] (P < 10-16).Our study, however, has the advantage of using gen-ome-wide observations of fixed and polymorphic TEs.This approach also predicts, for the first time, positiveselection for preferential retention of ERV and SINETEVs on the X chromosome.
0
20
40
60
80
100
Proviral
Solo-LTR
MuLV
VL30 IS2
ETn
RLTR
1B
RLTR
45 IAP
RLTR
10
MaLR
perc
ent T
EV
ER
Vs
(%)
0
20
40
60
80
100
Fixed
TEV
MuLV
VL30 IS2
ETn
RLTR
1B
RLTR
45 IAP
RLTR
10
MaLR
perc
ent o
f gen
omic
ER
Vs
(%)
(b)
5
6
7
MuLV
VL30 IS2
ETn
RLTR
1B
RLTR
45 IAP
RLTR
10
MaLRLo
g10
Bas
es E
RV
s in
the
geno
me
(d)(c)
(a)
prov
irus
ER
Vs
(%)
0
20
40
60
80
100
AB BC CD DE EF FG GH
ETnIAPRLTR10MaLRRemaining ERVs
Figure 2 Structure and activities of ERV families. (a) Numbers of bases within nine ERV families present in the C57BL/6J reference genome.(b) Proportions of C57BL/6J bases belonging to each ERV TEV family relative to apparently fixed ERV sequence. These proportions reflect thevariable ages and historical activities of ERV families. (c) Percentages of TEV ERVs predicted as having a proviral structure within the C57BL/6J orC57BL/6NJ lineages projected onto the phylogenetic tree from Figure 1. An older ERV insertion shows a greater tendency to be a solo-LTR thana canonical proviral form. (d) Proportions of proviral and solo-LTR structures for each TEV ERV family. Solo-LTR fractions are approximatelyproportional to the age of the TEVs with the exception of ETn and IAP, which have a higher percentage of solo-LTRs for their age relative to theother families.
Nellåker et al. Genome Biology 2012, 13:R45http://genomebiology.com/2012/13/6/R45
Page 5 of 21
(b)
X
X
11
194
13
15
3
19
X
117
7
120
140
80
60
120
140
8060
TEVsobs/exp (%)
Fixed TEsobs/exp (%)
SINELINEERV
Significant x2Significant x1Not Significant
(0-32
)
(32-34
)
(34-36
)
(36-38
)
(38-40
)
(40-42
)
(42-44
)
(44-46
)
(46-48
)
(48-50
)
(50-52
)
(52-54
)
(54-10
0)
GC - bin (%)
100
80
60
40
20
0
Cumu
lative
perce
ntage
of T
EVs (
%)
LINE TEVERV TEVSINE TEVMuLV TEVGenomic LINEGenomic ERVGenomic SINE
(a)
Figure 3 Genome-wide nucleotide composition and chromosome biases for TEV density. (a) Cumulative distributions of TEV familiesaccording to their genomic GC context. SINE TEVs tend to occur in GC-rich sequence while LINE and ERV TEVs each show an AT preference,with the notable exception of the MuLV family, which is biased towards GC. TEVs showed no differences in these biases compared to all TEs inthe reference genome assembly. (b) Chromosome biases in the densities of TEVs (x-axis) and apparently fixed TEs (y-axis). Each axis representsthe observed density divided by the density expected from genome-wide random samples of sequence approximately matched according to G+C content (Materials and methods). Significant density deviations from the null expectation are indicated by color for TEVs or fixed TEs (yellow)or both (red). The spread in observed densities across chromosomes is greater for TEVs compared with the older, apparently fixed, TEs. There is ageneral tendency for chromosomes that exhibit elevated (decreased) TE densities to also exhibit increased (lower) densities of TEVs (excludingchromosome X: SINE R2 = 0.6756, P < 10-4; LINE R2 = 0.0054, P < 0.7; ERV R2 = 0.3836, P < 0.0047). The quadrants shaded grey match thiscorrelation in ratios between TEVs and fixed TEs. Nevertheless, this trend does not explain the higher than expected density of TEVs on the Xchromosome when compared with its lower than expected TE density. All chromosomal TE density points that fall within the orange shadedarea show signals of positive selection according to the McDonald-Kreitman test (FDR 0.1%).
Nellåker et al. Genome Biology 2012, 13:R45http://genomebiology.com/2012/13/6/R45
Page 6 of 21
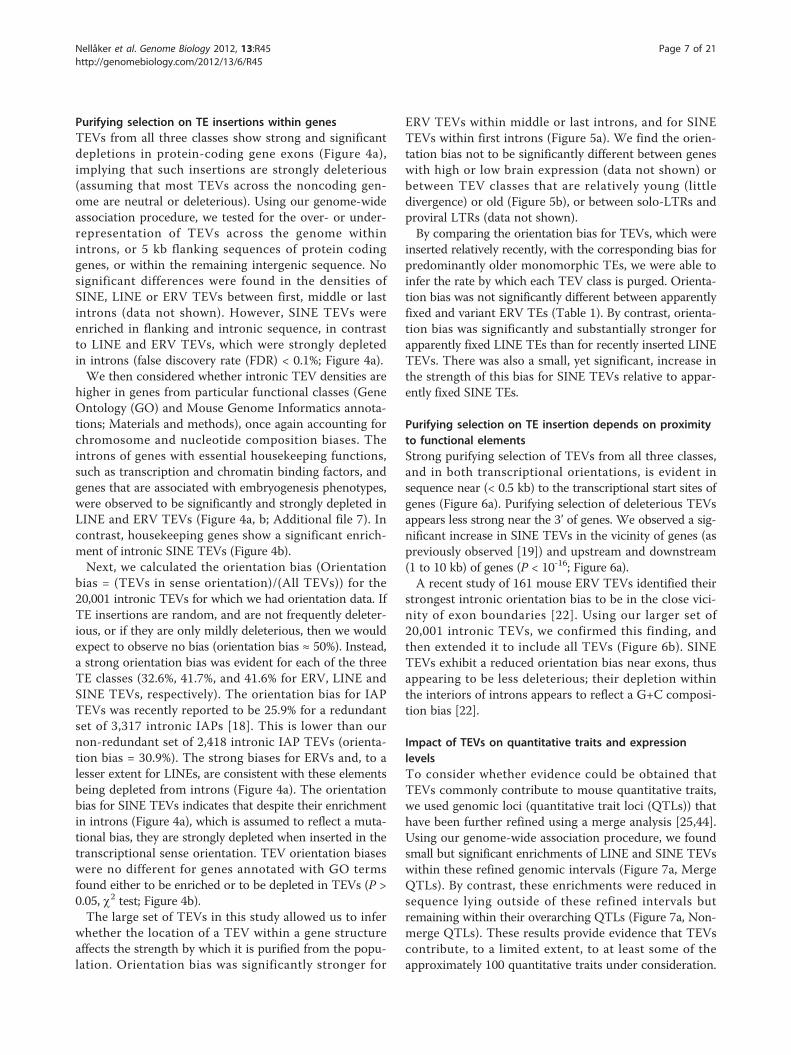
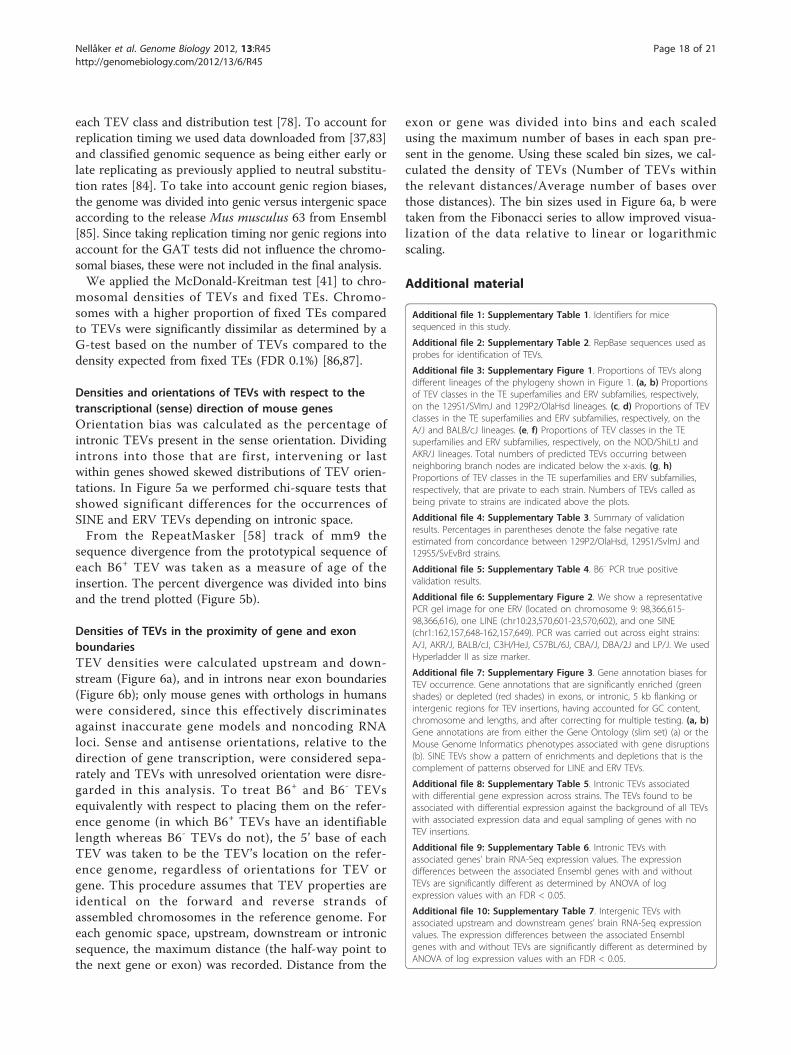
Purifying selection on TE insertions within genesTEVs from all three classes show strong and significantdepletions in protein-coding gene exons (Figure 4a),implying that such insertions are strongly deleterious(assuming that most TEVs across the noncoding gen-ome are neutral or deleterious). Using our genome-wideassociation procedure, we tested for the over- or under-representation of TEVs across the genome withinintrons, or 5 kb flanking sequences of protein codinggenes, or within the remaining intergenic sequence. Nosignificant differences were found in the densities ofSINE, LINE or ERV TEVs between first, middle or lastintrons (data not shown). However, SINE TEVs wereenriched in flanking and intronic sequence, in contrastto LINE and ERV TEVs, which were strongly depletedin introns (false discovery rate (FDR) < 0.1%; Figure 4a).We then considered whether intronic TEV densities are
higher in genes from particular functional classes (GeneOntology (GO) and Mouse Genome Informatics annota-tions; Materials and methods), once again accounting forchromosome and nucleotide composition biases. Theintrons of genes with essential housekeeping functions,such as transcription and chromatin binding factors, andgenes that are associated with embryogenesis phenotypes,were observed to be significantly and strongly depleted inLINE and ERV TEVs (Figure 4a, b; Additional file 7). Incontrast, housekeeping genes show a significant enrich-ment of intronic SINE TEVs (Figure 4b).Next, we calculated the orientation bias (Orientation
bias = (TEVs in sense orientation)/(All TEVs)) for the20,001 intronic TEVs for which we had orientation data. IfTE insertions are random, and are not frequently deleter-ious, or if they are only mildly deleterious, then we wouldexpect to observe no bias (orientation bias ≈ 50%). Instead,a strong orientation bias was evident for each of the threeTE classes (32.6%, 41.7%, and 41.6% for ERV, LINE andSINE TEVs, respectively). The orientation bias for IAPTEVs was recently reported to be 25.9% for a redundantset of 3,317 intronic IAPs [18]. This is lower than ournon-redundant set of 2,418 intronic IAP TEVs (orienta-tion bias = 30.9%). The strong biases for ERVs and, to alesser extent for LINEs, are consistent with these elementsbeing depleted from introns (Figure 4a). The orientationbias for SINE TEVs indicates that despite their enrichmentin introns (Figure 4a), which is assumed to reflect a muta-tional bias, they are strongly depleted when inserted in thetranscriptional sense orientation. TEV orientation biaseswere no different for genes annotated with GO termsfound either to be enriched or to be depleted in TEVs (P >0.05, c2 test; Figure 4b).The large set of TEVs in this study allowed us to infer
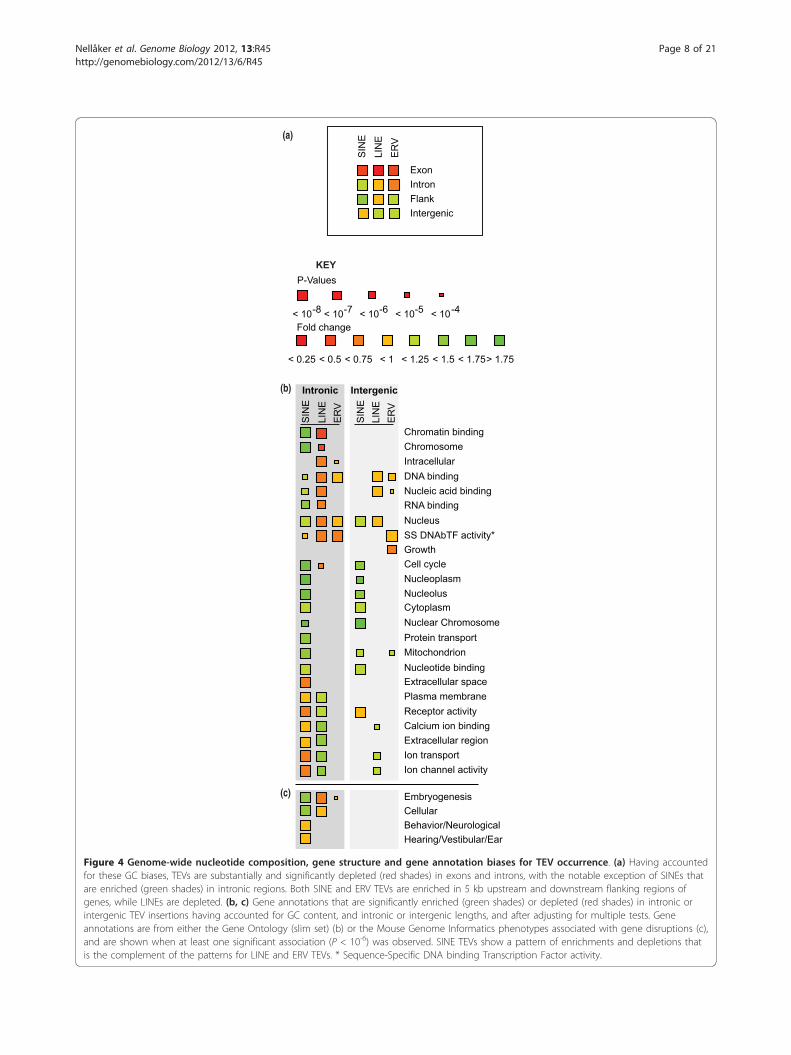
whether the location of a TEV within a gene structureaffects the strength by which it is purified from the popu-lation. Orientation bias was significantly stronger for
ERV TEVs within middle or last introns, and for SINETEVs within first introns (Figure 5a). We find the orien-tation bias not to be significantly different between geneswith high or low brain expression (data not shown) orbetween TEV classes that are relatively young (littledivergence) or old (Figure 5b), or between solo-LTRs andproviral LTRs (data not shown).By comparing the orientation bias for TEVs, which were
inserted relatively recently, with the corresponding bias forpredominantly older monomorphic TEs, we were able toinfer the rate by which each TEV class is purged. Orienta-tion bias was not significantly different between apparentlyfixed and variant ERV TEs (Table 1). By contrast, orienta-tion bias was significantly and substantially stronger forapparently fixed LINE TEs than for recently inserted LINETEVs. There was also a small, yet significant, increase inthe strength of this bias for SINE TEVs relative to appar-ently fixed SINE TEs.
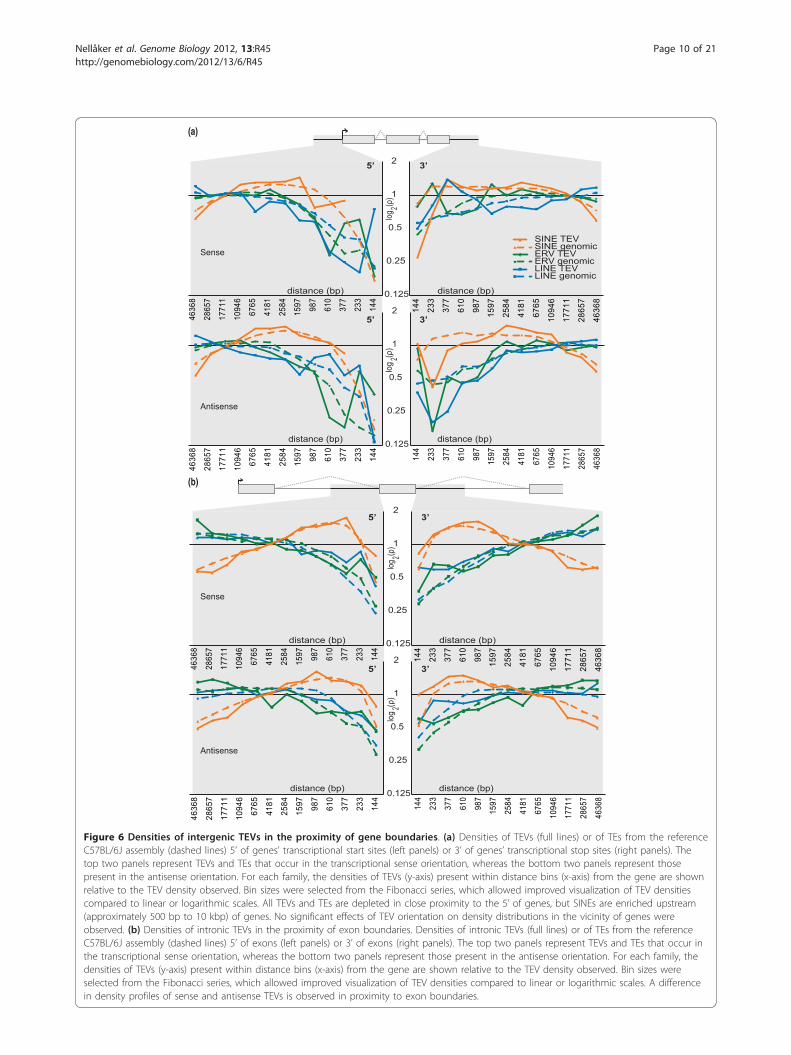
Purifying selection on TE insertion depends on proximityto functional elementsStrong purifying selection of TEVs from all three classes,and in both transcriptional orientations, is evident insequence near (< 0.5 kb) to the transcriptional start sites ofgenes (Figure 6a). Purifying selection of deleterious TEVsappears less strong near the 3’ of genes. We observed a sig-nificant increase in SINE TEVs in the vicinity of genes (aspreviously observed [19]) and upstream and downstream(1 to 10 kb) of genes (P < 10-16; Figure 6a).A recent study of 161 mouse ERV TEVs identified their
strongest intronic orientation bias to be in the close vici-nity of exon boundaries [22]. Using our larger set of20,001 intronic TEVs, we confirmed this finding, andthen extended it to include all TEVs (Figure 6b). SINETEVs exhibit a reduced orientation bias near exons, thusappearing to be less deleterious; their depletion withinthe interiors of introns appears to reflect a G+C composi-tion bias [22].
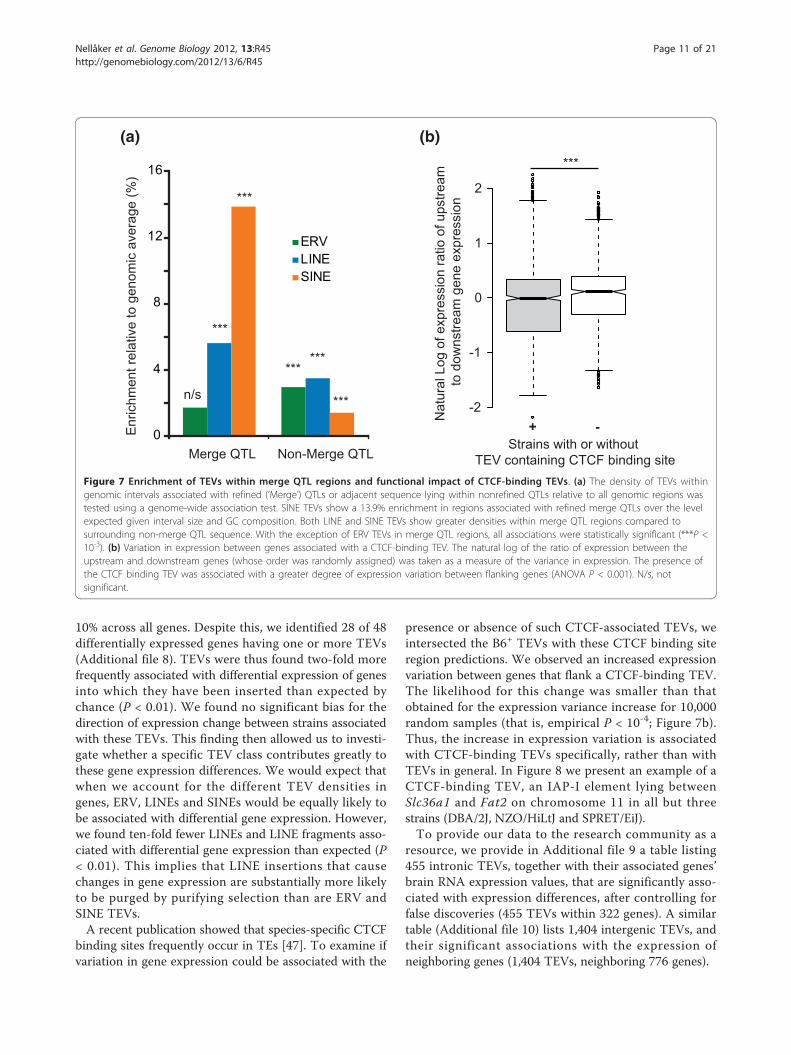
Impact of TEVs on quantitative traits and expressionlevelsTo consider whether evidence could be obtained thatTEVs commonly contribute to mouse quantitative traits,we used genomic loci (quantitative trait loci (QTLs)) thathave been further refined using a merge analysis [25,44].Using our genome-wide association procedure, we foundsmall but significant enrichments of LINE and SINE TEVswithin these refined genomic intervals (Figure 7a, MergeQTLs). By contrast, these enrichments were reduced insequence lying outside of these refined intervals butremaining within their overarching QTLs (Figure 7a, Non-merge QTLs). These results provide evidence that TEVscontribute, to a limited extent, to at least some of theapproximately 100 quantitative traits under consideration.
Nellåker et al. Genome Biology 2012, 13:R45http://genomebiology.com/2012/13/6/R45
Page 7 of 21
ER
VLI
NE
SIN
E
ER
VLI
NE
SIN
E
IntergenicIntronic
DNA binding
RNA binding
Calcium ion binding
Cell cycle
Chromatin bindingChromosome
Extracellular region
Extracellular space
Growth
Intracellular
Ion channel activityIon transport
Mitochondrion
Nucleic acid binding
NucleolusNucleoplasm
Nucleotide binding
Nucleus
Plasma membrane
Protein transport
Receptor activity
SS DNAbTF activity*
CytoplasmNuclear Chromosome
CellularEmbryogenesis
Hearing/Vestibular/EarBehavior/Neurological
> 1.75
Fold change
< 0.25 < 0.5 < 0.75 < 1 < 1.25 < 1.5 < 1.75
P-Values
< 10 < 10 < 10 < 10 < 10-8 -7 -6 -5 -4
ER
V
LIN
E
SIN
E
ExonIntronFlankIntergenic
(a)
(b)
(c)
KEY
Figure 4 Genome-wide nucleotide composition, gene structure and gene annotation biases for TEV occurrence. (a) Having accountedfor these GC biases, TEVs are substantially and significantly depleted (red shades) in exons and introns, with the notable exception of SINEs thatare enriched (green shades) in intronic regions. Both SINE and ERV TEVs are enriched in 5 kb upstream and downstream flanking regions ofgenes, while LINEs are depleted. (b, c) Gene annotations that are significantly enriched (green shades) or depleted (red shades) in intronic orintergenic TEV insertions having accounted for GC content, and intronic or intergenic lengths, and after adjusting for multiple tests. Geneannotations are from either the Gene Ontology (slim set) (b) or the Mouse Genome Informatics phenotypes associated with gene disruptions (c),and are shown when at least one significant association (P < 10-6) was observed. SINE TEVs show a pattern of enrichments and depletions thatis the complement of the patterns for LINE and ERV TEVs. * Sequence-Specific DNA binding Transcription Factor activity.
Nellåker et al. Genome Biology 2012, 13:R45http://genomebiology.com/2012/13/6/R45
Page 8 of 21
Of the 12 variants that passed the genome-wide associa-tion with QTLs [26], two were found to be IAP TEVs.To establish a set of TEVs that likely affect gene
expression, we examined the dataset for previously pro-ven examples of ERV strain variants, of which there areabout a dozen examples [6] (also see [45]), of whichonly some would show sufficient expression in brain tobe detected in our study. Indeed, for ERV insertions inGria4 (IAP type I insertion specific to C3H/HeJ mice),Myo5a (MuLV insertion specific to DBA/2J) and Zhx2(ETn insertion specific to BALB/c), the expected expres-sion decreases associated with the ERV allele were allobserved (data not shown). However, since many ERVinsertion effects are often local, primarily affecting levelsof a nearby exon [45], and/or are cell type-specific [46],these and likely other novel TEV cis effects on geneexpression did not survive the stringent multiple testingcorrection required for genome-wide analysis.
We next considered whether TEVs, when consideredtogether, were often causal variants of gene expressionchanges or quantitative traits. We compared expressionlevels among strains, acquired from RNA-Seq experi-ments of whole brain samples, for genes with or withoutan intronic TEV. Ascribing a gene expression differenceto a specific TEV is confounded by the presence of otherlinked variants that may, instead, be causal. To accountfor this and to identify a conservative set of TEVs asso-ciated with gene expression differences, we calculated ineach strain the expression for the constitutively expressedsequence and then normalized these mapped read levelsbetween samples to allow for their comparison. By con-sidering the presence or absence of a TEV as an experi-mental condition, differential expression of genes wascalculated (Materials and methods). In a previous publi-cation [26], we estimated that the proportion of expres-sion heritability attributable to TEVs is no more than
(a) (b)50%
45%
40%
35%
30%
25%
Divergence (%)
0-1
2-3
4-5
6-7
8-9
10-1
1
12-1
3
14-1
5
propo
rtion i
n sen
se or
ientat
ion (%
)
SINELINEERV
Expected
ERV LINE SINE
50%
40%
30%
20%
10%
0%
*** ***Fir
stMi
ddle
Last
First
Midd
leLa
st
First
Midd
leLa
st
Figure 5 Densities and orientations of TEVs with respect to the transcriptional (sense) direction of mouse genes. (a) Orientation biaswithin first, middle and last introns of protein coding genes. All TEV types occur preferentially in the antisense orientation, with the ERV TEV biasbeing the strongest. ERV TEVs show a lower bias in the first introns of genes (P < 10-3 by chi-square test). SINE TEVs show a significantly strongerorientation bias in the first introns of protein coding genes (P < 10-3). (b) Orientation biases are not significantly different between ‘young’ and‘old’ TEVs, categorized using percentage sequence divergence from the repeat consensus sequence (x-axis). *** indicates P < 10-3.
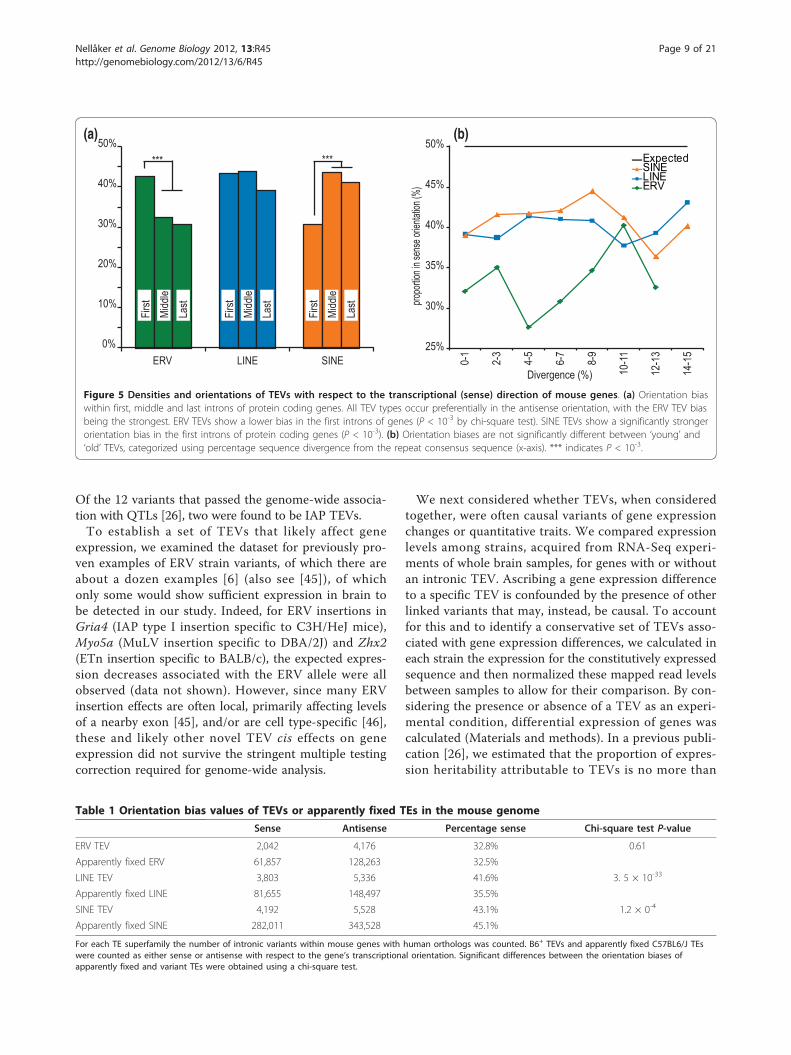
Table 1 Orientation bias values of TEVs or apparently fixed TEs in the mouse genome
Sense Antisense Percentage sense Chi-square test P-value
ERV TEV 2,042 4,176 32.8% 0.61
Apparently fixed ERV 61,857 128,263 32.5%
LINE TEV 3,803 5,336 41.6% 3. 5 × 10-33
Apparently fixed LINE 81,655 148,497 35.5%
SINE TEV 4,192 5,528 43.1% 1.2 × 0-4
Apparently fixed SINE 282,011 343,528 45.1%
For each TE superfamily the number of intronic variants within mouse genes with human orthologs was counted. B6+ TEVs and apparently fixed C57BL6/J TEswere counted as either sense or antisense with respect to the gene’s transcriptional orientation. Significant differences between the orientation biases ofapparently fixed and variant TEs were obtained using a chi-square test.
Nellåker et al. Genome Biology 2012, 13:R45http://genomebiology.com/2012/13/6/R45
Page 9 of 21
144
233
377
610
987
1597
2584
4181
6765
1094
6
1771
1
2865
7
4636
8
2
1
0.5
0.25
0.125
)( gol
2
distance (bp)
144
233
377
610
987
1597
2584
4181
6765
1094
6
1771
1
2865
7
4636
8
distance (bp)
144
233
377
610
987
1597
2584
4181
6765
1094
6
1771
1
2865
7
4636
8
2
1
0.5
0.25
0.125
)( gol
2
distance (bp)
144
233
377
610
987
1597
2584
4181
6765
1094
6
1771
1
2865
7
4636
8
distance (bp)
5’ 3’
5’ 3’
(a)
LINE genomicLINE TEVERV genomicERV TEVSINE genomicSINE TEV
144
233
377
610
987
1597
2584
4181
6765
1094
6
1771
1
2865
7
4636
8
2
1
0.5
0.25
0.125
)( gol
2
distance (bp)
144
233
377
610
987
1597
2584
4181
6765
1094
6
1771
1
2865
7
4636
8
distance (bp)
144
233
377
610
987
1597
2584
4181
6765
1094
6
1771
1
2865
7
4636
8
2
1
0.5
0.25
0.125
)( gol
2
distance (bp)
144
233
377
610
987
1597
2584
4181
6765
1094
6
1771
1
2865
7
4636
8
distance (bp)
5’ 3’
5’ 3’
(b)
Sense
Antisense
Sense
Antisense
Figure 6 Densities of intergenic TEVs in the proximity of gene boundaries. (a) Densities of TEVs (full lines) or of TEs from the referenceC57BL/6J assembly (dashed lines) 5’ of genes’ transcriptional start sites (left panels) or 3’ of genes’ transcriptional stop sites (right panels). Thetop two panels represent TEVs and TEs that occur in the transcriptional sense orientation, whereas the bottom two panels represent thosepresent in the antisense orientation. For each family, the densities of TEVs (y-axis) present within distance bins (x-axis) from the gene are shownrelative to the TEV density observed. Bin sizes were selected from the Fibonacci series, which allowed improved visualization of TEV densitiescompared to linear or logarithmic scales. All TEVs and TEs are depleted in close proximity to the 5’ of genes, but SINEs are enriched upstream(approximately 500 bp to 10 kbp) of genes. No significant effects of TEV orientation on density distributions in the vicinity of genes wereobserved. (b) Densities of intronic TEVs in the proximity of exon boundaries. Densities of intronic TEVs (full lines) or of TEs from the referenceC57BL/6J assembly (dashed lines) 5’ of exons (left panels) or 3’ of exons (right panels). The top two panels represent TEVs and TEs that occur inthe transcriptional sense orientation, whereas the bottom two panels represent those present in the antisense orientation. For each family, thedensities of TEVs (y-axis) present within distance bins (x-axis) from the gene are shown relative to the TEV density observed. Bin sizes wereselected from the Fibonacci series, which allowed improved visualization of TEV densities compared to linear or logarithmic scales. A differencein density profiles of sense and antisense TEVs is observed in proximity to exon boundaries.
Nellåker et al. Genome Biology 2012, 13:R45http://genomebiology.com/2012/13/6/R45
Page 10 of 21
10% across all genes. Despite this, we identified 28 of 48differentially expressed genes having one or more TEVs(Additional file 8). TEVs were thus found two-fold morefrequently associated with differential expression of genesinto which they have been inserted than expected bychance (P < 0.01). We found no significant bias for thedirection of expression change between strains associatedwith these TEVs. This finding then allowed us to investi-gate whether a specific TEV class contributes greatly tothese gene expression differences. We would expect thatwhen we account for the different TEV densities ingenes, ERV, LINEs and SINEs would be equally likely tobe associated with differential gene expression. However,we found ten-fold fewer LINEs and LINE fragments asso-ciated with differential gene expression than expected (P< 0.01). This implies that LINE insertions that causechanges in gene expression are substantially more likelyto be purged by purifying selection than are ERV andSINE TEVs.A recent publication showed that species-specific CTCF
binding sites frequently occur in TEs [47]. To examine ifvariation in gene expression could be associated with the
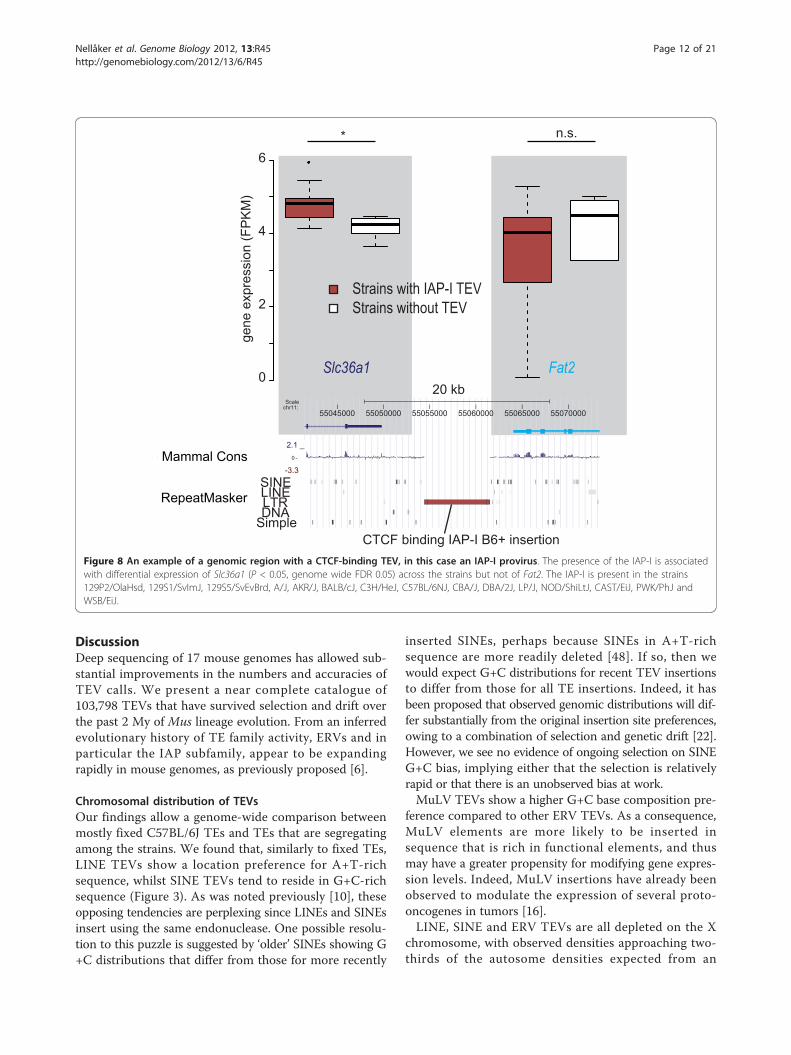
presence or absence of such CTCF-associated TEVs, weintersected the B6+ TEVs with these CTCF binding siteregion predictions. We observed an increased expressionvariation between genes that flank a CTCF-binding TEV.The likelihood for this change was smaller than thatobtained for the expression variance increase for 10,000random samples (that is, empirical P < 10-4; Figure 7b).Thus, the increase in expression variation is associatedwith CTCF-binding TEVs specifically, rather than withTEVs in general. In Figure 8 we present an example of aCTCF-binding TEV, an IAP-I element lying betweenSlc36a1 and Fat2 on chromosome 11 in all but threestrains (DBA/2J, NZO/HiLtJ and SPRET/EiJ).To provide our data to the research community as a
resource, we provide in Additional file 9 a table listing455 intronic TEVs, together with their associated genes’brain RNA expression values, that are significantly asso-ciated with expression differences, after controlling forfalse discoveries (455 TEVs within 322 genes). A similartable (Additional file 10) lists 1,404 intergenic TEVs, andtheir significant associations with the expression ofneighboring genes (1,404 TEVs, neighboring 776 genes).
(b)
0
1
2
-1
-2
Nat
ural
Log
of e
xpre
ssio
n ra
tio o
f ups
tream
to
dow
nstre
am g
ene
expr
essi
onStrains with or without
TEV containing CTCF binding site
-+
***
(a)
0
4
8
12
16
ERVLINESINE
***
***
******
***
Merge QTL Non-Merge QTL
Enr
ichm
ent r
elat
ive
to g
enom
ic a
vera
ge (%
)
n/s
Figure 7 Enrichment of TEVs within merge QTL regions and functional impact of CTCF-binding TEVs. (a) The density of TEVs withingenomic intervals associated with refined (’Merge’) QTLs or adjacent sequence lying within nonrefined QTLs relative to all genomic regions wastested using a genome-wide association test. SINE TEVs show a 13.9% enrichment in regions associated with refined merge QTLs over the levelexpected given interval size and GC composition. Both LINE and SINE TEVs show greater densities within merge QTL regions compared tosurrounding non-merge QTL sequence. With the exception of ERV TEVs in merge QTL regions, all associations were statistically significant (***P <10-3). (b) Variation in expression between genes associated with a CTCF-binding TEV. The natural log of the ratio of expression between theupstream and downstream genes (whose order was randomly assigned) was taken as a measure of the variance in expression. The presence ofthe CTCF binding TEV was associated with a greater degree of expression variation between flanking genes (ANOVA P < 0.001). N/s, notsignificant.
Nellåker et al. Genome Biology 2012, 13:R45http://genomebiology.com/2012/13/6/R45
Page 11 of 21
DiscussionDeep sequencing of 17 mouse genomes has allowed sub-stantial improvements in the numbers and accuracies ofTEV calls. We present a near complete catalogue of103,798 TEVs that have survived selection and drift overthe past 2 My of Mus lineage evolution. From an inferredevolutionary history of TE family activity, ERVs and inparticular the IAP subfamily, appear to be expandingrapidly in mouse genomes, as previously proposed [6].
Chromosomal distribution of TEVsOur findings allow a genome-wide comparison betweenmostly fixed C57BL/6J TEs and TEs that are segregatingamong the strains. We found that, similarly to fixed TEs,LINE TEVs show a location preference for A+T-richsequence, whilst SINE TEVs tend to reside in G+C-richsequence (Figure 3). As was noted previously [10], theseopposing tendencies are perplexing since LINEs and SINEsinsert using the same endonuclease. One possible resolu-tion to this puzzle is suggested by ‘older’ SINEs showing G+C distributions that differ from those for more recently
inserted SINEs, perhaps because SINEs in A+T-richsequence are more readily deleted [48]. If so, then wewould expect G+C distributions for recent TEV insertionsto differ from those for all TE insertions. Indeed, it hasbeen proposed that observed genomic distributions will dif-fer substantially from the original insertion site preferences,owing to a combination of selection and genetic drift [22].However, we see no evidence of ongoing selection on SINEG+C bias, implying either that the selection is relativelyrapid or that there is an unobserved bias at work.MuLV TEVs show a higher G+C base composition pre-
ference compared to other ERV TEVs. As a consequence,MuLV elements are more likely to be inserted insequence that is rich in functional elements, and thusmay have a greater propensity for modifying gene expres-sion levels. Indeed, MuLV insertions have already beenobserved to modulate the expression of several proto-oncogenes in tumors [16].LINE, SINE and ERV TEVs are all depleted on the X
chromosome, with observed densities approaching two-thirds of the autosome densities expected from an
20 kb55045000 55050000 55055000 55060000 55065000 55070000
Scalechr11:
SIN
DNASINELINELTR
Simple
Mammal Cons2.1 _
-3.3 0 -
Fat2
DNARepeatMasker
Slc36a1
gen
e ex
pres
sion
(FP
KM
)
0
2
4
6*
CTCF binding IAP-I B6+ insertion
n.s.
Strains with IAP-I TEVStrains without TEV
Figure 8 An example of a genomic region with a CTCF-binding TEV, in this case an IAP-I provirus. The presence of the IAP-I is associatedwith differential expression of Slc36a1 (P < 0.05, genome wide FDR 0.05) across the strains but not of Fat2. The IAP-I is present in the strains129P2/OlaHsd, 129S1/SvImJ, 129S5/SvEvBrd, A/J, AKR/J, BALB/cJ, C3H/HeJ, C57BL/6NJ, CBA/J, DBA/2J, LP/J, NOD/ShiLtJ, CAST/EiJ, PWK/PhJ andWSB/EiJ.
Nellåker et al. Genome Biology 2012, 13:R45http://genomebiology.com/2012/13/6/R45
Page 12 of 21
insertion pattern that is exclusively male (in contrast toequal densities if there are no gender mutation biases).This has previously been observed to be the case for activeAlu elements in humans [49]. We propose that the vastmajority of all TE insertions in the Mus lineage haveoccurred in the male germline genome. While the degreeof inter-chromosomal variation is decreased for apparentlyfixed ERV and SINE TEs in the genome, monomorphicLINE TEs are enriched on the X chromosome. We canconceive no alternative model other than strong positiveselection for this apparent higher rate of fixation in excessof the rate of mutation.
Purifying selection on intronic TEVsVariation in TEV densities in intergenic and genic regionscompared with expected values indicate ongoing selectiveprocesses acting on TEVs. The significant deficits of ERVor LINE TEVs in introns indicate that many were deleter-ious and thus were selectively purged over these strains’evolutionary history. These observations agree with pre-vious findings that LINE TE insertions are less well toler-ated within gene-rich sequence [38]. While LINE and ERVTEVs are strongly depleted in genes associated withhousekeeping functions, SINEs are enriched in such genes(Figure 4). De novo intronic insertion variants of LINEs orERVs but not SINEs are thus likely to often dysregulatesuch genes. Interestingly, it is exactly these classes ofgenes whose regulation depends on TE-derived sequence[50]. The enrichment of SINE TEVs, in contrast to thedepletions of ERV and LINE TEVs, is consistent with aprevious proposal that SINEs preferentially insert withingenes that are expressed in the germ line [51], and is inagreement with the increased density of SINE TEVs in thevicinity of genes [19]. While all TEV classes are depletedin the immediate proximity of genes and splice donor andacceptor sites, SINEs are enriched within 10 kb of genesand have shorter exclusion zones near to functionalsequence compared to ERV and LINE TEVs.If it is assumed that TEVs that are inserted in the anti-
sense orientation are not under selection, then orientationbias values imply that approximately 50% of all ERVs thatinserted in the sense orientation into the introns of proteincoding genes have been deleterious, as have been aboutone-third of LINE or SINE sense insertions. We mightexpect TEV orientation biases to be different betweengenes annotated with GO terms found either to beenriched or to be depleted in TEVs. However, no such dif-ferences were detected, which implies that antisense orien-tated TEVs may also commonly be deleterious (perhaps byaffecting the expression of antisense transcripts), and thatthe ratio of sense-to-antisense deleterious TEVs is rela-tively constant among genes from different functionalclasses.
The observed orientation biases do not appear to beattributable to non-selective mutational or repairmechanisms. This is because we observe differences inorientation bias values for SINE and ERV TEVs depend-ing on intron position in a gene, which in turn make lesslikely alternative models that explain orientation bias asbeing due solely to a mutational preference for TE pre-servation in the antisense strand, perhaps as a conse-quence of transcription-coupled repair [52].No substantial differences in orientation bias values
between fixed and variant ERVs were observed. Thisimplies that deleterious sense inserted ERV TEVs are notcommonly segregating among these mice; rather, theyhave most often been purged very rapidly from the mousepopulation. Orientation bias was significantly and substan-tially stronger for apparently fixed LINE TEs than forrecently inserted LINE TEVs, implying once more thatpurifying selection on sense inserted LINE TEVs tends tobe less strong than on ERVs.
Effect of TEVs on gene expression and quantitative traitsRegions annotated with refined QTLs [44] are significantlyenriched in LINE and SINE TEVs. This is evidence thatTEVs contribute, albeit rarely, to at least some of theapproximately hundred traits that were considered. Manyof these effects are likely to act either on exons flankingthe TEV site, or on downstream elements, as has beenobserved for many known de novo ERV insertions [6].Although a small number of TEVs (132) were annotatedas being in coding exons, due to breakpoint uncertaintysome of these will instead be intronic. None of our ERV,LINE or SINE TEV sets was significantly associated withglobal expression level change measured using an RNA-Seq experiment of whole brain samples. This suggests thatTEVs that survive purifying selection are only rarely asso-ciated with gene expression changes. Although de novo TEinsertions frequently cause disruptions in genes’ expres-sion, such deleterious variants appear to be often purgedby strong purifying selection and the genomic contributionof the remaining TEs to global gene expression variationthus appears minimal.Clearly a subset of TEVs will affect the expression of
their resident genes and their functions. Indeed, using astringent statistical re-sampling approach to take intoaccount confounding influences of strain and expressiondivergence, we found that TEVs are twice as likely toreside in a differentially expressed gene as expected bychance. Thus, among all genes that exhibit expression dif-ferences between strains, TEVs contribute more thanexpected by chance. Only 34 TEVs passed a stringent gen-ome-wide test, and these TEVs contain significantly fewerLINEs than the null expectation that all TEV classes haveequal effects. While it has been extensively documented in
Nellåker et al. Genome Biology 2012, 13:R45http://genomebiology.com/2012/13/6/R45
Page 13 of 21
the literature that de novo LINE insertions can causechanges in gene expression, it appears that, in Mus muscu-lus, purifying selection has preferentially purged suchvariants.However, given that the proportion of expression her-
itability attributable to TEVs generally is no more than10% [26], many of the significant expression changestabulated in Additional files 9 and 10 will not be duespecifically to the TEV but rather, for example, to co-segregating variants. Nevertheless, these data, togetherwith evidence that the insertion and selection on TEinsertions vary considerably according to class, tran-scriptional orientation, inter- or intragenic location, andgene functional category should now assist in distin-guishing the minority of TEVs with a profound negativeeffect on organismal fitness from the majority of TEVswith little to no effect on fitness. There are a host ofpossible phenotypic consequences of TEVs outside theones tested here, such as premature transcriptional ter-mination at a distance triggered by ERVs [18]. It is alsolikely that some TEVs have phenotypic effects that arerestricted to specific tissues and/or developmental timepoints. Although determining the full extent of sucheffects is beyond the remit of this paper, the extensivecatalogue of TEVs that we have presented provides avaluable resource that should greatly facilitate suchstudies.
ConclusionsWe present a near complete catalogue of TE variationacross 18 mouse strains, encompassing 2 My of diver-gence within the Mus lineage. We recaptured previouslyreported variation in the relative activities of differentmouse TE families and also report evidence that the vastmajority of TE activity has occurred in the paternal germline. Strong signals of purifying selection are evident withrespect to TE family, genomic location, orientation andfunctional category of encompassing genes. Most TEVsthat are not purged by rapid and strong negative selec-tion appear to have little, or no, effect on organismal fit-ness. Nevertheless, we found that a small fraction ofTEVs are associated with relatively large effects on geneexpression.
Materials and methodsSequencing dataRaw sequencing data were generated from 13 classicallaboratory (129P2/OlaHsd, 129S1/SvImJ, 129S5/SvEvBrd,A/J, AKR/J, BALB/cJ, C3H/HeJ, C57BL/6NJ, CBA/J,DBA/2J, LP/J, NOD/ShiLtJ and NZO/HiLtJ) and 4 wild-derived (CAST/EiJ, PWK/PhJ, WSB/EiJ and SPRET/EiJ)mouse inbred strains as part of the Mouse Genomes Pro-ject [25]. Briefly, 1,239 Gb of mapped sequence were gen-erated using the Illumina GAIIx platform [53] providing
an average of 27.6-fold sequence coverage across 17 gen-omes. Paired-end reads were a mixture of 37 bp, 54 bp,76 bp and 108 bp in length, with fragments being 150 to600 bp in length. Accession numbers for the raw sequen-cing data are given in Additional file 1.
ERV probesDifferences in nomenclature and classification groupingsbetween RepBase/Repeatmasker and colloquial descrip-tions used in the literature can be difficult to resolve. Inthis study, we classify TEs into DNA elements, SINEs,LINEs and ERVs. ERVs have been further classified intothe following families: IAP, ETn, MuLV, VL30, MaLR,RLTR10, IS2, RLTR45 and RLTR1B. A complete listingof RepBase [54] classifications and conventional ERVsuper-classes corresponding to these families is providedin Additional file 2.
B6+ calling algorithmsStructural variant (SV) deletions in all inbred strains weredetected using three methods: split-read mapping (Pindel[55]), mate-pair analysis (BreakDancer, release-0.0.1r61[56]), and read-depth (CND [57]). Following merger ofthese calls into a non-redundant set, computational vali-dation by local assembly and breakpoint refinement wasperformed. Details of the complete pipeline, SVMerge,are described elsewhere [28].SV calls were intersected with the RepeatMasker [58]
track of mm9 downloaded from UCSC on 20 July 2010[59,60]. SVs were then classified as B6+ TEV based onthe following criteria: they must contain TE sequence asannotated by RepeatMasker, must be a deletion withrespect to the C57BL6/J reference assembly and sequenceannotated as TE needed to be within 50 bp of the SVbreakpoints. TEVs were then further classified intosuperfamilies and TE structure types: LINE, fragment ofa LINE, SINE, DNA transposon, LTR bound element oras more ‘complex’. The LTR bound elements werefurther subdivided based on structure: solo-LTR (con-taining only a single LTR), LTR-int (the deleted sequenceif comparing a provirus element to a solo-LTR), provirus(an intact ERV with two LTRs and internal sequence),pseudoelement (ERV with partial LTR on either end and/or poly-A tail), hybrid provirus (multiple RepeatMaskersubfamily annotations within one repeat) or hybrid pseu-doelement. A flowchart of the classification criteria canbe found in Additional file 11.Of 145,429 SVs that are absent from the C57BL/6J
assembly, 11% did not appear to contain TE sequence,21.2% TE sequences did not coincide with the SV break-points and 33.4% were denoted as being complex, mean-ing that they contained either simple repeats or multipleevents of TE insertion. The categories DNA transposons(n = 283), LTR-int (n = 317), pseudoelement (n = 12),
Nellåker et al. Genome Biology 2012, 13:R45http://genomebiology.com/2012/13/6/R45
Page 14 of 21
hybrid pseudoelement (n = 36) and complex (n = 48,521)were subsequently disregarded in further analyses. Theremainder were classified into the TE repeat families cor-responding to the probes used in the B6- calls (Additionalfile 2). Although most TE families were classified basedon their RepeatMasker annotations, LINE elements wereclassified as LINE fragments (hereafter referred to asLINE_frag) if the length of the element was less than 5kb. The minimum cutoff was determined by the localminima between the frequency distribution curves ofsmall fragments and the predominance of LINEs oflengths near the 6.4 kb canonical sizes (data not shown).
B6- calling algorithmsTE insertions that were present in any strain but absentfrom the C57BL/6J mm9 reference sequence (denoted asB6- calls) were identified using RetroSeq [61]. RetroSeqseeks inconsistently mapped read pairs where one end ismapped confidently (referred to as anchor reads) but theother end is either not mapped to the reference or mappedto a distant location on the reference with low mappingquality. The non-mapping or distantly mapped mates arethen aligned to the ERV probes (Additional file 2). Retro-Seq requires the anchoring read to have a minimum map-ping quality of 30 and at least 10 independent read pairsto support a call. Alignments to Repbase were performedwith SSAHA2 [62] with a minimum of 80% identity andhit length of 36 bp. RetroSeq clusters the supporting readanchors to produce variant calls to approximately 1 to 2kb resolution. The initial seed call windows were subjectto further checking as follows. To identify the putativebreakpoints, we scanned the region for positions with cov-erage fewer than ten reads and positions with low cover-age mismatches (false alignments at the breakpoints canappear as false SNPs). For each putative breakpoint, wechecked the ratio of forward/reverse orientated anchorreads at either side of the breakpoint. For the breakpointto be accepted, we required at least 10 forward orientatedanchors within 450 bp upstream and 10 reverse orientatedanchors within 450 bp downstream. We also required thatthe ratio of forward-to-reverse anchors in the 450 bpupstream and 450 bp downstream to be less than 2-to-1.Furthermore, we required the distance from the final for-ward orientated upstream anchor to the first reverse orien-tated downstream anchor to be less than 120 bp. We thenremoved any calls that occurred within 50 bp of a regionannotated by Repeatmasker as a ‘simple_repeat’ or ‘low_-complexity’ or a SINE, LINE or ERV element in the mm9reference.Due to the differences in sequencing depth across the
strains, it was necessary to carry out a computationalgenotyping step in order to correct for false negatives inthe strains with lower sequencing coverage. For eachTEV call and each strain that the call was not made in,
we examined the reads 300 bp upstream and down-stream and counted the number of putative anchorreads. If there were at least five forward orientatedanchor reads upstream and five reverse orientatedanchor reads downstream, then we called the TEV asbeing present in the strain.
B6- orientationTo determine the sense or antisense orientation of theB6- elements, we carried out local de novo assemblywith Velvet [63] of the reads that mapped within 600 bpupstream and downstream (including their mates) of theputative breakpoint. We realigned the contigs to thereference with SSAHA2 [62] and detected contigs thatalign incompletely at the breakpoints. We aligned theunmatched part of the contig to the ERV probe set inorder to determine the orientation status of the element.
B6- size estimationIn order to obtain an accurate estimate of the sizes of theB6- TEVs, we generated a single long range Illumina‘jumping’ library with an estimated fragment size of 3 kband sequenced the 50 bp of the ends of the fragments ina single HiSeq2000 lane per strain for 13 strains (129P2,129S1/SvImJ, 129S5, A/J, BALB/cJ, C3H/HeJ, CAST/EiJ,CBA/J, DBA/2J, LP/J, NZO/SHiLtJ, PWK/PhJ, and WSB/EiJ). These data have been submitted to the EuropeanNucleotide Archive (ENA) under Sequence Read Archive(SRA) study ID ERP000255.Briefly, mate pair (3 kb) libraries were prepared from
10 μg mouse genomic DNA using a hybrid SOLiD/Illu-mina library protocol developed by L Shirley and MQuail at the Wellcome Trust Sanger Institute. Mousegenomic DNA was sheared to approx 3 kb fragmentsusing a Digilab Hydroshear and the 2 × 50 bp mate-paired library was constructed using the nick translationprotocol (SOLiD 3 Plus System Library PreparationGuide 2009) as described elsewhere [64]. Immediatelyfollowing the S1 nuclease/T7 exonuclease digest, thebiotinylated mate-pair fragments were purified andligated to appropriate adapters (Integrated DNA tech-nologies, Leuven, Belgium), enriched by PCR then size-selected exactly as described in the Illumina Mate-pairLibrary v2 Sample Preparation Guide.We mapped these reads to the reference genome
using SMALT [65] and estimated the physical coveragefrom these lanes to be between 30- and 40-fold perstrain. For each B6- TEV in the above strains, if therewere more than two read pairs spanning the insertionbreakpoint, then we estimated the size of the element tobe > 3 kb. This information was used to assign anapproximate size status to the LINE and ERV calls. Tovalidate this approach, we observed that almost all (>95%) SINE calls were spanned (data not shown).
Nellåker et al. Genome Biology 2012, 13:R45http://genomebiology.com/2012/13/6/R45
Page 15 of 21
B6+ validationAn estimate of 2.6% was made for the false positive ratein the B6+ calls from the percentage of TEVs fromfamilies considered to be inactive in the mouse lineage.For the B6+ calls, an estimation of the true false negativerate was performed against the high confidence manuallyvalidated sets for chromosome 19 in 8 of the strains andthe 250 selected PCR-validated SVs described in [26](Additional file 4). In these PCR sets no false positiveswere detected.In order to estimate false negative rates, we made a
conservative assumption that the three 129-derived sub-strains (129P2/OlaHsd, 129S1/SvImJ and 129S5/SvEvBrd) are monomorphic for any TEV. Therefore, wecounted the number of TEVs where there was a callmade in two out of the three 129-derived substrains andassumed the missing call to be a false negative. For B6+
calls, we obtained false negative estimates of 13.3%,14.4%, and 9.5% for SINE, LINE, and ERV classes, respec-tively (Additional file 4).
B6- validationTo measure the false positive rates of the B6- TEV calls,we performed 53, 34 and 47 random PCRs across SINE,LINE, and ERV superfamilies, respectively. Primers weredesigned using Primer3 [66] and purchased from MWG(Ebersberg, Germany). For each insertion call, severalindependent PCR reactions were carried out, includingtwo reactions with Hotstar Taq (Qiagen, Hilden, Ger-many), and a reaction with LongRange PCR Kit (Qiagen).Reactions were performed as previously described [67].PCR gel images were then taken to assess the performanceof the PCR reaction (Additional file 6). PCR products werepurified in a 96-well Millipore (Billerica, MA, USA) purifi-cation plate, resuspended in 30 μl of H2O and sequencedas previously described [67]. All sequencing reactions wererun out on an ABI3700 sequencer and assembled usingPHRED/PHRAP [68]. Consed was used for editing andvisualization of the assembly [69]. Strains with and withoutthe insertion were aligned in one single contig. Breakpointanalysis was mostly based on visual inspection of the align-ment after a BLAT search. Breakpoints were identified inalignments between sequences from strains with and with-out the insertion. PCR results are listed in Additional file5. From these data, we estimate false positive rates to be22%, 11%, and 0% for the three superfamilies (SINE, LINE,ERV), respectively. From the strain distribution patterns ofthe PCR, we estimated the false negative rates of the callsto be 7%, 12%, 5%, for SINE, LINE and ERV, respectively.We also estimated an upper bound on the false negativerate from the 129-derived substrains to be 28%, 32% and12%, respectively.We compared the datasets from previous publications
[18,21,23,24] to estimate the fraction recapitulated in the
current TEV call sets. We capture 84% of calls from [18],and 84% of calls from [21]; 23% of the SV calls in [23] areoverlapped by our TEV calls in DBA/2J; and, of the full-length intronic LINE1 elements in [24], we recapitulate76%. The overlaps may reflect differences in filtering cri-teria, and the non-zero false negative and false positiverates in these and our own studies.In a recent publication, Li et al. [18] compared the IAP
calls and validations to the SV calls presented in [26]. TheTEVs presented here have been updated since publicationand so we repeated this comparison. Of 12 B6+ TEVs thatwere considered, 3 are false negatives in our calls, which isin line with the null hypothesis that they are annotated asthe C57BL6/J variant. One B6- TEV appears to have beencalled in error in CAST/EiJ and SPRET/EiJ, which accordswith expectations based on a low, but non-zero, false posi-tive rate.
Expression comparison methodsFor 14 of the strains, RNA was extracted from thewhole brain of the sequenced mouse and a female sib-ling at 8 weeks of age using Trizol (Invitrogen, Carlsbad,CA, USA). RNA (RNA integrity number (RIN) > 8) wasthen used to generate transcriptome libraries, whichwere sequenced on the Illumina platform. Each lane oftranscriptome sequence was re-genotyped prior todownstream analysis. The raw sequencing data havebeen submitted to the SRA under accession numberERP000614 (links can be found at [70]).TopHat v1.1.1 [71] was deployed to map reads passing
Illumina’s chastity filter from each library to the mousegenome assembly (mm9), including splice sites annotatedin Ensembl and UCSC gene structures, known mRNAs,and expressed sequence tags [60], and to search for novelsplice sites with a minimum isoform fraction as 0.0.Insert size and standard deviation were estimated fromthe full width at half maximum of the internal insert dis-tance based on reads mapped uniquely with bwa [72].Cufflinks v0.9.2 [73] was then used to quantify expressionof all Ensembl transcripts across all libraries. Bias correc-tion [74] and quantile normalization were both enabled,and annotated mitochondrial transcripts and ribosomalRNAs were masked when determining the denominatorof the fragments per kilobase of exon per million frag-ments mapped (FPKM) quantification to provide maxi-mally robust expression values.We calculated normalized read counts for the constitu-
tively expressed nucleotides of each gene per strain inorder to produce one measure of expression level foreach gene across all its transcript models. Genes with noconstitutively expressed nucleotides or with no detectableexpression in any of the strains were discarded. Weselected 10,957 TEVs that were inserted in genes andthat are variable between at least 2 of the 14 strains for
Nellåker et al. Genome Biology 2012, 13:R45http://genomebiology.com/2012/13/6/R45
Page 16 of 21
which we had two biologically replicated RNA-Seq datasets. Read counts from strains with the TEV and strainswithout the TEV were randomly sampled and compiledinto tables representing four measures (two strains eachwith two replicates) of expression for each gene in strainswith the TEV and four for the strains without the TEV.For each gene sampled, a corresponding set was gener-ated from genes that are without TEVs in any strain. Theresulting tables were analyzed using the DESeq R packageto test for differential expression between RNAseq datasets. A Benjamini-Hochberg FDR of 10% was used as acutoff for each of 100 resampling tests. Differentiallyexpressed genes called in at least one-third of the testswere defined as being significantly differently expressed.A schematic representation of the method is provided inAdditional file 12.
CTCF-binding TEVs and variance in expressionWe intersected the B6+ calls with the CTCF binding peaksprovided in a recent publication [47]. Expression variancein strains with or without an intergenic TEV was esti-mated by taking the log natural of the ratio of expressionof the immediately upstream and downstream geneswhere expression data were available. Orientation (that is,which was considered upstream and downstream) wasrandomly permuted per gene set. The null hypothesis wasthat there is no difference in expression variance withrespect to the CTCF-binding TEV, and this was testedwith analysis of variance (ANOVA) and rejected (P <0.001). To test if this was a characteristic of TEVs in gen-eral, 10,000 random samples of expression ratios for TEVsnot annotated as CTCF-binding were generated and testedin the same manner. The P-value for the CTCF-bindingTEV ANOVA test was smaller than all 10,000 non-CTCF-binding TEV-associated gene expression variancesamples.
Availability of callsThe full set of TEV calls has been submitted to the Data-base of Genomic Variants archive DGVa at the EuropeanBioinformatics Institute (estd118) [75] and has also beenprovided in BED file format (Additional file 13).
Distribution of TEVs across a phylogeny representing aprimary subspecies history of 18 mouse strainsIgnoring incomplete lineage sorting, we calculated anapproximate phylogenetic tree of mouse strains thatwould allow us to infer the internal node whose ancestralspecies acquired a TEV insertion (Figure 1). Using Seq-boot, Mix and Consense from the Phylip package [76], weconsidered the TEVs to be discrete morphologies and per-formed 100 bootstraps. All nodes of the resulting consen-sus tree were established with 100% reliability. TEVs were
mapped parsimoniously to the last common ancestralnode of all strains carrying the TEV.
Structure and activities of ERV familiesFrom the RepeatMasker [58] track of mm9 the number ofbases belonging to each ERV family was calculated as thetotal amount of sequence annotated as one of the RepBaseidentifiers (Additional file 2). The proportion of ERVs thatare TEVs was estimated from the number of bases in theB6+ TEV calls (Figure 2b). From the B6+ structure classifi-cations of the ERV TEVs mapped to the primary phylo-geny (Figure 1a) within the C57BL6/J lineage (Figure 1c),percentages of proviral-LTRs were calculated (Figure 2c,d). The average autosomal densities (TEV/bp), and theindividual chromosome density ratios across all strainswere also calculated (chromosome density/autosome den-sity; Figure 3b) for the set of all TEVs. The time betweennodes AB and GH was taken to be 2 My [27], which,together with the proportion of ERVs found as solo-LTRs,also allowed an approximate half-life of provirus LTRrecombination rate to be calculated (l = Y × log(1/2)/log(Z), where Y is the years of divergence and Z is the frac-tion of proviruses observed).
Genome-wide nucleotide composition, gene structure andgene annotation biases for TEV occurrenceC57BL6/J genomic TEs were identified from the Repeat-Masker [58] track of mm9 by excluding consecutive anno-tations of TEs in the same subfamily and by concatenatingLTR bound sequences of a proviral structure. The localGC content was calculated from the 20 kb of sequencesurrounding the TE (Figure 3a).To calculate TEV density in different exons, introns,
5 kb flanks of genes and intergenic regions we used theGenomic Association Tester (GAT) [77]. GAT calculatesan expected count through randomized simulations of theinput data taking into account the observed segmentlength distribution. Simulations are performed per chro-mosome and isochore and so provide unbiased measuresof the null expectation. Multiple testing corrections wereapplied with the Benjamini-Hochberg method [78]. GATwas also used within the various genomic spaces to testfor significant association of TEVs to GOslim terms [79](Figure 4b) and Mouse Genome Informatics overarchingphenotype annotations [80-82] (Figure 4c).
Densities of TEVs with respect to chromosomeTo test the chromosomal densities of TEVs and fixed TEs,we applied a cross-genome GAT test (as opposed to thedefault by chromosome tests). The null hypothesis wasthat fixed TEs and TEVs are equally distributed across thegenome when taking into account G+C biases. The nullwas rejected if the P-value passed an FDR of 0.1% within
Nellåker et al. Genome Biology 2012, 13:R45http://genomebiology.com/2012/13/6/R45
Page 17 of 21
each TEV class and distribution test [78]. To account forreplication timing we used data downloaded from [37,83]and classified genomic sequence as being either early orlate replicating as previously applied to neutral substitu-tion rates [84]. To take into account genic region biases,the genome was divided into genic versus intergenic spaceaccording to the release Mus musculus 63 from Ensembl[85]. Since taking replication timing nor genic regions intoaccount for the GAT tests did not influence the chromo-somal biases, these were not included in the final analysis.We applied the McDonald-Kreitman test [41] to chro-
mosomal densities of TEVs and fixed TEs. Chromo-somes with a higher proportion of fixed TEs comparedto TEVs were significantly dissimilar as determined by aG-test based on the number of TEVs compared to thedensity expected from fixed TEs (FDR 0.1%) [86,87].
Densities and orientations of TEVs with respect to thetranscriptional (sense) direction of mouse genesOrientation bias was calculated as the percentage ofintronic TEVs present in the sense orientation. Dividingintrons into those that are first, intervening or lastwithin genes showed skewed distributions of TEV orien-tations. In Figure 5a we performed chi-square tests thatshowed significant differences for the occurrences ofSINE and ERV TEVs depending on intronic space.From the RepeatMasker [58] track of mm9 the
sequence divergence from the prototypical sequence ofeach B6+ TEV was taken as a measure of age of theinsertion. The percent divergence was divided into binsand the trend plotted (Figure 5b).
Densities of TEVs in the proximity of gene and exonboundariesTEV densities were calculated upstream and down-stream (Figure 6a), and in introns near exon boundaries(Figure 6b); only mouse genes with orthologs in humanswere considered, since this effectively discriminatesagainst inaccurate gene models and noncoding RNAloci. Sense and antisense orientations, relative to thedirection of gene transcription, were considered sepa-rately and TEVs with unresolved orientation were disre-garded in this analysis. To treat B6+ and B6- TEVsequivalently with respect to placing them on the refer-ence genome (in which B6+ TEVs have an identifiablelength whereas B6- TEVs do not), the 5’ base of eachTEV was taken to be the TEV’s location on the refer-ence genome, regardless of orientations for TEV orgene. This procedure assumes that TEV properties areidentical on the forward and reverse strands ofassembled chromosomes in the reference genome. Foreach genomic space, upstream, downstream or intronicsequence, the maximum distance (the half-way point tothe next gene or exon) was recorded. Distance from the
exon or gene was divided into bins and each scaledusing the maximum number of bases in each span pre-sent in the genome. Using these scaled bin sizes, we cal-culated the density of TEVs (Number of TEVs withinthe relevant distances/Average number of bases overthose distances). The bin sizes used in Figure 6a, b weretaken from the Fibonacci series to allow improved visua-lization of the data relative to linear or logarithmicscaling.
Additional material
Additional file 1: Supplementary Table 1. Identifiers for micesequenced in this study.
Additional file 2: Supplementary Table 2. RepBase sequences used asprobes for identification of TEVs.
Additional file 3: Supplementary Figure 1. Proportions of TEVs alongdifferent lineages of the phylogeny shown in Figure 1. (a, b) Proportionsof TEV classes in the TE superfamilies and ERV subfamilies, respectively,on the 129S1/SVImJ and 129P2/OlaHsd lineages. (c, d) Proportions of TEVclasses in the TE superfamilies and ERV subfamilies, respectively, on theA/J and BALB/cJ lineages. (e, f) Proportions of TEV classes in the TEsuperfamilies and ERV subfamilies, respectively, on the NOD/ShiLtJ andAKR/J lineages. Total numbers of predicted TEVs occurring betweenneighboring branch nodes are indicated below the x-axis. (g, h)Proportions of TEV classes in the TE superfamilies and ERV subfamilies,respectively, that are private to each strain. Numbers of TEVs called asbeing private to strains are indicated above the plots.
Additional file 4: Supplementary Table 3. Summary of validationresults. Percentages in parentheses denote the false negative rateestimated from concordance between 129P2/OlaHsd, 129S1/SvImJ and129S5/SvEvBrd strains.
Additional file 5: Supplementary Table 4. B6- PCR true positivevalidation results.
Additional file 6: Supplementary Figure 2. We show a representativePCR gel image for one ERV (located on chromosome 9: 98,366,615-98,366,616), one LINE (chr10:23,570,601-23,570,602), and one SINE(chr1:162,157,648-162,157,649). PCR was carried out across eight strains:A/J, AKR/J, BALB/cJ, C3H/HeJ, C57BL/6J, CBA/J, DBA/2J and LP/J. We usedHyperladder II as size marker.
Additional file 7: Supplementary Figure 3. Gene annotation biases forTEV occurrence. Gene annotations that are significantly enriched (greenshades) or depleted (red shades) in exons, or intronic, 5 kb flanking orintergenic regions for TEV insertions, having accounted for GC content,chromosome and lengths, and after correcting for multiple testing. (a, b)Gene annotations are from either the Gene Ontology (slim set) (a) or theMouse Genome Informatics phenotypes associated with gene disruptions(b). SINE TEVs show a pattern of enrichments and depletions that is thecomplement of patterns observed for LINE and ERV TEVs.
Additional file 8: Supplementary Table 5. Intronic TEVs associatedwith differential gene expression across strains. The TEVs found to beassociated with differential expression against the background of all TEVswith associated expression data and equal sampling of genes with noTEV insertions.
Additional file 9: Supplementary Table 6. Intronic TEVs withassociated genes’ brain RNA-Seq expression values. The expressiondifferences between the associated Ensembl genes with and withoutTEVs are significantly different as determined by ANOVA of logexpression values with an FDR < 0.05.
Additional file 10: Supplementary Table 7. Intergenic TEVs withassociated upstream and downstream genes’ brain RNA-Seq expressionvalues. The expression differences between the associated Ensemblgenes with and without TEVs are significantly different as determined byANOVA of log expression values with an FDR < 0.05.
Nellåker et al. Genome Biology 2012, 13:R45http://genomebiology.com/2012/13/6/R45
Page 18 of 21
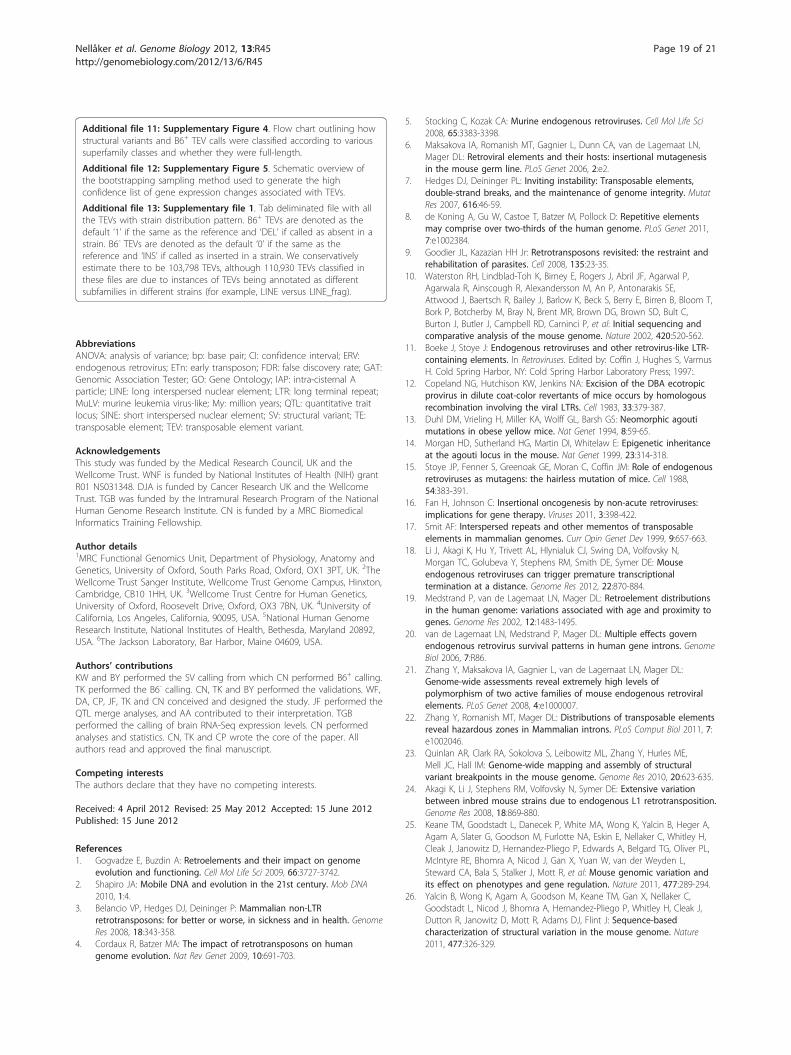
Additional file 11: Supplementary Figure 4. Flow chart outlining howstructural variants and B6+ TEV calls were classified according to varioussuperfamily classes and whether they were full-length.
Additional file 12: Supplementary Figure 5. Schematic overview ofthe bootstrapping sampling method used to generate the highconfidence list of gene expression changes associated with TEVs.
Additional file 13: Supplementary file 1. Tab deliminated file with allthe TEVs with strain distribution pattern. B6+ TEVs are denoted as thedefault ‘1’ if the same as the reference and ‘DEL’ if called as absent in astrain. B6- TEVs are denoted as the default ‘0’ if the same as thereference and ‘INS’ if called as inserted in a strain. We conservativelyestimate there to be 103,798 TEVs, although 110,930 TEVs classified inthese files are due to instances of TEVs being annotated as differentsubfamilies in different strains (for example, LINE versus LINE_frag).
AbbreviationsANOVA: analysis of variance; bp: base pair; CI: confidence interval; ERV:endogenous retrovirus; ETn: early transposon; FDR: false discovery rate; GAT:Genomic Association Tester; GO: Gene Ontology; IAP: intra-cisternal Aparticle; LINE: long interspersed nuclear element; LTR: long terminal repeat;MuLV: murine leukemia virus-like; My: million years; QTL: quantitative traitlocus; SINE: short interspersed nuclear element; SV: structural variant; TE:transposable element; TEV: transposable element variant.
AcknowledgementsThis study was funded by the Medical Research Council, UK and theWellcome Trust. WNF is funded by National Institutes of Health (NIH) grantR01 NS031348. DJA is funded by Cancer Research UK and the WellcomeTrust. TGB was funded by the Intramural Research Program of the NationalHuman Genome Research Institute. CN is funded by a MRC BiomedicalInformatics Training Fellowship.
Author details1MRC Functional Genomics Unit, Department of Physiology, Anatomy andGenetics, University of Oxford, South Parks Road, Oxford, OX1 3PT, UK. 2TheWellcome Trust Sanger Institute, Wellcome Trust Genome Campus, Hinxton,Cambridge, CB10 1HH, UK. 3Wellcome Trust Centre for Human Genetics,University of Oxford, Roosevelt Drive, Oxford, OX3 7BN, UK. 4University ofCalifornia, Los Angeles, California, 90095, USA. 5National Human GenomeResearch Institute, National Institutes of Health, Bethesda, Maryland 20892,USA. 6The Jackson Laboratory, Bar Harbor, Maine 04609, USA.
Authors’ contributionsKW and BY performed the SV calling from which CN performed B6+ calling.TK performed the B6- calling. CN, TK and BY performed the validations. WF,DA, CP, JF, TK and CN conceived and designed the study. JF performed theQTL merge analyses, and AA contributed to their interpretation. TGBperformed the calling of brain RNA-Seq expression levels. CN performedanalyses and statistics. CN, TK and CP wrote the core of the paper. Allauthors read and approved the final manuscript.
Competing interestsThe authors declare that they have no competing interests.
Received: 4 April 2012 Revised: 25 May 2012 Accepted: 15 June 2012Published: 15 June 2012
References1. Gogvadze E, Buzdin A: Retroelements and their impact on genome
evolution and functioning. Cell Mol Life Sci 2009, 66:3727-3742.2. Shapiro JA: Mobile DNA and evolution in the 21st century. Mob DNA
2010, 1:4.3. Belancio VP, Hedges DJ, Deininger P: Mammalian non-LTR
retrotransposons: for better or worse, in sickness and in health. GenomeRes 2008, 18:343-358.
4. Cordaux R, Batzer MA: The impact of retrotransposons on humangenome evolution. Nat Rev Genet 2009, 10:691-703.
5. Stocking C, Kozak CA: Murine endogenous retroviruses. Cell Mol Life Sci2008, 65:3383-3398.
6. Maksakova IA, Romanish MT, Gagnier L, Dunn CA, van de Lagemaat LN,Mager DL: Retroviral elements and their hosts: insertional mutagenesisin the mouse germ line. PLoS Genet 2006, 2:e2.
7. Hedges DJ, Deininger PL: Inviting instability: Transposable elements,double-strand breaks, and the maintenance of genome integrity. MutatRes 2007, 616:46-59.
8. de Koning A, Gu W, Castoe T, Batzer M, Pollock D: Repetitive elementsmay comprise over two-thirds of the human genome. PLoS Genet 2011,7:e1002384.
9. Goodier JL, Kazazian HH Jr: Retrotransposons revisited: the restraint andrehabilitation of parasites. Cell 2008, 135:23-35.
10. Waterston RH, Lindblad-Toh K, Birney E, Rogers J, Abril JF, Agarwal P,Agarwala R, Ainscough R, Alexandersson M, An P, Antonarakis SE,Attwood J, Baertsch R, Bailey J, Barlow K, Beck S, Berry E, Birren B, Bloom T,Bork P, Botcherby M, Bray N, Brent MR, Brown DG, Brown SD, Bult C,Burton J, Butler J, Campbell RD, Carninci P, et al: Initial sequencing andcomparative analysis of the mouse genome. Nature 2002, 420:520-562.
11. Boeke J, Stoye J: Endogenous retroviruses and other retrovirus-like LTR-containing elements. In Retroviruses. Edited by: Coffin J, Hughes S, VarmusH. Cold Spring Harbor, NY: Cold Spring Harbor Laboratory Press; 1997:.
12. Copeland NG, Hutchison KW, Jenkins NA: Excision of the DBA ecotropicprovirus in dilute coat-color revertants of mice occurs by homologousrecombination involving the viral LTRs. Cell 1983, 33:379-387.
13. Duhl DM, Vrieling H, Miller KA, Wolff GL, Barsh GS: Neomorphic agoutimutations in obese yellow mice. Nat Genet 1994, 8:59-65.
14. Morgan HD, Sutherland HG, Martin DI, Whitelaw E: Epigenetic inheritanceat the agouti locus in the mouse. Nat Genet 1999, 23:314-318.
15. Stoye JP, Fenner S, Greenoak GE, Moran C, Coffin JM: Role of endogenousretroviruses as mutagens: the hairless mutation of mice. Cell 1988,54:383-391.
16. Fan H, Johnson C: Insertional oncogenesis by non-acute retroviruses:implications for gene therapy. Viruses 2011, 3:398-422.
17. Smit AF: Interspersed repeats and other mementos of transposableelements in mammalian genomes. Curr Opin Genet Dev 1999, 9:657-663.
18. Li J, Akagi K, Hu Y, Trivett AL, Hlynialuk CJ, Swing DA, Volfovsky N,Morgan TC, Golubeva Y, Stephens RM, Smith DE, Symer DE: Mouseendogenous retroviruses can trigger premature transcriptionaltermination at a distance. Genome Res 2012, 22:870-884.
19. Medstrand P, van de Lagemaat LN, Mager DL: Retroelement distributionsin the human genome: variations associated with age and proximity togenes. Genome Res 2002, 12:1483-1495.
20. van de Lagemaat LN, Medstrand P, Mager DL: Multiple effects governendogenous retrovirus survival patterns in human gene introns. GenomeBiol 2006, 7:R86.
21. Zhang Y, Maksakova IA, Gagnier L, van de Lagemaat LN, Mager DL:Genome-wide assessments reveal extremely high levels ofpolymorphism of two active families of mouse endogenous retroviralelements. PLoS Genet 2008, 4:e1000007.
22. Zhang Y, Romanish MT, Mager DL: Distributions of transposable elementsreveal hazardous zones in Mammalian introns. PLoS Comput Biol 2011, 7:e1002046.
23. Quinlan AR, Clark RA, Sokolova S, Leibowitz ML, Zhang Y, Hurles ME,Mell JC, Hall IM: Genome-wide mapping and assembly of structuralvariant breakpoints in the mouse genome. Genome Res 2010, 20:623-635.
24. Akagi K, Li J, Stephens RM, Volfovsky N, Symer DE: Extensive variationbetween inbred mouse strains due to endogenous L1 retrotransposition.Genome Res 2008, 18:869-880.
25. Keane TM, Goodstadt L, Danecek P, White MA, Wong K, Yalcin B, Heger A,Agam A, Slater G, Goodson M, Furlotte NA, Eskin E, Nellaker C, Whitley H,Cleak J, Janowitz D, Hernandez-Pliego P, Edwards A, Belgard TG, Oliver PL,McIntyre RE, Bhomra A, Nicod J, Gan X, Yuan W, van der Weyden L,Steward CA, Bala S, Stalker J, Mott R, et al: Mouse genomic variation andits effect on phenotypes and gene regulation. Nature 2011, 477:289-294.
26. Yalcin B, Wong K, Agam A, Goodson M, Keane TM, Gan X, Nellaker C,Goodstadt L, Nicod J, Bhomra A, Hernandez-Pliego P, Whitley H, Cleak J,Dutton R, Janowitz D, Mott R, Adams DJ, Flint J: Sequence-basedcharacterization of structural variation in the mouse genome. Nature2011, 477:326-329.
Nellåker et al. Genome Biology 2012, 13:R45http://genomebiology.com/2012/13/6/R45
Page 19 of 21
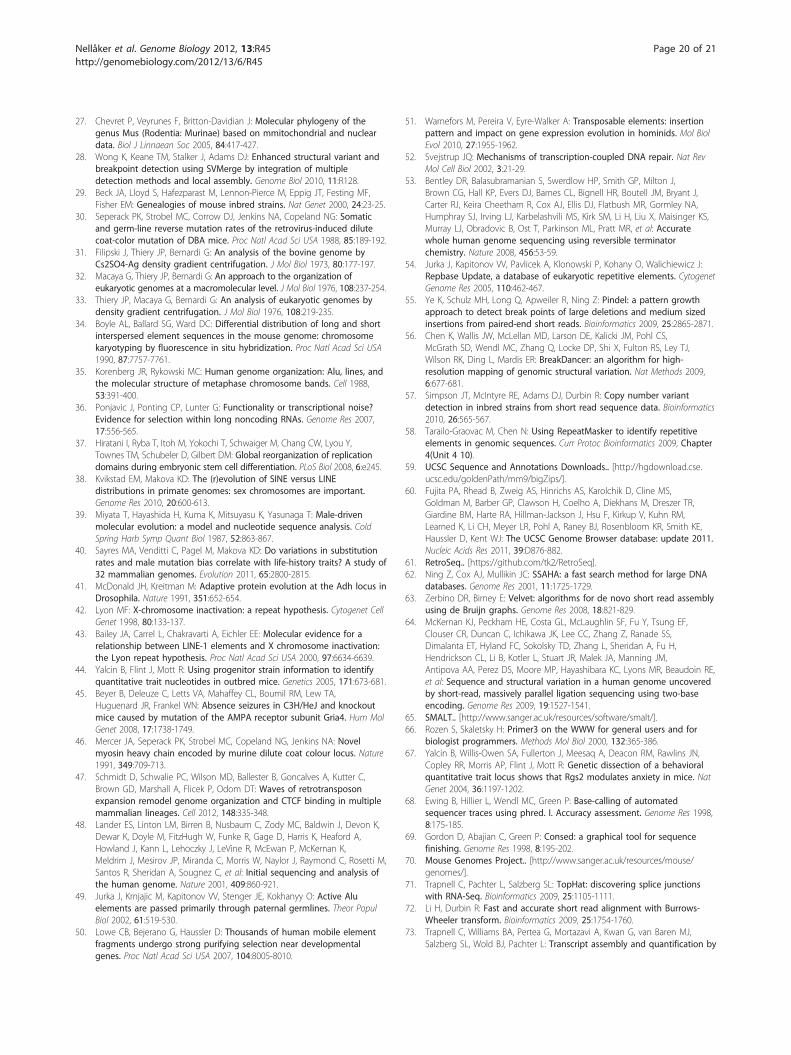
27. Chevret P, Veyrunes F, Britton-Davidian J: Molecular phylogeny of thegenus Mus (Rodentia: Murinae) based on mmitochondrial and nucleardata. Biol J Linnaean Soc 2005, 84:417-427.
28. Wong K, Keane TM, Stalker J, Adams DJ: Enhanced structural variant andbreakpoint detection using SVMerge by integration of multipledetection methods and local assembly. Genome Biol 2010, 11:R128.
29. Beck JA, Lloyd S, Hafezparast M, Lennon-Pierce M, Eppig JT, Festing MF,Fisher EM: Genealogies of mouse inbred strains. Nat Genet 2000, 24:23-25.
30. Seperack PK, Strobel MC, Corrow DJ, Jenkins NA, Copeland NG: Somaticand germ-line reverse mutation rates of the retrovirus-induced dilutecoat-color mutation of DBA mice. Proc Natl Acad Sci USA 1988, 85:189-192.
31. Filipski J, Thiery JP, Bernardi G: An analysis of the bovine genome byCs2SO4-Ag density gradient centrifugation. J Mol Biol 1973, 80:177-197.
32. Macaya G, Thiery JP, Bernardi G: An approach to the organization ofeukaryotic genomes at a macromolecular level. J Mol Biol 1976, 108:237-254.
33. Thiery JP, Macaya G, Bernardi G: An analysis of eukaryotic genomes bydensity gradient centrifugation. J Mol Biol 1976, 108:219-235.
34. Boyle AL, Ballard SG, Ward DC: Differential distribution of long and shortinterspersed element sequences in the mouse genome: chromosomekaryotyping by fluorescence in situ hybridization. Proc Natl Acad Sci USA1990, 87:7757-7761.
35. Korenberg JR, Rykowski MC: Human genome organization: Alu, lines, andthe molecular structure of metaphase chromosome bands. Cell 1988,53:391-400.
36. Ponjavic J, Ponting CP, Lunter G: Functionality or transcriptional noise?Evidence for selection within long noncoding RNAs. Genome Res 2007,17:556-565.
37. Hiratani I, Ryba T, Itoh M, Yokochi T, Schwaiger M, Chang CW, Lyou Y,Townes TM, Schubeler D, Gilbert DM: Global reorganization of replicationdomains during embryonic stem cell differentiation. PLoS Biol 2008, 6:e245.
38. Kvikstad EM, Makova KD: The (r)evolution of SINE versus LINEdistributions in primate genomes: sex chromosomes are important.Genome Res 2010, 20:600-613.
39. Miyata T, Hayashida H, Kuma K, Mitsuyasu K, Yasunaga T: Male-drivenmolecular evolution: a model and nucleotide sequence analysis. ColdSpring Harb Symp Quant Biol 1987, 52:863-867.
40. Sayres MA, Venditti C, Pagel M, Makova KD: Do variations in substitutionrates and male mutation bias correlate with life-history traits? A study of32 mammalian genomes. Evolution 2011, 65:2800-2815.
41. McDonald JH, Kreitman M: Adaptive protein evolution at the Adh locus inDrosophila. Nature 1991, 351:652-654.
42. Lyon MF: X-chromosome inactivation: a repeat hypothesis. Cytogenet CellGenet 1998, 80:133-137.
43. Bailey JA, Carrel L, Chakravarti A, Eichler EE: Molecular evidence for arelationship between LINE-1 elements and X chromosome inactivation:the Lyon repeat hypothesis. Proc Natl Acad Sci USA 2000, 97:6634-6639.
44. Yalcin B, Flint J, Mott R: Using progenitor strain information to identifyquantitative trait nucleotides in outbred mice. Genetics 2005, 171:673-681.
45. Beyer B, Deleuze C, Letts VA, Mahaffey CL, Boumil RM, Lew TA,Huguenard JR, Frankel WN: Absence seizures in C3H/HeJ and knockoutmice caused by mutation of the AMPA receptor subunit Gria4. Hum MolGenet 2008, 17:1738-1749.
46. Mercer JA, Seperack PK, Strobel MC, Copeland NG, Jenkins NA: Novelmyosin heavy chain encoded by murine dilute coat colour locus. Nature1991, 349:709-713.
47. Schmidt D, Schwalie PC, Wilson MD, Ballester B, Goncalves A, Kutter C,Brown GD, Marshall A, Flicek P, Odom DT: Waves of retrotransposonexpansion remodel genome organization and CTCF binding in multiplemammalian lineages. Cell 2012, 148:335-348.
48. Lander ES, Linton LM, Birren B, Nusbaum C, Zody MC, Baldwin J, Devon K,Dewar K, Doyle M, FitzHugh W, Funke R, Gage D, Harris K, Heaford A,Howland J, Kann L, Lehoczky J, LeVine R, McEwan P, McKernan K,Meldrim J, Mesirov JP, Miranda C, Morris W, Naylor J, Raymond C, Rosetti M,Santos R, Sheridan A, Sougnez C, et al: Initial sequencing and analysis ofthe human genome. Nature 2001, 409:860-921.
49. Jurka J, Krnjajic M, Kapitonov VV, Stenger JE, Kokhanyy O: Active Aluelements are passed primarily through paternal germlines. Theor PopulBiol 2002, 61:519-530.
50. Lowe CB, Bejerano G, Haussler D: Thousands of human mobile elementfragments undergo strong purifying selection near developmentalgenes. Proc Natl Acad Sci USA 2007, 104:8005-8010.
51. Warnefors M, Pereira V, Eyre-Walker A: Transposable elements: insertionpattern and impact on gene expression evolution in hominids. Mol BiolEvol 2010, 27:1955-1962.
52. Svejstrup JQ: Mechanisms of transcription-coupled DNA repair. Nat RevMol Cell Biol 2002, 3:21-29.
53. Bentley DR, Balasubramanian S, Swerdlow HP, Smith GP, Milton J,Brown CG, Hall KP, Evers DJ, Barnes CL, Bignell HR, Boutell JM, Bryant J,Carter RJ, Keira Cheetham R, Cox AJ, Ellis DJ, Flatbush MR, Gormley NA,Humphray SJ, Irving LJ, Karbelashvili MS, Kirk SM, Li H, Liu X, Maisinger KS,Murray LJ, Obradovic B, Ost T, Parkinson ML, Pratt MR, et al: Accuratewhole human genome sequencing using reversible terminatorchemistry. Nature 2008, 456:53-59.
54. Jurka J, Kapitonov VV, Pavlicek A, Klonowski P, Kohany O, Walichiewicz J:Repbase Update, a database of eukaryotic repetitive elements. CytogenetGenome Res 2005, 110:462-467.
55. Ye K, Schulz MH, Long Q, Apweiler R, Ning Z: Pindel: a pattern growthapproach to detect break points of large deletions and medium sizedinsertions from paired-end short reads. Bioinformatics 2009, 25:2865-2871.
56. Chen K, Wallis JW, McLellan MD, Larson DE, Kalicki JM, Pohl CS,McGrath SD, Wendl MC, Zhang Q, Locke DP, Shi X, Fulton RS, Ley TJ,Wilson RK, Ding L, Mardis ER: BreakDancer: an algorithm for high-resolution mapping of genomic structural variation. Nat Methods 2009,6:677-681.
57. Simpson JT, McIntyre RE, Adams DJ, Durbin R: Copy number variantdetection in inbred strains from short read sequence data. Bioinformatics2010, 26:565-567.
58. Tarailo-Graovac M, Chen N: Using RepeatMasker to identify repetitiveelements in genomic sequences. Curr Protoc Bioinformatics 2009, Chapter4(Unit 4 10).
59. UCSC Sequence and Annotations Downloads.. [http://hgdownload.cse.ucsc.edu/goldenPath/mm9/bigZips/].
60. Fujita PA, Rhead B, Zweig AS, Hinrichs AS, Karolchik D, Cline MS,Goldman M, Barber GP, Clawson H, Coelho A, Diekhans M, Dreszer TR,Giardine BM, Harte RA, Hillman-Jackson J, Hsu F, Kirkup V, Kuhn RM,Learned K, Li CH, Meyer LR, Pohl A, Raney BJ, Rosenbloom KR, Smith KE,Haussler D, Kent WJ: The UCSC Genome Browser database: update 2011.Nucleic Acids Res 2011, 39:D876-882.
61. RetroSeq.. [https://github.com/tk2/RetroSeq].62. Ning Z, Cox AJ, Mullikin JC: SSAHA: a fast search method for large DNA
databases. Genome Res 2001, 11:1725-1729.63. Zerbino DR, Birney E: Velvet: algorithms for de novo short read assembly
using de Bruijn graphs. Genome Res 2008, 18:821-829.64. McKernan KJ, Peckham HE, Costa GL, McLaughlin SF, Fu Y, Tsung EF,
Clouser CR, Duncan C, Ichikawa JK, Lee CC, Zhang Z, Ranade SS,Dimalanta ET, Hyland FC, Sokolsky TD, Zhang L, Sheridan A, Fu H,Hendrickson CL, Li B, Kotler L, Stuart JR, Malek JA, Manning JM,Antipova AA, Perez DS, Moore MP, Hayashibara KC, Lyons MR, Beaudoin RE,et al: Sequence and structural variation in a human genome uncoveredby short-read, massively parallel ligation sequencing using two-baseencoding. Genome Res 2009, 19:1527-1541.
65. SMALT.. [http://www.sanger.ac.uk/resources/software/smalt/].66. Rozen S, Skaletsky H: Primer3 on the WWW for general users and for
biologist programmers. Methods Mol Biol 2000, 132:365-386.67. Yalcin B, Willis-Owen SA, Fullerton J, Meesaq A, Deacon RM, Rawlins JN,
Copley RR, Morris AP, Flint J, Mott R: Genetic dissection of a behavioralquantitative trait locus shows that Rgs2 modulates anxiety in mice. NatGenet 2004, 36:1197-1202.
68. Ewing B, Hillier L, Wendl MC, Green P: Base-calling of automatedsequencer traces using phred. I. Accuracy assessment. Genome Res 1998,8:175-185.
69. Gordon D, Abajian C, Green P: Consed: a graphical tool for sequencefinishing. Genome Res 1998, 8:195-202.
70. Mouse Genomes Project.. [http://www.sanger.ac.uk/resources/mouse/genomes/].
71. Trapnell C, Pachter L, Salzberg SL: TopHat: discovering splice junctionswith RNA-Seq. Bioinformatics 2009, 25:1105-1111.
72. Li H, Durbin R: Fast and accurate short read alignment with Burrows-Wheeler transform. Bioinformatics 2009, 25:1754-1760.
73. Trapnell C, Williams BA, Pertea G, Mortazavi A, Kwan G, van Baren MJ,Salzberg SL, Wold BJ, Pachter L: Transcript assembly and quantification by
Nellåker et al. Genome Biology 2012, 13:R45http://genomebiology.com/2012/13/6/R45
Page 20 of 21
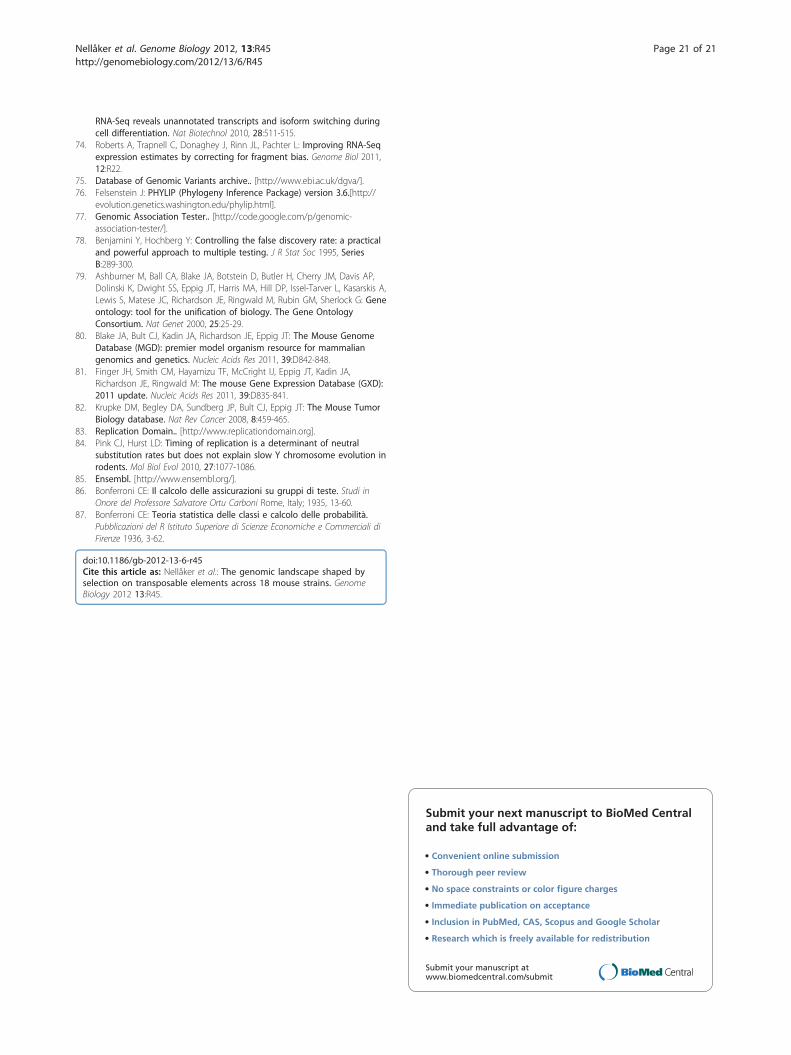
RNA-Seq reveals unannotated transcripts and isoform switching duringcell differentiation. Nat Biotechnol 2010, 28:511-515.
74. Roberts A, Trapnell C, Donaghey J, Rinn JL, Pachter L: Improving RNA-Seqexpression estimates by correcting for fragment bias. Genome Biol 2011,12:R22.
75. Database of Genomic Variants archive.. [http://www.ebi.ac.uk/dgva/].76. Felsenstein J: PHYLIP (Phylogeny Inference Package) version 3.6.[http://
evolution.genetics.washington.edu/phylip.html].77. Genomic Association Tester.. [http://code.google.com/p/genomic-
association-tester/].78. Benjamini Y, Hochberg Y: Controlling the false discovery rate: a practical
and powerful approach to multiple testing. J R Stat Soc 1995, SeriesB:289-300.
79. Ashburner M, Ball CA, Blake JA, Botstein D, Butler H, Cherry JM, Davis AP,Dolinski K, Dwight SS, Eppig JT, Harris MA, Hill DP, Issel-Tarver L, Kasarskis A,Lewis S, Matese JC, Richardson JE, Ringwald M, Rubin GM, Sherlock G: Geneontology: tool for the unification of biology. The Gene OntologyConsortium. Nat Genet 2000, 25:25-29.
80. Blake JA, Bult CJ, Kadin JA, Richardson JE, Eppig JT: The Mouse GenomeDatabase (MGD): premier model organism resource for mammaliangenomics and genetics. Nucleic Acids Res 2011, 39:D842-848.
81. Finger JH, Smith CM, Hayamizu TF, McCright IJ, Eppig JT, Kadin JA,Richardson JE, Ringwald M: The mouse Gene Expression Database (GXD):2011 update. Nucleic Acids Res 2011, 39:D835-841.
82. Krupke DM, Begley DA, Sundberg JP, Bult CJ, Eppig JT: The Mouse TumorBiology database. Nat Rev Cancer 2008, 8:459-465.
83. Replication Domain.. [http://www.replicationdomain.org].84. Pink CJ, Hurst LD: Timing of replication is a determinant of neutral
substitution rates but does not explain slow Y chromosome evolution inrodents. Mol Biol Evol 2010, 27:1077-1086.
85. Ensembl. [http://www.ensembl.org/].86. Bonferroni CE: Il calcolo delle assicurazioni su gruppi di teste. Studi in
Onore del Professore Salvatore Ortu Carboni Rome, Italy; 1935, 13-60.87. Bonferroni CE: Teoria statistica delle classi e calcolo delle probabilità.
Pubblicazioni del R Istituto Superiore di Scienze Economiche e Commerciali diFirenze 1936, 3-62.
doi:10.1186/gb-2012-13-6-r45Cite this article as: Nellåker et al.: The genomic landscape shaped byselection on transposable elements across 18 mouse strains. GenomeBiology 2012 13:R45.
Submit your next manuscript to BioMed Centraland take full advantage of:
• Convenient online submission
• Thorough peer review
• No space constraints or color figure charges
• Immediate publication on acceptance
• Inclusion in PubMed, CAS, Scopus and Google Scholar
• Research which is freely available for redistribution
Submit your manuscript at www.biomedcentral.com/submit
Nellåker et al. Genome Biology 2012, 13:R45http://genomebiology.com/2012/13/6/R45
Page 21 of 21