Embed Size (px)
Citation preview

RESEARCH Open Access
The enteric bacterial metabolite propionic acidalters brain and plasma phospholipid molecularspecies: further development of a rodent modelof autism spectrum disordersRaymond H Thomas1*, Melissa M Meeking1, Jennifer R Mepham1, Lisa Tichenoff1, Fred Possmayer2, Suya Liu3
and Derrick F MacFabe1
Abstract
Gastrointestinal symptoms and altered blood phospholipid profiles have been reported in patients with autismspectrum disorders (ASD). Most of the phospholipid analyses have been conducted on the fatty acid compositionof isolated phospholipid classes following hydrolysis. A paucity of information exists on how the intactphospholipid molecular species are altered in ASD. We applied ESI/MS to determine how brain and blood intactphospholipid species were altered during the induction of ASD-like behaviors in rats following intraventricularinfusions with the enteric bacterial metabolite propionic acid. Animals were infused daily for 8 days, locomotoractivity assessed, and animals killed during the induced behaviors. Propionic acid infusions increased locomotoractivity. Lipid analysis revealed treatment altered 21 brain and 30 blood phospholipid molecular species. Notablealterations were observed in the composition of brain SM, diacyl mono and polyunsaturated PC, PI, PS, PE, andplasmalogen PC and PE molecular species. These alterations suggest that the propionic acid rat model is a usefultool to study aberrations in lipid metabolism known to affect membrane fluidity, peroxisomal function, gap junctioncoupling capacity, signaling, and neuroinflammation, all of which may be associated with the pathogenesis of ASD.
Keyword: Locomotor activity, Membrane fluidity, Gap junction, Plasmalogens, Docosahexaenoic acid,Oxidative stress
IntroductionAutism spectrum disorders (ASD) are a family of disorderscharacterized by stereotypic and restrictive patterns of be-havior, deficits in social interactions, and impairments inlanguage development and communication skills [1].Several recent studies have indicated that interactions be-tween genetic, metabolic, immunological, gastrointestinal,environmental, and behavioral factors may be associatedwith the pathogenesis of ASD [2-6]. Our research grouphas been developing a novel rodent model of autism toexamine enteric bacterial metabolites as possible environ-mental triggers in ASD. Such a model could prove useful ininvestigating how the interactions between the above
factors may contribute to the pathogenesis of ASD [7-12],and identify potential biomarkers that could be used inearly detection and screening for this disorder.The central premise of this model is that propionic
acid (PPA) and/or related enteric fatty acids may be can-didate environmental factors involved in the develop-ment of some types of ASD. Propionate and other shortchain fatty acids (for example butyrate, acetate) are pro-duced in the body during normal cellular metabolismand following enteric bacterial fermentation of dietarycarbohydrates and proteins [13]. PPA producing entericbacteria, including unique Clostridial, Desulfovibrio, andBacteriodetes species, have been isolated from patientswith regressive ASD [2,14]. Propionate is also presentnaturally in a variety of foods and is a common foodpreservative in refined wheat and dairy products [15].Under normal circumstances these short chain fatty
* Correspondence: [email protected] Kilee Patchell-Evans Autism Research Group, Department of Psychology,University of Western Ontario, London, ON N6A 5C2, CanadaFull list of author information is available at the end of the article
JOURNAL OF NEUROINFLAMMATION
© 2012 Thomas et al.; licensee BioMed Central Ltd. This is an Open Access article distributed under the terms of the CreativeCommons Attribution License (http://creativecommons.org/licenses/by/2.0), which permits unrestricted use, distribution, andreproduction in any medium, provided the original work is properly cited.
Thomas et al. Journal of Neuroinflammation 2012, 9:153http://www.jneuroinflammation.com/content/9/1/153

acids are primarily metabolized in the liver. However, ifthere are genetic and/or acquired aberrations in metabol-ism [7,16], higher than normal levels of short chain fattyacids can be present in the circulating blood, and cancross the gut-blood and blood brain barriers passivelyand/or actively via high affinity transporters [17]. Underthese conditions, short chain fatty acids can concentrateintracellularly, particularly in acidotic conditions [18,19],where they may have deleterious effects on brain develop-ment and function [13,20,21]. This could be important inthe context of ASD, since PPA is known to affect cell sig-naling [22], neurotransmitter synthesis and release [20],mitochondrial function/CoA sequestration [16], lipid me-tabolism [23] immune function [24], gap junction modula-tion [19], and gene expression [25], all of which have beenimplicated in ASD [7,25-28].Previous results from our work developing this model in-
dicate that brief, intracerebroventricular infusions with PPA,but not control compounds (that is, propanol) producedshort bouts of behavioral (hyperactivity, perserveration,object fixation, social impairments) and electrophysiological(seizure, caudate spiking) effects, coupled with biochemical(increased oxidative stress, reduced glutathione) and neuro-pathological (innate neuroinflammation) alterations in adultrats, consistent with those seen in ASD [7-11]. Recent find-ings with this model indicate infusions with PPA or butyratealtered the brain acylcarnitine and phospholipid profiles[12]. Interestingly, the alterations in rat brain lipids noted inthis study showed a number of similarities to those docu-mented in blood from ASD patients [5,29-32].In the above studies, phospholipid fatty acid compos-
ition was determined by analyzing fatty acid acyl groupsfollowing hydrolysis of the separated phospholipid classes.Though the standard accepted method of lipid analysis,this method destroys the phospholipid structure, abolish-ing the ability to establish the individual phospholipid mo-lecular species distribution of the samples. Recently, it hasbecome possible to apply electrospray ionization massspectrometry to analyze phospholipids as their intact mo-lecular species, allowing for identification of individualand patterns of specific lipids [33-35]. This is potentiallyimportant considering there are presently no reliable bio-markers for the detection of ASD, the etiology of ASD isunclear, and altered lipid profiles have been reported bothfor ASD patients [5,27,29,32,36] and in the PPA rodentmodel of ASD [12]. Therefore, there is a need to deter-mine: (1) whether or not the intact phospholipid molecu-lar species are altered in relation to behaviors, to furthervalidate this animal model; and (2) how these alteredphospholipid profiles may relate to the pathogenesis ofASD.The development of liquid chromatography electrospray
ionization mass spectrometry (LC-ESI/MS) has made it pos-sible to directly analyze phospholipids as intact molecular
species, and preserve the information inherent in theirchemical structure [33,35]. Herein, we used ESI/MS todetermine how the intact blood and brain phospholipidmolecular species are altered during the induction of abnor-mal (ASD-like) behaviors following PPA infusions in rats.
Materials and methodsSubjectsTwenty four Long-Evans rats (Charles River Laboratories,Quebec, Canada), weighing 200–225 g (approximately47–49 days old) at the start of the experiment, were indi-vidually housed at 21±1°C in standard acrylic cages(26×48×21 cm) and exposed to 12:12 h light–dark cycle(lights on 0700 h to 1900 h). Animals were allowed accessto food (Prolab rat chow) and tap water ad libitum. Allprocedures were in accordance with guidelines of theCanadian Council on Animal Care and were approved by theUniversity of Western Ontario Animal Use Subcommittee.
Surgical implantation of intracerebroventricular (ICV)cannulaTo induce anesthesia, animals were placed in a sealedPlexiglas box into which 4 % isoflurane and 2 L/min oxy-gen flow were introduced. The animal was then placedinto a Kopf stereotaxic frame equipped with a gas flownose cover to maintain anesthesia throughout surgery at2 % isoflurane and 500 mL/min oxygen flow. Under asep-tic conditions, the animal received an implantation of a23-gauge guide cannula with the tip in the right lateralventricle (AP 1.3 mm, ML 1.8 mm, DV 3.0 mm) [37]. Can-nula placements were in accordance with Paxinos andWatson [37] rat brain atlas and our previous experience[7-11]. A removable obturator sealed the guide cannulauntil an injection was to be made. To facilitate infusioninto the lateral ventricle, the tip of a 30-gauge injectioncannula protruded 0.5 mm beyond the tip of the guidecannula. Small stainless steel screws were inserted into theskull surrounding the cannula to provide anchors for den-tal acrylic, which attached the cannula to the skull. Imme-diately post-surgery, all rats received a subcutaneousinjection of analgesic (Ketoprofin, 1 mL/kg). All animalswere allowed 14 days recovery before behavioral testingtook place.
Treatment groups and intracerebroventricular infusionprocedureFollowing recovery, animals were assigned to one of twogroups: PPA treatment (4.0 μL of a 0.26 M solution,n=12), or phosphate buffered saline (PBS) control (4.0 μL,n=12). Sodium propionic acid was dissolved in PBS ve-hicle and buffered to pH 7.5 using concentrated HCl. Eachgroup received intracerebroventricular (ICV) infusionstwice daily, separated by 4 h, for 8 consecutive days. Com-pounds were infused using a 30-gauge injection cannula
Thomas et al. Journal of Neuroinflammation 2012, 9:153 Page 2 of 18http://www.jneuroinflammation.com/content/9/1/153

connected to a Sage syringe pump with sterile PE10 tubing.The tip of the injection cannula protruded 0.5 mm beyondthe tip of the guide cannula. Each injection consisted of 4.0μL of solution delivered over a period of 1 min. The infu-sion cannula remained in place for an additional minutebefore being removed.
Apparatus: automated activity monitorsLocomotor activity was monitored using three VersamaxAnimal Activity Monitors (AccuScan Model DCM-8,Columbus, OH, USA). Each monitor consisted of a Plexi-glas open field chamber (40×40×30.5 cm), and a Plexiglaslid with air holes. Located on all four sides of the chamberwere 16 infrared beam sensors 2.54 cm apart and 4.5 cmfrom the floor to measure horizontal movements and ontwo opposite sides were 16 infrared beams located 15 cmabove the chamber floor to measure the vertical move-ments. Light levels at the floor of each open-field were ap-proximately 900 lux. A VersaMax Analyser (AccuscanModel VSA-16, Columbus, OH, USA) processed relayeddata from each automated open-field to a computer locatedin an adjacent room to the testing chambers [7,8].
Behavioral testingThe methods used for behavioral assessment presented inthis study have been previously reported (2011) [7-12].Briefly, animals were habituated to the automated activitymonitors for two 30-min sessions prior to the treatmentsessions. Baseline was recorded on the third day to establishnormal activity levels for untreated animals. Locomotorassessments were made for 30 min immediately followingthe second ICV infusion daily for 7 days. Locomotor activ-ity was assessed using horizontal, vertical, and repetitivemeasures (stereotypy) across infusion days. The horizontalactivity measures analyzed were number of horizontalmovements (the number of horizontal movements sepa-rated by 1 s stop time), horizontal movement time (lengthof time in seconds an animal was engaged in horizontalmovement), and total distance (total horizontal distance(cm) traveled). The vertical activity measure analyzed wasnumber of vertical movements (number of vertical move-ments separated by 1 s stop time). The repetitive activitymeasures were: clockwise revolutions (the number of timesan animal ran around in a clockwise circle of at least 2inches in diameter), counterclockwise revolutions (thenumber of times an animal ran around in a counterclock-wise circle of at least 2 inches in diameter), and the numberof stereotypic movements (repeated breaking of the sameinfrared beam separated by 1 s or more). Fifteen minutesafter animals received the final ICV infusion on the eighthtreatment day, they were decapitated, brains quicklyremoved, placed on powdered dry ice, then transportedfrom surgery room to the analytical laboratory for lipid ana-lysis. Samples were then stored in a −70°C freezer for 2 days
before lipid analysis. Whole blood collected from theneck following decapitation was heparinized and spun at3000×g for 5 min, and the supernatant (plasma) collectedfor lipid analysis.
Lipid extractionBrain tissue (100 mg) ipsilateral to ICV infusion site, con-taining frontal cortex, striatum, thalamus, and dorsal hippo-campus, 1.3 mm posterior to bregma, [37] was ground tofine powder while frozen in liquid nitrogen. The groundbrain samples (100 mg) and plasma (100 uL) were transferredto centrifuge tubes containing a mixture (2.5 mL) of chloro-form/methanol/0.01 % butylated hydroxytoluene (2:1:0.0003;v/v/wt) and 100 μL of 1 mg/mL 1,2-dipalmitoyl-sn-glycero-3-phospho-N,N-dimethylethanolamine (Sigma, St Louis, MO,USA) added as internal standard. The sample and solventmixture was centrifuged at 10,000×g for 15 min. Followingcentrifugation, the supernatant was collected and 1 mL of0.25 % potassium chloride (KCl) was added. The sample wasthen incubated in a water bath at 70°C for 10 min. After incu-bation, the sample was removed, cooled and the aqueouslayer (top) was removed with a Pasteur pipette. Theremaining layer (organic) containing the lipids was transferredto pre-weighed 4 mL sample vial having a poly-teflon resinlined cap (VWR). The sample was dried under a gentlestream of nitrogen and the vial re-weighed to determine theamount of sample recovered [38,39]. The recovered samplewas then resuspended in 1 mL chloroform:methanol (2:1 v/v)and stored at −20°C for analysis (ESI/MS).
Electrospray ionization mass spectrometry analysis (ESI-MS)Aliquots of blood and brain samples were analyzed by in-fusion on a triple quadruple instrument (Micromass Quat-troMicro; Waters, Milford. MA, USA) equipped with aZ-spray source. The mass spectrometer was operated inboth the positive and negative ion modes, and precursorion or neutral loss scans specific to the phospholipidclasses were used to determine the composition of themolecular species of each class [33,40]. Precursor ion scan(negative mode) of m/z 153 was used to detect all glycero-phospholipid molecular species, m/z 241 used to detect PImolecular species (negative mode), precursor ion scan ofm/z 196 (negative mode) or neutral loss scan of 141 D(positive mode) used to detect PE molecular species, andneutral loss scan of 87 D (negative mode) or 185 D (posi-tive mode) used to detect PS molecular species; while pre-cursor ion scan of m/z 184 in the positive mode was usedto detect SM and PC molecular species. The fatty acidcomposition of the identified molecular species of eachphospholipid classes was determined via MS/MS analysisand reference to the literature (LIPID MAPS). The investi-gated mass range was from 100–1000m/z. The cone volt-age was set at 30 V, the collision energy at 30–50 V,source temperature at 80°C and the collision gas at 2xe-3
Thomas et al. Journal of Neuroinflammation 2012, 9:153 Page 3 of 18http://www.jneuroinflammation.com/content/9/1/153

Mbar. Calibration was performed with sodium iodide andmass error was less than 0.05 Dalton (Da). Flow injectionwas carried out with chloroform:methanol:water:ammonia(20:70:8:2 v/v/v/v) at a flow rate of 50 uL/min with 20 uLof the sample injected for analysis. Quantitative analysiswas conducted using MassLynx 4.0 software (Micromass)and Microsoft Excel by using the signal intensity of thereference standard to normalize the intensities of the iden-tified molecular phospholipid species after correction for13C isotope effects. Representative external standards foreach phospholipid classes (Avanti Polar Lipids, Alabaster,AL, USA) were used to determine the relative amounts ofthe molecular species within a phospholipid class. Theamounts of each molecular species within a phospholipidclass are expressed as nanomole percent composition.
Statistical analysisA total of 24 animals were used for this study (12 PBSand 12 PPA).General analysis of variance (ANOVA) was used to deter-
mine the effects of treatments on behavior and phospho-lipid components. Where treatment effects were significant,the means were compared with Fisher’s LSD test, α=0.05.A one-way ANOVA was conducted on the baseline data toensure that there were no individual differences in behaviorprior to treatment days. The data were analyzed using theStatistix software package (Analytical Software, Tallahassee,FL, USA).
ResultsBehavioral assessmentLocomotor behavior was assessed daily for 7 days, imme-diately following the second infusion of the day. Prior tobehavioral assessment, there was no significant differencein baseline behavior between animals assigned to the PPAand PBS treatment groups. Locomotor activity expressedby horizontal, vertical, and repetitive measures across infu-sion days, was used to assess animal behavior. Analysis ofhorizontal activity measures revealed a significant effect ofPPA treatment across infusion days for number of hori-zontal movements, horizontal movement time, and totaldistance traveled (Figure 1). Propionic acid treated animalstraveled further, made more horizontal movements, andspent more time traveling horizontally than PBS treatedanimals. The number of horizontal movements was sig-nificantly higher (F (6, 126)=3.69, P <0.001) in rats infusedwith PPA on infusion days 2, 4, 5, 6, and 7 compared toPBS controls (Figure 1a). A similar pattern was observedfor horizontal movement time (F (6, 126) =2.82, P <0.001)(Figure 1f) and total distance traveled (F (6, 126)= 2.08,P <0.001) (Figure 1 g), whereby these behavioral activitieswere significantly higher in PPA treated animals comparedto PBS controls on infusion days 2, 3, 4, 5, 6, and 7. Analysisof the number of vertical movements revealed a significant
(F (6, 126)= 2.82, P <0.001) main effect of PPA treatmentacross infusion days, indicating PPA treated animals mademore vertical movements than PBS treated animals on infu-sion days 3 through 7 (Figure 1b). The results of the repeti-tive activity measures showed significant increases incounterclockwise revolutions (F (6, 126)= 2.46, P <0.001),clockwise revolutions (F (6, 126)= 2.40, P <0.001) and num-ber of stereotypic movements (F (6, 126)=4.05, P <0.001)in PPA-treated animals across infusion days. On infusiondays 3, 4, 5, 6, and 7, animals infused with PPA made morecounterclockwise (Figure 1c) and clockwise (Figure 1d)revolutions than PBS controls. Stereotypy showed a similartrend whereby PPA-treated animals displayed more stereo-typic movements than PBS animals on infusions days 2through 7 (Figure 1e).
Lipid analysisBehavioral assessment indicated animals developed abnor-mal (ASD-like) behaviors following PPA infusion (Figure 1).Animals were killed during the expression of these abnor-mal behaviors on day 8 and the molecular species of fivephospholipid classes (SM, PC, PI, PS, and PE) were evalu-ated to determine whether they were altered during the ex-pression of these behaviors. Phosphatidylcholine and SMmolecular species were detected in the positive ion mode(Figure 2), while PI, PS, and PE molecular species weredetected in the negative ion mode (Figure 3). Although thesame molecular species for each phospholipid class weredetected in control and PPA-infused animals, the analysesrevealed a quantitative change in these lipid constituents fol-lowing PPA infusions (Table 1, 2, 3, 4, 5, 6, 7, 8, 9, and 10).
SM molecular speciesSphingomyelin molecular species containing saturatedbase (C18:0) and fatty acids predominate in brain sam-ples (Table 1), while species with monounsaturated base(C18:1) and polyunsaturated fatty acid predominate inplasma samples (Table 2).Propionic acid treatment resulted in alterations in the pro-
portions of both brain (F (27, 56) =10.79, P <0.001) andplasma (F (27, 56) =32.64, P <0.001) SM molecular species(Tables 1 and 2). In both brain (Table 1) and plasma(Table 2) an overall increase (P <0.001) was observed in therelative level of saturated species, in addition to a reductionin monounsaturated species. Polyunsaturated species wereunchanged in brain, but increased in plasma following PPAinfusions. Increased proportions (P <0.001) of 36:0 (18:0/18:0) in brain (Table 1) and 38:0 (18:0/20:0) in plasma(Table 2) accounted for the increase in saturated SM species.In brain, the proportions of 38:0 (18:0/20:0) and 40:0 (18:0/22:0) were decreased, but this had no overall significant ef-fect on the total brain proportions of saturated SM. Con-versely, 38:1 (18:1/20:0) in brain (Table 1) and both 34:1(18:1/16:0) and 38:1 (18:1/20:0) in plasma (Table 2)
Thomas et al. Journal of Neuroinflammation 2012, 9:153 Page 4 of 18http://www.jneuroinflammation.com/content/9/1/153

Number of Horizontal Movements
Infusion Day
Nu
mb
er o
f H
ori
zon
tal M
ove
men
ts
0
50
100
150
200
250
300
350PBS PPA
** *
**
Number of Vertical Movements
Infusion Day
Nu
mb
er o
f V
erti
cal M
ove
men
ts
0
20
40
60
80
100PBS PPA
** *
* *
Counterclockwise Revolutions
Infusion Day
Nu
mb
er o
f C
ou
nte
rclo
ckw
ise
Rev
olu
tio
ns
0
10
20
30
40PBS PPA
*
**
**
Clockwise Revolutions
Infusion Day
Clo
ckw
ise
Rev
olu
tio
ns
(D)
0
10
20
30
40
50PBSPPA *
* *
*
*
Stereotypic Movement
Infusion Day
Nu
mb
er o
f S
tere
oty
pic
Mo
vem
ents
0
50
100
150
200
250
300PBSPPA
** *
* * *
Horizontal Movement Time
Infusion Day 1
Ho
rizo
nta
l Mo
vem
ent
Tim
e (s
ec)
0
200
400
600
800PBS PPA
*
** *
**
Total Distance
Infusion Day
1 2 3 4 5 6 7 1 2 3 4 5 6 7
1 2 3 4 5 6 7 1 2 3 4 5 6 7
1 2 3 4 5 6 7 1 2 3 4 5 6 7
1 2 3 4 5 6 7
To
tal D
ista
nce
Tra
velle
d (
cm)
0
2000
4000
6000
8000
10000
12000PBS PPA
*
*
** *
*
(A)
(C) (D)
(B)
(E) (F)
(G)
Figure 1 (See legend on next page.)
Thomas et al. Journal of Neuroinflammation 2012, 9:153 Page 5 of 18http://www.jneuroinflammation.com/content/9/1/153

accounted for the reduction in monounsaturated SM spe-cies, while 42:3 (18:1/24:2) in plasma accounted for theincreased polyunsaturated species following PPA infusions(Table 2).
PC molecular speciesDiacyl and plasmalogen PC molecular species werepresent in both brain (Table 3) and plasma (Table 4).However, only the diacyl species were altered (F (59,120) = 1042.12, P <0.001) in brain following PPA treat-ments, while both the diacyl and plasmalogen species werealtered (F (59, 120) = 873.32, P <0.001) in plasma. In brain,the proportions of monounsaturated 34:1 (16:0/18:1) andpolyunsaturated diacyl 34:2 (16:0/18:2) and 36:4 (16:0/
20:4) species were increased; while a reduction wasobserved in the monounsaturated diacyl 36:1 (18:0/18:1)species following PPA treatment (Table 3). No overallchange was observed in the relative proportions of satu-rated, unsaturated, and polyunsaturated PC species.Plasma samples on the other hand revealed a reduction inthe level of diacyl polyunsaturated PC species (34:2 (16:0/18:2), 36:4 (16:0/20:4), 38:2 (18:1/20:1), 38:4 (18:0/20:4)),and an in increase in the proportions of plasmalogen spe-cies (36:1 (18:0/18:1)). Although plasma proportions ofdiacyl saturated 34:0 (16:0/18:0) and monounsaturated36:1 (18:0/18:1) molecular species increased followingPPA infusions, this had no effect on the overall level oftotal saturated and monounsaturated PC species (Table 4).
m/z660 670 680 690 700 710 720 730 740 750 760 770 780 790 800 810 820 830 840 850 860
%
0
100
%
0
100
SY_20x5 760.57720.60
702.51678.44 686.61
718.59
734.62
721.55
722.49
735.56
746.62
761.57
788.59762.58
782.56
763.65
810.59789.60
792.55811.59
834.59814.67
SY_2009_00666_BUT_184_1 29 (0.730) Sm (SG, 2x0.50); Cm (19:67)x5 760.57
734.55
731.66
706.59703.57 731.29718.59
735.62
746.62
761.57
788.66762.58
782.56763.65
774.58
810.59789.60
834.66
B
Scan mode: full ion scan [M+H] +
Scan mode: + prec 184 [M+H]+ ions of SM + PC
A
IS
Figure 2 Positive ion mass spectra of brain lipid extract. (A) Full ion scan of all lipids present in positive ion mode. (B) Detection of [M+H]+
ions of PC and SM molecular species by precursor scanning of m/z 184. IS, internal standard; PC, phosphatidylcholine; SM, sphingomyelin.
(See figure on previous page.)
Figure 1 Number of horizontal movements (A), number of vertical movements (B), counterclockwise revolutions (C), clockwiserevolutions (D), number of stereotypic movements (E), horizontal movement time (F), and total distance travelled (G), representingabnormal animal behavior following ICV infusions with PPA and PBS. Animals received ICV infusions of PPA (n= 12) and PBS (n= 12) twice aday for 7 consecutive days. Behavioral measurements were monitored immediately after each infusion over 30 min. Values represent means ± SEover 7 days. Bars accompanied by asterisks indicate significant difference between treatments at LSD= 0.05, n= 12 per treatment group. PBS,phosphate buffered saline solution; PPA, propionic acid.
Thomas et al. Journal of Neuroinflammation 2012, 9:153 Page 6 of 18http://www.jneuroinflammation.com/content/9/1/153
IS
m/z450 475 500 525 550 575 600 625 650 675 700 725 750 775 800 825 850 875 900 925
%
0
100
%
0
100
SY_2009_00666_NEG_BUT_MS_1 25 (0.629) Sm (SG, 2x1.00); Sm (SG, 2x0.50); Cm (16:33)834.45
788.50
718.38
610.54501.41524.49 600.58568.38 700.51673.52
774.55766.52
790.49
804.43
885.48835.28
857.39
886.44
888.56
890.42
906.36
SY_2009_00666_NEG_BUT_MS_241 26 (0.654) Sm (SG, 2x1.00); Cm (22:30) Parents of 241ES- 1.04e4885.22
883.23856.94
603.08580.98
709.90618.89 835.28
732.90
858.10
881.49
886.12
888.50946.14
m/z680 690 700 710 720 730 740 750 760 770 780 790 800 810 820 830 840 850 860 870 880 890 900
%
0
100
%
0
100
SY_2009_00666_NEG_BUT_MS_87_2 24 (0.604) Sm (SG, 2x0.80); Cm (12:31)834.38
788.43
786.38760.41
789.46
810.41816.45 832.39
835.41
836.44
838.43
839.46
SY_2009_00666_NEG_BUT_MS_196 36 (0.906) Sm (SG, 2x0.80); Cm (22:45) Parents of 196ES- 2.49e3790.23
774.29
726.35
700.77
698.33677.25
722.37
715.49
766.84746.53
729.56
730.14
750.45
762.21
775.51
776.41
791.45
792.42
907.33796.40851.35824.55
809.06 847.81868.96
865.62 892.35874.04
B
A
B
C
D
Scan mode: - prec 153 [M-H]- ions of GPL
Scan mode: - prec 241 [M-H]- ions of PI
Scan mode: - neutral 87 [M-H]- ions of PS
Scan mode: - prec 196 [M-H]- ions of PE
Figure 3 (See legend on next page.)
Thomas et al. Journal of Neuroinflammation 2012, 9:153 Page 7 of 18http://www.jneuroinflammation.com/content/9/1/153

PI molecular speciesPropionic acid treatment altered the proportions of sev-eral plasma (F (35, 72) = 75.31, P <0.001) PI molecularspecies, while the proportions of only two brain (F (35,72) = 2017.70, P <0.001) PI molecular species wereaffected (slightly reduced) (Table 5 and 6). Reduced pro-portions of polyunsaturated diacyl 36:3 (18:1/18:2) and40:4 (18:0/22:4) species were observed in brain samplesfollowing PPA treatment (Table 5). The alterations weremore varied with plasma PI molecular species. The pro-portions of plasma diacyl 34:1 (16:0/18:1), 36:3 (18:1/18:2), 38:6 (16:0/22:6), 40:4 (18:0/22:4), and 40:6 (18:0/22:6) increased, while the proportions of the diacyl 38:4(18:0/20:4) species decreased following PPA treatment(Table 6). These changes indicate a compositional shiftoccurred particularly in plasma PI molecular species fol-lowing PPA infusions.
PS molecular speciesPropionic acid infusions altered the proportions of bothmono and polyunsaturated PS species in brain (Table 7)
and plasma (Table 8). In both brain (F (21, 44) = 305.49,P <0.001) and plasma (F (21, 44) = 12.14, P <0.001), anoverall increase was observed in the proportion of mono-unsaturated species, while a reduction was observed inpolyunsaturated species. An increase in brain 36:1 (18:0/18:1) (Table 7) and plasma (Table 8) 34:1 (16:0/18:1) and36:1 (18:0/18:1) accounted for the increase in monoun-saturated PS species. Conversely, a reduction in brain pro-portions of 40:4 (18:0/22:4) and 40:6 (18:0/22:6) andplasma proportions of 40:3 (18:0/22:3) and 40:6 (18:0/22:6) accounted for the reduced polyunsaturated PS spe-cies following PPA infusions.
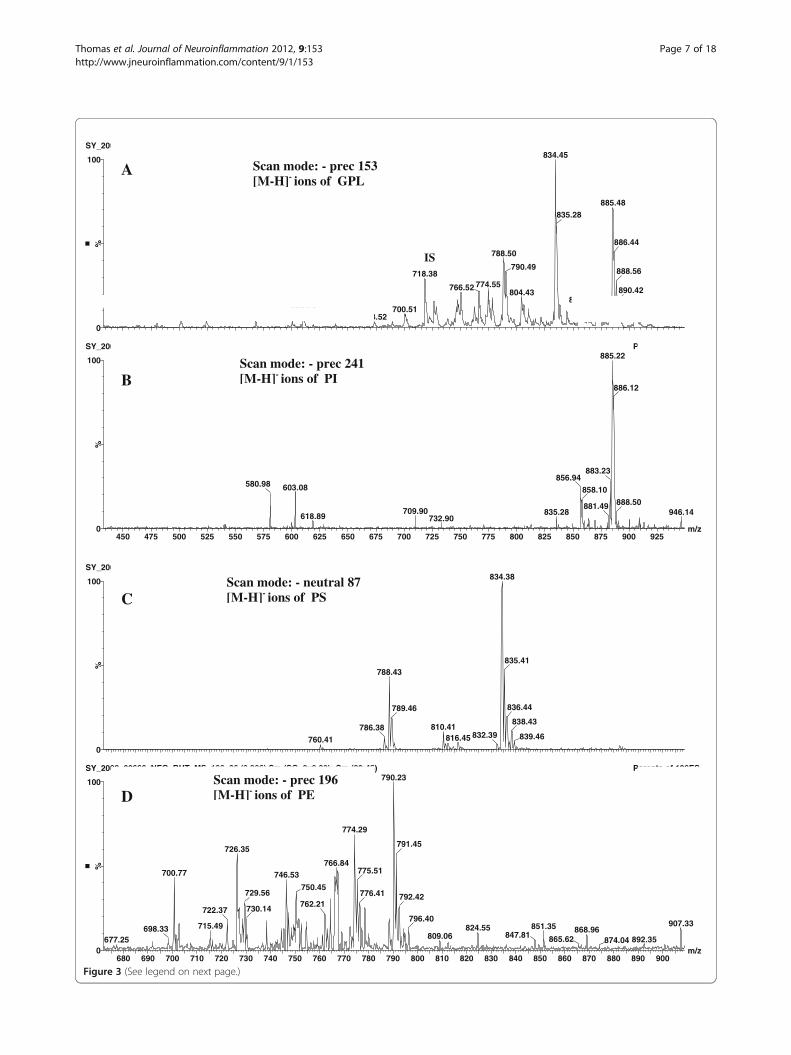
PE molecular speciesCompositional changes in brain diacyl and plasmalogenPE species occurred following PPA infusions (Table 9).Propionic acid treatment reduced (F (79, 160) = 8.79,P <0.001) P <0.001) brain relative proportions of plasmalo-gen 40:6 (p18:0/22:6), diacyl polyunsaturated 38:6 (16:0/22:6), and 40:6 (18:0/22:6) species, but increased the pro-portions of plasmalogen 36:1 (p18:0/18:1), 36:2 (p18:0/
Table 1 Changes (percent composition) in rat brainsphingomyelin molecular species followingintraventricular infusion with propionic acid (PPA) andphosphate buffered saline (PBS)
Molecularweight
Molecularspecies
Base/acylspecies
PBS PPA
703 34:1 18:1/16:0 0.07 ± 0.03 0.10 ± 0.05
733 36:0 18:0/18:0 21.96 ± 0.35 39.13 ± 1.35*
731 36:1 18:1/18:0 6.21 ± 0.67 4.53 ± 1.28
761 38:0 18:0/20:0 38.09 ± 0.84 29.37 ±1.92*
759 38:1 18:1/20:0 16.08 ± 0.19 12.31 ± 3.64*
789 40:0 18:0/22:0 13.03 ± 0.24 9.92 ± 1.31*
811 42:3 18:1/24:2 4.56 ± 0.12 4.64 ± 1.54
Total% 100 100P
Saturates 73.07 ± 0.15 78.41 ±1.44*P
Monounsat 22.37 ± 0.66 16.94 ±2.91*P
Polyunsat 4.55 ± 0.12 4.63± 1.54
Values (nanomole percent by weight composition) represent means ± standarderrors. Means in the same row accompanied by asterisks are significantlydifferent between treatments at LSD= 0.05, n= 12 per treatment group.Monounsat, monounsaturated fatty acids; PBS, phosphate buffered salinesolution; PPA, propionic acid; polyunsat, polyunsaturated fatty acids.Sphingomyelin molecular species were identified using a precursor ion scan ofm/z 184 in ESI positive mode. The lipid components in the table are arrangedbased on the molecular species composition.
(See figure on previous page.)Figure 3 Negative ion mass spectra of brain lipid extract. (A) Detection of all [M-H] - ions of glycerophospholipids by precursor ion scan ofm/z 153. (B) Detection of PI molecular species by precursor ion scanning of m/z 241. (C) Detection of PS molecular species by neutrol loss of 87D. (D) Detection of PE molecular species by precursor ion scanning of m/z 196. GPL, glycerophospholipids; IS, internal standard; PI,phosphatidylinositol; PS, phosphatidylserine; PE, phosphatidylethanolamine.
Table 2 Changes (percent composition) in rat plasmasphingomyelin molecular species followingintraventricular infusion with propionic acid (PPA) andphosphate buffered saline (PBS)
Molecularweight
Molecularspecies
Base/acylspecies
PBS PPA
703 34:1 18:1/16:0 14.05 ± 1.42 4.63 ± 1.10*
733 36:0 18:0/18:0 2.63 ± 0.47 3.40 ± 1.23
731 36:1 18:1/18:0 1.54 ± 0.32 1.65 ± 0.42
761 38:0 18:0/20:0 12.91 ± 0.37 15.92 ± 0.65*
759 38:1 18:1/20:0 8.36 ± 0.56 5.77 ± 0.24*
789 40:0 18:0/22:0 9.44 ± 2.89 10.39 ± 2.03
811 42:3 18:1/24:2 51.07 ± 0.62 58.24 ± 0.68*
Total% 100 100P
Saturates 24.98 ± 1.33 29.72 ±1.49*P
Monounsat 23.95 ± 1.53 12.05 ±1.57*P
Polyunsat 51.06 ± 0.63 58.22 ±0.68*
Values (nanomole percent by weight composition) represent means ± standarderrors. Means in the same row accompanied by asterisks are significantlydifferent between treatments at LSD= 0.05, n= 12 per treatment group.Monounsat, monounsaturated fatty acids; PBS, phosphate buffered salinesolution; PPA, propionic acid; polyunsat, polyunsaturated fatty acids.Sphingomyelin molecular species were identified using a precursor ion scan ofm/z 184 in ESI positive mode. The lipid components in the table are arrangedbased on the molecular species composition.
Thomas et al. Journal of Neuroinflammation 2012, 9:153 Page 8 of 18http://www.jneuroinflammation.com/content/9/1/153

18:2), 38:4 (p18:0/20:4), and 40:4 (p18:0/22:4) molecularspecies. In plasma, both the composition and overall rela-tive proportions of PE diacyl and plasmalogen specieswere altered following PPA infusions (Table 10). A reduc-tion (F (79, 160) = 11.61, P <0.001) was observed in diacyl36:1 (18:0/18:1), plasmalogen 36:0 (p18:0/18:0), 36:1(p18:0/18:1), 36:4 (p16:0/20:4), 38:4 (p18:0/20:4), and 40:6(p18:0/22:6) molecular species. In contrast, the propor-tions of polyunsaturated diacyl species (38:4 (18:0/20:4)and 38:6 (16:0/22:6)) increased with PPA infusions.
DiscussionBehavioral assessmentLocomotor activity as expressed by horizontal, vertical,and repetitive measures across infusion days was used toassess abnormal animal behavior. Assessment of loco-motor activity indicates that PPA infusions induced hyper-activity and stereotypy in rodents consistent with thefindings from previous studies by our group [7-12]. Thesebehaviors bear some resemblance to the hyperactive andrepetitive behaviors which are recognized as core symp-toms of ASD [41]. PPA and other short chain fatty acidsare known to increase intracellular neuronal and glial
acidification and calcium proportions, thereby producingwidespread effects on neurotransmitter release includingglutamate, dopamine, norepinepherine, and serotonin, eachof which play a role in elicitation of locomotor activity, asseen in the present study [42-44]. In addition, PPA hasbeen shown to increase glutamatergic transmission, leadingto excitability in brain regions linked to locomotor activity[45,46]. Collectively, these observations are consistent withan emerging theory of ASD as a disruption of excitatory/inhibitory neuronal activity [47]. The fact that PPA infu-sions consistently induce elevations in locomotor activityin rodents indicates that this model may be a useful toolfor studying the neurological mechanisms involved in thebehavioral disturbances seen in ASD.
Alterations in phospholipid molecular speciesThe phospholipid profiles observed in control animals areconsistent with those reported in the literature for rat brain([48,49]with the exception of SM molecular species. Typic-ally, molecular species with sphingosine base (C18:1) makeup the largest proportion of the SM profile in mammals. Inthis study, molecular species with sphinganine bases(C18:0) accounted for the largest proportion of rat brain
Table 3 Changes (percent composition) in rat brain phosphatidylcholine molecular species following intraventricularinfusion with propionic acid (PPA) and phosphate buffered saline (PBS)
Molecular weight Molecular species Plasmalogen or diacyl species PBS PPA
706 D30:0 16:0/14:0 0.13 ± 0.055 0.13 ± 0.04
734 D32:0 16:0/16:0 19.23 ± 0.34 19.33 ± 0.69
718 P32:1 p16:0/16:1 0.05 ± 0.01 0.06 ± 0.01
762 D34:0 16:0/18:0 18.66 ± 0.49 19.14 ± 0.63
760 D34:1 16:0/18:1 32.80 ± 0.15 33.68 ± 0.16*
746 P34:1 p16:0/18:1 1.54 ± 0.26 1.40 ± 0.32
758 D34:2 16:0/18:2 0.27 ± 0.04 0.69 ± 0.19*
788 D36:1 18:0/18:1 10.53 ± 0.18 9.20 ± 0.15*
774 P36:1 p18:0/18:1 0.50 ± 0.11 0.40 ± 0.11
782 D36:4 16:0/20:4 3.96 ± 0.51 4.81 ± 0.53*
814 D38:2 18:1/20:1 1.21 ± 0.25 1.29 ± 0.11
812 D38:3 18:0/20:3 1.85 ± 0.28 1.74 ± 0.14
810 D38:4 18:0/20:4 4.91 ± 0.26 4.33 ± 0.34
806 D38:6 16:0/22:6 2.98 ± 0.12 2.74 ± 0.10
834 D40:6 18:0/22:6 1.36 ± 0.11 1.06 ± 0.14
Total% 100 100P
Saturates 18.78± 0.48 19.27 ± 0.60P
Monounsat 62.56± 0.51 62.20 ± 0.70P
Polyunsat 16.55± 0.63 16.65 ± 0.99P
Plas 2.09 ± 0.32 1.85± 0.43
Values (nanomole percent by weight composition) represent means ± standard errors. Means in the same row accompanied by asterisks are significantly differentbetween treatments at LSD= 0.05, n= 12 per treatment group. D represents diacyl species and P represents plasmalogens species, p denotes a sn-1 vinyl ether(plasmalogen) linkage. Monounsat, monounsaturated fatty acids; PBS, phosphate buffered saline solution; plas, plasmalogens; polyunsat, polyunsaturated fattyacids; PPA, propionic acid. Phosphatidylcholine molecular species were identified using a precursor ion scan of m/z 184 in ESI positive mode.
Thomas et al. Journal of Neuroinflammation 2012, 9:153 Page 9 of 18http://www.jneuroinflammation.com/content/9/1/153

Table 5 Changes (percent composition) in rat brain phosphatidylinositol molecular species following intraventricularinfusion with propionic acid (PPA) and phosphate buffered saline (PBS)
Molecular weight Molecular species Diacyl species PBS PPA
835 D34:1 16:0/18:1 0.53 ± 0.05 0.54 ± 0.07
859 D36:3 18:1/18:2 1.01 ± 0.14 0.79 ± 0.01*
857 D36:4 16:0/20:4 7.71 ± 0.32 7.02 ± 0.45
887 D38:3 18:0/20:3 9.07 ± 0.69 9.71 ± 0.73
885 D38:4 18:0/20:4 74.17 ± 1.35 74.60 ± 1.27
883 D38:5 18:1/20:4 5.53 ± 0.73 5.44 ± 0.41
881 D38:6 16:0/22:6 0.80 ± 0.04 0.79 ± 0.04
913 D40:4 18:0/22:4 0.41 ± 0.01 0.17 ± 0.03*
909 D40:6 18:0/22:6 0.77 ± 0.10 0.94 ± 0.12
Total% 100 100P
Monounsat 0.53 ± 0.05 0.54± 0.07P
Polyunsat 99.46 ± 0.05 99.46 ± 0.07
Values (nanomole percent by weight composition) represent means ± standard errors. Means in the same row accompanied by asterisks are significantly differentbetween treatments at LSD= 0.05, n= 12 per treatment group. D represents diacyl species. Monounsat, monounsaturated fatty acids; PBS, phosphate bufferedsaline solution, polyunsat, polyunsaturated fatty acids; PPA, propionic acid. Phosphatidylinositol molecular species were identified using a precursor ion scan of m/z 241 in ESI negative mode. The lipid components in the table are arranged based on the molecular species composition.
Table 4 Changes (percent composition) in rat plasma phosphatidylcholine molecular species following intraventricularinfusion with propionic acid (PPA) and phosphate buffered saline (PBS)
Molecular weight Molecular species Plasmalogen or diacyl species PBS PPA
706 D30:0 16:0/14:0 0.79 ± 0.42 0.59 ± 0.18
734 D32:0 16:0/16:0 1.39 ± 0.57 2.08 ± 0.14
718 P32:1 p16:0/16:1 0.52 ± 0.39 0.40 ± 0.053
762 D34:0 16:0/18:0 2.90 ± 0.34 3.80 ± 0.32*
760 D34:1 16:0/18:1 9.03 ± 0.73 9.98 ± 1.81
746 P34:1 p16:0/18:1 0.61 ± 0.28 0.52 ± 0.05
758 D34:2 16:0/18:2 20.13 ± 0.23 17.61 ± 0.16*
788 D36:1 18:0/18:1 8.11 ± 0.40 9.87 ± 0.38*
774 P36:1 p18:0/18:1 0.76 ± 0.24 6.24 ± 1.96*
782 D36:4 16:0/20:4 13.23 ± 0.42 11.41 ± 0.22*
814 D38:2 18:1/20:1 4.14 ± 0.24 2.97 ± 0.45*
812 D38:3 18:0/20:3 9.82 ± 2.05 8.70 ± 0.64
810 D38:4 18:0/20:4 23.92 ± 0.41 21.45 ± 0.87*
806 D38:6 16:0/22:6 2.42 ± 0.64 2.60 ± 0.63
834 D40:6 18:0/22:6 2.23 ± 0.68 1.78 ± 0.58
Total% 100 100P
Saturates 3.68 ± 0.58 4.39± 1.21P
Monounsat 18.52± 1.57 21.92 ±2.25P
Polyunsat 75.89± 2.55 66.52 ±2.09*P
Plas 1.89 ± 0.86 7.15± 1.84*
Values (nanomole percent by weight composition) represent means ± standard errors. Means in the same row accompanied by asterisks are significantly differentbetween treatments at LSD= 0.05, n= 12 per treatment group. D represents diacyl species and P represents plasmalogens species, p denotes a sn-1 vinyl ether(plasmalogen) linkage., Monounsat, monounsaturated fatty acids; PBS, phosphate buffered saline solution; plas, plasmalogens; polyunsat, polyunsaturated fattyacids; PPA, propionic acid. Phosphatidylcholine molecular species were identified using a precursor ion scan of m/z 184 in ESI positive mode. The lipidcomponents in the table are arranged based on the molecular species composition.
Thomas et al. Journal of Neuroinflammation 2012, 9:153 Page 10 of 18http://www.jneuroinflammation.com/content/9/1/153

SM profile. At this time, we have no suitable/conclusive ex-planation for this observed variation in brain SM profilefollowing careful perusal of the data to ensure mass spec-tral interpretation, data normalization, and calculations arecorrect to the best of our knowledge. However, a similarSM profile with saturated base predominating has beenreported previously in human retina [40].
Phospholipids are the major structural components ofneuronal and other cellular membranes, and include PC,PE, PS, PI, and SM [50,51]. All of these phospholipid classeswere observed to have altered molecular species distributionfollowing PPA infusion. It has been suggested that commonneurodevelopmental disorders such as ASD could be asso-ciated with functional deficiencies or imbalances in fatty acid
Table 7 Changes (nanomole percent by weight composition) in rat brain phosphatidylserine molecular speciesfollowing intraventricular infusion with propionic acid (PPA) and phosphate buffered saline (PBS)
Molecular weight Molecular species Diacyl species PBS PPA
760 D34:1 16:0/18:1 0.90 ± 0.10 1.10 ± 0.21
790 D36:0 18:0/18:0 1.59 ± 0.41 1.65 ± 0.11
788 D36:1 18:0/18:1 18.10 ± 0.53 21.62 ± 0.63*
786 D36:2 18:0/18:2 2.36 ± 0.34 2.55 ± 0.17
816 D38:1 18:0/20:1 1.00 ± 0.15 1.22 ± 0.19
810 D38:4 18:0/20:4 4.18 ± 0.07 4.46 ± 0.12
840 D40:3 18:0/22:3 1.19 ± 0.23 1.20 ± 0.17
838 D40:4 18:0/22:4 4.67 ± 0.17 3.63 ± 0.14*
836 D40:5 18:0/22:5 6.40 ± 0.30 6.91 ± 0.43
834 D40:6 18:0/22:6 58.39 ± 0.98 54.49 ± 1.05*
832 D40:7 18:1/22:6 1.22 ± 0.08 1.17 ± 0.12
Total% 100 100P
Saturates 1.59 ± 0.15 1.65± 0.11P
Monounsat 19.99 ± 0.39 23.93 ±0.66*P
Polyunsat 78.41 ± 0.58 74.45 ±0.55*
Values (nanomole percent by weight composition) represent means ± standard errors. Means in the same row accompanied by asterisks are significantly differentbetween treatments at LSD= 0.05, n= 12 per treatment group. D represents diacyl species. Monounsat, monounsaturated fatty acids; PBS, phosphate bufferedsaline solution; polyunsat, polyunsaturated fatty acids; PPA, propionic acid. Phosphatidylserine molecular species were identified using neutral loss scan of 87 D inESI negative mode. The lipid components in the table are arranged based on the molecular species composition.
Table 6 Changes (percent composition) in rat plasma phosphatidylinositol molecular species following intraventricularinfusion with propionic acid (PPA) and phosphate buffered saline (PBS)
Molecular weight Molecular species Diacyl/species PBS PPA
835 D34:1 16:0/18:1 6.71 ± 0.66 9.04 ± 0.39*
859 D36:3 18:1/18:2 6.16 ± 0.29 8.67 ± 0.97*
857 D36:4 16:0/20:4 8.33 ± 1.03 8.70 ± 0.85
887 D38:3 18:0/20:3 8.53 ± 0.63 7.72 ± 0.69
885 D38:4 18:0/20:4 44.00 ± 2.19 32.68 ± 3.6*
883 D38:5 18:1/20:4 6.67 ± 0.56 7.79 ± 0.28
881 D38:6 16:0/22:6 6.17 ± 0.04 7.89 ± 0.50*
913 D40:4 18:0/22:4 6.50 ± 0.60 8.47 ± 0.31*
909 D40:6 18:0/22:6 6.93 ± 0.54 9.04 ± 0.38*
Total% 100 100P
Monounsat 6.70 ± 0.66 9.03± 1.03P
Polyunsat 93.29 ± 0.66 90.96 ± 1.03
Values (nanomole percent by weight composition) represent means ± standard errors. Means in the same row accompanied by asterisks are significantly differentbetween treatments at LSD= 0.05, n= 12 per treatment group. D represents diacyl species. Monounsat, monounsaturated fatty acids; PBS, phosphate bufferedsaline solution, polyunsat, polyunsaturated fatty acids; PPA, propionic acid. Phosphatidylinositol molecular species were identified using a precursor ion scan ofm/z 241 in ESI negative mode. The lipid components in the table are arranged based on the molecular species composition.
Thomas et al. Journal of Neuroinflammation 2012, 9:153 Page 11 of 18http://www.jneuroinflammation.com/content/9/1/153

synthesis/metabolism [5,27,29,36]. Most of these formerstudies evaluated the fatty acid composition following hy-drolysis of either total or individual phospholipid classes.Alterations in specific phospholipid molecular species couldnot only contribute more specific clinical criteria, but couldalso provide a basis for mechanistic interpretations. How-ever, to date, only one study [27] has evaluated the intactphospholipid molecular species in the blood of ASDpatients. Further, these authors only analyzed PE phospho-lipid molecular species. In the present study, we evaluatedSM, PC, PE, PS, and PI molecular species following infusionwith PPA and the induction of abnormal (ASD-like) beha-viors. Alterations were observed in 21 brain and 30 bloodphospholipid molecular species. Pastural et al. [27] observedelevations in the relative proportions of plasmalogen PE,saturated, and polyunsaturated PE molecular species in theplasma of ASD patients. In our plasma analyses we alsoobserved elevations in the relative proportions of polyun-saturated PE species, but the relative reduction in plasma-logen PE was in contrast with their findings. In addition,plasma from PPA-infused rats demonstrated elevations inthe relative proportions of some saturated SM and PCmolecular species, diacyl and plasmalogen monounsatu-rated PC species, PS monounsaturated species, and somepolyunsaturated PI molecular species (36:3, 40:4, and40:6). Elevations were also observed in the proportions ofsome brain PC polyunsaturated molecular species, PSmonounsaturated, and PE plasmalogen species in thepresent study.
Analysis of SM, PC, PI, PE, PS, and PC phospholipidclasses were conducted with both brain and blood sam-ples. In many cases, the same phospholipid molecularspecies were altered in both blood and brain, but thedirection and the relative proportions of these altera-tions were not consistent between both sample types.Much of the published work demonstrating alterationsin lipid metabolism in autism has been done usingplasma obtained from ASD patients [5,27,32,36]. Thefindings from these studies include elevations in satu-rated fatty acids [27,29,30], accompanied by a decline inplasmalogens [5,29,30], mono and polyunsaturated(ω3 +ω6) fatty acids [5,29,30,32,36,52]. Conversely,others have reported elevations in the proportions ofmono and poly unsaturated fatty acids [5,27,30,53].However, the origin of these altered fatty acids and plas-malogens are unknown, because the structures of thephospholipids were destroyed by hydrolysis during sam-ple analysis. This paper is the most comprehensivestudy to date which examines intact PL molecular spe-cies alteration in relation to autism. Currently, there isno clear uniform mechanism governing the etiology andearly detection of ASD, and no accepted biomarkers areavailable. Although this study is descriptive in nature, itprovides considerably more information than is cur-rently available, and as such provides a foundation fordefining which intact phospholipid molecular speciescan be altered in relation to ASD. This could provide aframework for future studies to elucidate the mechanisms
Table 8 Changes (nanomole percent by weight composition) in rat plasma phosphatidylserine molecular speciesfollowing intraventricular infusion with propionic acid (PPA) and phosphate buffered saline (PBS)
Molecular weight Molecular species Diacyl species PBS PPA
762 D34:1 16:0/18:1 6.55 ± 0.30 7.94 ± 0.09*
792 D36:0 18:0/18:0 8.12 ± 0.57 7.62 ± 0.24
790 D36:1 18:0/18:1 9.53 ± 0.74 12.13 ± 1.21*
788 D36:2 18:0/18:2 7.81 ± 0.06 8.84 ± 0.63*
818 D38:1 18:0/20:1 7.72 ± 0.24 6.94 ± 0.63
812 D38:4 18:0/20:4 11.55 ± 1.36 11.76 ± 1.65
842 D40:3 18:0/22:3 8.64 ± 0.53 7.37 ± 0.51*
840 D40:4 18:0/22:4 7.81 ± 0.08 7.50 ± 0.35
838 D40:5 18:0/22:5 7.61 ± 0.23 7.69 ± 0.06
836 D40:6 18:0/22:6 16.67 ± 1.34 13.68 ± 0.88*
834 D40:7 18:1/22:6 7.99 ± 0.37 8.53 ± 0.19
Total% 100 100P
Saturates 8.12 ± 0.57 7.62± 0.24P
Monounsat 23.80 ± 1.76 27.02 ±1.99*P
Polyunsat 68.06 ± 0.99 65.34 ±1.18*
Values (nanomole percent by weight composition) represent means ± standard errors. Means in the same row accompanied by asterisks are significantly differentbetween treatments at LSD= 0.05, n= 12 per treatment group. D represents diacyl species. Monounsat, monounsaturated fatty acids; PBS, phosphate bufferedsaline solution; polyunsat, polyunsaturated fatty acids; PPA, propionic acid. Phosphatidylserine molecular species were identified using neutral loss scan of 185 Din ESI positive mode. The lipid components in the table are arranged based on the molecular species composition.
Thomas et al. Journal of Neuroinflammation 2012, 9:153 Page 12 of 18http://www.jneuroinflammation.com/content/9/1/153
associated with the observed lipid alterations and their re-lationship to behavioral changes in ASD.The use of an animal model allowed comparison of brain
and plasma PL during the period of PPA-induced ASD-likebehaviors. The observations that small amounts (1.04micromole/infusion) of PPA into brain can influenceplasma lipid composition are considered intriguing. How-ever, the plasma alterations noted did not correlate directlywith those in brain. It could be that this difference merelyreflects the nature of the PPA rodent model where treat-ment is limited to 8 days. Furthermore, ASD likely involvesgenetic, metabolic, and environmental factors which couldresult in systemic as well as CNS effects.It is evident from the data presented in this study that
PPA infusion produced small but significant alterations inthe composition of brain and plasma phospholipid species.
These alterations occurred independent of diet. The mostnotable alterations were observed in the composition ofbrain SM, diacyl mono and polyunsaturated PC, PI, PS, PE,and plasmalogen PC and PE molecular species. Theseobservations are considered interesting because alterationsin brain lipid composition, particularly during developmentcan potentially have serious consequences on CNS function.
Potential physiological consequences of alteredphospholipid molecular species and their relation to ASDLipid mediated signaling and neuroinflammation in ASDThe pathological consequences of disturbances in phospho-lipid metabolism could include alterations in signal trans-duction involving the generation of second messengersderived from docosahexaenoic (C22:6n3) and arachidonic(C20:4n6) acids [54]. The observation that PPA infusion
Table 9 Changes (percent composition) in rat brain phosphatidylethanolamine molecular species followingintraventricular infusion with propionic acid (PPA) and phosphate buffered saline (PBS)
Molecular weight Molecular species Plasmalogen or diacyl species PBS PPA
700 P34:1 p16:0/18:1 5.85 ± 0.15 5.10 ± 0.14*
714 D34:2 16:0/18:2 3.37 ± 0.17 3.49 ± 0.15
730 P36:0 p18:0/18:0 3.42 ± 0.13 4.03 ± 0.38
744 D36:1 18:0/18:1 3.50 ± 0.46 3.32 ± 0.37
728 P36:1 p18:0/18:1 6.00 ± 0.09 6.82 ± 0.12*
742 D36:2 18:0/18:2 3.68 ± 0.14 3.59 ± 0.35
726 P36:2 p18:0/18:2 4.79 ± 0.30 7.16 ± 0.62*
724 P36:3 p18:1/18:2 3.38 ± 0.42 2.98 ± 0.27
722 P36:4 p16:0/20:4 4.32 ± 0.12 4.43 ± 0.14
766 D38:4 18:0/20:4 6.99 ± 0.71 7.33 ± 0.62
750 P38:4 p18:0/20:4 6.07 ± 0.13 7.70 ± 0.02*
762 D38:6 16:0/22:6 4.18 ± 0.16 3.45 ± 0.15*
746 P38:6 p16:0/22:6 5.14 ± 0.45 5.11 ± 0.80
796 D40:3 18:0/22:3 3.59 ± 0.26 3.52 ± 0.43
794 D40:4 20:0/20:4 3.51 ± 0.08 3.85 ± 0.42
778 P40:4 p18:0/22:4 3.46 ± 0.26 5.00 ± 0.10*
792 D40:5 18:0/22:5 4.30 ± 0.31 3.93 ± 0.41
776 P40:5 p18:0/22:5 3.91 ± 0.69 3.79 ± 0.60
790 D40:6 18:0/22:6 11.07 ± 1.06 8.59 ± 0.36*
774 P40:6 p18:0/22:6 9.47 ± 0.21 6.82 ± 0.86*
Total% 100 100P
Saturates 3.42 ± 0.12 4.02± 0.38P
Monounsat 15.32± 0.65 15.23 ± 0.92P
Polyunsat 81.23± 0.69 80.73 ± 0.55P
Plas 55.82± 1.63 58.93 ± 1.40
Values (nanomole percent by weight composition) represent means ± standard errors. Means in the same row accompanied by asterisks are significantly differentbetween treatments at LSD= 0.05, n= 12 per treatment group. D represents diacyl species and P represents plasmalogens species, p denotes a sn-1 vinyl ether(plasmalogen) linkage. Monounsat, monounsaturated fatty acids; PBS, phosphate buffered saline solution; plas, plasmalogens; polyunsat, polyunsaturated fattyacids; PPA, propionic acid. Phosphatidylethanolamine molecular species were identified using a precursor ion scan of m/z 196 in ESI negative mode. The lipidcomponents in the table are arranged based on the molecular species composition.
Thomas et al. Journal of Neuroinflammation 2012, 9:153 Page 13 of 18http://www.jneuroinflammation.com/content/9/1/153

increased the proportions of brain PI and PC molecularspecies containing arachidonic acid and decreased the pro-portions of PS and PE molecular species with docosahexae-noic acid, suggests that PPA could influence the innateneuroinflammatory process observed in autism. Metabol-ism of arachidonic and docosahexaenoic acids releasedfrom the sn-2 position of the glycerol moiety by phospho-lipase A2 results in the formation of eicosanoids anddocosanoids, respectively [54]. Both eicosanoids and doco-sanoids are potent modulators of the inflammatory re-sponse system. Eicosanoids are inflammatory mediatorsthat induce the formation of proinflammatory cytokinessuch as tumor necrosis factor (TNF), interleukin 1 (IL-1),and interleukin 6 (IL-6). Elevated levels of TNF, IL-1, andIL-6 have been reported in plasma of ASD patients [28].Docosanoids on the other hand are antiflammatory andinclude protectins and resolvins that have known
neuroprotective effects [54]. There is now emerging evi-dence that autism may be accompanied by abnormalitiesin the inflammatory response system [28], and that thisabnormality may be related to the increases in oxidativestress [55-57], innate neuroinflammation [58], and alteredlipid profiles [5,27,30,32,53] reported in ASD.The increased accumulation of brain molecular species
with the eicosanoids precursor (arachidonic acid), and thereduced proportions of the molecular species containingthe docosanoids precursor (docosahexaenoic acid) observedin this study are interesting, considering the increased in-nate neuroinflammation (reactive astrogliosis and activatedmicroglia) previously observed with this model [7] andreported for the brain of ASD patients at autopsy [58].Several of the studies analyzing the hydrolyzed fatty acid
components obtained from the blood of ASD patients alsoreport alterations in the proportions of arachidonic and
Table 10 Changes (nanomole percent by weight composition) in rat plasma phosphatidylethanolamine molecularspecies following intraventricular infusion with propionic acid (PPA) and phosphate buffered saline (PBS)
Molecular weight Molecular species Plasmalogen or diacyl species PBS PPA
702 P34:1 p16:0/18:1 4.59 ± 0.43 3.51 ± 0.53
716 D34:2 16:0/18:2 4.42 ± 0.13 4.41 ± 0.66
732 P36:0 p18:0/18:0 4.39 ± 0.19 3.11 ± 0.41*
746 D36:1 18:0/18:1 4.55 ± 0.44 3.38 ± 0.49*
730 P36:1 p18:0/18:1 5.76 ± 0.56 3.57 ± 0.50 *
744 D36:2 18:0/18:2 5.20 ± 0.58 4.49 ± 0.55
728 P36:2 p18:0/18:2 3.10 ± 1.36 3.19 ± 0.26
726 P36:3 p18:1/18:2 4.28 ± 0.19 3.85 ± 0.36
724 P36:4 p16:0/20:4 4.47 ± 0.42 3.41 ± 0.46*
768 D38:4 18:0/20:4 10.82 ± 0.71 23.60 ± 4.93*
752 P38:4 p18:0/20:4 4.67 ± 0.06 3.70 ± 0.45*
764 D38:6 16:0/22:6 5.35 ± 0.21 7.02 ± 0.56*
748 P38:6 p16:0/22:6 4.87 ± 0.38 3.71 ± 0.64
798 D40:3 18:0/22:3 4.27 ± 0.34 3.92 ± 0.68
796 D40:4 20:0/20:4 4.78 ± 0.29 3.67 ± 0.62
780 P40:4 p18:0/22:4 4.06 ± 0.17 3.41 ± 0.34
794 D40:5 18:0/22:5 4.97 ± 0.35 4.07 ± 0.32
778 P40:5 p18:0/22:5 4.67 ± 0.27 3.76 ± 0.83
792 D40:6 18:0/22:6 5.89 ± 0.62 7.03 ± 1.63
776 P40:6 p18:0/22:6 4.80 ± 0.33 3.54 ± 0.69*
Total% 100 100P
Saturates 4.39 ± 0.19 3.11± 0.41*P
Monounsat 14.92± 0.39 10.46 ±1.46*P
Polyunsat 80.68± 0.43 86.41 ±1.81*P
Plas 49.69± 0.96 38.37 ±3.81*
Values (nanomole percent by weight composition) represent means ± standard errors. Means in the same row accompanied by asterisks are significantly differentbetween treatments at LSD= 0.05, n= 12 per treatment group. D represents diacyl species and P represents plasmalogens species, p denotes a sn-1 vinyl ether(plasmalogen) linkage. Monounsat, monounsaturated fatty acids; PBS, phosphate buffered saline solution, plas, plasmalogens; polyunsat, polyunsaturated fattyacids; PPA, propionic acid. Phosphatidylethanolamine molecular species were identified using neutral loss scan of 141 D in ESI positive mode. The lipidcomponents in the table are arranged based on the molecular species composition.
Thomas et al. Journal of Neuroinflammation 2012, 9:153 Page 14 of 18http://www.jneuroinflammation.com/content/9/1/153

docosahexaenoic acids [27,29,32,36]. This could indicateaberrations in fatty acid elongation and desaturation mayoccur in the etiology of ASD. Arachidonic and docosahex-aenoic acids are cleaved from the sn-2 position of the gly-cerol moiety by phospholipase A2. Genetic sites linked toautism on chromosome 8q22 are in the proximity of thegene (8q24) for secretory phospholipase A2 [36]. Collect-ively, these findings suggest possible involvements of ara-chidonate, docosahexaenoate, and phospholipase A2 in thesignal cascade associated with the innate neuroinflamma-tion observed in ASD.
Membrane fluidity and stabilityBiological membranes are predominantly bilayers in whichthe inner and outer leaflets have different phospholipidcompositions. In contrast, blood plasma phospholipids arepresent as monolayers, sourrounding lipoproteins, and the ef-fect of fluidity on lipoprotein function is not well understood.Here we will refer to both cellular bilayers and blood lipopro-tein monolayers collectively as ‘membranes’. Phospholipidmolecular species distribution influences bilayer physicalproperties such as fluidity and this affects membrane pro-tein function. Monolayer molecular species compositionalso affects physical properties. Organisms can adjust theorder or fluidity of their cellular membranes in response tochanges in their physiological environment by altering theirlipid composition [50]. Alterations in brain and bloodphospholipid composition consistent with an adjustmentin the order or fluidity of the membrane in these tissues inresponse to PPA infusions were observed in this study.This adjustment was reflected by changes in the relativeproportions of unsaturated, diacyl, and/or plasmalogenspecies. Alterations in desaturation can have profoundchanges on membrane fluidity because increased carbon-carbon double bonds make unsaturated fatty acids moremobile, flexible, and fluid [50]. Changes in the relative pro-portions and the composition of diacyl and plasmalogenforms of phospholipids can also impact the fluidity of themembrane. For example, plasmalogen species facilitatemembrane fusion six times faster than diacyl species [59].Phosphatidylcholine, which has a large polar head group
does not pack closely in membrane bilayers and tends tobe more fluid compared to PE, which has a small headgroup and packs more closely in membranes, making themless fluid at physiological temperatures. The PC/PE balancein cell membranes is thought to regulate membrane fluid-ity and stabilize the membrane [50,60]. In both brain andblood membranes, PPA infusions alter the PC and PEcomposition (both diacyl and plasmalogen forms) possiblydisrupting this balance. Alterations in brain membranelipid composition affecting fluidity have been found to beassociated with a number of behavioral abnormalities, aswell as neurological and psychiatric disorders in bothadults and children [61]. Alterations in membrane fluidity
affect membrane properties, which in turn can affect thefunctions of integral membrane proteins, ion channels andthe permeability of solutes across the membrane [54]. It isunclear at this preliminary stage whether or not any ofthese processes are affected by PPA infusion in this model,or if they are related to the etiology of ASD. These are thesubjects of further studies in our laboratory.
Lipid oxidation/peroxisomal functionPlasmalogens are vinyl ether lipids found in PE, PC and PS.Several studies have reported increases [27] or declines[5,29,30] in plasmalogens obtain from the bloods of ASDpatients. Typically plasmalogens have docosahexaenoic orarachidonic acids esterified in the sn-2 position of the glycerolmoiety, and are essential for normal brain development andfunctions. Reduced plasmalogens and docosahexaenoic acidlevels are characteristic of peroxisomal-associated neuro-logical disorders such as infantile Refsum disease, adreno-leukodystrophy, adrenomyeloneuropathy, and Zellweger’ssyndrome [5,27,59]. The only study we know that analyzedthe intact PE molecular species of blood obtained from ASDpatients observed an overall increase in PE plasmalogens spe-cies, and this increase was accompanied by an increase indocosahexaenoic acid containing molecular species [27]. Inour rat model, we observed an overall reduction in the rela-tive proportions of PE plasmalogens in plasma, inclusive ofspecies with docosahexaenoic acid at the sn-2 position of theglycerol moiety. However, consistent with [27], elevated pro-portions of PE polyunsaturated diacyl species were observedin plasma, inclusive of docosahexaenoate containing species.In brain, a reduction in the relative proportions of diacyl
and plasmalogen PE molecular species containing docosa-hexaenoic acid was observed in this study following PPAinfusion. This was accompanied by a relative increase inseveral other PE plasmalogen molecular species lackingdocosahexaenoic acid in the sn-2 position of the glycerolmoiety. Plasmalogens act as a reservoir for docosahexae-noic acid, and both compounds have synthetic steps thatoccur in the peroxisome, providing a biochemical link [5].Peroxisomal disorders are characterized by abnormal per-oxisomal biogenesis associated with altered functionality ofthe two rate limiting enzymes in plasmalogen synthesis,acyl-coenzyme A (CoA): dihydroxyacetonephosphate acyl-transferase and alkyldihydoxyacetonephosphate synthase[36,59]. It appears from the findings presented in this studyand those from previous reports [5,27,29,30,52] that aber-rations in plasmalogen metabolism may occur in ASD, im-plying that peroxisomal dysfunction could be involved.Plasmalogens are considered endogenous antioxidants,
because their vinyl ether bonds are efficient neutralizers ofreactive oxygen species, which damage the polyunsaturatedfatty acids present in the sn-2 position of plasmalogen phos-pholipids [62]. The alterations observed in plasmalogen mo-lecular species in relation to the alterations in brain and
Thomas et al. Journal of Neuroinflammation 2012, 9:153 Page 15 of 18http://www.jneuroinflammation.com/content/9/1/153

blood polyunsaturated PE and PC molecular species, maybe a response to increase oxidation following PPA infusions.This is very interesting because oxidative damage of lipidshas been suggested to play a part in the pathogenesis ofmany neurological diseases including autism [26,55]. Inaddition, increased oxidative stress, and decreased antioxi-dant capacity have been previously reported in this rodentmodel [7,8], and also found to be present in ASD patients[55-57]. Interestingly, oxidative damage has been shown touncouple the gap junctions in astrocytes [63,64]. Arachi-donic and docosahexaenoic acids which are very susceptibleto oxidative damage have been shown to modulate thecoupling capacity of gap junctions [65-67]. In this study,PPA infusion led to alterations in the proportions of brainarachidonic and docosahexaenoic acids containing molecu-lar species.Collectively, the findings presented in this study, along
with those observed in the blood of ASD patients; indicatethat alterations in peroxisomal associated lipid metabolismand increased oxidative stress, possibly predisposing poly-unsaturated fatty acids to oxidative damage may be asso-ciated with the pathogenesis of ASD.
ConclusionInfusions with PPA-induced abnormal (ASD-like) behaviorsin rodents consistent with previous studies. This inductionin abnormal behaviors was accompanied by alterations inseveral brain and blood SM, PC, PS, PE, and PI molecularspecies. Alterations in lipid composition are known to affectmembrane fluidity, peroxisomal functions, gap junctioncoupling capacity, and signaling during neuroinflammation,which may be associated with the pathogenesis of ASD, atleast in a subset of patients. The mechanisms governingthese findings and their potential relevance to the patho-physiology of ASD, particularly during development, is thesubject of further studies in our laboratory. Finally, thesePPA-induced alterations of brain and plasma phospholipidmolecular species provide further validation of this rodentmodel as a useful tool to link the disparate behavioral, cen-tral nervous system, and systemic findings with a plausibleenvironmental factor in ASD.
AbbreviationsASD: Autism spectrum disorder; BUT: Butyric acid; CNS: Central nervoussystem; ESI: MS electrospray ionization mass spectrometry;ICV: Intracerebroventricular; PBS: Phosphate buffered saline;PC: Phosphatidylcholine; PE: Phosphatidylethanolamine;PI: Phosphatidylinositol; PPA: Propionic acid; PS: Phosphatidylserine;PUFA: Polyunsaturated fatty acids; SM: Sphingomyelin.
Competing interestsThe authors declare no conflict of interest.
Authors’ contributionsRHT designed and conducted the experiments for the lipid component ofthe study and wrote the manuscript. MMM designed and conducted theexperiments for the behavioral component of the study and assisted inediting the manuscript. JRM assisted with lipid and data analysis and editing
the manuscript. LT assisted with surgery and editing the manuscript. FP co-supervised the study, assisted with interpretations and editing themanuscript. SL assisted with electrospray analysis and editing themanuscript. DFM supervised the study and assisted with editing themanuscript. All authors discussed the results/ implications, commented onthe manuscript at all stages; read and approved the final manuscript.
AcknowledgementsThe authors would like to thank Miss Lisa Huyhn, for her assistance with dataentry. The authors would also like to thank Dr Christopher Guglielmo(Department of Biology, UWO) for his contribution to data interpretation andthe use of his laboratory space and equipment. This research was supportedby contributions from Goodlife Children’s Foundation and Autism ResearchInstitute Foundation to Derrick MacFabe. We extend our heartfelt gratitudeto David Patchell-Evans and Kilee Patchell-Evans.
Author details1The Kilee Patchell-Evans Autism Research Group, Department of Psychology,University of Western Ontario, London, ON N6A 5C2, Canada. 2Departmentof Obstetrics/Gynecology and Biochemistry, University of Western Ontario,London Health Sciences Center, London, ON, Canada. 3Biological MassSpectrometry Laboratory, Department of Biochemistry, University of WesternOntario, London, ON, Canada.
Received: 8 February 2012 Accepted: 29 May 2012Published: 2 July 2012
References1. Amminger GP, Berger GE, Schafer MR, Klier C, Friedrich MH, Feucht M:
Omega-3 fatty acids supplementation in children with autism: adouble-blind randomized, placebo-controlled pilot study. Biol Psychiatry2007, 61:551–553.
2. Finegold SM, Molitoris D, Song Y, Liu C, Vaisanen ML, Bolte E, McTeague M,Sandler R, Wexler H, Marlowe EM, Collins MD, Lawson PA, Summanen P,Baysallar M, Tomzynski TJ, Read E, Johnson E, Rolfe R, Nasir P, Shah H, HaakeDA, Manning P, Kaul A: Gastrointestinal microflora studies in late-onsetautism. Clin Infect Dis 2002, 35:S6–S16.
3. Hu VW, Frank BC, Heine S, Lee NH, Quackenbush J: Gene expressionprofiling of lymphoblastoid cell lines from monozygotic twins discordantin severity of autism reveals differential regulation of neurologicallyrelevant genes. BMC Genomics 2006, 7:118.
4. Sarachana T, Zhou R, Chen G, Manji HK, Hu VW: Investigation ofpost-transcriptional gene regulatory networks associated with autismspectrum disorders by microRNA expression profiling of lymphoblastoidcell lines. Genome Med 2010, 2:23.
5. Wiest MM, German JB, Harvey DJ, Watkins SM, Hertz-Picciotto I: Plasmafatty acid profiles in autism: a case–control study. Prostaglandins LeukotEssent Fatty Acids 2009, 80:221–227.
6. Zerrate MC, Pletnikov M, Connors SL, Vargas DL, Seidler FJ, Zimmerman AW,Slotkin TA, Pardo CA: Neuroinflammation and behavioral abnormalitiesafter neonatal terbutaline treatment in rats: implications for autism.J Pharmacol Exp Ther 2007, 322:16–22.
7. MacFabe DF, Cain DP, Rodriguez-Capote K, Franklin AE, Hoffman JE, Boon F,Taylor AR, Kavaliers M, Ossenkopp KP: Neurobiological effects ofintraventricular propionic acid in rats: possible role of short chain fattyacids on the pathogenesis and characteristics of autism spectrumdisorders. Behav Brain Res 2007, 176:149–169.
8. MacFabe DF, Rodriguez-Capote K, Hoffman JE, Franklin AE, Mohammad-Asef Y,Taylor A, Boon F, Cain DP, Kavaliers M, Possmayer F, Ossenkopp KP: A novelrodent model of autism: Intraventricular infusions of propionic acidincrease locomotor activity and induce neuroinflammation and oxidativestress in discrete regions of adult rat brain. Am J Biochem & Biotech. 2008,4:146–166.
9. MacFabe DF, Cain NE, Boon F, Ossenkopp KP, Cain DP: Effects of theenteric bacterial metabolic product propionic acid on object-directedbehavior, social behavior, cognition, and neuroinflammation inadolescent rats: Relevance to autism spectrum disorder. Behav Brain Res2010, 217:47–54.
10. Shultz SR, MacFabe DF, Martin S, Jackson J, Taylor R, Boon F, Ossenkopp KP,Cain DP: Intracerebroventricular injections of the enteric bacterialmetabolic product propionic acid impair cognition and sensorimotor
Thomas et al. Journal of Neuroinflammation 2012, 9:153 Page 16 of 18http://www.jneuroinflammation.com/content/9/1/153

ability in the Long-Evans rat: further development of a rodent model ofautism. Behav Brain Res 2009, 200:33–41.
11. Shultz SR, MacFabe DF, Ossenkopp KP, Scratch S, Whelan J, Taylor R, Cain DP:Intracerebroventricular injection of propionic acid, an enteric bacterialmetabolic end-product, impairs social behavior in the rat: implications foran animal model of autism. Neuropharmacology 2008, 54:901–911.
12. Thomas RH, Foley KA, Mepham JR, Tichenoff LJ, Possmayer F, MacFabe DF:Altered brain phospholipid and acylcarnitine profiles in propionic acidinfused rodents: further development of a potential model of autismspectrum disorders. J Neurochem 2010, 113:515–529.
13. Mortensen PB, Clausen MR: Short-chain fatty acids in the human colon:relation to gastrointestinal health and disease. Scand J Gastroenterol Suppl1996, 216:132–148.
14. Finegold SM, Dowd SE, Gontcharova V, Liu C, Henley KE, Wolcott RD, Youn E,Summanen PH, Granpeesheh D, Dixon D, Liu M, Molitoris DR, Green JA III:Pyrosequencing study of fecal microflora of autistic and control children.Anaerobe 2010, 16:444–453.
15. Brock M, Buckel W: On the mechanism of action of the antifungal agentpropionate. Eur J Biochem 2004, 271:3227–3241.
16. Wajner M, Latini A, Wyse AT, Dutra-Filho CS: The role of oxidative damagein the neuropathology of organic acidurias: insights from animal studies.J Inherit Metab Dis 2004, 27:427–448.
17. Conn AR, Fell DI, Steele RD: Characterization of alpha-keto acid transportacross blood–brain barrier in rats. Am J Physiol 1983, 245:E253–E260.
18. Karuri AR, Dobrowsky E, Tannock IF: Selective cellular acidification andtoxicity of weak organic acids in an acidic microenvironment. Br J Cancer1993, 68:1080–1087.
19. Rorig B, Klausa G, Sutor B: Intracellular acidification reduced gap junctioncoupling between immature rat neocortical pyramidal neurones.J Physiol 1996, 490:31–49.
20. DeCastro M, Nankova BB, Shah P, Patel P, Mally PV, Mishra R, La Gamma EF:Short chain fatty acids regulate tyrosine hydroxylase gene expressionthrough a cAMP-dependent signaling pathway. Brain Res Mol Brain Res2005, 142:28–38.
21. Maurer MH, Canis M, Kuschinsky W, Duelli R: Correlation between localmonocarboxylate transporter 1 (MCT1) and glucose transporter 1(GLUT1) densities in the adult rat brain. Neurosci Lett 2004, 355:105–108.
22. Nakao S, Moriya Y, Furuyama S, Niederman R, Sugiya H: Propionic acidstimulates superoxide generation in human neutrophils. Cell Biol Int 1998,22:331–337.
23. Hara H, Haga S, Aoyama Y, Kiriyama S: Short-chain fatty acids suppresscholesterol synthesis in rat liver and intestine. J Nutr 1999, 129:942–948.
24. Le Poul E, Loison C, Struyf S, Springael JY, Lannoy V, Decobecq ME, Brezillon S,Dupriez V, Vassart G, Van Damme J, Parmentier M, Detheux M: Functionalcharacterization of human receptors for short chain fatty acids and their rolein polymorphonuclear cell activation. J Biol Chem 2003, 278:25481–25489.
25. Parab S, Nankova BB, La Gamma EF: Differential regulation of the tyrosinehydroxylase and enkephalin neuropeptide transmitter genes in rat PC12cells by short chain fatty acids: concentration-dependent effects ontranscription and RNA stability. Brain Res 2007, 1132:42–50.
26. Frye RE, Rossignol DA: Mitochondrial dysfunction can connect the diversemedical symptoms associated with autism spectrum disorders. PediatrRes 2011, 69:41R–47R.
27. Pastural E, Ritchie S, Lu Y, Jin W, Kavianpour A, Khine Su-Myat K, Heath D,Wood PL, Fisk M, Goodenowe DB: Novel plasma phospholipidbiomarkers of autism: Mitochondrial dysfunction as a putativecausative mechanism. Prostaglandins Leukot Essent Fatty Acids 2009,81:253–264.
28. Tamiji J, Crawford DA: The neurobiology of lipid metabolism in autismspectrum disorders. Neurosignals 2010, 18:98–112.
29. Bell JG, MacKinlay EE, Dick JR, MacDonald DJ, Boyle RM, Glen AC: Essentialfatty acids and phospholipase A2 in autistic spectrum disorders.Prostaglandins Leukot. Essent Fatty Acids 2004, 71:201–204.
30. Bell JG, Sargent JR, Tocher DR, Dick JR: Red blood cell fatty acidcompositions in a patient with autistic spectrum disorder: acharacteristic abnormality in neurodevelopmental disorders?Prostaglandins Leukot. Essent Fatty Acids 2000, 63:21–25.
31. Richardson AJ: Clinical trials of fatty acid treatment in ADHD, dyslexia,dyspraxia and the autistic spectrum. Prostaglandins Leukot Essent FattyAcids 2004, 70:383–390.
32. Vancassel S, Durand G, Barthelemy C, Lejeune B, Martineau J, Guilloteau D,Andres C, Chalon S: Plasma fatty acid levels in autistic children.Prostaglandins Leukot Essent Fatty Acids 2001, 65:1–7.
33. Brugger B, Erben G, Sandhoff R, Wieland FT, Lehmann WD: Quantitativeanalysis of biological membrane lipids at the low picomole level bynano-electrospray ionization tandem mass spectrometry. Proc Natl AcadSci U S A 1997, 94:2339–2344.
34. Postle AD, Heeley EL, Wilton DC: A comparison of the molecular speciescompositions of mammalian lung surfactant phospholipids. CompBiochem Physiol A Mol Integr Physiol 2001, 129:65–73.
35. Pulfer M, Murphy RC: Electrospray mass spectrometry of phospholipids.Mass Spectrom Rev 2003, 22:332–364.
36. Meguid NA, Atta HM, Gouda AS, Khalil RO: Role of polyunsaturated fattyacids in the management of Egyptian children with autism. Clin Biochem2008, 41:1044–1048.
37. Paxinos G, Watson C: The Rat Brain in Stereotaxic Coordinates. Montreal:Academic Press; 1986.
38. Folch J, Lees M, Sloane Stanley GH: A simple method for the isolation andpurification of total lipides from animal tissues. J Biol Chem 1957,226:497–509.
39. Sherma J, Fried B: Handbook of Thin Layer Chromatography. New York, NY:Marcel and Dekker; 2003:pp. ii-991.
40. Deeley JM, Mitchell TW, Wei X, Korth J, Nealon JR, Blanksby SJ, Truscott RJ:Human lens lipids differ markedly from those of commonly usedexperimental animals. Biochim Biophys Acta 2008, 1781:288–298.
41. Volkmar FR, Lord C, Bailey A, Schultz RT, Klin A: Autism and pervasivedevelopmental disorders. J Child Psychol Psychiatry 2004, 45:135–170.
42. Cannizzaro C, Monastero R, Vacca M, Martire M: [3 H]-DA release evokedby low pH medium and internal H + accumulation in rat hypothalamicsynaptosomes: involvement of calcium ions. Neurochem Int 2003, 43:9–17.
43. Remblier C, Pontcharraud R, Tallineau C, Piriou A, Huguet F: Lactic acid-induced increase of extracellular dopamine measured by microdialysis inrat striatum: evidence for glutamatergic and oxidative mechanisms. BrainRes 1999, 837:22–28.
44. Severson CA, Wang W, Pieribone VA, Dohle CI, Richerson GB: Midbrainserotonergic neurons are central pH chemoreceptors. Nat Neurosci 2003,6:1139–1140.
45. Bronstein JM, Farber DB, Wasterlain CG: Regulation of type-II calmodulinkinase: functional implications. Brain Res Rev 1993, 18:135–147.
46. Nakao S, Fujii A, Niederman R: Alteration of cytoplasmic Ca2+ in restingand stimulated human neutrophils by short-chain carboxylic acids atneutral pH. Infect Immun 1992, 60:5307–5311.
47. Fukuchi M, Nii T, Ishimaru N, Minamino A, Hara D, Takasaki I, Tabuchi A,Tsuda M: Valproic acid induces up- or down-regulation of geneexpression responsible for the neuronal excitation and inhibition in ratcortical neurons through its epigenetic actions. Neurosci Res 2009,65:35–43.
48. Bayir H, Tyurin VA, Tyurina YY, Viner R, Ritov V, Amoscato AA, Zhao Q,Zhang XJ, Janesko-Feldman KL, Alexander H, Basova LV, Clark RS, Kochanek PM,Kagan VE: Selective early cardiolipin peroxidation after traumatic braininjury: an oxidative lipidomics analysis. Ann Neurol 2007,62:154–169.
49. Little SJ, Lynch MA, Manku M, Nicolaou A: Docosahexaenoic acid-inducedchanges in phospholipids in cortex of young and aged rats: a lipidomicanalysis. Prostaglandins Leukot Essent Fatty Acids 2007, 77:155–162.
50. Hon GM, Hassan MS, van Rensburg SJ, Abel S, van JP, Erasmus RT, Matsha T:Red blood cell membrane fluidity in the etiology of multiple sclerosis.J Membr Biol 2009, 232:25–34.
51. Kakela R, Somerharju P, Tyynela J: Analysis of phospholipid molecularspecies in brains from patients with infantile and juvenile neuronal-ceroid lipofuscinosis using liquid chromatography-electrosprayionization mass spectrometry. J Neurochem 2003, 84:1051–1065.
52. Bu B, Ashwood P, Harvey D, King IB, Water JV, Jin LW: Fatty acidcompositions of red blood cell phospholipids in children with autism.Prostaglandins Leukot Essent Fatty Acids 2006, 74:215–221.
53. Sliwinski S, Croonenberghs J, Christophe A, Deboutte D, Maes M:Polyunsaturated fatty acids: do they have a role in the pathophysiologyof autism? Neuro Endocrinol Lett 2006, 27:465–471.
54. Farooqui AA, Ong WY, Horrocks LA: Biochemical aspects ofneurodegeneration in human brain: involvement of neural membrane
Thomas et al. Journal of Neuroinflammation 2012, 9:153 Page 17 of 18http://www.jneuroinflammation.com/content/9/1/153
phospholipids and phospholipases A2. Neurochem Res 2004, 29:1961–1977.
55. Chauhan A, Chauhan V: Oxidative stress in autism. Pathophysiology 2006,13:171–181.
56. Chauhan A, Chauhan V, Brown WT, Cohen I: Oxidative stress in autism:increased lipid peroxidation and reduced serum levels of ceruloplasminand transferrin–the antioxidant proteins. Life Sci 2004, 75:2539–2549.
57. Chauhan V, Chauhan A, Cohen IL, Brown WT, Sheikh A: Alteration inamino-glycerophospholipids levels in the plasma of children withautism: a potential biochemical diagnostic marker. Life Sci 2004, 74:1635–1643.
58. Vargas DL, Nascimbene C, Krishnan C, Zimmerman AW, Pardo CA:Neuroglial activation and neuroinflammation in the brain of patientswith autism. Ann Neurol 2004, 57:67–81.
59. Farooqui AA, Horrocks LA: Plasmalogens, phospholipase A(2), anddocosahexaenoic acid turnover in brain tissue. J Mol Neurosci 2001,16:263–272.
60. Allen HG, Allen JC, Boyd LC, ston-Mills BP, Fenner GP: Determination ofmembrane lipid differences in insulin resistant diabetes mellitus type 2in whites and blacks. Nutrition 2006, 22:1096–1102.
61. Schuchardt JP, Huss M, Stauss-Grabo M, Hahn A: Significance of long-chainpolyunsaturated fatty acids (PUFAs) for the development and behaviourof children. Eur J Pediatr 2009, 169:149–164.
62. Gorgas K, Teigler A, Komljenovic D, Just WW: The ether lipid-deficientmouse: tracking down plasmalogen functions. Biochim Biophys Acta 2006,1763:1511–1526.
63. Dommels YE, Alink GM, Linssen JP, van OB: Effects of n-6 and n-3polyunsaturated fatty acids on gap junctional intercellularcommunication during spontaneous differentiation of the human colonadenocarcinoma cell line Caco-2. Nutr Cancer 2002, 42:125–130.
64. Martinez AD, Saez JC: Regulation of astrocyte gap junctions by hypoxia-reoxygenation. Brain Res Brain Res Rev 2000, 32:250–258.
65. Aylsworth CF, Trosko JE, Welsch CW: Influence of lipids on gap-junction-mediated intercellular communication between Chinese hamster cellsin vitro. Cancer Res 1986, 46:4527–4533.
66. Champeil-Potokar G, Chaumontet C, Guesnet P, Lavialle M, Denis I:Docosahexaenoic acid (22:6n-3) enrichment of membrane phospholipidsincreases gap junction coupling capacity in cultured astrocytes. Eur JNeurosci 2006, 24:3084–3090.
67. Rouach N, Avignone E, Meme W, Koulakoff A, Venance L, Blomstrand F,Giaume C: Gap junctions and connexin expression in the normal andpathological central nervous system. Biol Cell 2002, 94:457–475.
doi:10.1186/1742-2094-9-153Cite this article as: Thomas et al.: The enteric bacterial metabolitepropionic acid alters brain and plasma phospholipid molecular species:further development of a rodent model of autism spectrum disorders.Journal of Neuroinflammation 2012 9:153.
Submit your next manuscript to BioMed Centraland take full advantage of:
• Convenient online submission
• Thorough peer review
• No space constraints or color figure charges
• Immediate publication on acceptance
• Inclusion in PubMed, CAS, Scopus and Google Scholar
• Research which is freely available for redistribution
Submit your manuscript at www.biomedcentral.com/submit
Thomas et al. Journal of Neuroinflammation 2012, 9:153 Page 18 of 18http://www.jneuroinflammation.com/content/9/1/153