Embed Size (px)
Citation preview
Cui et al. Proteome Science 2013, 11:13http://www.proteomesci.com/content/11/1/13
RESEARCH Open Access
Profiling and annotation of human kidneyglomerulus proteomeZenyui Cui1, Yutaka Yoshida1*, Bo Xu1, Ying Zhang1, Masaaki Nameta1, Sameh Magdeldin1,2, Tomoo Makiguchi1,Toshikazu Ikoma1, Hidehiko Fujinaka1,3, Eishin Yaoita1 and Tadashi Yamamoto1
Abstract
Background: The comprehensive analysis of human kidney glomerulus we previously performed using highlypurified glomeruli, provided a dataset of 6,686 unique proteins representing 2,966 distinct genes. This dataset,however, contained considerable redundancy resulting from identification criteria under which all the proteinsmatched with the same set of peptides and its subset were reported as identified proteins. In this study wereanalyzed the raw data using the Mascot search engine and highly stringent criteria in order to select proteinswith the highest scores matching peptides with scores exceeding the “Identity Threshold” and one or more uniquepeptides. This enabled us to exclude proteins with lower scores which only matched the same set of peptides or itssubset. This approach provided a high-confidence, non-redundant dataset of identified proteins for extensiveprofiling, annotation, and comparison with other proteome datasets that can provide biologically relevantknowledge of glomerulus proteome.
Results: Protein identification using the Mascot search engine under highly stringent, computational strategygenerated a non-redundant dataset of 1,817 proteins representing 1,478 genes. These proteins were represented by2-D protein array specifying observed molecular weight and isoelectric point range of identified proteins todemonstrate differences in the observed and calculated physicochemical properties. Characteristics of glomerulusproteome could be illustrated by GO analysis and protein classification. The depth of proteomic analysis was welldocumented via comparison of the dynamic range of identified proteins with other proteomic analyses of humanglomerulus, as well as a high coverage of biologically important pathways. Comparison of glomerulus proteomewith human plasma and urine proteomes, provided by comprehensive analysis, suggested the extent andcharacteristics of proteins contaminated from plasma and excreted into urine, respectively. Among the latterproteins, several were demonstrated to be highly or specifically localized in the glomerulus by cross-referenceanalysis with the Human Protein Atlas database, and could be biomarker candidates for glomerular injury.Furthermore, comparison of ortholog proteins identified in human and mouse glomeruli suggest some biologicallysignificant differences in glomerulus proteomes between the two species.
Conclusions: A high-confidence, non-redundant dataset of proteins created by comprehensive proteomic analysiscould provide a more extensive understanding of human glomerulus proteome and could be useful as a resourcefor the discovery of biomarkers and disease-relevant proteins.
Keywords: Human glomerulus proteome, Human plasma proteome, Human urine proteome, Mouse glomerulusproteome, Cross-reference analysis, Bioinformatics, Biomarkers
* Correspondence: [email protected] of Structural Pathology, Institute of Nephrology, GraduateSchool of Medical and Dental Sciences, Niigata University, Niigata, JapanFull list of author information is available at the end of the article
© 2013 Cui et al.; licensee BioMed Central Ltd. This is an Open Access article distributed under the terms of the CreativeCommons Attribution License (http://creativecommons.org/licenses/by/2.0), which permits unrestricted use, distribution, andreproduction in any medium, provided the original work is properly cited.
Cui et al. Proteome Science 2013, 11:13 Page 2 of 12http://www.proteomesci.com/content/11/1/13
BackgroundThe glomerulus is the site of plasma filtration and produc-tion of primary urine in the kidney. Not only does theglomerulus play a pivotal role in the ultrafiltration ofplasma into urine but it is also the locus of kidney diseaseswhich often progress to chronic renal failure. The diagno-sis and treatment of glomerular diseases are now based onclinical manifestations, urinary protein excretion level,and the renal pathology of needle biopsy specimens. Thecellular and matrix architecture of the glomeruli of biopsyspecimens have been mapped in detail, providing a basisfor diagnosis, classification, and clinical treatment deci-sions. In contrast to the detailed information aboutmorphological changes in the glomerulus, the molecularcomposition of the glomerulus and how it changes withthe progress of the diseases are still obscure. Identificationand characterization of biomarkers and proteins relevantto the onset and progress of diseases, therefore, are of highpriority, as they would allow better disease classification,detection, and prognosis. Proteomic analysis of the glom-erulus could be the most straightforward approach towarddiscovery of disease-related proteins [1], while most effortsof proteomic analyses have been focused on urine [2,3].We have previously analyzed glomeruli purified from
kidney cortex with no apparent pathological manifesta-tions in order to compile an in-depth profile of the normalhuman glomerulus proteome as a resource for clinicalresearch [4]. The large-scale shotgun proteomic analysisprovided a dataset of 6,686 identified proteins representing2,966 distinct genes. The dataset, however, contained con-siderable redundancy: proteins produced by alternativesplicing of primary mRNAs from the same gene and pro-teins produced from gene families containing highly con-servative regions of nucleotide or amino acid sequencesare included in the dataset. These proteins were generallyidentified with lower score and arose from both bioinfor-matics and biological redundancy because all the proteinsmatched with the same set of peptides or its subsets werereported as identified proteins. Redundancy is unavoidablein peptide-based protein identification in mass spectrom-etry, i.e., bottom-up or shotgun analysis. Although wecould not exclude the actual presence of these proteins,the redundant dataset obviously contained many ambigu-ously identified proteins as explained above, and couldconsiderably affect profiling and annotation of proteomeunder analysis.In the present study, we reanalyzed raw data obtained in
our previous, large-scale proteomic analysis to generate ahigh-confidence, non-redundant dataset of identified pro-teins by using the Mascot search engine and highly strin-gent, computational strategy for extensive profiling andannotation of the normal human glomerulus proteome[5]. The identified proteins were represented by 2-D pro-tein array specifying actual molecular weight (Mw) and
isoelectric point (pI) range to demonstrate differences inthe observed and calculated physicochemical properties,often lost in shotgun analysis. Characteristics of the glom-erulus proteome were illustrated by Gene Ontology (GO)analysis and protein classification with the aid of bioinfor-matics tools. The depth of proteomic analysis was welldocumented by comparing the dynamic range of identi-fied proteins with other proteomic analyses targeting theglomerulus. Comparison of the glomerulus proteome withcomprehensive analyses of the human plasma and humanurine proteomes suggested the extent and characteristicsof proteins contaminated from plasma and excreted intourine, respectively. Furthermore, a comparison of orthologproteins identified in human and mouse glomerulus sug-gested some biologically significant differences betweenthe two species. The extensive profiling and annotation ofthe human glomerulus proteome were first conducted inthis study and could be a useful resource for the discoveryof biomarkers and disease-relevant proteins.
Results and discussionProtein identificationIn our previous study [4], glomeruli from the kidneycortex of a 68-year-old male patient who had undergonea nephrectomy due to ureter carcinoma were purified toapparent homogeneity by the sieving method. The cor-tex was histologically normal on the basis of lightmicroscopic observations of PAS- and PAM-stained tis-sue and no significant deposition of immunoglobulins(IgA, IgG, and IgM) or complement C3 was observed byimmunofluorescence microscopy. In the previous study,protein extract from the glomerular preparation wasfractionated by two procedures; 1-D SDS-PAGE and 2-Dpre-fractionation using solution phase isoelectric focusing(IEF) followed by 1-D-SDS-PAGE. All SDS-PAGE laneswere cut into 15 slices corresponding to a total of 90 slicesor fractions, processed by in-gel trypsin digestion, andanalyzed by a nanoflow-ESI-ion trap mass spectrometer.Peptides recovered from each gel slice were analyzed induplicate by two consecutive LC-MS/MS runs followed bytwo consecutive blank LC-MS/MS runs. The four rawdata files generated were merged and identified using theSpectrum Mill search engine (for details, see Additionalfile 1). In this study, the four raw data files for each of thefractions were converted into Mascot generic files via aData Analysis software (Agilent) and used for proteinidentification using the Mascot search engine against theIPI_human protein sequence database (ver. 3.70) to createa dataset of high-confidence, non-redundant identifiedproteins (see Methods section). In addition, the same rawdata files were analyzed by Spectrum Mill using the sameversion of the IPI_human protein sequence database forconvenience of comparison.
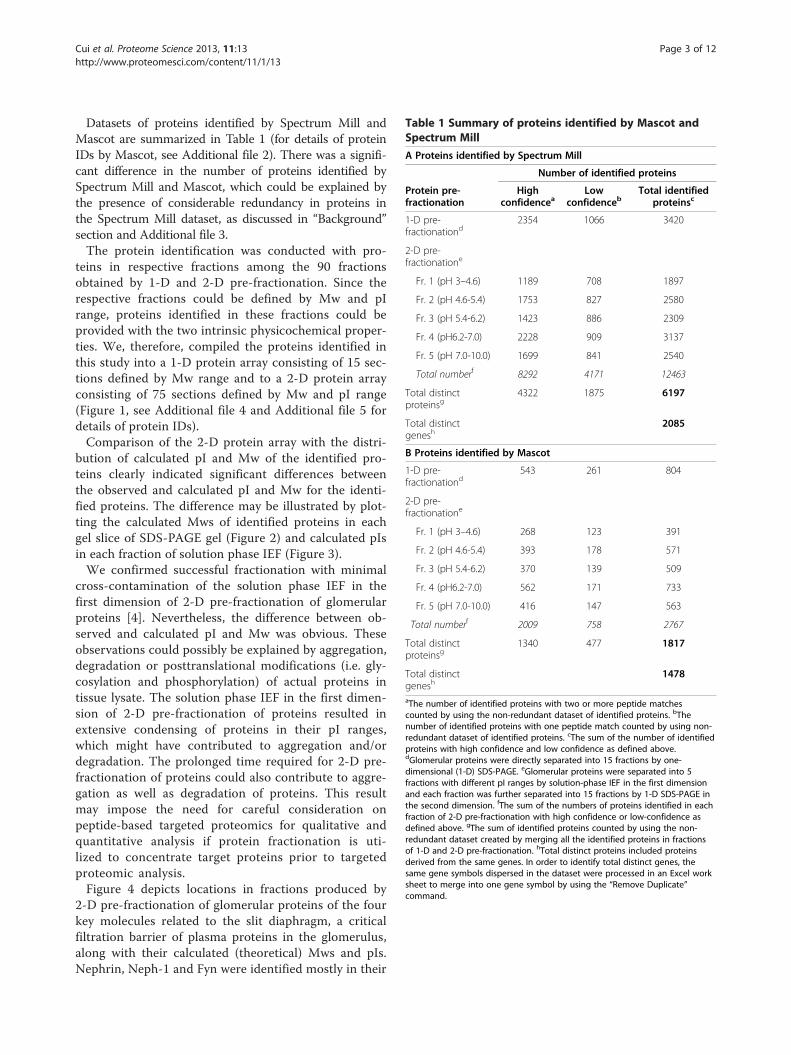
Table 1 Summary of proteins identified by Mascot andSpectrum Mill
A Proteins identified by Spectrum Mill
Number of identified proteins
Protein pre-fractionation
Highconfidencea
Lowconfidenceb
Total identifiedproteinsc
1-D pre-fractionationd
2354 1066 3420
2-D pre-fractionatione
Fr. 1 (pH 3–4.6) 1189 708 1897
Fr. 2 (pH 4.6-5.4) 1753 827 2580
Fr. 3 (pH 5.4-6.2) 1423 886 2309
Fr. 4 (pH6.2-7.0) 2228 909 3137
Fr. 5 (pH 7.0-10.0) 1699 841 2540
Total numberf 8292 4171 12463
Total distinctproteinsg
4322 1875 6197
Total distinctgenesh
2085
B Proteins identified by Mascot
1-D pre-fractionationd
543 261 804
2-D pre-fractionatione
Fr. 1 (pH 3–4.6) 268 123 391
Fr. 2 (pH 4.6-5.4) 393 178 571
Fr. 3 (pH 5.4-6.2) 370 139 509
Fr. 4 (pH6.2-7.0) 562 171 733
Fr. 5 (pH 7.0-10.0) 416 147 563
Total numberf 2009 758 2767
Total distinctproteinsg
1340 477 1817
Total distinctgenesh
1478
aThe number of identified proteins with two or more peptide matchescounted by using the non-redundant dataset of identified proteins. bThenumber of identified proteins with one peptide match counted by using non-redundant dataset of identified proteins. cThe sum of the number of identifiedproteins with high confidence and low confidence as defined above.dGlomerular proteins were directly separated into 15 fractions by one-dimensional (1-D) SDS-PAGE. eGlomerular proteins were separated into 5fractions with different pI ranges by solution-phase IEF in the first dimensionand each fraction was further separated into 15 fractions by 1-D SDS-PAGE inthe second dimension. fThe sum of the numbers of proteins identified in eachfraction of 2-D pre-fractionation with high confidence or low-confidence asdefined above. gThe sum of identified proteins counted by using the non-redundant dataset created by merging all the identified proteins in fractionsof 1-D and 2-D pre-fractionation. hTotal distinct proteins included proteinsderived from the same genes. In order to identify total distinct genes, thesame gene symbols dispersed in the dataset were processed in an Excel worksheet to merge into one gene symbol by using the “Remove Duplicate”command.
Cui et al. Proteome Science 2013, 11:13 Page 3 of 12http://www.proteomesci.com/content/11/1/13
Datasets of proteins identified by Spectrum Mill andMascot are summarized in Table 1 (for details of proteinIDs by Mascot, see Additional file 2). There was a signifi-cant difference in the number of proteins identified bySpectrum Mill and Mascot, which could be explained bythe presence of considerable redundancy in proteins inthe Spectrum Mill dataset, as discussed in “Background”section and Additional file 3.The protein identification was conducted with pro-
teins in respective fractions among the 90 fractionsobtained by 1-D and 2-D pre-fractionation. Since therespective fractions could be defined by Mw and pIrange, proteins identified in these fractions could beprovided with the two intrinsic physicochemical proper-ties. We, therefore, compiled the proteins identified inthis study into a 1-D protein array consisting of 15 sec-tions defined by Mw range and to a 2-D protein arrayconsisting of 75 sections defined by Mw and pI range(Figure 1, see Additional file 4 and Additional file 5 fordetails of protein IDs).Comparison of the 2-D protein array with the distri-
bution of calculated pI and Mw of the identified pro-teins clearly indicated significant differences betweenthe observed and calculated pI and Mw for the identi-fied proteins. The difference may be illustrated by plot-ting the calculated Mws of identified proteins in eachgel slice of SDS-PAGE gel (Figure 2) and calculated pIsin each fraction of solution phase IEF (Figure 3).We confirmed successful fractionation with minimal
cross-contamination of the solution phase IEF in thefirst dimension of 2-D pre-fractionation of glomerularproteins [4]. Nevertheless, the difference between ob-served and calculated pI and Mw was obvious. Theseobservations could possibly be explained by aggregation,degradation or posttranslational modifications (i.e. gly-cosylation and phosphorylation) of actual proteins intissue lysate. The solution phase IEF in the first dimen-sion of 2-D pre-fractionation of proteins resulted inextensive condensing of proteins in their pI ranges,which might have contributed to aggregation and/ordegradation. The prolonged time required for 2-D pre-fractionation of proteins could also contribute to aggre-gation as well as degradation of proteins. This resultmay impose the need for careful consideration onpeptide-based targeted proteomics for qualitative andquantitative analysis if protein fractionation is uti-lized to concentrate target proteins prior to targetedproteomic analysis.Figure 4 depicts locations in fractions produced by
2-D pre-fractionation of glomerular proteins of the fourkey molecules related to the slit diaphragm, a criticalfiltration barrier of plasma proteins in the glomerulus,along with their calculated (theoretical) Mws and pIs.Nephrin, Neph-1 and Fyn were identified mostly in their

1-D 2-D
Slice Fraction 1 Fraction 2 Fraction 3 Fraction 4 Fraction 5
1 40 59 61 40 28 37
2 48 55 54 40 31 36
3 65 60 60 49 35 39
4 77 62 69 60 45 48
5 74 71 59 57 57 60
6 94 65 107 67 52 56
7 90 24 68 35 93 66
8 113 70 49 77 99 74
9 67 73 75 32 132 78
10 120 53 61 53 139 80
11 115 71 90 96 111 77
12 122 62 85 79 121 99
13 113 73 83 84 101 105
14 74 62 81 65 113 80
15 124 103 131 92 144 78
215
165
125
95
75
58
49
44
28
32
40
36
24
20
163.0 4.6 5.4 6.2 7.0 10.0
Mw(kDa)
pI
20 40 60 80 100 120 140 160
# of identified proteins
Figure 1 The number of identified proteins in fractions of 1-D and 2-D pre-fractionation of glomerular proteins. The number of proteinsidentified in each of the 90 fractions separated by 1-D (SDS-PAGE) and 2-D pre-fractionation (solution phase isoelectric focusing followed bySDS-PAGE) are shown in 1-D and 2-D protein array format in which each cell or fraction is defined with Mw and pI range. The workflow for theprotein identification strategy is depicted in Additional file 1, and details of identified proteins are shown in Additional file 4 and Additional file 5.
Cui et al. Proteome Science 2013, 11:13 Page 4 of 12http://www.proteomesci.com/content/11/1/13
calculated Mws and pIs, while most podocin was found tobe aggregated or associated strongly with large molecularweight proteins and appeared in acidic fractions far fromits calculated Mw and pI.
Characterization of glomerulus proteome usingbioinformatics toolsAll the identified proteins included in the non-redundant,high-confidence dataset consisting of 1,817 unique pro-teins representing 1,478 unique genes were subjected tobioinformatics analysis based on the structured vocabularyof Gene Ontology (GO) using a PANTHER analyticaltool (ver. 7.0) [6,7]. Subcellular distribution as esti-mated by analysis with GO Cellular Component vo-cabulary indicated the highest number of hits to theactin cytoskeleton and a considerably higher numberof hits to the intermediate filament cytoskeleton andthe extracellular region (a term defining proteinspresent in the external protective or encapsulatingstructure outside the plasma membrane including theextracellular matrix) (Additional file 6: Figure S1A).The classification of proteins based on GO MolecularFunction vocabulary (Additional file 6: Figure S1B) andBiological Process vocabulary (Additional file 6: FigureS2A) yielded the successful identification of unbiased,
widely diverse proteins. Enrichment analysis based onGO Biological Process vocabulary using Cytoscape(version 2.82) with the BinGO plug-in (version 2.42)[8] further illustrated biological processes in whichglomerular proteins are significantly enriched com-pared to products of whole human genes (p < 0.001,hypergeometric test followed by multiple testing cor-rection using Benjamin and Hochberg false discoveryrate correction) (Additional file 6: Figure S2B).Under-representation or depletion analysis based on
GO Biological Process vocabulary using Cytoscape, asdescribed above, indicated significant depletion of pro-teins involved in “sensory perception”, “regulation ofsmall GTPase mediated signal transduction”, especiallyin “regulation of Ras protein signal transduction”, and,most notably, in “regulation of transcription” including“regulation of transcription from RNA polymerase IIpromoter” (Additional file 7).PANTHER Protein Class analysis is based on PANTHER
Molecular Function ontology, which includes commonlyused classes of protein functions, many of which are notcovered by GO Molecular Function. PANTHER ProteinClass analysis again showed that the highest number ofproteins was classified as cytoskeletal proteins (Additionalfile 6: Figure S3).
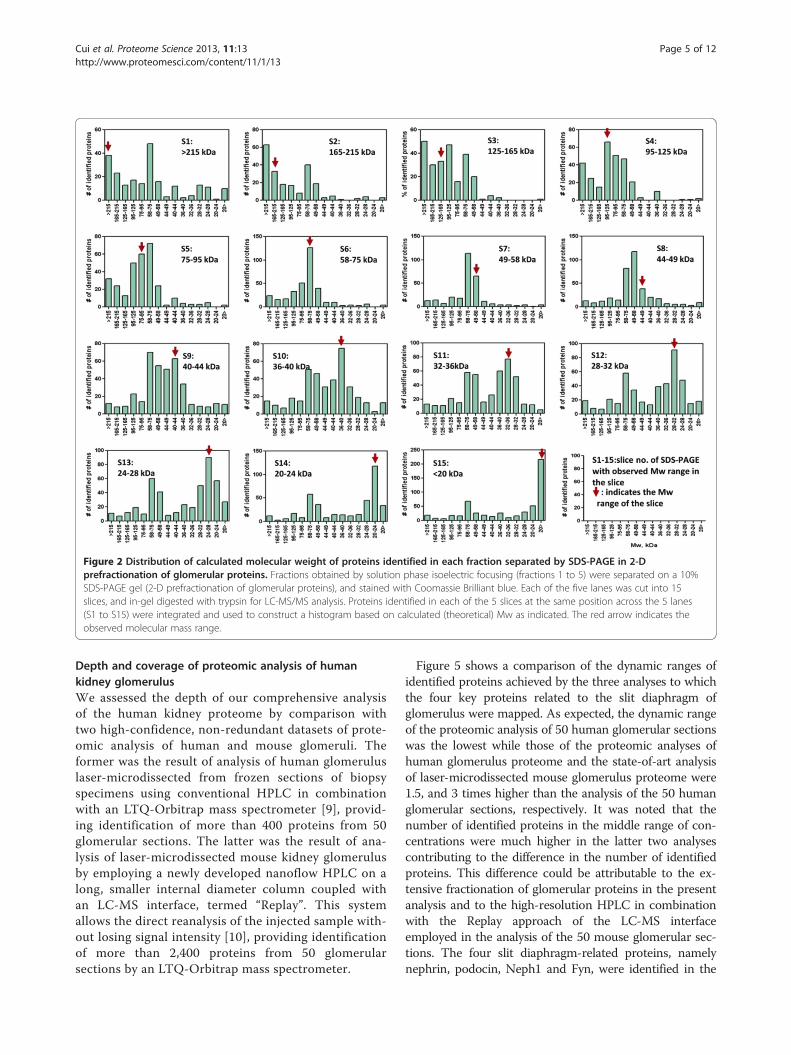
Figure 2 Distribution of calculated molecular weight of proteins identified in each fraction separated by SDS-PAGE in 2-Dprefractionation of glomerular proteins. Fractions obtained by solution phase isoelectric focusing (fractions 1 to 5) were separated on a 10%SDS-PAGE gel (2-D prefractionation of glomerular proteins), and stained with Coomassie Brilliant blue. Each of the five lanes was cut into 15slices, and in-gel digested with trypsin for LC-MS/MS analysis. Proteins identified in each of the 5 slices at the same position across the 5 lanes(S1 to S15) were integrated and used to construct a histogram based on calculated (theoretical) Mw as indicated. The red arrow indicates theobserved molecular mass range.
Cui et al. Proteome Science 2013, 11:13 Page 5 of 12http://www.proteomesci.com/content/11/1/13
Depth and coverage of proteomic analysis of humankidney glomerulusWe assessed the depth of our comprehensive analysisof the human kidney proteome by comparison withtwo high-confidence, non-redundant datasets of prote-omic analysis of human and mouse glomeruli. Theformer was the result of analysis of human glomeruluslaser-microdissected from frozen sections of biopsyspecimens using conventional HPLC in combinationwith an LTQ-Orbitrap mass spectrometer [9], provid-ing identification of more than 400 proteins from 50glomerular sections. The latter was the result of ana-lysis of laser-microdissected mouse kidney glomerulusby employing a newly developed nanoflow HPLC on along, smaller internal diameter column coupled withan LC-MS interface, termed “Replay”. This systemallows the direct reanalysis of the injected sample with-out losing signal intensity [10], providing identificationof more than 2,400 proteins from 50 glomerularsections by an LTQ-Orbitrap mass spectrometer.
Figure 5 shows a comparison of the dynamic ranges ofidentified proteins achieved by the three analyses to whichthe four key proteins related to the slit diaphragm ofglomerulus were mapped. As expected, the dynamic rangeof the proteomic analysis of 50 human glomerular sectionswas the lowest while those of the proteomic analyses ofhuman glomerulus proteome and the state-of-art analysisof laser-microdissected mouse glomerulus proteome were1.5, and 3 times higher than the analysis of the 50 humanglomerular sections, respectively. It was noted that thenumber of identified proteins in the middle range of con-centrations were much higher in the latter two analysescontributing to the difference in the number of identifiedproteins. This difference could be attributable to the ex-tensive fractionation of glomerular proteins in the presentanalysis and to the high-resolution HPLC in combinationwith the Replay approach of the LC-MS interfaceemployed in the analysis of the 50 mouse glomerular sec-tions. The four slit diaphragm-related proteins, namelynephrin, podocin, Neph1 and Fyn, were identified in the
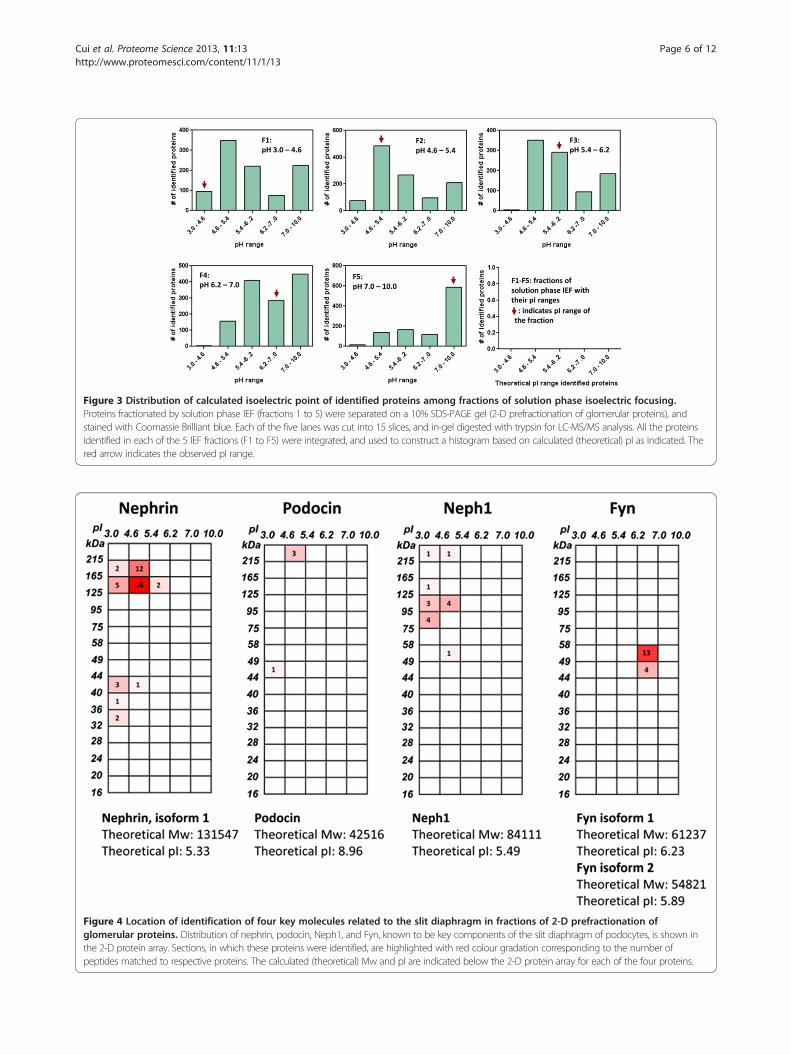
Figure 4 Location of identification of four key molecules related to the slit diaphragm in fractions of 2-D prefractionation ofglomerular proteins. Distribution of nephrin, podocin, Neph1, and Fyn, known to be key components of the slit diaphragm of podocytes, is shown inthe 2-D protein array. Sections, in which these proteins were identified, are highlighted with red colour gradation corresponding to the number ofpeptides matched to respective proteins. The calculated (theoretical) Mw and pI are indicated below the 2-D protein array for each of the four proteins.
Figure 3 Distribution of calculated isoelectric point of identified proteins among fractions of solution phase isoelectric focusing.Proteins fractionated by solution phase IEF (fractions 1 to 5) were separated on a 10% SDS-PAGE gel (2-D prefractionation of glomerular proteins), andstained with Coomassie Brilliant blue. Each of the five lanes was cut into 15 slices, and in-gel digested with trypsin for LC-MS/MS analysis. All the proteinsidentified in each of the 5 IEF fractions (F1 to F5) were integrated, and used to construct a histogram based on calculated (theoretical) pI as indicated. Thered arrow indicates the observed pI range.
Cui et al. Proteome Science 2013, 11:13 Page 6 of 12http://www.proteomesci.com/content/11/1/13

Figure 5 Comparison of dynamic range of proteomic analyses.Dynamic ranges of identified proteins achieved by the present studyare shown in comparison with those of two proteomic analyses ofhuman (Human glomerulus (LMD)) and mouse glomerulus. Theformer is the result of analysis of 50 human glomerular sectionsprepared by laser-microdissection from frozen sections of each of 3different biopsy specimens using conventional HPLC in combinationwith an LTQ-Orbitrap mass spectrometer [9]. Four replicate runswere conducted for each of the 3 samples and all the identifiedproteins were integrated to create a high-confidence, non-redundant dataset of identified proteins (604) under the criteriaadopted in this study. The high-confidence, non-redundant datasetof mouse glomerulus proteome was taken from Waanders et al. [10]who analyzed the proteins of 50 glomerular sections laser-microdissected from mouse kidneys using a newly developednanoflow HPLC. The nanoflow HPLC’s long, smaller internal diametercolumn coupled with the LC-MS interface “Replay” allowed thereanalysis of the injected sample with high sensitivity, and with anLTQ-Orbitrap mass spectrometer, provided 2,670 proteins.Normalized spectral abundance factor (NSAF), a relative proteinabundance index, was calculated according to Paoletti et al. [12].NSAF is based on the number of peptide matches (spectral counts)divided by protein mass or protein length which roughly correlateswith protein concentration in a protein mixture (spectral abundancefactor, SAF). To accurately account for run to run variation, individualSAF was normalized by dividing the SAF of a respective protein bythe sum of SAFs for all identified proteins to give an NSAFrepresenting relative protein abundance. NSAFs for the four keyproteins comprising the slit diaphragm of glomerulus (nephrin,podocin, Neph1 and Fyn) are mapped on each of theabundance curves.
Figure 6 Comparison of glomerulus proteome with plasmaproteome. Contamination of plasma proteins in the glomerulusproteome was roughly estimated by comparison with a high-confidence, non-redundant dataset of normal human plasmaproteome [13]. Among the 401 overlapping proteins between thetwo proteomes, representing 22.1% of the glomerulus proteome, 40proteins, annotated as “extracellular space” by GO CellularComponent vocabulary, were selected as plasma proteins to excludelow-abundance, tissue-leakage proteins including intrinsicglomerular proteins. See the text for more details.
Cui et al. Proteome Science 2013, 11:13 Page 7 of 12http://www.proteomesci.com/content/11/1/13
latter two comprehensive analyses whereas among them,Fyn, a non-receptor tyrosine kinase, was lost in the ana-lysis of the 50 human glomerulus sections. DAVID KEGGpathway analysis [11] predicted an over-representation ofthe actin cytoskeleton regulatory pathway (Additional file 8).
Comparison of glomerulus proteome with human plasmaproteomeInclusion of blood-derived proteins in glomerulus prote-ome was unavoidable since the removal of blood fromkidney tissue by perfusion with a physiological solutionwas impossible before the sampling of kidney cortices forthe purification of glomeruli. We therefore roughly esti-mated the extent of blood contamination by comparingglomerulus proteome with normal human plasma prote-ome consisting of 3,020 non-redundant proteins with twoor more peptide matches [13]. Figure 6 depicts the overlapbetween our glomerulus proteome and the normal humanplasma proteome indicating that 401 proteins (22.1% ofglomerulus proteome) were commonly identified in bothproteomes. Since the plasma proteome contained low-abundant tissue leakage proteins including intrinsic kidneyproteins in addition to abundant classical plasma proteins[14], we estimated the extent of contamination of classicalplasma proteins in the glomerulus proteome by specifyingproteins annotated with “extracellular space” by GOCellular Component vocabulary, “Extracellular space” isdefined as the part of a multicellular organism outside thecell proper, usually taken to be outside the plasma mem-brane, and occupied by fluid, excluding proteins located inthe outmost protective or encapsulating structure of a cell.Among the 401 overlapping proteins, 80 were annotated
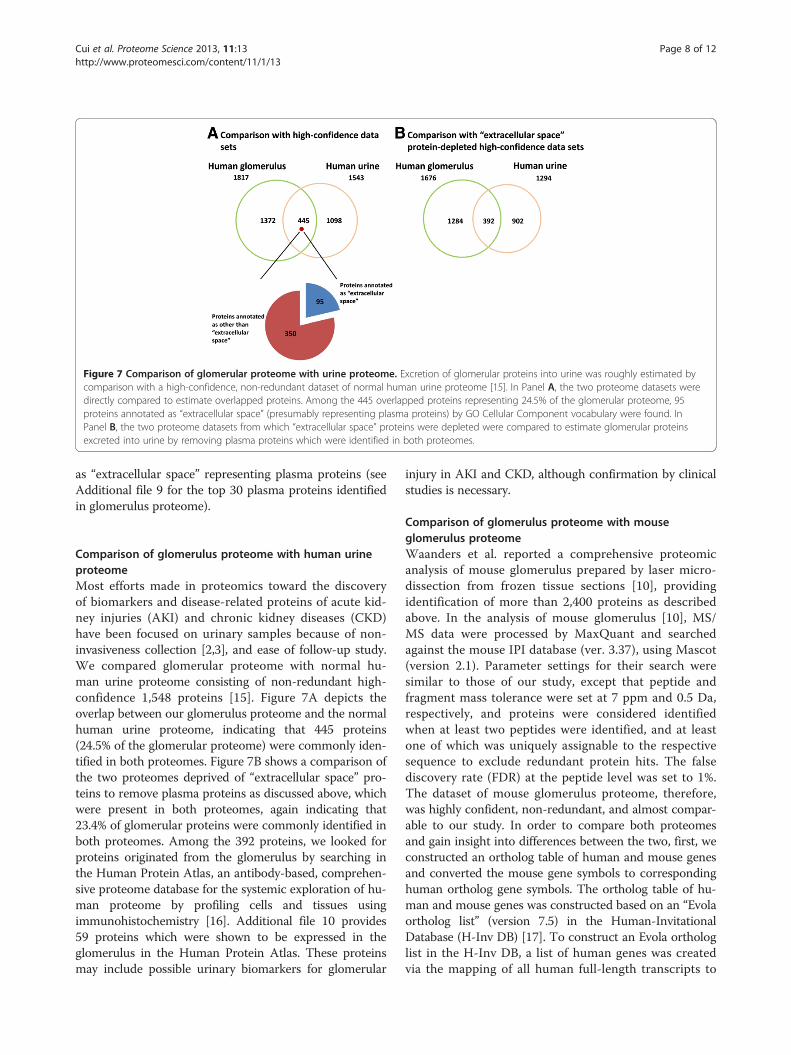
Figure 7 Comparison of glomerular proteome with urine proteome. Excretion of glomerular proteins into urine was roughly estimated bycomparison with a high-confidence, non-redundant dataset of normal human urine proteome [15]. In Panel A, the two proteome datasets weredirectly compared to estimate overlapped proteins. Among the 445 overlapped proteins representing 24.5% of the glomerular proteome, 95proteins annotated as “extracellular space” (presumably representing plasma proteins) by GO Cellular Component vocabulary were found. InPanel B, the two proteome datasets from which “extracellular space” proteins were depleted were compared to estimate glomerular proteinsexcreted into urine by removing plasma proteins which were identified in both proteomes.
Cui et al. Proteome Science 2013, 11:13 Page 8 of 12http://www.proteomesci.com/content/11/1/13
as “extracellular space” representing plasma proteins (seeAdditional file 9 for the top 30 plasma proteins identifiedin glomerulus proteome).
Comparison of glomerulus proteome with human urineproteomeMost efforts made in proteomics toward the discoveryof biomarkers and disease-related proteins of acute kid-ney injuries (AKI) and chronic kidney diseases (CKD)have been focused on urinary samples because of non-invasiveness collection [2,3], and ease of follow-up study.We compared glomerular proteome with normal hu-man urine proteome consisting of non-redundant high-confidence 1,548 proteins [15]. Figure 7A depicts theoverlap between our glomerulus proteome and the normalhuman urine proteome, indicating that 445 proteins(24.5% of the glomerular proteome) were commonly iden-tified in both proteomes. Figure 7B shows a comparison ofthe two proteomes deprived of “extracellular space” pro-teins to remove plasma proteins as discussed above, whichwere present in both proteomes, again indicating that23.4% of glomerular proteins were commonly identified inboth proteomes. Among the 392 proteins, we looked forproteins originated from the glomerulus by searching inthe Human Protein Atlas, an antibody-based, comprehen-sive proteome database for the systemic exploration of hu-man proteome by profiling cells and tissues usingimmunohistochemistry [16]. Additional file 10 provides59 proteins which were shown to be expressed in theglomerulus in the Human Protein Atlas. These proteinsmay include possible urinary biomarkers for glomerular
injury in AKI and CKD, although confirmation by clinicalstudies is necessary.
Comparison of glomerulus proteome with mouseglomerulus proteomeWaanders et al. reported a comprehensive proteomicanalysis of mouse glomerulus prepared by laser micro-dissection from frozen tissue sections [10], providingidentification of more than 2,400 proteins as describedabove. In the analysis of mouse glomerulus [10], MS/MS data were processed by MaxQuant and searchedagainst the mouse IPI database (ver. 3.37), using Mascot(version 2.1). Parameter settings for their search weresimilar to those of our study, except that peptide andfragment mass tolerance were set at 7 ppm and 0.5 Da,respectively, and proteins were considered identifiedwhen at least two peptides were identified, and at leastone of which was uniquely assignable to the respectivesequence to exclude redundant protein hits. The falsediscovery rate (FDR) at the peptide level was set to 1%.The dataset of mouse glomerulus proteome, therefore,was highly confident, non-redundant, and almost compar-able to our study. In order to compare both proteomesand gain insight into differences between the two, first, weconstructed an ortholog table of human and mouse genesand converted the mouse gene symbols to correspondinghuman ortholog gene symbols. The ortholog table of hu-man and mouse genes was constructed based on an “Evolaortholog list” (version 7.5) in the Human-InvitationalDatabase (H-Inv DB) [17]. To construct an Evola orthologlist in the H-Inv DB, a list of human genes was createdvia the mapping of all human full-length transcripts to
Cui et al. Proteome Science 2013, 11:13 Page 9 of 12http://www.proteomesci.com/content/11/1/13
genomic sequences using three nucleotide sequencealignment search engines including BLAT, BLAST andest2genome. For other species, gene loci were similarlypredicted through the mapping of all transcripts fromDDBJ, RefSeq and Ensemble nucleotide sequence data-bases to genomic sequences. The Evola ortholog list wasthen generated if exons overlapped between species ingenomic alignment for the longest for both the humanside and the other species’ side: the pairs were detectedas ortholog by computational analysis if they could bealigned with a length of 50% or more of the humanamino acid sequence. Using this approach, a pair ofortholog genes in the two species under comparison,which were generated from an ancestor gene by specifi-cation, was selected.Among 1,478 genes identified in the human glomerulus,
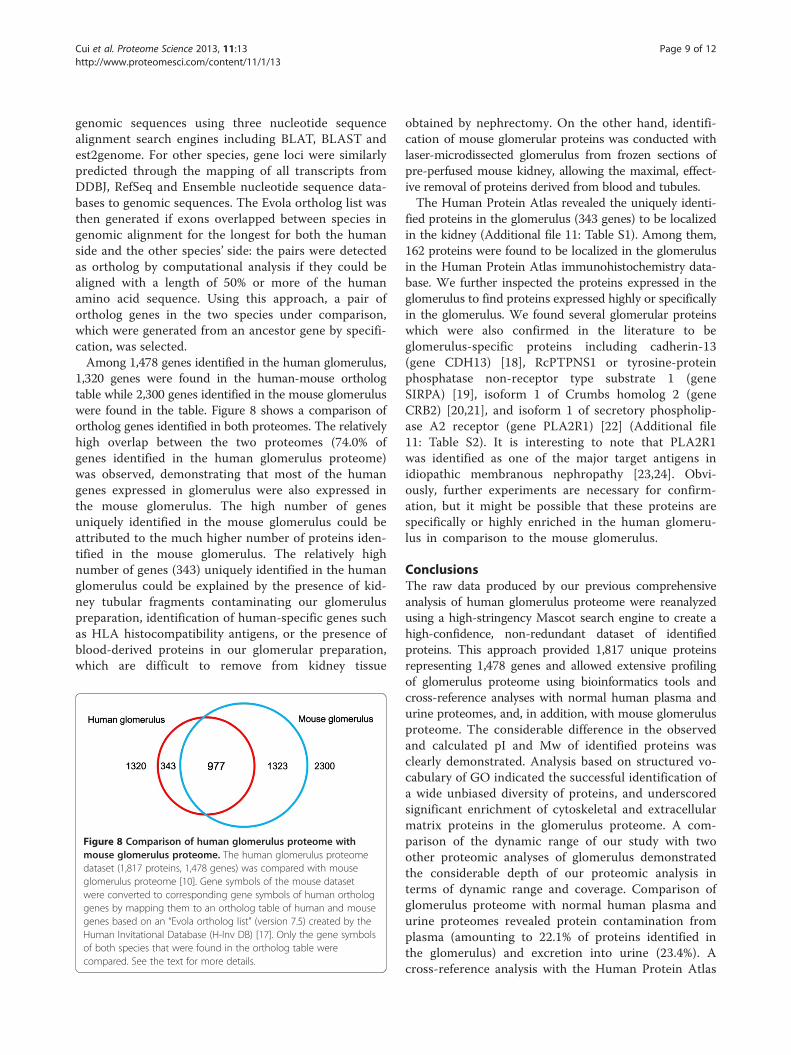
1,320 genes were found in the human-mouse orthologtable while 2,300 genes identified in the mouse glomeruluswere found in the table. Figure 8 shows a comparison ofortholog genes identified in both proteomes. The relativelyhigh overlap between the two proteomes (74.0% ofgenes identified in the human glomerulus proteome)was observed, demonstrating that most of the humangenes expressed in glomerulus were also expressed inthe mouse glomerulus. The high number of genesuniquely identified in the mouse glomerulus could beattributed to the much higher number of proteins iden-tified in the mouse glomerulus. The relatively highnumber of genes (343) uniquely identified in the humanglomerulus could be explained by the presence of kid-ney tubular fragments contaminating our glomeruluspreparation, identification of human-specific genes suchas HLA histocompatibility antigens, or the presence ofblood-derived proteins in our glomerular preparation,which are difficult to remove from kidney tissue
Figure 8 Comparison of human glomerulus proteome withmouse glomerulus proteome. The human glomerulus proteomedataset (1,817 proteins, 1,478 genes) was compared with mouseglomerulus proteome [10]. Gene symbols of the mouse datasetwere converted to corresponding gene symbols of human orthologgenes by mapping them to an ortholog table of human and mousegenes based on an “Evola ortholog list” (version 7.5) created by theHuman Invitational Database (H-Inv DB) [17]. Only the gene symbolsof both species that were found in the ortholog table werecompared. See the text for more details.
obtained by nephrectomy. On the other hand, identifi-cation of mouse glomerular proteins was conducted withlaser-microdissected glomerulus from frozen sections ofpre-perfused mouse kidney, allowing the maximal, effect-ive removal of proteins derived from blood and tubules.The Human Protein Atlas revealed the uniquely identi-
fied proteins in the glomerulus (343 genes) to be localizedin the kidney (Additional file 11: Table S1). Among them,162 proteins were found to be localized in the glomerulusin the Human Protein Atlas immunohistochemistry data-base. We further inspected the proteins expressed in theglomerulus to find proteins expressed highly or specificallyin the glomerulus. We found several glomerular proteinswhich were also confirmed in the literature to beglomerulus-specific proteins including cadherin-13(gene CDH13) [18], RcPTPNS1 or tyrosine-proteinphosphatase non-receptor type substrate 1 (geneSIRPA) [19], isoform 1 of Crumbs homolog 2 (geneCRB2) [20,21], and isoform 1 of secretory phospholip-ase A2 receptor (gene PLA2R1) [22] (Additional file11: Table S2). It is interesting to note that PLA2R1was identified as one of the major target antigens inidiopathic membranous nephropathy [23,24]. Obvi-ously, further experiments are necessary for confirm-ation, but it might be possible that these proteins arespecifically or highly enriched in the human glomeru-lus in comparison to the mouse glomerulus.
ConclusionsThe raw data produced by our previous comprehensiveanalysis of human glomerulus proteome were reanalyzedusing a high-stringency Mascot search engine to create ahigh-confidence, non-redundant dataset of identifiedproteins. This approach provided 1,817 unique proteinsrepresenting 1,478 genes and allowed extensive profilingof glomerulus proteome using bioinformatics tools andcross-reference analyses with normal human plasma andurine proteomes, and, in addition, with mouse glomerulusproteome. The considerable difference in the observedand calculated pI and Mw of identified proteins wasclearly demonstrated. Analysis based on structured vo-cabulary of GO indicated the successful identification ofa wide unbiased diversity of proteins, and underscoredsignificant enrichment of cytoskeletal and extracellularmatrix proteins in the glomerulus proteome. A com-parison of the dynamic range of our study with twoother proteomic analyses of glomerulus demonstratedthe considerable depth of our proteomic analysis interms of dynamic range and coverage. Comparison ofglomerulus proteome with normal human plasma andurine proteomes revealed protein contamination fromplasma (amounting to 22.1% of proteins identified inthe glomerulus) and excretion into urine (23.4%). Across-reference analysis with the Human Protein Atlas

Cui et al. Proteome Science 2013, 11:13 Page 10 of 12http://www.proteomesci.com/content/11/1/13
database indicated the excretion of proteins highly or spe-cifically localized in the glomerulus into urine, suggestingtheir possible clinical use as urinary biomarkers for glom-erular injury. A comparison of ortholog proteins identifiedin human and mouse glomeruli showed considerablesimilarity but also suggested some biologically significantdifferences between species.
MethodsLC-tandem mass analysisThe workflow for the preparation of human kidneyglomeruli, the strategy for comprehensive analysis, andthe LC-MS/MS analysis are provided in Additional file 1.Briefly, 2 mg of proteins extracted from purified glom-eruli were either separated on 1-D SDS-PAGE (1-Dpre-fractionation) or by 2-D pre-fractionation (solutionphase IEF followed by 1-D SDS-PAGE). All the lanes ofSDS-PAGE gels were cut into 15 slices (90 slices orfractions in total), and subjected to in-gel digestion toproduce tryptic peptides. Two replicate LC-MS/MS runswith samples followed by two consecutive LC-MS/MSruns with blanks (0.3% formic acid) were conducted foreach sample. The latter two blank runs were included toretrieve and eliminate carryover peptides from the preced-ing sample runs.
Protein identification using Spectrum MillWe have previously reported identified proteins usingSpectrum Mill (version A.03.12.060) as a search engineagainst the IPI_human protein sequence database (version3.18) [4]. In this study, we reanalyzed the same raw dataset using a new version of Spectrum Mill (version03.03.081 SR1a) against the IPI_human protein sequencedatabase (version 3.70) for convenience of comparisonwith proteins identified using the Mascot search engineagainst the same version of the IPI-human proteinsequence database. The identification strategy and criteriafor protein identification were similar to those of theprevious report [4]. The protein identification done usingSpectrum Mill is summarized in Table 1.
Protein identification using MascotFor protein identification with the Mascot search engine,the raw data files generated by Spectrum Mill wereconverted to Mascot generic files (mgf files) by using thebuilt-in script of Data Analysis software (Agilent version6.1) without grouping. The 4 mgf files corresponding toeach of the fractions (2 sample runs and 2 blank runs)were merged, and searched against the IPI_human proteinsequence database (version 3.70) using the Mascot searchengine (version 2.2.1). Cystein carbamoidmethylation wasset as the fixed modification, and other modificationswere set as variable modifications including oxidationof methionine, oxidation of histidine and tryptophan,
N-terminal glutamine to pyroglutamate, and N-terminalglutamate to pyroglutamate. Peptide and fragment masstolerance were set at ±2.5 Da, and at ± 0.7 Da, respect-ively. A maximum of one missed cleavage was allowed.Proteins matched with at least one unique peptide andwith peptides of scores above the “identity threshold” wereselected to generate a non-redundant, high-confidencedataset of identified proteins. Selection of matched pep-tides with scores exceeding the identity threshold wasperformed by using the same value as the significantthreshold in the “Ion score or cut-off” parameter setting.The significant threshold was adjusted to give a falsediscovery rate of less than 1% (0.25 ± 0.24%), which wascalculated on the basis of the number of peptidematches against a decoy database. Protein identificationis summarized in Table 1 in comparison with data obtainedwith Spectrum Mill.
Additional files
Additional file 1: Workflow of large-scale proteomic analysis ofnormal human kidney glomerulus proteome. The workflow for thelarge-scale proteomic analysis of normal human kidney glomerulus(Panel 1.1) and details of LC-tandem mass analysis (Panel 1.2) areprovided.
Additional file 2: High-confidence, non-redundant dataset ofproteins identified in human kidney glomerulus. Proteins wereidentified using Mascot version 2.2.01 searching against the IPI_humanprotein sequence database (version 3.70), and reported by integrating allthe results of 90 fractions prepared by 1-D and 2-D pre-fractionation of2 mg of protein extracted from a highly purified preparation of normalhuman kidney glomerulus. See Additional file 1 and the Methods sectionfor details.
Additional file 3: Summary of proteins identified using SpectrumMill and Mascot. A graphic view of Table 1 to illustrate the difference inthe number of proteins identified by the two search engines is shown inPanel 3.1. Venn diagram for comparison of proteins and genes are alsoshown in Panel 3.2.
Additional file 4: Lists of proteins identified in each of the 15fractions prepared by 1-D pre-fractionation of glomerular proteins.Proteins identified in each of the 15 slices (fractions) of 1-D SDS-PAGE gelusing Mascot are reported in a corresponding worksheet.
Additional file 5: List of proteins identified in 5 fractions preparedby 2-D pre-fractionation of glomerular proteins. Proteins identified ineach of the 75 fractions prepared by 2-D pre-fractionation are compiledin a worksheet.
Additional file 6: Characterization of glomerulus proteome usingbioinformatics tools. All the identified proteins in the non-redundant,high-confidence dataset of glomerulus proteome were analyzed withPANTHER analytical tool (ver. 7.0). Subcellular distribution as analyzedusing GO Cellular Component vocabulary (Figure 1A), GO MolecularFunction vocabulary (Figure 1B), and GO Biological Process vocabulary(Figure 2A) are shown. In addition, enrichment analysis with GOBiological Process vocabulary and Cytoscape (ver. 2.82) with BinGO plug-in (ver. 2.42) using the results of whole human genes as a background isdepicted in Figure 2B. Protein classification analysis using PANTHERProtein Class based on PANTHER Molecular Function ontology is shownin Figure 3. See the text for further details.
Additional file 7: Under-representation analysis of glomerulusproteome. All the identified proteins of the non-redundant, high-confidence dataset of glomerulus proteome consisting of 1,817 uniqueproteins representing 1,478 unique genes were analyzed for under-
Cui et al. Proteome Science 2013, 11:13 Page 11 of 12http://www.proteomesci.com/content/11/1/13
represented or depleted proteins on the basis of GO Biological Processvocabulary with Cytoscape version 2.82 coupled with BinGO plug-in(version 2.42) using the results of whole human genes as a background.
Additional file 8: Glomerular proteins matched in a KEGG“Regulation of Actin Cytoskeleton” pathway. All the identifiedproteins of the non-redundant, high-confidence dataset of glomerulusproteome consisting of 1,817 unique proteins representing 1,478 uniquegenes were analyzed by DAVID KEGG analysis. Matched proteins tocomponents in the “Regulation of Actin Cytoskeleton” are indicated withasterisk.
Additional file 9: An estimate of protein contamination from bloodinto glomerulus proteome by comparison of glomerulus proteomewith plasma proteome. All the identified proteins of the non-redundant,high-confidence dataset of glomerulus proteome consisting of 1,817unique proteins representing 1,478 unique genes were compared with thehigh-confidence, non-redundant dataset of normal human plasmaproteome [States DJ et al., Nat. Biotech., 2006, 24, 333–338]. Among the 401overlapping proteins, proteins annotated as “extracellular space” by GOCellular Component vocabulary were selected as representing plasmaproteins. The top 30 plasma proteins are listed in order according to thenumber of peptide matches.
Additional file 10: Proteins expressed in the glomerulus excretedinto urine. Among proteins commonly identified in both glomerulusand urine proteome [Adachi et al., Genome Biol, 2006, 7, R80], theproteins that were confirmed to be expressed in the glomerulus byimmunohistochemistry (Human Protein Atlas) were selected andsummarized in this file.
Additional file 11: The proteins that might be specifically orabundantly expressed in human glomerulus compared with mouseglomerulus. The human glomerular dataset was compared with themouse glomerular dataset [Waanders et al., Proc. Natl. Acad. Sci. USA,2009, 106, 18902–18907]. Gene symbols of the mouse dataset wereconverted to corresponding gene symbols of human ortholog genes bymapping them to an ortholog table of human and mouse genes basedon an “Evola ortholog list” (version 7.5) created by the Human Invitationaldatabase (H-Inv DB). Proteins-corresponding genes uniquely identified inthe human dataset were examined for their cellular localization bysearching in the Human Protein Atlas (version 9.0).
AbbreviationsAKI: Acute kidney injury; CKD: Chronic kidney diseases; FDR: False discoveryrate; GO: Gene Ontology; H-Inv DB: Human-Invitational Database;HPA: Human Protein Atlas; IEF: Isoelectric focusing; mgf: Mascot generic file;Mw: Molecular weight; NSAF: Normalized spectral abundance factor;pI: Isoelectric point.
Competing interestsAll authors have no competing interest.
Authors’ contributionsZC designed the study, conducted protein identification with the Mascotsearch engine, and analyzed identified proteins using bioinformatics tools.YY worked with ZC on all the protein identification procedures, analyses withbioinformatics tools, and cross-reference analyses in the study. BX, YZ andSM worked with ZC on protein identification and helped to analyze usingbioinformatics tools. MN participated in the processing of MS raw data forprotein identification. TM, TI, HF and EY contributed to the annotation ofglomerulus proteome. TY contributed to the overall design of this study andthe revision of the manuscript regarding the interpretation of results. Allauthors read and accepted the final manuscript.
AcknowledgementsThis study was supported by a Grant-in-Aid for Scientific Research (C) to YY(22590881) from the Japan Society for Promotion of Science, a Grant-in-Aidfor Strategic Research Project to TY (500460) from the Ministry of Education,Culture, Sports, Science and Technology, Japan, and a Grant-in-Aid forDiabetic Nephropathy and Nephrosclerosis Research to TY from the Ministryof Health, Labor and Welfare of Japan.
Author details1Department of Structural Pathology, Institute of Nephrology, GraduateSchool of Medical and Dental Sciences, Niigata University, Niigata, Japan.2Department of Physiology, Faculty of Veterinary Medicine, Suez CanalUniversity, Ismailia, Egypt. 3Institute of Clinical Research, Niigata NationalHospital, Kashiwazaki, Japan.
Received: 13 December 2012 Accepted: 2 April 2013Published: 8 April 2013
References1. Yoshida Y, Miyamoto M, Taguchi I, Xu B, Zhang Y, Yaoita E,
Fujinaka H, Yamamoto T: Human kidney glomerulus proteome andbiomarker discovery of kidney diseases. Proteomics Clin Appl 2008,2:420–427.
2. Bonventre JV, Vaidya VS, Schmounder R, Feig P, Dieterle F: Next-generationbiomarkers for detecting kidney toxicity. Nat Biotech 2010,28:436–440.
3. Decramer S, Gonzalez de Peredo A, Breul B, Mishak H, Monsarrat B,Bascands J-L, Schanstra JP: Urine in clinical proteomics. Mol Cell Proteomics2008, 7:1850–1862.
4. Miyamoto M, Yoshida Y, Taguchi I, Nagasaka Y, Tasaki M, Zhang Y,Xu B, Nameta M, Sezaki H, Cuellar LM, Osawa T, Morishita H, SekiyamaS, Yaoita E, Kimura K, Yamamoto T: In-depth proteomic profiling ofthe normal human kidney glomerulus using two-dimensional proteinprefractionation in combination with liquid chromatography-tandemmass spectrometry. J Proteome Res 2007, 6:3680–3690.
5. Kapp EA, Schütz F, Connolly LM, Chakel JA, Meza JE, Miller CA, Fenyo D,Eng JK, Adkins JN, Omenn GS, Simpson RJ: An evaluation, comparison,and accurate benchmarking of several publicly available MS/MSsearch algorithms: Sensitivity and specificity analysis. Proteomics 2005,5:3475–3490.
6. Mi H, Dong Q, Muruganujan A, Gaudet P, Lewis S, Thomas PD:PANTHER version 7: improved phylogenetic trees, orthologs andcollaboration with the Gene Ontology Consortium. Nuc Acids Res2010, 38:D204–D210.
7. PANTHER Classification System. [http://www.pantherdb.org/]8. Cytoscape. [http://www.cytoscape.org/]9. Yoshida Y, Nameta M, Kuwano M, Zhang Y, Xu B, Magdeldin S,
Cui Z, Fujinaka H, Yaoita E, Tomonaga T, Yamamoto T: Proteomicapproach to human kidney glomerulus prepared by lasermicrodissection from frozen biopsy specimens: Exploration ofproteome after removal of blood-derived proteins. Proteomics Clin Appl2012, 6:412–417.
10. Waanders LF, Chwalek K, Monetti M, Kumar C, Lammert E, Mann M:Quantitative proteomic analysis of single pancreatic islets. Proc Natl AcadSci USA 2009, 106:18902–18907.
11. DAVID. [http://david.abcc.ncifcrf.gov/]12. Paoletti AC, Parmely TJ, Tomomori-Sato C, Sato S, Zhu D, Conaway RC,
Conaway JW, Florens L, Washburn MP: Quantitative proteomicanalysis of distinct mammalian mediator complexes usingnormalized spectral abundance factors. Proc Natl Acad Sci USA 2006,103:18928–18933.
13. States DJ, Omenn GS, Blackwell TW, Fermin D, Eng J, Speicher DW, HanashSM: Challenges in deriving high-confidence protein identifications fromdata gathered by a HUPO plasma proteome collaborative study.Nat Biotech 2006, 24:333–338.
14. Anderson NL, Anderson NG: The human plasma proteome. Mol CellProteomics 2002, 1:845–867.
15. Adachi J, Kumar C, Zhang Y, Olsen JV, Mann M: The human urinaryproteome contains more than 1500 proteins, including a largeproportion of membrane proteins. Genome Biol 2006, 7:R80.
16. The Human Proteome Atlas. [http://www.proteinatlas.org/]17. Human-Invitational Database (H-Inv DB). [http://h-invitational.jp/hinv/
ahg-db/index.jsp]18. Arnemann J, Sultani O, Hasgün D, Coerdt W: T-/H-cadherin (CDH-13): a
new marker for differentiating podocytes. Virchows Arch 2006,448:160–164.
19. Willingham SB, Volkmer JP, Gentles AJ, Sahoo D, Dalerba P, Mitra SS, WangJ, Contreras-Trujillo H, Martin R, Cohen JD, Lovelance P, Sceeren FA, ChaoMP, Weiskopf K, Tang C, Volkmer AK, Naik TJ, Storm TA, Mosley AR, Edris B,
Cui et al. Proteome Science 2013, 11:13 Page 12 of 12http://www.proteomesci.com/content/11/1/13
Schmid SM, Sun CK, Chua MS, Murillo O, Rajendran P, Cha AC, Chin RK, KimD, Adorno M, Raveh T, Tseng D, Jaiswal S, Enger PO, Steinberg GK, Li G, SoSK, Majeti R, Harsh GR, van de Rijn M, Teng NN, Sunwoo JB, Alzadeh AA,Clarke MF, Weissman IL: The CD-47-signaling regulatory protein alpha(SIRa) interaction is a therapeutic target for human solid tumours.Proc Natl Acad Sci USA 2012, 109:6662–6667.
20. van den Hurk JA, Rashbass P, Roepman R, Davis J, Voesenek KE, Arends ML,Zonneveld MN, van Roekel MH, Cameron K, Rohschneider K, HeckenlivelyJR, Koenekoop RK, Hoyng CB, Cremers FP, den Hollander AI:Characterization of the Crumbs homolog 2 (CRB2) gene and analysis ofits role in retinitis pigmentosa and Leber congenital amaurosis. Mol Vis2005, 11:263–273.
21. Boroviak T, Rashbass P: The apical polarity determinant Crumbs 2 is anovel regulator of ESC-derived neural progenitors. Stem Cells 2011,29:193–205.
22. Ronco P, Debiec H: Antigen identification in membranous nephropathymoves toward targeted monitoring and new therapy. J Am Soc Nephrol2010, 21:564–569.
23. Beck LH Jr, Bonegio RGB, Lambeau G, David M, Beck BA, Powell DW,Cummins TD, Klein JB, Salant DJ: M-type phospholipase A2 receptor astarget in idiopathic membranous nephropathy. N Eng J Med 2009,361:11–21.
24. Debiec H, Ronco P: PLA2R autoantibodies and PLA2R glomerular depositsin membranous nephropathy. N Eng J Med 2011, 364:689–690.
doi:10.1186/1477-5956-11-13Cite this article as: Cui et al.: Profiling and annotation of human kidneyglomerulus proteome. Proteome Science 2013 11:13.
Submit your next manuscript to BioMed Centraland take full advantage of:
• Convenient online submission
• Thorough peer review
• No space constraints or color figure charges
• Immediate publication on acceptance
• Inclusion in PubMed, CAS, Scopus and Google Scholar
• Research which is freely available for redistribution
Submit your manuscript at www.biomedcentral.com/submit