Embed Size (px)
Citation preview
Nievergelt et al. Investigative Genetics 2013, 4:13http://www.investigativegenetics.com/content/4/1/13
RESEARCH Open Access
Inference of human continental origin andadmixture proportions using a highlydiscriminative ancestry informative 41-SNP panelCaroline M Nievergelt1*, Adam X Maihofer1, Tatyana Shekhtman1, Ondrej Libiger2, Xudong Wang3,4,Kenneth K Kidd4 and Judith R Kidd4
Abstract
Background: Accurate determination of genetic ancestry is of high interest for many areas such as biomedicalresearch, personal genomics and forensics. It remains an important topic in genetic association studies, as it hasbeen shown that population stratification, if not appropriately considered, can lead to false-positive and -negativeresults. While large association studies typically extract ancestry information from available genome-wide SNPgenotypes, many important clinical data sets on rare phenotypes and historical collections assembled before theGWAS area are in need of a feasible method (i.e., ease of genotyping, small number of markers) to infer thegeographic origin and potential admixture of the study subjects. Here we report on the development, applicationand limitations of a small, multiplexable ancestry informative marker (AIM) panel of SNPs (or AISNP) developedspecifically for this purpose.
Results: Based on worldwide populations from the HGDP, a 41-AIM AISNP panel for multiplex application with theABI SNPlex and a subset with 31 AIMs for the Sequenome iPLEX system were selected and found to be highlyinformative for inferring ancestry among the seven continental regions Africa, the Middle East, Europe, Central/South Asia, East Asia, the Americas and Oceania. The panel was found to be least informative for Eurasianpopulations, and additional AIMs for a higher resolution are suggested. A large reference set including over 4,000subjects collected from 120 global populations was assembled to facilitate accurate ancestry determination. Weshow practical applications of this AIM panel, discuss its limitations for admixed individuals and suggest ways toincorporate ancestry information into genetic association studies.
Conclusion: We demonstrated the utility of a small AISNP panel specifically developed to discern global ancestry.We believe that it will find wide application because of its feasibility and potential for a wide range of applications.
Keywords: Ancestry Informative Markers, Multiplex, Global Ancestry, Population Stratification, Admixture, AISNP,AIMs
BackgroundCharacterization of human ancestry has been of interestfor decades as information about population structure canprovide novel insight into the human past and remains animportant topic in the rapidly evolving biomedical field.For example, because genetic variants conferring risk to aparticular disease may be geographically restricted because
* Correspondence: [email protected] of Psychiatry, School of Medicine, University of San DiegoCalifornia, La Jolla 92093, CA, USAFull list of author information is available at the end of the article
© 2013 Nievergelt et al.; licensee BioMed CenCreative Commons Attribution License (http:/distribution, and reproduction in any medium
of evolutionary forces such as mutation, genetic drift, mi-gration and natural selection, the assessment of the gen-etic background in individuals chosen for a study is crucialin genetic epidemiology [1].While still a topic of controversy [2], there is ample
evidence that self-reported race, as for example used inthe US Census, can predict ancestral clusters in a popu-lation sample. However, it does not completely informon how genetic variation is apportioned within and be-tween racial groups, nor does information on race revealthe extent of admixture [2,3].
tral Ltd. This is an Open Access article distributed under the terms of the/creativecommons.org/licenses/by/2.0), which permits unrestricted use,, provided the original work is properly cited.
Nievergelt et al. Investigative Genetics 2013, 4:13 Page 2 of 16http://www.investigativegenetics.com/content/4/1/13
Especially in the context of mapping disease genes,more objective and accurate methods of defining homo-genous populations for the investigation of specificpopulation-disease associations are required. This is notonly paramount for specific mapping approaches such asadmixture mapping [4], but has also been recognized asa crucial prerequisite for genetic association studies, asthe presence of undetected population structure can leadto both false-positive results and failures to detect genu-ine associations [5]. Furthermore, it has been shown thatthe consequences of population structure on associationoutcomes increase markedly with sample size, and evenmodest levels of population structure within populationgroups cannot safely be ignored in the large studiesneeded to detect typical genetic effects in common dis-eases [6].In order to assess genetic background diversity, a large
number of ancestry informative marker (AIM) panels havebeen developed for particular applications. Genome-widepanels for admixture mapping have been developedfor Hispanic populations [7], African Americans [8] orthree-way admixture in the Americas [9], and smallerAIM panels have been designed to discern ancestry ateither the global level [10-12] or within specific popu-lations such as the Native and Mexican Americans[13-15], Europeans [16-20] or African Americans [21,22].In addition, genome-wide association studies (GWAS) areable to leverage ancestral information from the allele fre-quencies of the several thousand SNPs generated forwhole-genome applications, alleviating the need for spe-cific AIM panels [5].However, determining ancestry and controlling for
population structure is just as important in smallergenetic association studies. These include for examplecandidate gene studies involving only a few geneticmarkers, replication of GWAS findings, or consist ofsmaller, highly valuable collections of rare patho-logical phenotypes and historical collections with lim-ited amounts of DNA. Genotyping these samples onlarge AIM panels or leveraging ancestry informationfrom preexisting genotyping is often not practical orpossible.To address this specific need, we set out to develop a
highly informative AIM panel that would allow us toinfer a subject’s ancestral origin at the continental leveland estimate admixture proportions among at leastseven main geographic regions Africa, the Middle East,Europe, Central and South Asia, East Asia, Oceania andthe Americas. The selection of such AIMs has to focuson SNPs with the largest allele frequency differences be-tween the continental regions of interest to achieve thedesired resolution at the continental level. Such highresolution is required because genetic diversity of humanpopulations follows gradients or geographic clines within
and among continents rather than specific clusters orclades [3,23,24].We further aimed for the development of a feasible
method to determine ancestry, as resources such asfunding and available DNA are often limited for theseapplications. We therefore developed panels of AISNPssuitable for multiplex application on two commonlyused platforms, the ABI SNPlex [25] and SequenomeiPLEX [26] systems. Additionally, all markers are also in-cluded on the Illumina HumanHap550 array, thusallowing for a combined analysis with studies genotypedon the Illumina whole-genome arrays.Lastly, we specifically focused on the applicability of
our panel to determine the ancestry of subjects from anyof the worldwide geographic origins. To date, most re-search involving genetic association studies has focusedon populations of European descent, where longer LDblocks require fewer genetic markers to be genotyped[27]. However, current gene-mapping efforts specificallyrequest more global research, thus increasing the needfor global AIM panels. Furthermore, global ancestrydetermination is especially important in clinical samplesascertained in specific geographic regions such asSouthern California that are inhabited by individualswith very diverse and often heavily admixed ancestries.Here we describe the development of AIM panels
based on the well-studied global reference populationsfrom the HGDP-CEPH [28], which include 52 geograph-ically diverse populations collected from seven continen-tal regions. We then greatly expanded the referencepopulation set by genotyping the AIMs in over 2,000additional subjects of known ancestry with the goal ofachieving the most comprehensive global reference col-lection possible. We report on these efforts and describehighly discriminative ancestry informative 41- and 31-marker panels for multiplex applications.
MethodsReference populationsAIM panels were developed based on the global refer-ence populations from the HGDP-CEPH [28]. A total of941 subjects including 52 populations from the stan-dardized H952 subset were selected [29]. Based on thegeographic origin of the samples, HGDP subjects wereassigned to one of seven geographic or continentalregions: Africa (n = 131), the Middle East (including theNorth African Moabites, n = 133), Europe (n = 158),Central/South Asia (CS Asia, n = 198), East Asia (E Asia,n = 229), the Americas (n = 64) and Oceania (n = 28)(Additional file 1: Table S1).
AIM panel developmentGenotypes of HGDP subjects from the Illumina 650Y SNParray are publicly available (http://hagsc.org/hgdp/files.html).
Nievergelt et al. Investigative Genetics 2013, 4:13 Page 3 of 16http://www.investigativegenetics.com/content/4/1/13
We used Infocalc 1.1 [30] to calculate the marker in-formativeness (I_n) among the seven continental re-gions for each of the 644,195 autosomal markers. Themean informativeness of all markers was 0.0539, with awide range of I_n = 0.0003-0.406. AIMs were selectedaccording to the following criteria: being autosomal, un-ambiguous (AC, AG, TC, TG) and present on theIllumina Hap550 array (n = 547,458). Next, the top5,000 markers with the highest I_n were chosen (I_n >0.077) and, to reduce the correlation of markers, weresubjected to LD pruning using PLINK [31] at a VIF =1.5. The resulting pool of AIMs included 1,442 SNPs(Additional file 2: Table S2).A small panel for multiplexing applications was devel-
oped by first choosing from the pool of 1,442 AIMs thetop ten markers with the highest allele frequency differ-ences (δ) between each of the 21 pairwise continental re-gion comparisons. This set of 210 markers was thenfurther reduced in an iterative way by considering multi-plex genotyping requirements for the ABI SNPlex geno-typing system [25] and Sequenome iPLEX system [26],leading to the final 41-AIM set for ABI SNPlex genotyp-ing and the matching 31-AIM set for Sequenome iPLEXgenotyping.
Additional reference and test populationsTo validate the AIM panels and increase the globalcoverage of the reference population set for down-stream applications, we included two additional, verylarge data sets with worldwide populations: the Inter-national HapMap Project (http://hapmap.ncbi.nlm.nih.gov/; phase III release 2 and 3) standard set HAP1161[32] included 931 subjects from 11 populations, andthe Yale data set included 2,146 subjects from 57 pop-ulations [33]. The combined reference set included4,018 unrelated subjects from 120 (partially overlap-ping) populations (Additional file 1: Table S1). Thesereference populations have been described previously[33], and geographic features such as latitude andlongitude of these populations are presented in theallele frequency database ALFRED (http://alfred.med.yale.edu/) [34]. Genotypes of at least 40 of the 41AIMs were available for all reference subjects.Finally, to illustrate a practical application of the 41-
AIM panel with our complete set of global referencepopulations, a contemporary population sample of 2,392subjects ascertained in Southern California [35] was ge-notyped using the ABI SNPlex system. Ancestry was de-termined for all subjects with < 5% genotypes missing.
Statistical analysesPopulation structure and individual ancestry estimateswere obtained using STRUCTURE v2.3.2.1. [36,37]. Toassess the global informativeness of the 41-AIM panel
in the original HGDP reference populations, five inde-pendent runs without prior population assignmentwere performed at K = 2 to K = 7, using 20,000 burn-in cycles and 20,000 MCMC replications under theadmixture model. The “infer α” option with the same,uniform alpha for all populations was used underthe λ = 1 option. All other parameters were set atdefault.To further validate the 41-AIM panel, ancestry esti-
mates of 3,077 independent subjects of known ancestryfrom 68 global populations (reference set 2) were deter-mined at k = 7 using the above STRUCTURE parame-ters, but now including prior population information ofthe HGDP reference set. Allele frequencies were updatedusing only individuals with population information at amigration prior of 0.05. Graphs were plotted usingDISTRUCT v1.1 [38].CLUMPP v1.1.2 [39] was used to evaluate different
replicates of STRUCTURE runs. To assign a subject to aspecific cluster, we applied cutoffs of >85% and >50%cluster membership, respectively. These criteria were se-lected to facilitate a comparison with Seldin's 93-AIMpanel [10]. Finally, to validate the AIM panels, the per-centage of subjects that clustered correctly compared tothe known geographic origin was calculated.Population structure was further analyzed using prin-
cipal component analysis (PCA) implemented in theEIGENSTRAT software [40] and multi-dimensional scal-ing (MDS) as implemented in PLINK. All other calcula-tions were performed in R v2.15.0.As a measure of informativeness of the different AIM
panels at the population level, we calculated FST, a gen-etic distance measure for inter-population differentiationcompared to intra-population variation. Significance ofpairwise FSTs was established using 10,000 permutations.A Mantel test was used to correlate the FST matricesbased on the 41-AIM and 31-AIM panels. Calculationswere performed in ARLEQUIN 3.5 [41].To investigate the informativeness of the AIM pa-
nels in detecting admixture at the individual level,subjects from two admixed populations of the SouthernCalifornia test population (self-reported African Americansand self-reported Hispanic White and Native Americans)were selected. These subjects were subjected to theIllumina HumanOmniExpressExome array, and indi-vidual ancestry estimates were determined with a sec-ond, independent approach (see [42] for details). Inbrief, we used over 10,000 GWAS-derived SNPs, aset of 2,513 (partly overlapping) reference individuals anda two-step analysis approach implemented in ADMIX-TURE [43]. Individual admixture estimates based on theGWAS-derived panel were then compared to the admix-ture estimates based on the 41- and 31-AIM panels forthese two admixed populations (see above).
Nievergelt et al. Investigative Genetics 2013, 4:13 Page 4 of 16http://www.investigativegenetics.com/content/4/1/13
ResultsCharacterization of small AIM panels to determinecontinental ancestryFifty-two global populations from the HGDP-CEPHpanel [28] were used to select AIMs optimized for thedetermination of continental ancestry. We developed asmall 41-AIM panel specifically for multiplex applicationon the ABI system from a pre-selected pool of 1,442highly informative AIMs (Additional file 1: Table S1).The panel was further reduced to 31 AIMs for applica-tion on the Sequenome iPLEX system.Table 1 shows the informativeness (I_n) and pairwise
allele frequency differences (δ) among the seven contin-ental regions for each of the 41 AIMs. I_n ranges from0.08 - 0.41 with a high mean of 0.23. The largest I_n andlargest δ for each of the 21 continental comparisons areindicated in bold, highlighting the strength of a markerto distinguish between specific different global origins.Most continental comparisons included several markerswith very high δ of >0.8. The smallest allele frequencydifferences were found for comparisons of regionswithin Eurasia where the top markers showed δ in therange of 0.4, indicating limited power to accuratelydistinguish subjects from Europe, the Middle East andCentral/South Asia from each other.The AIM panels were further characterized by calcu-
lating FST [41] as a measure of the panel’s relativestrength to distinguish the seven geographic regions.Table 2 shows the genetic distance between the contin-ental regions when using the 41-AIM (lower diagonal)and 31-AIM panel (upper diagonal), respectively. Inter-continent differentiation was based on allele frequenciesfrom 51 HGDP populations; the atypical North AfricanMozabites were excluded here.In general, we found high FST values distinguishing the
African, East Asian, American and Oceanian regions. Asexpected, the lower FST values among Europe, the Mid-dle East and Central/South Asia reflect the I_n and δfound for the single markers. When comparing the FSTvalues of the full 41-AIM panel with the reduced31-AIM panel, no significant differences were found(Wilcoxon signed rank test, n = 21 paired comparisons,p > 0.38). In addition, a comparison of all pairwise FSTvalues among the 52 populations showed a highly sig-nificant correlation among the FST values calculatedbased on the 41-AIM panel and the 31-AIM panel(Mantel test, r = 0.987, p < 0.001), further indicating nosignificant loss of power to discern global ancestry in thesmaller panel.Lastly, the population structure of the HGDP was ana-
lyzed using STRUCTURE. To facilitate a comparisonwith previous studies (e.g., [10,12,24,33,44]), we usedsimilar model parameters without prior informationabout individual sampling locations. Figure 1 shows the
most typical patterns with the highest likelihood fromeach of 20 independent runs at K = 2–7. Similar toRosenberg‘s analyses including 377 microsatellites [44]and 993 SNPs [24], we found stable results with twoclusters anchored by Africa and the Americas at K = 2(20/20 runs) and a separation of Africa at K = 3 (19/20).At K = 4, a new cluster emerged isolating either theAmericas (11/20) or alternatively Central/South Asia (9/20), and at K = 5 both of these regions were isolated(14/20). Most runs separated Europe from the MiddleEast at K = 6 (17/20), and at K = 7 the main continentalregions for whose partitioning the panel was designedwere separated from each other in the majority of runs(11/20) and with the highest likelihood.
Validation of the 41-AIM panel using additionalpopulations of known originWe further tested the performance of the 41-AIM panelin a realistic setting and estimated the ancestry of 3,077test subjects from 68 regionally collected populationsfrom the HapMap III and Yale collections. These testpopulations have been extensively characterized by usand others (see, e.g., [33] and [45]) and are well suitedfor this purpose. STRUCTURE was run with the HGDPas predefined reference populations at K = 7 (Yale sam-ples were not genotyped for rs2717329). Table 3 showsthe average cluster membership of individuals belongingto a specific population for each of the seven continentalregions, Africa, the Middle East, Europe, Central/SouthAsia, East Asia, the Americas and Oceania (n = 68 pop-ulations). We calculated the percentage of subjects thatclustered correctly, using criteria of >85% and >50%cluster membership (MS), respectively.We found that African populations had very high clus-
ter membership in the African cluster, but East Africanpopulations (e.g., Chagga, Maasai and Sandawe) showedslightly lower values. As expected, admixed AfricanAmericans as well as a population of Ethiopian Jewsshowed some cluster membership in Europe and theMiddle East, and less than 50% of the subjects were in-cluded in the African group at the 85% MS criteria.The ethnoreligious Samaritans, Yemenite Jews and
Druze clustered with the Kuwaiti predominantly in theMiddle East, but also showed a significant Europeancontribution. As expected, most European populationsclustered predominantly with Europe. However, therewas a significant Middle Eastern component, even forthe Northern European populations such as the Finnsand Irish, demonstrating the somewhat reduced specifi-city of the 41-AIM panel to distinguish between Europeand the Middle East compared to the resolution betweenother continents. When applying the less stringent 50%MS criterion, most populations had over 90% of theirsubjects placed in Europe. Not surprisingly, the Russian
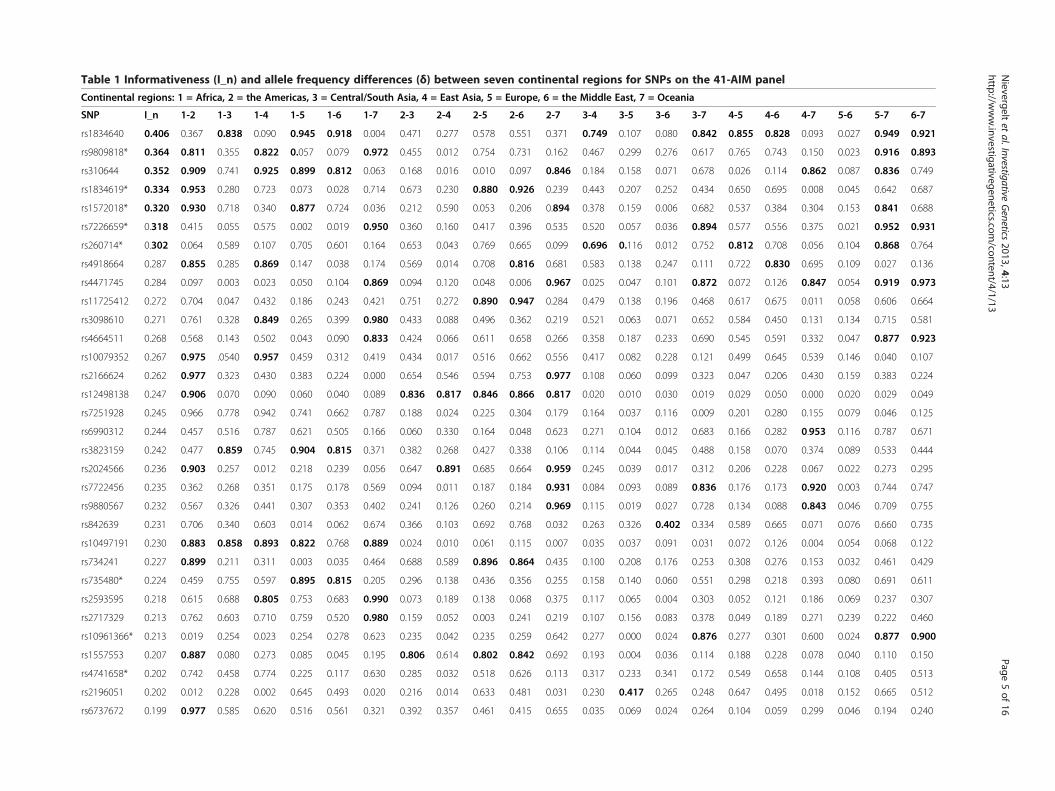
Table 1 Informativeness (I_n) and allele frequency differences (δ) between seven continental regions for SNPs on the 41-AIM panel
Continental regions: 1 = Africa, 2 = the Americas, 3 = Central/South Asia, 4 = East Asia, 5 = Europe, 6 = the Middle East, 7 = Oceania
SNP I_n 1-2 1-3 1-4 1-5 1-6 1-7 2-3 2-4 2-5 2-6 2-7 3-4 3-5 3-6 3-7 4-5 4-6 4-7 5-6 5-7 6-7
rs1834640 0.406 0.367 0.838 0.090 0.945 0.918 0.004 0.471 0.277 0.578 0.551 0.371 0.749 0.107 0.080 0.842 0.855 0.828 0.093 0.027 0.949 0.921
rs9809818* 0.364 0.811 0.355 0.822 0.057 0.079 0.972 0.455 0.012 0.754 0.731 0.162 0.467 0.299 0.276 0.617 0.765 0.743 0.150 0.023 0.916 0.893
rs310644 0.352 0.909 0.741 0.925 0.899 0.812 0.063 0.168 0.016 0.010 0.097 0.846 0.184 0.158 0.071 0.678 0.026 0.114 0.862 0.087 0.836 0.749
rs1834619* 0.334 0.953 0.280 0.723 0.073 0.028 0.714 0.673 0.230 0.880 0.926 0.239 0.443 0.207 0.252 0.434 0.650 0.695 0.008 0.045 0.642 0.687
rs1572018* 0.320 0.930 0.718 0.340 0.877 0.724 0.036 0.212 0.590 0.053 0.206 0.894 0.378 0.159 0.006 0.682 0.537 0.384 0.304 0.153 0.841 0.688
rs7226659* 0.318 0.415 0.055 0.575 0.002 0.019 0.950 0.360 0.160 0.417 0.396 0.535 0.520 0.057 0.036 0.894 0.577 0.556 0.375 0.021 0.952 0.931
rs260714* 0.302 0.064 0.589 0.107 0.705 0.601 0.164 0.653 0.043 0.769 0.665 0.099 0.696 0.116 0.012 0.752 0.812 0.708 0.056 0.104 0.868 0.764
rs4918664 0.287 0.855 0.285 0.869 0.147 0.038 0.174 0.569 0.014 0.708 0.816 0.681 0.583 0.138 0.247 0.111 0.722 0.830 0.695 0.109 0.027 0.136
rs4471745 0.284 0.097 0.003 0.023 0.050 0.104 0.869 0.094 0.120 0.048 0.006 0.967 0.025 0.047 0.101 0.872 0.072 0.126 0.847 0.054 0.919 0.973
rs11725412 0.272 0.704 0.047 0.432 0.186 0.243 0.421 0.751 0.272 0.890 0.947 0.284 0.479 0.138 0.196 0.468 0.617 0.675 0.011 0.058 0.606 0.664
rs3098610 0.271 0.761 0.328 0.849 0.265 0.399 0.980 0.433 0.088 0.496 0.362 0.219 0.521 0.063 0.071 0.652 0.584 0.450 0.131 0.134 0.715 0.581
rs4664511 0.268 0.568 0.143 0.502 0.043 0.090 0.833 0.424 0.066 0.611 0.658 0.266 0.358 0.187 0.233 0.690 0.545 0.591 0.332 0.047 0.877 0.923
rs10079352 0.267 0.975 .0540 0.957 0.459 0.312 0.419 0.434 0.017 0.516 0.662 0.556 0.417 0.082 0.228 0.121 0.499 0.645 0.539 0.146 0.040 0.107
rs2166624 0.262 0.977 0.323 0.430 0.383 0.224 0.000 0.654 0.546 0.594 0.753 0.977 0.108 0.060 0.099 0.323 0.047 0.206 0.430 0.159 0.383 0.224
rs12498138 0.247 0.906 0.070 0.090 0.060 0.040 0.089 0.836 0.817 0.846 0.866 0.817 0.020 0.010 0.030 0.019 0.029 0.050 0.000 0.020 0.029 0.049
rs7251928 0.245 0.966 0.778 0.942 0.741 0.662 0.787 0.188 0.024 0.225 0.304 0.179 0.164 0.037 0.116 0.009 0.201 0.280 0.155 0.079 0.046 0.125
rs6990312 0.244 0.457 0.516 0.787 0.621 0.505 0.166 0.060 0.330 0.164 0.048 0.623 0.271 0.104 0.012 0.683 0.166 0.282 0.953 0.116 0.787 0.671
rs3823159 0.242 0.477 0.859 0.745 0.904 0.815 0.371 0.382 0.268 0.427 0.338 0.106 0.114 0.044 0.045 0.488 0.158 0.070 0.374 0.089 0.533 0.444
rs2024566 0.236 0.903 0.257 0.012 0.218 0.239 0.056 0.647 0.891 0.685 0.664 0.959 0.245 0.039 0.017 0.312 0.206 0.228 0.067 0.022 0.273 0.295
rs7722456 0.235 0.362 0.268 0.351 0.175 0.178 0.569 0.094 0.011 0.187 0.184 0.931 0.084 0.093 0.089 0.836 0.176 0.173 0.920 0.003 0.744 0.747
rs9880567 0.232 0.567 0.326 0.441 0.307 0.353 0.402 0.241 0.126 0.260 0.214 0.969 0.115 0.019 0.027 0.728 0.134 0.088 0.843 0.046 0.709 0.755
rs842639 0.231 0.706 0.340 0.603 0.014 0.062 0.674 0.366 0.103 0.692 0.768 0.032 0.263 0.326 0.402 0.334 0.589 0.665 0.071 0.076 0.660 0.735
rs10497191 0.230 0.883 0.858 0.893 0.822 0.768 0.889 0.024 0.010 0.061 0.115 0.007 0.035 0.037 0.091 0.031 0.072 0.126 0.004 0.054 0.068 0.122
rs734241 0.227 0.899 0.211 0.311 0.003 0.035 0.464 0.688 0.589 0.896 0.864 0.435 0.100 0.208 0.176 0.253 0.308 0.276 0.153 0.032 0.461 0.429
rs735480* 0.224 0.459 0.755 0.597 0.895 0.815 0.205 0.296 0.138 0.436 0.356 0.255 0.158 0.140 0.060 0.551 0.298 0.218 0.393 0.080 0.691 0.611
rs2593595 0.218 0.615 0.688 0.805 0.753 0.683 0.990 0.073 0.189 0.138 0.068 0.375 0.117 0.065 0.004 0.303 0.052 0.121 0.186 0.069 0.237 0.307
rs2717329 0.213 0.762 0.603 0.710 0.759 0.520 0.980 0.159 0.052 0.003 0.241 0.219 0.107 0.156 0.083 0.378 0.049 0.189 0.271 0.239 0.222 0.460
rs10961366* 0.213 0.019 0.254 0.023 0.254 0.278 0.623 0.235 0.042 0.235 0.259 0.642 0.277 0.000 0.024 0.876 0.277 0.301 0.600 0.024 0.877 0.900
rs1557553 0.207 0.887 0.080 0.273 0.085 0.045 0.195 0.806 0.614 0.802 0.842 0.692 0.193 0.004 0.036 0.114 0.188 0.228 0.078 0.040 0.110 0.150
rs4741658* 0.202 0.742 0.458 0.774 0.225 0.117 0.630 0.285 0.032 0.518 0.626 0.113 0.317 0.233 0.341 0.172 0.549 0.658 0.144 0.108 0.405 0.513
rs2196051 0.202 0.012 0.228 0.002 0.645 0.493 0.020 0.216 0.014 0.633 0.481 0.031 0.230 0.417 0.265 0.248 0.647 0.495 0.018 0.152 0.665 0.512
rs6737672 0.199 0.977 0.585 0.620 0.516 0.561 0.321 0.392 0.357 0.461 0.415 0.655 0.035 0.069 0.024 0.264 0.104 0.059 0.299 0.046 0.194 0.240
Nievergelt
etal.Investigative
Genetics
2013,4:13Page
5of
16http://w
ww.investigativegenetics.com
/content/4/1/13
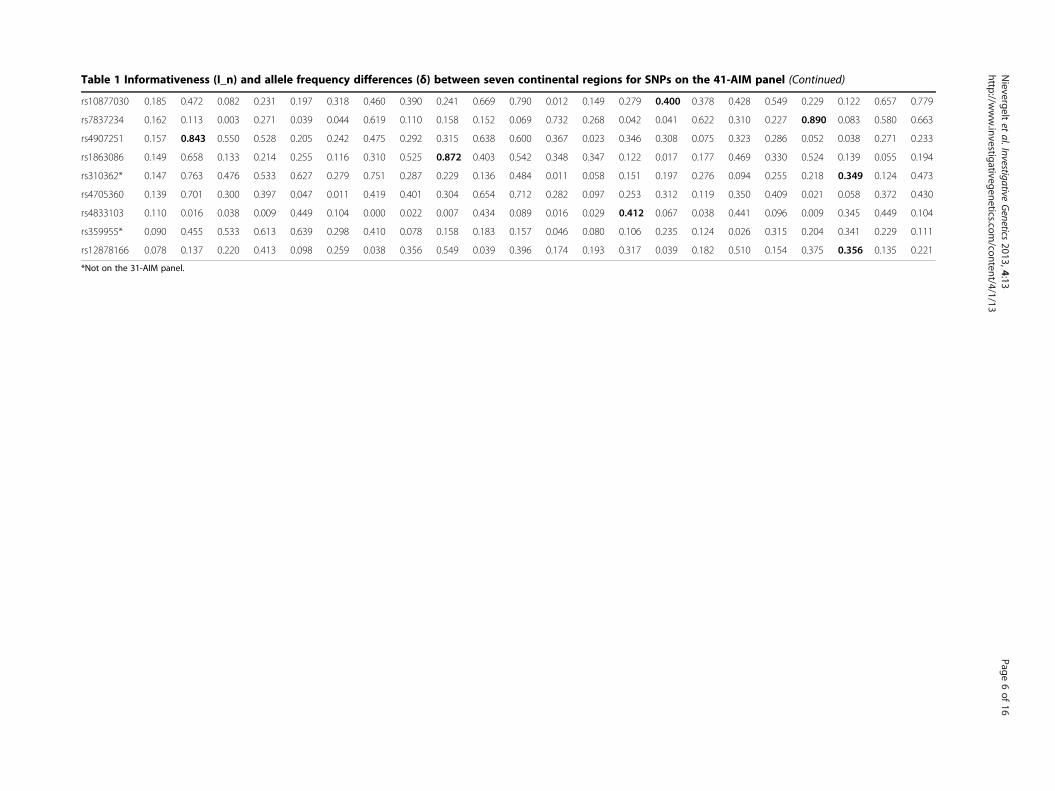
Table 1 Informativeness (I_n) and allele frequency differences (δ) between seven continental regions for SNPs on the 41-AIM panel (Continued)
rs10877030 0.185 0.472 0.082 0.231 0.197 0.318 0.460 0.390 0.241 0.669 0.790 0.012 0.149 0.279 0.400 0.378 0.428 0.549 0.229 0.122 0.657 0.779
rs7837234 0.162 0.113 0.003 0.271 0.039 0.044 0.619 0.110 0.158 0.152 0.069 0.732 0.268 0.042 0.041 0.622 0.310 0.227 0.890 0.083 0.580 0.663
rs4907251 0.157 0.843 0.550 0.528 0.205 0.242 0.475 0.292 0.315 0.638 0.600 0.367 0.023 0.346 0.308 0.075 0.323 0.286 0.052 0.038 0.271 0.233
rs1863086 0.149 0.658 0.133 0.214 0.255 0.116 0.310 0.525 0.872 0.403 0.542 0.348 0.347 0.122 0.017 0.177 0.469 0.330 0.524 0.139 0.055 0.194
rs310362* 0.147 0.763 0.476 0.533 0.627 0.279 0.751 0.287 0.229 0.136 0.484 0.011 0.058 0.151 0.197 0.276 0.094 0.255 0.218 0.349 0.124 0.473
rs4705360 0.139 0.701 0.300 0.397 0.047 0.011 0.419 0.401 0.304 0.654 0.712 0.282 0.097 0.253 0.312 0.119 0.350 0.409 0.021 0.058 0.372 0.430
rs4833103 0.110 0.016 0.038 0.009 0.449 0.104 0.000 0.022 0.007 0.434 0.089 0.016 0.029 0.412 0.067 0.038 0.441 0.096 0.009 0.345 0.449 0.104
rs359955* 0.090 0.455 0.533 0.613 0.639 0.298 0.410 0.078 0.158 0.183 0.157 0.046 0.080 0.106 0.235 0.124 0.026 0.315 0.204 0.341 0.229 0.111
rs12878166 0.078 0.137 0.220 0.413 0.098 0.259 0.038 0.356 0.549 0.039 0.396 0.174 0.193 0.317 0.039 0.182 0.510 0.154 0.375 0.356 0.135 0.221
*Not on the 31-AIM panel.
Nievergelt
etal.Investigative
Genetics
2013,4:13Page
6of
16http://w
ww.investigativegenetics.com
/content/4/1/13
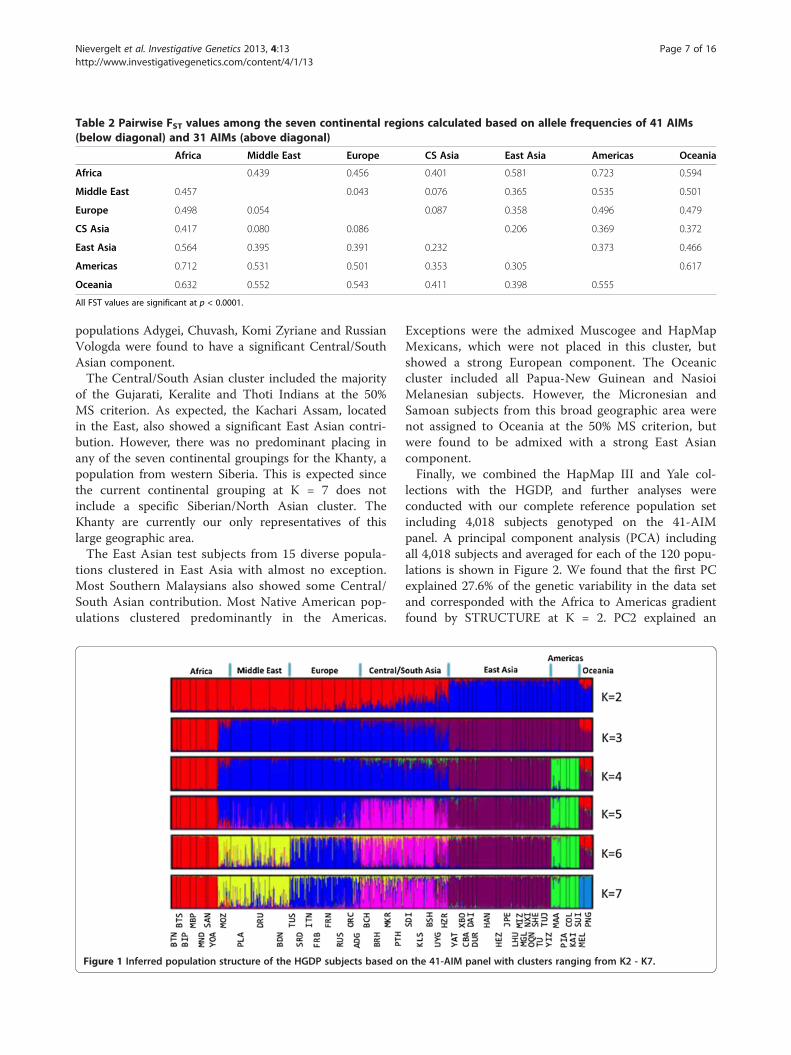
Table 2 Pairwise FST values among the seven continental regions calculated based on allele frequencies of 41 AIMs(below diagonal) and 31 AIMs (above diagonal)
Africa Middle East Europe CS Asia East Asia Americas Oceania
Africa 0.439 0.456 0.401 0.581 0.723 0.594
Middle East 0.457 0.043 0.076 0.365 0.535 0.501
Europe 0.498 0.054 0.087 0.358 0.496 0.479
CS Asia 0.417 0.080 0.086 0.206 0.369 0.372
East Asia 0.564 0.395 0.391 0.232 0.373 0.466
Americas 0.712 0.531 0.501 0.353 0.305 0.617
Oceania 0.632 0.552 0.543 0.411 0.398 0.555
All FST values are significant at p < 0.0001.
Nievergelt et al. Investigative Genetics 2013, 4:13 Page 7 of 16http://www.investigativegenetics.com/content/4/1/13
populations Adygei, Chuvash, Komi Zyriane and RussianVologda were found to have a significant Central/SouthAsian component.The Central/South Asian cluster included the majority
of the Gujarati, Keralite and Thoti Indians at the 50%MS criterion. As expected, the Kachari Assam, locatedin the East, also showed a significant East Asian contri-bution. However, there was no predominant placing inany of the seven continental groupings for the Khanty, apopulation from western Siberia. This is expected sincethe current continental grouping at K = 7 does notinclude a specific Siberian/North Asian cluster. TheKhanty are currently our only representatives of thislarge geographic area.The East Asian test subjects from 15 diverse popula-
tions clustered in East Asia with almost no exception.Most Southern Malaysians also showed some Central/South Asian contribution. Most Native American pop-ulations clustered predominantly in the Americas.
Figure 1 Inferred population structure of the HGDP subjects based o
Exceptions were the admixed Muscogee and HapMapMexicans, which were not placed in this cluster, butshowed a strong European component. The Oceaniccluster included all Papua-New Guinean and NasioiMelanesian subjects. However, the Micronesian andSamoan subjects from this broad geographic area werenot assigned to Oceania at the 50% MS criterion, butwere found to be admixed with a strong East Asiancomponent.Finally, we combined the HapMap III and Yale col-
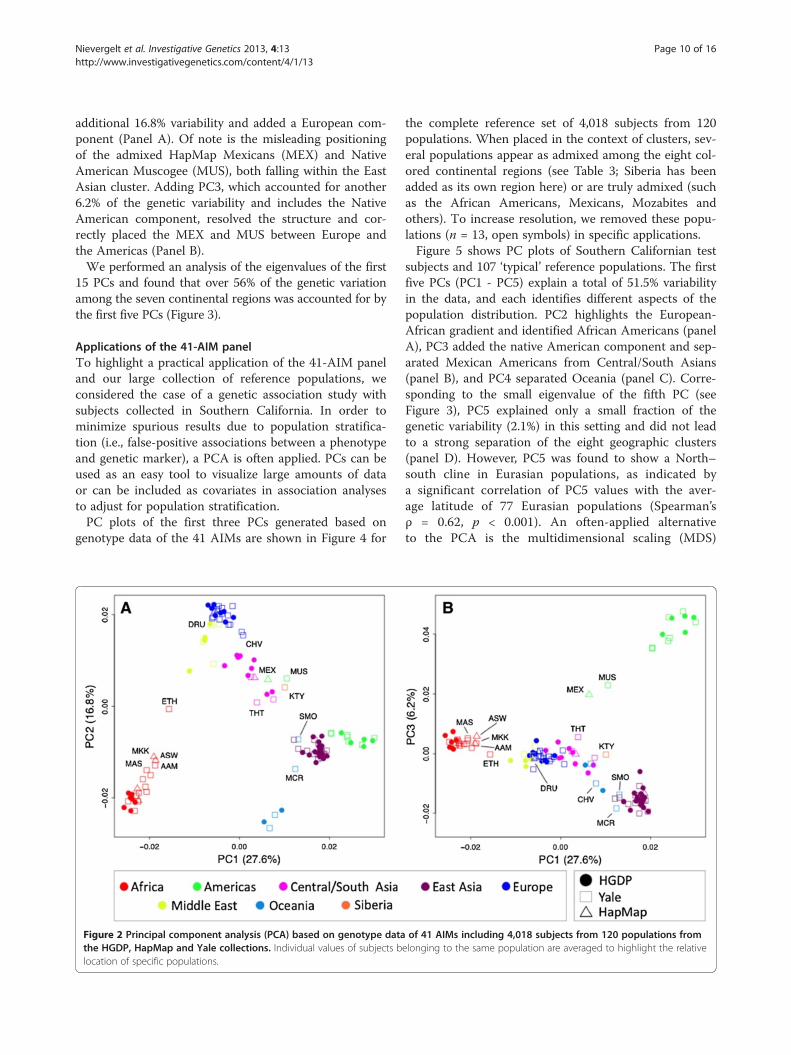
lections with the HGDP, and further analyses wereconducted with our complete reference population setincluding 4,018 subjects genotyped on the 41-AIMpanel. A principal component analysis (PCA) includingall 4,018 subjects and averaged for each of the 120 popu-lations is shown in Figure 2. We found that the first PCexplained 27.6% of the genetic variability in the data setand corresponded with the Africa to Americas gradientfound by STRUCTURE at K = 2. PC2 explained an
n the 41-AIM panel with clusters ranging from K2 - K7.
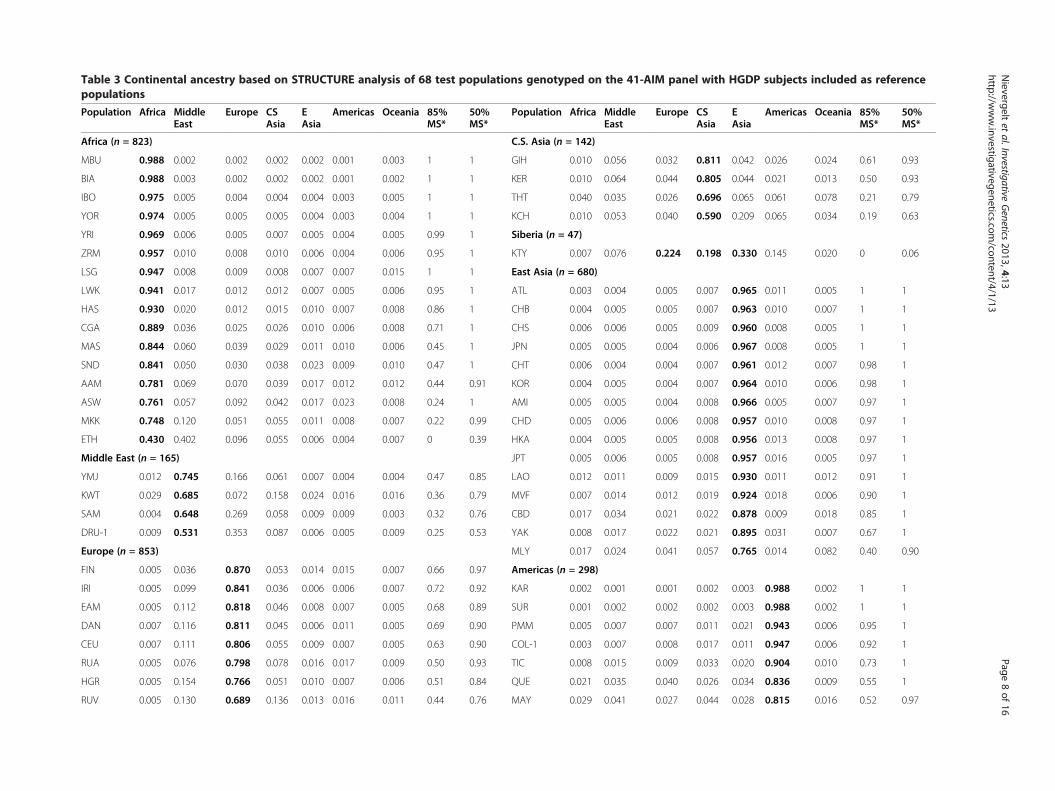
Table 3 Continental ancestry based on STRUCTURE analysis of 68 test populations genotyped on the 41-AIM panel with HGDP subjects included as referencepopulations
Population Africa MiddleEast
Europe CSAsia
EAsia
Americas Oceania 85%MS*
50%MS*
Population Africa MiddleEast
Europe CSAsia
EAsia
Americas Oceania 85%MS*
50%MS*
Africa (n = 823) C.S. Asia (n = 142)
MBU 0.988 0.002 0.002 0.002 0.002 0.001 0.003 1 1 GIH 0.010 0.056 0.032 0.811 0.042 0.026 0.024 0.61 0.93
BIA 0.988 0.003 0.002 0.002 0.002 0.001 0.002 1 1 KER 0.010 0.064 0.044 0.805 0.044 0.021 0.013 0.50 0.93
IBO 0.975 0.005 0.004 0.004 0.004 0.003 0.005 1 1 THT 0.040 0.035 0.026 0.696 0.065 0.061 0.078 0.21 0.79
YOR 0.974 0.005 0.005 0.005 0.004 0.003 0.004 1 1 KCH 0.010 0.053 0.040 0.590 0.209 0.065 0.034 0.19 0.63
YRI 0.969 0.006 0.005 0.007 0.005 0.004 0.005 0.99 1 Siberia (n = 47)
ZRM 0.957 0.010 0.008 0.010 0.006 0.004 0.006 0.95 1 KTY 0.007 0.076 0.224 0.198 0.330 0.145 0.020 0 0.06
LSG 0.947 0.008 0.009 0.008 0.007 0.007 0.015 1 1 East Asia (n = 680)
LWK 0.941 0.017 0.012 0.012 0.007 0.005 0.006 0.95 1 ATL 0.003 0.004 0.005 0.007 0.965 0.011 0.005 1 1
HAS 0.930 0.020 0.012 0.015 0.010 0.007 0.008 0.86 1 CHB 0.004 0.005 0.005 0.007 0.963 0.010 0.007 1 1
CGA 0.889 0.036 0.025 0.026 0.010 0.006 0.008 0.71 1 CHS 0.006 0.006 0.005 0.009 0.960 0.008 0.005 1 1
MAS 0.844 0.060 0.039 0.029 0.011 0.010 0.006 0.45 1 JPN 0.005 0.005 0.004 0.006 0.967 0.008 0.005 1 1
SND 0.841 0.050 0.030 0.038 0.023 0.009 0.010 0.47 1 CHT 0.006 0.004 0.004 0.007 0.961 0.012 0.007 0.98 1
AAM 0.781 0.069 0.070 0.039 0.017 0.012 0.012 0.44 0.91 KOR 0.004 0.005 0.004 0.007 0.964 0.010 0.006 0.98 1
ASW 0.761 0.057 0.092 0.042 0.017 0.023 0.008 0.24 1 AMI 0.005 0.005 0.004 0.008 0.966 0.005 0.007 0.97 1
MKK 0.748 0.120 0.051 0.055 0.011 0.008 0.007 0.22 0.99 CHD 0.005 0.006 0.006 0.008 0.957 0.010 0.008 0.97 1
ETH 0.430 0.402 0.096 0.055 0.006 0.004 0.007 0 0.39 HKA 0.004 0.005 0.005 0.008 0.956 0.013 0.008 0.97 1
Middle East (n = 165) JPT 0.005 0.006 0.005 0.008 0.957 0.016 0.005 0.97 1
YMJ 0.012 0.745 0.166 0.061 0.007 0.004 0.004 0.47 0.85 LAO 0.012 0.011 0.009 0.015 0.930 0.011 0.012 0.91 1
KWT 0.029 0.685 0.072 0.158 0.024 0.016 0.016 0.36 0.79 MVF 0.007 0.014 0.012 0.019 0.924 0.018 0.006 0.90 1
SAM 0.004 0.648 0.269 0.058 0.009 0.009 0.003 0.32 0.76 CBD 0.017 0.034 0.021 0.022 0.878 0.009 0.018 0.85 1
DRU-1 0.009 0.531 0.353 0.087 0.006 0.005 0.009 0.25 0.53 YAK 0.008 0.017 0.022 0.021 0.895 0.031 0.007 0.67 1
Europe (n = 853) MLY 0.017 0.024 0.041 0.057 0.765 0.014 0.082 0.40 0.90
FIN 0.005 0.036 0.870 0.053 0.014 0.015 0.007 0.66 0.97 Americas (n = 298)
IRI 0.005 0.099 0.841 0.036 0.006 0.006 0.007 0.72 0.92 KAR 0.002 0.001 0.001 0.002 0.003 0.988 0.002 1 1
EAM 0.005 0.112 0.818 0.046 0.008 0.007 0.005 0.68 0.89 SUR 0.001 0.002 0.002 0.002 0.003 0.988 0.002 1 1
DAN 0.007 0.116 0.811 0.045 0.006 0.011 0.005 0.69 0.90 PMM 0.005 0.007 0.007 0.011 0.021 0.943 0.006 0.95 1
CEU 0.007 0.111 0.806 0.055 0.009 0.007 0.005 0.63 0.90 COL-1 0.003 0.007 0.008 0.017 0.011 0.947 0.006 0.92 1
RUA 0.005 0.076 0.798 0.078 0.016 0.017 0.009 0.50 0.93 TIC 0.008 0.015 0.009 0.033 0.020 0.904 0.010 0.73 1
HGR 0.005 0.154 0.766 0.051 0.010 0.007 0.006 0.51 0.84 QUE 0.021 0.035 0.040 0.026 0.034 0.836 0.009 0.55 1
RUV 0.005 0.130 0.689 0.136 0.013 0.016 0.011 0.44 0.76 MAY 0.029 0.041 0.027 0.044 0.028 0.815 0.016 0.52 0.97
Nievergelt
etal.Investigative
Genetics
2013,4:13Page
8of
16http://w
ww.investigativegenetics.com
/content/4/1/13
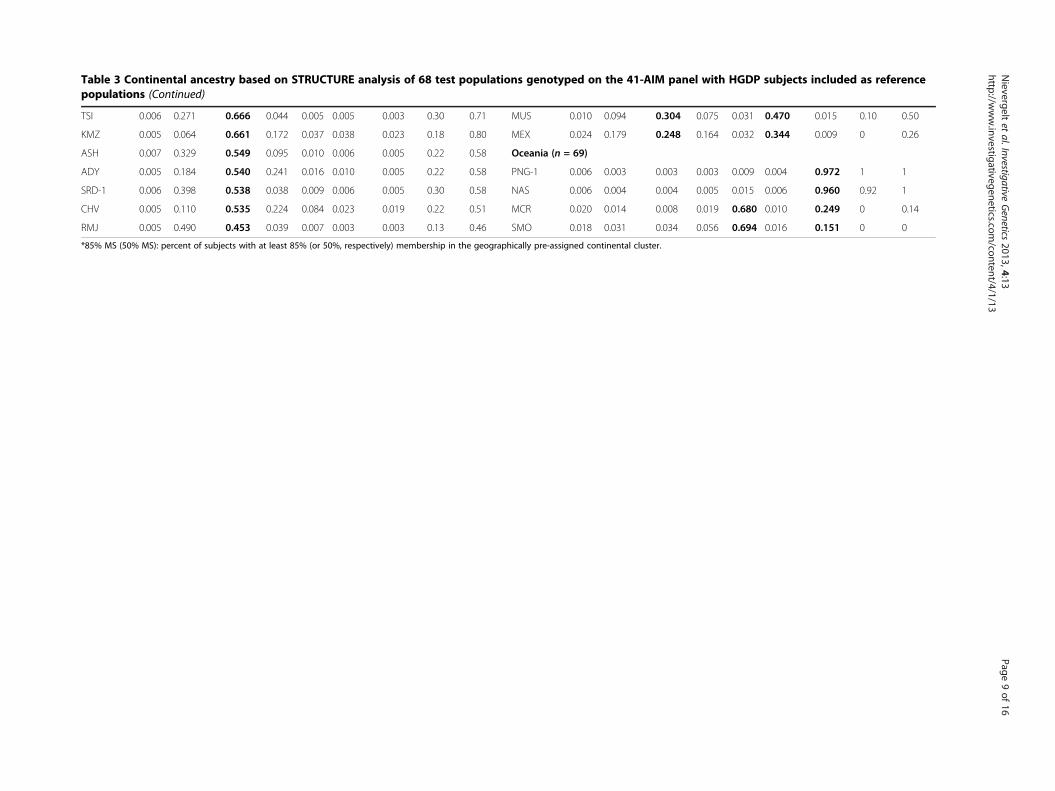
Table 3 Continental ancestry based on STRUCTURE analysis of 68 test populations genotyped on the 41-AIM panel with HGDP subjects included as referencepopulations (Continued)
TSI 0.006 0.271 0.666 0.044 0.005 0.005 0.003 0.30 0.71 MUS 0.010 0.094 0.304 0.075 0.031 0.470 0.015 0.10 0.50
KMZ 0.005 0.064 0.661 0.172 0.037 0.038 0.023 0.18 0.80 MEX 0.024 0.179 0.248 0.164 0.032 0.344 0.009 0 0.26
ASH 0.007 0.329 0.549 0.095 0.010 0.006 0.005 0.22 0.58 Oceania (n = 69)
ADY 0.005 0.184 0.540 0.241 0.016 0.010 0.005 0.22 0.58 PNG-1 0.006 0.003 0.003 0.003 0.009 0.004 0.972 1 1
SRD-1 0.006 0.398 0.538 0.038 0.009 0.006 0.005 0.30 0.58 NAS 0.006 0.004 0.004 0.005 0.015 0.006 0.960 0.92 1
CHV 0.005 0.110 0.535 0.224 0.084 0.023 0.019 0.22 0.51 MCR 0.020 0.014 0.008 0.019 0.680 0.010 0.249 0 0.14
RMJ 0.005 0.490 0.453 0.039 0.007 0.003 0.003 0.13 0.46 SMO 0.018 0.031 0.034 0.056 0.694 0.016 0.151 0 0
*85% MS (50% MS): percent of subjects with at least 85% (or 50%, respectively) membership in the geographically pre-assigned continental cluster.
Nievergelt
etal.Investigative
Genetics
2013,4:13Page
9of
16http://w
ww.investigativegenetics.com
/content/4/1/13
Nievergelt et al. Investigative Genetics 2013, 4:13 Page 10 of 16http://www.investigativegenetics.com/content/4/1/13
additional 16.8% variability and added a European com-ponent (Panel A). Of note is the misleading positioningof the admixed HapMap Mexicans (MEX) and NativeAmerican Muscogee (MUS), both falling within the EastAsian cluster. Adding PC3, which accounted for another6.2% of the genetic variability and includes the NativeAmerican component, resolved the structure and cor-rectly placed the MEX and MUS between Europe andthe Americas (Panel B).We performed an analysis of the eigenvalues of the first
15 PCs and found that over 56% of the genetic variationamong the seven continental regions was accounted for bythe first five PCs (Figure 3).
Applications of the 41-AIM panelTo highlight a practical application of the 41-AIM paneland our large collection of reference populations, weconsidered the case of a genetic association study withsubjects collected in Southern California. In order tominimize spurious results due to population stratifica-tion (i.e., false-positive associations between a phenotypeand genetic marker), a PCA is often applied. PCs can beused as an easy tool to visualize large amounts of dataor can be included as covariates in association analysesto adjust for population stratification.PC plots of the first three PCs generated based on
genotype data of the 41 AIMs are shown in Figure 4 for
Figure 2 Principal component analysis (PCA) based on genotype datathe HGDP, HapMap and Yale collections. Individual values of subjects blocation of specific populations.
the complete reference set of 4,018 subjects from 120populations. When placed in the context of clusters, sev-eral populations appear as admixed among the eight col-ored continental regions (see Table 3; Siberia has beenadded as its own region here) or are truly admixed (suchas the African Americans, Mexicans, Mozabites andothers). To increase resolution, we removed these popu-lations (n = 13, open symbols) in specific applications.Figure 5 shows PC plots of Southern Californian test
subjects and 107 ‘typical’ reference populations. The firstfive PCs (PC1 - PC5) explain a total of 51.5% variabilityin the data, and each identifies different aspects of thepopulation distribution. PC2 highlights the European-African gradient and identified African Americans (panelA), PC3 added the native American component and sep-arated Mexican Americans from Central/South Asians(panel B), and PC4 separated Oceania (panel C). Corre-sponding to the small eigenvalue of the fifth PC (seeFigure 3), PC5 explained only a small fraction of thegenetic variability (2.1%) in this setting and did not leadto a strong separation of the eight geographic clusters(panel D). However, PC5 was found to show a North–south cline in Eurasian populations, as indicated bya significant correlation of PC5 values with the aver-age latitude of 77 Eurasian populations (Spearman’sρ = 0.62, p < 0.001). An often-applied alternativeto the PCA is the multidimensional scaling (MDS)
of 41 AIMs including 4,018 subjects from 120 populations fromelonging to the same population are averaged to highlight the relative
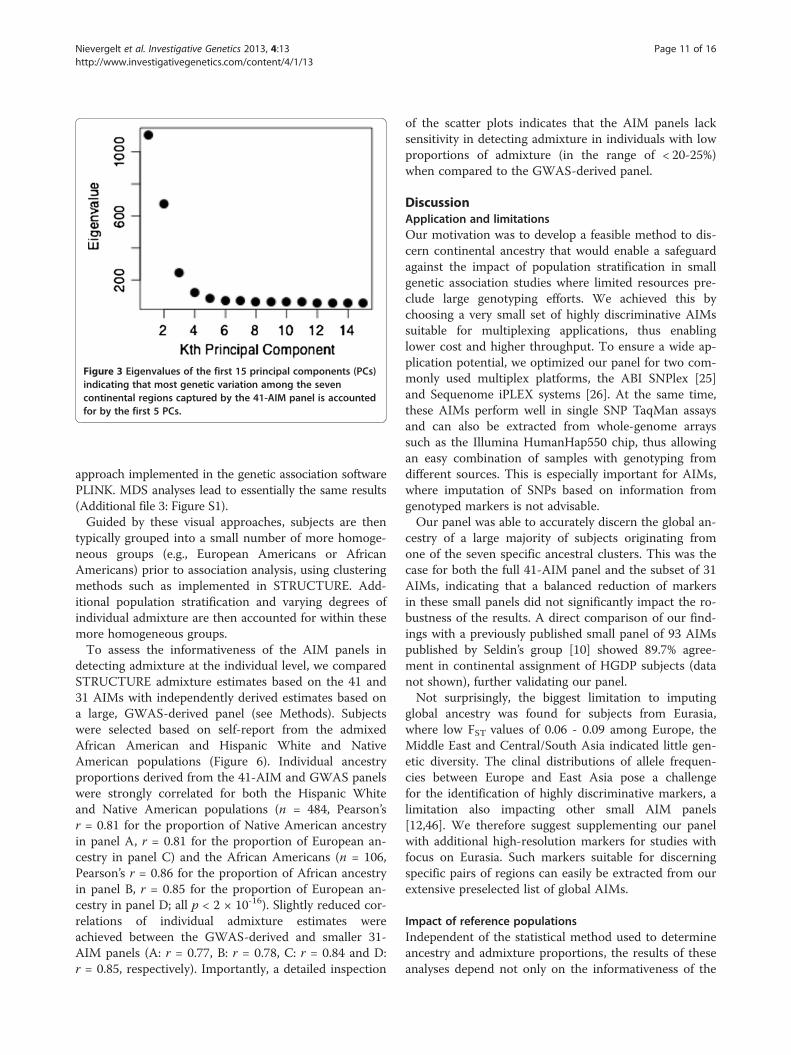
Figure 3 Eigenvalues of the first 15 principal components (PCs)indicating that most genetic variation among the sevencontinental regions captured by the 41-AIM panel is accountedfor by the first 5 PCs.
Nievergelt et al. Investigative Genetics 2013, 4:13 Page 11 of 16http://www.investigativegenetics.com/content/4/1/13
approach implemented in the genetic association softwarePLINK. MDS analyses lead to essentially the same results(Additional file 3: Figure S1).Guided by these visual approaches, subjects are then
typically grouped into a small number of more homoge-neous groups (e.g., European Americans or AfricanAmericans) prior to association analysis, using clusteringmethods such as implemented in STRUCTURE. Add-itional population stratification and varying degrees ofindividual admixture are then accounted for within thesemore homogeneous groups.To assess the informativeness of the AIM panels in
detecting admixture at the individual level, we comparedSTRUCTURE admixture estimates based on the 41 and31 AIMs with independently derived estimates based ona large, GWAS-derived panel (see Methods). Subjectswere selected based on self-report from the admixedAfrican American and Hispanic White and NativeAmerican populations (Figure 6). Individual ancestryproportions derived from the 41-AIM and GWAS panelswere strongly correlated for both the Hispanic Whiteand Native American populations (n = 484, Pearson’sr = 0.81 for the proportion of Native American ancestryin panel A, r = 0.81 for the proportion of European an-cestry in panel C) and the African Americans (n = 106,Pearson’s r = 0.86 for the proportion of African ancestryin panel B, r = 0.85 for the proportion of European an-cestry in panel D; all p < 2 × 10-16). Slightly reduced cor-relations of individual admixture estimates wereachieved between the GWAS-derived and smaller 31-AIM panels (A: r = 0.77, B: r = 0.78, C: r = 0.84 and D:r = 0.85, respectively). Importantly, a detailed inspection
of the scatter plots indicates that the AIM panels lacksensitivity in detecting admixture in individuals with lowproportions of admixture (in the range of < 20-25%)when compared to the GWAS-derived panel.
DiscussionApplication and limitationsOur motivation was to develop a feasible method to dis-cern continental ancestry that would enable a safeguardagainst the impact of population stratification in smallgenetic association studies where limited resources pre-clude large genotyping efforts. We achieved this bychoosing a very small set of highly discriminative AIMssuitable for multiplexing applications, thus enablinglower cost and higher throughput. To ensure a wide ap-plication potential, we optimized our panel for two com-monly used multiplex platforms, the ABI SNPlex [25]and Sequenome iPLEX systems [26]. At the same time,these AIMs perform well in single SNP TaqMan assaysand can also be extracted from whole-genome arrayssuch as the Illumina HumanHap550 chip, thus allowingan easy combination of samples with genotyping fromdifferent sources. This is especially important for AIMs,where imputation of SNPs based on information fromgenotyped markers is not advisable.Our panel was able to accurately discern the global an-
cestry of a large majority of subjects originating fromone of the seven specific ancestral clusters. This was thecase for both the full 41-AIM panel and the subset of 31AIMs, indicating that a balanced reduction of markersin these small panels did not significantly impact the ro-bustness of the results. A direct comparison of our find-ings with a previously published small panel of 93 AIMspublished by Seldin’s group [10] showed 89.7% agree-ment in continental assignment of HGDP subjects (datanot shown), further validating our panel.Not surprisingly, the biggest limitation to imputing
global ancestry was found for subjects from Eurasia,where low FST values of 0.06 - 0.09 among Europe, theMiddle East and Central/South Asia indicated little gen-etic diversity. The clinal distributions of allele frequen-cies between Europe and East Asia pose a challengefor the identification of highly discriminative markers, alimitation also impacting other small AIM panels[12,46]. We therefore suggest supplementing our panelwith additional high-resolution markers for studies withfocus on Eurasia. Such markers suitable for discerningspecific pairs of regions can easily be extracted from ourextensive preselected list of global AIMs.
Impact of reference populationsIndependent of the statistical method used to determineancestry and admixture proportions, the results of theseanalyses depend not only on the informativeness of the
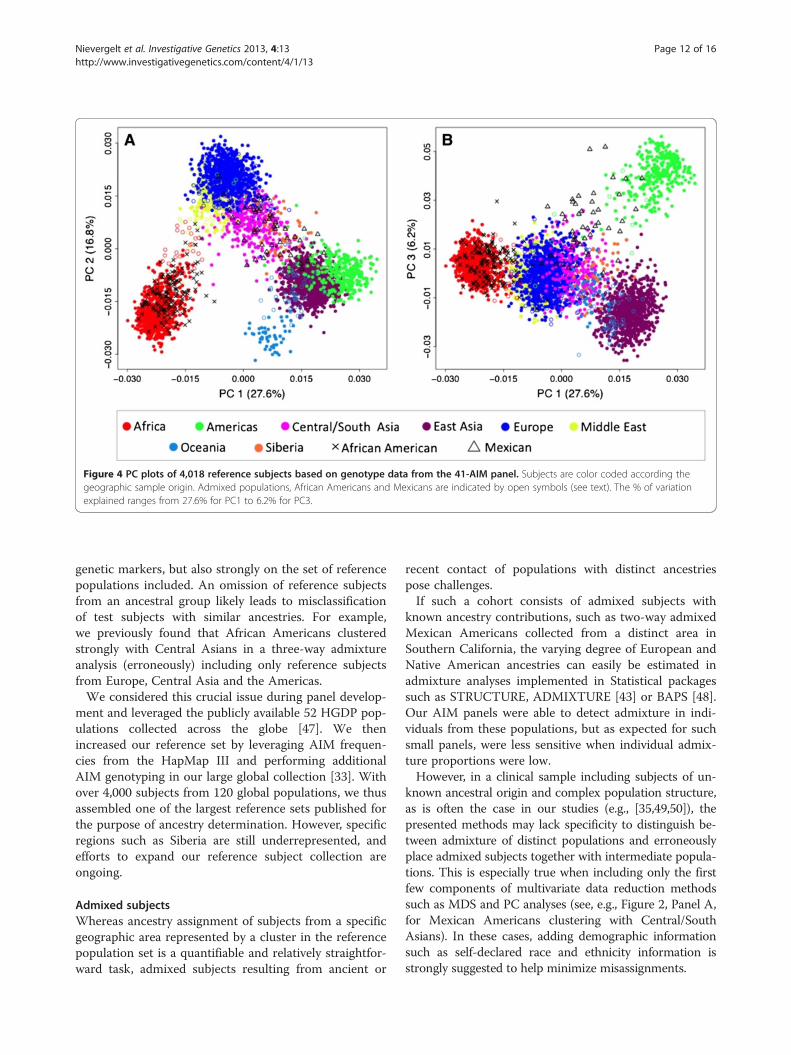
Figure 4 PC plots of 4,018 reference subjects based on genotype data from the 41-AIM panel. Subjects are color coded according thegeographic sample origin. Admixed populations, African Americans and Mexicans are indicated by open symbols (see text). The % of variationexplained ranges from 27.6% for PC1 to 6.2% for PC3.
Nievergelt et al. Investigative Genetics 2013, 4:13 Page 12 of 16http://www.investigativegenetics.com/content/4/1/13
genetic markers, but also strongly on the set of referencepopulations included. An omission of reference subjectsfrom an ancestral group likely leads to misclassificationof test subjects with similar ancestries. For example,we previously found that African Americans clusteredstrongly with Central Asians in a three-way admixtureanalysis (erroneously) including only reference subjectsfrom Europe, Central Asia and the Americas.We considered this crucial issue during panel develop-
ment and leveraged the publicly available 52 HGDP pop-ulations collected across the globe [47]. We thenincreased our reference set by leveraging AIM frequen-cies from the HapMap III and performing additionalAIM genotyping in our large global collection [33]. Withover 4,000 subjects from 120 global populations, we thusassembled one of the largest reference sets published forthe purpose of ancestry determination. However, specificregions such as Siberia are still underrepresented, andefforts to expand our reference subject collection areongoing.
Admixed subjectsWhereas ancestry assignment of subjects from a specificgeographic area represented by a cluster in the referencepopulation set is a quantifiable and relatively straightfor-ward task, admixed subjects resulting from ancient or
recent contact of populations with distinct ancestriespose challenges.If such a cohort consists of admixed subjects with
known ancestry contributions, such as two-way admixedMexican Americans collected from a distinct area inSouthern California, the varying degree of European andNative American ancestries can easily be estimated inadmixture analyses implemented in Statistical packagessuch as STRUCTURE, ADMIXTURE [43] or BAPS [48].Our AIM panels were able to detect admixture in indi-viduals from these populations, but as expected for suchsmall panels, were less sensitive when individual admix-ture proportions were low.However, in a clinical sample including subjects of un-
known ancestral origin and complex population structure,as is often the case in our studies (e.g., [35,49,50]), thepresented methods may lack specificity to distinguish be-tween admixture of distinct populations and erroneouslyplace admixed subjects together with intermediate popula-tions. This is especially true when including only the firstfew components of multivariate data reduction methodssuch as MDS and PC analyses (see, e.g., Figure 2, Panel A,for Mexican Americans clustering with Central/SouthAsians). In these cases, adding demographic informationsuch as self-declared race and ethnicity information isstrongly suggested to help minimize misassignments.
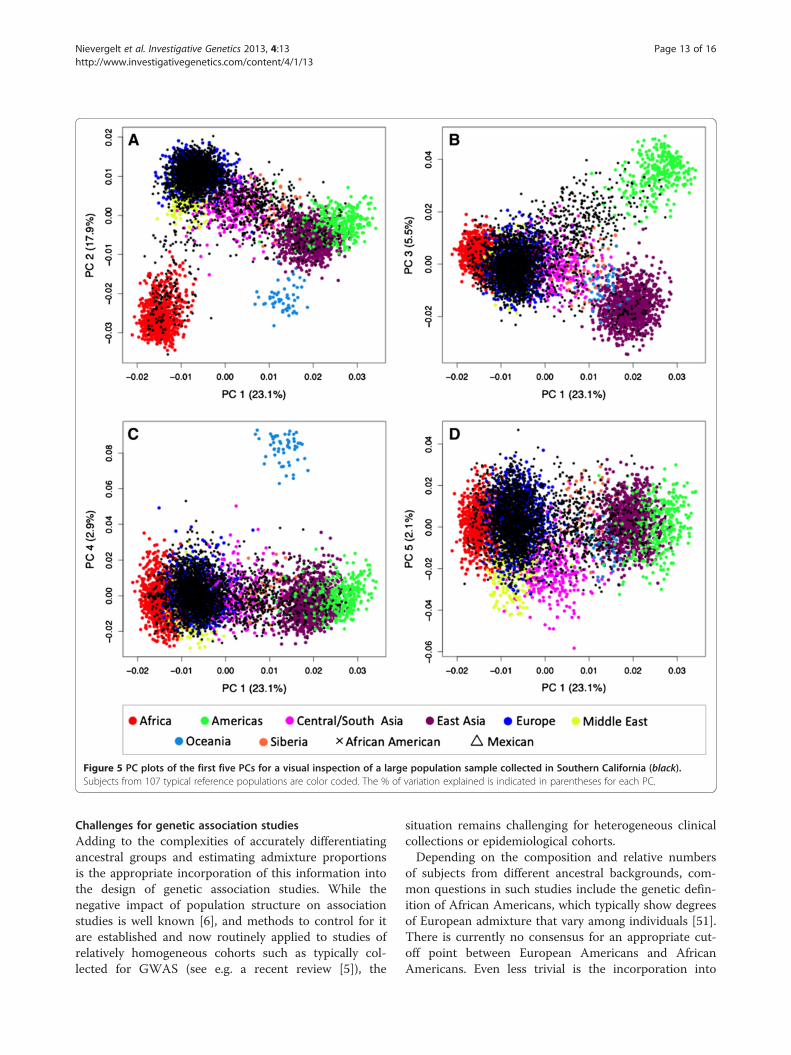
Figure 5 PC plots of the first five PCs for a visual inspection of a large population sample collected in Southern California (black).Subjects from 107 typical reference populations are color coded. The % of variation explained is indicated in parentheses for each PC.
Nievergelt et al. Investigative Genetics 2013, 4:13 Page 13 of 16http://www.investigativegenetics.com/content/4/1/13
Challenges for genetic association studiesAdding to the complexities of accurately differentiatingancestral groups and estimating admixture proportionsis the appropriate incorporation of this information intothe design of genetic association studies. While thenegative impact of population structure on associationstudies is well known [6], and methods to control for itare established and now routinely applied to studies ofrelatively homogeneous cohorts such as typically col-lected for GWAS (see e.g. a recent review [5]), the
situation remains challenging for heterogeneous clinicalcollections or epidemiological cohorts.Depending on the composition and relative numbers
of subjects from different ancestral backgrounds, com-mon questions in such studies include the genetic defin-ition of African Americans, which typically show degreesof European admixture that vary among individuals [51].There is currently no consensus for an appropriate cut-off point between European Americans and AfricanAmericans. Even less trivial is the incorporation into
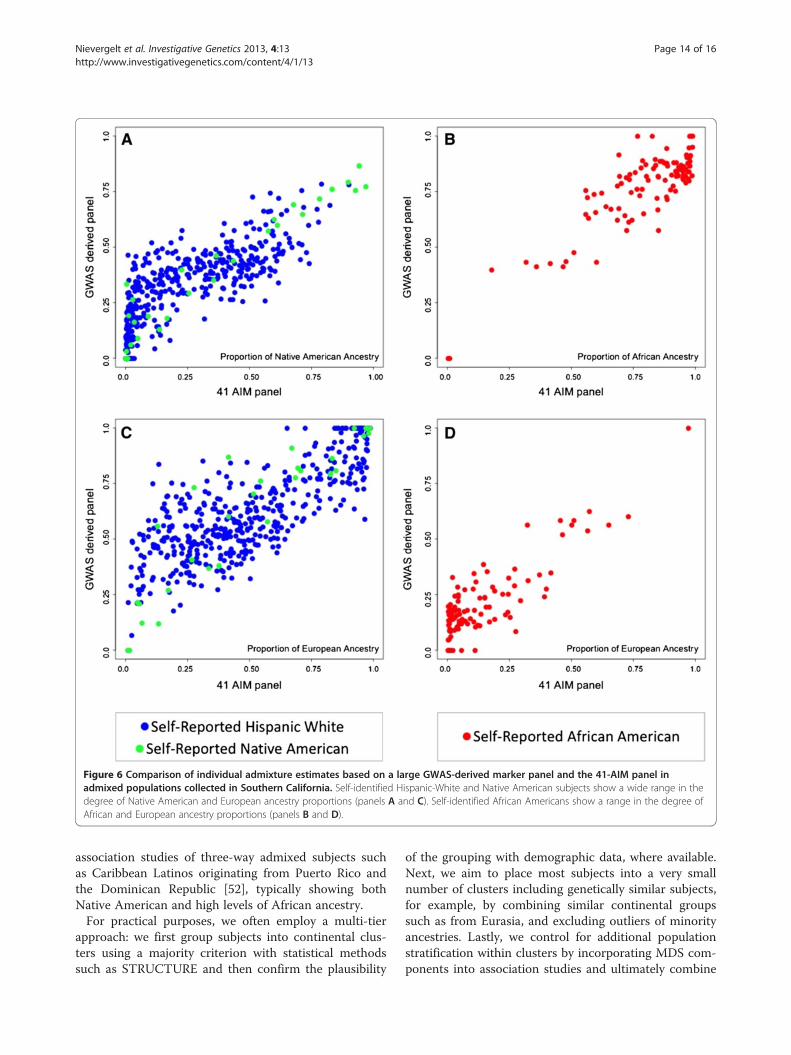
Figure 6 Comparison of individual admixture estimates based on a large GWAS-derived marker panel and the 41-AIM panel inadmixed populations collected in Southern California. Self-identified Hispanic-White and Native American subjects show a wide range in thedegree of Native American and European ancestry proportions (panels A and C). Self-identified African Americans show a range in the degree ofAfrican and European ancestry proportions (panels B and D).
Nievergelt et al. Investigative Genetics 2013, 4:13 Page 14 of 16http://www.investigativegenetics.com/content/4/1/13
association studies of three-way admixed subjects suchas Caribbean Latinos originating from Puerto Rico andthe Dominican Republic [52], typically showing bothNative American and high levels of African ancestry.For practical purposes, we often employ a multi-tier
approach: we first group subjects into continental clus-ters using a majority criterion with statistical methodssuch as STRUCTURE and then confirm the plausibility
of the grouping with demographic data, where available.Next, we aim to place most subjects into a very smallnumber of clusters including genetically similar subjects,for example, by combining similar continental groupssuch as from Eurasia, and excluding outliers of minorityancestries. Lastly, we control for additional populationstratification within clusters by incorporating MDS com-ponents into association studies and ultimately combine
Nievergelt et al. Investigative Genetics 2013, 4:13 Page 15 of 16http://www.investigativegenetics.com/content/4/1/13
results in meta-analyses, where appropriate. Such amethod was, for example, employed for the SouthernCalifornian population sample presented here, whichencompassed a wide array of self-declared ethnic groups.Our approach resulted in a four-cluster analysis with61% European Americans, 18% subjects with NativeAmerican admixture, 7% subjects with African admix-ture, and 15% subjects of other ancestry and/or complexadmixtures.
ConclusionIn conclusion, we demonstrated the utility and limita-tions of a small AIM panel specifically developed to dis-cern global ancestry. We believe that it will find wideapplication because of its feasibility and potential for awide range of applications. To allow this reference set tobe readily accessible for others to use, we are enteringthe allele frequencies for these 41 SNPs into ALFRED(alfred.med.yale.edu) [34] as an “SNP Set.” To allowready estimation of likelihoods of ancestry of individuals,these SNPs are also being entered as an additionalAISNP Panel in FROG-kb (frog.med.yale.edu) [53].
Additional files
Additional file 1: Table S1. Geographic sampling location, populationname, number of subjects and source of genotype data of 120 referencepopulations.
Additional file 2: Table S2. Chromosomal position (GRCh37.p5), allelesand informativeness (I_n) of 1,442 continental AIMs and sequenceinformation for the multiplex 41-AIM and 31-AIM panels.
Additional file 3: Figure S1. MDS plots of the first five MDScomponents for a visual inspection of a large population samplecollected in Southern California (black). Subjects from 107 typicalreference populations are color coded.
AbbreviationsALFRED: allele frequency database; AIM: ancestry informative marker;AISNP: ancestry informative single nucleotide polymorphism; δ: allelefrequency differences; MS: cluster membership; GWAS: genome-wideassociation study; I_n: marker informativeness; MDS: multi-dimensionalscaling; PC: principal component; PCA: principal component analysis.
Competing interestsThe authors declare that they have no competing interests.
Author‘s contributionsAll authors read and approved the final manuscript. CMN conceived of thestudy, participated in its design and coordination, and wrote the manuscript.TS carried out genotyping. AXM performed the statistical analyses. KKK andJRK participated in the coordination of the study and in the writing of themanuscript. XW carried out genotyping and assisted in preliminary analysesat Yale. All authors read and approved the final manuscript.
AcknowledgementsCMN is supported by NIH grants 1 R01MH093500, R01 AG030474, 3U01HD052104, 1 U01 MH092758 and BUMED, and by the Marine Corps andNavy Bureau of Medicine and Surgery. KKK and JRK have been supported inpart by grants 2010-DN-BX-K225 and 2010-DN-BX-K226 awarded by theNational Institute of Justice, Office of Justice Programs, US Department ofJustice, and also in part by NSF grant BCS0938633. Points of view in this
document are those of the authors and do not necessarily represent theofficial position or policies of the US Department of Justice.
Author details1Department of Psychiatry, School of Medicine, University of San DiegoCalifornia, La Jolla 92093, CA, USA. 2Department of Molecular and ExperimentMedicine, The Scripps Research Institute, La Jolla 92037, CA, USA.3Chongqing Medical University, Chongqing, Sichuan, China. 4Genetics Dept,Yale University School of Medicine, New Haven 06520, CT, USA.
Received: 19 November 2012 Accepted: 14 May 2013Published: 1 July 2013
References1. Tishkoff SA, Kidd KK: Implications of biogeography of human populations
for ‘race’ and medicine. Nat Genet 2004, 36:S21–S27.2. Yaeger R, Avila-Bront A, Abdul K, Nolan PC, Grann VR, Birchette MG,
Choudhry S, Burchard EG, Beckman KB, Gorroochurn P, et al: Comparinggenetic ancestry and self-described race in african americans born in theUnited States and in Africa. Cancer Epidemiol Biomarkers Prev 2008,17:1329–1338.
3. Manica A, Prugnolle F, Balloux F: Geography is a better determinant ofhuman genetic differentiation than ethnicity. Hum Genet 2005,118:366–371.
4. Nievergelt CM, Schork NJ: Admixture mapping as a gene discoveryapproach for complex human traits and diseases. Curr Hypertens Rep2005, 7:31–37.
5. Price AL, Zaitlen NA, Reich D, Patterson N: New approaches to populationstratification in genome-wide association studies. Nat Rev Genet 2010,11:459–463.
6. Marchini J, Cardon LR, Phillips MS, Donnelly P: The effects of humanpopulation structure on large genetic association studies. Nat Genet 2004,36:512–517.
7. Mao X, Bigham AW, Mei R, Gutierrez G, Weiss KM, Brutsaert TD, Leon-Velarde F, Moore LG, Vargas E, McKeigue PM, et al: A genomewideadmixture mapping panel for Hispanic/Latino populations. Am J HumGenet 2007, 80:1171–1178.
8. Tian C, Hinds DA, Shigeta R, Kittles R, Ballinger DG, Seldin MF: Agenomewide single-nucleotide-polymorphism panel with high ancestryinformation for African American admixture mapping. Am J Hum Genet2006, 79:640–649.
9. Galanter JM, Fernandez-Lopez JC, Gignoux CR, Barnholtz-Sloan J, Fernandez-Rozadilla C, Via M, Hidalgo-Miranda A, Contreras AV, Figueroa LU, Raska P, etal: Development of a panel of genome-wide ancestry informativemarkers to study admixture throughout the Americas. PLoS Genet 2012,8:e1002554.
10. Nassir R, Kosoy R, Tian C, White PA, Butler LM, Silva G, Kittles R, Alarcon-Riquelme ME, Gregersen PK, Belmont JW, et al: An ancestry informativemarker set for determining continental origin: validation and extensionusing human genome diversity panels. BMC Genet 2009, 10:39.
11. Paschou P, Lewis J, Javed A, Drineas P: Ancestry informative markers forfine-scale individual assignment to worldwide populations. J Med Genet2010, 47:835–847.
12. Phillips C, Salas A, Sanchez JJ, Fondevila M, Gomez-Tato A, Alvarez-Dios J,Calaza M, De Cal MC, Ballard D, Lareu MV, Carracedo A: Inferring ancestralorigin using a single multiplex assay of ancestry-informative markerSNPs. Forensic Sci Int Genet 2007, 1:273–280.
13. Kidd JR, Friedlaender F, Pakstis AJ, Furtado M, Fang R, Wang X, NievergeltCM, Kidd KK: Single nucleotide polymorphisms and haplotypes in NativeAmerican populations. Am J Phys Anthropol 2011, 146:495–502.
14. Kosoy R, Nassir R, Tian C, White PA, Butler LM, Silva G, Kittles R, Alarcon-Riquelme ME, Gregersen PK, Belmont JW, et al: Ancestry informativemarker sets for determining continental origin and admixtureproportions in common populations in America. Hum Mutat 2009,30:69–78.
15. Collins-Schramm HE, Chima B, Morii T, Wah K, Figueroa Y, Criswell LA,Hanson RL, Knowler WC, Silva G, Belmont JW, Seldin MF: MexicanAmerican ancestry-informative markers: examination of populationstructure and marker characteristics in European Americans, MexicanAmericans, Amerindians and Asians. Hum Genet 2004, 114:263–271.
Nievergelt et al. Investigative Genetics 2013, 4:13 Page 16 of 16http://www.investigativegenetics.com/content/4/1/13
16. Tian C, Plenge RM, Ransom M, Lee A, Villoslada P, Selmi C, Klareskog L,Pulver AE, Qi L, Gregersen PK, Seldin MF: Analysis and application ofEuropean genetic substructure using 300 K SNP information. PLoS Genet2008, 4:e4.
17. Price AL, Butler J, Patterson N, Capelli C, Pascali VL, Scarnicci F, Ruiz-LinaresA, Groop L, Saetta AA, Korkolopoulou P, et al: Discerning the ancestry ofEuropean Americans in genetic association studies. PLoS Genet 2008,4:e236.
18. Bauchet M, McEvoy B, Pearson LN, Quillen EE, Sarkisian T, Hovhannesyan K,Deka R, Bradley DG, Shriver MD: Measuring European populationstratification with microarray genotype data. Am J Hum Genet 2007,80:948–956.
19. Drineas P, Lewis J, Paschou P: Inferring geographic coordinates of originfor Europeans using small panels of ancestry informative markers.PLoS One 2010, 5:e11892.
20. Tian C, Kosoy R, Nassir R, Lee A, Villoslada P, Klareskog L, Hammarstrom L,Garchon HJ, Pulver AE, Ransom M, et al: European population geneticsubstructure: further definition of ancestry informative markers fordistinguishing among diverse European ethnic groups. Mol Med 2009,15:371–383.
21. Parra EJ, Marcini A, Akey J, Martinson J, Batzer MA, Cooper R, Forrester T,Allison DB, Deka R, Ferrell RE, Shriver MD: Estimating African Americanadmixture proportions by use of population-specific alleles. Am J HumGenet 1998, 63:1839–1851.
22. Collins-Schramm HE, Chima B, Operario DJ, Criswell LA, Seldin MF: Markersinformative for ancestry demonstrate consistent megabase-lengthlinkage disequilibrium in the African American population. Hum Genet2003, 113:211–219.
23. Serre D, Paabo S: Evidence for gradients of human genetic diversitywithin and among continents. Genome Res 2004, 14:1679–1685.
24. Rosenberg NA, Mahajan S, Ramachandran S, Zhao C, Pritchard JK, FeldmanMW: Clines, clusters, and the effect of study design on the inference ofhuman population structure. PLoS Genet 2005, 1:e70.
25. Tobler AR, Short S, Andersen MR, Paner TM, Briggs JC, Lambert SM, Wu PP,Wang Y, Spoonde AY, Koehler RT, et al: The SNPlex genotyping system: aflexible and scalable platform for SNP genotyping. J Biomol Tech 2005,16:398–406.
26. Gabriel S, Ziaugra L, Tabbaa D: SNP genotyping using the SequenomMassARRAY iPLEX platform. Curr Protoc Hum Genet 2009, 2:2–12.
27. Gabriel SB, Schaffner SF, Nguyen H, Moore JM, Roy J, Blumenstiel B, HigginsJ, DeFelice M, Lochner A, Faggart M, et al: The structure of haplotypeblocks in the human genome. Science 2002, 296:2225–2229.
28. Li JZ, Absher DM, Tang H, Southwick AM, Casto AM, Ramachandran S, CannHM, Barsh GS, Feldman M, Cavalli-Sforza LL, Myers RM: Worldwide humanrelationships inferred from genome-wide patterns of variation. Science2008, 319:1100–1104.
29. Rosenberg NA: Standardized subsets of the HGDP-CEPH Human GenomeDiversity Cell Line Panel, accounting for atypical and duplicated samplesand pairs of close relatives. Ann Hum Genet 2006, 70:841–847.
30. Rosenberg NA, Li LM, Ward R, Pritchard JK: Informativeness of geneticmarkers for inference of ancestry. Am J Hum Genet 2003, 73:1402–1422.
31. Purcell S, Neale B, Todd-Brown K, Thomas L, Ferreira MA, Bender D, Maller J,Sklar P, De Bakker PI, Daly MJ, Sham PC: PLINK: a tool set for whole-genome association and population-based linkage analyses. Am J HumGenet 2007, 81:559–575.
32. Pemberton TJ, Wang C, Li JZ, Rosenberg NA: Inference of unexpectedgenetic relatedness among individuals in HapMap Phase III. Am J HumGenet 2010, 87:457–464.
33. Kidd JR, Friedlaender FR, Speed WC, Pakstis AJ, De La Vega FM, Kidd KK:Analyses of a set of 128 ancestry informative single-nucleotidepolymorphisms in a global set of 119 population samples. Investig Genet2011, 2:1.
34. Rajeevan H, Soundararajan U, Kidd JR, Pakstis AJ, Kidd KK: ALFRED: an allelefrequency resource for research and teaching. Nucleic Acids Res 2011, 40:D1010–D1015.
35. Baker DG, Nash WP, Litz BT, Geyer MA, Risbrough VB, Nievergelt CM,O‘Connor DT, Larson GE, Schork NJ, Vasterling JJ, et al: Predictors of riskand resilience for posttraumatic stress disorder among ground combatmarines: methods of the marine resiliency study. Prev Chronic Dis 2012,9:E97.
36. Pritchard JK, Stephens M, Donnelly P: Inference of population structureusing multilocus genotype data. Genetics 2000, 155:945–959.
37. Falush D, Stephens M, Pritchard JK: Inference of population structureusing multilocus genotype data: linked loci and correlated allelefrequencies. Genetics 2003, 164:1567–1587.
38. Rosenberg NA: DISTRUCT: a program for the graphical display ofpopulation structure. Mol Ecol Notes 2004, 4:137–138.
39. Jakobsson M, Rosenberg NA: CLUMPP: a cluster matching andpermutation program for dealing with label switching andmultimodality in analysis of population structure. Bioinformatics 2007,23:1801–1806.
40. Price AL, Patterson NJ, Plenge RM, Weinblatt ME, Shadick NA, Reich D:Principal components analysis corrects for stratification in genome-wideassociation studies. Nat Genet 2006, 38:904–909.
41. Excoffier L, Lischer HE: Arlequin suite ver 3.5: a new series of programs toperform population genetics analyses under Linux and Windows. MolEcol Resour 2010, 10:564–567.
42. Libiger O, Schork NJ: A method for inferring an individual‘s geneticancestry and degree of admixture associated with six major continentalpopulations. Front Genet 2013, 3:1–11.
43. Alexander DH, Novembre J, Lange K: Fast model-based estimation ofancestry in unrelated individuals. Genome Res 2009, 19:1655–1664.
44. Rosenberg NA, Pritchard JK, Weber JL, Cann HM, Kidd KK, Zhivotovsky LA,Feldman MW: Genetic structure of human populations. Science 2002,298:2381–2385.
45. Altshuler DM, Gibbs RA, Peltonen L, Dermitzakis E, Schaffner SF, Yu F,Bonnen PE, De Bakker PI, Deloukas P, Gabriel SB, et al: Integrating commonand rare genetic variation in diverse human populations. Nature 2010,467:52–58.
46. Rosenberg NA, Mahajan S, Gonzalez-Quevedo C, Blum MG, Nino-Rosales L,Ninis V, Das P, Hegde M, Molinari L, Zapata G, et al: Low levels of geneticdivergence across geographically and linguistically diverse populationsfrom India. PLoS Genet 2006, 2:e215.
47. Cann HM, De Toma C, Cazes L, Legrand MF, Morel V, Piouffre L, Bodmer J,Bodmer WF, Bonne-Tamir B, Cambon-Thomsen A, et al: A human genomediversity cell line panel. Science 2002, 296:261–262.
48. Corander J, Waldmann P, Marttinen P, Sillanpaa MJ: BAPS 2: enhancedpossibilities for the analysis of genetic population structure.Bioinformatics 2004, 20:2363–2369.
49. Shimizu C, Matsubara T, Onouchi Y, Jain S, Sun S, Nievergelt CM, Shike H,Brophy VH, Takegawa T, Furukawa S, et al: Matrix metalloproteinasehaplotypes associated with coronary artery aneurysm formation inpatients with Kawasaki disease. J Hum Genet 2010, 55(12):779–784.
50. Mbewe-Campbell N, Wei Z, Zhang K, Friese RS, Mahata M, Schork AJ, Rao F,Chiron S, Biswas N, Kim HS, et al: Genes and environment: novel,functional polymorphism in the human cathepsin L (CTSL1) promoterdisrupts a xenobiotic response element (XRE) to alter transcription andblood pressure. J Hypertens 2012, 30(10):1961–1969.
51. Zakharia F, Basu A, Absher D, Assimes TL, Go AS, Hlatky MA, Iribarren C,Knowles JW, Li J, Narasimhan B, et al: Characterizing the admixed Africanancestry of African Americans. Genome Biol 2009, 10:R141.
52. Bryc K, Auton A, Nelson MR, Oksenberg JR, Hauser SL, Williams S, FromentA, Bodo JM, Wambebe C, Tishkoff SA, Bustamante CD: Genome-widepatterns of population structure and admixture in West Africans andAfrican Americans. Proc Natl Acad Sci U S A 2010, 107:786–791.
53. Rajeevan H, Soundararajan U, Pakstis AJ, Kidd KK: Introducing the ForensicResearch/Reference on Genetics knowledge base. FROG-kb. Investig Genet2012, 3:18.
doi:10.1186/2041-2223-4-13Cite this article as: Nievergelt et al.: Inference of human continentalorigin and admixture proportions using a highly discriminative ancestryinformative 41-SNP panel. Investigative Genetics 2013 4:13.