Embed Size (px)
Citation preview
Mogollon et al. Nutrition Journal 2013, 12:41http://www.nutritionj.com/content/12/1/41
RESEARCH Open Access
Blood pressure and endothelial function inhealthy, pregnant women after acute and dailyconsumption of flavanol-rich chocolate: a pilot,randomized controlled trialJaime Andres Mogollon1, Emmanuel Bujold2, Simone Lemieux3, Mélodie Bourdages5, Claudine Blanchet1,Laurent Bazinet3, Charles Couillard3, Martin Noël4 and Sylvie Dodin1,6*
Abstract
Background: Several randomized clinical trials (RCTs) indicate that flavanol-rich chocolate has beneficial effects onflow-mediated dilation (FMD) and blood pressure (BP). However, no RCTs have evaluated these outcomes inpregnant women. The objective of this 2-group, parallel, double-blind RCT was to examine the effects of flavanol-rich chocolate on FMD and BP in pregnant women with normal BP.
Methods: Forty-four healthy, pregnant women were randomized to the high-flavanol (n = 23) or low-flavanol(n = 21) chocolate consumption for 12 weeks. At randomization (0, 60, 120 and 180 min after a single 40-g dose ofchocolate), 6 and 12 weeks after daily 20-g chocolate intake, we evaluated plasma concentrations of flavanols andtheobromine, as well as the FMD and BP.
Results: Plasma epicatechin was significantly increased (p < 0.001) 180 min after the consumption of 40-g high-flavanol chocolate compared to low-flavanol chocolate. Theobromine concentrations were significantly higher180 min and 12 weeks after the intake of experimental chocolate or low-flavanol chocolate (p < 0.001). FMD wasnot different between the 2 groups at all pre-defined time periods. No other significant within-group or between-group changes were observed.
Conclusion: These results confirm the feasibility of a large-scale RCT comparing daily consumption of flavanol-richchocolate to an equivalent placebo during pregnancy and demonstrate higher plasma epicatechin andtheobromine concentration in the intervention group after acute ingestion
Trial registration: ClinicalTrials.gov Identifier: NCT01659060
Keywords: Cacao, Chocolate, Theobromine, Flavanols, Pregnant women, Hypertension, Pregnancy-induced,Preeclampsia, Epicatechin
IntroductionPreeclampsia (PE), defined as gestational hypertensionassociated with proteinuria, is one of the most commonmedical disorders affecting pregnancy [1], with poten-tially severe consequences for mother and child,
* Correspondence: [email protected]. François d’Assise Hospital, Centre hospitalier universitaire de Québec(CHUQ), Quebec, Canada6Department of Obstetrics and Gynecology, Research Center, St. Françoisd’Assise Hospital (CHUQ), Université Laval, Québec G1L 3 L5, QC, CanadaFull list of author information is available at the end of the article
© 2013 Mogollon et al.; licensee BioMed CentCommons Attribution License (http://creativecreproduction in any medium, provided the or
especially in developing countries [2]. It is estimated that3 to 8% of all pregnancies are impacted by this compli-cation. Every year, PE is responsible for about 60,000deaths worldwide [1]. More than half of women with PEwill undergo caesarean delivery [1]. PE heightens the riskof peri-natal mortality by 5-fold and is a major cause oflow birth weight in infants [1]. Numerous studies havesuggested that women who develop PE have an in-creased risk of cardiovascular disease later in life [3].The cardiovascular manifestations of PE share manycharacteristics and risk factors with cardiovascular
ral Ltd. This is an Open Access article distributed under the terms of the Creativeommons.org/licenses/by/2.0), which permits unrestricted use, distribution, andiginal work is properly cited.
Mogollon et al. Nutrition Journal 2013, 12:41 Page 2 of 13http://www.nutritionj.com/content/12/1/41
disease, including hypertension, endothelium dysfunc-tion and oxidative stress [4,5].Despite intensive research, PE remains an idiopathic
disease for which few effective prophylactic measuresare available to patients [2]. PE is associated with aplacental disease in most cases and is distinguished bygeneralized maternal dysfunction of the endothelium.Endothelium dysfunction leads to clinical symptoms inthe mother [6,7]. There is strong evidence that maternalnitric oxide (NO) deficiency plays a key role in thedevelopment of PE [8]. Therapeutic approaches focusingon up-regulating NO availability may be useful targets inPE prevention. Flavanols, the most common flavonoidsin dark chocolate, are potent antioxidants capable ofinducing NO-dependent vasodilation. A recent meta-analysis of randomized controlled trials (RTCs) confirmedthat flavanol-rich chocolate has a beneficial influence onendothelial function and reduces systolic (SBP) and dia-stolic blood pressure (DBP) [9]. Recent cohort [10] andcase–control studies [11] have indicated that chocolateconsumption during pregnancy may lower the risk of PE,but their design did not permit the exploration of temporalrelationships. Moreover, this association was not found inanother case–control study [12]. Finally, a non-placebo,controlled, non-blinded study by Di Renzo et al [13]suggested that modest daily intake of high-cocoa contentchocolate contributes to BP reduction during pregnancy.As endothelial dysfunction is fundamental to PE devel-
opment we believe that the growing body of literaturesupporting the hypothesis of a beneficial outcome offlavanol-rich chocolate consumption, through its actionon endothelial function and BP regulation, justifies aclinical trial in pregnant women.The primary objective of this pilot RCT is to test the
feasibility of design methods and procedures for lateruse on a larger scale. The secondary objective is toexamine the acute and chronic impact of dark chocolateon FMD and BP in healthy, pregnant women withnormal BP.
Patients and methodsEthics statementProtocol and consent form of this study was reviewed andapproved by the institutional Ethics Committee of CentreHospitalier Universitaire de Québec. An information andconsent form, approved by the institutional EthicsCommittee, was read and signed by the participants.
Study participantsBetween July 2008 and April 2009, we enrolled non-smoking, normotensive women aged 18 to 35 years, witha live fetus between the 7th and 12th weeks of gestationdocumented by ultrasound. Normal BP was defined asSBP <140 mmHg and DBP <90 mmHg.
We excluded patients with a family history of prema-ture cardiovascular disease, chronic hypertension, renaldysfunction, medication use for treating hypertension orinterfering with the metabolism of glucose or lipids,taking supplements or natural health products that mayinterfere with BP (fish oils, coenzyme Q10, and garlic).Women consuming 1 alcoholic drink per day or more,or suffering from allergies or intolerance to nuts orchocolate were also excluded.
Recruitment and randomizationWomen were recruited through advertisements given tothem by healthcare professionals previously informedabout the project. Those wishing to participate contactedthe Study Coordinator who explained the researchproject to them. They then presented themselves at theResearch Center of Saint-François d’Assise Hospital for atotal of 4 visits.The recruitment protocol included an initial visit dur-
ing which suitability for randomization was evaluated.Inclusion and exclusion criteria as well as the risks andbenefits of the study were reviewed in detail during thispre-randomization visit. An information and consentform, approved by the institutional Ethics Committee,was read and signed. BP was measured 3 times at 3-minintervals and averaged, according to a validated protocol[14]. Anthropometric measurements and fasting bloodsamples were collected. The blood samples were analyzedfor lipid and fasting blood sugar profiles. A questionnairedocumenting social and demographic characteristics, to-bacco use, consumption of alcohol and medications wascompleted by all women which were also required tocomplete a 3-day food record [15], including a weekendday, and a validated 2-day activity record [16,17] the weekbefore the 2nd visit. Nutrient and food intake results wereevaluated with the Nutrition Data System for Research,version 4.03, developed by the Nutrition CoordinatingCenter, University of Minnesota in Minneapolis.Eligible healthy, pregnant women were randomly
assigned to either high-flavanol dark chocolate (experi-mental group) or low-flavanol dark chocolate (placebogroup). Concealed randomization was generated usingcomputer-aided block randomization (block size was keptsecret), with pre-stratification by parity and body massindex (BMI), under the responsibility of an independentstatistician. Another statistician undertook treatmentallocation independently of the trial team. At therandomization visit participants were instructed toconsume in the fasting state 40-g of chocolate within10 min. The composition of each chocolate bar – energy,nutrients, catechins, epicatechins and theobromine – wasquantified by Barry Callebaut (Lebbeke-Wieze, Belgium)and re-evaluated before the beginning of the study at theINAF Laboratory using mass spectrometry (Table 1). All
Mogollon et al. Nutrition Journal 2013, 12:41 Page 3 of 13http://www.nutritionj.com/content/12/1/41
chocolate bars were standardized for their flavanol andtheobromine content and matched for caloric load, nutri-ents and caffeine. All of them were similar in taste andwere supplied free in individual, opaque packaging byBarry Callebaut. Our cocoa provided 400 mg of totalflavanols. Therefore, to isolate the effects of flavanols, ourchocolate placebo was identical to the experimentalchocolate in its content for all other nutrients except forflavanols (including theobromine and caffeine contents).
Clinical follow-upDuring the chronic phase, the women were advisedto consume chocolate bars 3 times a day for a totalof 20-g daily providing 400 mg of total flavanols and64 mg of epicatechin and catechin. This flavanoldaily intake should be sufficient to exert beneficialeffects. Indeed, in a similar study of non-pregnantwomen, a chronic consumption of 373 mg flavanolcontent was associated with significant outcomes onBP and endothelial function. Moreover, its caloricvalue was easily replaced by a snack of equivalentenergy. Therefore, the balance between beneficial ef-fects, caloric value and fat content was carefullyconsidered.Participants were scheduled for 2 follow-up visits at 6
and 12 weeks after randomization. All clinical investiga-tions, laboratory analyses, data collection and assessmentwere blinded to the randomization allocation.The participants were asked not to consume other
chocolate products during the study and to avoidfoods rich in polyphenols or theobromine (tea, cof-fee, fruit juice, wine) for 24 h before each visit. In-tense physical activity was also forbidden for 48 hpreceding each visit. Anthropometric measurementswere taken at each visit, and the participants com-pleted a food frequency questionnaire (FFQ) specific-ally evaluating their polyphenol consumption in the
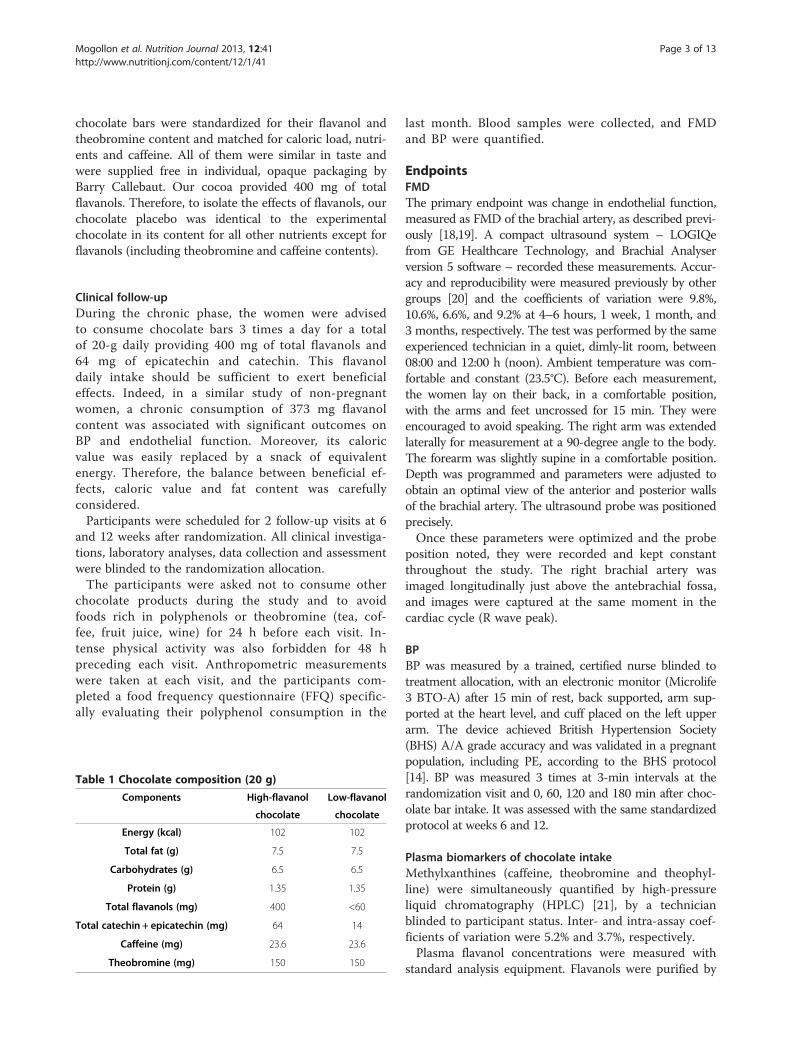
Table 1 Chocolate composition (20 g)
Components High-flavanol Low-flavanol
chocolate chocolate
Energy (kcal) 102 102
Total fat (g) 7.5 7.5
Carbohydrates (g) 6.5 6.5
Protein (g) 1.35 1.35
Total flavanols (mg) 400 <60
Total catechin + epicatechin (mg) 64 14
Caffeine (mg) 23.6 23.6
Theobromine (mg) 150 150
last month. Blood samples were collected, and FMDand BP were quantified.
EndpointsFMDThe primary endpoint was change in endothelial function,measured as FMD of the brachial artery, as described previ-ously [18,19]. A compact ultrasound system – LOGIQefrom GE Healthcare Technology, and Brachial Analyserversion 5 software – recorded these measurements. Accur-acy and reproducibility were measured previously by othergroups [20] and the coefficients of variation were 9.8%,10.6%, 6.6%, and 9.2% at 4–6 hours, 1 week, 1 month, and3 months, respectively. The test was performed by the sameexperienced technician in a quiet, dimly-lit room, between08:00 and 12:00 h (noon). Ambient temperature was com-fortable and constant (23.5°C). Before each measurement,the women lay on their back, in a comfortable position,with the arms and feet uncrossed for 15 min. They wereencouraged to avoid speaking. The right arm was extendedlaterally for measurement at a 90-degree angle to the body.The forearm was slightly supine in a comfortable position.Depth was programmed and parameters were adjusted toobtain an optimal view of the anterior and posterior wallsof the brachial artery. The ultrasound probe was positionedprecisely.Once these parameters were optimized and the probe
position noted, they were recorded and kept constantthroughout the study. The right brachial artery wasimaged longitudinally just above the antebrachial fossa,and images were captured at the same moment in thecardiac cycle (R wave peak).
BPBP was measured by a trained, certified nurse blinded totreatment allocation, with an electronic monitor (Microlife3 BTO-A) after 15 min of rest, back supported, arm sup-ported at the heart level, and cuff placed on the left upperarm. The device achieved British Hypertension Society(BHS) A/A grade accuracy and was validated in a pregnantpopulation, including PE, according to the BHS protocol[14]. BP was measured 3 times at 3-min intervals at therandomization visit and 0, 60, 120 and 180 min after choc-olate bar intake. It was assessed with the same standardizedprotocol at weeks 6 and 12.
Plasma biomarkers of chocolate intakeMethylxanthines (caffeine, theobromine and theophyl-line) were simultaneously quantified by high-pressureliquid chromatography (HPLC) [21], by a technicianblinded to participant status. Inter- and intra-assay coef-ficients of variation were 5.2% and 3.7%, respectively.Plasma flavanol concentrations were measured with
standard analysis equipment. Flavanols were purified by
Mogollon et al. Nutrition Journal 2013, 12:41 Page 4 of 13http://www.nutritionj.com/content/12/1/41
solid extraction, followed by HPLC with a fluorescencedetection system [22].
Side-effectsWeight change was evaluated at each visit, and digestiveand other signs and symptoms (nausea, abdominal pain,constipation, and headache) were documented with aself-administered questionnaire related to the week pre-ceding the visit.
ComplianceEach participant received a telephone reminder in theweek preceding each visit. Women were paid an alloca-tion for expenses related to the assessment visits. If aparticipant missed a visit, the nurse scheduled a newappointment. In addition, study participants recordedtheir daily intake of chocolate bars on diary cards.
Blinding and contamination biasThe proportion of women who guessed right aboutgroup allocation was documented with a short question-naire at the last visit. To control for contamination bias,the flavonoid consumption was measured by FFQ in thelast month preceding each follow-up visit.
Sample size and statistical analysisChanges in FMD were defined as a primary endpointcalculated as variations 12 weeks after chocolate intakeand expressed as mean differences. The secondary out-come was BP. All analyses were based on intention-to-treat. In the context of this feasibility study, no samplesize was calculated and the 44 pregnant women whoagreed to participate were included on the basis of rec-ommendations by Thabane et al [23].The baseline characteristics of the 2 groups were
compared, and factors influencing BP were considereddescriptively. Non-paired t tests were performed forplanned comparisons between groups. Changes withingroups were evaluated by paired t test. P ≤ 0.05 valueswere considered as significant. The presence of side-effects was compared in the 2 groups.
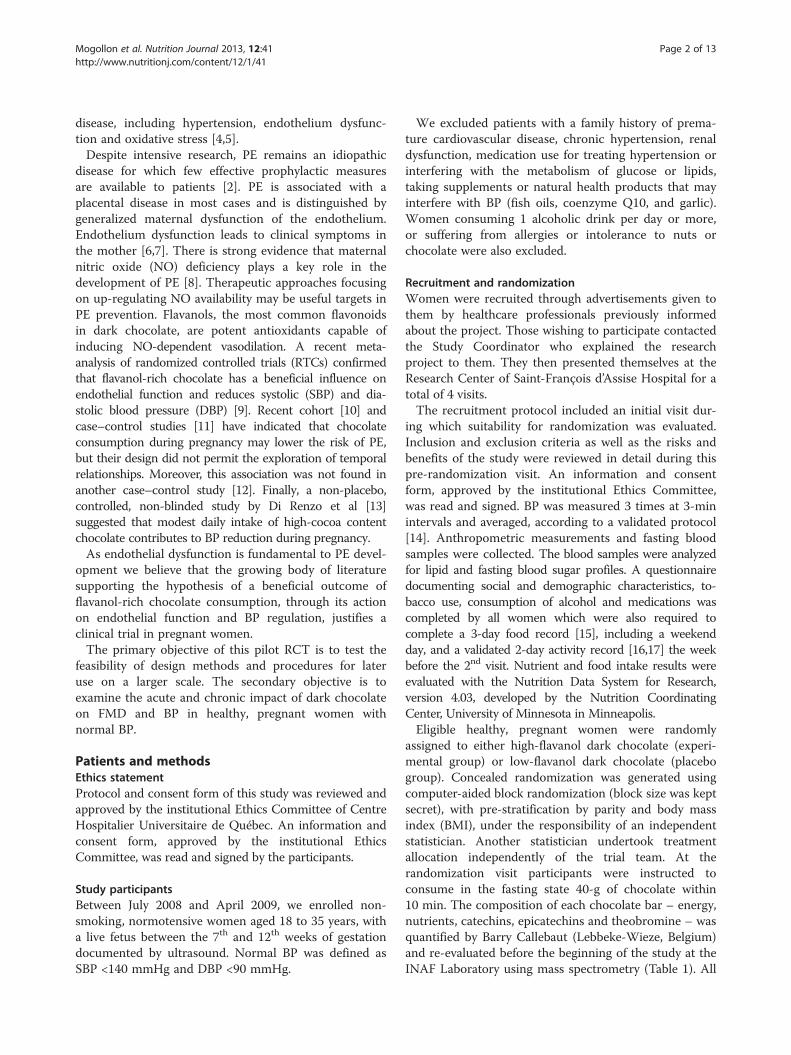
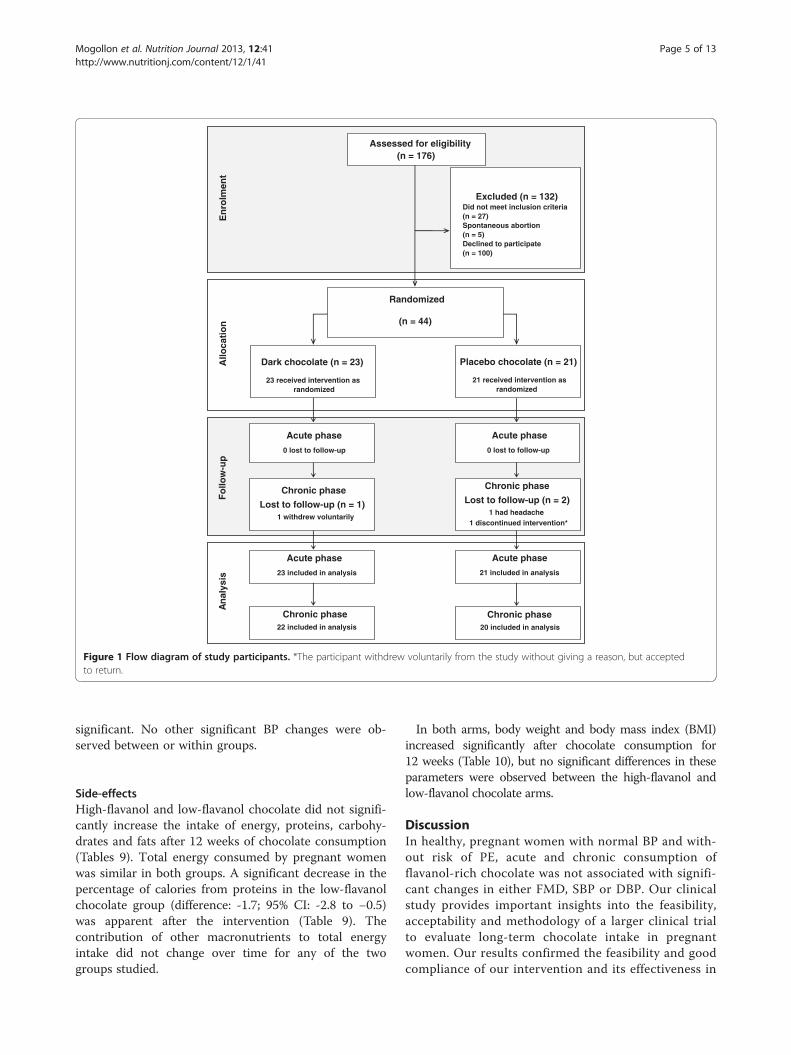
ResultsWe approached 176 women, of whom 27 were excludedas they failed to meet the inclusion criteria: 12 were over16 weeks pregnant, 6 were smokers, 5 had a body massindex >30, 4 did not meet other criteria, and 5 hadspontaneous abortions (n = 5). One hundred womendeclined to participate for different reasons: 72 womenhad logistical or personal problems (transportation,work, other children at home, too time-consuming), 18did not return calls, and 10 refused to give a reason forwithdrawing their participation. Finally, 44 (33%) of the132 pregnant women who met the inclusion criteria and
who agreed to participate were randomised (23 in thehigh-flavanol chocolate arm and 21 in the low-flavanolchocolate arm) (Figure 1). The baseline characteristics ofthe women who declined to participate were not signifi-cantly different from those of randomised women (datanot included). At randomization, the 2 arms were wellbalanced with regard to social and baseline characteris-tics (Tables 2 and 3).Of the 44 randomized women who participated in the
acute phase, 42 (22 and 20 in the high-flavanol and low-flavanol chocolate arms, respectively) had outcomesavailable for intention-to-treat analysis. Two womendropped out of the study for reasons not related to theintervention.
Plasma biomarkers of chocolate intakePlasma epicatechin concentrations increased signifi-cantly in the high-flavanol chocolate group at 180 minafter intervention compared to low-flavanol chocolate(p < 0.001) (Table 4). This dose of high-flavanol choc-olate in the current study had no effect on increasingplasma catechin concentrations. After 12 weeks,epicatechin and catechin concentrations were too lowto be detectable.As expected, methylxanthine concentrations were sig-
nificantly higher at 180 min compared to baseline in the2 groups (Table 5). More specifically, a significantincrease in plasma theobromine concentrations was ob-served in both groups at 180 min and was slightly butsignificantly more marked in the experimental group.Therefore, theobromine concentrations served as amarker of chocolate compliance. A significant differencein caffeine concentrations (p = 0.02) was also seen in thetwo chocolate groups after single chocolate intake.Compared to baseline, theobromine concentrations
were still significantly higher in high-flavanol and low-flavanol chocolate groups at 6 and 12 weeks, indicatinggood subject compliance (Table 6). A small but signifi-cant difference in plasma theobromine concentrations(p = 0.03) was noted between chocolate groups after12 weeks of chocolate consumption.
FMD and BPFMD, SBP, DBP and mean arterial BP (MAP) were notsignificantly affected by acute or chronic consumption ofhigh-flavanol chocolate, as reported in Tables 7 and 8.No significant changes were observed within or be-
tween groups for SBP after 6 or 12 weeks. Althoughwithin normal values, DBP increased significantly frombaseline after 6 and 12 weeks only in the low-flavanolchocolate group, but the difference between the 2 groupswas not significant. At 12 weeks, MAP rose significantlyin the low-flavanol chocolate group compared to base-line, but the difference between the 2 arms was not
An
alys
isE
nro
lmen
tA
lloca
tio
nF
ollo
w-u
p
Assessed for eligibility(n = 176)
Excluded (n = 132)Did not meet inclusion criteria(n = 27)Spontaneous abortion(n = 5)Declined to participate(n = 100)
Dark chocolate (n = 23)
23 received intervention as randomized
Placebo chocolate (n = 21)
21 received intervention as randomized
Acute phase
21 included in analysis
Acute phase
23 included in analysis
Chronic phase
Lost to follow-up (n = 1)1 withdrew voluntarily
Chronic phase20 included in analysis
Randomized
(n = 44)
Chronic phase22 included in analysis
Chronic phase
Lost to follow-up (n = 2) 1 had headache
1 discontinued intervention*
Acute phase
0 lost to follow-up
Acute phase
0 lost to follow-up
Figure 1 Flow diagram of study participants. *The participant withdrew voluntarily from the study without giving a reason, but acceptedto return.
Mogollon et al. Nutrition Journal 2013, 12:41 Page 5 of 13http://www.nutritionj.com/content/12/1/41
significant. No other significant BP changes were ob-served between or within groups.
Side-effectsHigh-flavanol and low-flavanol chocolate did not signifi-cantly increase the intake of energy, proteins, carbohy-drates and fats after 12 weeks of chocolate consumption(Tables 9). Total energy consumed by pregnant womenwas similar in both groups. A significant decrease in thepercentage of calories from proteins in the low-flavanolchocolate group (difference: -1.7; 95% CI: -2.8 to −0.5)was apparent after the intervention (Table 9). Thecontribution of other macronutrients to total energyintake did not change over time for any of the twogroups studied.
In both arms, body weight and body mass index (BMI)increased significantly after chocolate consumption for12 weeks (Table 10), but no significant differences in theseparameters were observed between the high-flavanol andlow-flavanol chocolate arms.
DiscussionIn healthy, pregnant women with normal BP and with-out risk of PE, acute and chronic consumption offlavanol-rich chocolate was not associated with signifi-cant changes in either FMD, SBP or DBP. Our clinicalstudy provides important insights into the feasibility,acceptability and methodology of a larger clinical trialto evaluate long-term chocolate intake in pregnantwomen. Our results confirmed the feasibility and goodcompliance of our intervention and its effectiveness in
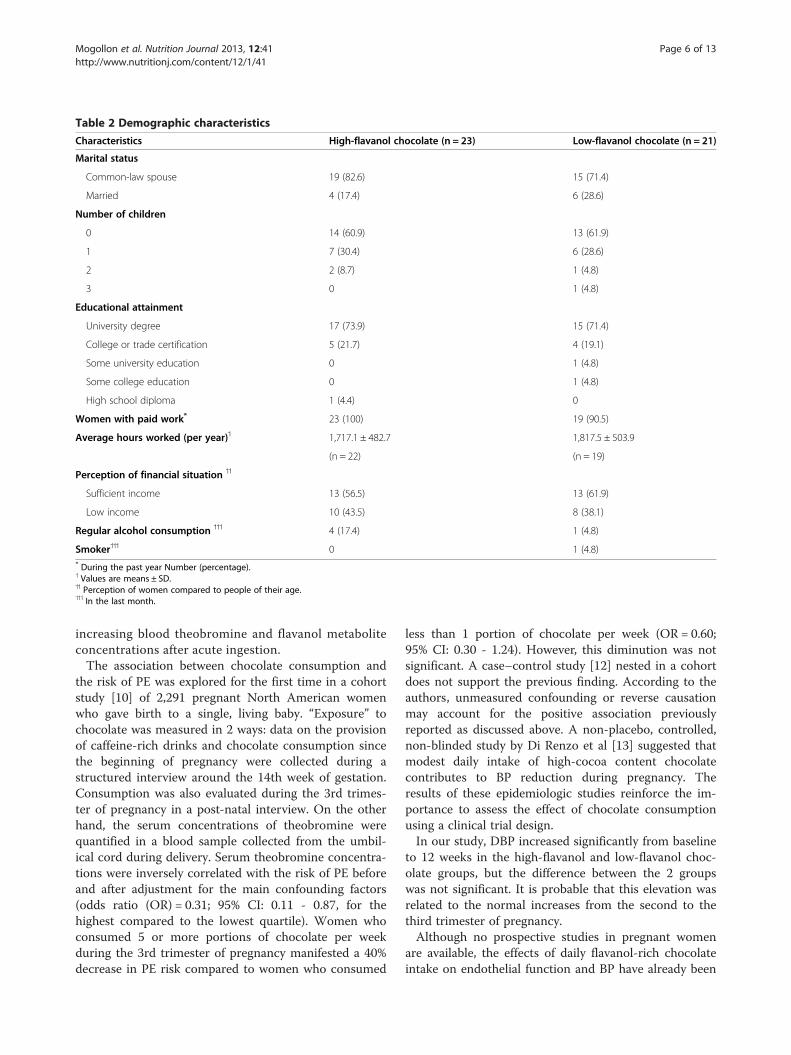
Table 2 Demographic characteristics
Characteristics High-flavanol chocolate (n = 23) Low-flavanol chocolate (n = 21)
Marital status
Common-law spouse 19 (82.6) 15 (71.4)
Married 4 (17.4) 6 (28.6)
Number of children
0 14 (60.9) 13 (61.9)
1 7 (30.4) 6 (28.6)
2 2 (8.7) 1 (4.8)
3 0 1 (4.8)
Educational attainment
University degree 17 (73.9) 15 (71.4)
College or trade certification 5 (21.7) 4 (19.1)
Some university education 0 1 (4.8)
Some college education 0 1 (4.8)
High school diploma 1 (4.4) 0
Women with paid work* 23 (100) 19 (90.5)
Average hours worked (per year)˦ 1,717.1 ± 482.7 1,817.5 ± 503.9
(n = 22) (n = 19)
Perception of financial situation ˦˦
Sufficient income 13 (56.5) 13 (61.9)
Low income 10 (43.5) 8 (38.1)
Regular alcohol consumption ˦˦˦ 4 (17.4) 1 (4.8)
Smoker˦˦˦ 0 1 (4.8)* During the past year Number (percentage).˦ Values are means ± SD.˦˦ Perception of women compared to people of their age.˦˦˦ In the last month.
Mogollon et al. Nutrition Journal 2013, 12:41 Page 6 of 13http://www.nutritionj.com/content/12/1/41
increasing blood theobromine and flavanol metaboliteconcentrations after acute ingestion.The association between chocolate consumption and
the risk of PE was explored for the first time in a cohortstudy [10] of 2,291 pregnant North American womenwho gave birth to a single, living baby. “Exposure” tochocolate was measured in 2 ways: data on the provisionof caffeine-rich drinks and chocolate consumption sincethe beginning of pregnancy were collected during astructured interview around the 14th week of gestation.Consumption was also evaluated during the 3rd trimes-ter of pregnancy in a post-natal interview. On the otherhand, the serum concentrations of theobromine werequantified in a blood sample collected from the umbil-ical cord during delivery. Serum theobromine concentra-tions were inversely correlated with the risk of PE beforeand after adjustment for the main confounding factors(odds ratio (OR) = 0.31; 95% CI: 0.11 - 0.87, for thehighest compared to the lowest quartile). Women whoconsumed 5 or more portions of chocolate per weekduring the 3rd trimester of pregnancy manifested a 40%decrease in PE risk compared to women who consumed
less than 1 portion of chocolate per week (OR = 0.60;95% CI: 0.30 - 1.24). However, this diminution was notsignificant. A case–control study [12] nested in a cohortdoes not support the previous finding. According to theauthors, unmeasured confounding or reverse causationmay account for the positive association previouslyreported as discussed above. A non-placebo, controlled,non-blinded study by Di Renzo et al [13] suggested thatmodest daily intake of high-cocoa content chocolatecontributes to BP reduction during pregnancy. Theresults of these epidemiologic studies reinforce the im-portance to assess the effect of chocolate consumptionusing a clinical trial design.In our study, DBP increased significantly from baseline
to 12 weeks in the high-flavanol and low-flavanol choc-olate groups, but the difference between the 2 groupswas not significant. It is probable that this elevation wasrelated to the normal increases from the second to thethird trimester of pregnancy.Although no prospective studies in pregnant women
are available, the effects of daily flavanol-rich chocolateintake on endothelial function and BP have already been
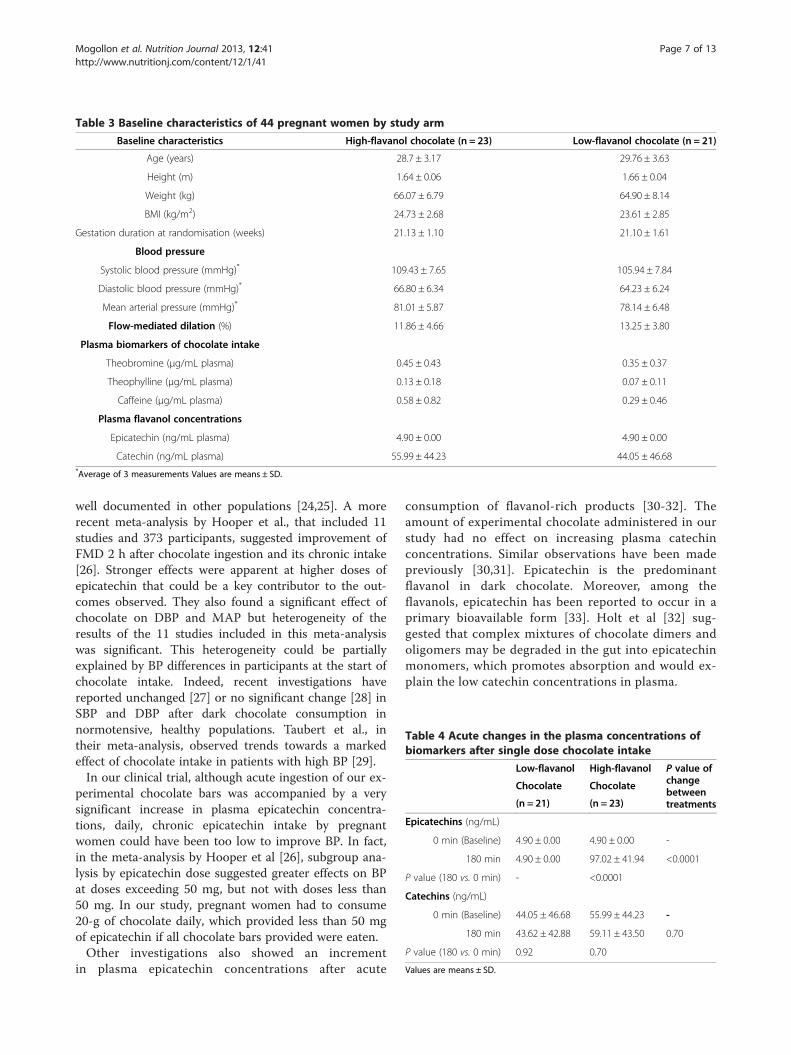
Table 3 Baseline characteristics of 44 pregnant women by study arm
Baseline characteristics High-flavanol chocolate (n = 23) Low-flavanol chocolate (n = 21)
Age (years) 28.7 ± 3.17 29.76 ± 3.63
Height (m) 1.64 ± 0.06 1.66 ± 0.04
Weight (kg) 66.07 ± 6.79 64.90 ± 8.14
BMI (kg/m2) 24.73 ± 2.68 23.61 ± 2.85
Gestation duration at randomisation (weeks) 21.13 ± 1.10 21.10 ± 1.61
Blood pressure
Systolic blood pressure (mmHg)* 109.43 ± 7.65 105.94 ± 7.84
Diastolic blood pressure (mmHg)* 66.80 ± 6.34 64.23 ± 6.24
Mean arterial pressure (mmHg)* 81.01 ± 5.87 78.14 ± 6.48
Flow-mediated dilation (%) 11.86 ± 4.66 13.25 ± 3.80
Plasma biomarkers of chocolate intake
Theobromine (μg/mL plasma) 0.45 ± 0.43 0.35 ± 0.37
Theophylline (μg/mL plasma) 0.13 ± 0.18 0.07 ± 0.11
Caffeine (μg/mL plasma) 0.58 ± 0.82 0.29 ± 0.46
Plasma flavanol concentrations
Epicatechin (ng/mL plasma) 4.90 ± 0.00 4.90 ± 0.00
Catechin (ng/mL plasma) 55.99 ± 44.23 44.05 ± 46.68*Average of 3 measurements Values are means ± SD.
Table 4 Acute changes in the plasma concentrations ofbiomarkers after single dose chocolate intake
Low-flavanol High-flavanol P value ofchangebetweentreatments
Chocolate Chocolate
(n = 21) (n = 23)
Epicatechins (ng/mL)
0 min (Baseline) 4.90 ± 0.00 4.90 ± 0.00 -
180 min 4.90 ± 0.00 97.02 ± 41.94 <0.0001
P value (180 vs. 0 min) - <0.0001
Catechins (ng/mL)
0 min (Baseline) 44.05 ± 46.68 55.99 ± 44.23 -
180 min 43.62 ± 42.88 59.11 ± 43.50 0.70
P value (180 vs. 0 min) 0.92 0.70
Values are means ± SD.
Mogollon et al. Nutrition Journal 2013, 12:41 Page 7 of 13http://www.nutritionj.com/content/12/1/41
well documented in other populations [24,25]. A morerecent meta-analysis by Hooper et al., that included 11studies and 373 participants, suggested improvement ofFMD 2 h after chocolate ingestion and its chronic intake[26]. Stronger effects were apparent at higher doses ofepicatechin that could be a key contributor to the out-comes observed. They also found a significant effect ofchocolate on DBP and MAP but heterogeneity of theresults of the 11 studies included in this meta-analysiswas significant. This heterogeneity could be partiallyexplained by BP differences in participants at the start ofchocolate intake. Indeed, recent investigations havereported unchanged [27] or no significant change [28] inSBP and DBP after dark chocolate consumption innormotensive, healthy populations. Taubert et al., intheir meta-analysis, observed trends towards a markedeffect of chocolate intake in patients with high BP [29].In our clinical trial, although acute ingestion of our ex-
perimental chocolate bars was accompanied by a verysignificant increase in plasma epicatechin concentra-tions, daily, chronic epicatechin intake by pregnantwomen could have been too low to improve BP. In fact,in the meta-analysis by Hooper et al [26], subgroup ana-lysis by epicatechin dose suggested greater effects on BPat doses exceeding 50 mg, but not with doses less than50 mg. In our study, pregnant women had to consume20-g of chocolate daily, which provided less than 50 mgof epicatechin if all chocolate bars provided were eaten.Other investigations also showed an increment
in plasma epicatechin concentrations after acute
consumption of flavanol-rich products [30-32]. Theamount of experimental chocolate administered in ourstudy had no effect on increasing plasma catechinconcentrations. Similar observations have been madepreviously [30,31]. Epicatechin is the predominantflavanol in dark chocolate. Moreover, among theflavanols, epicatechin has been reported to occur in aprimary bioavailable form [33]. Holt et al [32] sug-gested that complex mixtures of chocolate dimers andoligomers may be degraded in the gut into epicatechinmonomers, which promotes absorption and would ex-plain the low catechin concentrations in plasma.
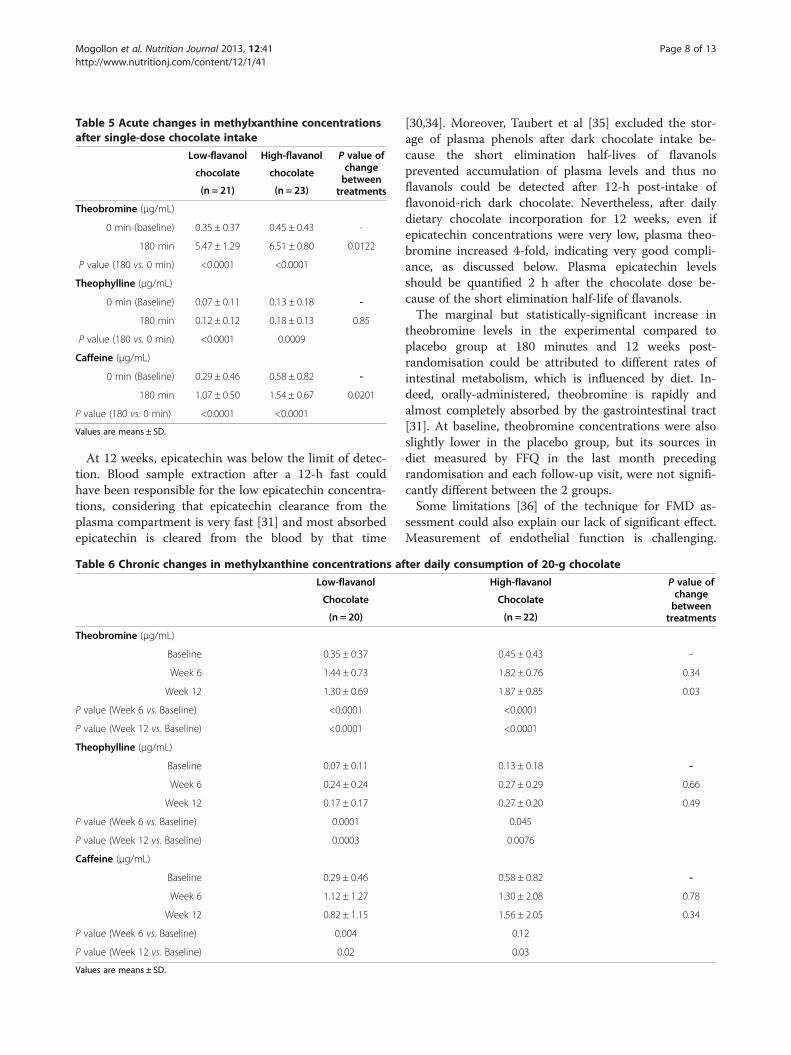
Table 5 Acute changes in methylxanthine concentrationsafter single-dose chocolate intake
Low-flavanol High-flavanol P value ofchangebetweentreatments
chocolate chocolate
(n = 21) (n = 23)
Theobromine (μg/mL)
0 min (baseline) 0.35 ± 0.37 0.45 ± 0.43 -
180 min 5.47 ± 1.29 6.51 ± 0.80 0.0122
P value (180 vs. 0 min) <0.0001 <0.0001
Theophylline (μg/mL)
0 min (Baseline) 0.07 ± 0.11 0.13 ± 0.18 -
180 min 0.12 ± 0.12 0.18 ± 0.13 0.85
P value (180 vs. 0 min) <0.0001 0.0009
Caffeine (μg/mL)
0 min (Baseline) 0.29 ± 0.46 0.58 ± 0.82 -
180 min 1.07 ± 0.50 1.54 ± 0.67 0.0201
P value (180 vs. 0 min) <0.0001 <0.0001
Values are means ± SD.
Mogollon et al. Nutrition Journal 2013, 12:41 Page 8 of 13http://www.nutritionj.com/content/12/1/41
At 12 weeks, epicatechin was below the limit of detec-tion. Blood sample extraction after a 12-h fast couldhave been responsible for the low epicatechin concentra-tions, considering that epicatechin clearance from theplasma compartment is very fast [31] and most absorbedepicatechin is cleared from the blood by that time
Table 6 Chronic changes in methylxanthine concentrations af
Low-flavanol
Chocolate
(n = 20)
Theobromine (μg/mL)
Baseline 0.35 ± 0.37
Week 6 1.44 ± 0.73
Week 12 1.30 ± 0.69
P value (Week 6 vs. Baseline) <0.0001
P value (Week 12 vs. Baseline) <0.0001
Theophylline (μg/mL)
Baseline 0.07 ± 0.11
Week 6 0.24 ± 0.24
Week 12 0.17 ± 0.17
P value (Week 6 vs. Baseline) 0.0001
P value (Week 12 vs. Baseline) 0.0003
Caffeine (μg/mL)
Baseline 0.29 ± 0.46
Week 6 1.12 ± 1.27
Week 12 0.82 ± 1.15
P value (Week 6 vs. Baseline) 0.004
P value (Week 12 vs. Baseline) 0.02
Values are means ± SD.
[30,34]. Moreover, Taubert et al [35] excluded the stor-age of plasma phenols after dark chocolate intake be-cause the short elimination half-lives of flavanolsprevented accumulation of plasma levels and thus noflavanols could be detected after 12-h post-intake offlavonoid-rich dark chocolate. Nevertheless, after dailydietary chocolate incorporation for 12 weeks, even ifepicatechin concentrations were very low, plasma theo-bromine increased 4-fold, indicating very good compli-ance, as discussed below. Plasma epicatechin levelsshould be quantified 2 h after the chocolate dose be-cause of the short elimination half-life of flavanols.The marginal but statistically-significant increase in
theobromine levels in the experimental compared toplacebo group at 180 minutes and 12 weeks post-randomisation could be attributed to different rates ofintestinal metabolism, which is influenced by diet. In-deed, orally-administered, theobromine is rapidly andalmost completely absorbed by the gastrointestinal tract[31]. At baseline, theobromine concentrations were alsoslightly lower in the placebo group, but its sources indiet measured by FFQ in the last month precedingrandomisation and each follow-up visit, were not signifi-cantly different between the 2 groups.Some limitations [36] of the technique for FMD as-
sessment could also explain our lack of significant effect.Measurement of endothelial function is challenging.
ter daily consumption of 20-g chocolate
High-flavanol P value ofchangebetweentreatments
Chocolate
(n = 22)
0.45 ± 0.43 -
1.82 ± 0.76 0.34
1.87 ± 0.85 0.03
<0.0001
<0.0001
0.13 ± 0.18 -
0.27 ± 0.29 0.66
0.27 ± 0.20 0.49
0.045
0.0076
0.58 ± 0.82 -
1.30 ± 2.08 0.78
1.56 ± 2.05 0.34
0.12
0.03
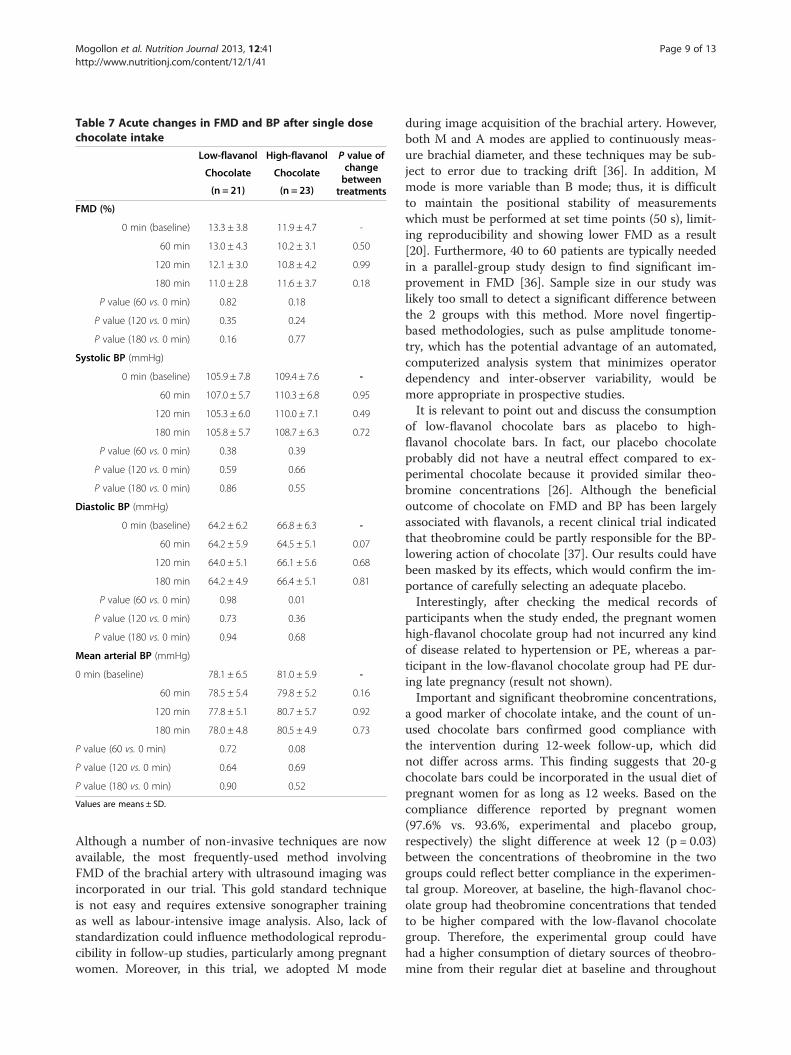
Table 7 Acute changes in FMD and BP after single dosechocolate intake
Low-flavanol High-flavanol P value ofchangebetweentreatments
Chocolate Chocolate
(n = 21) (n = 23)
FMD (%)
0 min (baseline) 13.3 ± 3.8 11.9 ± 4.7 -
60 min 13.0 ± 4.3 10.2 ± 3.1 0.50
120 min 12.1 ± 3.0 10.8 ± 4.2 0.99
180 min 11.0 ± 2.8 11.6 ± 3.7 0.18
P value (60 vs. 0 min) 0.82 0.18
P value (120 vs. 0 min) 0.35 0.24
P value (180 vs. 0 min) 0.16 0.77
Systolic BP (mmHg)
0 min (baseline) 105.9 ± 7.8 109.4 ± 7.6 -
60 min 107.0 ± 5.7 110.3 ± 6.8 0.95
120 min 105.3 ± 6.0 110.0 ± 7.1 0.49
180 min 105.8 ± 5.7 108.7 ± 6.3 0.72
P value (60 vs. 0 min) 0.38 0.39
P value (120 vs. 0 min) 0.59 0.66
P value (180 vs. 0 min) 0.86 0.55
Diastolic BP (mmHg)
0 min (baseline) 64.2 ± 6.2 66.8 ± 6.3 -
60 min 64.2 ± 5.9 64.5 ± 5.1 0.07
120 min 64.0 ± 5.1 66.1 ± 5.6 0.68
180 min 64.2 ± 4.9 66.4 ± 5.1 0.81
P value (60 vs. 0 min) 0.98 0.01
P value (120 vs. 0 min) 0.73 0.36
P value (180 vs. 0 min) 0.94 0.68
Mean arterial BP (mmHg)
0 min (baseline) 78.1 ± 6.5 81.0 ± 5.9 -
60 min 78.5 ± 5.4 79.8 ± 5.2 0.16
120 min 77.8 ± 5.1 80.7 ± 5.7 0.92
180 min 78.0 ± 4.8 80.5 ± 4.9 0.73
P value (60 vs. 0 min) 0.72 0.08
P value (120 vs. 0 min) 0.64 0.69
P value (180 vs. 0 min) 0.90 0.52
Values are means ± SD.
Mogollon et al. Nutrition Journal 2013, 12:41 Page 9 of 13http://www.nutritionj.com/content/12/1/41
Although a number of non-invasive techniques are nowavailable, the most frequently-used method involvingFMD of the brachial artery with ultrasound imaging wasincorporated in our trial. This gold standard techniqueis not easy and requires extensive sonographer trainingas well as labour-intensive image analysis. Also, lack ofstandardization could influence methodological reprodu-cibility in follow-up studies, particularly among pregnantwomen. Moreover, in this trial, we adopted M mode
during image acquisition of the brachial artery. However,both M and A modes are applied to continuously meas-ure brachial diameter, and these techniques may be sub-ject to error due to tracking drift [36]. In addition, Mmode is more variable than B mode; thus, it is difficultto maintain the positional stability of measurementswhich must be performed at set time points (50 s), limit-ing reproducibility and showing lower FMD as a result[20]. Furthermore, 40 to 60 patients are typically neededin a parallel-group study design to find significant im-provement in FMD [36]. Sample size in our study waslikely too small to detect a significant difference betweenthe 2 groups with this method. More novel fingertip-based methodologies, such as pulse amplitude tonome-try, which has the potential advantage of an automated,computerized analysis system that minimizes operatordependency and inter-observer variability, would bemore appropriate in prospective studies.It is relevant to point out and discuss the consumption
of low-flavanol chocolate bars as placebo to high-flavanol chocolate bars. In fact, our placebo chocolateprobably did not have a neutral effect compared to ex-perimental chocolate because it provided similar theo-bromine concentrations [26]. Although the beneficialoutcome of chocolate on FMD and BP has been largelyassociated with flavanols, a recent clinical trial indicatedthat theobromine could be partly responsible for the BP-lowering action of chocolate [37]. Our results could havebeen masked by its effects, which would confirm the im-portance of carefully selecting an adequate placebo.Interestingly, after checking the medical records of
participants when the study ended, the pregnant womenhigh-flavanol chocolate group had not incurred any kindof disease related to hypertension or PE, whereas a par-ticipant in the low-flavanol chocolate group had PE dur-ing late pregnancy (result not shown).Important and significant theobromine concentrations,
a good marker of chocolate intake, and the count of un-used chocolate bars confirmed good compliance withthe intervention during 12-week follow-up, which didnot differ across arms. This finding suggests that 20-gchocolate bars could be incorporated in the usual diet ofpregnant women for as long as 12 weeks. Based on thecompliance difference reported by pregnant women(97.6% vs. 93.6%, experimental and placebo group,respectively) the slight difference at week 12 (p = 0.03)between the concentrations of theobromine in the twogroups could reflect better compliance in the experimen-tal group. Moreover, at baseline, the high-flavanol choc-olate group had theobromine concentrations that tendedto be higher compared with the low-flavanol chocolategroup. Therefore, the experimental group could havehad a higher consumption of dietary sources of theobro-mine from their regular diet at baseline and throughout
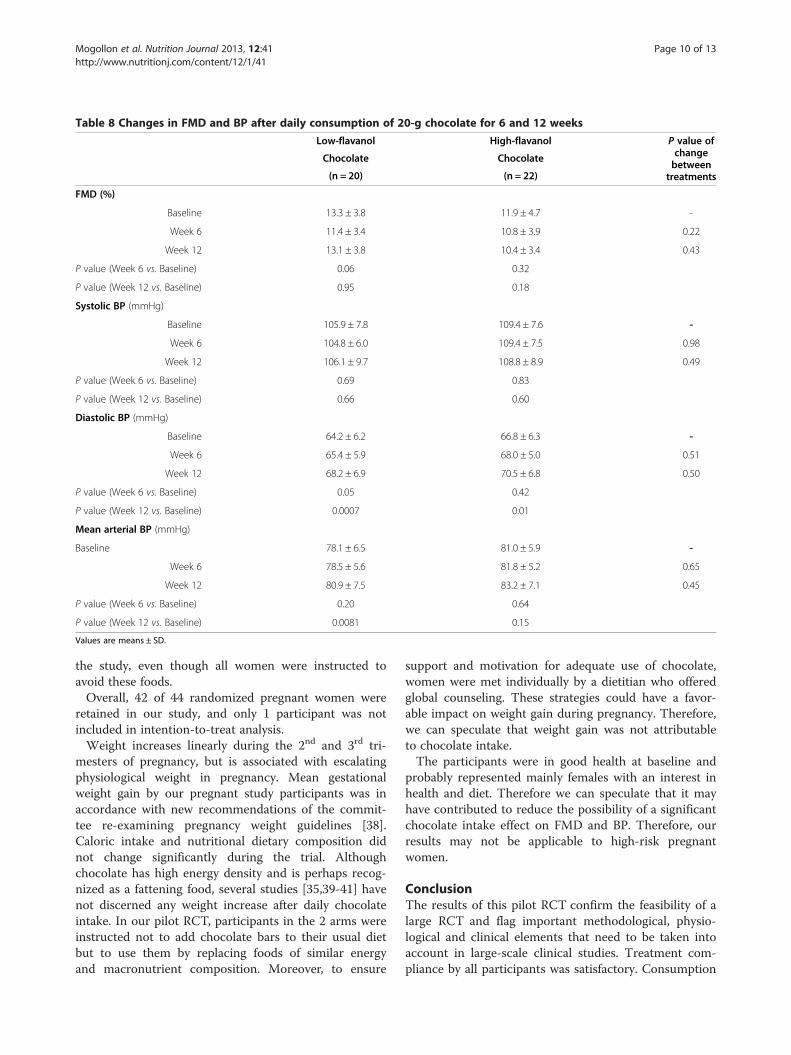
Table 8 Changes in FMD and BP after daily consumption of 20-g chocolate for 6 and 12 weeks
Low-flavanol High-flavanol P value ofchangebetweentreatments
Chocolate Chocolate
(n = 20) (n = 22)
FMD (%)
Baseline 13.3 ± 3.8 11.9 ± 4.7 -
Week 6 11.4 ± 3.4 10.8 ± 3.9 0.22
Week 12 13.1 ± 3.8 10.4 ± 3.4 0.43
P value (Week 6 vs. Baseline) 0.06 0.32
P value (Week 12 vs. Baseline) 0.95 0.18
Systolic BP (mmHg)
Baseline 105.9 ± 7.8 109.4 ± 7.6 -
Week 6 104.8 ± 6.0 109.4 ± 7.5 0.98
Week 12 106.1 ± 9.7 108.8 ± 8.9 0.49
P value (Week 6 vs. Baseline) 0.69 0.83
P value (Week 12 vs. Baseline) 0.66 0.60
Diastolic BP (mmHg)
Baseline 64.2 ± 6.2 66.8 ± 6.3 -
Week 6 65.4 ± 5.9 68.0 ± 5.0 0.51
Week 12 68.2 ± 6.9 70.5 ± 6.8 0.50
P value (Week 6 vs. Baseline) 0.05 0.42
P value (Week 12 vs. Baseline) 0.0007 0.01
Mean arterial BP (mmHg)
Baseline 78.1 ± 6.5 81.0 ± 5.9 -
Week 6 78.5 ± 5.6 81.8 ± 5.2 0.65
Week 12 80.9 ± 7.5 83.2 ± 7.1 0.45
P value (Week 6 vs. Baseline) 0.20 0.64
P value (Week 12 vs. Baseline) 0.0081 0.15
Values are means ± SD.
Mogollon et al. Nutrition Journal 2013, 12:41 Page 10 of 13http://www.nutritionj.com/content/12/1/41
the study, even though all women were instructed toavoid these foods.Overall, 42 of 44 randomized pregnant women were
retained in our study, and only 1 participant was notincluded in intention-to-treat analysis.Weight increases linearly during the 2nd and 3rd tri-
mesters of pregnancy, but is associated with escalatingphysiological weight in pregnancy. Mean gestationalweight gain by our pregnant study participants was inaccordance with new recommendations of the commit-tee re-examining pregnancy weight guidelines [38].Caloric intake and nutritional dietary composition didnot change significantly during the trial. Althoughchocolate has high energy density and is perhaps recog-nized as a fattening food, several studies [35,39-41] havenot discerned any weight increase after daily chocolateintake. In our pilot RCT, participants in the 2 arms wereinstructed not to add chocolate bars to their usual dietbut to use them by replacing foods of similar energyand macronutrient composition. Moreover, to ensure
support and motivation for adequate use of chocolate,women were met individually by a dietitian who offeredglobal counseling. These strategies could have a favor-able impact on weight gain during pregnancy. Therefore,we can speculate that weight gain was not attributableto chocolate intake.The participants were in good health at baseline and
probably represented mainly females with an interest inhealth and diet. Therefore we can speculate that it mayhave contributed to reduce the possibility of a significantchocolate intake effect on FMD and BP. Therefore, ourresults may not be applicable to high-risk pregnantwomen.
ConclusionThe results of this pilot RCT confirm the feasibility of alarge RCT and flag important methodological, physio-logical and clinical elements that need to be taken intoaccount in large-scale clinical studies. Treatment com-pliance by all participants was satisfactory. Consumption
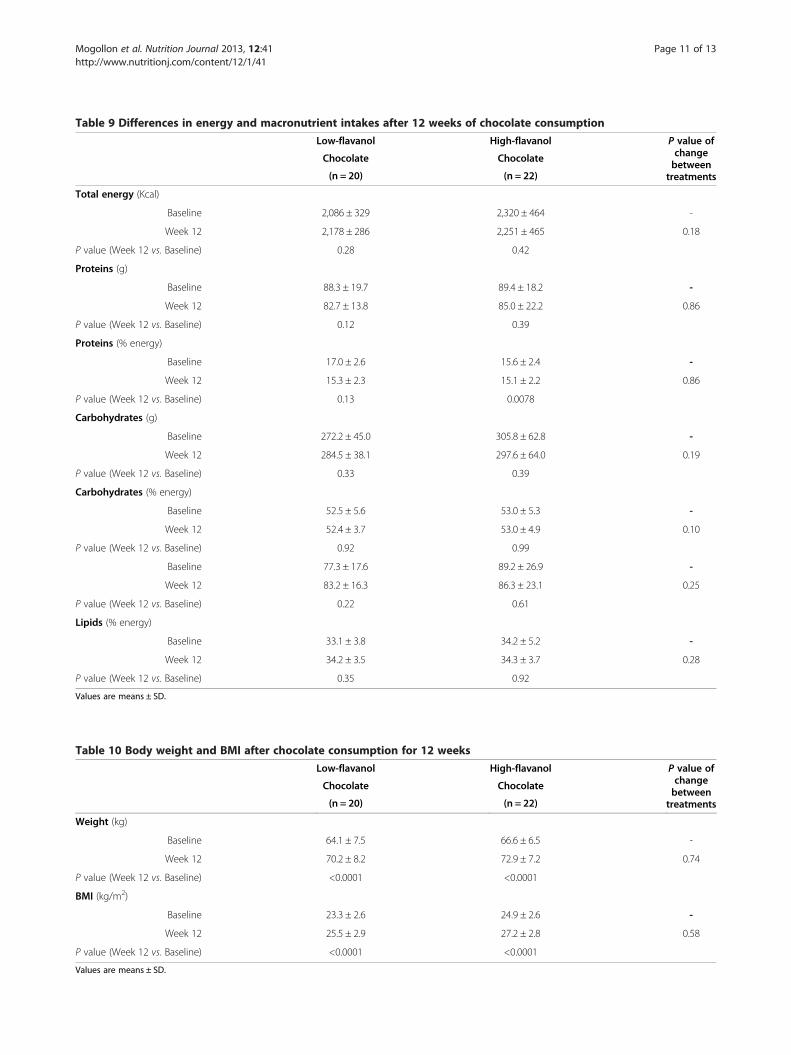
Table 9 Differences in energy and macronutrient intakes after 12 weeks of chocolate consumption
Low-flavanol High-flavanol P value ofchangebetweentreatments
Chocolate Chocolate
(n = 20) (n = 22)
Total energy (Kcal)
Baseline 2,086 ± 329 2,320 ± 464 -
Week 12 2,178 ± 286 2,251 ± 465 0.18
P value (Week 12 vs. Baseline) 0.28 0.42
Proteins (g)
Baseline 88.3 ± 19.7 89.4 ± 18.2 -
Week 12 82.7 ± 13.8 85.0 ± 22.2 0.86
P value (Week 12 vs. Baseline) 0.12 0.39
Proteins (% energy)
Baseline 17.0 ± 2.6 15.6 ± 2.4 -
Week 12 15.3 ± 2.3 15.1 ± 2.2 0.86
P value (Week 12 vs. Baseline) 0.13 0.0078
Carbohydrates (g)
Baseline 272.2 ± 45.0 305.8 ± 62.8 -
Week 12 284.5 ± 38.1 297.6 ± 64.0 0.19
P value (Week 12 vs. Baseline) 0.33 0.39
Carbohydrates (% energy)
Baseline 52.5 ± 5.6 53.0 ± 5.3 -
Week 12 52.4 ± 3.7 53.0 ± 4.9 0.10
P value (Week 12 vs. Baseline) 0.92 0.99
Baseline 77.3 ± 17.6 89.2 ± 26.9 -
Week 12 83.2 ± 16.3 86.3 ± 23.1 0.25
P value (Week 12 vs. Baseline) 0.22 0.61
Lipids (% energy)
Baseline 33.1 ± 3.8 34.2 ± 5.2 -
Week 12 34.2 ± 3.5 34.3 ± 3.7 0.28
P value (Week 12 vs. Baseline) 0.35 0.92
Values are means ± SD.
Table 10 Body weight and BMI after chocolate consumption for 12 weeks
Low-flavanol High-flavanol P value ofchangebetweentreatments
Chocolate Chocolate
(n = 20) (n = 22)
Weight (kg)
Baseline 64.1 ± 7.5 66.6 ± 6.5 -
Week 12 70.2 ± 8.2 72.9 ± 7.2 0.74
P value (Week 12 vs. Baseline) <0.0001 <0.0001
BMI (kg/m2)
Baseline 23.3 ± 2.6 24.9 ± 2.6 -
Week 12 25.5 ± 2.9 27.2 ± 2.8 0.58
P value (Week 12 vs. Baseline) <0.0001 <0.0001
Values are means ± SD.
Mogollon et al. Nutrition Journal 2013, 12:41 Page 11 of 13http://www.nutritionj.com/content/12/1/41
Mogollon et al. Nutrition Journal 2013, 12:41 Page 12 of 13http://www.nutritionj.com/content/12/1/41
of flavanol-rich chocolate was not associated with sig-nificant changes in FMD, SBP and DBP in pregnantwomen with normal BP. We cannot rule out that failureto improve could have been due to a ceiling effect.We could hypothesize that the absence of effects was
attributable to our healthy, normotensive female popula-tion, among whom only small changes in BP or FMDwere to be expected. Nevertheless, as our study resultsdid not show side-effects, it would be pertinent tospecifically investigate these outcomes of flavanol-richchocolate in pregnant women at high risk of PE.
AbbreviationsBMI: Body mass index; BP: Blood pressure; DBP: Diastolic blood pressure;FFQ: Food frequency questionnaire; FMD: Flow-mediated dilation;HPLC: High-pressure liquid chromatography; MAP: Mean arterial bloodpressure; NO: Nitric oxide; PE: Preeclampsia; RCTs: Randomized clinical trials;SBP: Systolic blood pressure.
Competing interestsAll other authors declare that they have no conflicts of interest.
Authors’ contributionsJAM analyzed and interpretation the data and wrote the paper. EBperformed the experiments, acquisition of data and revising critical. SLacquisition of data and revising critical. CB conception and design,performed the experiments, acquisition of data, analyzed and interpretationthe data and revising critical. LB acquisition of data and revising critical. CCacquisition of data and revising critical. MN Performed the experiments,acquisition of data and revising critical. SD Conception and design, analyzedand interpretation the data, wrote the paper and revising critical. All authorsread and approved the final manuscript.
AcknowledgmentsThanks to the staff of the University Laval, especially at the St. Françoisd’Assise Hospital Research Centre and the Institute of Nutraceuticals andFunctional Foods (INAF). We also thank the women who participated in thestudy.
ProtocolFull details of the trial protocol can be requested: [email protected]
Author details1St. François d’Assise Hospital, Centre hospitalier universitaire de Québec(CHUQ), Quebec, Canada. 2Reproductive Biology Research Center, ResearchCenter, Centre hospitalier de l'Université Laval (CHUL)-CHUQ, Quebec,Canada. 3Department of Food Sciences and Nutrition, Institute ofNutraceuticals and Functional Foods (INAF), Université Laval, Quebec,Canada. 4Public Health Research Center, CHUQ, Quebec, Canada. 5Institute ofNutraceuticals and Functional Foods (INAF), Université Laval, Quebec,Canada. 6Department of Obstetrics and Gynecology, Research Center, St.François d’Assise Hospital (CHUQ), Université Laval, Québec G1L 3 L5, QC,Canada.
Received: 20 August 2012 Accepted: 4 April 2013Published: 8 April 2013
References1. Roberts JM, Pearson G, Cutler J, Lindheimer M: Summary of the NHLBI
Working Group on Research on Hypertension During Pregnancy.Hypertension 2003, 41(3):437–445.
2. Sibai B, Dekker G, Kupferminc M: Pre-eclampsia. Lancet 2005, 365(9461):785–799.3. Bellamy L, Casas JP, Hingorani AD, Williams DJ: Pre-eclampsia and risk of
cardiovascular disease and cancer in later life: systematic review andmeta-analysis. BMJ 2007, 335(7627):974.
4. Conrad KP, Joffe GM, Kruszyna H, Kruszyna R, Rochelle LG, Smith RP, ChavezJE, Mosher MD: Identification of increased nitric oxide biosynthesisduring pregnancy in rats. FASEB J 1993, 7(6):566–571.
5. Magness RR, Shaw CE, Phernetton TM, Zheng J, Bird IM: Endothelial vasodilatorproduction by uterine and systemic arteries, II. Pregnancy effects on NOsynthase expression. Am J Physiol 1997, 272(4 Pt 2):H1730–H1740.
6. Redman CW, Sargent IL: Latest advances in understanding preeclampsia.Science 2005, 308(5728):1592–1594.
7. Redman CW, Sargent IL: Placental stress and pre-eclampsia: a revisedview. Placenta 2009, 30(Suppl A):S38–S42.
8. Widlansky ME, Gokce N, Keaney JF Jr, Vita JA: The clinical implications ofendothelial dysfunction. J Am Coll Cardiol 2003, 42(7):1149–1160.
9. Hooper L, Kroon PA, Rimm EB, Cohn JS, Harvey I, Le Cornu KA, Ryder JJ, HallWL, Cassidy A: Flavonoids, flavonoid-rich foods, and cardiovascular risk:a meta-analysis of randomized controlled trials. Am J Clin Nutr 2008,88(1):38–50.
10. Triche EW, Grosso LM, Belanger K, Darefsky AS, Benowitz NL, Bracken MB:Chocolate Consumption in Pregnancy and Reduced Likelihood ofPreeclampsia. Epidemiology 2008, 19(3):459–464.
11. Saftlas AF, Triche EW, Beydoun H, Bracken MB: Does chocolate intakeduring pregnancy reduce the risks of preeclampsia and gestationalhypertension? Ann Epidemiol 2010, 20(8):584–591.
12. Klebanoff MA, Zhang J, Zhang C, Levine RJ: Maternal serum theobromineand the development of preeclampsia. Epidemiology 2009,20(5):727–732.
13. Di Renzo GC, Brillo E, Romanelli M, Porcaro G, Capanna F, Kanninen TT, GerliS, Clerici G: Potential effects of chocolate on human pregnancy: arandomized controlled trial. The journal of maternal-fetal & neonatalmedicine: the official journal of the European Association of Perinatal Medicine,the Federation of Asia and Oceania Perinatal Societies, the InternationalSociety of Perinatal Obstetricians 2012, 25(10):1860–1867.
14. Reinders A, Cuckson AC, Lee JT, Shennan AH: An accurate automatedblood pressure device for use in pregnancy and pre-eclampsia: theMicrolife 3BTO-A. BJOG 2005, 112(7):915–920.
15. Goulet J, Nadeau G, Lapointe A, Lamarche B, Lemieux S: Validity andreproducibility of an interviewer-administered food frequency questionnairefor healthy French-Canadian men and women. Nutr J 2004, 3:13.
16. Bouchard C, Tremblay A, Leblanc C, Lortie G, Savard R, Theriault G: Amethod to assess energy expenditure in children and adults. Am J ClinNutr 1983, 37(3):461–467.
17. Schmidt MD, Freedson PS, Pekow P, Roberts D, Sternfeld B, Chasan-Taber L:Validation of the Kaiser Physical Activity Survey in pregnant women.Medicine and science in sports and exercise 2006, 38(1):42–50.
18. Rodes-Cabau J, Noel M, Marrero A, Rivest D, Mackey A, Houde C, Bedard E,Larose E, Verreault S, Peticlerc M, Pibarot P, Bogaty P, Bertrand OF:Atherosclerotic burden findings in young cryptogenic stroke patientswith and without a patent foramen ovale. Stroke; a journal of cerebralcirculation 2009, 40(2):419–425.
19. Bogaty P, Brophy JM, Noel M, Boyer L, Simard S, Bertrand F, Dagenais GR:Impact of prolonged cyclooxygenase-2 inhibition on inflammatorymarkers and endothelial function in patients with ischemic heart diseaseand raised C-reactive protein: a randomized placebo-controlled study.Circulation 2004, 110(8):934–939.
20. Donald AE, Halcox JP, Charakida M, Storry C, Wallace SM, Cole TJ, Friberg P,Deanfield JE: Methodological approaches to optimize reproducibility andpower in clinical studies of flow-mediated dilation. J Am Coll Cardiol 2008,51(20):1959–1964.
21. Foenander T, Birkett DJ, Miners JO, Wing LM: The simultaneous determinationof theophylline, theobromine and caffeine in plasma by high performanceliquid chromatography. Clin Biochem 1980, 13(3):132–134.
22. Baba S, Osakabe N, Yasuda A, Natsume M, Takizawa T, Nakamura T, Terao J:Bioavailability of (−)-epicatechin upon intake of chocolate and cocoa inhuman volunteers. Free Radic Res 2000, 33(5):635–641.
23. Thabane L, Ma J, Chu R, Cheng J, Ismaila A, Rios LP, Robson R, Thabane M,Giangregorio L, Goldsmith CH: A tutorial on pilot studies: the what, whyand how. BMC Med Res Methodol 2010, 10:1.
24. Grassi D, Lippi C, Necozione S, Desideri G, Ferri C: Short-termadministration of dark chocolate is followed by a significant increase ininsulin sensitivity and a decrease in blood pressure in healthy persons.Am J Clin Nutr 2005, 81(3):611–614.
25. Fraga CG, Actis-Goretta L, Ottaviani JI, Carrasquedo F, Lotito SB, Lazarus S,Schmitz HH, Keen CL: Regular consumption of a flavanol-rich chocolatecan improve oxidant stress in young soccer players. Clin Dev Immunol2005, 12(1):11–17.
Mogollon et al. Nutrition Journal 2013, 12:41 Page 13 of 13http://www.nutritionj.com/content/12/1/41
26. Hooper L, Kay C, Abdelhamid A, Kroon PA, Cohn JS, Rimm EB, Cassidy A:Effects of chocolate, cocoa, and flavan-3-ols on cardiovascular health:a systematic review and meta-analysis of randomized trials. Am J ClinNutr 2012, 95(3):740–751.
27. Fisher ND, Hughes M, Gerhard-Herman M, Hollenberg NK: Flavanol-richcocoa induces nitric-oxide-dependent vasodilation in healthy humans.J Hypertens 2003, 21(12):2281–2286.
28. Vlachopoulos C, Aznaouridis K, Alexopoulos N, Economou E, Andreadou I,Stefanadis C: Effect of dark chocolate on arterial function in healthyindividuals. Am J Hypertens 2005, 18(6):785–791.
29. Taubert D, Roesen R, Schomig E: Effect of cocoa and tea intake on bloodpressure: a meta-analysis. Arch Intern Med 2007, 167(7):626–634.
30. Rein D, Lotito S, Holt RR, Keen CL, Schmitz HH, Fraga CG: Epicatechin inhuman plasma: In vivo determination and effect of chocolateconsumption on plasma oxidation status. J Nutr 2000, 130(8):2109s–2114s.
31. Richelle M, Tavazzi I, Enslen M, Offord EA: Plasma kinetics in man ofepicatechin from black chocolate. Eur J Clin Nutr 1999, 53(1):22–26.
32. Engler MB, Engler MM, Chen CY, Malloy MJ, Browne A, Chiu EY, Kwak HK,Milbury P, Paul SM, Blumberg J, Mietus-Snyder ML: Flavonoid-rich darkchocolate improves endothelial function and increases plasmaepicatechin concentrations in healthy adults. J Am Coll Nutr 2004,23(3):197–204.
33. Spencer JP, Schroeter H, Shenoy B, Srai SK, Debnam ES, Rice-Evans C:Epicatechin is the primary bioavailable form of the procyanidin dimersB2 and B5 after transfer across the small intestine. Biochem Biophys ResCommun 2001, 285(3):588–593.
34. Holt RR, Lazarus SA, Sullards MC, Zhu QY, Schramm DD, Hammerstone JF,Fraga CG, Schmitz HH, Keen CL: Procyanidin dimer B2 [epicatechin-(4beta-8)-epicatechin] in human plasma after the consumption of aflavanol-rich cocoa. Am J Clin Nutr 2002, 76(4):798–804.
35. Taubert D, Roesen R, Lehmann C, Jung N, Schomig E: Effects of lowhabitual cocoa intake on blood pressure and bioactive nitric oxide:a randomized controlled trial. JAMA 2007, 298(1):49–60.
36. Corretti MC, Anderson TJ, Benjamin EJ, Celermajer D, Charbonneau F,Creager MA, Deanfield J, Drexler H, Gerhard-Herman M, Herrington D,Vallance P, Vita J, Vogel R: Guidelines for the ultrasound assessment ofendothelial-dependent flow-mediated vasodilation of the brachial artery:a report of the International Brachial Artery Reactivity Task Force. J AmColl Cardiol 2002, 39(2):257–265.
37. van den Bogaard B, Draijer R, Westerhof BE, van den Meiracker AH, vanMontfrans GA, van den Born BJ: Effects on peripheral and central bloodpressure of cocoa with natural or high-dose theobromine: a randomized,double-blind crossover trial. Hypertension 2010, 56(5):839–846.
38. Rasmussen KM, Catalano PM, Yaktine AL: New guidelines for weight gainduring pregnancy: what obstetrician/gynecologists should know.Curr Opin Obstet Gynecol 2009, 21(6):521–526.
39. Buijsse B, Weikert C, Drogan D, Bergmann M, Boeing H: Chocolateconsumption in relation to blood pressure and risk of cardiovasculardisease in German adults. Eur Heart J 2010, 31(13):1616–1623.
40. Balzer J, Rassaf T, Heiss C, Kleinbongard P, Lauer T, Merx M, Heussen N,Gross HB, Keen CL, Schroeter H, Kelm M: Sustained benefits in vascularfunction through flavanol-containing cocoa in medicated diabeticpatients a double-masked, randomized, controlled trial. J Am Coll Cardiol2008, 51(22):2141–2149.
41. Davison K, Coates AM, Buckley JD, Howe PR: Effect of cocoa flavanols andexercise on cardiometabolic risk factors in overweight and obesesubjects. Int J Obes 2008, 32(8):1289–1296.
doi:10.1186/1475-2891-12-41Cite this article as: Mogollon et al.: Blood pressure and endothelialfunction in healthy, pregnant women after acute and dailyconsumption of flavanol-rich chocolate: a pilot, randomized controlledtrial. Nutrition Journal 2013 12:41.
Submit your next manuscript to BioMed Centraland take full advantage of:
• Convenient online submission
• Thorough peer review
• No space constraints or color figure charges
• Immediate publication on acceptance
• Inclusion in PubMed, CAS, Scopus and Google Scholar
• Research which is freely available for redistribution
Submit your manuscript at www.biomedcentral.com/submit