Embed Size (px)
Citation preview
RESEARCH Open Access
Research on vocal sounding based onspectrum image analysisJian Sun1,2
Abstract
The improvement of vocal singing technology involves many factors, and it is difficult to achieve the desired effectby human analysis alone. Based on this, this study based on spectrum image analysis uses the base-2 time-selectionFFT algorithm as the research algorithm, uses the wavelet transform algorithm as the denoising algorithm, and combinescomparative analysis to discuss the mechanism of vocal music, the state of vocalization, and the vocal quality of vocalistsin vocal music teaching. Simultaneously, this study compares the singer’s frequency, pitch, overtones, harmonics, singerformants, etc., and derives the characteristics of vocal vocalization under different conditions, and can be extended to allmusic vocal studies. Research shows that this research method has certain practicality and can provide theoreticalreference for related research.
Keywords: Vocal music, Image analysis, Music spectrum, Singing, Image processing
1 IntroductionThe research on vocal singing technology has a long his-tory. In the process, many experts and scholars havecontinuously studied and summarized this. After re-peated exploration and continuous practice, some rela-tively perfect technical methods have been formed.However, through my own review, it is found that thedomestic summary of these singing methods is only inthe teaching of words, and the intuitive unified descrip-tion is basically blank, which is quite inconvenient for usto correctly learn, recognize, and evaluate vocal music.Although the current relevant research report has cer-tain results, considering the vocal cord conditions, thecultural background will bring some deviations to theexperimental results. Therefore, we doubt whether theirdata results can represent the level of the subjects in ourcountry. Whether these tests are in line with the culturalbackground is indeed a difficult problem to be verified,and it is also an urgent need for domestic research tocarry out such research. In addition, there are some dif-ferences in different kinds of music, and there are fewstudies related to vocal music in related research. There-fore, this study combines image processing to study theoccurrence of vocal music [1].
Wang et al. proposed a normalized model of pitch per-ception based on the unique resolution of the human earto different frequency sources. This algorithm has greatsignificance in multi-frequency estimation techniques [2].Wu et al. simplified the pitch model by using the Barkscale to simulate the human ear frequency response,which greatly reduced the amount of computation. Themethod calculates the autocorrelation coefficient of thesignal through two channels, and the multi-channel signalautocorrelation coefficient in the non-ERB scale, and fi-nally calculates the respective fundamental frequencyvalues one by one by scale stretching and linearinterpolation. Similarly, the cycle-based algorithm wasused by Staley and Sethares. Similarly, based on the estab-lishment of the pitch model, Cheveigne et al. recursivelyscreened the estimated fundamental frequencies in thepoetry selection [3].Guan et al. used the new technology to develop one of
the most advanced automatic music annotations at thattime. The multi-frequency estimation method in thissystem was also in a leading position at that time. Theyapplied computer scene analysis in the system, assumingthat the sinusoidal trajectory is a musical note, and interms of methods, they cite the principle of perceptualaggregation, including harmonicity, frequency, timbre,and melody. Guan et al. designed musical instrumentmodels for the instruments corresponding to each note.
Correspondence: [email protected] college, Mahasarakham University, Mahasarakham 44150, Thailand2Huayang High School, Chengdu 610213, China
EURASIP Journal on Imageand Video Processing
© The Author(s). 2019 Open Access This article is distributed under the terms of the Creative Commons Attribution 4.0International License (http://creativecommons.org/licenses/by/4.0/), which permits unrestricted use, distribution, andreproduction in any medium, provided you give appropriate credit to the original author(s) and the source, provide a link tothe Creative Commons license, and indicate if changes were made.
Sun EURASIP Journal on Image and Video Processing (2019) 2019:4 https://doi.org/10.1186/s13640-018-0397-0
These models can solve the problem of spectral energydistribution when notes of different frequencies overlap.In addition, they analyze the probability of occurrence ofnotes in the case of a given chord and use Markovchains to encode and transfer chord probabilities. Themethod uses a Bayesian network for linear prediction forbottom-up analysis, and top-down processing includespredictive note spectral components and chord predic-tion [4].Meng models the short-time spectrum of the music
signal. In the model, a certain number of harmonicsconstitute each tone model, and each harmonic compo-nent is modeled by a Gaussian distribution centered onthe fundamental frequency integer multiple. Meng de-signed a multi-agent structure to track the fundamentalfrequency weights of consecutive frames and iterativelyupdated each pitch model and its weight with themethod of calculating the expectation maximization.The algorithm can successfully track the pitch lines ofthe music signal and its melody. Although the system ismore complicated, the core EM algorithm is relativelyeasy to implement in the experiment. In addition, the al-gorithm can correctly estimate the weight of all funda-mental frequencies, but the disadvantage is that theprimary fundamental frequency can usually only beestimated [5].Qiu et al. improved on the idea of weighted
mixed-tone models. However, they modeled each set ofharmonics in the tone model instead of modeling eachharmonic individually. They believe that although theamplitude of the notes in the signal will change, the har-monic structure of each note is unique and stable. Theharmonic structure here refers to the relative relation-ship between the harmonics. Based on the relationshipbetween harmonic frequencies, Qiu et al. chose to modela set of harmonics using a constrained mixed Gaussianmodel. It can be seen in the experiment that the con-straint to be used in the system reduces the parametersto be estimated in the system. In this modeling mode,the signal model is established and finally the parameterestimation result is given based on the expectationmaximization [6].Spectrum iterative deletion method was adopted by
Claudio. In order to reduce the influence of instrumentsof different timbres as much as possible, the algorithmfirstly pre-whitens the signals and then calculates thesum of the energy of the corresponding harmonic fre-quencies in the frequency domain for each candidatefundamental frequency. Among them, the person withthe greatest energy is considered to be the fundamentalfrequency. Then, the algorithm subtracts the fundamen-tal frequency and its harmonic energy from the originalspectrum according to a certain ratio. At this time, thealgorithm estimates the next fundamental frequency,
and then iteratively estimates. The algorithm has a lot oftechnical links that need special attention, such as par-ameter estimation during pre-whitening, proportionaldeletion coefficient, and judgment of dominant funda-mental frequency estimation. The algorithm testedchords randomly synthesized from a variety of instru-mental notes, and the test yielded the desired results [7].Zabalza sees the fundamental frequency estimation as
a multi-label classification problem, which is completelydifferent from the other methods. Each signal frame inthe algorithm is considered to be a sample, the funda-mental frequency is treated as a label, and the algorithmextracts the features of the spectrum of the signal. Theycollect all samples of this fundamental frequency foreach fundamental frequency, thus training a supportvector machine classifier. The algorithm considers theclassification result obtained by the classifier as the re-sult of the fundamental frequency estimation. Zabalza etal. chose the piano signal for testing and the results wereas expected. However, although the algorithm is novel, itneeds to deal with two difficulties: First, although the al-gorithm uses a one-to-many classifier, the parameterspace is greatly reduced, but the fundamental frequencyclassifier is split, and it also violates the close relation-ship between the notes. Second, the algorithm needs totrain up to dozens of classifiers, which greatly increasesthe amount of computation [8].In view of the current understanding of image process-
ing in vocal research topics, the purpose of this study isas follows: First, this article is to facilitate a clear under-standing of the current status and trends of research onthis topic in the world, as well as some unresolved issuesand development limitations, so as to better fill the gap.Second, the author’s collation of the adjectives of singingtechnology can be used as a basic research for other re-searchers, thus providing an innovative basis for futureresearch.
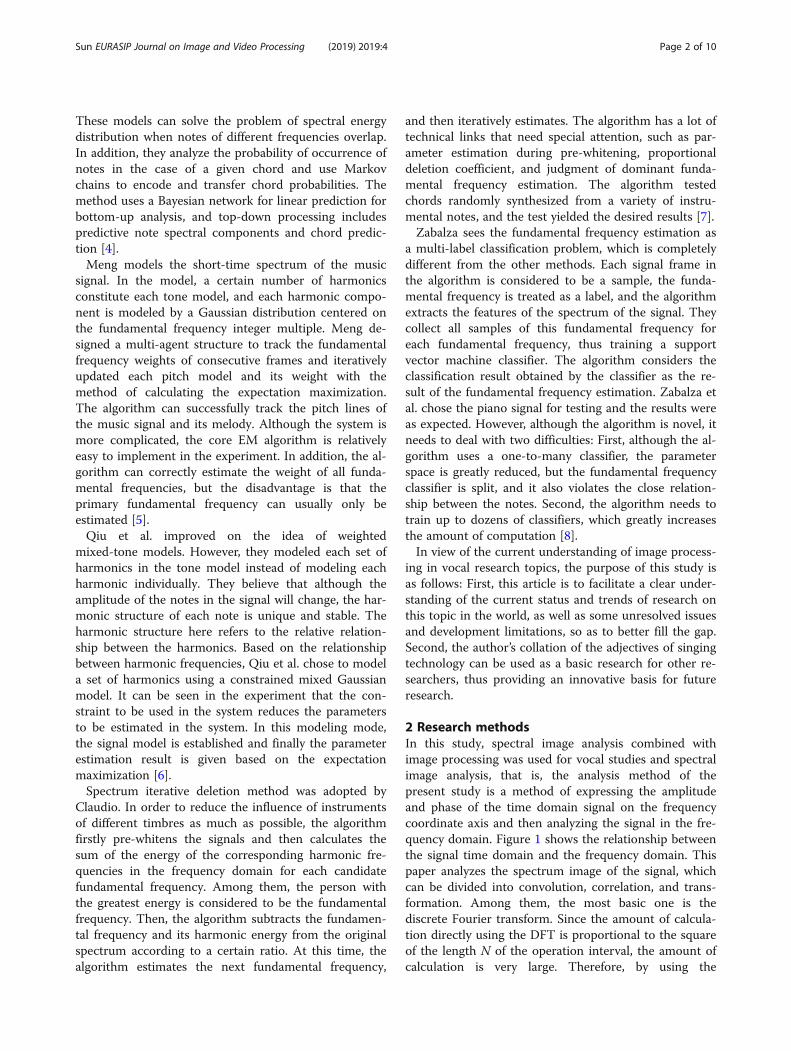
2 Research methodsIn this study, spectral image analysis combined withimage processing was used for vocal studies and spectralimage analysis, that is, the analysis method of thepresent study is a method of expressing the amplitudeand phase of the time domain signal on the frequencycoordinate axis and then analyzing the signal in the fre-quency domain. Figure 1 shows the relationship betweenthe signal time domain and the frequency domain. Thispaper analyzes the spectrum image of the signal, whichcan be divided into convolution, correlation, and trans-formation. Among them, the most basic one is thediscrete Fourier transform. Since the amount of calcula-tion directly using the DFT is proportional to the squareof the length N of the operation interval, the amount ofcalculation is very large. Therefore, by using the
Sun EURASIP Journal on Image and Video Processing (2019) 2019:4 Page 2 of 10
periodicity, symmetry, and other properties of the twid-dle factor, the DFT of the long sequence is decomposedinto short-order DFTs one by one, and the amount ofcomputation is reduced, which is the fast Fourier trans-form (FFT) algorithm. The base-2 time-selection FFT al-gorithm [9] is used in this paper.By definition, the DNF formula for a finite-length se-
quence x(n) of length N is as shown in Eq. (1):
X kð Þ ¼XN−1
n¼0x nð ÞWnk
N ; k ¼ 0; 1;…;N−1 ð1Þ
WnkN ¼ e− j
2πN nk¼ cos 2π
N nkð Þ−− j sin 2πN
ð2Þ
In the actual application process, it can be clearly feltthat the FFT algorithm is greatly improved comparedwith the direct calculation of DFT, especially the largerN, the effect is more obvious. In addition, the computa-tional complexity of the FFT algorithm is significantlyless than that of the DFT algorithm, so the FFT algo-rithm is more suitable for this study.This study starts with the butterfly operation of
spectrum image analysis and optimizes the FFT algo-rithm to make it suitable for embedded system. On thisbasis, we propose an audio dual spectrum identificationmethod for the problem of music and color mismatch.Regardless of the type of music, from the perspective ofspectral image analysis, their audio signals are composedof various harmonics of the sinusoidal signal, and thespectrum of the audio signal is its essential feature.Therefore, in this experiment, we collected a multi-trackMIDI main melody demo of standard music chords. Wemainly perform spectral feature extraction on it, and thefrequency value of the international standard sound A_la
major is 440 Hz. Then, according to the calculation ofthe 12 average law, the adjacent semitones differ by 2 to12 times, and the theoretical frequency values of theother majors are obtained [10]. Table 1 shows the fre-quency values corresponding to the major.The spectrum of the audio signal in the vocal utter-
ance and the spectrum of which music chords are corre-sponding or similar are determined by the frequencycomparison method. There are many ways to compare.The simplest can be determined by the maximum inten-sity of the spectrum, i.e., the maximum intensity methodof the contrast spectrum. We need to use Bayesian for-mula to calculate the same or similar probability, whichis widely used in scientific research with its profoundthoughts.We set the natural state θ to have k kinds, namely θ1,
θ2, …, θk. P(θi) represents the prior probability of θ_i oc-curring in the natural state. P(x| θi) represents the prob-ability that the event is x in the state θi condition. Thefull probability P(x) is the probability that x may occurin various states, i.e., [11]
P xð Þ ¼Xk
i¼1P xjθið ÞP θið Þ ð3Þ
Fig. 1 Diagram of the time domain and frequency domain of the signal
Table 1 Comparison of the computational quantities of basal-2FFT and direct computation DFT
Complex multiplication Complex addition
Basal-2 FFT N/2log2N N2log2N
Direct computation DFT N2 numbers N(N − 1)
Sun EURASIP Journal on Image and Video Processing (2019) 2019:4 Page 3 of 10
P xjθið Þ ¼ P xjθið ÞP xð ÞPki¼1P xjθið ÞP θið Þ ð4Þ
When using the Bayes formula, it is necessary to con-struct a probability model based on the spectrum of theaudio signal. The statistical calculation is used to com-pare the amplitude of the audio signal samplingspectrum with the peak of the standard music chordspectrum to determine the music chord correspondingto the played audio signal, and then the color can bedetermined.The vocal vocalization will produce noise during the
actual extension, and the abovementioned audio formatconversion will inevitably generate noise during the con-version process, which will seriously affect the accuracyof the audio dual spectrum identification method.Therefore, this study uses wavelet transform to removehigh-frequency noise interference. When the waveletfunction Ψ(t) is a real function, the one-dimensionalwavelet continuous transformation formula is as shownin Eq. (5) [12].
W f a; bð Þ ¼ aj j1=2Z þ∞
−∞f tð Þψ t−b
a
� �dt ð5Þ
Among them, a is the scale factor and b is the dis-placement factor. There are three existing waveletdenoising methods, namely, modulus maximal recon-struction denoising, spatial correlation denoising, andwavelet domain threshold denoising. By comparing thequalitative methods of the three denoising methods, andfinally considering the calculation and denoising effects,we choose to use the third wavelet domain thresholddenoising. Threshold denoising in the wavelet domain isto select appropriate thresholds on different scales, zero
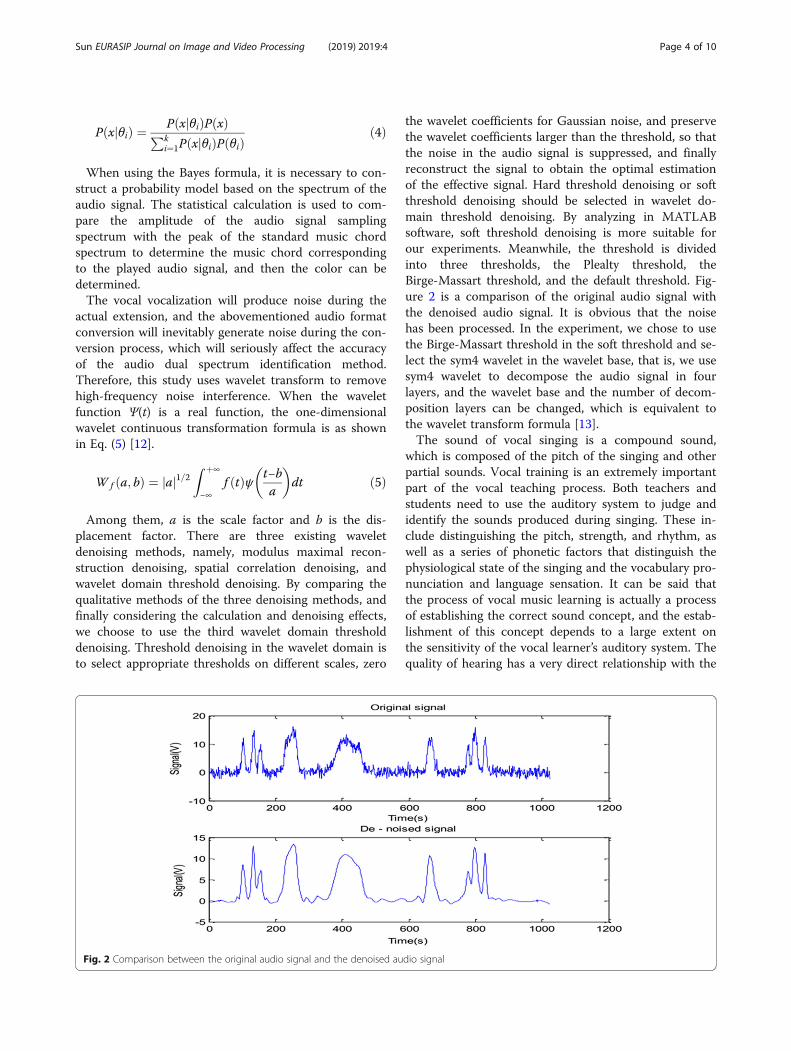
the wavelet coefficients for Gaussian noise, and preservethe wavelet coefficients larger than the threshold, so thatthe noise in the audio signal is suppressed, and finallyreconstruct the signal to obtain the optimal estimationof the effective signal. Hard threshold denoising or softthreshold denoising should be selected in wavelet do-main threshold denoising. By analyzing in MATLABsoftware, soft threshold denoising is more suitable forour experiments. Meanwhile, the threshold is dividedinto three thresholds, the Plealty threshold, theBirge-Massart threshold, and the default threshold. Fig-ure 2 is a comparison of the original audio signal withthe denoised audio signal. It is obvious that the noisehas been processed. In the experiment, we chose to usethe Birge-Massart threshold in the soft threshold and se-lect the sym4 wavelet in the wavelet base, that is, we usesym4 wavelet to decompose the audio signal in fourlayers, and the wavelet base and the number of decom-position layers can be changed, which is equivalent tothe wavelet transform formula [13].The sound of vocal singing is a compound sound,
which is composed of the pitch of the singing and otherpartial sounds. Vocal training is an extremely importantpart of the vocal teaching process. Both teachers andstudents need to use the auditory system to judge andidentify the sounds produced during singing. These in-clude distinguishing the pitch, strength, and rhythm, aswell as a series of phonetic factors that distinguish thephysiological state of the singing and the vocabulary pro-nunciation and language sensation. It can be said thatthe process of vocal music learning is actually a processof establishing the correct sound concept, and the estab-lishment of this concept depends to a large extent onthe sensitivity of the vocal learner’s auditory system. Thequality of hearing has a very direct relationship with the
Fig. 2 Comparison between the original audio signal and the denoised audio signal
Sun EURASIP Journal on Image and Video Processing (2019) 2019:4 Page 4 of 10
physiological conditions and experience of the listener.The most obvious thing about the sound spectrum de-scription and identification of the pronunciation ofmultimedia computer technology is that it has accuracyand intuitiveness. During the vocal training process, werecorded the singer’s singing voice through a computerand observed various subtle parameters of the emittedsound through the function chart and the sound wavetable displayed on the computer screen. This is a posi-tive complement to the human auditory system in anobjective perspective. The use of the computer to par-ticipate in the vocal music teaching process has a posi-tive effect on the quality of the vocalist’s pronunciation,as well as the analysis of singing and speech intelligibil-ity. The following is a spectrum image analysis test forvocal sounds and the like [14].By analyzing the vocalist’s pronunciation through spec-
tral image analysis, you can observe the pitch of thesinging voice and various overtones, partial sounds, andsounds in different frequency segments. The analysis re-sults from the average of the sound frequency analysis ina certain time zone, which we call the “frequencyspectrum.” In fact, it is a frequency and sound intensitydistribution map of each harmonic column of singing.This frequency spectrum shows the sound intensity pro-file of the sound of singing at different frequencies, andits sound intensity is expressed in decibels. Usually, wegive a more specific “sound form” reference frame fromthe perspective of musical acoustics. It allows us notonly to understand the sound in the abstract concept ofthe “anapharyngeal cavity, oral cavity, chest cavity, headcavity, high position resonance” pointed out by the ab-stract general auditory organs, but also to visually seethe visual form and specific numerical values. Thismethod of analysis is specific, intuitive, and accurate
[15]. In addition, the graphics and data provided by thecomputer can not only objectively reflect the character-istics of pitch, sound intensity, etc., but also assist theauditory to further analyze the timbre, resonance, andother factors of sound of singing.
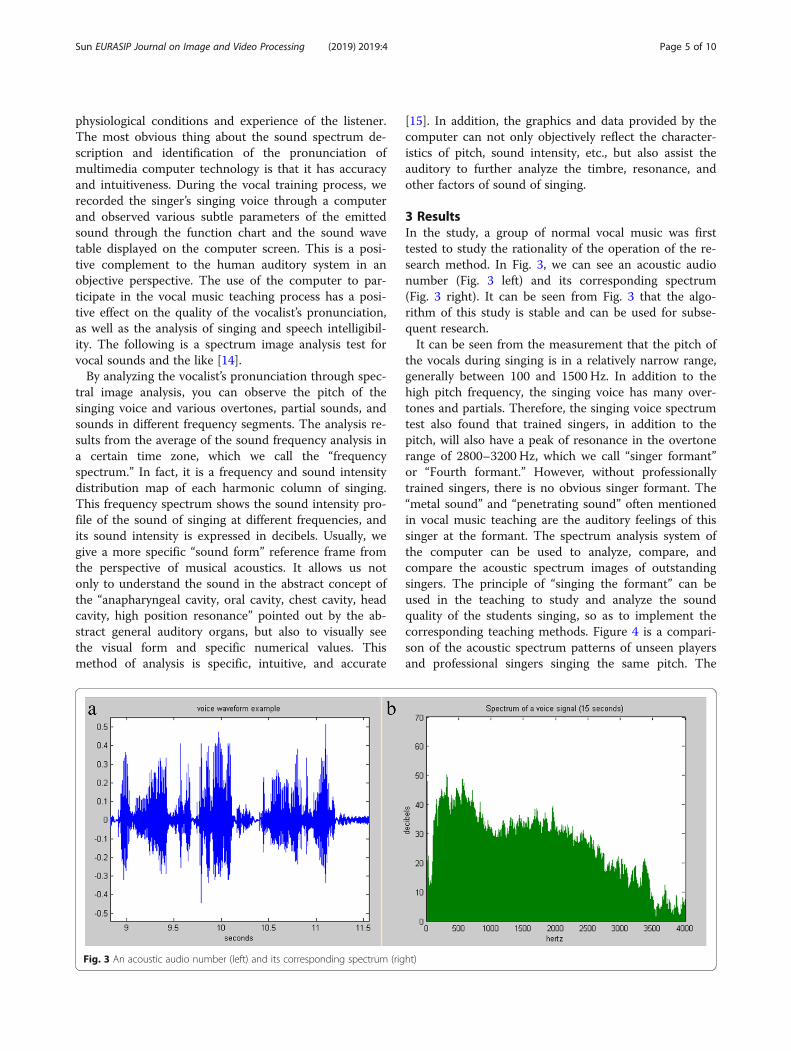
3 ResultsIn the study, a group of normal vocal music was firsttested to study the rationality of the operation of the re-search method. In Fig. 3, we can see an acoustic audionumber (Fig. 3 left) and its corresponding spectrum(Fig. 3 right). It can be seen from Fig. 3 that the algo-rithm of this study is stable and can be used for subse-quent research.It can be seen from the measurement that the pitch of
the vocals during singing is in a relatively narrow range,generally between 100 and 1500 Hz. In addition to thehigh pitch frequency, the singing voice has many over-tones and partials. Therefore, the singing voice spectrumtest also found that trained singers, in addition to thepitch, will also have a peak of resonance in the overtonerange of 2800–3200 Hz, which we call “singer formant”or “Fourth formant.” However, without professionallytrained singers, there is no obvious singer formant. The“metal sound” and “penetrating sound” often mentionedin vocal music teaching are the auditory feelings of thissinger at the formant. The spectrum analysis system ofthe computer can be used to analyze, compare, andcompare the acoustic spectrum images of outstandingsingers. The principle of “singing the formant” can beused in the teaching to study and analyze the soundquality of the students singing, so as to implement thecorresponding teaching methods. Figure 4 is a compari-son of the acoustic spectrum patterns of unseen playersand professional singers singing the same pitch. The
Fig. 3 An acoustic audio number (left) and its corresponding spectrum (right)
Sun EURASIP Journal on Image and Video Processing (2019) 2019:4 Page 5 of 10
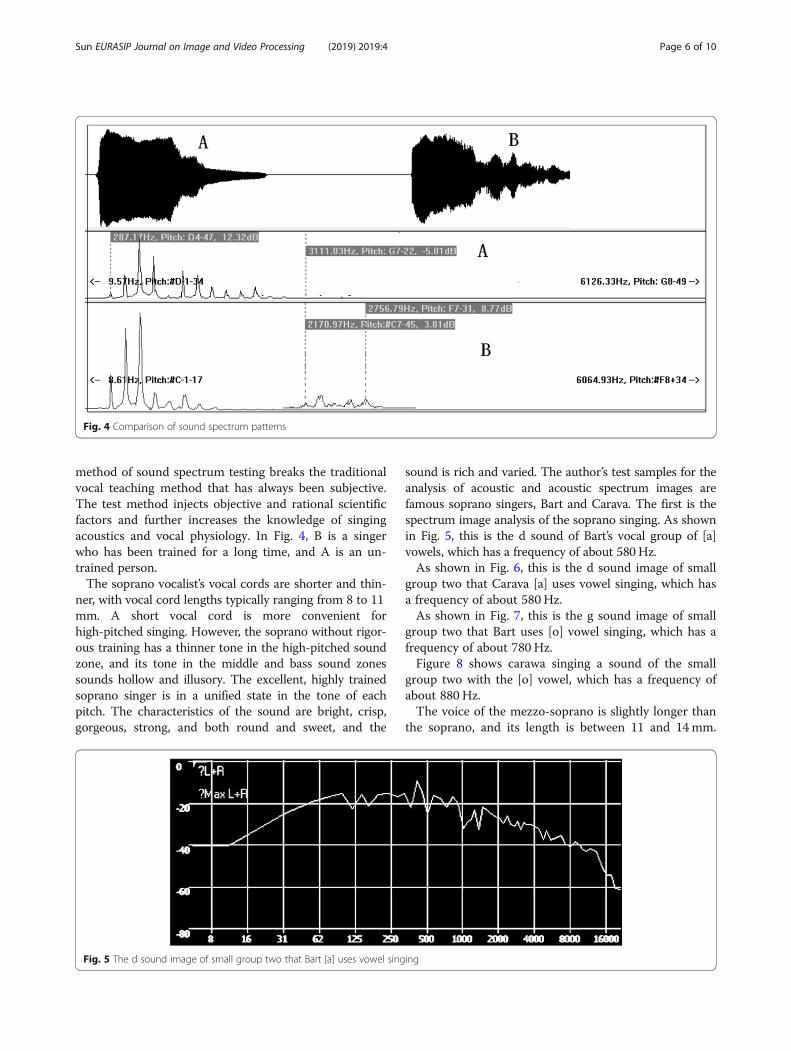
method of sound spectrum testing breaks the traditionalvocal teaching method that has always been subjective.The test method injects objective and rational scientificfactors and further increases the knowledge of singingacoustics and vocal physiology. In Fig. 4, B is a singerwho has been trained for a long time, and A is an un-trained person.The soprano vocalist’s vocal cords are shorter and thin-
ner, with vocal cord lengths typically ranging from 8 to 11mm. A short vocal cord is more convenient forhigh-pitched singing. However, the soprano without rigor-ous training has a thinner tone in the high-pitched soundzone, and its tone in the middle and bass sound zonessounds hollow and illusory. The excellent, highly trainedsoprano singer is in a unified state in the tone of eachpitch. The characteristics of the sound are bright, crisp,gorgeous, strong, and both round and sweet, and the
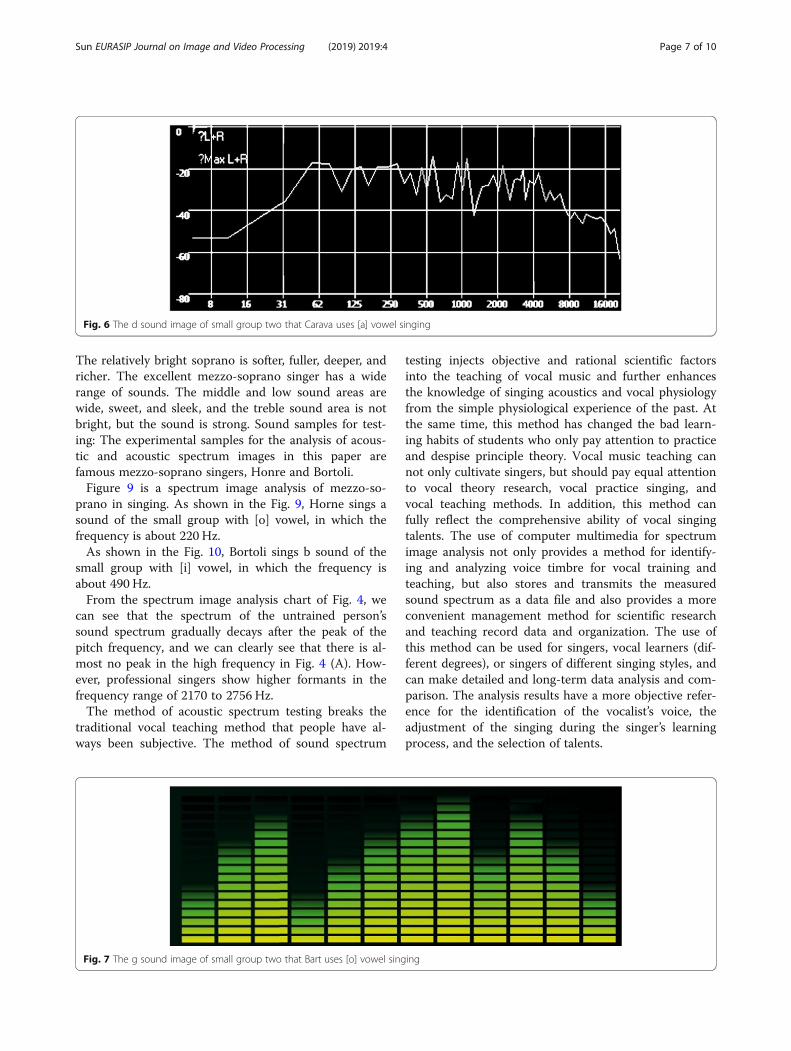
sound is rich and varied. The author’s test samples for theanalysis of acoustic and acoustic spectrum images arefamous soprano singers, Bart and Carava. The first is thespectrum image analysis of the soprano singing. As shownin Fig. 5, this is the d sound of Bart’s vocal group of [a]vowels, which has a frequency of about 580Hz.As shown in Fig. 6, this is the d sound image of small
group two that Carava [a] uses vowel singing, which hasa frequency of about 580 Hz.As shown in Fig. 7, this is the g sound image of small
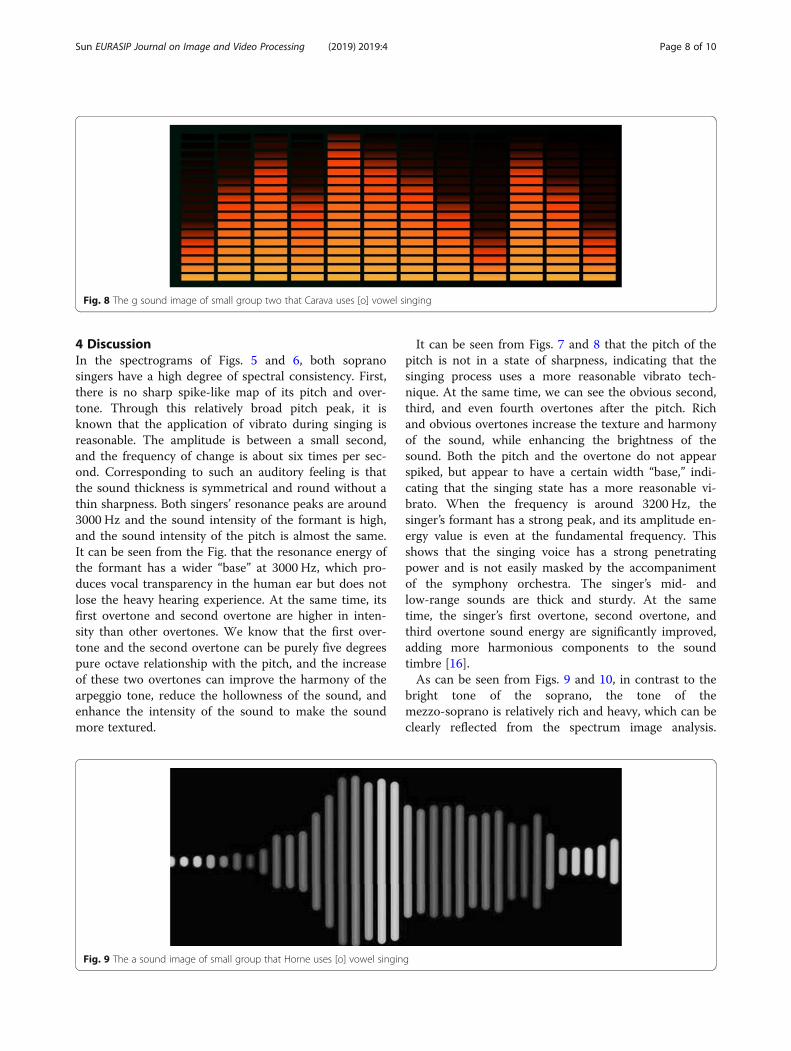
group two that Bart uses [o] vowel singing, which has afrequency of about 780 Hz.Figure 8 shows carawa singing a sound of the small
group two with the [o] vowel, which has a frequency ofabout 880 Hz.The voice of the mezzo-soprano is slightly longer than
the soprano, and its length is between 11 and 14mm.
Fig. 4 Comparison of sound spectrum patterns
Fig. 5 The d sound image of small group two that Bart [a] uses vowel singing
Sun EURASIP Journal on Image and Video Processing (2019) 2019:4 Page 6 of 10
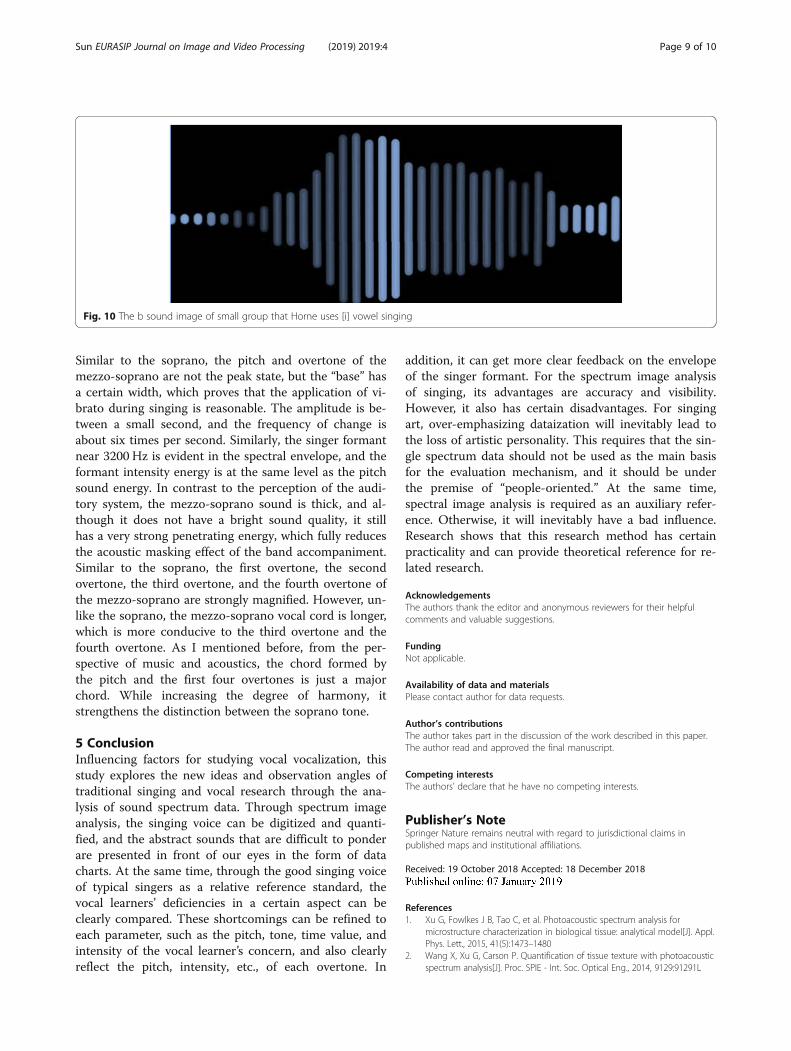
The relatively bright soprano is softer, fuller, deeper, andricher. The excellent mezzo-soprano singer has a widerange of sounds. The middle and low sound areas arewide, sweet, and sleek, and the treble sound area is notbright, but the sound is strong. Sound samples for test-ing: The experimental samples for the analysis of acous-tic and acoustic spectrum images in this paper arefamous mezzo-soprano singers, Honre and Bortoli.Figure 9 is a spectrum image analysis of mezzo-so-
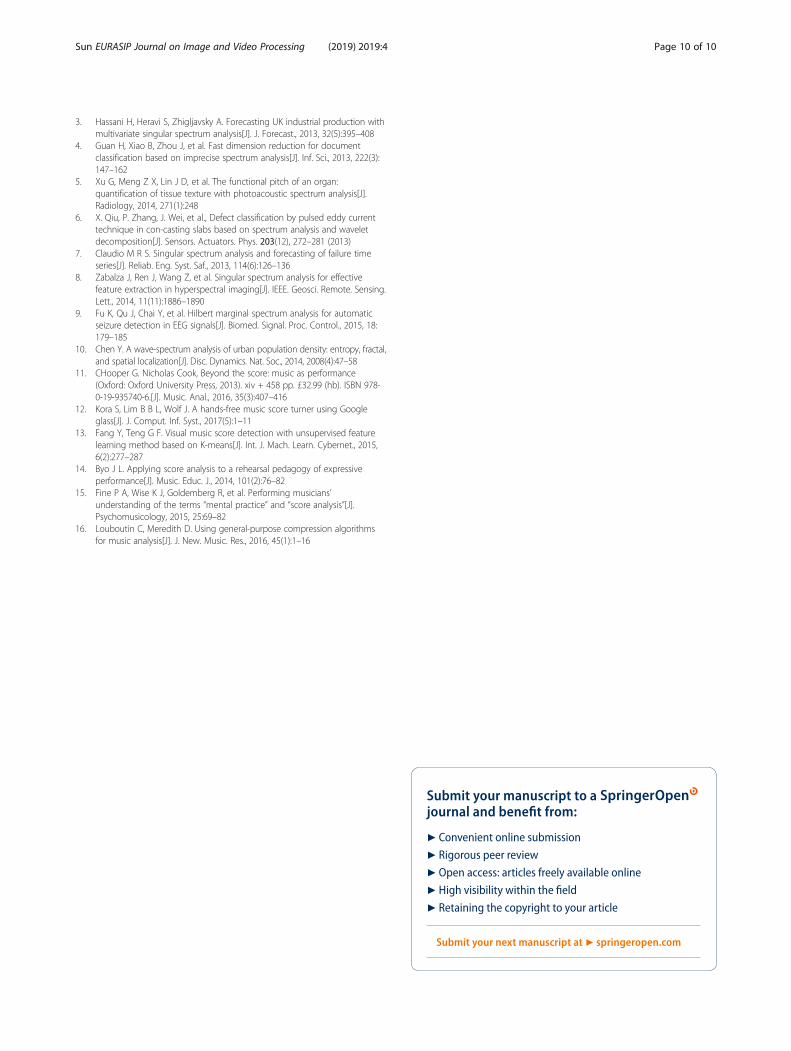
prano in singing. As shown in the Fig. 9, Horne sings asound of the small group with [o] vowel, in which thefrequency is about 220 Hz.As shown in the Fig. 10, Bortoli sings b sound of the
small group with [i] vowel, in which the frequency isabout 490 Hz.From the spectrum image analysis chart of Fig. 4, we
can see that the spectrum of the untrained person’ssound spectrum gradually decays after the peak of thepitch frequency, and we can clearly see that there is al-most no peak in the high frequency in Fig. 4 (A). How-ever, professional singers show higher formants in thefrequency range of 2170 to 2756 Hz.The method of acoustic spectrum testing breaks the
traditional vocal teaching method that people have al-ways been subjective. The method of sound spectrum
testing injects objective and rational scientific factorsinto the teaching of vocal music and further enhancesthe knowledge of singing acoustics and vocal physiologyfrom the simple physiological experience of the past. Atthe same time, this method has changed the bad learn-ing habits of students who only pay attention to practiceand despise principle theory. Vocal music teaching cannot only cultivate singers, but should pay equal attentionto vocal theory research, vocal practice singing, andvocal teaching methods. In addition, this method canfully reflect the comprehensive ability of vocal singingtalents. The use of computer multimedia for spectrumimage analysis not only provides a method for identify-ing and analyzing voice timbre for vocal training andteaching, but also stores and transmits the measuredsound spectrum as a data file and also provides a moreconvenient management method for scientific researchand teaching record data and organization. The use ofthis method can be used for singers, vocal learners (dif-ferent degrees), or singers of different singing styles, andcan make detailed and long-term data analysis and com-parison. The analysis results have a more objective refer-ence for the identification of the vocalist’s voice, theadjustment of the singing during the singer’s learningprocess, and the selection of talents.
Fig. 6 The d sound image of small group two that Carava uses [a] vowel singing
Fig. 7 The g sound image of small group two that Bart uses [o] vowel singing
Sun EURASIP Journal on Image and Video Processing (2019) 2019:4 Page 7 of 10
4 DiscussionIn the spectrograms of Figs. 5 and 6, both sopranosingers have a high degree of spectral consistency. First,there is no sharp spike-like map of its pitch and over-tone. Through this relatively broad pitch peak, it isknown that the application of vibrato during singing isreasonable. The amplitude is between a small second,and the frequency of change is about six times per sec-ond. Corresponding to such an auditory feeling is thatthe sound thickness is symmetrical and round without athin sharpness. Both singers’ resonance peaks are around3000 Hz and the sound intensity of the formant is high,and the sound intensity of the pitch is almost the same.It can be seen from the Fig. that the resonance energy ofthe formant has a wider “base” at 3000 Hz, which pro-duces vocal transparency in the human ear but does notlose the heavy hearing experience. At the same time, itsfirst overtone and second overtone are higher in inten-sity than other overtones. We know that the first over-tone and the second overtone can be purely five degreespure octave relationship with the pitch, and the increaseof these two overtones can improve the harmony of thearpeggio tone, reduce the hollowness of the sound, andenhance the intensity of the sound to make the soundmore textured.
It can be seen from Figs. 7 and 8 that the pitch of thepitch is not in a state of sharpness, indicating that thesinging process uses a more reasonable vibrato tech-nique. At the same time, we can see the obvious second,third, and even fourth overtones after the pitch. Richand obvious overtones increase the texture and harmonyof the sound, while enhancing the brightness of thesound. Both the pitch and the overtone do not appearspiked, but appear to have a certain width “base,” indi-cating that the singing state has a more reasonable vi-brato. When the frequency is around 3200 Hz, thesinger’s formant has a strong peak, and its amplitude en-ergy value is even at the fundamental frequency. Thisshows that the singing voice has a strong penetratingpower and is not easily masked by the accompanimentof the symphony orchestra. The singer’s mid- andlow-range sounds are thick and sturdy. At the sametime, the singer’s first overtone, second overtone, andthird overtone sound energy are significantly improved,adding more harmonious components to the soundtimbre [16].As can be seen from Figs. 9 and 10, in contrast to the
bright tone of the soprano, the tone of themezzo-soprano is relatively rich and heavy, which can beclearly reflected from the spectrum image analysis.
Fig. 8 The g sound image of small group two that Carava uses [o] vowel singing
Fig. 9 The a sound image of small group that Horne uses [o] vowel singing
Sun EURASIP Journal on Image and Video Processing (2019) 2019:4 Page 8 of 10
Similar to the soprano, the pitch and overtone of themezzo-soprano are not the peak state, but the “base” hasa certain width, which proves that the application of vi-brato during singing is reasonable. The amplitude is be-tween a small second, and the frequency of change isabout six times per second. Similarly, the singer formantnear 3200 Hz is evident in the spectral envelope, and theformant intensity energy is at the same level as the pitchsound energy. In contrast to the perception of the audi-tory system, the mezzo-soprano sound is thick, and al-though it does not have a bright sound quality, it stillhas a very strong penetrating energy, which fully reducesthe acoustic masking effect of the band accompaniment.Similar to the soprano, the first overtone, the secondovertone, the third overtone, and the fourth overtone ofthe mezzo-soprano are strongly magnified. However, un-like the soprano, the mezzo-soprano vocal cord is longer,which is more conducive to the third overtone and thefourth overtone. As I mentioned before, from the per-spective of music and acoustics, the chord formed bythe pitch and the first four overtones is just a majorchord. While increasing the degree of harmony, itstrengthens the distinction between the soprano tone.
5 ConclusionInfluencing factors for studying vocal vocalization, thisstudy explores the new ideas and observation angles oftraditional singing and vocal research through the ana-lysis of sound spectrum data. Through spectrum imageanalysis, the singing voice can be digitized and quanti-fied, and the abstract sounds that are difficult to ponderare presented in front of our eyes in the form of datacharts. At the same time, through the good singing voiceof typical singers as a relative reference standard, thevocal learners’ deficiencies in a certain aspect can beclearly compared. These shortcomings can be refined toeach parameter, such as the pitch, tone, time value, andintensity of the vocal learner’s concern, and also clearlyreflect the pitch, intensity, etc., of each overtone. In
addition, it can get more clear feedback on the envelopeof the singer formant. For the spectrum image analysisof singing, its advantages are accuracy and visibility.However, it also has certain disadvantages. For singingart, over-emphasizing dataization will inevitably lead tothe loss of artistic personality. This requires that the sin-gle spectrum data should not be used as the main basisfor the evaluation mechanism, and it should be underthe premise of “people-oriented.” At the same time,spectral image analysis is required as an auxiliary refer-ence. Otherwise, it will inevitably have a bad influence.Research shows that this research method has certainpracticality and can provide theoretical reference for re-lated research.
AcknowledgementsThe authors thank the editor and anonymous reviewers for their helpfulcomments and valuable suggestions.
FundingNot applicable.
Availability of data and materialsPlease contact author for data requests.
Author’s contributionsThe author takes part in the discussion of the work described in this paper.The author read and approved the final manuscript.
Competing interestsThe authors’ declare that he have no competing interests.
Publisher’s NoteSpringer Nature remains neutral with regard to jurisdictional claims inpublished maps and institutional affiliations.
Received: 19 October 2018 Accepted: 18 December 2018
References1. Xu G, Fowlkes J B, Tao C, et al. Photoacoustic spectrum analysis for
microstructure characterization in biological tissue: analytical model[J]. Appl.Phys. Lett., 2015, 41(5):1473–1480
2. Wang X, Xu G, Carson P. Quantification of tissue texture with photoacousticspectrum analysis[J]. Proc. SPIE - Int. Soc. Optical Eng., 2014, 9129:91291L
Fig. 10 The b sound image of small group that Horne uses [i] vowel singing
Sun EURASIP Journal on Image and Video Processing (2019) 2019:4 Page 9 of 10
3. Hassani H, Heravi S, Zhigljavsky A. Forecasting UK industrial production withmultivariate singular spectrum analysis[J]. J. Forecast., 2013, 32(5):395–408
4. Guan H, Xiao B, Zhou J, et al. Fast dimension reduction for documentclassification based on imprecise spectrum analysis[J]. Inf. Sci., 2013, 222(3):147–162
5. Xu G, Meng Z X, Lin J D, et al. The functional pitch of an organ:quantification of tissue texture with photoacoustic spectrum analysis[J].Radiology, 2014, 271(1):248
6. X. Qiu, P. Zhang, J. Wei, et al., Defect classification by pulsed eddy currenttechnique in con-casting slabs based on spectrum analysis and waveletdecomposition[J]. Sensors. Actuators. Phys. 203(12), 272–281 (2013)
7. Claudio M R S. Singular spectrum analysis and forecasting of failure timeseries[J]. Reliab. Eng. Syst. Saf., 2013, 114(6):126–136
8. Zabalza J, Ren J, Wang Z, et al. Singular spectrum analysis for effectivefeature extraction in hyperspectral imaging[J]. IEEE. Geosci. Remote. Sensing.Lett., 2014, 11(11):1886–1890
9. Fu K, Qu J, Chai Y, et al. Hilbert marginal spectrum analysis for automaticseizure detection in EEG signals[J]. Biomed. Signal. Proc. Control., 2015, 18:179–185
10. Chen Y. A wave-spectrum analysis of urban population density: entropy, fractal,and spatial localization[J]. Disc. Dynamics. Nat. Soc., 2014, 2008(4):47–58
11. CHooper G. Nicholas Cook, Beyond the score: music as performance(Oxford: Oxford University Press, 2013). xiv + 458 pp. £32.99 (hb). ISBN 978-0-19-935740-6.[J]. Music. Anal., 2016, 35(3):407–416
12. Kora S, Lim B B L, Wolf J. A hands-free music score turner using Googleglass[J]. J. Comput. Inf. Syst., 2017(5):1–11
13. Fang Y, Teng G F. Visual music score detection with unsupervised featurelearning method based on K-means[J]. Int. J. Mach. Learn. Cybernet., 2015,6(2):277–287
14. Byo J L. Applying score analysis to a rehearsal pedagogy of expressiveperformance[J]. Music. Educ. J., 2014, 101(2):76–82
15. Fine P A, Wise K J, Goldemberg R, et al. Performing musicians’understanding of the terms “mental practice” and “score analysis”[J].Psychomusicology, 2015, 25:69–82
16. Louboutin C, Meredith D. Using general-purpose compression algorithmsfor music analysis[J]. J. New. Music. Res., 2016, 45(1):1–16
Sun EURASIP Journal on Image and Video Processing (2019) 2019:4 Page 10 of 10


![Untitled-1 [dms.delranschools.org]dms.delranschools.org/UserFiles/Servers/Server_3013453/File/Mamselle.pdf · encyclopedia on the Internet, calls a recording by Vocal Spectrum, Barbershop](https://img.pdfslide.us/doc/110x75/5e7a7d8aa040041c7d1211f1/untitled-1-dms-dms-encyclopedia-on-the-internet-calls-a-recording-by-vocal.jpg)