Embed Size (px)
Citation preview
Research on the Efficiency and Potential of China's Trade with South Asian Countries-Based on the Stochastic Frontier Gravity Model
Yifan Lei1*, Cuiping Li2 1Joint training of Xinjiang University of Finance and Economics and Central University of Finance and Economics ,Institute of Finance, China, e-mail: [email protected]
2Ptgraduate tutor, School of Xinjiang University of Finance and Economic, China
Abstract. In the context of COVID-19, international trade has been strongly impacted, and it is of great significance to accelerate trade exchanges with countries along the “Belt and Road” to achieve trade transformation. This paper uses the time-varying stochastic frontier gravity model to measure trade efficiency based on the data of China and South Asia from 2000 to 2019. The empirical results show that economic scale and population have a positive impact on trade. China’s GDP growth is not conducive to the growth of bilateral trade volume, and distance is no longer a factor hindering trade. Trade inefficiency has a great impact on trade. Among them, whether to sign a free trade agreement, the quality of port infrastructure, the simple average tax rate of all products, and political risks have a more significant impact on the trade coefficient. The trade potential between China and South Asian countries is very large and different countries are uneven. China has high trade efficiency with Sri Lanka, Pakistan, India, and Bangladesh, while trade with Bhutan has extremely low efficiency, and trade with Maldives and Nepal is average. Based on the above empirical results and combined with the current epidemic situation, the corresponding conclusions and countermeasures are put forward. For example, exporters should continue to innovate to promote trade transformation and diversified development; combine the western development strategy to promote trade and South Asian exchanges; reduce trade tariff barriers between the two countries; Jointly maintain the security and political situation of the two countries. Keyword: South Asia, Trade Efficiency, Potential, Stochastic Frontier Gravity Model
* Corresponding author: [email protected]
© The Authors, published by EDP Sciences. This is an open access article distributed under the terms of the Creative Commons Attribution License 4.0 (http://creativecommons.org/licenses/by/4.0/).
SHS Web of Conferences 96, 01010 (2021) https://doi.org/10.1051/shsconf/20219601010IAFSM 2020
1 Introduction and literature review
1.1 Introduction
In 2020, the new epidemic will sweep the world, and international political relations will undergo subtle changes. South Asia is an important area of the "Belt and Road" and "Maritime Silk Road", and has also established the China-Pakistan Economic Corridor and the Bangladesh-China-India Economic Corridor with China to promote the development of the two countries. During the epidemic, trade exchanges between China and South Asian countries were restricted. On November 11, 2020, in order to speed up the resumption of work and production, China and South Asia held an international trade digital exhibition. The common interests of China and South Asian countries are accelerating and the potential for economic and trade exchanges continues is deepening, enterprises are increasingly eager to strengthen mutual benefit and mutual assistance. The China Business Council will continue to work hand in hand with other countries to create a better platform for China and South Asian countries to carry out trade activities, provide quality services, and create convenience. It shows that the two sides have strong hopes to jointly strengthen the trade between the two countries, and it is of great significance to continue to deepen the friendship and trade exchanges between the two parties in the context of major emergencies. From 2005 to 2018, China's exports to South Asia increased by about 4.5 times. The trade exchanges between the two sides have become increasingly close, but the growth rate is still very low, and the two sides have great potential for development. The "India and South Asia Limited Trade Links" report confirms that South Asia accounts for 5% of the national trade, and the level of integration of South Asian countries is significantly lower than the level of global economic integration. The reasons include trade protectionism, high logistics and transportation costs, lack of political will, and widespread trust deficits. In order to enhance the trade potential of bilateral countries, this article conducts empirical analysis and exploration and gives corresponding opinions and policies.
1.2 Literature review
Regarding the study of trade potential, most scholars use SFGM to measure trade efficiency and then analyze trade potential. Research on foreign scholars: Amirul Islam, Ruhul Salim and Harry Bloch (2016) [1] studied the impact of free trade agreement signing on South Asia’s efficiency and productivity growth. The results show that South Asia still has the problem of declining production efficiency and pointed out that backward countries may increase productivity by moving resources across borders. Rakesh Kumar (2018) [2] estimated the current situation of South Asian trade integration under the self-returning multilateral framework, and the results showed that Pakistan and Sri Lanka have long-term trade complementarity, and India and Bangladesh, India and Sri Lanka have short-term trade complementarity. Nazia Gul and Hafiz M. Yasin (2011) [3] used a trade gravity model to estimate Pakistan’s trade potential. The results showed that Pakistan has the largest trade potential with countries in the Asia-Pacific region, the Middle East, Latin America and North America, and its trade volume with South Asia is very low. The main reason is political tensions in neighboring countries. Naseem Akhter and Ejaz Ghani (2010) [4] used the gravity model to assess the trade potential between the member states and non-member states of the South Asia Free Trade Agreement. The results showed that the trade volume will increase only when the major partners sign trade agreements. Research by domestic scholars: Yingying Zong (2018) [5] studied the complementarity of agricultural product trade and export similarity between China and South Asian countries and proposed corresponding countermeasures. Zhixiong Liu and Honghui Chen (2020) [6] found from static and dynamic
2
SHS Web of Conferences 96, 01010 (2021) https://doi.org/10.1051/shsconf/20219601010IAFSM 2020
1 Introduction and literature review
1.1 Introduction
In 2020, the new epidemic will sweep the world, and international political relations will undergo subtle changes. South Asia is an important area of the "Belt and Road" and "Maritime Silk Road", and has also established the China-Pakistan Economic Corridor and the Bangladesh-China-India Economic Corridor with China to promote the development of the two countries. During the epidemic, trade exchanges between China and South Asian countries were restricted. On November 11, 2020, in order to speed up the resumption of work and production, China and South Asia held an international trade digital exhibition. The common interests of China and South Asian countries are accelerating and the potential for economic and trade exchanges continues is deepening, enterprises are increasingly eager to strengthen mutual benefit and mutual assistance. The China Business Council will continue to work hand in hand with other countries to create a better platform for China and South Asian countries to carry out trade activities, provide quality services, and create convenience. It shows that the two sides have strong hopes to jointly strengthen the trade between the two countries, and it is of great significance to continue to deepen the friendship and trade exchanges between the two parties in the context of major emergencies. From 2005 to 2018, China's exports to South Asia increased by about 4.5 times. The trade exchanges between the two sides have become increasingly close, but the growth rate is still very low, and the two sides have great potential for development. The "India and South Asia Limited Trade Links" report confirms that South Asia accounts for 5% of the national trade, and the level of integration of South Asian countries is significantly lower than the level of global economic integration. The reasons include trade protectionism, high logistics and transportation costs, lack of political will, and widespread trust deficits. In order to enhance the trade potential of bilateral countries, this article conducts empirical analysis and exploration and gives corresponding opinions and policies.
1.2 Literature review
Regarding the study of trade potential, most scholars use SFGM to measure trade efficiency and then analyze trade potential. Research on foreign scholars: Amirul Islam, Ruhul Salim and Harry Bloch (2016) [1] studied the impact of free trade agreement signing on South Asia’s efficiency and productivity growth. The results show that South Asia still has the problem of declining production efficiency and pointed out that backward countries may increase productivity by moving resources across borders. Rakesh Kumar (2018) [2] estimated the current situation of South Asian trade integration under the self-returning multilateral framework, and the results showed that Pakistan and Sri Lanka have long-term trade complementarity, and India and Bangladesh, India and Sri Lanka have short-term trade complementarity. Nazia Gul and Hafiz M. Yasin (2011) [3] used a trade gravity model to estimate Pakistan’s trade potential. The results showed that Pakistan has the largest trade potential with countries in the Asia-Pacific region, the Middle East, Latin America and North America, and its trade volume with South Asia is very low. The main reason is political tensions in neighboring countries. Naseem Akhter and Ejaz Ghani (2010) [4] used the gravity model to assess the trade potential between the member states and non-member states of the South Asia Free Trade Agreement. The results showed that the trade volume will increase only when the major partners sign trade agreements. Research by domestic scholars: Yingying Zong (2018) [5] studied the complementarity of agricultural product trade and export similarity between China and South Asian countries and proposed corresponding countermeasures. Zhixiong Liu and Honghui Chen (2020) [6] found from static and dynamic
empirical research that China's trade with South Asia is mainly inter-industry trade and there are no large country differences. Yunjie Cheng and Chenghui Dong (2020) [7] used a heterogeneous stochastic frontier gravity model to measure the efficiency of bilateral trade. Jin Liu (2020) [8] explored the scale and structure of trade between China and South Asia. Ling Wang and Shan Chen (2019) [9] studied the trade efficiency of the Bangladesh-China-India Economic Corridor and found that trade efficiency has been declining over time. They proposed to speed up free trade zone negotiations and reduce trade barriers. Zhigang Gao and Feng Tian (2019) [10] Study the trade efficiency of the China-Pakistan Economic Corridor. Liang Li and Shucai Ma (2020) [11] research on trade competition and complementarity between China and South Asia shows that their country has advantages in industrial products and South Asia has advantages in low-end products. The two countries have a strong complementary relationship.
2 Model settings, variable descriptions and data sources
2.1 Theoretical model
2.1.1Trade gravity model (GM)
The gravity model originated from Newton's universal gravitation. Tinbergen (1962) and Poyhonen (1963) first used GM to measure trade efficiency, and its basic form is as follows:
(1)
Tij represents the volume of trade between the two countries, A is a constant, GDPi and
GDPj represent the gross domestic product of the traded countries respectively, and the volume of trade is positively correlated with GDP, Dij represents the distance between the two countries, and the volume of trade has a negative correlation with the distance .
In the empirical analysis of the model, in order to explain the meaning of the coefficients, the logarithm of the data is usually taken. The basic form of the model is as follows:
(2)
δ is the other influencing variables, ε is the iid random disturbance term, α0 is the constant
term, and α1, α2, α3, and α4 are the corresponding variable coefficients. Lineman (1966) added demographic variables to the trade gravity model. In subsequent
research, each scholar introduced the required variables according to his own research direction to analyze the impact and measure trade efficiency.
2.1.2 Stochastic frontier gravity model (SFGM)
SFGM is a method of introducing stochastic frontiers in trade GM, which was first proposed by Meeusen and Broeck (1977). SFGM splits the random disturbance term (ε) into a random error term (vij) and a human-factor inefficiency term (uij). The trade potential obtained by the SFGM is more in line with the actual situation and the result is more effective. It is expressed as follows:
(3)
ij
( )= i j
ij
A GDPGDPT
D
ij 0 1 i 2 3 i 4 ij ij= + + + +j jLNT LNGDP LNGDP LND +
ijt = ( , ) exp( )
= ( , ) exp( ), 0ijt ijt
ijt ijt ijt ijt
T f xf x v u u
3
SHS Web of Conferences 96, 01010 (2021) https://doi.org/10.1051/shsconf/20219601010IAFSM 2020
Take the logarithm of both sides together to get the following form:
(4) Tijt represents the trade volume of country i to country j in period t, xijt is a relevant
variable affecting trade, β is a parameter to be estimated, vijt is a random error term, and uijt is an inefficiency term.
Calculate the trade potential, that is, when there is no human factor, the formula is as follows:
(5) Trade efficiency is the ratio of real trade volume to trade potential. The formula is:
(6)
With the growth of Tijt, the efficiency of trade also increases.
2.1.3 Trade inefficiency model (BC95)
For a long time, the estimation of the stochastic frontier is divided into two processes, that is, first use SFGM to obtain the inefficiency value, and use the inefficiency as the dependent variable for regression. However, the two stages have inconsistent assumptions about inefficiency, so it is impossible to obtain the same effective results as the first stage. In the first stage, it is estimated that the SFGM will return to trade inefficiency at the same time, adding the analysis of allocation efficiency. Kumbhakar, Ghosh and McGukin (1991) believe that the inefficiency term can represent a deterministic function of specific variables and random errors. Battese and Coelli (1995) proposed SFGM (BC95) for solving technical efficiency. The basic form is as follows:
(7)
η is the parameter to be estimated considering the time-varying nature, and uijt obeys the truncated normal distribution. When η>0, η<0, η=0, the inefficiency terms decrease, increase, and remain the same with time.
(8)
α is a parameter to be estimated, zijt represents an exogenous variable that trade inefficiency in period t, and εijt is a random disturbance term.
Substituting into equation (4), the time-varying SFGM for measuring technical efficiency can be obtained:
(9)
2.2 Model setting and variable description
Armstrong (2007) proposed that SFGM only includes core explanatory variables, such as economic scale, distance between the two countries, borders, language and other natural factors that are difficult to change in the near term; human factors such as FTA, tax rates, and freedom indicators are included in the model's trade inefficiency items. At the same time, considering that the current political situation is complex and changeable, this article adds political risk indicators as the factors affecting trade inefficiency.
ijt ( , ) , 0ijt ijt ijt ijtLNT LNf x v u u= + −
*ijt = ( , ) exp( )ijt ijtT f x v
*ijt ijt ijt ijt=T / = exp( ) 0 0 1ijt ijtT u u− TE ,TE ( ,)
{exp[ ( )]}u t T uijt ij= − −
=ijt ijt ijtu z +
( , )ijt ijt ijt ijtLNf x v z + − +( )
4
SHS Web of Conferences 96, 01010 (2021) https://doi.org/10.1051/shsconf/20219601010IAFSM 2020
Take the logarithm of both sides together to get the following form:
(4) Tijt represents the trade volume of country i to country j in period t, xijt is a relevant
variable affecting trade, β is a parameter to be estimated, vijt is a random error term, and uijt is an inefficiency term.
Calculate the trade potential, that is, when there is no human factor, the formula is as follows:
(5) Trade efficiency is the ratio of real trade volume to trade potential. The formula is:
(6)
With the growth of Tijt, the efficiency of trade also increases.
2.1.3 Trade inefficiency model (BC95)
For a long time, the estimation of the stochastic frontier is divided into two processes, that is, first use SFGM to obtain the inefficiency value, and use the inefficiency as the dependent variable for regression. However, the two stages have inconsistent assumptions about inefficiency, so it is impossible to obtain the same effective results as the first stage. In the first stage, it is estimated that the SFGM will return to trade inefficiency at the same time, adding the analysis of allocation efficiency. Kumbhakar, Ghosh and McGukin (1991) believe that the inefficiency term can represent a deterministic function of specific variables and random errors. Battese and Coelli (1995) proposed SFGM (BC95) for solving technical efficiency. The basic form is as follows:
(7)
η is the parameter to be estimated considering the time-varying nature, and uijt obeys the truncated normal distribution. When η>0, η<0, η=0, the inefficiency terms decrease, increase, and remain the same with time.
(8)
α is a parameter to be estimated, zijt represents an exogenous variable that trade inefficiency in period t, and εijt is a random disturbance term.
Substituting into equation (4), the time-varying SFGM for measuring technical efficiency can be obtained:
(9)
2.2 Model setting and variable description
Armstrong (2007) proposed that SFGM only includes core explanatory variables, such as economic scale, distance between the two countries, borders, language and other natural factors that are difficult to change in the near term; human factors such as FTA, tax rates, and freedom indicators are included in the model's trade inefficiency items. At the same time, considering that the current political situation is complex and changeable, this article adds political risk indicators as the factors affecting trade inefficiency.
ijt ( , ) , 0ijt ijt ijt ijtLNT LNf x v u u= + −
*ijt = ( , ) exp( )ijt ijtT f x v
*ijt ijt ijt ijt=T / = exp( ) 0 0 1ijt ijtT u u− TE ,TE ( ,)
{exp[ ( )]}u t T uijt ij= − −
=ijt ijt ijtu z +
( , )ijt ijt ijt ijtLNf x v z + − +( )
2.2.1 Time-varying stochastic frontier gravity model setting According to the above analysis, the random frontier gravity model set in this article is introduced:
0 1 2 3 4 5 6
-ijt it jt it jt ij ij
ijt ijt
LnPGDP LnPGDP LnPOP LnPOP LnDIS BORv u
= + + + + + +
+
lnE (10)
β0 is a constant term, β1, β2, β3, β4, β5, and β6 are parameters to be estimated, and the remaining variables are as follows:
Eijt represents China's trade exports to South Asian countries in period t, and the data comes from UN Comtrade.
PGDPit and PGDPjt respectively represent China's per capita gdp in period t and South Asian countries' per capita gdp in period t,The higher the economic scale, the greater the flow between trade. The data comes from the World Bank.
POPit and POPjt respectively represent the total population of China in period t and the total population of South Asian countries in period t. The larger the population of China, the higher the market consumer demand and the greater the export supply. The greater the population of South Asian countries, the higher the poverty level, and the reduction in trade import demand. The data comes from the World Bank.
DISit indicates the distance between China and the capitals of South Asian countries. The farther the distance, the higher the transportation cost required, which is negatively correlated with the export trade volume. The data comes from CEPII.
BORij is a dummy variable, which represents whether China and South Asian countries have the same borders. One is taken as 1 and no one is taken as 0. The neighboring two countries are positively related to export trade due to factors such as culture and distance. The data comes from CEPII.
2.2.2 Trade inefficiency model setting
This paper selects inefficiency variables based on the research of different scholars on trade inefficiency and the reality of China and South Asian countries. The model is expressed as follows:
0 1 2 3 4 5 6 7ijt ijt jt jt jt jt jt jt ijtu FTA AHS GI TF FF WEF PR = + + + + + + + + (11)
α0 is a constant term, α1, α2, α3, α4, α5, and α6 are parameters to be estimated, and the remaining variables are as follows:
FTAijt is a dummy variable, which represents whether China and South Asian countries have signed a free trade agreement in year t. It is 1 and 0 is not. The signing of a free trade agreement will increase the trade between the two countries and therefore has a negative effect on inefficiency. The data comes from China FTA Network.
AHSjt is the simple average tax rate of all products in South Asia in period t. The higher the tax rate, the less trade between the two countries, which is positively correlated with inefficiency. The data comes from the World Bank.
GIjt is the government credibility of a South Asian country in period t. The higher the credibility, the better the credibility of the country and the increase in trade exchanges between countries, which is negatively related to inefficiency. Data from the Heritage Foundation.
TFjt represents the degree of trade freedom of South Asian countries in the t period. The higher the indicator, the less the South Asian countries are bound by tariffs and non-tariff barriers, which is negatively related to trade inefficiency. Data comes from Heritage Foundation.
FFjt represents the financial freedom of South Asian countries in period t. The higher the index, the larger the scale of the country’s financial market opening, the low degree of
5
SHS Web of Conferences 96, 01010 (2021) https://doi.org/10.1051/shsconf/20219601010IAFSM 2020
government control over financial services, and the improvement of financial service companies’ operating capabilities, which are negatively related to trade inefficiencies. Data source Heritage Foundation
WEFjt represents the quality of port infrastructure in South Asian countries during the t period (1=very underdeveloped, 7=highly developed and efficient in accordance with international standards). The higher the quality of port infrastructure, the higher the efficiency of trade. It is negatively correlated with non-efficiency items. Data source World Bank.
PRjt represents the political risk index of South Asian ICRG countries in period t. The higher the risk index of a country, the lower the degree of political risk in the country, which is positively correlated with trade inefficiency. Data source PRS.
3 Empirical analysis This article uses data from China and 7 South Asian countries (India, Pakistan, Sri Lanka, Nepal, Bhutan, Bangladesh, and Maldives) from 2000 to 2019 as a sample to study the potential of bilateral trade. The software used in this article is Frontier4.1, which is passed The LR test separately examines the rationality and applicability of the time-varying SFGM and trade inefficiency models, and makes corresponding trade potential analysis.
3.1 Model verification
To test the applicability of the model, run the LR value based on constrained and unconstrained conditions, and compare with the mixed chi-square critical value to check whether there is a trade inefficiency term and whether it is a time-varying model. The results are as shown in table 1.
Table 1. Applicability test results of the random frontier gravity model.
Null Hypothesis
Constraint Model
Unconstrained Model LR Degree of
Freedom 10%
Threshold Test Result
There is no inefficiency -114.70 -111.80 5.79 3 5.528 Refuse
Inefficiency does not change with time
-114.70 -112.17 5.05 2 3.808 Refuse
It can be seen from the table that the two hypotheses LR are both greater than the 10% critical value. The null hypothesis is rejected, indicating that there is a trade inefficiency term and it is a time-varying SFGM.
3.2 Analysis of SFGM regression results
This article directly makes a regression analysis on the time-varying SFGM. According to the results of Frontier regression analysis, it is shown in Table 2
6
SHS Web of Conferences 96, 01010 (2021) https://doi.org/10.1051/shsconf/20219601010IAFSM 2020
government control over financial services, and the improvement of financial service companies’ operating capabilities, which are negatively related to trade inefficiencies. Data source Heritage Foundation
WEFjt represents the quality of port infrastructure in South Asian countries during the t period (1=very underdeveloped, 7=highly developed and efficient in accordance with international standards). The higher the quality of port infrastructure, the higher the efficiency of trade. It is negatively correlated with non-efficiency items. Data source World Bank.
PRjt represents the political risk index of South Asian ICRG countries in period t. The higher the risk index of a country, the lower the degree of political risk in the country, which is positively correlated with trade inefficiency. Data source PRS.
3 Empirical analysis This article uses data from China and 7 South Asian countries (India, Pakistan, Sri Lanka, Nepal, Bhutan, Bangladesh, and Maldives) from 2000 to 2019 as a sample to study the potential of bilateral trade. The software used in this article is Frontier4.1, which is passed The LR test separately examines the rationality and applicability of the time-varying SFGM and trade inefficiency models, and makes corresponding trade potential analysis.
3.1 Model verification
To test the applicability of the model, run the LR value based on constrained and unconstrained conditions, and compare with the mixed chi-square critical value to check whether there is a trade inefficiency term and whether it is a time-varying model. The results are as shown in table 1.
Table 1. Applicability test results of the random frontier gravity model.
Null Hypothesis
Constraint Model
Unconstrained Model LR Degree of
Freedom 10%
Threshold Test Result
There is no inefficiency -114.70 -111.80 5.79 3 5.528 Refuse
Inefficiency does not change with time
-114.70 -112.17 5.05 2 3.808 Refuse
It can be seen from the table that the two hypotheses LR are both greater than the 10% critical value. The null hypothesis is rejected, indicating that there is a trade inefficiency term and it is a time-varying SFGM.
3.2 Analysis of SFGM regression results
This article directly makes a regression analysis on the time-varying SFGM. According to the results of Frontier regression analysis, it is shown in Table 2
Table 2. Measurement results of Stochastic Frontier Gravity Model.
Time-varying model Variable Coefficient Standard-Error T-ratio Constant -346.7466*** 1.6326 -213.0069 LNGDPit 0.7972*** 0.0765 10.4214 LNGDPjt -0.4390*** 0.1178 -3.7286 LNPOPit 15.4658*** 0.1070 114.4913 LNPOPjt 0.9567*** 0.0226 42.2419 LNDISij 2.9612*** 0.2595 11.4123 BORij -0.7218*** 0.08486 -8.5052 σ2 0.1551 13.2631 1.1694 γ 0.9953*** 0.0049 204.9877
Log likelihood function -99.0975 LR Test 31.1965
Note: ***, **, * represent significant at the level of 1%, 5%, and 10% respectively.
From the regression results, the SFGM coefficients all pass the 1% significance level. γ represents the proportion of trade inefficiency in the random disturbance item. γ is significant at the 1% level. The value of γ is 0.9953, which represents 99.53% of the trade resistance caused by trade inefficiency. Very close to 1 shows that human factors have an important influence on trade, and also shows the applicability of the time-varying SFGM, The following will compare the regression results with expectations:
(1) Economic scale. From the results, the GDP of both countries passed the 1% significance test. The GDP growth of South Asian countries has increased China’s export trade to South Asian countries and promoted the development of bilateral trade. The correlation coefficient is 0.7972, indicating that the GDP growth of South Asian countries has a significant impact on the trade between the two countries, which is consistent with the expected result, while China's GDP growth actually reduces the trade between the two countries, inconsistent with the expected results. The reason may be that with the adjustment of the industrial structure in recent years, China’s exports have shifted from agricultural products, chemical products, and textiles to high-end electronic products. Most South Asian countries have weak economic foundations, and they mainly import industrial products and capital-intensive products from China. Therefore, China's economic growth has invested more in high-end electronic products and slowly reduced its investment in light industry, which has led to a gradual decrease in China's exports to South Asia and a decrease in trade complementarity. [12]
(2) In terms of population, demographic factors have a significant positive impact on bilateral trade. The LNPOPit coefficient of 15.4658 indicates that for every 1% increase in the population of South Asian countries, China’s exports to South Asian countries will increase by 15.4658%, and the population growth of South Asian countries will also accelerate trade exchanges, which is contrary to expectations, the reason may be that the population of trading countries drives the increase of market demand and labor force, which leads to an increase in trade volume. The LNPOPjt coefficient of 0.9567 means that for every 1% increase in China’s population, China’s exports to South Asia increase by 0.9567%. The total population coefficient of importing countries is much greater than that of exporting countries, indicating that population changes in importing countries have a more prominent impact on trade.
(3) In terms of distance, it has a significant effect on trade and is not in line with expectations. Previous scholars’ research distance generally hinders trade, but the result of this paper is positive. The reason may be that with the development of the economy, the
7
SHS Web of Conferences 96, 01010 (2021) https://doi.org/10.1051/shsconf/20219601010IAFSM 2020
infrastructure of various countries is constantly improving, the effect of distance gradually weakens. It also shows the gradual improvement of transportation facilities in China and South Asian countries to promote trade efficiency.
(4) Boundary factors, and trade have a significant effect at the 1% level. The correlation coefficient is negative. The reason may be that the poor geographical environment between China and South Asian countries hinders imports from trading parties. It is also possible that with the improvement of transportation levels, sea and air transportation will become more convenient, making the existence of common borders less impact on trade , Countries have also tended to develop globally, and cultural and religious factors have gradually weakened.
3.3 Analysis of regression results of trade inefficiency model
This paper adopts a one-step method to perform regression analysis on trade inefficiency items. According to the frontier4.1 regression results, the results are shown in Table3:
Table 3. Estimated results of trade inefficiency model.
From the above table, the value of γ is as high as 0.9871, which is very close to 1, which
further shows the suitability of choosing a time-varying SFGM. In the trade inefficiency model, the coefficient is positive, indicating that this factor is a promotion factor of the inefficiency model. It is the reason for hindering trade, and the coefficient is negative, indicating that this factor is the hindering factor of the inefficiency model and the reason for promoting trade.
(1) Free Trade Agreement (FTAijt) is negatively correlated with inefficiency and is significant, which can reduce the hindrance of trade inefficiency factors and improve trade efficiency. Among the inefficiencies, the coefficient of the free trade agreement is the largest, indicating that the signing of the free trade agreement is an important factor in promoting bilateral trade. The signing of a free trade agreement between the two countries can lower tariff barriers and promote China's exports to South Asia. Increase the volume of bilateral trade. Therefore, countries should encourage the signing of free trade agreements. In addition
SFGM Trade inefficiency model
Variable Coefficient Standard-
Error T-Ratio Variable Coefficient
Standard-
Error T-Ratio
Constant -86.2828* 49.7318 -1.7350 Constant -1.4778 1.4605 1.0118
LNGDPit 0.5981*** 0.0663 9.0223 FTAijt -2.5898*** 0.9788 -2.6459
LNGDPjt 0.3159*** 0.0752 4.2019 AHSjt 0.1174*** 0.0334 3.5156
LNPOPit 4.1463* 2.3551 1.7605 GIjt 0.0587*** 0.0100 5.8975
LNPOPjt 0.7775*** 0.0116 66.8541 TFjt -0.0359** 0.0175 -2.0545
LNDISij 0.0192 0.2235 -0.0859 FFjt 0.0648* 0.0356 1.8216
BORij -0.1587*** 0.0422 -3.7563 WEFjt -2.2187*** 0.2962 -7.4904 PRjt 0.1684* 0.0978 1.7208
σ2 0.6818*** 0.0967 7.0496
γ 0.9898*** 0.0028 351.9917
Log
likelihood
function
-34.3862
LR Test 160.6190
8
SHS Web of Conferences 96, 01010 (2021) https://doi.org/10.1051/shsconf/20219601010IAFSM 2020
infrastructure of various countries is constantly improving, the effect of distance gradually weakens. It also shows the gradual improvement of transportation facilities in China and South Asian countries to promote trade efficiency.
(4) Boundary factors, and trade have a significant effect at the 1% level. The correlation coefficient is negative. The reason may be that the poor geographical environment between China and South Asian countries hinders imports from trading parties. It is also possible that with the improvement of transportation levels, sea and air transportation will become more convenient, making the existence of common borders less impact on trade , Countries have also tended to develop globally, and cultural and religious factors have gradually weakened.
3.3 Analysis of regression results of trade inefficiency model
This paper adopts a one-step method to perform regression analysis on trade inefficiency items. According to the frontier4.1 regression results, the results are shown in Table3:
Table 3. Estimated results of trade inefficiency model.
From the above table, the value of γ is as high as 0.9871, which is very close to 1, which
further shows the suitability of choosing a time-varying SFGM. In the trade inefficiency model, the coefficient is positive, indicating that this factor is a promotion factor of the inefficiency model. It is the reason for hindering trade, and the coefficient is negative, indicating that this factor is the hindering factor of the inefficiency model and the reason for promoting trade.
(1) Free Trade Agreement (FTAijt) is negatively correlated with inefficiency and is significant, which can reduce the hindrance of trade inefficiency factors and improve trade efficiency. Among the inefficiencies, the coefficient of the free trade agreement is the largest, indicating that the signing of the free trade agreement is an important factor in promoting bilateral trade. The signing of a free trade agreement between the two countries can lower tariff barriers and promote China's exports to South Asia. Increase the volume of bilateral trade. Therefore, countries should encourage the signing of free trade agreements. In addition
SFGM Trade inefficiency model
Variable Coefficient Standard-
Error T-Ratio Variable Coefficient
Standard-
Error T-Ratio
Constant -86.2828* 49.7318 -1.7350 Constant -1.4778 1.4605 1.0118
LNGDPit 0.5981*** 0.0663 9.0223 FTAijt -2.5898*** 0.9788 -2.6459
LNGDPjt 0.3159*** 0.0752 4.2019 AHSjt 0.1174*** 0.0334 3.5156
LNPOPit 4.1463* 2.3551 1.7605 GIjt 0.0587*** 0.0100 5.8975
LNPOPjt 0.7775*** 0.0116 66.8541 TFjt -0.0359** 0.0175 -2.0545
LNDISij 0.0192 0.2235 -0.0859 FFjt 0.0648* 0.0356 1.8216
BORij -0.1587*** 0.0422 -3.7563 WEFjt -2.2187*** 0.2962 -7.4904 PRjt 0.1684* 0.0978 1.7208
σ2 0.6818*** 0.0967 7.0496
γ 0.9898*** 0.0028 351.9917
Log
likelihood
function
-34.3862
LR Test 160.6190
to India, all South Asian countries have signed free trade agreements with China, which can significantly promote their trade. India should also reduce territorial disputes with China and establish free trade agreements with China to increase the freedom of trade between two sides.
(2) Simple average tax rate (AHSjt) for all products. The tax rate is positively correlated with trade inefficiency and is significant. A 1% reduction in the tax rate will increase bilateral trade by 0.1365%. The lower the tax rate, the lower the amount of tax to be paid, and the higher the trade flow between the two countries.
(3) Government integrity: The coefficient of government integrity (GIjt) is positive, which is positively correlated with trade inefficiency, and is significant at the 1% level, which is contrary to expectations. The government has a high degree of credibility, which reduces trade efficiency. The coefficient is very small and only 0.0679, indicating that the degree of influence is small. The possible reason is that the government's credibility is not necessarily measured in trade, and the main factor influencing the trade between the two countries is not government credibility.
(4) Freedom indicators: trade freedom (TFjt), financial freedom (FFjt), TF and the explained variable are positively correlated and significant, indicating that the open free trade market enhances the trade between the two countries, the trade freedom is high, and the country is open to trade Various restrictions on exchanges and increased activity in market trade have a certain stimulus effect on trade. FF and inefficiency are positively correlated, indicating that open financial markets have a certain level of hindrance to the trade between the two countries, and the variables have a significant relationship. The possible reason is that South Asia and China are both developing countries, compared to the financial system of developed countries. It is not perfect yet. The government's laissez-faire financial market may cause chaos in market financial transactions, and developing countries cannot afford the losses caused by the laissez-faire financial market. The index coefficient of the degree of freedom is the smallest among all inefficiencies, indicating that the main factor affecting inefficiency is not the degree of freedom index. The effect of the degree of freedom index is not obvious when the development situation of various countries is unbalanced. The possible reason is relative to the trade and financial level system of developed countries. South Asia and China are not very complete and their forces are relatively small.
(5) Port infrastructure quality (WEFjt), the coefficient is negative and the 1% significance test is passed. The possible reason for this phenomenon is that the South Asian countries are relatively backward and the port infrastructure is not perfect, so the two countries should strengthen infrastructure construction to promote trade development. China should give full play to the role of the Belt and Road and economic corridors to help South Asian countries build infrastructure to promote the long-term development of bilateral trade.
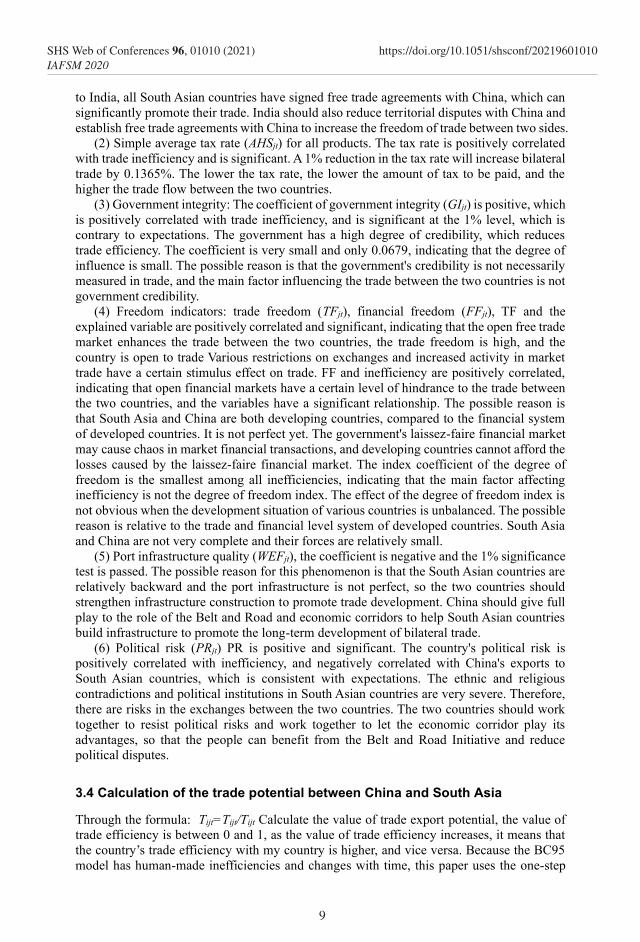
(6) Political risk (PRjt) PR is positive and significant. The country's political risk is positively correlated with inefficiency, and negatively correlated with China's exports to South Asian countries, which is consistent with expectations. The ethnic and religious contradictions and political institutions in South Asian countries are very severe. Therefore, there are risks in the exchanges between the two countries. The two countries should work together to resist political risks and work together to let the economic corridor play its advantages, so that the people can benefit from the Belt and Road Initiative and reduce political disputes.
3.4 Calculation of the trade potential between China and South Asia
Through the formula: Tijt=Tijt/Tijt Calculate the value of trade export potential, the value of trade efficiency is between 0 and 1, as the value of trade efficiency increases, it means that the country’s trade efficiency with my country is higher, and vice versa. Because the BC95 model has human-made inefficiencies and changes with time, this paper uses the one-step
9
SHS Web of Conferences 96, 01010 (2021) https://doi.org/10.1051/shsconf/20219601010IAFSM 2020
method to measure trade efficiency.
3.4.1 Analysis of trade efficiency
The trade efficiency value is sorted according to the frontier regression results to get the annual trade efficiency of South Asian countries, and draw a line chart to see its trend. It can be seen from the data and graphs that, generally speaking, the trade efficiency between China and South Asian countries shows a fluctuating upward trend and then declines, but the trend is not very obvious, which also shows that China and South Asian countries have great potential for trade development. 2000-2008 is generally on the rise. In 2008, the financial crisis encountered a decline in trade efficiency and continued to rise. In 2014, China initiated the Belt and Road Initiative and signed free trade agreements with various countries to help South Asian countries promote infrastructure and reduce bilateral tariff rates. The open trade market has greatly facilitated trade flows. In recent years, trade efficiency has shown a downward trend. There have been some political disputes in various countries, the normal implementation of economic corridors, and the interference of other countries have reduced trade efficiency. In terms of specific countries, each country has different levels. Pakistan and Sri Lanka have maintained good trade relations with China, indicating that the two countries have maintained close trade relations. The China-Pakistan Economic Corridor has also played a significant role. The trade between the Maldives and China has shown an obvious upward trend year by year. In 2017, the Maldives signed a free trade agreement with China, and the trade volume has increased significantly. The efficiency of Sino-Indian trade continues to rise, but in recent years, political border conflicts between China and India and internal risk issues within the country, as well as India's control of South Asian countries to prevent other South Asian countries from cooperating with China, have reduced the cooperation between the two countries. The trade relationship between Nepal and China shows a fluctuating trend. Due to the natural geographical environment and China separated by the Himalayas, hindering the trade and transportation between the two countries and India's suppression of Nepal, the trade relationship between China and Nepal is not very close. In the context of the Belt and Road Initiative from 2010 to 2014, China-Nepal trade efficiency achieved leapfrog development, and then declined. The development of Bhutan and China has been slow. For two decades, there has been no obvious trend of trade development. The two countries have not established diplomatic relations. On the one hand, Bhutan has always adopted a closed attitude and its economic development is backward. What’s more, Bhutan's trade has long been dependent on India, and India has also restricted Bhutan. With economic development, Bhutan also hopes to get rid of its dependence on India, but now Bhutan is still adopting a wait-and-see strategy for the One Belt One Road strategy. China's exports to Bhutan are mostly agricultural products and low-end products, and Bhutan's imports are also low-end products. Therefore, the structure of commodity trade between the two countries has not changed. With the passage of time and the development of bilateral relations, the two countries are expected to establish a friendly relationship of mutual assistance and mutual assistance under the “Belt and Road” initiative.
10
SHS Web of Conferences 96, 01010 (2021) https://doi.org/10.1051/shsconf/20219601010IAFSM 2020
method to measure trade efficiency.
3.4.1 Analysis of trade efficiency
The trade efficiency value is sorted according to the frontier regression results to get the annual trade efficiency of South Asian countries, and draw a line chart to see its trend. It can be seen from the data and graphs that, generally speaking, the trade efficiency between China and South Asian countries shows a fluctuating upward trend and then declines, but the trend is not very obvious, which also shows that China and South Asian countries have great potential for trade development. 2000-2008 is generally on the rise. In 2008, the financial crisis encountered a decline in trade efficiency and continued to rise. In 2014, China initiated the Belt and Road Initiative and signed free trade agreements with various countries to help South Asian countries promote infrastructure and reduce bilateral tariff rates. The open trade market has greatly facilitated trade flows. In recent years, trade efficiency has shown a downward trend. There have been some political disputes in various countries, the normal implementation of economic corridors, and the interference of other countries have reduced trade efficiency. In terms of specific countries, each country has different levels. Pakistan and Sri Lanka have maintained good trade relations with China, indicating that the two countries have maintained close trade relations. The China-Pakistan Economic Corridor has also played a significant role. The trade between the Maldives and China has shown an obvious upward trend year by year. In 2017, the Maldives signed a free trade agreement with China, and the trade volume has increased significantly. The efficiency of Sino-Indian trade continues to rise, but in recent years, political border conflicts between China and India and internal risk issues within the country, as well as India's control of South Asian countries to prevent other South Asian countries from cooperating with China, have reduced the cooperation between the two countries. The trade relationship between Nepal and China shows a fluctuating trend. Due to the natural geographical environment and China separated by the Himalayas, hindering the trade and transportation between the two countries and India's suppression of Nepal, the trade relationship between China and Nepal is not very close. In the context of the Belt and Road Initiative from 2010 to 2014, China-Nepal trade efficiency achieved leapfrog development, and then declined. The development of Bhutan and China has been slow. For two decades, there has been no obvious trend of trade development. The two countries have not established diplomatic relations. On the one hand, Bhutan has always adopted a closed attitude and its economic development is backward. What’s more, Bhutan's trade has long been dependent on India, and India has also restricted Bhutan. With economic development, Bhutan also hopes to get rid of its dependence on India, but now Bhutan is still adopting a wait-and-see strategy for the One Belt One Road strategy. China's exports to Bhutan are mostly agricultural products and low-end products, and Bhutan's imports are also low-end products. Therefore, the structure of commodity trade between the two countries has not changed. With the passage of time and the development of bilateral relations, the two countries are expected to establish a friendly relationship of mutual assistance and mutual assistance under the “Belt and Road” initiative.
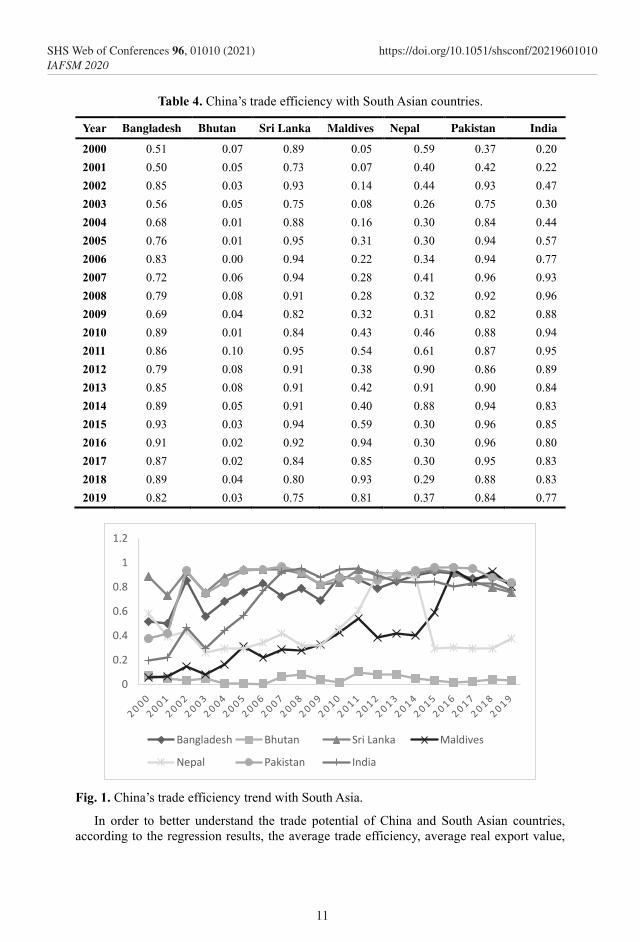
Table 4. China’s trade efficiency with South Asian countries.
Year Bangladesh Bhutan Sri Lanka Maldives Nepal Pakistan India
2000 0.51 0.07 0.89 0.05 0.59 0.37 0.20
2001 0.50 0.05 0.73 0.07 0.40 0.42 0.22
2002 0.85 0.03 0.93 0.14 0.44 0.93 0.47
2003 0.56 0.05 0.75 0.08 0.26 0.75 0.30
2004 0.68 0.01 0.88 0.16 0.30 0.84 0.44
2005 0.76 0.01 0.95 0.31 0.30 0.94 0.57
2006 0.83 0.00 0.94 0.22 0.34 0.94 0.77
2007 0.72 0.06 0.94 0.28 0.41 0.96 0.93
2008 0.79 0.08 0.91 0.28 0.32 0.92 0.96
2009 0.69 0.04 0.82 0.32 0.31 0.82 0.88
2010 0.89 0.01 0.84 0.43 0.46 0.88 0.94
2011 0.86 0.10 0.95 0.54 0.61 0.87 0.95
2012 0.79 0.08 0.91 0.38 0.90 0.86 0.89
2013 0.85 0.08 0.91 0.42 0.91 0.90 0.84
2014 0.89 0.05 0.91 0.40 0.88 0.94 0.83
2015 0.93 0.03 0.94 0.59 0.30 0.96 0.85
2016 0.91 0.02 0.92 0.94 0.30 0.96 0.80
2017 0.87 0.02 0.84 0.85 0.30 0.95 0.83
2018 0.89 0.04 0.80 0.93 0.29 0.88 0.83
2019 0.82 0.03 0.75 0.81 0.37 0.84 0.77
Fig. 1. China’s trade efficiency trend with South Asia.
In order to better understand the trade potential of China and South Asian countries, according to the regression results, the average trade efficiency, average real export value,
0
0.2
0.4
0.6
0.8
1
1.2
Bangladesh Bhutan Sri Lanka Maldives
Nepal Pakistan India
11
SHS Web of Conferences 96, 01010 (2021) https://doi.org/10.1051/shsconf/20219601010IAFSM 2020
average trade potential value and expansion space of each country from 2000 to 2019 are made to better compare and analyze the trade development level of different countries. The results are shown in Table 4. As can be clearly seen from the table rankings, the average trade potential ranking is followed by Sri Lanka, Pakistan, Bangladesh, India, Nepal, Maldives and Bhutan. Since the friendly exchanges between China and Pakistan and Sri Lanka in 2014, the volume of trade has expanded rapidly. It has surpassed India to become the first and second trade potential partner of China in South Asia. India's trade is declining because of its recent political disputes with China. Pakistan's trade efficiency value with China in 2019 was 0.84, making it the most efficient country in the trade with China. This shows that bilateral trade cooperation has made remarkable progress. During the epidemic, the two countries also helped each other with epidemic prevention materials, and the relationship between the two countries has heated up after the epidemic. The trade efficiency of Nepal and Maldives with China is low at around 0.4 and there is still a lot of room for development. But Bhutan's trade efficiency is very low, only 0.04, so there is a lot of room for development. Therefore, China and Bhutan should seize the opportunity to remove the obstacles to bilateral exchanges, form a long-term trade plan, establish diplomatic relations with each other, and join the One Belt and One Road.
Table 5. Average values of indicators between China and South Asian countries from 2000 to 2019.
Country eff.-est. Rank Actual export volume(million)
Export potential Expand space
Sri Lanka 0.88 1 3511.9 4010.75 0.14
Pakistan 0.85 2 830.46 982.03 0.18
Bangladesh 0.78 3 732.55 939.83 0.28
India 0.71 4 226.27 317.2 0.4
Nepal 0.45 5 79.78 177.64 1.23
Maldives 0.41 6 10.6 25.81 1.44
Bhutan 0.04 7 0.66 15.1 22.03
Data source: Calculated based on the results of the trade inefficiency model.
Note: Expansion space = (export potential / actual export value-1) * 100%
4 Conclusions and policy recommendations
4.1 Basic conclusion
This paper uses the time-varying stochastic frontier gravity model to select data from the past 20 years to study the relationship between China and South Asian countries' trade, introduces trade efficiency and artificial inefficiency factors to measure trade efficiency, analyzes related factors and compares the results with expectations to draw the corresponding conclusion. Judging from the results of the SFGM analysis, the main factors affecting the trade between China and South Asian countries are the per capita GDP of the two countries, the total population, and whether there is a common boundary. The result of geographic distance is not significant. It is concluded that the growth of the economic scale and population of the two countries has an obvious promotion effect on bilateral trade, while the growth of China's GDP has an obstructive effect on bilateral trade. The distance between the two countries in trade is to enhance the utility of bilateral trade, and may be the weakening of the distance utility. The existence of a common border between the two countries can also effectively
12
SHS Web of Conferences 96, 01010 (2021) https://doi.org/10.1051/shsconf/20219601010IAFSM 2020
average trade potential value and expansion space of each country from 2000 to 2019 are made to better compare and analyze the trade development level of different countries. The results are shown in Table 4. As can be clearly seen from the table rankings, the average trade potential ranking is followed by Sri Lanka, Pakistan, Bangladesh, India, Nepal, Maldives and Bhutan. Since the friendly exchanges between China and Pakistan and Sri Lanka in 2014, the volume of trade has expanded rapidly. It has surpassed India to become the first and second trade potential partner of China in South Asia. India's trade is declining because of its recent political disputes with China. Pakistan's trade efficiency value with China in 2019 was 0.84, making it the most efficient country in the trade with China. This shows that bilateral trade cooperation has made remarkable progress. During the epidemic, the two countries also helped each other with epidemic prevention materials, and the relationship between the two countries has heated up after the epidemic. The trade efficiency of Nepal and Maldives with China is low at around 0.4 and there is still a lot of room for development. But Bhutan's trade efficiency is very low, only 0.04, so there is a lot of room for development. Therefore, China and Bhutan should seize the opportunity to remove the obstacles to bilateral exchanges, form a long-term trade plan, establish diplomatic relations with each other, and join the One Belt and One Road.
Table 5. Average values of indicators between China and South Asian countries from 2000 to 2019.
Country eff.-est. Rank Actual export volume(million)
Export potential Expand space
Sri Lanka 0.88 1 3511.9 4010.75 0.14
Pakistan 0.85 2 830.46 982.03 0.18
Bangladesh 0.78 3 732.55 939.83 0.28
India 0.71 4 226.27 317.2 0.4
Nepal 0.45 5 79.78 177.64 1.23
Maldives 0.41 6 10.6 25.81 1.44
Bhutan 0.04 7 0.66 15.1 22.03
Data source: Calculated based on the results of the trade inefficiency model.
Note: Expansion space = (export potential / actual export value-1) * 100%
4 Conclusions and policy recommendations
4.1 Basic conclusion
This paper uses the time-varying stochastic frontier gravity model to select data from the past 20 years to study the relationship between China and South Asian countries' trade, introduces trade efficiency and artificial inefficiency factors to measure trade efficiency, analyzes related factors and compares the results with expectations to draw the corresponding conclusion. Judging from the results of the SFGM analysis, the main factors affecting the trade between China and South Asian countries are the per capita GDP of the two countries, the total population, and whether there is a common boundary. The result of geographic distance is not significant. It is concluded that the growth of the economic scale and population of the two countries has an obvious promotion effect on bilateral trade, while the growth of China's GDP has an obstructive effect on bilateral trade. The distance between the two countries in trade is to enhance the utility of bilateral trade, and may be the weakening of the distance utility. The existence of a common border between the two countries can also effectively
promote bilateral trade. The non-efficiency model has great obstacles to bilateral trade. Among them, whether to sign a free trade agreement, the degree of trade freedom, and the quality of port infrastructure play a role in promoting trade and are all significant. The simple average tax rate of all products, government integrity, financial freedom, and political risks hinder trade and are all significant.
From the perspective of trade efficiency, China’s trade efficiency value with Bangladesh, Pakistan, and Maldives is high in 2019, and it has certain development potential with India, Nepal, and Sri Lanka. It has the lowest average trade efficiency with Bhutan. China’s trade has huge potential for development.
4.2 Countermeasures and suggestions
(1) China should establish friendly diplomatic relations with South Asian countries and play the role of the Belt and Road and the Maritime Silk Road. In the context of the COVID-19, the development of new industries has been continuously promoted. For example, the operation of Internet platforms, home office, biomedicine, online teaching, etc. will continue to develop, 5g technology will develop against the trend due to the epidemic, and the pace of the information age will accelerate, while the economic and technological level of South Asian countries is backward, and external technical equipment and materials are more needed Therefore, China should join hands with South Asian countries to overcome difficulties. China should also speed up the cross-border e-commerce transaction mechanism with South Asia, reduce taxes and fees, and stabilize industrial supply to expand trade volume. [13] Bhutan has not established diplomatic relations with China so far, indicating that the two sides still have concerns. Bhutan has also been extremely backward in economic development due to a long-term closed attitude to the outside world and has not yet opened up ideologically. However, India’s suppression in recent years has led to some signs that Butan is getting rid of this situation, and the two sides should seize the opportunity of the Belt and Road to enhance mutual trade. Hoping that Bhutan's trade with China will improve in the near future. India has not participated so far, China and India should also remove factors that hinder the exchanges between the two countries and join the Belt and Road Initiative. China and South Asia should also promote the construction of a free trade zone and further deepen open cooperation. If China and South Asian countries with high trade efficiency continue to maintain friendly trade exchanges, the trade volume between the two countries will be further deepened to develop new goods for trade exchanges. For countries with extremely low trade efficiency, the two countries should lower trade barriers and adopt a positive attitude to promote trade development.
(2) Promote the financing function, and the government strengthens the management of the financial market. Project construction in China and South Asian countries generally has the characteristics of long cycle and high capital demand. The Asian Infrastructure Investment Bank and the Silk Road Fund should also play their financing role to help South Asian countries provide financial support. To constantly improve the financial system services, and continue to promote the internationalization of the RMB. Continue to promote the construction of infrastructure. With the continuous expansion and improvement of the "Belt and Road", China has helped many countries in South Asia to carry out infrastructure construction, but there are still many projects that have not been completed. China should use its advantages in infrastructure such as roads and railways to promote the development of China and South Asia.
(3) According to the situation of different countries, implement a differentiated trade model that meets the needs of the two countries. [14] The economic situation, political situation and trade environment of South Asian countries are different. The Chinese government should coordinate the various demands of different countries to strengthen the
13
SHS Web of Conferences 96, 01010 (2021) https://doi.org/10.1051/shsconf/20219601010IAFSM 2020
understanding of the culture, politics, economy and other aspects of South Asian countries and establish sustainable trade relations with South Asia. China has always been in a surplus in exports with South Asia, and trade exchanges account for a small proportion of China's exports. This reflects the trade issues between China and South Asia and also shows that there is a lot of room for expansion in trade cooperation. [15] The trade between China and South Asian countries is mostly capital-intensive products, and China’s exports are shifting towards high-end electronic products. The two sides should expand new industries for trade exchanges, and continuously improve and innovate export products to promote trade transformation between the two sides. Countries should unite to resolve domestic and international security issues. South Asia has always been threatened by terrorism. The Global Terrorism Index shows that South Asia is most affected by terrorism in the world. South Asian countries should improve national management and control capabilities, reduce inequality in society, and take measures to ease people’s sentiments to reduce terrorism.
(4) Strengthen cooperation and exchanges between the western region and South Asia. China’s Tibet and Xinjiang are connected with South Asian countries. They should give full play to their geographic advantages and extend their territory to South Asia with the west as its territory. Therefore, China should strengthen assistance to the west by establishing industrial parks, strengthening infrastructure construction in the west, and providing high-tech equipment. It not only promotes the development of China and South Asia, but also gives a lateral impetus to the strategy of developing the western region.
References 1. A.Islam, R.Salim, & H.Bloch, Does Regional Integration Affect Efficiency and
Productivity Growth? Empirical Evidence from South Asia. Review of Urban and Regional Development Studies, 28(2), 107–122. (2016)
2. R. Kumar, South Asia: Multilateral trade agreements and untapped regional trade integration. Int J Fin Econ. 2020; 1– 13. (2020)
3. N. Gul, & H.M Yasin, The Trade Potential of Pakistan: An Application of the Gravity Model. Lahore Journal of Economics, 16(1), 23–62. (2011)
4. N.Akhter, E.Ghani, Regional Integration in South Asia: An Analysis of Trade Flows Using the Gravity Model. Pakistan Development Review. 2010;49(2):105-118. (2010)
5. Y Y Zong. Analysis on the growth potential of agricultural trade between China and South Asian countries[D]. Shandong University of Finance and Economics (2018).
6. Z X Liu, H H Chen. An Empirical Study on Energy Intra-Industry Trade between China and ASEAN[J]. Coal Economic Research, 2019, 39(09): 56-62. (2019)
7. Y J Cheng, C H Dong. Research on the efficiency and potential of trade between China and South Asian countries from the perspective of "One Belt and One Road"——An Empirical Test Based on the Heterogeneous Stochastic Frontier Gravity Model[J]. Journal of Lanzhou University of Finance and Economics, 2020, 36(02) :94-105. (2020)
8. J Liu. Research on the trade potential and influencing factors between China and Central Asia and South Asia [D]. Guangdong University of Foreign Studies, (2020).
9. L Wang, S Chen. Research on the Trade Efficiency and Potential of Bangladesh-China-India-Myanmar Economic Corridor——Based on the Analysis of Stochastic Frontier Gravity Model[J]. Asia-Pacific Economics, (2019)
14
SHS Web of Conferences 96, 01010 (2021) https://doi.org/10.1051/shsconf/20219601010IAFSM 2020
understanding of the culture, politics, economy and other aspects of South Asian countries and establish sustainable trade relations with South Asia. China has always been in a surplus in exports with South Asia, and trade exchanges account for a small proportion of China's exports. This reflects the trade issues between China and South Asia and also shows that there is a lot of room for expansion in trade cooperation. [15] The trade between China and South Asian countries is mostly capital-intensive products, and China’s exports are shifting towards high-end electronic products. The two sides should expand new industries for trade exchanges, and continuously improve and innovate export products to promote trade transformation between the two sides. Countries should unite to resolve domestic and international security issues. South Asia has always been threatened by terrorism. The Global Terrorism Index shows that South Asia is most affected by terrorism in the world. South Asian countries should improve national management and control capabilities, reduce inequality in society, and take measures to ease people’s sentiments to reduce terrorism.
(4) Strengthen cooperation and exchanges between the western region and South Asia. China’s Tibet and Xinjiang are connected with South Asian countries. They should give full play to their geographic advantages and extend their territory to South Asia with the west as its territory. Therefore, China should strengthen assistance to the west by establishing industrial parks, strengthening infrastructure construction in the west, and providing high-tech equipment. It not only promotes the development of China and South Asia, but also gives a lateral impetus to the strategy of developing the western region.
References 1. A.Islam, R.Salim, & H.Bloch, Does Regional Integration Affect Efficiency and
Productivity Growth? Empirical Evidence from South Asia. Review of Urban and Regional Development Studies, 28(2), 107–122. (2016)
2. R. Kumar, South Asia: Multilateral trade agreements and untapped regional trade integration. Int J Fin Econ. 2020; 1– 13. (2020)
3. N. Gul, & H.M Yasin, The Trade Potential of Pakistan: An Application of the Gravity Model. Lahore Journal of Economics, 16(1), 23–62. (2011)
4. N.Akhter, E.Ghani, Regional Integration in South Asia: An Analysis of Trade Flows Using the Gravity Model. Pakistan Development Review. 2010;49(2):105-118. (2010)
5. Y Y Zong. Analysis on the growth potential of agricultural trade between China and South Asian countries[D]. Shandong University of Finance and Economics (2018).
6. Z X Liu, H H Chen. An Empirical Study on Energy Intra-Industry Trade between China and ASEAN[J]. Coal Economic Research, 2019, 39(09): 56-62. (2019)
7. Y J Cheng, C H Dong. Research on the efficiency and potential of trade between China and South Asian countries from the perspective of "One Belt and One Road"——An Empirical Test Based on the Heterogeneous Stochastic Frontier Gravity Model[J]. Journal of Lanzhou University of Finance and Economics, 2020, 36(02) :94-105. (2020)
8. J Liu. Research on the trade potential and influencing factors between China and Central Asia and South Asia [D]. Guangdong University of Foreign Studies, (2020).
9. L Wang, S Chen. Research on the Trade Efficiency and Potential of Bangladesh-China-India-Myanmar Economic Corridor——Based on the Analysis of Stochastic Frontier Gravity Model[J]. Asia-Pacific Economics, (2019)
10. Z G Gao, F Tian. Research on the impact of trade facilitation level on China-Pakistan export trade efficiency under the background of China-Pakistan Economic Corridor[J]. South Asian Studies, (2019)
11. L Li, S C Ma. An Empirical Study on Trade Competitiveness and Complementarity between China and South Asia[J]. Price Monthly, (04): 49-58, (2020)
12. Y X Li. The cooperation basis, promotion opportunity and realization mechanism of China and South Asia trade under the "One Belt and One Road" strategy. Gansu Social Sciences, (2016)
13. L H Xu. China's New International Competitive Advantages of Foreign Trade in South Asia and Southeast Asia[J]. South Asia and Southeast Asia Studies, (2020).
14. J Wei, H Y Zhang. Potential analysis of import trade between China and Central and Eastern European countries: an empirical study based on the time-varying stochastic frontier gravity model [J]. Regional Economic Review, (2020)
15. Y M Wu. Research on China-South Asia trade cooperation under the background of "One Belt and One Road" [D]. Yunnan University of Finance and Economics, (2016)
15
SHS Web of Conferences 96, 01010 (2021) https://doi.org/10.1051/shsconf/20219601010IAFSM 2020


![[Roger Cliff] the Military Potential of China's Co(Bookos.org)](https://img.pdfslide.us/doc/110x75/577cd9641a28ab9e78a3646d/roger-cliff-the-military-potential-of-chinas-cobookosorg.jpg)