Embed Size (px)
Citation preview

Research on the Cheap: Making an Impact Without Big Grants
Mark H. Ebell MD, MSCollege of Public HealthThe University of Georgia

Why do we do research?
• Frustration• Passion• Curiosity• Collaboration• To go to great meetings like NAPCRG
• It’s just plain fun

So, today’s goal is:• Commiserate a bit about (lack of) funding• Suggest a framework for thinking
systematically about a clinical area• Suggest some innovative study designs and
research tools that might help
• It is NOT to tell you how to get funding. Lots of people are far better qualified than me!
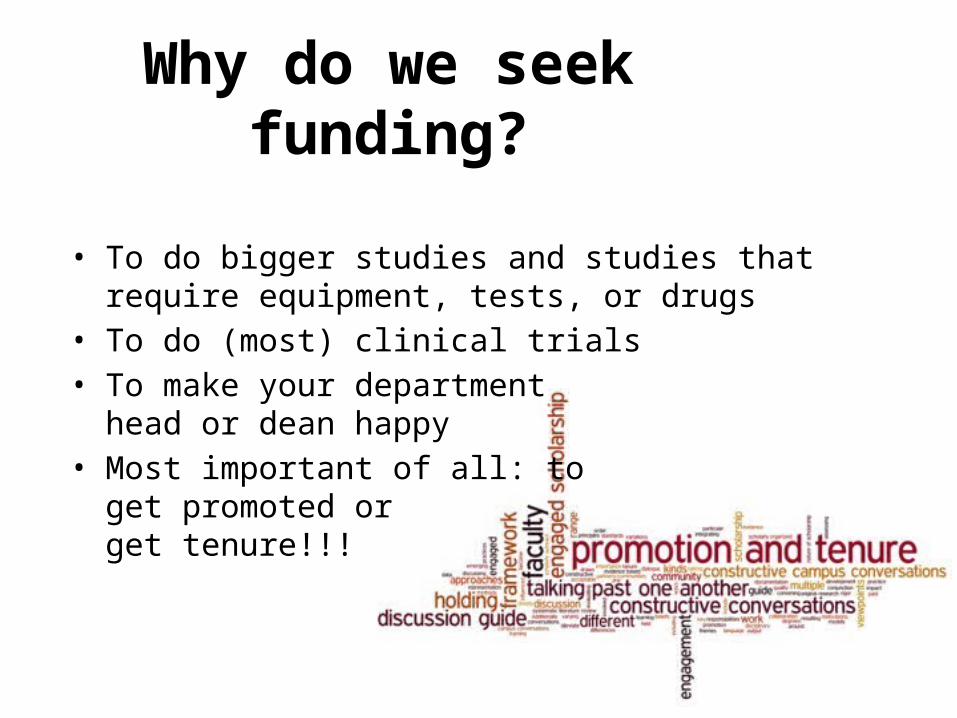
Why do we seek funding?
• To do bigger studies and studies that require equipment, tests, or drugs
• To do (most) clinical trials• To make your department
head or dean happy• Most important of all: to
get promoted or get tenure!!!

Please raise your hand if you have received a grant in the amount of 1,000,000 or more dollars or euros

Success Rates by YearPercentage of all applications that are funded; considerably lower for RO1s (RO1 = large, investigator initiated research project)
NIH Institute
1997 2001 2005 2009 2012
NCI 28.2 27.2 20.4 19.2 13.6
NHLBI 29.6 35.7 23.5 22.1 14.7
NIAID 43.1 38.3 25.2 18.7 23.2
NIMH 28.4 30.7 21.0 21.5 21.6
Overall 30.5 32.1 22.3 20.6 17.6
Source: NIH Office of the Budget

Source: mikethemadbiologist.com

It’s your own damn fault!
More grants are funded, twice as much money is available
Will all of you please STOP writing grants!
NIH Institute 1997 2001 2005 2009 2012
Applications reviewed
24,221 28,368 43,069 43,142 51,313
Applications awarded
7,388 9,098 9,599 8,881 9,032
Percent awarded
30.5% 32.1% 22.3% 20.6% 17.6%
Total $ (billions) $1.82 $3.03 $3.41 $3.71 $3.81
Source: NIH Office of the Budget

Source: NIH Office of the Budget

Source: NIH Office of the Budget
38 years old
45 years old

1980

2010

1980 & 2010
1980 2010

So will all of you older professors please RETIRE?
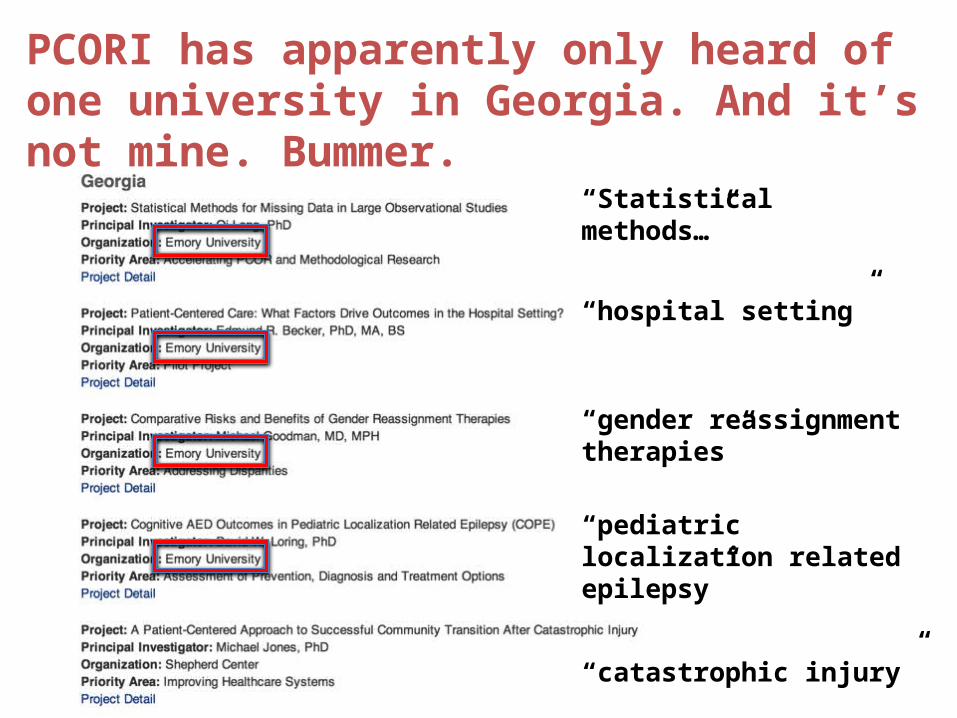
PCORI has apparently only heard of one university in Georgia. And it’s not mine. Bummer.
“Statistical methods…”
“hospital setting”
“gender reassignment therapies”
“pediatric localization related epilepsy”
“catastrophic injury”

My experience
• In the past 4 years I’ve submitted or resubmitted 10 grant proposals to NIH or AHRQ, and 2 to PCORI (a 3rd is going in next month)
• Best result: 6th percentile for grant to develop automated approach to answering clinical questions. Yeah! 6th percentile will surely get funded.
• Nope, not funded by NLM.

A way forward
Generate good questions
Think systematically about a clinical problem
Use innovative (and frugal) designs and tools
Collaboration as a force multiplier

Generating a good question:from your NAPCRG colleagues• Should we treat Group C and G strep with antibiotics?
• Which company’s artificial joint is best?
• Effective treatments for mild to moderate depression?
• Should we target a lipid value or “fire and forget”?
• What works for common annoying problems: non-ulcer dyspepsia, eructation, plantar fasciitis?
• Should we bother treating mild hypertension?
• Is there value in a modern, targeted period health exam?
• What is the natural history for fatigue, dyspepsia, and pain.

Generating a good question
• Read a lot – know the literature cold in your area of interest
• Reflect on your practice• Question your underlying assumptions• Question authority• Pick something you are
passionate about• Brainstorm with colleagues,
especially those who arenot in your field

A way forward: think systematically about a clinical problem1. What is the differential diagnosis and
pretest probability?
2. What are the test and treatment thresholds?
3. How to best use individual elements of the history and physical exam and diagnostic tests?
4. Would a clinical decision rule be helpful?
5. How effective and safe are common treatments?
6. What is the prognosis and natural history?

1. What is the differential diagnosis and pretest probability?
Example: World’s literature on causes of chest pain in primary care setting
Very little!
Source:(mostly NAPCRGers!)1. Klinkman, 19942,3. Bosner, Hasenritter, 20104. Verdon, 2008

1. What is the differential diagnosis and pretest probability?
• Transitions Project in Netherlands in 1990’s (also NAPCRGers!)
• We need same for North America
• EHR’s provide way forward if we can link reason for visit to final diagnosis
• Can also do SR’s of differential diagnosis and pretest probabilityof important diagnoses in different settings

2. What are the test and treatment thresholds?If you are designing a decision support tool or clinical rule, don’t you have to know this? How low risk is low enough? How high is high enough?
Central to clinical decision-making – but almost completely unstudied
Test threshold
Treatment threshold

2. What are the test and treatment thresholds?
My proposal: clinical decision rules must be situated in a clinical context. Cutoffs for risk groups should be guided by test and treatment thresholds.
Low risk group
Moderate risk group
High risk group
Lots of good research needed to figure out these thresholds and their variance
Test threshold
Treatment threshold

2. How do we determine these test and treatment thresholds? One approach…
• A patient presents during flu season, but you think influenza is unlikely based on the history, physical exam, and optionally a rapid antigen test.
• At what probability of influenza do you consider influenza ruled out after your exam? Stand up when you see the percentage that matches your test threshold
< 30%
< 25%
< 20%
< 15%
< 10%
< 5%

2. How do we determine these test and treatment thresholds? One approach…
• A patient presents during flu season with typical signs and symptoms of influenza. You perform a careful exam and (optionally) a rapid flu test.
• At what probability of influenza do you consider influenza ruled in? Stand up when you see the percentage that matches your treatment threshold
> 30%
> 40%
> 50%
> 60%
> 70%
> 80%

2. How do we determine these test and treatment thresholds? Clinical vignettes!
Created Web site (http://bit.ly/154aCQ7) that presented physicians with a series of vignettes.
Each vignette included a description of a patient and a randomly generated probability of the disease
Physicians were asked to make decision:
Neither test nor treat (below test threshold)
Test (between thresholds)
Treat (above treatment threshold)
Think about how you can use this approach of dynamically generated vignettes in your research


Results: Influenza Scenario
US on left Swiss on right
Shout out to Swiss collaborators Nicolas Senn and Isabella Locatelli!

2. Test and treatment thresholds
A great area for primary care research:– How do we determine the test and treatment
thresholds?– Do they differ by specialty, or for patients?– Can we identify test and treatment thresholds for
clinical decision rules and diagnostic tests that reflect these thresholds?
– This does not require a big budget, but requires creativity and collaboration
Also think about how you can use dynamically generated clinical vignettes in YOUR research
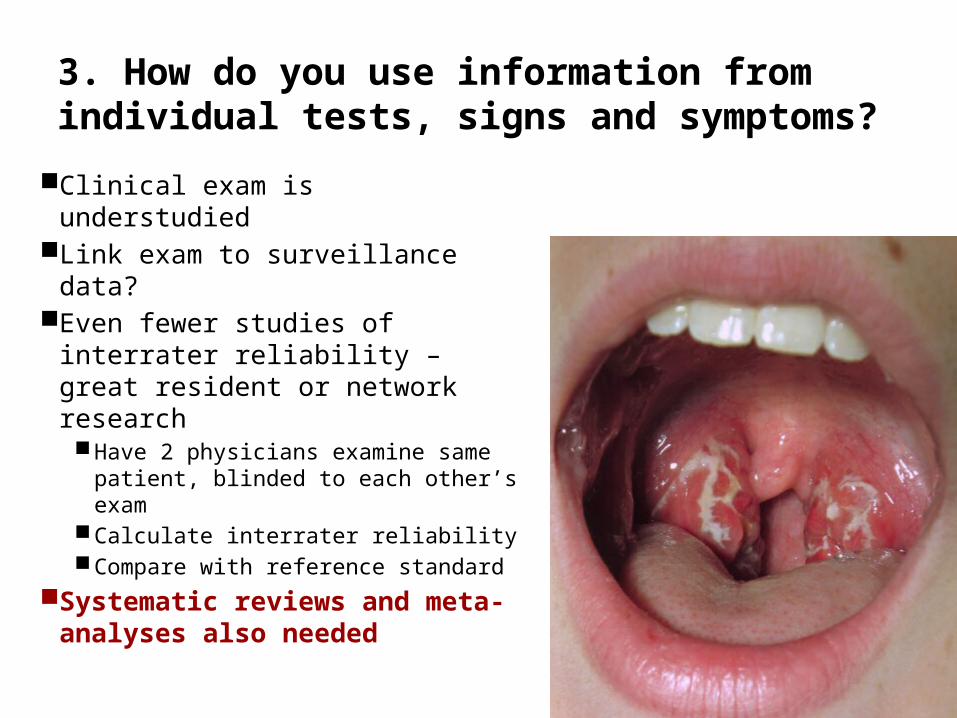
3. How do you use information from individual tests, signs and symptoms?
Clinical exam is understudiedLink exam to surveillance data?Even fewer studies of interrater
reliability – great resident or network researchHave 2 physicians examine same
patient, blinded to each other’s exam
Calculate interrater reliabilityCompare with reference standard
Systematic reviews and meta-analyses also needed

4. Would a clinical decision rule be helpful?
• CDRs integrate information from several elements of the history, physical or simple tests to identify low, moderate and high risk groups.
• EHRs may make their use more efficient and practical
• Need to:– Develop and validate new rules– Validate existing rules in primary
care– Do systematic reviews of clinical
rules

4. Would a clinical decision rule be helpful?
Performed MV analysis to determine independent association of each sign/symptom to diagnosis of flu.
Collaborators: Nicolas Senn, Blaise Genton (Lausanne) and Ralph Gonzales, John Stein (UCSF)
Clinical Variable Beta Odds ratio Points
Fever x cough 1.361 3.90 (2.27 – 6.70) 2
Myalgia (body aches) 1.260 3.53 (1.65 – 7.53) 2
Onset < 48 hours 0.721 2.06 (1.19 – 3.55) 1
Chills and/or sweats 0.401 1.49 (0.78 – 2.87) 1
Constant -2.808

4. Would a clinical decision rule be helpful?
• Best performing model shown at right; equally accurate in validation group
• Classified 26% in low risk group and 41% in high risk group
• Disease could be ruled in or ruled out in 2/3 without point of care testing
Clinical finding Points
Fever + cough 2Myalgia 2Onset
< 48 hrs1
Chills or sweats 1Total:
Risk group % flu Action
Low risk (0-2) 6% Flu ruled out
Mod risk (3) 26% Consider test
High risk (4-6) 58% Treat

4. Would a clinical decision rule be helpful?
Study designed to create congruence between the clinical decision rule and the decision thresholds. Lots of work to be done here for other conditions!
4+ points, 58% probability
3 points, 26% probability
< 3 pts, 6% probability
And don’t forget: meta-analysis of clinical decision rules is a cheap, fun study design and very useful to clinicians
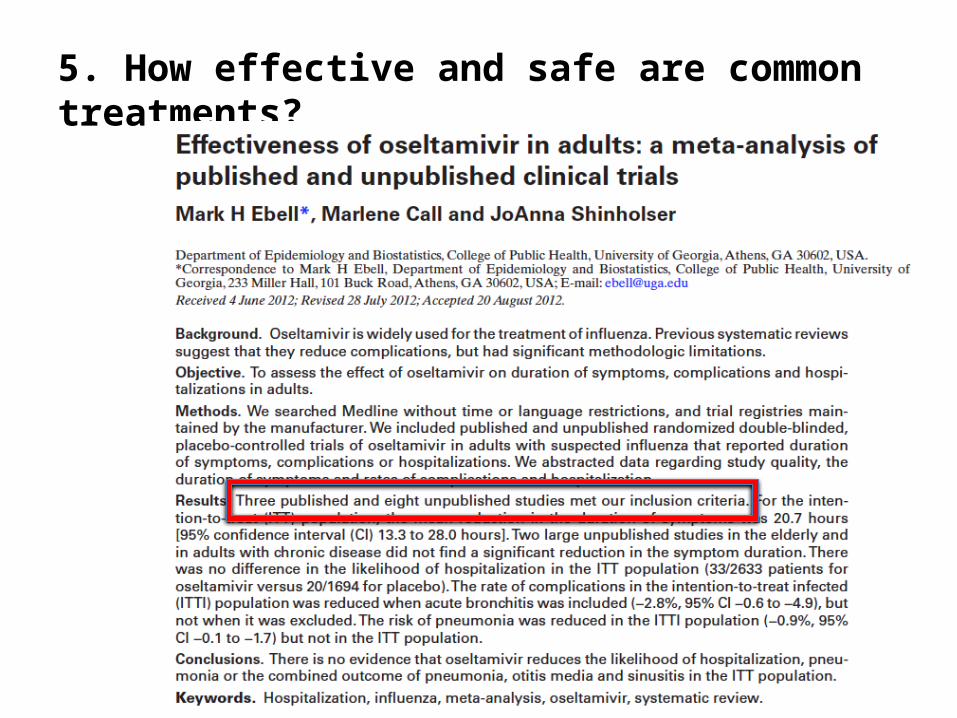
5. How effective and safe are common treatments?

Key Findings:Based only on 3 published RCTs (according to Roche)
• Treatment within 48 hours reduces symptoms about 30 hours
• Treatment reduces complications requiring an antibiotic by at least 5% (absolute risk reduction)
• Gosh, we just don’t know about effectiveness in elderly and in those with chronic pulmonary disease, but SURELY it is better, right?

Key Findings:Based on all 11 published and unpublished RCTs
• Reduction in symptom duration is only 20 hours (not 30).
– 0 to 24 hours: 30 hours shorter duration
– 24 to 36 hours: 14 hours shorter duration
• Complications requiring antibiotics are not reduced if you exclude acute bronchitis
• No difference in hospitalization rates
• Was a 0.9% absolute reduction in pneumonia, but only if you restrict to PCR positive patients (about half of total)
• No significant reduction in duration of symptoms or complications in studies of 736 elderly or 401 with chronic disease

5. How effective and safe are common treatments?
• Systematic reviews and meta-analyses of benefit and harm of therapy are a cheap research design that creates useful results – especially when you track down unpublished data
• Your mission: figure out how to get access to unpublished data (Clinical Trial Reports or CTRs) from FDA or European Medicines Agency
• See Ben Goldacre: WhatDoctors Don’t Know About the Drugs They Prescribe”
• http://bit.ly/S3vh3C
• http://www.badscience.net
• http://www.alltrials.net
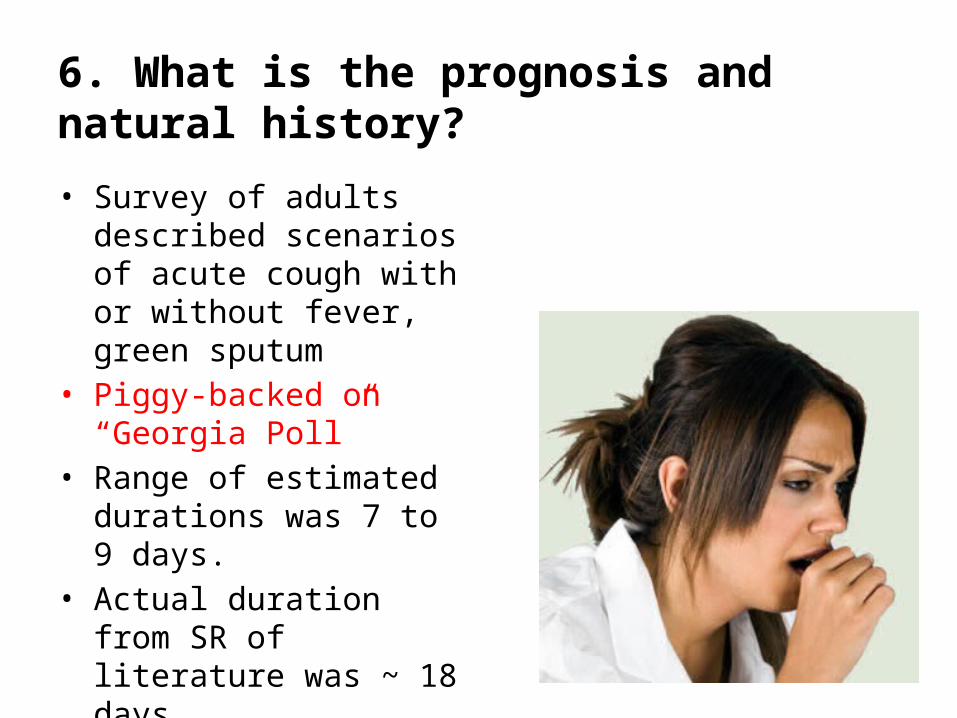
6. What is the prognosis and natural history?
• Survey of adults described scenarios of acute cough with or without fever, green sputum
• Piggy-backed on “Georgia Poll”
• Range of estimated durations was 7 to 9 days.
• Actual duration from SR of literature was ~ 18 days
Big mismatch!

6. Prognosis and natural history: great opportunity for research
• Prognosis and natural history are also understudied• How long do common conditions last? • Good PBRN opportunity• Could build on EHR networks and systems – key is
identifying episodes of care• Also opportunity for systematic reviews of natural
history and prognosis studies
Helping patients set realistic expectations can reduce overdiagnosis and overtreatment.

Use innovative (and frugal) designs
Clinical vignettes
Meta-analysis
Survey research
Qualitative research
Cost-utility / cost-effectiveness analysis
Analysis of secondary datasets
Data-mining techniques

Cost-Effectiveness and Decision Analysis
• Can be quite complex• Attend a course (SMDM or ISPOR meetings)• Team up with modelers at your institution

Secondary datasets and data-mining
• Obtained dataset from a national registry with 165,000 episodes of CPR at over 300 hospitals
• How? Just went online and applied for access!
• Used 3 different analytic strategies with single dataset:– Developed point score based on multivariate
model (JAMA IM, 2013)– Developed CART model (Crit Care Med, 2013) – Artificial neural network study in progress
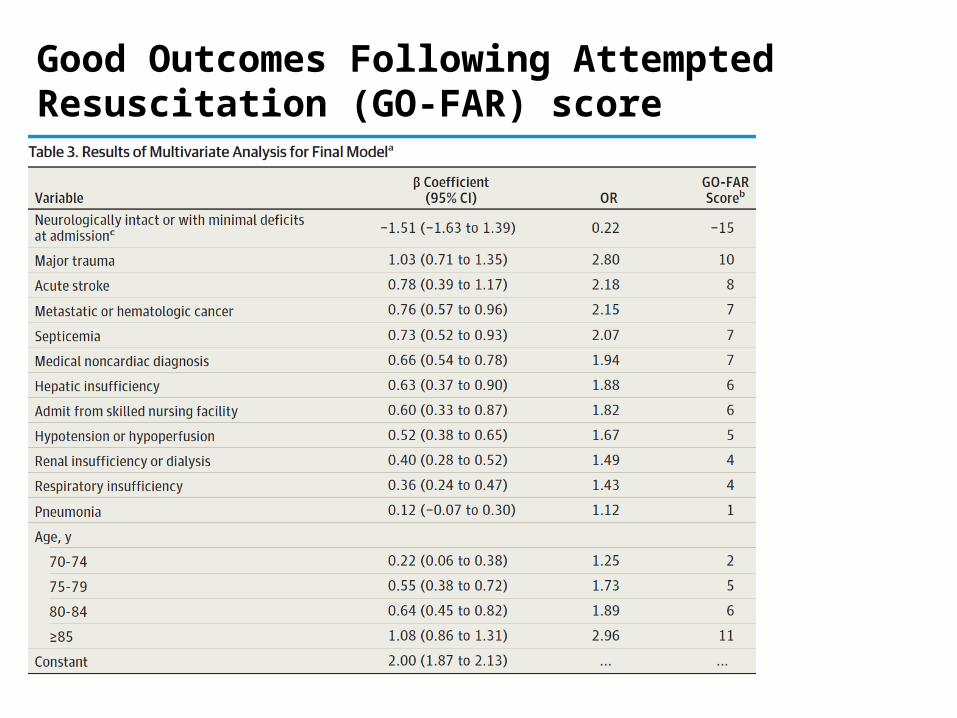
Good Outcomes Following Attempted Resuscitation (GO-FAR) score

Good Outcomes Following Attempted Resuscitation (GO-FAR) score
Able to identify 10% of patients with a 0.9% likelihood of neurologically intact survival, and 28.1% with 1.4% chance of same.
Ebell MH, Afonso AM, Geocadin RG. Pre-arrest prediction of neurologically intact survival following in-hospital cardiopulmonary resuscitation: The Good Outcome Following Attempted Resuscitation (GO-FAR) score. JAMA IM 2013; doi:10.1001/jamainternmed.2013.10037

Data-mining: CART and ANN
• Model-free techniques that can be used as alternatives to MV analysis and point scores; are prone to overfitting.
• Classification and Regression Trees (CART)– Creates decision trees that
have good user friendlinessand transparency
• Artificial neural networks– Artificial intelligence approach
not widely used in clinicalmedicine

Use innovative (and fairly cheap) tools• Stata: meta-analysis and systematic reviews • SPSS JMP: data mining, including CART and
artificial neural networks• TreeAge by Data: decision analysis and cost-
effectiveness analysis• JavaScript: creating interactive Web sites• Secondary datasets:
– National Center for Health Statistics (NHANES, BRFSS, NAMCS, etc) and SEER
– Manufacturers with clinical trial data
– Others: Lifeline, CVS Minute Clinics

A program of research:acute respiratory tract infections
• Methods used: diagnostic test assessment, CART modeling, meta-analysis, systematic reviews, decision rule development and validation, clinical vignettes
• Collaborators: 13• Publications: 9• Research budget: $1600

A program of research:DNR decision-making
• Methods used: survey, chart review, multivariate analysis, CART modeling, artificial neural network, meta-analysis, decision rule development and validation, cost-utility analysis, cost analysis
• Collaborators: 16 • Publications: 17 • Research budget: $0

Lessons Learned
Network and collaborate• Go to the same meeting(s)
each year, and get involved• Have a “speed-dating for research” session at
your institutions– 3 minutes to present 1 or 2 ideas– 5 minutes to discuss and find collaborators– Lather, rinse repeat for each researcher– Cocktail party at the end
• Be bold. Email people. Call them. Find those interesting datasets.
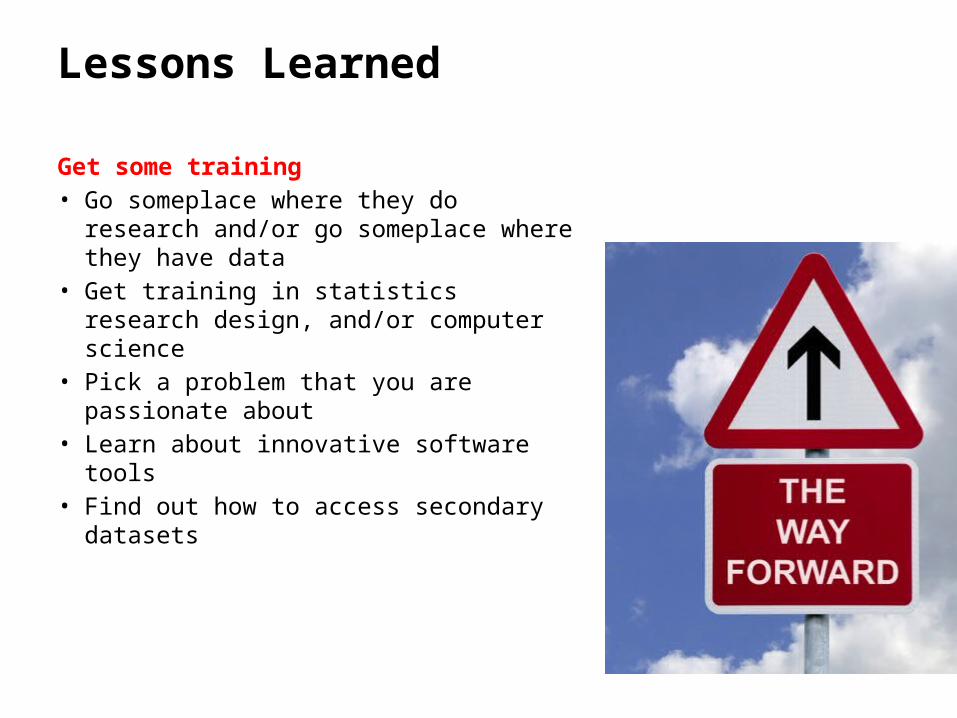
Lessons Learned
Get some training• Go someplace where they do
research and/or go someplace where they have data
• Get training in statistics research design, and/or computer science
• Pick a problem that you are passionate about
• Learn about innovative software tools • Find out how to access secondary
datasets

Lessons Learned
Learn how to use cheap research designs and innovative tools:• Vignette based studies (Web opens
new possibilities)• Piggy backing on existing surveys• Cost-effectiveness analyses• Secondary analysis of publicly
available databases• Accuracy and inter-rater reliability of
history and physical• Clinical decision rules• Data mining (CART, ANN)• Systematic reviews (including
unpublished treatment research)

Lessons Learned
Think systematically about a clinical problem
– Pretest probability and differential diagnosis
– Accuracy of clinical diagnosis– Accuracy of office-based tests– Development and validation of
clinical decision rules– Efficacy of common outpatient
primary care treatments– Prognosis and natural history
studies
There’s a lot left to learn about common problems in every field

Barley and Islay say: “Dive into your research – it’s fun!”