Embed Size (px)
Citation preview

RESEARCH ON THE CHARACTERISTICS OF WIND ENERGY
RESOURCES AND THE FINE ASSESSMENT TECHNOLOGY IN
SOUTHWEST CHINA
Pengkang Lou,Huaneng Renewables Corporation Limited, [email protected]
Rongwei Zhou, CMA Wind & Solar Energy Resources Centre
Chen Guo,Huaneng Renewables Corporation Limited
Chunhong Yuan, CMA Wind & Solar Energy Resources Centre
Xiaodan Feng, Huaneng Renewables Corporation Limited
Lihong Quan, CMA Wind & Solar Energy Resources Centre
Yihan Sun, CMA Wind & Solar Energy Resources Centre
ABSTRACT
Wind observation data has advantages in studying the characteristics of wind energy resources over
complex terrain in southwest China. Some methods, including the wind data quality control, long-term
revision and extreme wind speed evaluation, were developed in order to assess the wind parameter
characteristics in this area. These parameters were consist of air density, temporal and spatial variety
of wind speed, dominant wind direction, wind speed vertical profiles and exponents, gustiness factor,
the annual average wind power density, turbulence intensity, wind speed probability distribution,
return period wind speed.
It used WERAS/CMA numerical simulation method, including synoptic patterns, conventional
observation data fusion, meteorological model systems, and statistical revisions, and Chinese
meteorological observation data fused with global reanalysis data, to drive the mesoscale model and
get a preliminary evaluation result. Through comparing with the wind mast data in southwest China,
the applicability of the results in these areas was examined.
KEYWORDS: wind energy resources, southwest China, WREAS/CMA numerical simulation method
1. Introduction
In 2015, China's wind power installed capacity hit a new record. The country (except Taiwan) added
around 30753 MW of new installed capacity, and had an accumulative total installed capacity of around
145362 MW; In 2015, the accumulative installed capacity of Inner Mongolia, xinjiang, gansu, hebei,
shandong rank top five, accounted for 51.7% of the national total installed capacity. Compared with
2014, the maximum growth amplitude is 91% year-on-year in Southwest region, 37% of the Central
and Southern region, 35% of the Northeast region, 27% of the Northwest region, 22% and 20%
respectively of North and East region. This shows that China's wind power development has gradually
turned to inland areas, where wind energy resource is rich in complex terrain, especially the southwest

plateau area.
In addition to the synoptic-scale system, the wind energy resource in surface layer affected by the local
landform features. Most are complex mountainous terrain in Chinese southwest plateau area, where the
wind speed of surface layer is greatly influenced by local terrain, and the wind energy resource presents
low wind speed and strong regional features.
In this paper, through observation data analysis of multiple wind masts, and numerical simulation, the
characteristics and high resolution distribution of wind energy resource in the Chinese southwest
plateau area are evaluated.
2. Technical approach
2.1 Data process of wind masts
2.1.1 Data inspection
In accordance with " Methodology of wind energy resource assessment for wind farm (GB/T
18710-2002) ", and " Regulations for data inspection and correction of wind power plant
meteorological observation (QX/T 74-2007)", evaluating the data integrity and rationality. The
rationality test includes removing the not real data resulted from the instrumentation failure,
transmission error and unusual weather, checking of extreme value range, correlation and validation
analysis to meet the requirement of the valid data integrity rate more than 90% to assess local wind
energy resources.
2.1.2 Missing data interpolation and invalid data correction
The methods and steps of correlation analysis, the missing data interpolation and invalid data
correction are as follows:
Correction with the same wind mast: if a certain level and moment's data missing or invalid, and the
data of adjacent level effective, to establish the regression equation between the adjacent layers, and
correct the data using this equation; If a certain moment's data of all levels missing or invalid and the
adjacent time is very short, using the effective data of the time before and after; The wind correction
directly uses the adjacent effective layer's.
Correction with different wind masts: using data layer of good correlation from different mast (that is,
the adjacent mast).
Correction with reference weather stations: if the above steps can't work, to establish linear regression
equation between data of the wind mast and reference weather stations.
2.1.3 Requirements of reference weather station data

Because the observation period of wind mast is short, the statistical parameters are not representative
for long-term average status at observation site. According to the relative technical regulations,
appropriate national weather stations was chosen as reference station. And the history and synchronous
observation data is used to extend the observation data based on correlation test, and the data of
reference stations is also used for comparative calculation and analysis. The selected national
meteorological station is called the reference meteorological station, or the reference station.
According to "the wind resource assessment method for wind farm" (GB/T 18710-2002), "technical
specifications for meteorological observation, data verification, data revision"(QX/T74-2007) etc, the
selected reference station at least need to meet the following conditions:
a. the weather station environment of wind observation keeps unchanged for many years;
b. weather station location and climate characteristics of reference station is similar to the wind mast
and the wind farm area;
c. the observation time of historical wind data years meteorological stations is more than 20 years.
2.2 Numerical simulation method
Wind energy resource numerical simulation assessment system (WERAS/CMA) is based on
introducing and absorbing the international advanced wind numerical simulation technology.
According to the topography and climate characteristics of China, WERAS/CMA is developed and
improved. The system is on international advanced level and is the numerical simulation system
suitable for Chinese climate characteristics and geographical feathers. The system is composed of
weather classification module, meso-scale and micro-scale numerical simulation model, statistical
analysis and correction module, GIS analysis and product making module.
In weather classification module, each weather station of simulation area is used, and the ground and
sounding observation data of nearly 30 years is used. Wind speed, wind direction and the maximum
daily mixed layer height are used as weather classification factors. Wind speed is divided into 8
categories, wind direction is divided into 8 categories, and maximum mixing layer height is divided
into 4categories which is calculated by sounding data at 08 hours and ground observation data at 14
hours. And then 256 weather types are classified. 5% data of each days is selected as typical day for
numerical simulation.
Meso-scale model is WRF model and CALMET model is used as micro-scale model in WERA/CMA.
WRF (Research Forecast Weather) model system is a new generation of meso- scale prediction model
and real time data assimilation system developed jointly by several research departments and
universities in the United States. The model is a fully compressible non-hydrostatic model, and the
governing equations are written in the form of flux, and the grid form is C Arakawa lattice. The
physical processes in the WRF model include the radiation process, the boundary layer
parameterization, the convective parameterization, the sub grid turbulent diffusion process, and the
micro physical processes. CALMET model is recommended by the U. S. Environmental Protection
Agency (EPA). CALMET is a dynamical diagnostic model of wind field using a grid of complex
terrain according to the principle of mass conservation. The main consideration process is the dynamic
effect of near ground atmosphere to terrain, slope flow produces and obstacles blocking effect, and the
use of three-dimensional nondivergent treatment to eliminate interpolation to generate spurious
oscillations.
The high-resolution average wind field can be simulated by mesoscale and small-scale numerical
models, which is then corrected through the comparison and examination with the data measured on
wind towers so as to obtain the finer distribution of wind energy resource. In this correction method
measured data should be made sure to be representative of simulated area.
The exploration and utilization of wind energy resource is restricted by physical geography, land
resource, transport, power grid, national or local development planning, and so on, which should be
comprehensively considered in calculating potential exploration amount of wind energy resource. By
applying ArcGIS software system, and combining the geographic information data of terrain, land use,
etc, those areas that cannot be explored or restricted to be explored were designated in the distribution
figure of wind energy resource calculated from the result of numerical simulations, and then the
location, area, and potential exploration amount of exploitable wind energy resource were finally
obtained.
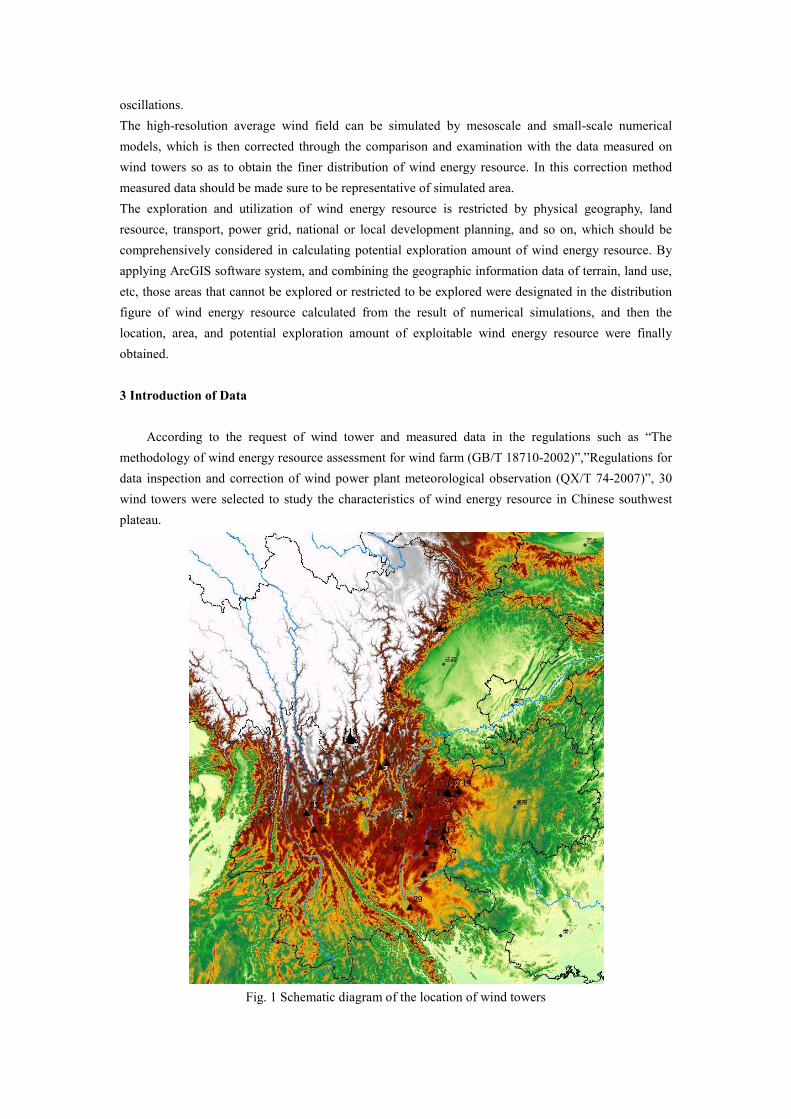
3 Introduction of Data
According to the request of wind tower and measured data in the regulations such as “The
methodology of wind energy resource assessment for wind farm (GB/T 18710-2002)”,”Regulations for
data inspection and correction of wind power plant meteorological observation (QX/T 74-2007)”, 30
wind towers were selected to study the characteristics of wind energy resource in Chinese southwest
plateau.
Fig. 1 Schematic diagram of the location of wind towers

4 Analysis the characteristics of wind parameters
4.1 Air density
Air density directly affects the value of wind energy. With the same wind speed, the larger the value of
air density is, the higher wind energy is. The relationship between air density and elevation at a wind
tower is shown in Fig. 2. From the figure, air density at the wind tower decreases with the increase of
terrain elevation. Air density is low in Chinese southwest plateau area, which is smaller than 0.8kg/m3
in the area with altitude above 4000m, and 0.9~1.0 kg/m3 in the area with altitude between
2000-3000m.
Fig. 2 The relationship between air density and elevation at a wind tower
4.2 Wind speed and wind power density
Yearly average wind speed is closed related to elevation at all wind towers. Yearly average wind speed
at the wind towers above 3000m is usually larger than that below 3000m. Yearly average wind speed is
also related to terrain. Yearly average wind speed at the wind tower on the ridge is higher than that on
the dam for that there is significantly air compressing and momentum passing down of upper air wind
at ridge.

Fig. 3 The Schematic diagram of the distribution of yearly average wind speed (U) and average wind
power density (P) at 70 m of wind towers
4.3 Vertical shear of wind speed
In general, the variation of wind at every layer is resulted from the friction of surface to air, and the
effect of surface friction decreases with the increase height in surface layer. Therefore, average wind
speed increase with the height in accordance with index law.
For the complex terrain of southwest plateau, the variation of wind with height at most wind towers
cannot be described by index law, for example, tower 1#, 4#, 29# at river valley, 14#, 15#, 23# at
mountain area, through the variation of wind speed with the height at tower 25#、28# can be described
by index law.

1# 4# 14#
15# 23# 29#
28# 25#
Fig. 4vertical wind profile of anemometer tower

4.4 Turbulence intensity
Turbulence intensity indicates the deviation between mean wind velocity and instantaneous wind
velocity, and it is the index to evaluate the air flow stability. Turbulence intensity relates to geographic
location, terrain, surface roughness, the type of weather systems and other factors.
Fig. 5 Turbulence intensity at 15m/s( 70m height)
Around the most wind towers, the turbulence intensity at 10 meters height layer is significantly higher
than the other layers. Above 50 meters, the turbulence intensity curves substantially coincide, and is the
minimum. The turbulence intensity distribution on different height layer is affect by the surface friction.
Because the influence of surface friction at 10m is greater than other height, the turbulence intensity at
10m layer is greatest.
General characteristics of each wind tower turbulence intensity change in different seasons, turbulence
intensity is strong in summer, and is weak in winter. In terms of diurnal variation, there is strong
turbulence intensity in the afternoon, and weak turbulence intensity in the night and the morning.
5. Analysis of Wind Energy Resources
In order to obtain the wind energy resource of Southwest China, it used WERAS / CMA numerical
simulation method to get a horizontal resolution 1 km × 1 km wind energy resource numerical
simulation results on different height layers.
In order to analyze the applicability of numerical simulation in southwestern China, the measured data
is used to compare with the simulation result. Five masts data in Sichuan province were selected to

analyze. Through comparing the annual average wind speed, wind power density, the frequency of
wind velocity and wind direction, we analyze the applicability of WERAS / CMA system in southwest
China's complex mountainous plateau.
Table 1. Anemometer tower at the average wind speed and wind power density relative error (%)
Anemoneter
tower
Altitude
Relative
error of
70m wind
velocity
Relative
error of
80m wind
velocity
Relative error of
70m wind power
density
Relative error of
70m wind
power density
7805 4138 -5.45 -5.75 -8.85 -8.20
7993 4409 3.60 -9.82 5.06 -5.00
7994 4161 -5.64 -6.02 6.57 5.90
8426 4169 -5.61 -6.15 8.09 7.69
8536 4175 -7.81 — 0.58 —
Table 1 shows the comparing error of the simulated and observed average wind speed and average
wind power density values of the WERAS / CMA system of wind towers at 70m and 80m height, this 5
Anemometer towers are located on mountain areaon an altitude of 4000meters, the relative error of
wind speed in the range of 3.60% -9.82%, wind power density error range of -8.85% - 8.09%. The
wind simulation results are basically consistent with the measured data, the measured analog values are
mostly slightly lower than the measured value due to model simulations of air density are slightly
higher than the actual value, which result in the wind power density analog values are slightly higher
than the measured values.
Table 2. Wind speed and wind direction frequency comparison
Anemometer
tower Comparison of wind speed frequency
Comparison of wind direction
frequency
7805
0
5
10
15
<1
.5 3 5 7 9
11
13
15
17
19
21
23
0
10
20
30N
NNE
NE
ENE
E
ESE
SE
SSES
SSW
SW
WS…
W
W…
NW
NN…
obs
simu

7993
8426
8536
Table 2 shows the comparison results between numerical simulation and measured valueof wind speed
frequency and wind direction frequency, the result shows WERAS / CMA system could simulate the
wind speed frequency and wind patterns well of plateau region on the altitude of 4000 meters above.
0
5
10
15
<1
.5 3 5 7 9
11
13
15
17
19
21
23
05
10152025
NNNE
NE
ENE
E
ESE
SE
SSES
SSW
SW
WSW
W
WNW
NW
NNW
obs
simu
0
3
6
9
12
15
<1
.5 3 5 7 9
11
13
15
17
19
21
23
0
10
20
30
40N
NNENE
ENE
E
ESE
SE
SSES
SSW
SW
WSW
W
WNW
NWNNW
obs
simu
0
5
10
15
<1
.5 3 5 7 9
11
13
15
17
19
21
23
obs
simu
0
10
20
30N
NNE
NE
ENE
E
ESE
SE
SSES
SSW
SW
WSW
W
WNW
NW
NNW
obs
simu

(A) Average wind speed (m / s) (B) the average wind power density
Fig. 6 The average wind speed and wind power density distribution of 70 meters height in Sichuan
Based on WERAS / CMA system to obtain the wind energy resource atlas at 1km * 1km level of
resolution, take Sichuan Province as an example, Figure 6 shows the average wind speed and wind
power density distribution of 70 meters height in Sichuan. Due tothe high altitude and complex terrain
of the region, so the level of wind energy resource distribution are quite different: the central Sichuan is
in lower elevation, so ithas relatively lower wind speed of 4.0m / s or less on average, and wind power
density of 100W / m2 or less; the western Sichuan has higher altitude and more complex terrain, so the
wind speed of 4.0 ~ 8.0m / s on average and the wind power density of 100 ~ 500 W / m2, and wind
resource-rich regionsare substantiallylocated on high altitude area; the wind speed in part of
mountainsin eastern Sichuan could achieve 6.0m / s, and wind power density could reach 300 W / m2.
6. Discussion and conclusion
Through the anemometer tower data and WERAS / CMA wind energy resource simulation system
to analyzethe wind resource characteristics of plateau region in southwest China, we could get the
following conclusions:
Southwest China has higher altitude, and the annual average air density is about 0.8kg / m3 above 4000
meters height,for the rest part, the air density is about 0.9 ~ 1.0 kg / m3;
Due to the complex terrain in southwest plateau areas, so most masts observed variation of wind
velocity with height disobedience exponentially;
3. When the wind velocity is 15m/s, the average turbulence intensity varied from 0.07 to 0.26.
Because of the complex terrain, there are large differences between every masts.
4. The WERAS / CMA numerical simulation of wind resource assessment systems can simulate the
characteristics of wind energy resources in southwest China plateau region.
The error of average wind speed and average wind power density of the simulated and measured results
is small, and the frequency of the wind speed and wind direction of the simulated results are consistent
with the measured values.
5. For Sichuan province, because of its complex topography, the distribution of wind energy resources
are quite different. The resource-rich region almost located substantially at the tall terrain.

Reference
Brower M C, Bailey B, Zack J. Applications and validations of the MesoMap system in different
climate regimes, paper presented at Windpower 2001, Am. Wind Energy Assoc., Washington,D.
C.
Chandrasekar A, Philbrick R, Clark B, et al Evaluating the performance of a computationally efficient
MM5/CALMET system for developing wind field inputs to air quality models [J]. Atmos.
Environ., 2003, 37: 3267-3276.
Douglas S G, Kessler P C. User’s guide to the diagnostic wind model (version 1.0), Systems
Applications Inc., San Rafael, Calif, CA. 1988.
Frank H P, Landberg L. 1997. Modeling the wind climate of Ireland. Bound -Layer Meteor, 85:
359–377
Grell D J, Stauffer D R. A description of the fifth generation Penn State/NCAR mesoscale model
(MM5) [R]. http://nldr.library.ucar.edu/collections/technotes/asset-000-000-000-214.pdf. 1995.
He X F, Zhou R W, Zhu R. 2009. Study on climatologic numerical simulation method of wind energy
resource//Advances in Industrial Aerodynamics. Changsha: Central South University Press,
124-129 (in Chinese)
Li Z C, Zhu R, He X F. 2007. Study on the assessment technology of wind energy resource. Acta
Meteor Sinica, 65(5): 708-717(in Chinese)
Rife D L, Vanvyve E, Pinto J O. 2013. Selecting representative days for more efficient dynamical
climate downscaling: application to wind energy. Journal of Applied Meteorology and
Climatology, 52: 47-63
Schwartz M, Elliott D. 2004. Validation of updated state wind resource maps for the Unite States.
National Renewable Energy Laboratory, NREL/CP-500-36200, 6 pp. [available online at
http://www.nrel.gov/docs/fy04osti/36200.pdf]
Warner T T, Kibler D F, Steinhart R L. Separate and coupled testing of meteorological and
hydrological forecasting models for the Susquehanna River Basin in Pennsylvania [J]. J. Appl.
Meteorol., 1991, 30: 1521–1533.
Yu W, Benoit R, Girard C. 2006. Wind Energy Simulation Toolkit (WEST): a wind mapping system
for use by the wind-energy industry. Wind Engineering, 30: 15-33
Zhang D, Zhu R, Luo Y. 2008. Application of wind energy simulation toolkit (WEST) to wind energy
numerical simulation of China. Plateau Meteorology, 27(1): 202-207(in Chinese)
Zhou R W, He X F, Zhu R. 2010. Application of MM5/Calmet Model System in Wind Energy
Resource Assessment. Journal of natural Resources, 25(12): 2101-2013(in Chinese)