Embed Size (px)
Citation preview

Journal of Physics Conference Series
OPEN ACCESS
Research on Linear Wireless Sensor NetworksUsed for Online Monitoring of Rolling Bearing inFreight TrainTo cite this article WANG Nan et al 2011 J Phys Conf Ser 305 012024
View the article online for updates and enhancements
You may also likeEvaluation key generator of MultipleAsymmetric methods in Wireless SensorNetwork (WSNs)Aseel Hamoud Hamza and Saif M Kh Al-Alak
-
Competition at the Wireless SensorNetwork MAC Layer Low Power Probinginterfering with X-MACSven Zacharias and Thomas Newe
-
Automatic reading recognition system ofpointer meters using WSNs with on-sensorimage processingLiqun Hou Quanjun Zhang andHuaisheng Qu
-
Recent citationsAsynchronous Resilient Wireless SensorNetwork for Train Integrity MonitoringMihai T Lazarescu and Pooya Poolad
-
Power Consumption Prediction Method forTrain-Health Monitoring Wireless SensorNetworksTomoki Kawamura et al
-
A Comparative Study of MAC protocols forLinear WSNsRadosveta Sokullu and Eren Demir
-
This content was downloaded from IP address 106167153226 on 05112021 at 1451
Research on Linear Wireless Sensor Networks Used for On-line Monitoring of Rolling Bearing in Freight Train
WANG Nan13 MENG Qingfeng1 Zheng Bin1 Li Tong2 and Ma Qinghai2 1Theory of Lubrication and Bearing Institute Xirsquoan Jiaotong University
Xirsquoan 710049 China
2Xirsquoan Rail Bureau Xirsquoan 710054 China
E-mail heroyoyu2009stuxjtueducn
Abstract This paper presents a Wireless Sensor Networks (WSNs) technique for the purpose of on-line monitoring of rolling bearing in freight train A new technical scheme including the arrangements of sensors the design of sensor nodes and base station routing protocols signal acquirement processing and transmission is described and an on-line monitoring system is established Considering the approximately linear arrangements of cars and the running state of freight train a linear topology structure of WSNs is adopted and five linear routing protocols are discussed in detail as to obtain the desired minimum energy consumption of WSNs By analysing the simulation results an optimal multi-hop routing protocol named sub-section routing protocol according to equal distance is adopted in which all sensor nodes are divided into different groups according to the equal transmission distance the optimal transmission distance and number of hops of routing protocol are also studied We know that the communication consumes significant power in WSNs so in order to save the limit power supply of WSNs the data compression and coding scheme based on lifting integer wavelet and embedded zerotree wavelet (EZW) algorithms is studied to reduce the amounts of data transmitted The experimental results of rolling bearing have been given at last to verify the effectiveness of data compression algorithm The on-line monitoring system of rolling bearing in freight train will be applied to actual application in the near future
1 Introduction Rolling bearing is widely used in freight train as an important component and the fault of it affects the safety operation of freight train seriously With the development of speed-raising and overload about freight train how to timely forecast the breakdowns of freight train is an urgent task facing us During the high speed running of freight train the heat generated by friction between axle and bearing will raise the axle temperature Especially when the bearing is defective the defects and temperature rise will promote each other which can damage the bearing cause the burning shaft and cutting shaft and even lead to the train diriment
Over the past decades trackside monitoring techniques such as infrared and acoustic monitoring 3 Corresponding author Corresponding address Theory of Lubrication and Bearing Institute Xirsquoan Jiaotong University Xian Ning West Road 28 Bei Lin Zone Xirsquoan 710049 China
9th International Conference on Damage Assessment of Structures (DAMAS 2011) IOP PublishingJournal of Physics Conference Series 305 (2011) 012024 doi1010881742-65963051012024
Published under licence by IOP Publishing Ltd 1
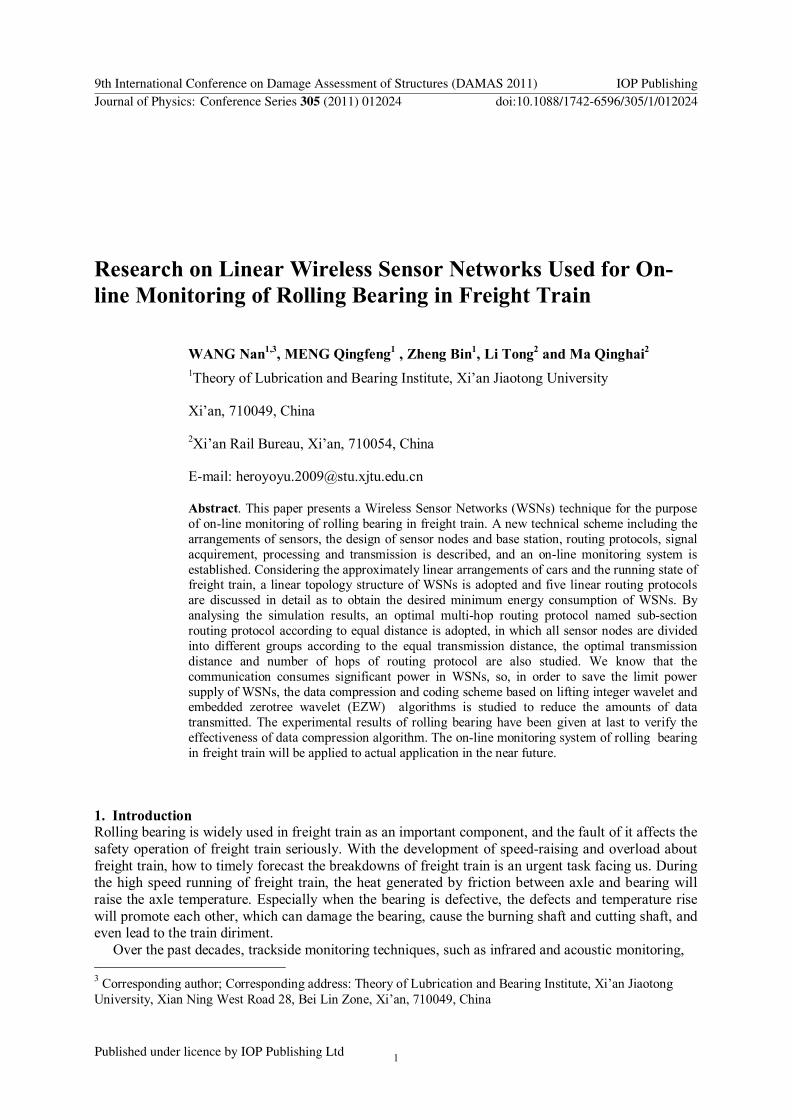
have been developed to monitor the rolling bearing in freight train but these techniques could not well be applied because of false positives and false frequently On the other hand onboard monitoring techniques can not be used to freight train because the cars of freight train are unattended assembled frequently and have no steady power supply In this paper we propose a WSNs technique for on-line monitoring of rolling bearing in freight train and establish a measurement system Figure 1 shows the model of freight train and the arrangements of sensor nodes
Base stationSensor nodeExternal sensor
Figure 1 The model of freight train and the arrangements of sensor nodes Figure 2 shows the measurement scheme of rolling bearing in freight train As shown in figure 2
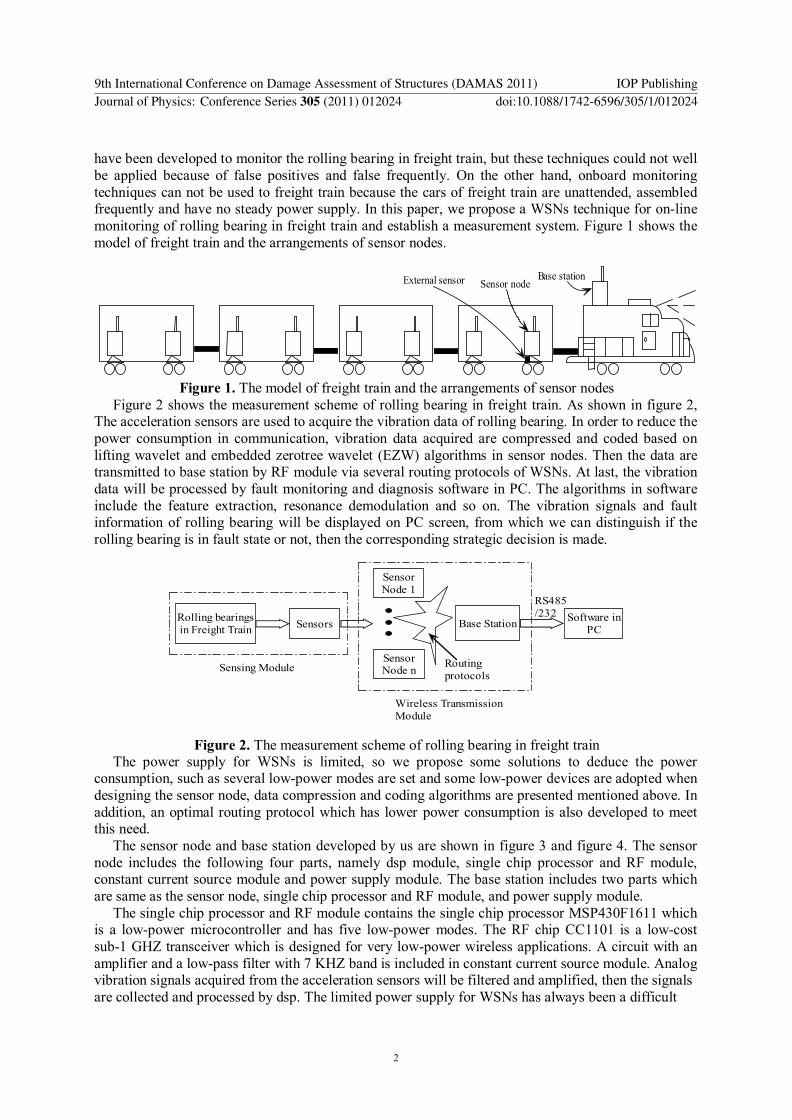
The acceleration sensors are used to acquire the vibration data of rolling bearing In order to reduce the power consumption in communication vibration data acquired are compressed and coded based on lifting wavelet and embedded zerotree wavelet (EZW) algorithms in sensor nodes Then the data are transmitted to base station by RF module via several routing protocols of WSNs At last the vibration data will be processed by fault monitoring and diagnosis software in PC The algorithms in software include the feature extraction resonance demodulation and so on The vibration signals and fault information of rolling bearing will be displayed on PC screen from which we can distinguish if the rolling bearing is in fault state or not then the corresponding strategic decision is made
Rolling bearingsin Freight Train Sensors
SensorNode 1
SensorNode n
Base Station Software inPC
Sensing Module
Wireless TransmissionModule
RS485232
Routingprotocols
Figure 2 The measurement scheme of rolling bearing in freight train The power supply for WSNs is limited so we propose some solutions to deduce the power
consumption such as several low-power modes are set and some low-power devices are adopted when designing the sensor node data compression and coding algorithms are presented mentioned above In addition an optimal routing protocol which has lower power consumption is also developed to meet this need
The sensor node and base station developed by us are shown in figure 3 and figure 4 The sensor node includes the following four parts namely dsp module single chip processor and RF module constant current source module and power supply module The base station includes two parts which are same as the sensor node single chip processor and RF module and power supply module
The single chip processor and RF module contains the single chip processor MSP430F1611 which is a low-power microcontroller and has five low-power modes The RF chip CC1101 is a low-cost sub-1 GHZ transceiver which is designed for very low-power wireless applications A circuit with an amplifier and a low-pass filter with 7 KHZ band is included in constant current source module Analog vibration signals acquired from the acceleration sensors will be filtered and amplified then the signals are collected and processed by dsp The limited power supply for WSNs has always been a difficult
9th International Conference on Damage Assessment of Structures (DAMAS 2011) IOP PublishingJournal of Physics Conference Series 305 (2011) 012024 doi1010881742-65963051012024
2
Figure 3 Sensor node Figure 4 Base station problem Battery is widely used but it is not well suitable for the on-line monitoring system of rolling bearing in freight train using linear WSNs because that the battery power is easily exhausted and the freight train is unattended So the scheme of piezoelectric cantilever beam vibration dynamo is proposed The piezoelectric material and the energy harvesting circuit are used in vibration dynamo to collect the vibration energy which is generated during the operation of freight train then the power supply problem can be better resolved In initial we do still use battery to supply power for WSNs the vibration dynamo is being studied and developed
2 Linear routing protocols Many routing protocols of WSNs are proposed and used widely now such as SPIN (Sensor Protocols for Information via Negotiation) SAR (Sequential Assignment Routing) DD (Directed Diffusion) LEACH (Low-Energy Adaptive Clustering Hierarchy) TEEN (Threshold Sensitive Energy Efficient Sensor Network Protocol) and PEGASIS (Power-Efficient Gathering Sensor Information System) But these routing protocols are not well used on monitoring of rolling bearing in freight train because that the car and running state of freight train are approximately linear the arrangements of nodes are fixed not random The corresponding linear topology and linear routing protocols are developed Figure 5 shows the linear topology structure of WSNs
dn d5 d4 d3 d2 d1
Nn Nn-1 N5 N4 N3 N2 N1
Figure 5 The linear topology structure of WSNs Power consumption is also the key issue to consider when designing the routing protocols because
of communication consumes significant power in WSNs Each node in WSNs may play a dual role data processor or router In order to save and balance the limited power of WSNs we therefore focus on the communication-related power consumption of the sensor nodes and adopt a widely-used energy model in Ref[4] Figure 6 shows the block diagram of energy model We will use the energy model to evaluate the power consumption of five linear routing protocols later
21 Energy model
9th International Conference on Damage Assessment of Structures (DAMAS 2011) IOP PublishingJournal of Physics Conference Series 305 (2011) 012024 doi1010881742-65963051012024
3
TransmittingEquipment
SignalAmplifier
Ptx(rd)
txrk elecrkd
k bit packet
ReceivingEquipment
Prx(r)
rxrk
k bit packet
d
Figure 6 The block diagram of energy model
P ( ( )tx tx elecr d rk d ) (1)
P (rx rxr rk) (2)
P ( ) ( )relay elecr d rk d tx rx (3)
Where ( )txP r d in equation (1) is the transmitter power for a sensor node to transmit k bit-stream of rate r over a distance d tx is the energy per bit consumed in the transmitter circuit and
elec accounts for the energy dissipated in the signal amplifier The path loss exponent typically ranges between 2 and 6 it is closer to 2 if there is a perfect line-of-sight between transmitter and receiver and can go up to 6 in dense urban areas ( )rxP r d in equation (2) is the receiver power for a sensor node to receive k bit-stream of rate r over a distance d rx is the energy per bit consumed by the receiver circuit ( )relayP r d in equation (3) is the power consumption when sensor nodes send and receive data simultaneously Generally when a WSNs is established the parameters r
elec are constant Then we can find that the power consumption ( )txP r d ( )rxP r d and ( )relayP r d are only related to parameters k and d When k is constant the power consumption will increase with the transmission distance d increasing When d is constant the power consumption will increase with the transmission data bit k increasing
22 Five linear routing protocols Figure 7 shows the five linear routing protocols they are single-hop routing multi-hop routing
multi-hop sub-cluster routing according to equal distance multi-hop sub-section routing according to changing distance multi-hop sub-section routing according to equal distance Figure 8 shows the simulation results of power consumption of each routing protocol using the energy model above
Simulation parameters 50 tx rx nJ bit
10 elec pJ bit m 2 9600 r bit s
The freight train in China always has 60 cars the length of each car is 11 m There are 8 bearings in each car namely 8 measuring points so 2 sensor nodes needed (4 channels per node) as shown in figure (1) The total number of sensor nodes is 120 Suppose that the distance d between nodes is equal 7d m
The single-hop routing shown in figure 7 (a) is not suitable for the WSNs which is used for monitoring of rolling bearing in freight train because that the power consumption of nodes will be
9th International Conference on Damage Assessment of Structures (DAMAS 2011) IOP PublishingJournal of Physics Conference Series 305 (2011) 012024 doi1010881742-65963051012024
4
larger with the increasing distance d between nodes and base station The nodes of multi-hop routing shown in figure 7 (b) need to transmit data one by one the node which is close to base station has more data to transmit and has more power consumption so the node will fail quickly We can easily see that the node power consumption of sub-cluster routing shown in figure 7 (c) is not balanced the cluster head node has much more power consumption because it need to transmit more data other nodes have little power consumption As shown in figure 8 (a) with the distance d increasing from 28m to 140m the power consumption of cluster head nodes is larger than before When the cluster head node is far away from base station power consumption is getting smaller because of the reduced amount of data transmitted The variable transmission distance routing protocol is proposed and researched by Zach Shelby in Ref[4] and Hong Li in Ref[7] the distance between nodes is changing in data transmission process When node is closer to base station the shorter transmission distance it has According to their views the arrangements of network nodes are random and can be moved but this is not suitable for monitoring of rolling bearing in freight train because the nodes of freight train are fixed and the distance between them are constant Then we present a new routing protocol based on the variable transmission distance routing protocol to balance the power consumption of network as shown in figure 7 (d) The nodes in this routing protocol are divided into many groups according to the changing distance 1d 2d hellip and so on As the distance decreases the nodes of each group reduce and the first node has more energy consumption just like a cluster head node
N12 N10 N1N2N3N4N5N6N7N8N9N11
N12 N10 N1N2N3N4N5N6N7N8N9N11
N12 N10 N1N2N3N4N5N6N7N8N9N11
N12 N10 N1N2N3N4N5N6N7N8N9N11
N12 N10 N1N2N3N4N5N6N7N8N9N11
GROUP1GROUP2
d
Base station
Base station
Base station
Base station
Base station
GROUP1GROUP2GROUP3GROUP4
GROUP1GROUP2
d
d1d2d3d4
(a)
(b)
(c)
(d)
(e)
Figure 7 Five linear routing protocols Figure 8 (c) shows the power consumption of the sub-section routing protocol according to
changing distance (black curve) the power consumption of first node in each group is larger than other nodes In every group the power consumption of each node except for the first one is equal Compared to figure 8 (a) the power consumption of cluster head nodes reduce numerously but it is still too large The optimal routing protocol is shown in figure 7 (e) this is the improvement of the fourth routing protocol which is named sub-section routing protocol according to equal distance In this routing protocol the transmission distances between groups are equal figure 8 (b) shows the simulation results Because there are no cluster heads the power consumption of nodes in each group of this routing is equal and more balanced compared to the third and fourth one in figure 7 as shown
9th International Conference on Damage Assessment of Structures (DAMAS 2011) IOP PublishingJournal of Physics Conference Series 305 (2011) 012024 doi1010881742-65963051012024
5
in figure 8 (a) (b) and (c) The figure 8 (c) is the comparison between two routing protocols in figure 7 (d) and (e) obviously because that the cluster head consumes most power from first node to 60 node we can find that each ladder shape of black curve is lower than red curve the power consumption of routing protocol in figure 7 (d) is so unbalanced In figure 8 (b) and (c) every curve has the ladder shape except for the beginning section the shape of the beginning section is rising because that the nodes of the first group transmit data to base station over various distances (as the broken line in figure 7 (d) and (e) detected)
Figure 8 Power consumption of different routing
protocols
23 Optimal transmission distance and number of hops For the optimal routing protocol in figure 7 (e) in order to achieve the optimal energy consumption
we still need to calculate the optimal transmission distance and optimal number of hops The optimal routing is proposed by Marco Zimmerling in Ref[8] In this paper minimum energy paths are researched the formulas of optimal transmission distance and number of hops are given
optopt
DKd
or opt
Dd
(4)
(a)
(b)
(c)
9th International Conference on Damage Assessment of Structures (DAMAS 2011) IOP PublishingJournal of Physics Conference Series 305 (2011) 012024 doi1010881742-65963051012024
6
( 1)optelec
d
(5)
In equation (4) where D is the distance from last sensor node to base station namely the length of entire linear WSNs According to the simulation parameters mentioned above we can derive
7 120 840D m The other parameters are all the same with the simulation above The optimal transmission optd then can be obtained
6
9
100 10 ( ) 100 ( )( 1) 10 10 ( )opt
elec
mJd mmJ
(6)
The optimal number of hops can be obtained by using the following algorithm Input D optd
Output optK 1 Let optm D d and optD d m
2 0t (initialize auxiliary variable t ) 3 if 2 then
4 2t m m m 5 end if 6 0optK (initialize optK ) 7 if t then 8 optK m 9 else 10 1optK m 11 end if 12 return optK
Then 840 100 8optm D d 2 0484t m m m 04optD d m Because
t 8optK m Then the 120 nodes will be divided into 8 groups there are 15 nodes in each group and the actual transmission distance is 105m which is very close to the theoretical optimal transmission distance optd (100m) In figure 8 (c) the maximum distance is just 105m other distance decrease by a node spacing (7m) in turn In figure 8 (b) we can easily find that when transmission distance 105d m (red curve) each ladder section of the curve is lower than others the power of nodes in WSNs is saved
3 Data compression scheme Taking the limited power supply of WSNs into account we reduce the large amounts of data transmitted by using some data compression algorithms such as lifting integer wavelet and EZW so the energy of WSNs will be saved The data compression scheme is shown in figure 9
The data collected from acceleration sensors is first decomposed by lifting integer wavelet the wavelet coefficients acquired after decomposition are processed by setting different thresholds some unimportant coefficients are discarded Then the important wavelet coefficients are compressed and coded by EZW and transmitted to receiver nodes including the base station Lastly the data compressed and coded is sent to the software in PC where the data will be decoded and decompressed the signal will be reconstructed by lifting integer wavelet
The embedded zerotree wavelet (EZW) is proposed by Jerome M Shapiro in Ref[5] It is a two- dimensional image compression algorithm which is used for image processing in initial We develop the algorithm which can be used for one-dimensional vibration data compression In EZW a new data
9th International Conference on Damage Assessment of Structures (DAMAS 2011) IOP PublishingJournal of Physics Conference Series 305 (2011) 012024 doi1010881742-65963051012024
7
Data need to becompressed
Multi-layerdecomposition of
lifting wavelet
Processing forthreshold of wavelet
coefficients
EZW compressionand coding
Datatransmission
Decodingand
Dcompression
Multi-layer inversetransform of lifting
wavelet
Data recovery
Figure 9 Flow chart of data compression scheme structure called a zerotree is defined Four symbols are used in EZW 1) zerotree root 2) isolated zero 3) positive significant and 4) negative significant
Given a threshold T to determine whether or not a coefficient x is significant If |x|gtT it is significant else if |x|ltT it is insignificant The x is said to be an element of a zerotree if itself and all of its descendants are insignificant it is also said to be zerotree root for threshold T If the x is insignificant and its descendants are significant it is said to be isolated zero Only the significant coefficient can be quantized and coded During the process of quantization and coding threshold T will be halved continually With the threshold T decreasing the reconstructed signal has higher accuracy and the corresponding compression ratio is lower than before The advantage of EZW is the variable and high compression ratio
We present evaluation criteria to evaluate the effectiveness of EZW Compression ratio (CR) and percent root mean square difference (PRD) are defined as follows
N O BC RN C B
(7)
1 22
n 1
2
1
( ( ) ( ))1 00
( )
N
N
n
x n x nP R D
x n
(8)
In equation (7) NOB is the number of bits occupied by original signal and NCB is the number of bits occupied by compressed signal In equation (8) ( )x n is the sampled values of original signal and
( )x n is the sampled values of reconstructed signal N is the number of sampled points The relationships among T CR and PRD under different wavelet levels are shown in figure 10 We
can see easily that CR and PRD increases with T increasing they are proportional Different lifting wavelet decomposition level is in fact very important to affect the compression result As shown in figure 10 5 levels wavelet decomposition achieves the best performance When the same threshold T is given the higher CR and the lower PRD can be found from the 5 levels wavelet decomposition curve compared to the other two (as the notes in figure 10 detected)
In order to verify the effectiveness of compression algorithm the monitoring experiment of rolling bearing is done and some vibration data of rolling bearing which is in normal state are acquired The sampling frequency is 20 KHZ and the sampling points are 2048 Figure 11 shows the original vibration signal and itrsquos spectrum the signal after compression and reconstruction by EZW and itrsquos spectrum (5 levels wavelet decomposition CR=6)
9th International Conference on Damage Assessment of Structures (DAMAS 2011) IOP PublishingJournal of Physics Conference Series 305 (2011) 012024 doi1010881742-65963051012024
8
Figure 10 ThresholdCRPRD under different wavelet
decomposition levels
Figure 11 Original signal and reconstruction signal (CR=6) Compare the signals in time domain we find that about 342 points of signal are reserved and the
main components of vibration signals are not lost at several time points (such as 001 hellip 008s and so on) after compression and reconstruction but the amplitudes of them change in different degrees Compare the signal spectrum in spectrum domain we can see that the main frequency components (500 hellip 2750HZ) of signal are not lost yet after the compression and reconstruction but the amplitudes of them reduce considerably In the process of signal compression and reconstruction the unimportant components are deleted and some noise may be interfused all of these will affect the signal after reconstruction But if the main information of signal is reserved the accuracy and the distortion of reconstructed signal will be under control With such a high compression ratio the small amounts of data transmitted will be achieved without heavy burden to dsp and the network energy will be saved
4 Conclusions
9th International Conference on Damage Assessment of Structures (DAMAS 2011) IOP PublishingJournal of Physics Conference Series 305 (2011) 012024 doi1010881742-65963051012024
9
In this paper an on-line monitoring system of rolling bearing in freight train using linear WSNs is established The structures of sensor nodes and base station have been described Considering the structure and running condition of freight train the linear topology and 5 routing protocols of WSNs are proposed The data compression and coding scheme are presented to save the limited power of WSNs By analysing the simulation results the optimal routing protocol which is named multi-hop sub-section according to equal distance is adopted The theoretical optimal transmission distance ( 100optd m ) and number of hops ( 8optK ) are obtained through several algorithms At last we verify the effectiveness of compression algorithm by analysing the experimental vibration data of rolling bearing the results of data compression by lifting integer wavelet and EZW can meet the designed requirements So far some tests about the monitoring system have already been carried out In the near future the system of WSNs will be used in monitoring the operation of rolling bearing in freight train The research of other applications is also under study now
References [1] Wei Zhou Thomas G Habetler and Ronald G Harley 2007 Bearing Condition Monitoring
Methods for Electric Machines A General Review 1-6 [2] Office of Research and Development Washington DC 20590 2003 Acoustic Detection of
Railcar Roller Bearing Defects Phase 1 Laboratory Test [3] Ashraf Hossain T Radhika et al An Approach to Increase the Lifetime of a Linear Array of
Wireless Sensor Nodes 2008 Int J Wireless Inf Networks vol 15 p 72ndash81 [4] Zach Shelby Carlos Pomalaza-Raez et al Energy Optimization in Multihop Wireless
Embedded and Sensor Networks 2005 Int J Wireless Inf Networks vol 12 p 11-21 [5] Jerome M Shapiro Embedded Image Coding Using Zerotrees of Wavelet Coefficients 1993
IEEE Transactions on Signal Processing 41 3445-62 [6] Dr John Donelson lll Dr Ronald L Dicus Bearing Defect Detection Using on-board
Accelerometer Measurements 2002 Proc of the 2002 ASMEIEEE Joint Rail Conf (Washington DC) pp 95-102
[7] Hong Li Xu Shunjie Energy-Efficient Node Placement in Linear Wireless Sensor Networks 2010 Int Conf On Measuring Technology and Mechatronics Automation p 104-107
[8] Marco Zimmerling Waltenegus Dargie and Johnathan M Reason 2007 Energy-Efficient Routing in Linear Wireless Sensor Networks
[9] OD Snell I Nairne Acoustic Bearing Monitoring ndashThe Future RCM 2008 2008 [10] Marco Zimmerling Waltenegus Dargie and Johnathan M Reason Localized Power-Aware
Routing in Linear Wireless Sensor Networks 2008 CASEMANS rsquo08 (Sydney Australia) [11] William H Sneed Richard L Smith On-Board Real-Time Railroad Bearing Defect Detection
and Monitoring p 149-153 [12] Q Gao KJ Blow et al Radio range adjustment for energy efficient wireless sensor networks
2006 Ad Hoc Networks vol 4 75-82 [13] Bin Zhang Georgios Georgoulas et al Rolling Element Bearing Feature Extraction and
Anomaly Detection Based on Vibration Monitoring 2008 16th Mediterranean Conf on Control and Automation Congress Centre (Ajaccio France) p 1792-1797
[14] Mark CEdwards John Donefson III Improving freight rail safety with on-board monitoring and control systems 2005 Proc of Joint Rail Conf p 117-122
[15] IStojmenovic and XLin Power-aware localized routing in wireless networks IEEE Transactions on Parallel and Distributed Systems 2001 vol 12 p 1122-1133
Acknowledgements The work was funded by the National science Foundation of China (NO50875196) and the National Basis Research Program of China (NO2009CB724304) The authors would like to thank the reviewers for their valuable comments on this paper
9th International Conference on Damage Assessment of Structures (DAMAS 2011) IOP PublishingJournal of Physics Conference Series 305 (2011) 012024 doi1010881742-65963051012024
10
Research on Linear Wireless Sensor Networks Used for On-line Monitoring of Rolling Bearing in Freight Train
WANG Nan13 MENG Qingfeng1 Zheng Bin1 Li Tong2 and Ma Qinghai2 1Theory of Lubrication and Bearing Institute Xirsquoan Jiaotong University
Xirsquoan 710049 China
2Xirsquoan Rail Bureau Xirsquoan 710054 China
E-mail heroyoyu2009stuxjtueducn
Abstract This paper presents a Wireless Sensor Networks (WSNs) technique for the purpose of on-line monitoring of rolling bearing in freight train A new technical scheme including the arrangements of sensors the design of sensor nodes and base station routing protocols signal acquirement processing and transmission is described and an on-line monitoring system is established Considering the approximately linear arrangements of cars and the running state of freight train a linear topology structure of WSNs is adopted and five linear routing protocols are discussed in detail as to obtain the desired minimum energy consumption of WSNs By analysing the simulation results an optimal multi-hop routing protocol named sub-section routing protocol according to equal distance is adopted in which all sensor nodes are divided into different groups according to the equal transmission distance the optimal transmission distance and number of hops of routing protocol are also studied We know that the communication consumes significant power in WSNs so in order to save the limit power supply of WSNs the data compression and coding scheme based on lifting integer wavelet and embedded zerotree wavelet (EZW) algorithms is studied to reduce the amounts of data transmitted The experimental results of rolling bearing have been given at last to verify the effectiveness of data compression algorithm The on-line monitoring system of rolling bearing in freight train will be applied to actual application in the near future
1 Introduction Rolling bearing is widely used in freight train as an important component and the fault of it affects the safety operation of freight train seriously With the development of speed-raising and overload about freight train how to timely forecast the breakdowns of freight train is an urgent task facing us During the high speed running of freight train the heat generated by friction between axle and bearing will raise the axle temperature Especially when the bearing is defective the defects and temperature rise will promote each other which can damage the bearing cause the burning shaft and cutting shaft and even lead to the train diriment
Over the past decades trackside monitoring techniques such as infrared and acoustic monitoring 3 Corresponding author Corresponding address Theory of Lubrication and Bearing Institute Xirsquoan Jiaotong University Xian Ning West Road 28 Bei Lin Zone Xirsquoan 710049 China
9th International Conference on Damage Assessment of Structures (DAMAS 2011) IOP PublishingJournal of Physics Conference Series 305 (2011) 012024 doi1010881742-65963051012024
Published under licence by IOP Publishing Ltd 1
have been developed to monitor the rolling bearing in freight train but these techniques could not well be applied because of false positives and false frequently On the other hand onboard monitoring techniques can not be used to freight train because the cars of freight train are unattended assembled frequently and have no steady power supply In this paper we propose a WSNs technique for on-line monitoring of rolling bearing in freight train and establish a measurement system Figure 1 shows the model of freight train and the arrangements of sensor nodes
Base stationSensor nodeExternal sensor
Figure 1 The model of freight train and the arrangements of sensor nodes Figure 2 shows the measurement scheme of rolling bearing in freight train As shown in figure 2
The acceleration sensors are used to acquire the vibration data of rolling bearing In order to reduce the power consumption in communication vibration data acquired are compressed and coded based on lifting wavelet and embedded zerotree wavelet (EZW) algorithms in sensor nodes Then the data are transmitted to base station by RF module via several routing protocols of WSNs At last the vibration data will be processed by fault monitoring and diagnosis software in PC The algorithms in software include the feature extraction resonance demodulation and so on The vibration signals and fault information of rolling bearing will be displayed on PC screen from which we can distinguish if the rolling bearing is in fault state or not then the corresponding strategic decision is made
Rolling bearingsin Freight Train Sensors
SensorNode 1
SensorNode n
Base Station Software inPC
Sensing Module
Wireless TransmissionModule
RS485232
Routingprotocols
Figure 2 The measurement scheme of rolling bearing in freight train The power supply for WSNs is limited so we propose some solutions to deduce the power
consumption such as several low-power modes are set and some low-power devices are adopted when designing the sensor node data compression and coding algorithms are presented mentioned above In addition an optimal routing protocol which has lower power consumption is also developed to meet this need
The sensor node and base station developed by us are shown in figure 3 and figure 4 The sensor node includes the following four parts namely dsp module single chip processor and RF module constant current source module and power supply module The base station includes two parts which are same as the sensor node single chip processor and RF module and power supply module
The single chip processor and RF module contains the single chip processor MSP430F1611 which is a low-power microcontroller and has five low-power modes The RF chip CC1101 is a low-cost sub-1 GHZ transceiver which is designed for very low-power wireless applications A circuit with an amplifier and a low-pass filter with 7 KHZ band is included in constant current source module Analog vibration signals acquired from the acceleration sensors will be filtered and amplified then the signals are collected and processed by dsp The limited power supply for WSNs has always been a difficult
9th International Conference on Damage Assessment of Structures (DAMAS 2011) IOP PublishingJournal of Physics Conference Series 305 (2011) 012024 doi1010881742-65963051012024
2
Figure 3 Sensor node Figure 4 Base station problem Battery is widely used but it is not well suitable for the on-line monitoring system of rolling bearing in freight train using linear WSNs because that the battery power is easily exhausted and the freight train is unattended So the scheme of piezoelectric cantilever beam vibration dynamo is proposed The piezoelectric material and the energy harvesting circuit are used in vibration dynamo to collect the vibration energy which is generated during the operation of freight train then the power supply problem can be better resolved In initial we do still use battery to supply power for WSNs the vibration dynamo is being studied and developed
2 Linear routing protocols Many routing protocols of WSNs are proposed and used widely now such as SPIN (Sensor Protocols for Information via Negotiation) SAR (Sequential Assignment Routing) DD (Directed Diffusion) LEACH (Low-Energy Adaptive Clustering Hierarchy) TEEN (Threshold Sensitive Energy Efficient Sensor Network Protocol) and PEGASIS (Power-Efficient Gathering Sensor Information System) But these routing protocols are not well used on monitoring of rolling bearing in freight train because that the car and running state of freight train are approximately linear the arrangements of nodes are fixed not random The corresponding linear topology and linear routing protocols are developed Figure 5 shows the linear topology structure of WSNs
dn d5 d4 d3 d2 d1
Nn Nn-1 N5 N4 N3 N2 N1
Figure 5 The linear topology structure of WSNs Power consumption is also the key issue to consider when designing the routing protocols because
of communication consumes significant power in WSNs Each node in WSNs may play a dual role data processor or router In order to save and balance the limited power of WSNs we therefore focus on the communication-related power consumption of the sensor nodes and adopt a widely-used energy model in Ref[4] Figure 6 shows the block diagram of energy model We will use the energy model to evaluate the power consumption of five linear routing protocols later
21 Energy model
9th International Conference on Damage Assessment of Structures (DAMAS 2011) IOP PublishingJournal of Physics Conference Series 305 (2011) 012024 doi1010881742-65963051012024
3
TransmittingEquipment
SignalAmplifier
Ptx(rd)
txrk elecrkd
k bit packet
ReceivingEquipment
Prx(r)
rxrk
k bit packet
d
Figure 6 The block diagram of energy model
P ( ( )tx tx elecr d rk d ) (1)
P (rx rxr rk) (2)
P ( ) ( )relay elecr d rk d tx rx (3)
Where ( )txP r d in equation (1) is the transmitter power for a sensor node to transmit k bit-stream of rate r over a distance d tx is the energy per bit consumed in the transmitter circuit and
elec accounts for the energy dissipated in the signal amplifier The path loss exponent typically ranges between 2 and 6 it is closer to 2 if there is a perfect line-of-sight between transmitter and receiver and can go up to 6 in dense urban areas ( )rxP r d in equation (2) is the receiver power for a sensor node to receive k bit-stream of rate r over a distance d rx is the energy per bit consumed by the receiver circuit ( )relayP r d in equation (3) is the power consumption when sensor nodes send and receive data simultaneously Generally when a WSNs is established the parameters r
elec are constant Then we can find that the power consumption ( )txP r d ( )rxP r d and ( )relayP r d are only related to parameters k and d When k is constant the power consumption will increase with the transmission distance d increasing When d is constant the power consumption will increase with the transmission data bit k increasing
22 Five linear routing protocols Figure 7 shows the five linear routing protocols they are single-hop routing multi-hop routing
multi-hop sub-cluster routing according to equal distance multi-hop sub-section routing according to changing distance multi-hop sub-section routing according to equal distance Figure 8 shows the simulation results of power consumption of each routing protocol using the energy model above
Simulation parameters 50 tx rx nJ bit
10 elec pJ bit m 2 9600 r bit s
The freight train in China always has 60 cars the length of each car is 11 m There are 8 bearings in each car namely 8 measuring points so 2 sensor nodes needed (4 channels per node) as shown in figure (1) The total number of sensor nodes is 120 Suppose that the distance d between nodes is equal 7d m
The single-hop routing shown in figure 7 (a) is not suitable for the WSNs which is used for monitoring of rolling bearing in freight train because that the power consumption of nodes will be
9th International Conference on Damage Assessment of Structures (DAMAS 2011) IOP PublishingJournal of Physics Conference Series 305 (2011) 012024 doi1010881742-65963051012024
4
larger with the increasing distance d between nodes and base station The nodes of multi-hop routing shown in figure 7 (b) need to transmit data one by one the node which is close to base station has more data to transmit and has more power consumption so the node will fail quickly We can easily see that the node power consumption of sub-cluster routing shown in figure 7 (c) is not balanced the cluster head node has much more power consumption because it need to transmit more data other nodes have little power consumption As shown in figure 8 (a) with the distance d increasing from 28m to 140m the power consumption of cluster head nodes is larger than before When the cluster head node is far away from base station power consumption is getting smaller because of the reduced amount of data transmitted The variable transmission distance routing protocol is proposed and researched by Zach Shelby in Ref[4] and Hong Li in Ref[7] the distance between nodes is changing in data transmission process When node is closer to base station the shorter transmission distance it has According to their views the arrangements of network nodes are random and can be moved but this is not suitable for monitoring of rolling bearing in freight train because the nodes of freight train are fixed and the distance between them are constant Then we present a new routing protocol based on the variable transmission distance routing protocol to balance the power consumption of network as shown in figure 7 (d) The nodes in this routing protocol are divided into many groups according to the changing distance 1d 2d hellip and so on As the distance decreases the nodes of each group reduce and the first node has more energy consumption just like a cluster head node
N12 N10 N1N2N3N4N5N6N7N8N9N11
N12 N10 N1N2N3N4N5N6N7N8N9N11
N12 N10 N1N2N3N4N5N6N7N8N9N11
N12 N10 N1N2N3N4N5N6N7N8N9N11
N12 N10 N1N2N3N4N5N6N7N8N9N11
GROUP1GROUP2
d
Base station
Base station
Base station
Base station
Base station
GROUP1GROUP2GROUP3GROUP4
GROUP1GROUP2
d
d1d2d3d4
(a)
(b)
(c)
(d)
(e)
Figure 7 Five linear routing protocols Figure 8 (c) shows the power consumption of the sub-section routing protocol according to
changing distance (black curve) the power consumption of first node in each group is larger than other nodes In every group the power consumption of each node except for the first one is equal Compared to figure 8 (a) the power consumption of cluster head nodes reduce numerously but it is still too large The optimal routing protocol is shown in figure 7 (e) this is the improvement of the fourth routing protocol which is named sub-section routing protocol according to equal distance In this routing protocol the transmission distances between groups are equal figure 8 (b) shows the simulation results Because there are no cluster heads the power consumption of nodes in each group of this routing is equal and more balanced compared to the third and fourth one in figure 7 as shown
9th International Conference on Damage Assessment of Structures (DAMAS 2011) IOP PublishingJournal of Physics Conference Series 305 (2011) 012024 doi1010881742-65963051012024
5
in figure 8 (a) (b) and (c) The figure 8 (c) is the comparison between two routing protocols in figure 7 (d) and (e) obviously because that the cluster head consumes most power from first node to 60 node we can find that each ladder shape of black curve is lower than red curve the power consumption of routing protocol in figure 7 (d) is so unbalanced In figure 8 (b) and (c) every curve has the ladder shape except for the beginning section the shape of the beginning section is rising because that the nodes of the first group transmit data to base station over various distances (as the broken line in figure 7 (d) and (e) detected)
Figure 8 Power consumption of different routing
protocols
23 Optimal transmission distance and number of hops For the optimal routing protocol in figure 7 (e) in order to achieve the optimal energy consumption
we still need to calculate the optimal transmission distance and optimal number of hops The optimal routing is proposed by Marco Zimmerling in Ref[8] In this paper minimum energy paths are researched the formulas of optimal transmission distance and number of hops are given
optopt
DKd
or opt
Dd
(4)
(a)
(b)
(c)
9th International Conference on Damage Assessment of Structures (DAMAS 2011) IOP PublishingJournal of Physics Conference Series 305 (2011) 012024 doi1010881742-65963051012024
6
( 1)optelec
d
(5)
In equation (4) where D is the distance from last sensor node to base station namely the length of entire linear WSNs According to the simulation parameters mentioned above we can derive
7 120 840D m The other parameters are all the same with the simulation above The optimal transmission optd then can be obtained
6
9
100 10 ( ) 100 ( )( 1) 10 10 ( )opt
elec
mJd mmJ
(6)
The optimal number of hops can be obtained by using the following algorithm Input D optd
Output optK 1 Let optm D d and optD d m
2 0t (initialize auxiliary variable t ) 3 if 2 then
4 2t m m m 5 end if 6 0optK (initialize optK ) 7 if t then 8 optK m 9 else 10 1optK m 11 end if 12 return optK
Then 840 100 8optm D d 2 0484t m m m 04optD d m Because
t 8optK m Then the 120 nodes will be divided into 8 groups there are 15 nodes in each group and the actual transmission distance is 105m which is very close to the theoretical optimal transmission distance optd (100m) In figure 8 (c) the maximum distance is just 105m other distance decrease by a node spacing (7m) in turn In figure 8 (b) we can easily find that when transmission distance 105d m (red curve) each ladder section of the curve is lower than others the power of nodes in WSNs is saved
3 Data compression scheme Taking the limited power supply of WSNs into account we reduce the large amounts of data transmitted by using some data compression algorithms such as lifting integer wavelet and EZW so the energy of WSNs will be saved The data compression scheme is shown in figure 9
The data collected from acceleration sensors is first decomposed by lifting integer wavelet the wavelet coefficients acquired after decomposition are processed by setting different thresholds some unimportant coefficients are discarded Then the important wavelet coefficients are compressed and coded by EZW and transmitted to receiver nodes including the base station Lastly the data compressed and coded is sent to the software in PC where the data will be decoded and decompressed the signal will be reconstructed by lifting integer wavelet
The embedded zerotree wavelet (EZW) is proposed by Jerome M Shapiro in Ref[5] It is a two- dimensional image compression algorithm which is used for image processing in initial We develop the algorithm which can be used for one-dimensional vibration data compression In EZW a new data
9th International Conference on Damage Assessment of Structures (DAMAS 2011) IOP PublishingJournal of Physics Conference Series 305 (2011) 012024 doi1010881742-65963051012024
7
Data need to becompressed
Multi-layerdecomposition of
lifting wavelet
Processing forthreshold of wavelet
coefficients
EZW compressionand coding
Datatransmission
Decodingand
Dcompression
Multi-layer inversetransform of lifting
wavelet
Data recovery
Figure 9 Flow chart of data compression scheme structure called a zerotree is defined Four symbols are used in EZW 1) zerotree root 2) isolated zero 3) positive significant and 4) negative significant
Given a threshold T to determine whether or not a coefficient x is significant If |x|gtT it is significant else if |x|ltT it is insignificant The x is said to be an element of a zerotree if itself and all of its descendants are insignificant it is also said to be zerotree root for threshold T If the x is insignificant and its descendants are significant it is said to be isolated zero Only the significant coefficient can be quantized and coded During the process of quantization and coding threshold T will be halved continually With the threshold T decreasing the reconstructed signal has higher accuracy and the corresponding compression ratio is lower than before The advantage of EZW is the variable and high compression ratio
We present evaluation criteria to evaluate the effectiveness of EZW Compression ratio (CR) and percent root mean square difference (PRD) are defined as follows
N O BC RN C B
(7)
1 22
n 1
2
1
( ( ) ( ))1 00
( )
N
N
n
x n x nP R D
x n
(8)
In equation (7) NOB is the number of bits occupied by original signal and NCB is the number of bits occupied by compressed signal In equation (8) ( )x n is the sampled values of original signal and
( )x n is the sampled values of reconstructed signal N is the number of sampled points The relationships among T CR and PRD under different wavelet levels are shown in figure 10 We
can see easily that CR and PRD increases with T increasing they are proportional Different lifting wavelet decomposition level is in fact very important to affect the compression result As shown in figure 10 5 levels wavelet decomposition achieves the best performance When the same threshold T is given the higher CR and the lower PRD can be found from the 5 levels wavelet decomposition curve compared to the other two (as the notes in figure 10 detected)
In order to verify the effectiveness of compression algorithm the monitoring experiment of rolling bearing is done and some vibration data of rolling bearing which is in normal state are acquired The sampling frequency is 20 KHZ and the sampling points are 2048 Figure 11 shows the original vibration signal and itrsquos spectrum the signal after compression and reconstruction by EZW and itrsquos spectrum (5 levels wavelet decomposition CR=6)
9th International Conference on Damage Assessment of Structures (DAMAS 2011) IOP PublishingJournal of Physics Conference Series 305 (2011) 012024 doi1010881742-65963051012024
8
Figure 10 ThresholdCRPRD under different wavelet
decomposition levels
Figure 11 Original signal and reconstruction signal (CR=6) Compare the signals in time domain we find that about 342 points of signal are reserved and the
main components of vibration signals are not lost at several time points (such as 001 hellip 008s and so on) after compression and reconstruction but the amplitudes of them change in different degrees Compare the signal spectrum in spectrum domain we can see that the main frequency components (500 hellip 2750HZ) of signal are not lost yet after the compression and reconstruction but the amplitudes of them reduce considerably In the process of signal compression and reconstruction the unimportant components are deleted and some noise may be interfused all of these will affect the signal after reconstruction But if the main information of signal is reserved the accuracy and the distortion of reconstructed signal will be under control With such a high compression ratio the small amounts of data transmitted will be achieved without heavy burden to dsp and the network energy will be saved
4 Conclusions
9th International Conference on Damage Assessment of Structures (DAMAS 2011) IOP PublishingJournal of Physics Conference Series 305 (2011) 012024 doi1010881742-65963051012024
9
In this paper an on-line monitoring system of rolling bearing in freight train using linear WSNs is established The structures of sensor nodes and base station have been described Considering the structure and running condition of freight train the linear topology and 5 routing protocols of WSNs are proposed The data compression and coding scheme are presented to save the limited power of WSNs By analysing the simulation results the optimal routing protocol which is named multi-hop sub-section according to equal distance is adopted The theoretical optimal transmission distance ( 100optd m ) and number of hops ( 8optK ) are obtained through several algorithms At last we verify the effectiveness of compression algorithm by analysing the experimental vibration data of rolling bearing the results of data compression by lifting integer wavelet and EZW can meet the designed requirements So far some tests about the monitoring system have already been carried out In the near future the system of WSNs will be used in monitoring the operation of rolling bearing in freight train The research of other applications is also under study now
References [1] Wei Zhou Thomas G Habetler and Ronald G Harley 2007 Bearing Condition Monitoring
Methods for Electric Machines A General Review 1-6 [2] Office of Research and Development Washington DC 20590 2003 Acoustic Detection of
Railcar Roller Bearing Defects Phase 1 Laboratory Test [3] Ashraf Hossain T Radhika et al An Approach to Increase the Lifetime of a Linear Array of
Wireless Sensor Nodes 2008 Int J Wireless Inf Networks vol 15 p 72ndash81 [4] Zach Shelby Carlos Pomalaza-Raez et al Energy Optimization in Multihop Wireless
Embedded and Sensor Networks 2005 Int J Wireless Inf Networks vol 12 p 11-21 [5] Jerome M Shapiro Embedded Image Coding Using Zerotrees of Wavelet Coefficients 1993
IEEE Transactions on Signal Processing 41 3445-62 [6] Dr John Donelson lll Dr Ronald L Dicus Bearing Defect Detection Using on-board
Accelerometer Measurements 2002 Proc of the 2002 ASMEIEEE Joint Rail Conf (Washington DC) pp 95-102
[7] Hong Li Xu Shunjie Energy-Efficient Node Placement in Linear Wireless Sensor Networks 2010 Int Conf On Measuring Technology and Mechatronics Automation p 104-107
[8] Marco Zimmerling Waltenegus Dargie and Johnathan M Reason 2007 Energy-Efficient Routing in Linear Wireless Sensor Networks
[9] OD Snell I Nairne Acoustic Bearing Monitoring ndashThe Future RCM 2008 2008 [10] Marco Zimmerling Waltenegus Dargie and Johnathan M Reason Localized Power-Aware
Routing in Linear Wireless Sensor Networks 2008 CASEMANS rsquo08 (Sydney Australia) [11] William H Sneed Richard L Smith On-Board Real-Time Railroad Bearing Defect Detection
and Monitoring p 149-153 [12] Q Gao KJ Blow et al Radio range adjustment for energy efficient wireless sensor networks
2006 Ad Hoc Networks vol 4 75-82 [13] Bin Zhang Georgios Georgoulas et al Rolling Element Bearing Feature Extraction and
Anomaly Detection Based on Vibration Monitoring 2008 16th Mediterranean Conf on Control and Automation Congress Centre (Ajaccio France) p 1792-1797
[14] Mark CEdwards John Donefson III Improving freight rail safety with on-board monitoring and control systems 2005 Proc of Joint Rail Conf p 117-122
[15] IStojmenovic and XLin Power-aware localized routing in wireless networks IEEE Transactions on Parallel and Distributed Systems 2001 vol 12 p 1122-1133
Acknowledgements The work was funded by the National science Foundation of China (NO50875196) and the National Basis Research Program of China (NO2009CB724304) The authors would like to thank the reviewers for their valuable comments on this paper
9th International Conference on Damage Assessment of Structures (DAMAS 2011) IOP PublishingJournal of Physics Conference Series 305 (2011) 012024 doi1010881742-65963051012024
10
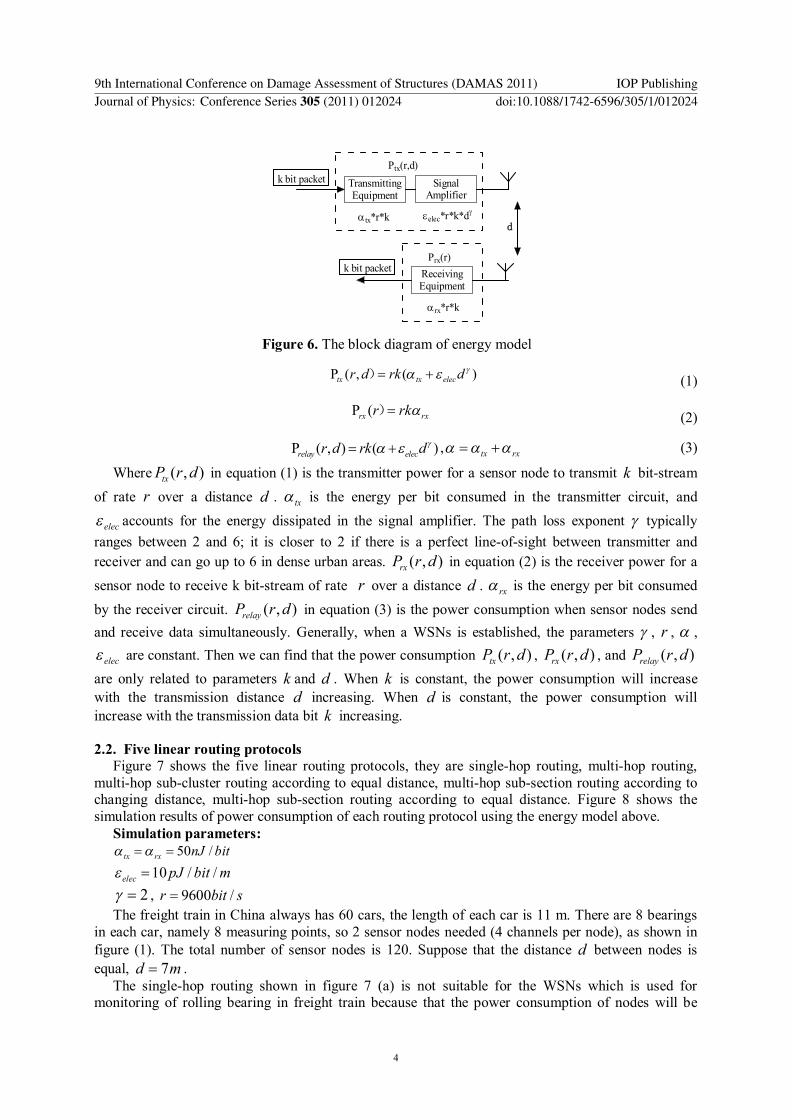
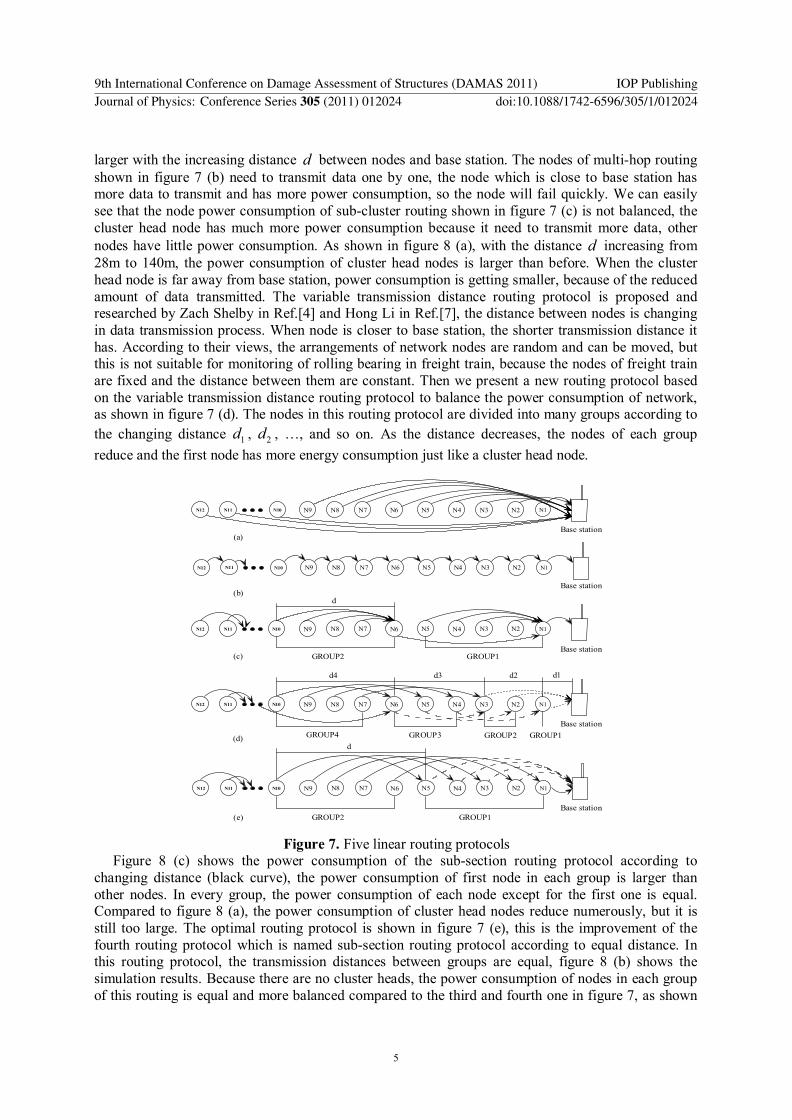
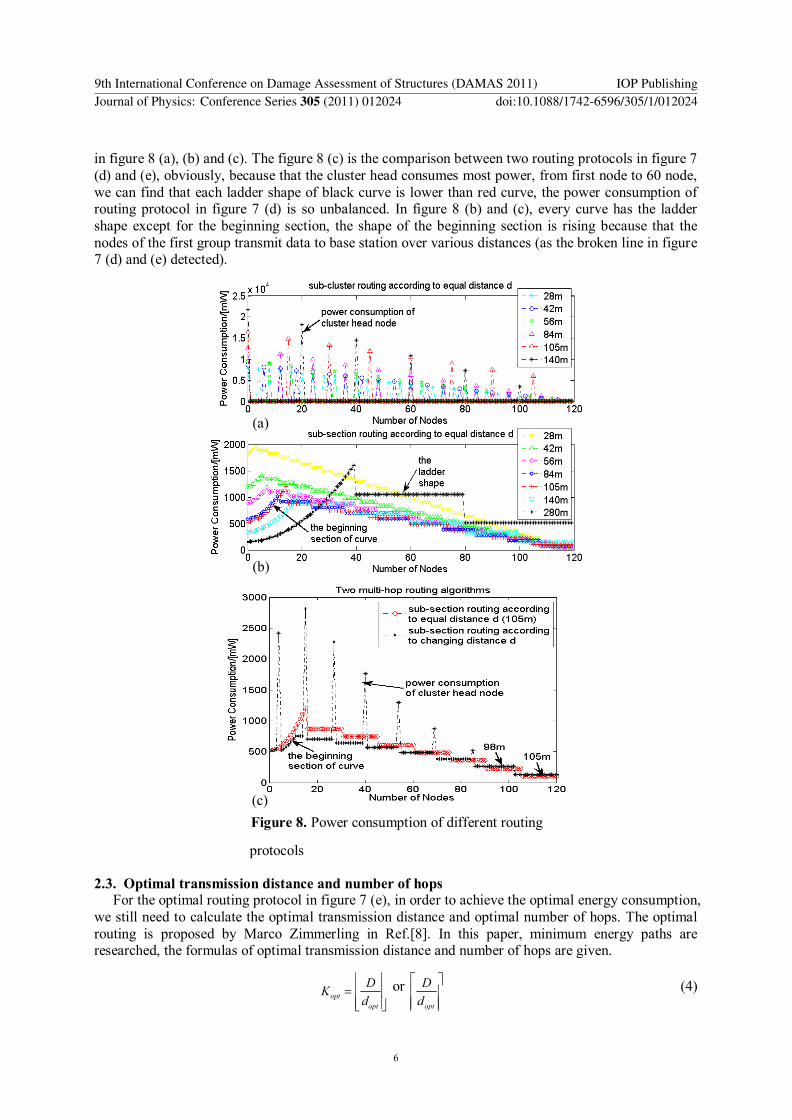
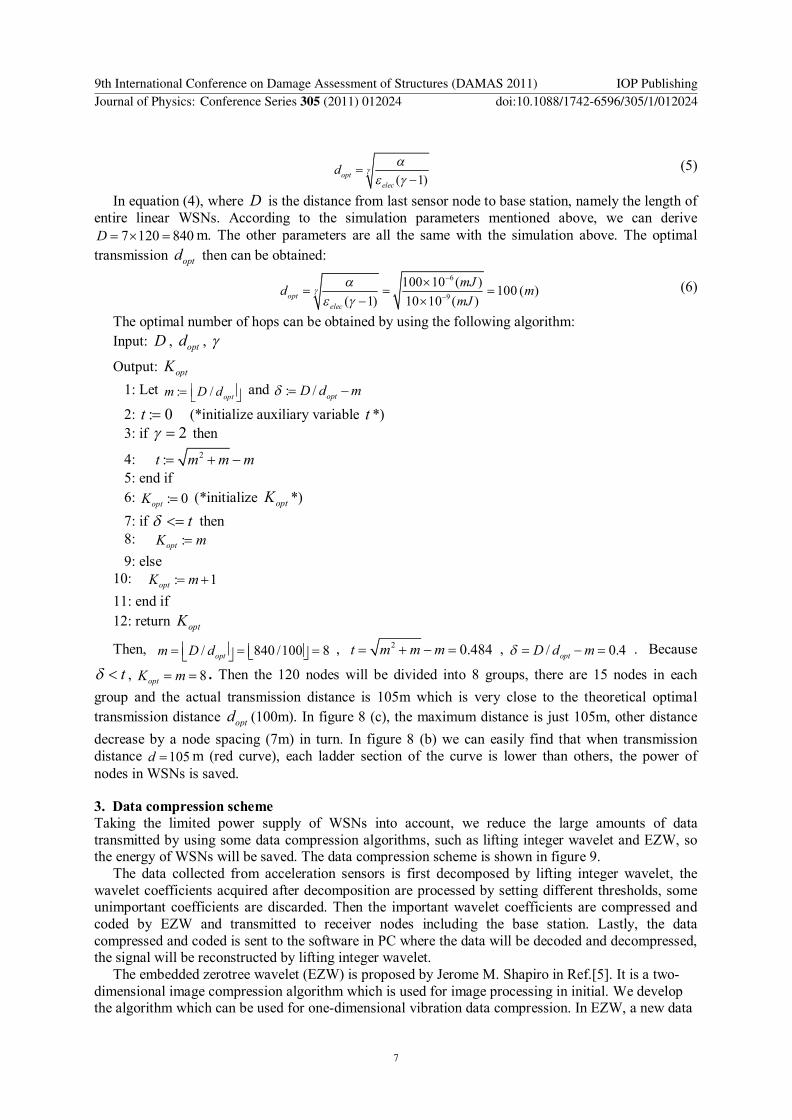
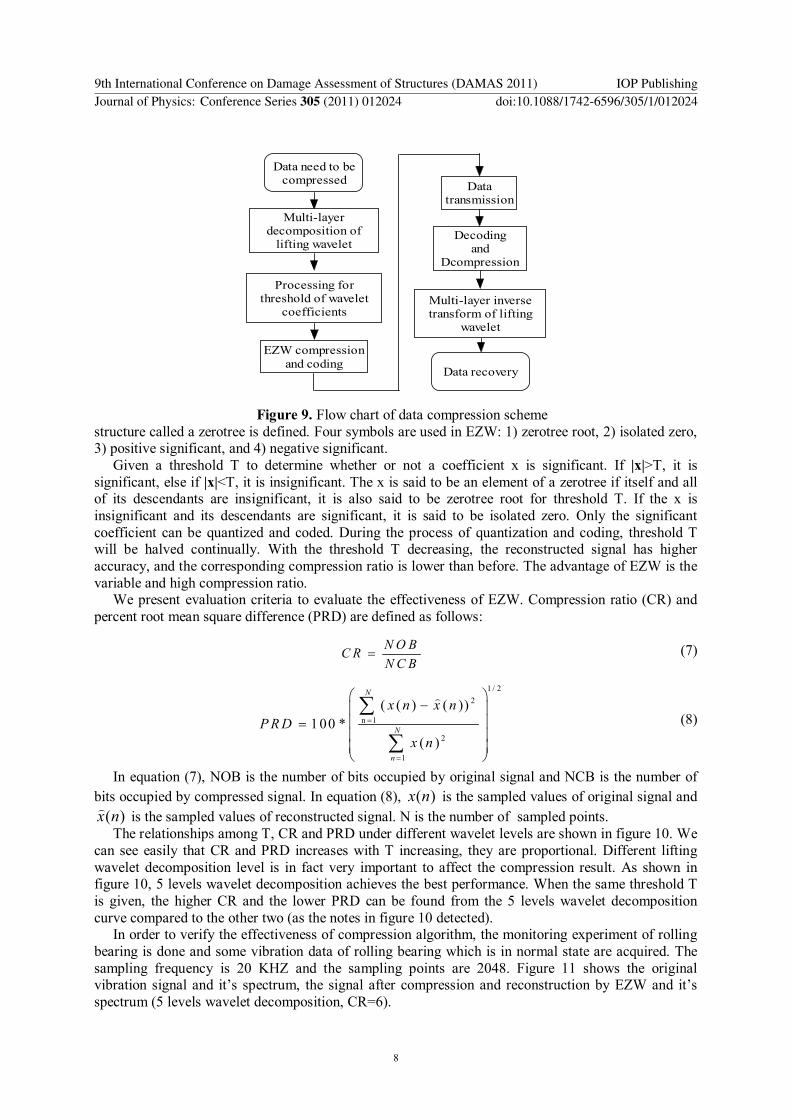
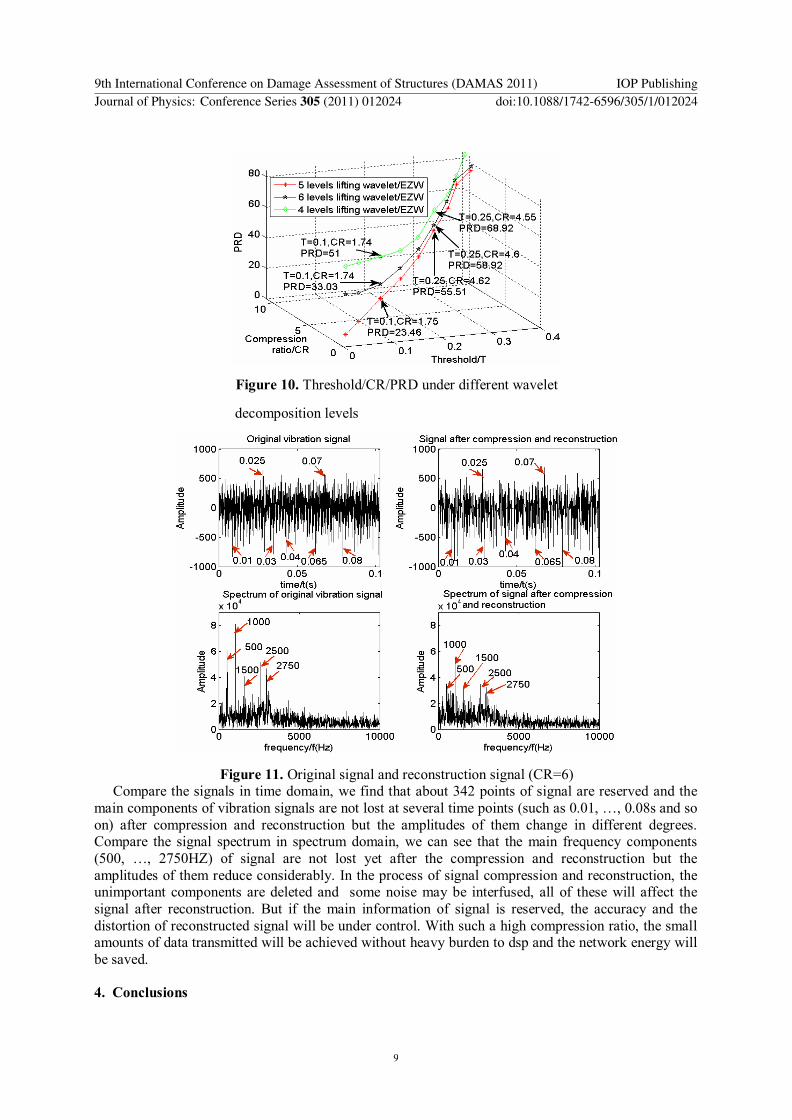