Embed Size (px)
Citation preview
Workshop
13.30-14.10 Existing challenges in travel behavior analysis and modeling solved
from the perspective of large datasets: a take-off in the DATASIM
project, Prof. dr. Davy Janssens
14.10-14.50 Unveiling the complexity of human mobility by querying and mining
massive trajectory data, Dr. Fosca Giannotti
14.50-15.10 BREAK
15.10-15.50 Spatial Data Mining in Practice: Principles and Case Studies, Dr.
Michael May
15.50-16.30 A universal model for mobility and migration patterns, Dr. Filippo
Simini
Research on Data Mining and Complex Networks Meets
Transportation Research: New Approach to Existing Challenges in
Travel Behavior Analysis
1

Existing challenges in
travel behavior and
modelling, seen from the
perspective of large
datasets: a take-off in the
DATASIM FP 7 project
Prof. dr. Davy Janssens, [email protected]
2
22/01/2012

Context and background of this
workshop/presentation 3

Why transportation modelling?
Transportation problem is multi-dimensional:
Traffic jams, CO2-emissions, Impact on economy, Traffic accidents,…
Transportation models
Support ex ante management decision making (What if?)
Make predictions in uncertain circumstances:
Changing infrastructure, environment
Changing behaviour of people
Changing socio-demographic circumstances
…
Assess impact of policies/ other domains
Mobility
Traffic safety
Environmental impact (emissions)
Exposure (human health)
Electrical vehicles
4

Transportation models
HOME LOCATION
1 Eat (30 min)
6 Eat (90 min)
8 Sleep (550 min)SHOP LOCATION
5 Shop (25 min)
WORK-LOCATION
2 Work (240 min)
4 Work (240 min)
MOVIE THEATHER
7 Movie (120 min)
LUNCH BAR
3 Lunch (40 min)
25 min (A)
10 min (B)10 min (C)
20 min (D)
10 min (E)
15 min (F)15 min (G)
Some scenario’s
almost cannot
be calculated by
means of trip
and tour-based
models
5
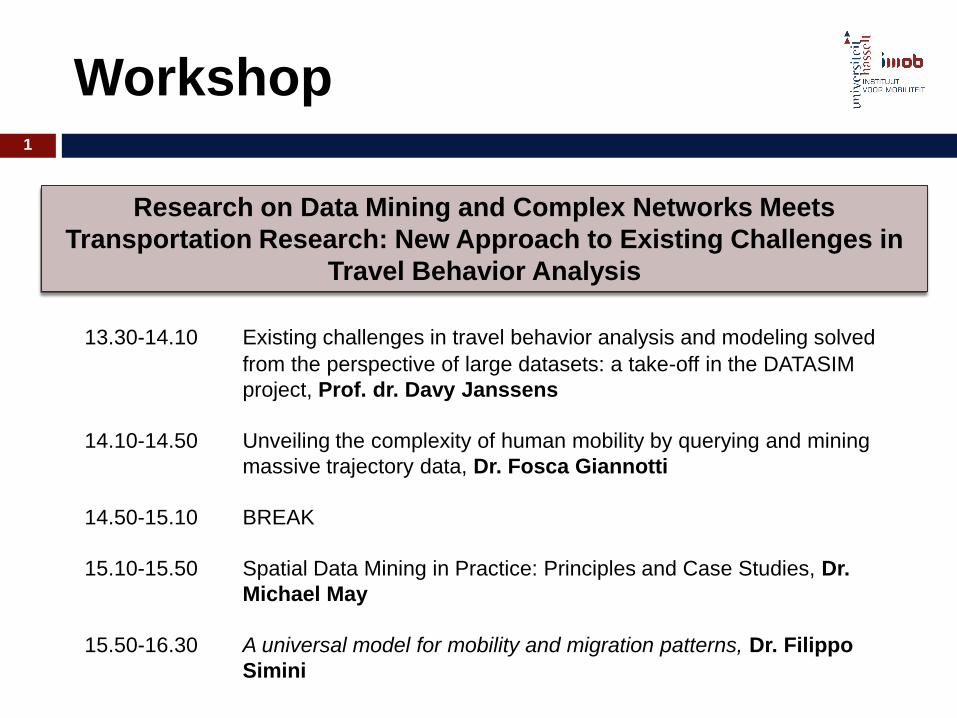
Sequences of episodes
Activities
Travel
Account for constraints
Household interactions
Time-space constraint
“Travel demand derived from activities ”
Activity-based models 6

Simulate
Which activities?
Where?
When?
How long?
With whom?
Transport mode?
“Travel demand derived from activities ”
7
Activity-based models
Research challenges in travel behaviour
analysis and modelling 8
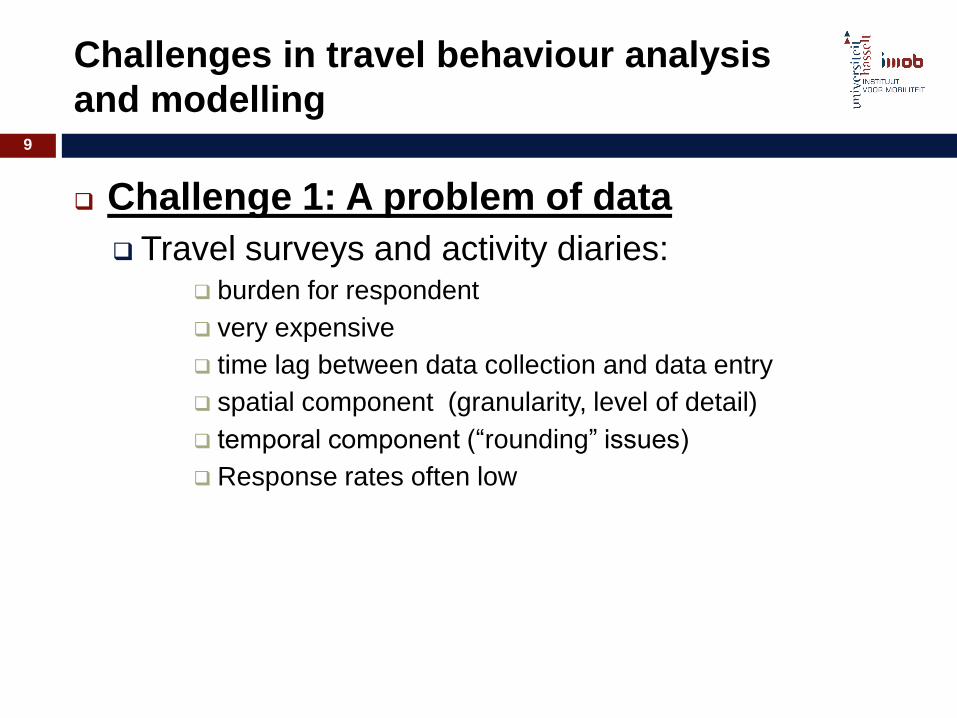
Challenges in travel behaviour analysis
and modelling
Challenge 1: A problem of data
Travel surveys and activity diaries: burden for respondent
very expensive
time lag between data collection and data entry
spatial component (granularity, level of detail)
temporal component (“rounding” issues)
Response rates often low
9

Challenges in travel behaviour analysis
and modelling
Challenge 2: Efficient model validation
Currently model validation only done at the final step
in the modelling phase (comparing with traffic counts) E.g. no intermediary validation at the level of origin-destination
matrices
Difficult to see how errors propagate in the model
Furthermore: in traditional modelling, OD matrices are
estimated from the perspective of pre-defined zones
(corresponding to administrative districts,
communities etc), while fuzzy (non-administrative but
data driven) OD matrices may reveal important and
more valueable information
10

Challenges in travel behaviour analysis
and modelling
Challenge 3: A problem of currently
existing AB models
Operationalisation of AB models!
Real-world applications of AB models
(increasing though) while in theory there are
plenty of opportunities
Furthermore: Scalability of models is an issue!
In traditional straightforward (non agent-based)
applications, behavioural sensitivity in the AB model
which was present during demand estimation is lost in
the assignment step
11

Big datasets as a possible solution?:
The DATA SIM Approach 12
DATA SIM
Data Science for Simulating the Era of Electric
Vehicles (DATA SIM): an open-FET FP7 EU
project
FET-Open supports the exploration of new and
alternative ideas that, because of their risky or
non-conventional nature, would not be supported
elsewhere.
Only highly ambitious projects are accepted, low
acceptance rate (~5%)
13

Participants in DATA SIM 14
Participants Expertise
UH-IMOB
(Belgium)
Transportation
modelling, traffic
safety, and logistics
CNR-ISTI (Italy)
knowledge discovery
and data mining
BME-TTK
(Hungary)
network science
applied in
economics,computer
science, sociology
and biology
FRAUNHOFER
(Germany)
data mining,
statistical relational
learning, geographic
information systems,
and distributed
computing
Participants Expertise
UPM (Spain)
electric power systems,
control engineering,
chemistry and topography
geographical information
Systems
VITO (Belgium)
industrial innovation,
energy, and quality of the
environment;
TECHNION
HAIFA University
(Israel)
distributed knowledge
discovery, large-scale
distributed data mining
and data streams
UPRC (Greece)
database management,
knowledge discovery and
data mining
Challenge 1: a problem of data
(diaries)
Solution:
GPS data are in theory a possible solution to this
problem (!)
However: there is a long way to go from raw data of
individual trajectories up to high level collective
mobility knowledge:
Only detailed spatio and temporal resolutions are covered
Annotation (activity, transport mode) is necessary
A lot has been done in data mining and informatics in the past!
Behavioural reflection of annotation process often not taken
into account
annotation of vehicle trajectories: translate to individuals’
trajectories: account for e.g. Hägerstrands’ constraints
15

Mobile phone data:
Spatio-temporal information also available but
less detailed (call data records, handover data)
Are Massive datasets
Covered in the area of Network Science
16
Challenge 1: a problem of data
(diaries)

State-of-the-art
The latest developments in the research of human mobility include:
Mobility data mining: extending traditional data mining techniques to location sequences of individuals’ movement for pattern mining, clustering and location prediction (M-Atlas);
Statistical physics of human mobility: uncovering statistical laws that govern the key dimensions of human travels, e.g. travel distance and activity duration;
Semantic-enrichment of mobility data: inferring semantic and context aspects of travel behavior; annotation process
Social network analysis: investigating the dynamics of social network to characterize mobility behaviours of subpopulations based on their social relations.
Combine data mining and statistical physics into a uniform analytical framework, able to develop macro-micro models of human mobility with an unprecedented explanatory and predictive power
Combine mobility patterns with social networks to explore how mobility patterns depend on demographic factors and social network characteristics.
Extend mobility patterns with semantics to explain the purpose of people’s whereabouts.
17

Implementation of the solution
Goal: try to combine micro- and macro-laws of
human mobility and use them in AB-modelling!
E.g. location choice model can be developed from
GPS/GSM traces (see also presentation by dr.
Simini)
When fully annotated, travel diaries can (in
theory) be reconstructed (from GPS traces), and
can be fed into AB-models
18

Merge the raw and behaviorally poor big data with the smaller but
behaviorally richer travel survey data, building a novel agent-based reality
mining modeling standard of mobility behavior.
Modelling anchor points from big data (home, work, school)
Modelling stop frequencies
A detailed modeling level for departure time of activities, trips and tours;
Destination choice models built from individual accessibility point-of-view, under
potential path areas that can be reached within certain spatio-temporal constraints
of the agent, derived from the annotated trajectories developed in WP2;
Merging the person-based accessibility measures with socio-demographic
information.
Sensitive towards a broad range of behavioral changes, accounting for the
impact of policy measures and trends, especially the impact of different
scenarios in the era of electric vehicles.
19
Implementation of the solution

Simulation process demonstration
20
Home (Departure
time;
Travel
mode)
Work Home
Stop Stop Stop
Starting time
Activity duration
Activity type
Activity Location
Travel mode
Travel companion
Number of
trips a day
Travel distance
Travel mode
Activity sequence
More

The final outcome 21

Challenge 2: efficient model
validation
Massive mobility data trace people transfer phenomenons, providing direct and objective measures for the validation process.
GPS: providing movement trajectories in precise spatial locations and a high time rate; but covering small subsets of a population, and related to vehicles rather than individuals;
GSM: tracking individuals’ movement and covering a significant segment of population; but requiring additional efforts from telecom operators and lacking details in spatial and temporal resolution.
Overcome the limitation of single data source, combine heterogeneous data types, and yield reliable model validation methodologies applicable to large-scale domains.
Start from hand-over data to estimate OD Matrix
22

Challenge 3: A problem of currently
existing AB models
Look for applications which shows the real
value of an operational model
Previous research in the past (Beckx et al.)
In this project: application domain of electric
vehicles:
Nationwide power demand estimation (using
detailed charging schemes)
Dynamic electricity pricing scenario’s (prices
when electricity demand , prices when
electricity demand )
23
Challenge 1: Activity-diaries
Some preliminary research results of
DATA SIM 24
Some preliminary research results of
DATA SIM (challenge 1)
Semantic annotation of GPS traces (topic
related to challenge 1)
= automatic inference of activity types only based
on activity start times and activity durations
Developing an expert system that links GPS
trajectories to corresponding diary data based
on two models: Predicted probability distribution
Point predictions
25

Challenge 1: Data
Development of a GPS-enabled
Personal Digital Assistant (PDA)
(PARROTS: PDA system for Activity
Registration and Recording of Travel
Scheduling)
Data collected for 2400 Households,
about 900 based on PDA, 1500 paper-
and-pencil diaries
1 week activity-based survey
Capturing route information
Planning activities for the future
Enabler for future research related
activities (see later)
26

Challenge 1: Data
Activity attributes:
Which type of activity?
When?
For how long?
Where?
With whom?
Trip attributes:
When?
With whom
Route?
Transport mode
27
+ consistency checks

Challenge 1: Data
Fraction GPS logs with GPS information as a
function of time-of-day
Day: fraction increases logging of trips
Night: fraction decreases charging
Evening: fraction decreases charging & imputation
28
0
100000
200000
300000
400000
500000
600000
0 1 2 3 4 5 6 7 8 9 10 11 12 13 14 15 16 17 18 19 20 21 22 23
Time of day (h)
# N
ME
A s
trin
gs
0
200
400
600
800
1000
1200
# r
ec
ord
s in
pu
tte
d
No location info Location info Respondent activity

Challenge 1: Data
Training, test and validation set
Diary data after cleaning: N=11906
GPS data with matching diary data: N=342 Validation data
Training data: 75% N=8930
Test data: 25% N=2976
29

Challenge 1: Processing/cleaning of
data
Deviation in time registration:
Strong mismatch due to
Incomplete schedules!
Trip end identification
GPS burn in, battery instability, incorrect diary reporting/use of GPS device
Small deviation for most trips
Due to rounding errors (min), burn in problems
5% large deviations (> 1 h, > 2 h)
Due to inefficiency during process of trip end identification?
Rounding errors at hour level?
Perfect match
Trip start times: 245 trips
Trip end times: 311 trips
Trip durations: 421 trips
30

Challenge 1: Research methodology
Classification of activity start times and activity
durations
Decision Tree (C4.5)
Optimizing classification by considering minimum
class frequencies and by creating balance
between number of leaf nodes and impurity
Start times: 13 categories
Durations: 8 categories
31

Challenge 1: Research methodology
Predicting probability matrix
= Probability distribution model
Distribution of activity probabilities for each class
of activity start time and activity duration
Extracting majority matrix
= Point prediction model
Highest probability for each class
32

Challenge 1: Results 33
Data set N Misclassification error
Training data 8930 29,50%
Test data 2976 27,76%
Validation data 342 25,44%

Challenge 1: Results probability distribution
34
Activity duration <=18min
AND Activity Start time <= 8:56
am
Activity duration <= 18min
AND Start Time between 8:56 am and
11:55 am
P (Bring-get) = 66,2% P (Bring-get) = 22%
P (Home) = 12,4% P (Home) = 7,9%
P (Leisure) = 0,6% P (Leisure) = 2,9%
P (Services) = 1,9% P (Services) = 15,9%
P (Shopping) = 14,6% P (Shopping) = 43,3%
P (Social) = 1,3% P (Social) = 4,7%
P (Touring) = 0% P (Touring) = 0,4%
P (Working) = 2,9% P (Working) = 2,9%

Challenge 1: Results point prediction
35

Challenge 1: Conclusion
Using these models (and further improvements)
To enrich GPS logs with diary variables
To be able to use GPS data collection without
accompanying diaries (survey questionnaires)
Contributions to scientific state-of-the-art
Pure time annotation
Deviation in time registration between both data
sources
Indication of impact of time on activities
Important role in the semantic enrichment process
36

Challenge 3: Operationalisation of nation-
wide activity-based models and application
scenario in EV
(by L. Knapen et al. TRB 2012)
Some preliminary research results of
DATA SIM 37

Some preliminary research results
of DATA SIM (challenge 3)
The Feathers framework
Forecasting Evolutionary Activity-Travel of Households
and their Environmental RepercussionS (FEATHERS)
AB simulation research laboratory
Platform for model development Prototyping
Experimenting
Simulating
Configurable for different study areas
Recuperation of research / implementation efforts
38

Activity-travel schedules
Most detailed form
Aggregation to extract targeted
information
Analysis of personal transportation
behavior
Usage of means of transportation E.g. Usage of public transportation,
carpooling, …
Detailed segmentation E.g. motive: Home-work/school transportation
39
The FEATHERS output

Analysis of tours and trips
Frequencies
Modal choice
Distance and/or time distribution
Detailed segmentation based on socio-demographics E.g. Modal split for 65+
Relative amount of trips leaving each municipality in Flanders (Belgium)
40
The FEATHERS output

Traffic assignment
Vehicle flows
Volume to network capacity
Trips for all activities in Flanders (Belgium)
Trips for work activity in Brussel
41
The FEATHERS output

Analysis of Activities
Type
Location
Duration
Time of day
Person-hours spend from all origin zones in
Hasselt
Quotient work status in Flanders
(Belgium)
42
The FEATHERS output

The FEATHERS output
Relative amount of Work Activities per municipality in Flanders
43

Application domain
Yearly electric energy consumption
For Belgian Household estimated at 3500..3900kWh
For EV (15000Km, 200Wh/km): 3000 kWh
Potential problem if everyone would charge its
car at the same time
Electric Vehicle Scenario
Calculate
EV energy requirement (based on distance driven)
Available charging period (deadline)
Location
44

Application domain
Charging scenarios Everyone uses timer to start when lowTariffPeriod starts: peak
Uniform distribution within lowTarifPeriod : Feasible
Immediate charging after last home arrival : Lower peak
Parameters for scenarios Market share EV : BEV, PHEV
Car class : small, medium, large : similar to ICEV cars
Charger types
Range anxiety coefficient
Privately owned vs. company cars
Work location charging (cheaper than fuel card)
45

Application domain 46

Application domain
BEV feasibility conditions
47

Results 48

Results 49

Electric Vehicle Scenario
Power requirement : All EV are PHEV
Scenarios :
UniformLowCost
LastHomeArrival
EachHomeArrival
Electric power demand during low tariff period for a working day
50
Results

Transportation Research Institute (IMOB)
Hasselt University
Wetenschapspark 5 bus 6
3590 Diepenbeek – Belgium
Tel.: +32 (0)11 26 91 28
E-mail: [email protected]
URL: www.imob.uhasselt.be
Also visit the DATA SIM website: www.datasim-fp7.eu
Questions? Thanks for your attention!
51