Embed Size (px)
Citation preview


’s three Federally Funded Research and Development Centers (FFRDCs) provide objective analyses of national and homeland security issues and related challenges, particularly those requiring extraordinary scientific and technical expertise.
IDA is a not-for-profit corporation, operating in the public interest, whose sole business is administering FFRDCs. Since 1956, we have provided our sponsors timely, authoritative, and objective analyses of important national issues, many of which have significant scientific and technical content. We bring experienced staff, an established ability to attract and collaborate with outside experts, a dedication to quality, a reputation for trustworthiness, and a commitment to sponsor satisfaction.
The summaries in this edition of IDA Research Notes were written by researchers within the following five IDA research groups. The directors of those divisions would be glad to respond to questions about the specific research topics or related issues.
Cost Analysis and Research Division (CARD), Dr. David J. Nicholls, Director (703.575.4991, [email protected])
Information Technology and Systems Division (ITSD), Dr. Margaret E. Myers, Director (703.578.2782, [email protected])
Operational Evaluation Division (OED), Mr. Robert R. Soule, Director (703.845.2482, [email protected])
Science and Technology Policy Institute (STPI), Dr. Mark J. Lewis, Director (202.419.5491, [email protected])
Strategy, Forces and Resources Division (SFRD), Mr. John C. Harvey, Director (703.575.4530, [email protected])
Institute for Defense Analyses 4850 Mark Center Drive
Alexandria, Virginia 22311-188
ida.org
@ida_org
RESEARCH NOTES
RESEARCH NOTES
3ida.org
Multidisciplinary Research for Securing the HomelandIDA and DHS: Beyond 15
Burns, John Whitley, Bryan Roberts, and Brian Rieksts describe the results of a rapid-response study to evaluate performance measures used by border security enforcement agencies along the southern border of the United States. The initial phase, completed in less than one month, led to a longer study during which the team proposed new mission outcome-based performance measures.
Long-Term Challenges and Evolving Threats: Over the last several years, Serena Chan has investigated both the infrastructure and messaging challenges posed by decentralizing response across the local, state, and Federal levels as captured in “Improving Shared Understanding of National Security and Emergency Preparedness Communications.” Andrew Hull and David Markov discuss the emerging threat landscape in “Foreign Counter-Unmanned Aerial Systems: Developments in the International Arms Market.” In “Operationalizing Cyber Security Risk Assessments for the Dams Sector,” Kevin Burns, Jason Dechant, Darrell Morgeson, and Reginald Meeson build on the common risk model for dams (CRM-D) to explain how effective risk assessments for cyber security threats can be performed.
Historical Assessments and Forward-Looking Roadmaps: John Whitley, Bryan Roberts, Sarah Burns, Brian Rieksts, and Amrit Romana assessed more than 10 years of data to aid in “Understanding the Juvenile Migrant Surge from Central America.” Steven Lev, Anne Ressler, and Seth Jonas, meanwhile, use skilled analytic expertise, economic analyses, and introduction of metrics in “Implementing a Roadmap
In 2016, IDA celebrated 60 years as a Federally Funded Research and Development Center (FFRDC) steward dedicated to providing objective, independent analyses of our nation’s most challenging security issues.
In 2018, we will mark another anniversary: 15 years of support to the Department of Homeland Security (DHS), a collaboration that began within weeks of the establishment of the Department. The challenges facing the Homeland Security Enterprise continue to grow in complexity—from fighting an evolving terrorist threat, to securing our borders, to ensuring appropriate responses to natural disasters. Insightful, technically superb analyses help identify appropriate policy responses.
In this issue of IDA Research Notes, we celebrate IDA’s long-standing collaborative relationship with DHS; the articles in this edition are summaries of projects conducted for DHS over the last 15 years, some of which continue today, or of topics relevant to the Homeland Security Enterprise. They exemplify the diversity and depth of our work to address the evolving, complex challenges across the homeland security space.
Enduring Support and Rapid Response: In “Countering Terrorism One Technology at a Time,” Laura Itle details IDA’s enduring support to DHS, describing the evolution of IDA’s support to the DHS Science and Technology Directorate’s Office of SAFETY Act Implementation, from the first implementations of the act in 2003 to current efforts to identify, engage with, and secure new sectors against potential terrorist threats. In “Does Imposing Consequences Deter Attempted Illegal Entry into the United States?” Sarah
4 Research Notes
for Critical Infrastructure Security and Resilience.”
Collaboration and Simulation, from the Baseline through Test and Evaluation: Understanding and concisely defining the baseline against which future metrics-based comparisons can be accomplished is fundamental, especially when evaluating single solutions for deployment with multiple user communities. This concept is presented with a quantitative case study by Deena Disraelly, Stephanie Caico, David Santez, and Terri Walsh in “Baselining: Application of a Qualitative Methodology for Quantitative Assessment of Emergency Management Capabilities.”
Amy Henninger, in “Analysis, Analysis Practices, and Implications for Modeling and Simulation,” describes the application of broad-based analyses, ranging from the engineering to strategic levels, which can be implemented across the Department to initiate and support modeling and simulation and enable informed choices by DHS. Laura Freeman and Rebecca Dickinson explain how DHS could use data science methods to assess test and evaluation data and present reliability findings in “Test and Evaluation for Reliability.”
We have enjoyed and learned from our partnership with DHS to date and look forward to assisting the Department in meeting the challenges of the next 15 years.
Sincerely,
David S.C. Chu President and Chief Executive Officer Institute for Defense Analyses
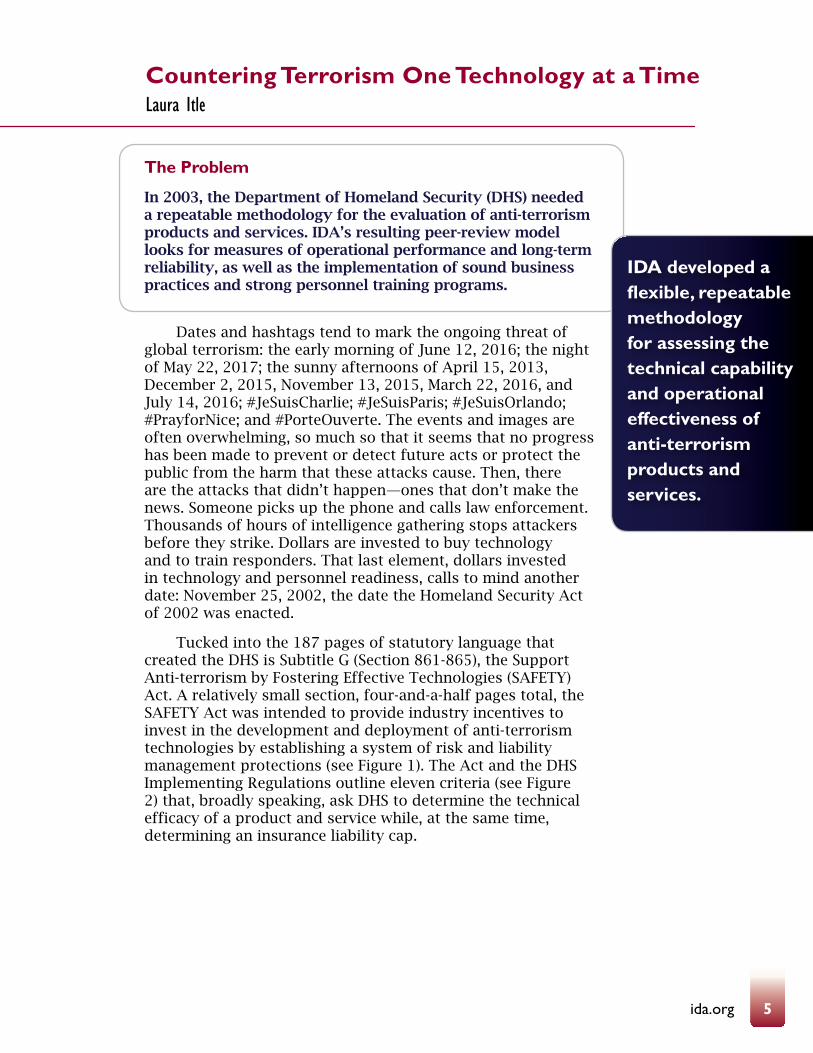
IDA developed a flexible, repeatable methodology for assessing the technical capability and operational effectiveness of anti-terrorism products and services.
5ida.org
Countering Terrorism One Technology at a TimeLaura Itle
The Problem
In 2003, the Department of Homeland Security (DHS) needed a repeatable methodology for the evaluation of anti-terrorism products and services. IDA’s resulting peer-review model looks for measures of operational performance and long-term reliability, as well as the implementation of sound business practices and strong personnel training programs.
Dates and hashtags tend to mark the ongoing threat of global terrorism: the early morning of June 12, 2016; the night of May 22, 2017; the sunny afternoons of April 15, 2013, December 2, 2015, November 13, 2015, March 22, 2016, and July 14, 2016; #JeSuisCharlie; #JeSuisParis; #JeSuisOrlando; #PrayforNice; and #PorteOuverte. The events and images are often overwhelming, so much so that it seems that no progress has been made to prevent or detect future acts or protect the public from the harm that these attacks cause. Then, there are the attacks that didn’t happen—ones that don’t make the news. Someone picks up the phone and calls law enforcement. Thousands of hours of intelligence gathering stops attackers before they strike. Dollars are invested to buy technology and to train responders. That last element, dollars invested in technology and personnel readiness, calls to mind another date: November 25, 2002, the date the Homeland Security Act of 2002 was enacted.
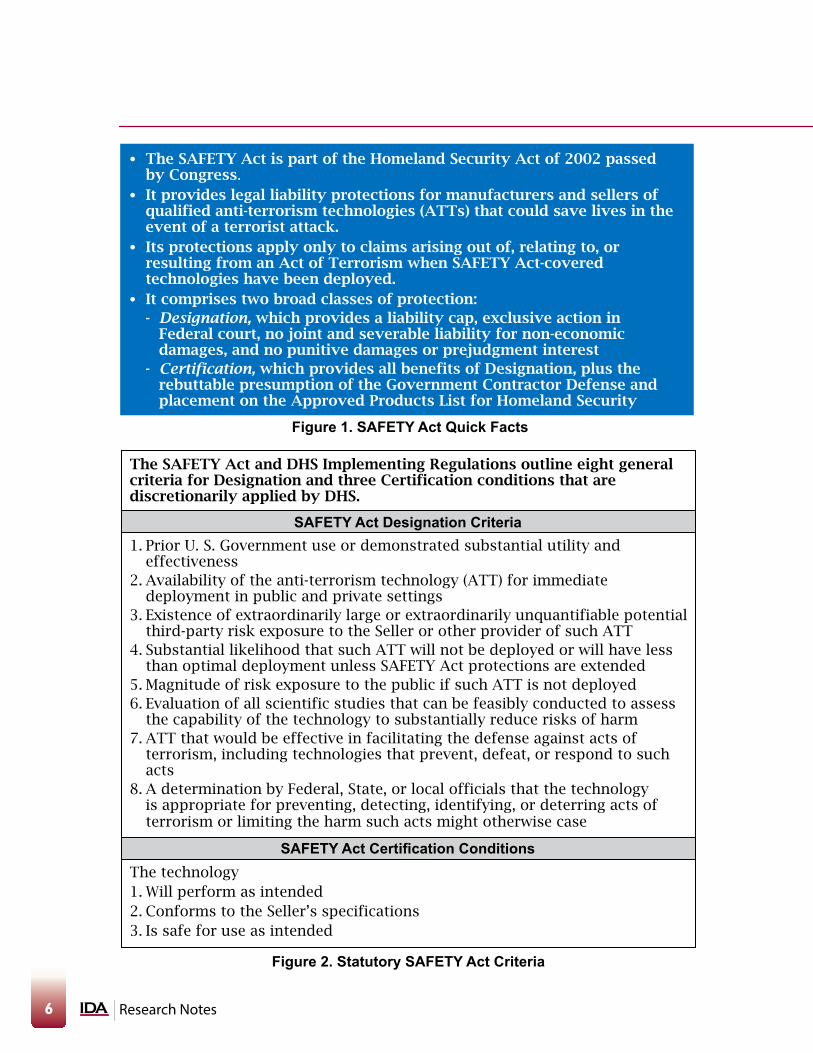
Tucked into the 187 pages of statutory language that created the DHS is Subtitle G (Section 861-865), the Support Anti-terrorism by Fostering Effective Technologies (SAFETY) Act. A relatively small section, four-and-a-half pages total, the SAFETY Act was intended to provide industry incentives to invest in the development and deployment of anti-terrorism technologies by establishing a system of risk and liability management protections (see Figure 1). The Act and the DHS Implementing Regulations outline eleven criteria (see Figure 2) that, broadly speaking, ask DHS to determine the technical efficacy of a product and service while, at the same time, determining an insurance liability cap.
IDA developed a flexible, repeatable methodology for assessing the technical capability and operational effectiveness of anti-terrorism products and services.
6 Research Notes
l The SAFETY Act is part of the Homeland Security Act of 2002 passed by Congress.
l It provides legal liability protections for manufacturers and sellers of qualified anti-terrorism technologies (ATTs) that could save lives in the event of a terrorist attack.
l Its protections apply only to claims arising out of, relating to, or resulting from an Act of Terrorism when SAFETY Act-covered technologies have been deployed.
l It comprises two broad classes of protection: - Designation, which provides a liability cap, exclusive action in
Federal court, no joint and severable liability for non-economic damages, and no punitive damages or prejudgment interest
- Certification, which provides all benefits of Designation, plus the rebuttable presumption of the Government Contractor Defense and placement on the Approved Products List for Homeland Security
Figure 1. SAFETY Act Quick Facts
SAFETY Act Designation Criteria
SAFETY Act Certification Conditions
Figure 2. Statutory SAFETY Act Criteria
1. Prior U. S. Government use or demonstrated substantial utility and effectiveness
2. Availability of the anti-terrorism technology (ATT) for immediate deployment in public and private settings
3. Existence of extraordinarily large or extraordinarily unquantifiable potential third-party risk exposure to the Seller or other provider of such ATT
4. Substantial likelihood that such ATT will not be deployed or will have less than optimal deployment unless SAFETY Act protections are extended
5. Magnitude of risk exposure to the public if such ATT is not deployed6. Evaluation of all scientific studies that can be feasibly conducted to assess
the capability of the technology to substantially reduce risks of harm7. ATT that would be effective in facilitating the defense against acts of
terrorism, including technologies that prevent, defeat, or respond to such acts
8. A determination by Federal, State, or local officials that the technology is appropriate for preventing, detecting, identifying, or deterring acts of terrorism or limiting the harm such acts might otherwise case
The technology1. Will perform as intended2. Conforms to the Seller’s specifications3. Is safe for use as intended
The SAFETY Act and DHS Implementing Regulations outline eight general criteria for Designation and three Certification conditions that are discretionarily applied by DHS.
7ida.org
In May 2003, DHS asked IDA to help develop a method to assess the operational effectiveness of new technologies and determine the proper level of liability insurance that each company should carry. Within 5 months, DHS was able to accept SAFETY Act applications for evaluation. DHS subsequently asked IDA to refine and implement the initial evaluation methodologies using the combined operational test and evaluation and cost analyses experience of IDA’s Operational Evaluation Division and Cost Analysis and Research Division. In 14 years, IDA, in support of the DHS Office of SAFETY Act Implementation (OSAI), has reviewed thousands of technologies: metal detectors, chemical, biological, radiological, nuclear, and explosive (CBRNE) sensors; mass notification systems; integrated security programs for sports stadiums; cybersecurity platforms; first responder gear; medical countermeasures; and others. Each technology represents the willingness of the private sector to invest in the development of anti-terrorism measures to protect the general population through the deployment of one technology at a time.
IDA developed a flexible, repeatable methodology for assessing the technical capability and operational effectiveness of anti-terrorism products and services.
Establishing a Review Process
Central to IDA’s support of OSAI is a repeatable process staffed with the right mix of people to assess the diverse range of potential technologies that can seek SAFETY Act protections. The evaluation process is subject to the following conditions:
l Any application should be processed in 120 business days, including a 30-day completeness phase and a 90-day evaluation phase.
l Applications should be reviewed using consistent measures, irrespective of the type of technology or the size of the business entity seeking protections.
l Applications should be assessed against the statutory criteria and subject to a liability cap analysis.
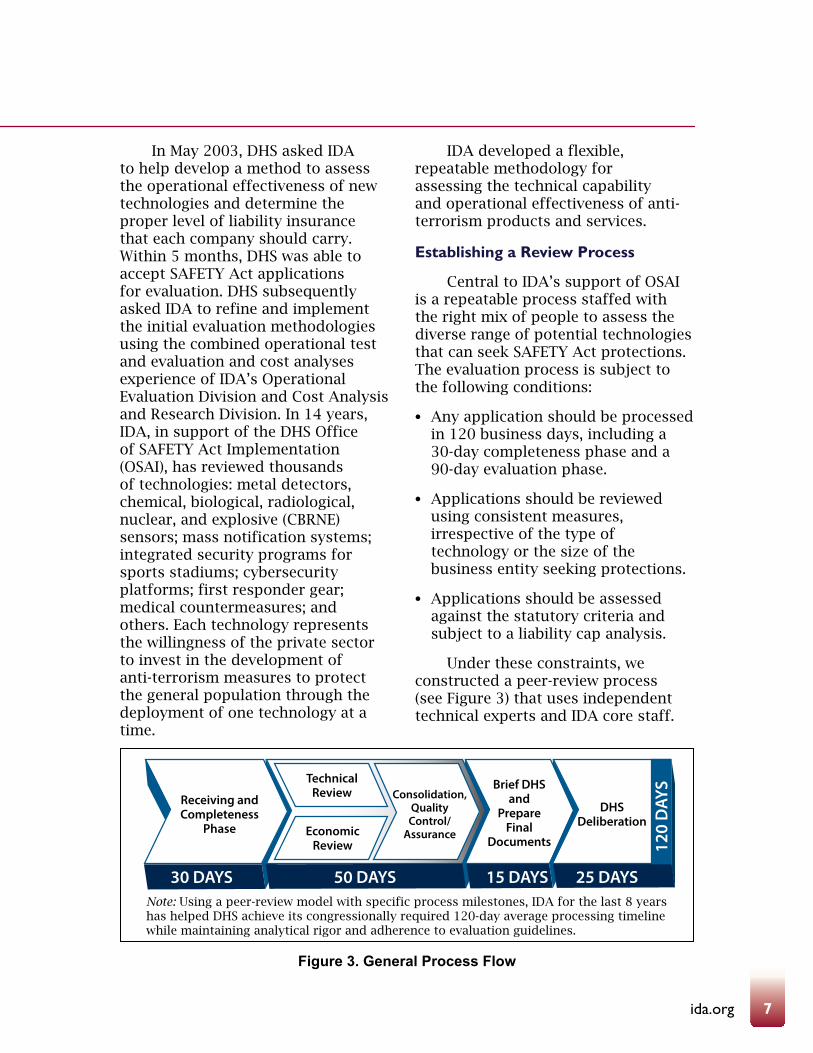
Under these constraints, we constructed a peer-review process (see Figure 3) that uses independent technical experts and IDA core staff.
Receiving andCompleteness
Phase
Consolidation,QualityControl/
Assurance
Brief DHSand
PrepareFinal
Documents
DHSDeliberation
TechnicalReview
EconomicReview
30 DAYS 50 DAYS 15 DAYS 25 DAYS
120
DAY
S
Note: Using a peer-review model with specific process milestones, IDA for the last 8 years has helped DHS achieve its congressionally required 120-day average processing timeline while maintaining analytical rigor and adherence to evaluation guidelines.
Figure 3. General Process Flow
8 Research Notes
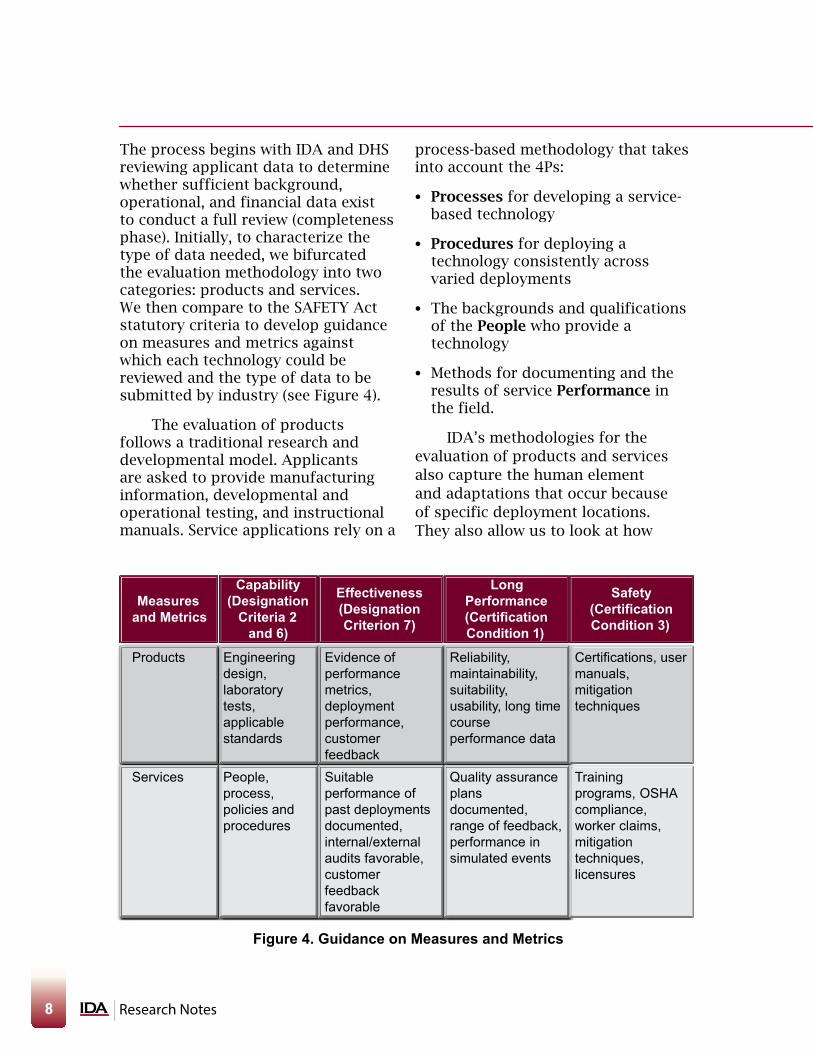
Figure 4. Guidance on Measures and Metrics
The process begins with IDA and DHS reviewing applicant data to determine whether sufficient background, operational, and financial data exist to conduct a full review (completeness phase). Initially, to characterize the type of data needed, we bifurcated the evaluation methodology into two categories: products and services. We then compare to the SAFETY Act statutory criteria to develop guidance on measures and metrics against which each technology could be reviewed and the type of data to be submitted by industry (see Figure 4).
The evaluation of products follows a traditional research and developmental model. Applicants are asked to provide manufacturing information, developmental and operational testing, and instructional manuals. Service applications rely on a
process-based methodology that takes into account the 4Ps:
l Processes for developing a service-based technology
l Procedures for deploying a technology consistently across varied deployments
l The backgrounds and qualifications of the People who provide a technology
l Methods for documenting and the results of service Performance in the field.
IDA’s methodologies for the evaluation of products and services also capture the human element and adaptations that occur because of specific deployment locations. They also allow us to look at how
Measuresand Metrics
Capability(Designation
Criteria 2 and 6)
Effectiveness(DesignationCriterion 7)
LongPerformance(Certification Condition 1)
Safety(Certification Condition 3)
Products Engineeringdesign, laboratory tests, applicable standards
Evidence of performance metrics,deployment performance, customer feedback
Reliability, maintainability, suitability,usability, long time course performance data
Certifications, user manuals, mitigation techniques
Services People, process, policies and procedures
Suitable performance of past deployments documented, internal/external audits favorable,customer feedback favorable
Quality assurance plans documented,range of feedback, performance in simulated events
Training programs, OSHAcompliance, worker claims, mitigation techniques, licensures
9ida.org
technology providers might react to unanticipated future changes in operation (e.g., having to adapt to a future threat), how providers implement quality control measures to support consistent operations or correct problems, and how a provider might ensure that practitioners are hired, trained, and vetted.
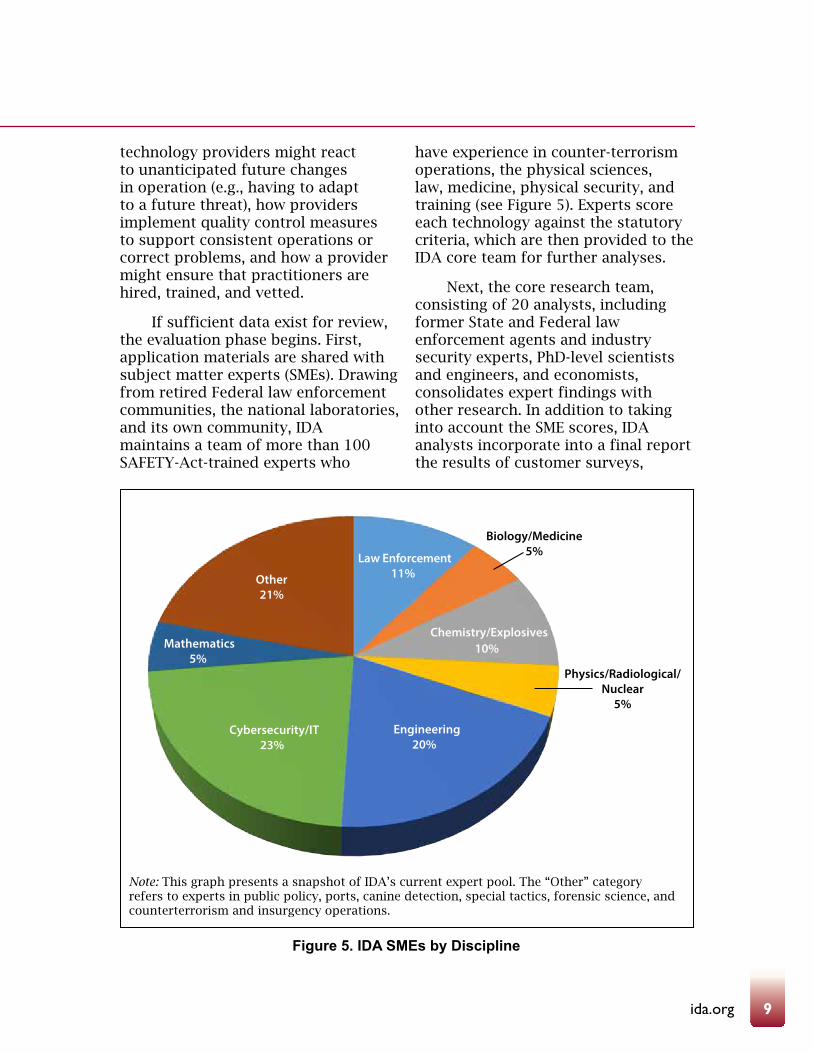
If sufficient data exist for review, the evaluation phase begins. First, application materials are shared with subject matter experts (SMEs). Drawing from retired Federal law enforcement communities, the national laboratories, and its own community, IDA maintains a team of more than 100 SAFETY-Act-trained experts who
have experience in counter-terrorism operations, the physical sciences, law, medicine, physical security, and training (see Figure 5). Experts score each technology against the statutory criteria, which are then provided to the IDA core team for further analyses.
Next, the core research team, consisting of 20 analysts, including former State and Federal law enforcement agents and industry security experts, PhD-level scientists and engineers, and economists, consolidates expert findings with other research. In addition to taking into account the SME scores, IDA analysts incorporate into a final report the results of customer surveys,
Note: This graph presents a snapshot of IDA’s current expert pool. The “Other” category refers to experts in public policy, ports, canine detection, special tactics, forensic science, and counterterrorism and insurgency operations.
Figure 5. IDA SMEs by Discipline
Law Enforcement 11%
Biology/Medicine5%
Chemistry/Explosives
10%
Physics/Radiological/Nuclear
5%
Engineering
20%
Cybersecurity/IT
23%
Mathematics 5%
Other
21%

10 Research Notes
consultations with other government agencies, and independent technical research. This final report also includes the IDA team’s analysis of an applicant’s insurance policies and liability exposure. Each report works through IDA’s quality control process before it is submitted to OSAI. OSAI reviews this report in light of its own analysis and makes a recommendation to the Under Secretary for Science and Technology as to whether a technology should be Designated and Certified, thus completing the process.
Adapting the Review Process
As the need for anti-terrorism products and services grew, industry turned to the SAFETY Act and, in particular, the Approved Products List for Homeland Security to inform purchasing decisions. While purchasing SAFETY Act-approved technologies, venue owners also realized the importance that these protections could have in the development and deployment of integrated security solutions at a specific venue. Starting with the New York Stock Exchange, IDA adapted the base methodology for the evaluation of venue-specific (and campus-specific, in the case of Southern Methodist University) anti-terrorism measures.
We worked to refine methodologies for specific types of venues. For example, IDA, working in collaboration with OSAI and the National Football League (NFL), created a tailored process for the review of stadiums that implement the NFL’s practices for stadium security. This method compares the applicability of various NFL-proprietary security
measures to the SAFETY Act statutory criteria through a set of tailored technical forms and structured interview guides. These forms and questionnaires are accompanied by a guided elicitation tool for SMEs to focus their reviews solely on the implementation of the NFL Best Practices. To date, IDA has assessed the security programs of seven NFL stadiums (see Figure 6), with a specific focus on anti-terrorism measures such as active shooter prevention and response and measures for minimizing the risks from improvised explosive devices (IEDs).
Similarly, with the increasing prevalence of cyber attacks, IDA is working with DHS to develop tailored methodologies for the assessment of corporate cybersecurity solutions that protect electrical generation and distribution systems. This method ties the SAFETY Act statutory criteria to the National Institute of Standards and Technology (NIST) Cybersecurity Framework and other standards such as NIST Special Publications (SP) 800-53 Revision 4 (Security and Privacy Controls for Federal Information Systems and Organizations) and NIST SP 800-82 Revision 2 (Guide to Industrial Control Systems (ICS) Security).
These tailored methods for physical and cybersecurity measures retain the fundamental principles of SAFETY Act reviews (the need for developmental and operational test data and for information on processes, procedures, people, and performance) while accounting for specific threat types and industry guidance.

11ida.org
Evaluation Process
IDA’s evaluation process has been successfully implemented to review several thousand applications, resulting in 934 individual SAFETY Act Designations and Certifications in the past 14 years (see Table 1). At the end of July 2017, 75 technologies had received SAFETY Act protections
in Fiscal Year (FY) 2017, representing over $3 billion in revenue and over 81,000 employees. Thirty-five percent of these technologies were provided by small businesses. The 2017 SAFETY Act Designations and Certifications include:
l Autonomous aerial reconnaissance and surveillance systems that can
(a) (b) Note: (a) The author (right) and a DHS-colleague at Lambeau Field (home of the Green Bay Packers) during the development of an NFL-specific methodology for stadium security program evaluations; (b) An IDA analyst, Mr. Gregory Olmstead, on a site visit to the University of Phoenix Stadium (home of the Arizona Cardinals)
Figure 6. Assessing the Security Programs of NFL Stadiums
Table 1. Numbers of SAFETY Act Awards Since FY 2012
FY12 FY13 FY14 FY15 FY16 FY17
Certi�cation 3 1 2 1 1 4
Designation & Certi�cation 24 14 19 19 26 29
Designation 40 39 35 57 41 46
DT&E Designation 6 6 9 10 8 12
Total 73 60 65 87 76 91
FY12TYPE FY13 FY14 FY15 FY16 FY17
12 Research Notes
be deployed from land or sea for border surveillance
l Computed-tomography systems for the detection of explosives and other prohibited items in carry-on luggage at airports or other screening checkpoints
l Security personnel who provide access control and crowd management at sporting events, business conventions, and concerts
l The physical security program for Gillette Stadium, home of the New England Patriots.
These technologies, along with hundreds of others, are used by first responders, law enforcement and public safety agencies, and private security providers. They touch all aspects of American life—where we shop, how we travel, where we learn, and where we play. They help us communicate faster in crises and help keep our data secure. Each product or service was painstakingly reviewed to ensure that if a business is granted liability protections to help it succeed, Americans will benefit from technically sound anti-terrorism solutions. For
14 years, IDA’s evaluation method has adapted to changing threat environments and industrial innovation and is poised to continue to do so as DHS seeks to respond, deter, and protect against acts of terrorism that might otherwise become simply another date or hashtag.
Acknowledgments
IDA wishes to thank DHS OSAI, particularly Director Bruce Davidson and Deputy Director Rachel Abreu, for its continued sponsorship. The SAFETY Act task at IDA is supported annually by more than 100 analysts across the IDA Systems and Analyses Center’s eight divisions and the IDA Science and Technology Policy Institute. The author wishes to thank the core staff of Mr. David Berezansky, Ms. Larysa Murray, Mr. David Greene, Ms. Dina Gregory, Mr. Gregory Olmstead, Mr. John Seidenberg, Mr. Tj O’Connor, Ms. Nancy LeMieux, Mr. Christopher Lawyer, Ms. EunRae Oh, Ms. Amelia DiAngelo, Mr. Scott Bidlack, Mr. Ryan Ellman, Dr. Dennis Kimko, Dr. John Bailey, Dr. Dmitriy Mayorov, and Dr. Thomas Frazier.
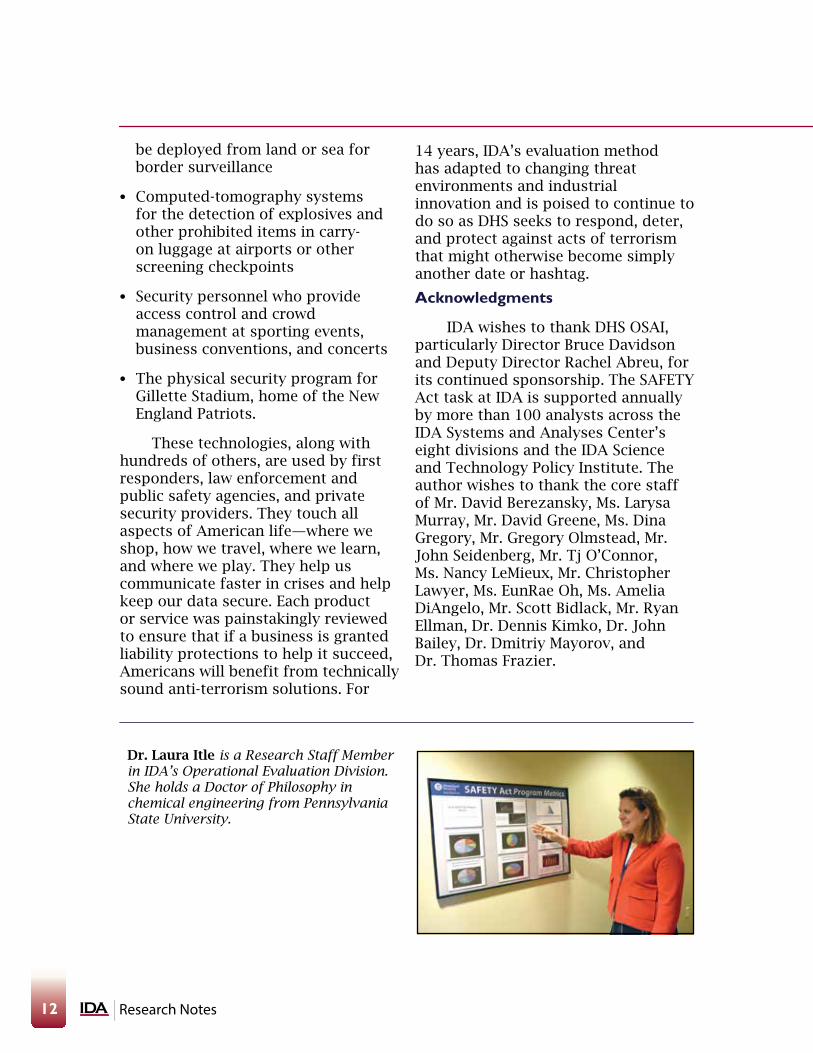
Dr. Laura Itle is a Research Staff Member in IDA’s Operational Evaluation Division. She holds a Doctor of Philosophy in chemical engineering from Pennsylvania State University.

13ida.org
The Problem
For many years, those caught attempting illegal entry across the border between the United States and Mexico were rarely subjected to legal consequence. This situation began to change in the mid-2000s, and, by 2010, most of those caught were subjected to some kind of consequence. Has imposing consequences on those caught deterred them from further attempts to enter the United States illegally? What types of consequences are more effective at creating deterrence?
Enforcement of immigration laws at U.S. national borders is intended to prevent and deter illegal entry. Border enforcement agencies achieve these goals by catching or apprehending someone who is attempting illegal entry and then applying legal consequences to these people. Border enforcement is primarily carried out by component agencies of the Department of Homeland Security (DHS):
l The U.S. Coast Guard, which manages the maritime domain
l The Office of Field Operations (OFO), which is responsible for managing ports of entry where legal entry into the United States takes place
l The U.S. Border Patrol (USBP), which is responsible for managing land borders between ports of entry.
USBP has made most of the apprehensions of those attempting illegal entry across U.S. borders, and most of its historical apprehensions have been Mexican nationals who were attempting entry across the border between the United States and Mexico. For many decades, most Mexicans who were caught were not subjected to any legal consequence but, instead, were allowed to “voluntarily return” to Mexico, usually on the same day that they were caught. Starting in 2005, however, USBP began to apply meaningful consequences to an increasing degree, and, by 2015, almost no apprehended Mexican national received a voluntary return. Figure 1 shows that the application of voluntary return fell from 96 percent of all apprehensions in 2005 to 1 percent in 2015.
USBP has applied three basic types of consequences—administrative, programmatic, and criminal—to Mexican nationals caught in the U.S.-Mexico border region.
Does Imposing Consequences Deter Attempted Illegal Entry into the United States?Sarah Burns, John Whitley, Bryan Roberts, and Brian Rieksts
More than one consequence can be applied to a particular individual...Many different combinations of consequences are applied in practice. The application of consequences also varies along the border.

14 Research Notes
Administrative consequences include expedited removals (ERs) and reinstatement of removals (RRs), both of which impose bans on the ability to migrate to the United States legally in the future and increase the chance of being criminally prosecuted if caught again. Of those apprehended, the percentage subjected to an ER or RR rose from nearly 0 percent in 2005 to almost 100 percent in 2015.
Programmatic consequences include the Alien Transfer Exit Program (ATEP), in which someone is returned to Mexico at a place far away from where he/she was caught, and the Mexican Interior Repatriation Program (MIRP), which identifies Mexicans from the interior of Mexico and flies them to their home towns. MIRP ended in 2012 due to the program’s high cost. The percentage of those subjected to a programmatic consequence rose from 15 percent in 2009 to a peak of 45 percent in 2012, followed by a fall to 30 percent in 2015.
Criminal consequences include a standard prosecution, which is a criminal prosecution of a migrant for violation of immigration law and/or any other federal law that DHS can enforce (drug violations, human smuggling, assault, and so forth), and a Streamline prosecution, which is typically a felony illegal entry charge that is pled down to a misdemeanor illegal entry charge. USBP uses a decision algorithm to identify what consequence should be imposed on the people whom they apprehend, given the person’s previous encounters with USBP, the availability of resources, and other factors.
An important point to note is that more than one consequence can be applied to a particular individual. For example, someone could receive an expedited removal and also be subject to the ATEP. Many different combinations of consequences are applied in practice. The application of consequences also varies along the border. more than one consequence can be applied to a particular
Figure 1. Percentage of Mexican Nationals Apprehended on the U.S.-Mexico Border Allowed to Voluntarily Return
2005 2006 2007 2008 2009 2010 2011 2012 2013 2014 2015
96% 94% 92%85%
60%54%
29%
12%5% 7%
1%
15ida.org
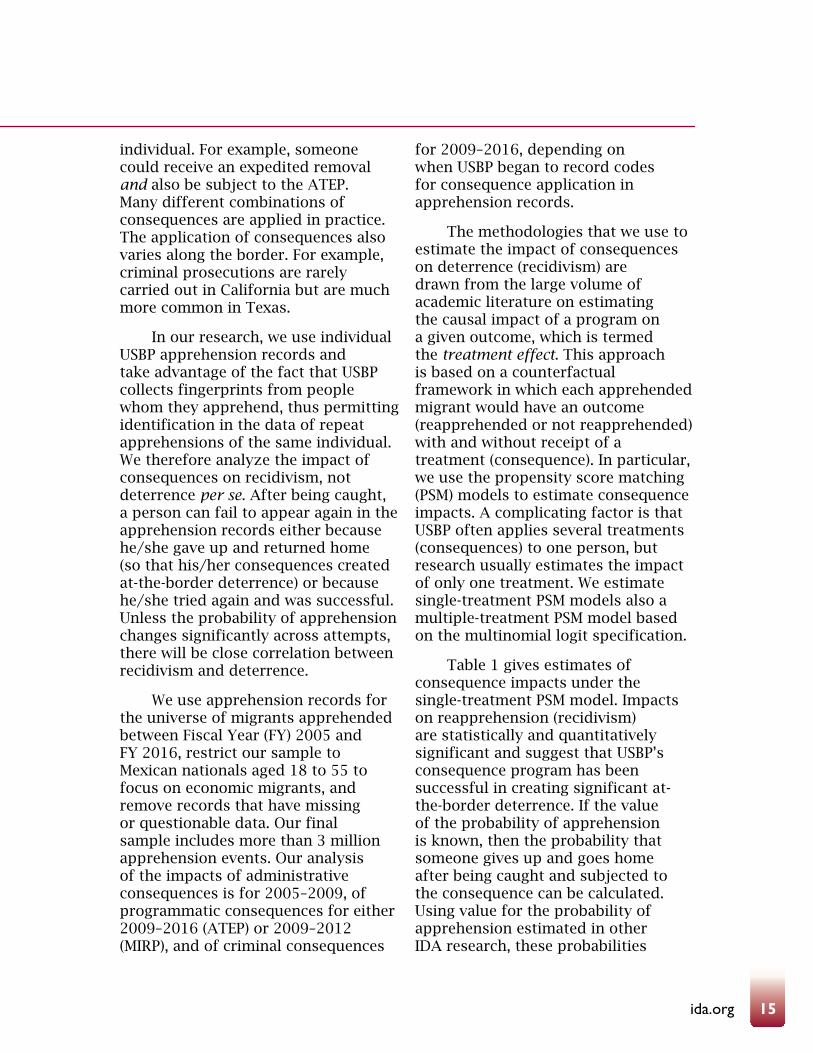
individual. For example, someone could receive an expedited removal and also be subject to the ATEP. Many different combinations of consequences are applied in practice. The application of consequences also varies along the border. For example, criminal prosecutions are rarely carried out in California but are much more common in Texas.
In our research, we use individual USBP apprehension records and take advantage of the fact that USBP collects fingerprints from people whom they apprehend, thus permitting identification in the data of repeat apprehensions of the same individual. We therefore analyze the impact of consequences on recidivism, not deterrence per se. After being caught, a person can fail to appear again in the apprehension records either because he/she gave up and returned home (so that his/her consequences created at-the-border deterrence) or because he/she tried again and was successful. Unless the probability of apprehension changes significantly across attempts, there will be close correlation between recidivism and deterrence.
We use apprehension records for the universe of migrants apprehended between Fiscal Year (FY) 2005 and FY 2016, restrict our sample to Mexican nationals aged 18 to 55 to focus on economic migrants, and remove records that have missing or questionable data. Our final sample includes more than 3 million apprehension events. Our analysis of the impacts of administrative consequences is for 2005–2009, of programmatic consequences for either 2009–2016 (ATEP) or 2009–2012 (MIRP), and of criminal consequences
for 2009–2016, depending on when USBP began to record codes for consequence application in apprehension records.
The methodologies that we use to estimate the impact of consequences on deterrence (recidivism) are drawn from the large volume of academic literature on estimating the causal impact of a program on a given outcome, which is termed the treatment effect. This approach is based on a counterfactual framework in which each apprehended migrant would have an outcome (reapprehended or not reapprehended) with and without receipt of a treatment (consequence). In particular, we use the propensity score matching (PSM) models to estimate consequence impacts. A complicating factor is that USBP often applies several treatments (consequences) to one person, but research usually estimates the impact of only one treatment. We estimate single-treatment PSM models also a multiple-treatment PSM model based on the multinomial logit specification.
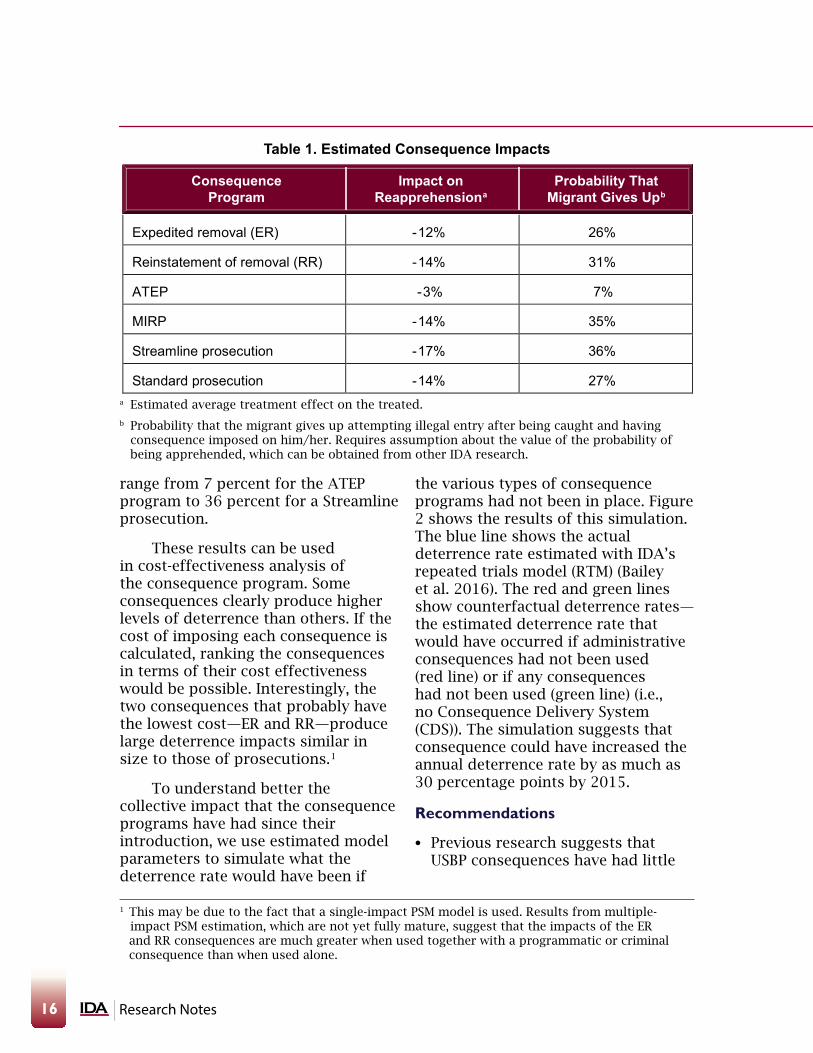
Table 1 gives estimates of consequence impacts under the single-treatment PSM model. Impacts on reapprehension (recidivism) are statistically and quantitatively significant and suggest that USBP’s consequence program has been successful in creating significant at-the-border deterrence. If the value of the probability of apprehension is known, then the probability that someone gives up and goes home after being caught and subjected to the consequence can be calculated. Using value for the probability of apprehension estimated in other IDA research, these probabilities
16 Research Notes
1 This may be due to the fact that a single-impact PSM model is used. Results from multiple- impact PSM estimation, which are not yet fully mature, suggest that the impacts of the ER and RR consequences are much greater when used together with a programmatic or criminal consequence than when used alone.
range from 7 percent for the ATEP program to 36 percent for a Streamline prosecution.
These results can be used in cost-effectiveness analysis of the consequence program. Some consequences clearly produce higher levels of deterrence than others. If the cost of imposing each consequence is calculated, ranking the consequences in terms of their cost effectiveness would be possible. Interestingly, the two consequences that probably have the lowest cost—ER and RR—produce large deterrence impacts similar in size to those of prosecutions.1
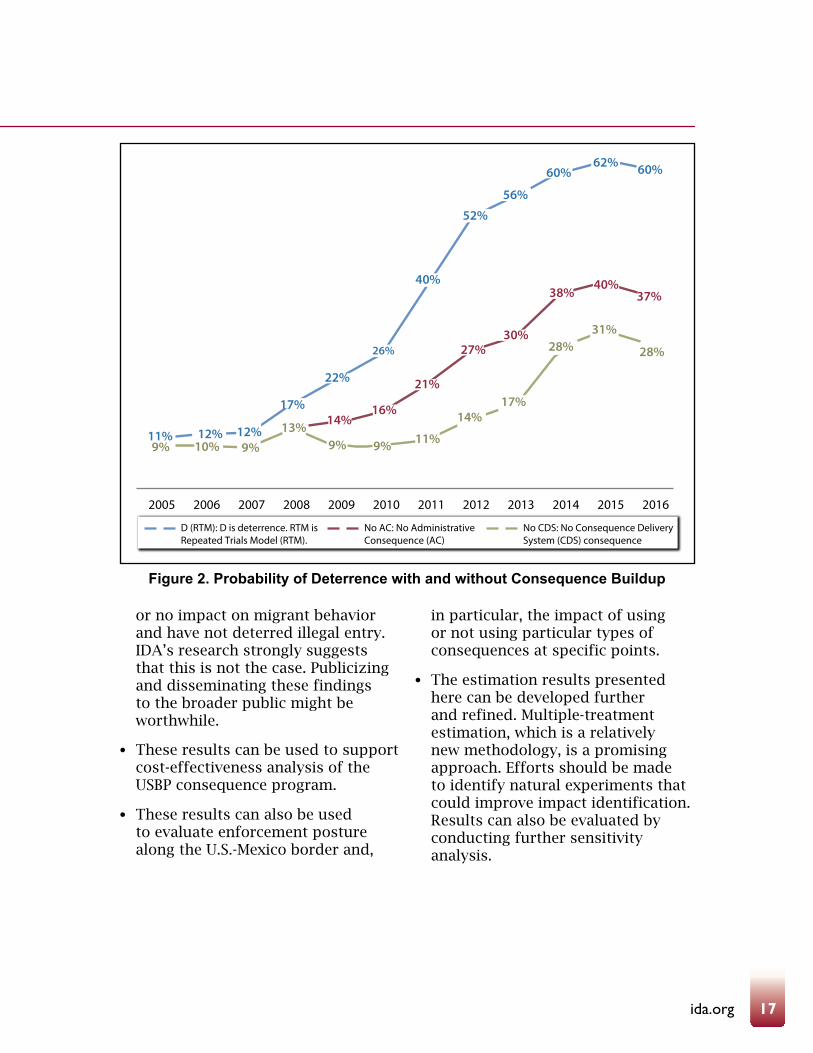
To understand better the collective impact that the consequence programs have had since their introduction, we use estimated model parameters to simulate what the deterrence rate would have been if
the various types of consequence programs had not been in place. Figure 2 shows the results of this simulation. The blue line shows the actual deterrence rate estimated with IDA’s repeated trials model (RTM) (Bailey et al. 2016). The red and green lines show counterfactual deterrence rates—the estimated deterrence rate that would have occurred if administrative consequences had not been used (red line) or if any consequences had not been used (green line) (i.e., no Consequence Delivery System (CDS)). The simulation suggests that consequence could have increased the annual deterrence rate by as much as 30 percentage points by 2015.
Recommendations
l Previous research suggests that USBP consequences have had little
a Estimated average treatment effect on the treated.
b Probability that the migrant gives up attempting illegal entry after being caught and having consequence imposed on him/her. Requires assumption about the value of the probability of being apprehended, which can be obtained from other IDA research.
Table 1. Estimated Consequence Impacts
ConsequenceProgram
Expedited removal (ER) -12% 26%
Reinstatement of removal (RR) -14% 31%
ATEP -3% 7%
MIRP -14% 35%
Streamline prosecution -17% 36%
Standard prosecution -14% 27%
Impact onReapprehensiona
Probability ThatMigrant Gives Upb
17ida.org
or no impact on migrant behavior and have not deterred illegal entry. IDA’s research strongly suggests that this is not the case. Publicizing and disseminating these findings to the broader public might be worthwhile.
l These results can be used to support cost-effectiveness analysis of the USBP consequence program.
l These results can also be used to evaluate enforcement posture along the U.S.-Mexico border and,
in particular, the impact of using or not using particular types of consequences at specific points.
l The estimation results presented here can be developed further and refined. Multiple-treatment estimation, which is a relatively new methodology, is a promising approach. Efforts should be made to identify natural experiments that could improve impact identification. Results can also be evaluated by conducting further sensitivity analysis.
Figure 2. Probability of Deterrence with and without Consequence Buildup
11%
60%62%60%
56%
52%
40%
26%
22%
17%
12%12%9% 10% 9%
13%9% 9% 11%
14%17%
28% 28%
31%
14%16%
21%
27%30%
38%40%
37%
2005 2006 2007
D (RTM): D is deterrence. RTM isRepeated Trials Model (RTM).
No AC: No AdministrativeConsequence (AC)
No CDS: No Consequence DeliverySystem (CDS) consequence
2008 2009 2010 2011 2012 2013 2014 2015 2016

18 Research Notes
Reference
Bailey, John, Sarah K. Burns, David F. Eisler, Clare C. Fletcher, Thomas P. Frazier, Brandon R. Gould, Kristen M. Guerrera, Terry C. Heuring, Brian Q. Rieksts, Bryan Roberts, and John E. Whitley. 2016. Assessing Southern Border Security. IDA Paper NS P-5304, Revised. Alexandria, VA: Institute for Defense Analyses, May.
Dr. John Whitley (second from right, facing away) is an Adjunct Research Staff Member in IDA’s Cost Analysis and Research Division. He holds a Doctor of Philosophy in economics from the University of Chicago.
Dr. Bryan Roberts (third from right) is an Adjunct Research Staff Member in IDA’s Cost Analysis and Research Division. He holds a Doctor of Philosophy in economics from the Massachusetts Institute of Technology.
Dr. Sarah Burns (third from left) is a Research Staff Member in IDA’s Cost Analysis and Research Division. She holds a Doctor of Philosophy in economics from the University of Kentucky.
Dr. Brian Rieksts (center in blue shirt) is a Research Staff Member in IDA’s Cost Analysis and Research Division. He holds a Doctor of Philosophy in industrial engineering and operations research from Pennsylvania State University.
19ida.org
The Problem
The current infrastructures that support the nation’s communications comprise a highly interconnected set of commercial, private, and public networks. National Security and Emergency Preparedness (NS/EP) communications depend on these infrastructures, but, unfortunately, these interconnected networks and capabilities are neither fully documented nor fully understood.
The U.S. Government has long recognized the critical role of resilient government communications in handling national security and emergency incidents. Following the 1962 Cuban Missile Crisis, President John F. Kennedy established the National Communications System (NCS) via Presidential Memorandum in 1963 to provide better communications support to critical government functions during national emergencies. In 1984, President Ronald Reagan signed Executive Order (E.O.) 12472 (Assignment of National Security and Emergency Preparedness Telecommunications Functions), which expanded the NCS from its original six members to an interagency group of 23 federal departments and agencies tasked with coordinating and planning NS/EP telecommunications to provide support during crises and disasters. In 2003, President George W. Bush transferred the NCS from the Department of Defense (DoD) to the Department of Homeland Security (DHS) in accordance with E.O. 13286 (Amendment of Executive Orders, and Other Actions, in Connection with the Transfer of Certain Functions to the Secretary of Homeland Security). In 2012, President Barack Obama replaced E.O. 12472 by signing E.O. 13618 (Assignment of National Security and Emergency Preparedness Communications Functions).
E.O. 13618 dissolved the NCS and established the NS/EP Communications Executive Committee (ExCom), which comprises eight Assistant Secretary-level representatives of departments and agencies to serve as the forum for addressing survivable, resilient, enduring, and effective domestic and international communications. The designees of the Secretary of Homeland Security and the Secretary of Defense serve as co-chairs of the ExCom.
Improving Shared Understanding of National Security and Emergency Preparedness Communications Serena Chan
IDA’s research on NS/EP communications contributes to continuous data collection and reporting while enabling sustained coordination of the evolving interagency NS/EP communication architecture and the application of advanced analytical tools.

20 Research Notes
Pursuant to Section 3.3, the ExCom is responsible for the following activities:
l Advising and making policy recommendations to the President on enhancing the survivability, resilience, and future architecture of NS/EP communications, including what should constitute NS/EP communication requirements
l Developing a long-term strategic vision for NS/EP communications and proposing funding requirements and places for NS/EP communications initiatives that benefit multiple agencies or other Federal entities
l Coordinating the planning for, and provision of, NS/EP communications for the Federal Government under all hazards
l Promoting the incorporation of the optimal combination of hardness, redundancy, mobility, connectivity, interoperability, restorability, and security to obtain, to the maximum extent practicable, the survivability of NS/EP communications under all circumstances
l Recommending the regimes for testing, exercising, and evaluating the capabilities of existing and planning communications systems, networks, or facilities to meet all executive branch NS/EP communications requirements, including any recommended
understanding of the systems, components, and data flows that characterize NS/EP communications; leverage that understanding to improve department and agency internal and interagency communication systems’ support for mission-essential functions; identify policy, resource, and capability gaps; and improve analyses that support critical decisions. With DHS sponsorship, IDA worked closely with three participating departments and agencies: DoD’s National Leadership Command Capabilities Management Office, the Department of Justice’s Federal Bureau of Investigation, and the Department of Commerce’s National Oceanic and Atmospheric Administration. Our goal was to help the ExCom working groups accurately characterize and understand the NS/EP communications environment to improve analytical capabilities and decision-making processes.
We developed an information model to support the required NS/EP communications architecture data and instantiated it in a Microsoft (MS) Access database to function as a repository. We developed a user interface—the National Security and Emergency Preparedness Communications Architecture Data Entry Tool (NECADET)—to facilitate data entry and data query for generating architecture views and identifying gaps in survivability against hazards. We thus developed an analytic front end to the repository—the NS/EP Data Analysis Tool (NEDAT)—to support the visualization of mission threads and the status of their systems in the context of hazard scenarios. Figure 1 illustrates the
remedial actions.
Approach
In support of the NS/EP Communications ExCom, IDA’s objective was to provide comprehensive
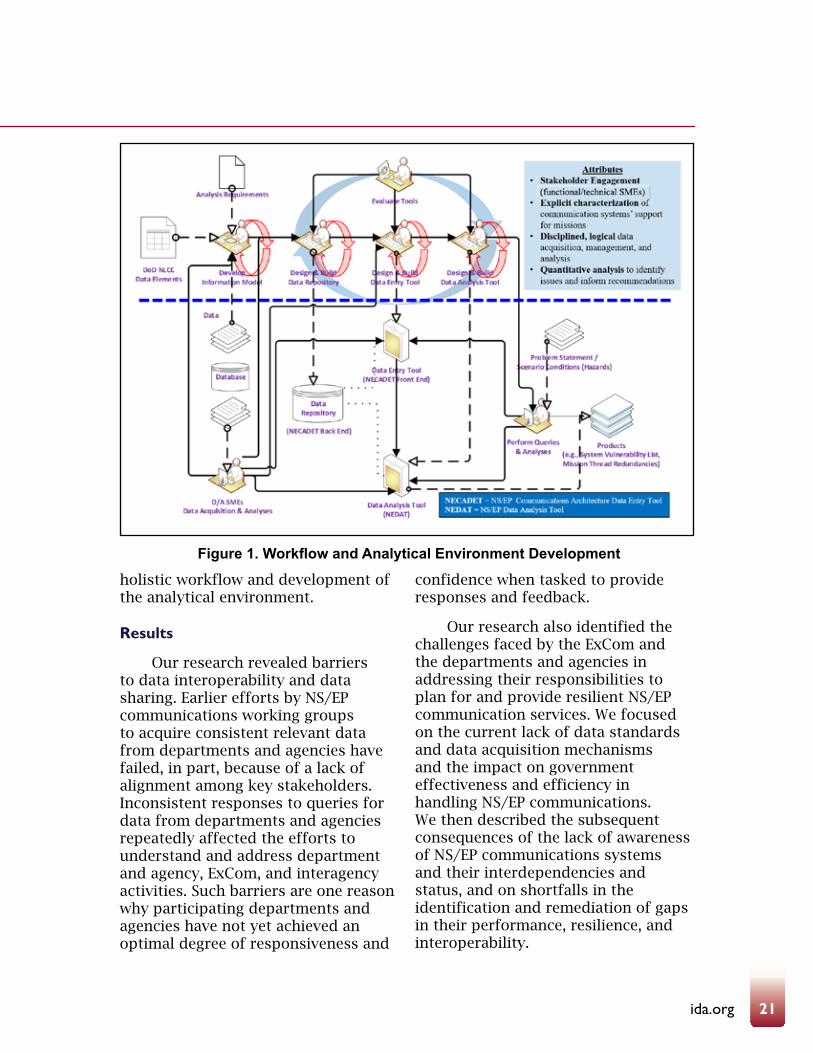
21ida.org
holistic workflow and development of the analytical environment.
Results
Our research revealed barriers to data interoperability and data sharing. Earlier efforts by NS/EP communications working groups to acquire consistent relevant data from departments and agencies have failed, in part, because of a lack of alignment among key stakeholders. Inconsistent responses to queries for data from departments and agencies repeatedly affected the efforts to understand and address department and agency, ExCom, and interagency activities. Such barriers are one reason why participating departments and agencies have not yet achieved an optimal degree of responsiveness and
confidence when tasked to provide responses and feedback.
Our research also identified the challenges faced by the ExCom and the departments and agencies in addressing their responsibilities to plan for and provide resilient NS/EP communication services. We focused on the current lack of data standards and data acquisition mechanisms and the impact on government effectiveness and efficiency in handling NS/EP communications. We then described the subsequent consequences of the lack of awareness of NS/EP communications systems and their interdependencies and status, and on shortfalls in the identification and remediation of gaps in their performance, resilience, and interoperability.
Figure 1. Workflow and Analytical Environment Development
22 Research Notes
After identifying the current problems and their impacts, we proposed using an approach to information acquisition and sharing based on the National Information Exchange Model (NIEM) to improve the understanding, policy development, and resilience of NS/EP communications systems. NIEM is an existing government-wide best practice for information sharing, and a NIEM-based approach will enable NS/EP communications architecture efforts to reuse data and improve support for machine processability. We also discussed the potential cost savings of implementing this approach by leveraging existing relevant reporting mechanisms, data elements, and Federal information portals.
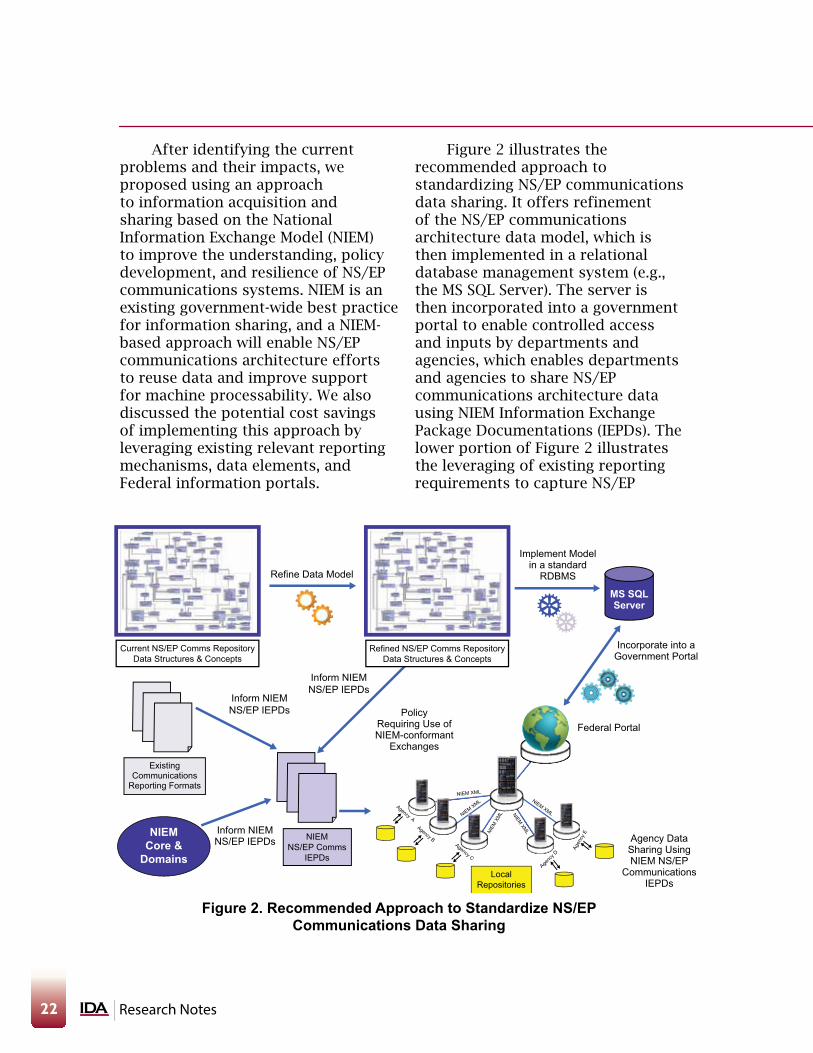
Figure 2 illustrates the recommended approach to standardizing NS/EP communications data sharing. It offers refinement of the NS/EP communications architecture data model, which is then implemented in a relational database management system (e.g., the MS SQL Server). The server is then incorporated into a government portal to enable controlled access and inputs by departments and agencies, which enables departments and agencies to share NS/EP communications architecture data using NIEM Information Exchange Package Documentations (IEPDs). The lower portion of Figure 2 illustrates the leveraging of existing reporting requirements to capture NS/EP
Figure 2. Recommended Approach to Standardize NS/EP Communications Data Sharing
NIEMNS/EP Comms
IEPDs
LocalRepositories
ExistingCommunications
Reporting Formats
Refine Data Model
Federal Portal
Inform NIEMNS/EP IEPDs
Inform NIEMNS/EP IEPDs Policy
Requiring Use ofNIEM-conformant
Exchanges
Agency A
NIEM XML
NIEM
XM
L
NIEM XMLNIEM XM
L
NIEM XML
Agency BAgency C
Inform NIEMNS/EP IEPDs
Implement Modelin a standard
RDBMS
Incorporate into aGovernment Portal
Agency DataSharing UsingNIEM NS/EP
CommunicationsIEPDs
NIEMCore &
DomainsAge
ncy D
Agen
cy E
Current NS/EP Comms RepositoryData Structures & Concepts
Refined NS/EP Comms RepositoryData Structures & Concepts
MS SQLServer

23ida.org
communications architecture data using NIEM IEPDs. The IEPDs are informed by the requirements of the refined data model and the existing relevant reporting requirements. This approach depends on a policy that requires NIEM-conformant data sharing of this information.
Lessons learned from IDA’s analyses were categorized into the following areas of concern: governance and management, data acquisition, data modeling, data repository tools, and visualizations. Within each topic, specific lessons learned were summarized with a description of the problem or success, the impact of the problem, and recommendations to improve the situation or promote the success.
Conclusions
After identifying current problems and their impacts, we described opportunities for improving NS/EP communications systems understanding, policy development, and resilience, using an approach to information acquisition and sharing based on NIEM. By adopting standardized vocabularies and machine-processable formats to support structured reporting of NS/EP communications architecture data, many of the identified weaknesses in data interoperability and data sharing could be eliminated and substantive benefits could accrue. We recommended key activities that would be necessary when adopting a NIEM-based approach to information collection and dissemination in support of NS/EP communications architecture analysis.
Adopting and implementing NIEM-enabled repositories would enable individual departments and agencies to:
l Improve documentation of communications systems, and their interdependencies and gaps in resiliency
l Enhance understanding of internal and external mission-critical dependencies
l Improve the resilience of communication systems in the face of all hazards
l Reduce long-term costs in communications systems and services that result from cross- department and -agency contracting.
The ExCom, under its E.O. 13618 responsibilities, could facilitate the development of NIEM-based workflows of NS/EP communications data acquisition and analysis via policy recommendations to support implementation, align reporting capabilities under its authorities, and propose funding requirements and plans for data repositories and portals. Although the efforts involved are substantial, their coordination across the ExCom departments and agencies would significantly enhance unity of effort across the departments and agencies and eliminate the duplication of effort and the conflicts that could occur if each department and agency pursued such capabilities independently. The IDA-recommended way forward would enable the NS/EP Communications ExCom to meet
24 Research Notes
its responsibilities effectively and efficiently in:
l Conducting rigorous analysis designed to inform critical decisions
l Identifying NS/EP communications resiliency gaps
l Anticipating NS/EP communications requirements
l Enhancing NS/EP community interoperability
l Improving allocation of resources to priority requirements
l Identifying and addressing excess capabilities
l Facilitating coordination of cross-department and -agency contracting for shared services, technology, and commercial telecommunications to reduce communications acquisition costs
l Promoting resilient, robust, and interoperable NS/EP communications capabilities.
Acknowledgments
The author wishes to thank the members of IDA’s National Security and Emergency Preparedness team: Brian Haugh, Francisco Loaiza-Lemos, Ned Snead, and Steve Wartik.
References
Chan, Serena, Brian A. Haugh, Francisco L. Loaiza-Lemos, Edward W. Snead, and Steven P. Wartik. 2016. National Security and Emergency Preparedness Communications Architecture Analysis. Vol. I, Project Overview. IDA Document D-5753. Alexandria, VA: Institute for Defense Analyses, March.
Chan, Serena, Brian A. Haugh, Francisco L. Loaiza-Lemos, Edward W. Snead, and Steven P. Wartik. 2016. National Security and Emergency Preparedness Communications Architecture Analysis. Vol. II, Repository Development. IDA Document D-5753. Alexandria, VA: Institute for Defense Analyses, March.
Chan, Serena, Brian A. Haugh, Francisco L. Loaiza-Lemos, Edward W. Snead, and Steven P. Wartik. 2017. Improving Shared Understanding of National Security and Emergency Preparedness Communications to Promote Enhanced Communications Resilience. IDA Document D-8045. Alexandria, VA: Institute for Defense Analyses, February.
Chan, Serena, Brian A. Haugh, Francisco L. Loaiza-Lemos, Edward W. Snead, and Steven P. Wartik. 2017. Lessons Learned for NS/EP Communications Architecture Analysis. IDA Document D-8377. Alexandria, VA: Institute for Defense Analyses, February.
Dr. Serena Chan is a Research Staff Member in IDA’s Information Technology and Systems Division. She holds a Doctor of Philosophy in engineering systems from the Massachusetts Institute of Technology.

25ida.org
The Problem
The numbers and capabilities of unmanned aerial vehicles (UAVs) are growing. Many have attributes that make them formidable military tools and threats to homeland security. Consequently, a growing number of counter-UAV systems are being offered by foreign vendors.
Overview
Over the last decade the numbers, types, and capabilities of unmanned aerial vehicles (UAVs) available to military forces, domestic security forces, non-state actors, commercial interests, and even private citizens have grown substantially. Offerings range from large, expensive fixed-wing high-altitude/long-endurance UAVs, which are affordable only to nation states, down to low-cost, low-flying small and micro vertical take-off-and-landing (VTOL) models available to everyone. Both armed and unarmed models are marketed. Some unarmed models are being upgraded with aftermarket lethal capabilities by third parties or private individuals using do-it-yourself techniques. Today, some kind of UAV capability is available to virtually all nations, non-state actors, commercial interests, and individuals. Availability is now generally a function of the price point, rather than technological or regulatory constraints. UAVs are becoming ubiquitous.
The capabilities of both large and small UAVs are constantly evolving. They are becoming faster, capable of carrying heavier and more diverse payloads, have longer endurance, and are more autonomous. At the same time, economies of scale are driving down costs of both large and small UAVs.
UAVs offered in the international arms market have attributes that make them formidable military tools. They can distract, disorient, and disrupt military operations, as well as provide direct and indirect support to destroying military equipment and structures. Likewise, some individuals and groups have taken advantage of the wide-scale availability of small commercial UAVs for malicious purposes. The Islamic State of Iraq and the Levant (ISIS), for example, has weaponized small commercial drones using improvised grenades as a lethal payload. Other individuals and groups have used small UAVs to overfly sensitive military and infrastructure facilities, fly in restricted airspace around airports, and spy on famous personalities and their neighbors. Two years ago, an individual
Foreign Counter-Unmanned Aerial Systems: Developments in the International Arms Markets Andrew Hull and David Markov
Today, some kind of UAV capability is available to virtually all nations, non-state actors, commercial interests, and individuals.
26 Research Notes
even landed a small UAV carrying a bottle with traces of radioactive material onto the roof of the Japanese Prime Minister’s office.
Predictably, demand from military, police, and homeland security agencies for technical counters to UAVs is growing. Counter-UAV systems are now a major marketing thrust at international arms and homeland security exhibitions. Options offered encompass a wide variety of approaches, including (1) destroying the UAV, (2) deceiving or evading on-board sensors, (3) disrupting/jamming navigation systems and data links, (4) third-parties taking control of the UAV, and (5) catch/capture systems. A few systems combine several of those approaches. International arms shows offer the full spectrum of countermeasures designed to deal with both large and small UAVs, but with a heavy emphasis on kinetic approaches that destroy UAVs. Security exhibitions, on the other hand, generally concentrate on non-kinetic/not-destructive counters targeted at small, low-flying UAVs.
Destroying UAVs
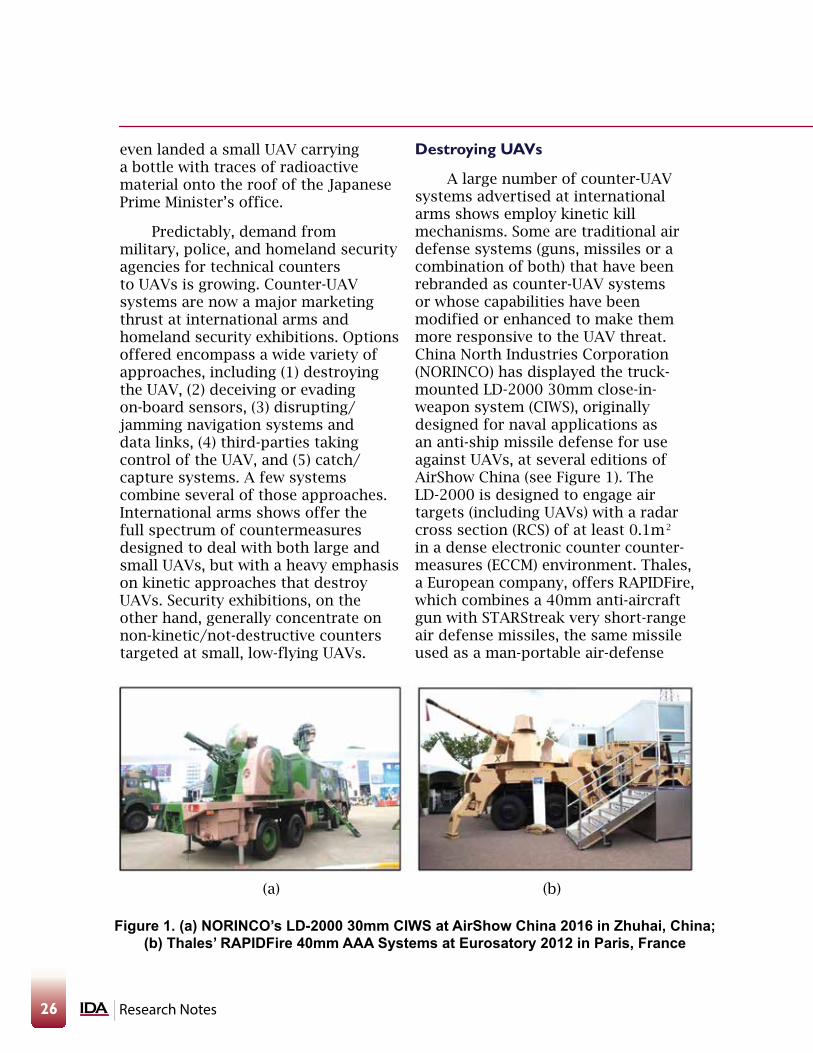
A large number of counter-UAV systems advertised at international arms shows employ kinetic kill mechanisms. Some are traditional air defense systems (guns, missiles or a combination of both) that have been rebranded as counter-UAV systems or whose capabilities have been modified or enhanced to make them more responsive to the UAV threat. China North Industries Corporation (NORINCO) has displayed the truck-mounted LD-2000 30mm close-in-weapon system (CIWS), originally designed for naval applications as an anti-ship missile defense for use against UAVs, at several editions of AirShow China (see Figure 1). The LD-2000 is designed to engage air targets (including UAVs) with a radar cross section (RCS) of at least 0.1m2 in a dense electronic counter counter-measures (ECCM) environment. Thales, a European company, offers RAPIDFire, which combines a 40mm anti-aircraft gun with STARStreak very short-range air defense missiles, the same missile used as a man-portable air-defense
Figure 1. (a) NORINCO’s LD-2000 30mm CIWS at AirShow China 2016 in Zhuhai, China; (b) Thales’ RAPIDFire 40mm AAA Systems at Eurosatory 2012 in Paris, France
(a) (b)

27ida.org
system (MANPADS) to destroy multiple types of air targets, including UAVs (see Figure 1). Thales advertises that RAPIDFire, an anti-aircraft artillery system (AAA), is addressing “the new threats being encountered by armed forces today and in particular the low-cost targets which can attack in swarms and can saturate conventional missile defenses” (Thales Group 2017).
More innovative “kill” concepts include directed energy weapons (DEWs) (systems such as high-power microwaves (HPM), electro-magnetic pulse (EMP), and various kinds of lasers). HPEMcounterUAS from Diehl Defense, a German company, uses HPM to attack semiconductors inside the control systems of UAVs. Targets become inoperable upon the impact of HPM pulses triggering a fail-safe mode. Diehl Defense literature offers scalable ranges up to several hundred meters and the capability of engaging swarms of mini-UAVs simultaneously. Russia’s United Instrument Manufacturing Corporation also discussed a microwave gun with military specialists at a closed event at the ARMY-2016 exhibition held in a venue outside Moscow, Russia. Company officials said the weapon
is capable of firing super-high-frequency electromagnetic waves, a kind of EMP approach to suppress equipment on board low-altitude aircraft. Researchers at China’s Air Force Engineering University published a paper in Laser & Infrared in 2013 that discussed advantages of using lasers against small, slow targets, including target detection and destruction with a laser weapon. Four years later, NORINCO displayed such a system, called Silent Hunter, at the International Defense Exhibition and Conference (IDEX) 2017 in Abu Dhabi, United Arab Emirates (UAE) (see Figure 2). It is primarily designed to destroy small, low-altitude UAVs using variable power (5kW to 30kW) lasers mounted on a truck or in a fixed stand-alone box at ranges up to 2 kilometers. NORINCO claims that Silent Hunter is capable of destroying more than 30 UAVs with a 100 percent success rate during the system’s state acceptance testing.
Rheinmetall, a German company, showed the Oerlikon Skyshield turret equipped with a high-energy laser effector at IDEX 2017 to deal with low, slow air threats (see Figure 2).
Figure 2. (a) Silent Hunter and (b) Skyshield on Display at IDEX 2017 (a) (b)

28 Research Notes
Skyshield employs multiple high-energy laser beams superimposed and focused on one spot on the target. Rafael Advance Systems, an Israeli company, has also marketed its Iron Beam high-energy vehicle-mounted laser for dealing with very short-range small airborne targets and as a counter rocket, artillery, and mortar system (C-RAM). Iron Beam uses two separately located high-power fiber-optic lasers working in tandem.
Disrupting/Jamming Navigation Systems and Data Links
Electronically jamming a UAV’s links to space-based navigation systems like GPS and jamming radio links passing data are perhaps the most popular non-kinetic approach to countering UAVs. Several such systems were displayed by various Russian firms at ARMY-2016. One in particular was the United Instrument Manufacturing Corporation’s Shipovnik-AERO Electronic Warfare System (see Figure 3), which requires about 25 seconds for detecting a UAV and jamming its control signal. It employs wide-band countermeasures to jam all signals, narrow-band
countermeasures to jam a certain frequency band, or information countermeasures to distort information.
At Airshow China 2016, held in Zhuhai, China, a number of counter-UAS solutions from Chinese companies were introduced. Three of those solutions included (1) Xinxing Cathay International Group’s Counter-UAS System, which is designed to jam the on-board navigation, ground control, and video datalink systems, (2) CETC’s JN3141 Remote Control UAV Jammer, which is a rifle-style counter-UAV system that jams the on-board satellite navigation system, and (3) ZR Aerospace’s Counter-UAS System, which jams the on-board navigation and ground control systems. See Figure 4.
Deceiving or Evading On-Board Sensors
Some counters concentrate on defeating the UAV’s sensors, rather than the platform. These approaches range from rather simple, do-it-yourself (DIY) methods to purpose-built systems being offered in the
Source: HoangSa.net (2016).
Figure 3. Shipovnik-AERO Electronic Warfare System Discussed at ARMY-2016

29ida.org
international arms market. Western anti-drone activists, for example, have developed the technique of using high-power spotlights or commercial lasers to blind on-board electro-optical (EO) sensors of low-flying UAVs by concentrating light on the forward lower portion of the small UAV’s nose where these sensors are located.
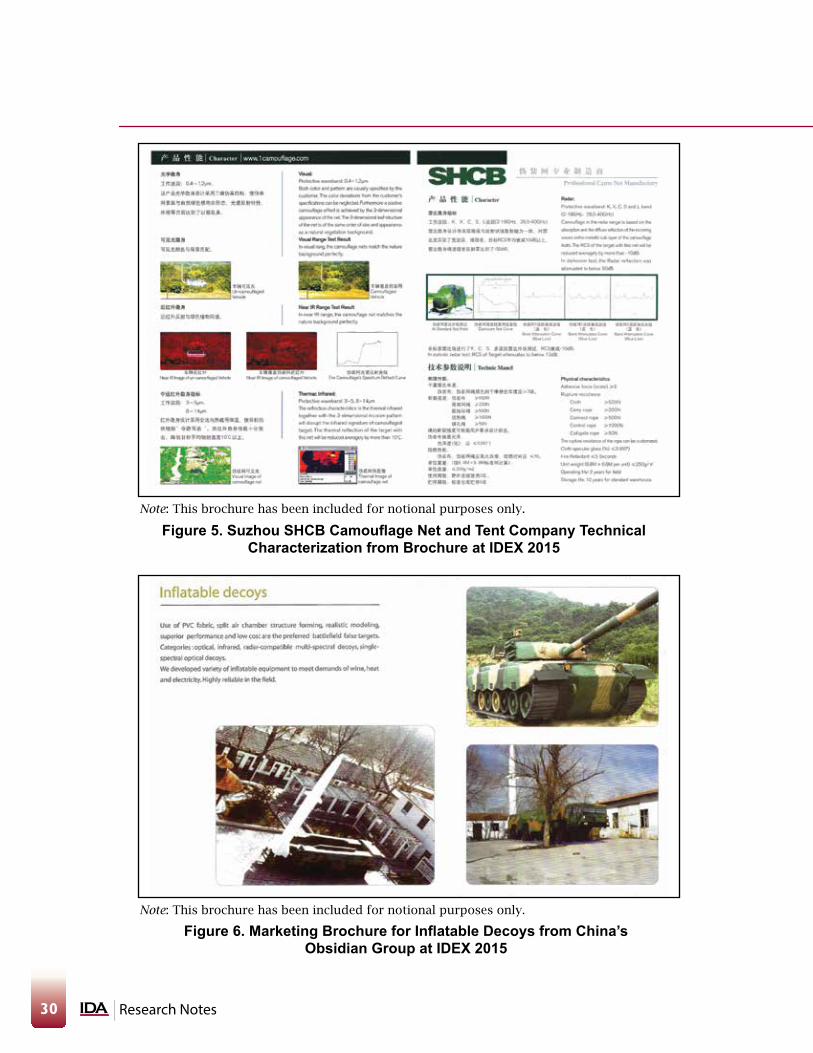
Companies from many countries are selling multi-spectral camouflage nets. China’s Suzhou SHCB Camouflage Net and Tent Company, for example, offered the JF-Leaf Multi-Spectral Camouflage Net, made from nano-composite materials and structures, at IDEX 2015. Company literature claims its design provides a stealthy camouflage net structure that achieves a full band reduction in optical (0.4 to 1.2μm), infrared (3 to 5μm and 8 to 14μm), and radar (Ka, Ku, X, C, S, and L bands) signatures.
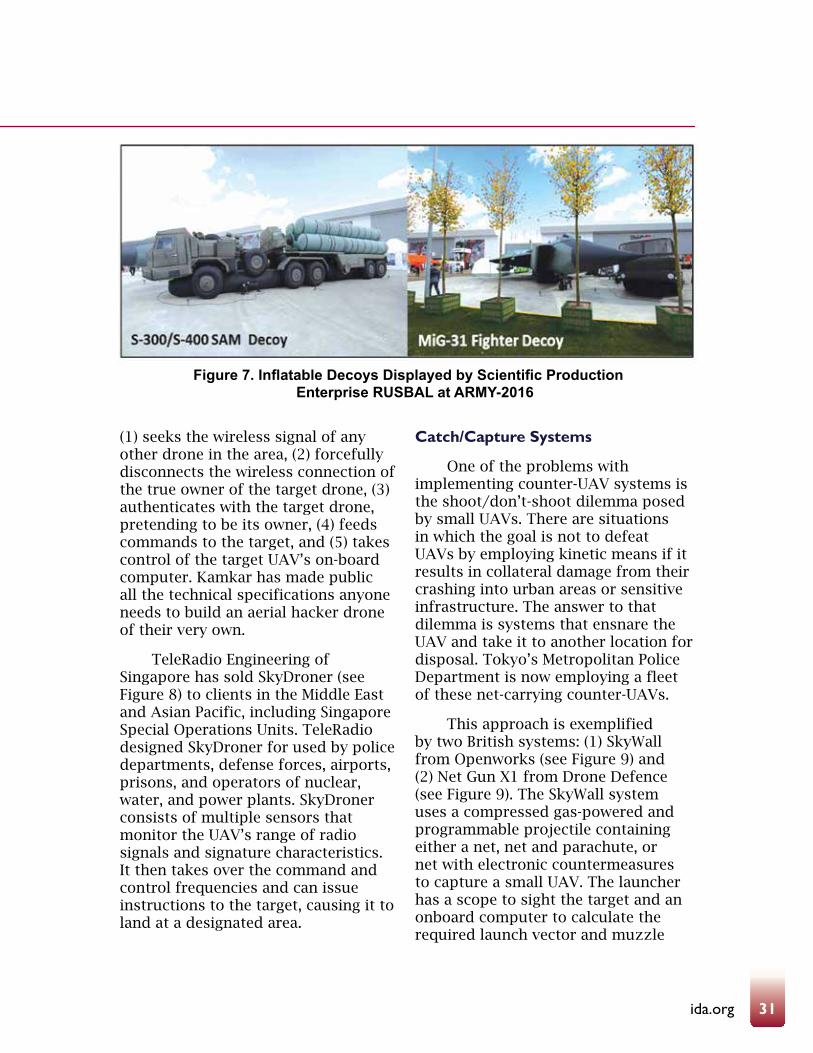
Chinese companies are also aggressively marketing high-fidelity inflatable decoys to deceive on-board UAV sensors. China’s Obsidian Group (see Figure 6), for example, advertised inflatable military equipment decoys at IDEX 2015. According to marketing
brochures, this company uses PVC fabric, split air chamber structure forming, and “realistic modeling” techniques to produce “superior performance and low cost” false targets for the battlefield. Customer decoy options include optical, infrared, radar-compatible, single spectral, and multi-spectral decoys.
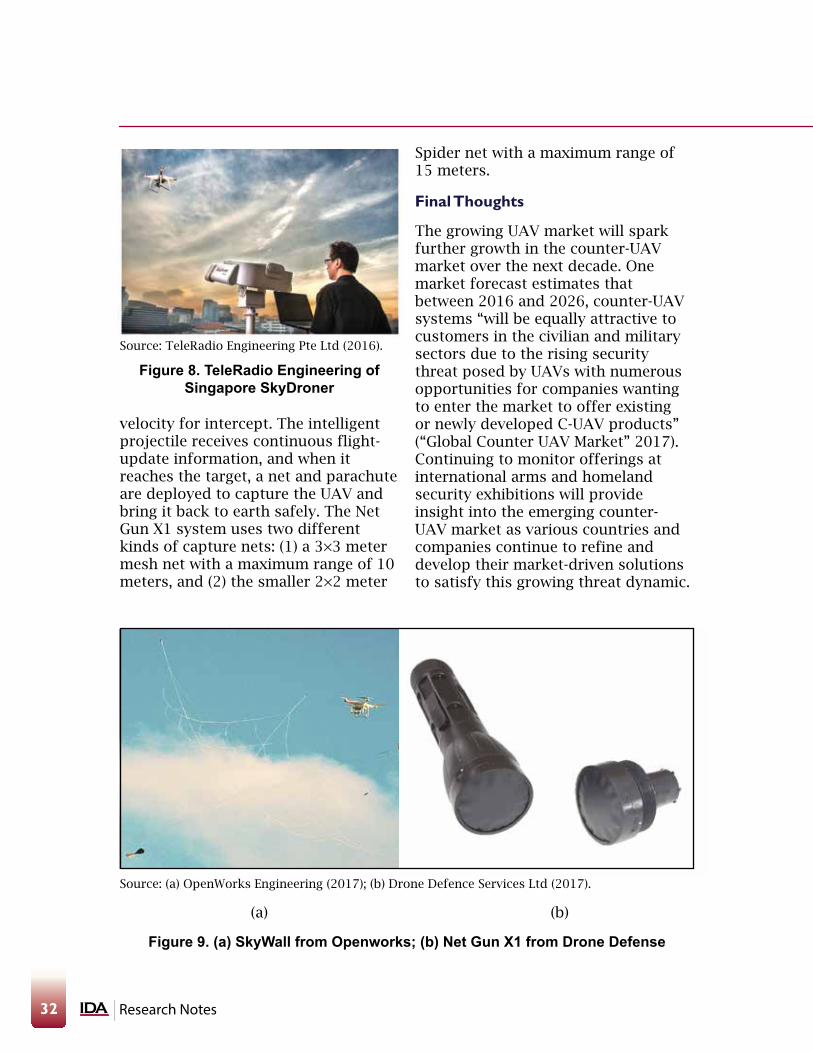
Russian companies like Scientific Production Enterprise RUSBAL also offer a wide range of inflatable decoys. Examples of their products are shown on display at ARMY-2016. See Figure 7.
Taking Control of the UAV
One of the more sophisticated approaches involves third parties taking over the control system of the targeted UAV. The RSA Conference 2016 in San Francisco had a session entitled “Hacking a Professional Drone,” which claimed that “professional UAVs are not as secure as one might think” (Rodday 2016). “Serial hacker” Samy Kamkar, for example, designed the SkyJack Counter-Drone System that seeks out other UAVs. The SkyJack system takes over the UAV following these steps:
(a) (b) (c)
Figure 4. Three Types of Counter-UAV Jammers Displayed at AirShow China 2016: (a) Xinxing Cathay International Group’s Counter-UAS System, (b) CETC’s JN3141 Counter-UAS System, and (c) ZR Aerospace’s Counter-UAS System
30 Research Notes
Figure 6. Marketing Brochure for Inflatable Decoys from China’s Obsidian Group at IDEX 2015
Note: This brochure has been included for notional purposes only.
Note: This brochure has been included for notional purposes only.
Figure 5. Suzhou SHCB Camouflage Net and Tent Company Technical Characterization from Brochure at IDEX 2015
31ida.org
(1) seeks the wireless signal of any other drone in the area, (2) forcefully disconnects the wireless connection of the true owner of the target drone, (3) authenticates with the target drone, pretending to be its owner, (4) feeds commands to the target, and (5) takes control of the target UAV’s on-board computer. Kamkar has made public all the technical specifications anyone needs to build an aerial hacker drone of their very own.
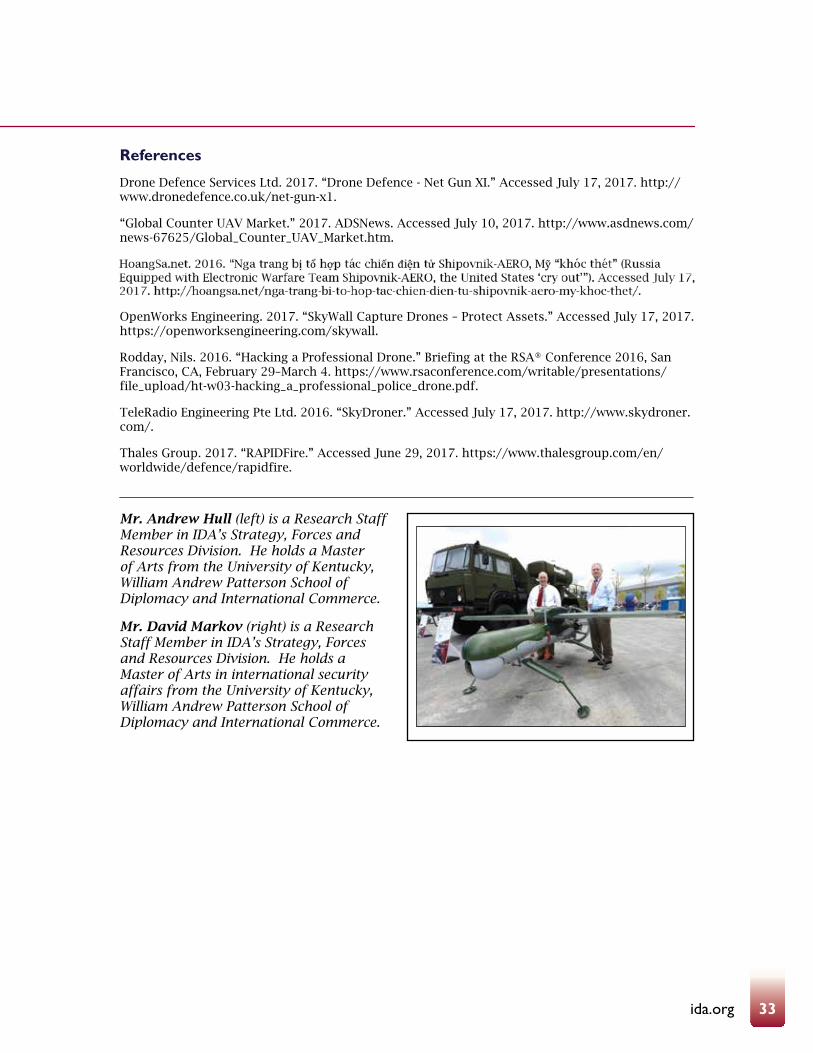
TeleRadio Engineering of Singapore has sold SkyDroner (see Figure 8) to clients in the Middle East and Asian Pacific, including Singapore Special Operations Units. TeleRadio designed SkyDroner for used by police departments, defense forces, airports, prisons, and operators of nuclear, water, and power plants. SkyDroner consists of multiple sensors that monitor the UAV’s range of radio signals and signature characteristics. It then takes over the command and control frequencies and can issue instructions to the target, causing it to land at a designated area.
Catch/Capture Systems
One of the problems with implementing counter-UAV systems is the shoot/don’t-shoot dilemma posed by small UAVs. There are situations in which the goal is not to defeat UAVs by employing kinetic means if it results in collateral damage from their crashing into urban areas or sensitive infrastructure. The answer to that dilemma is systems that ensnare the UAV and take it to another location for disposal. Tokyo’s Metropolitan Police Department is now employing a fleet of these net-carrying counter-UAVs.
This approach is exemplified by two British systems: (1) SkyWall from Openworks (see Figure 9) and (2) Net Gun X1 from Drone Defence (see Figure 9). The SkyWall system uses a compressed gas-powered and programmable projectile containing either a net, net and parachute, or net with electronic countermeasures to capture a small UAV. The launcher has a scope to sight the target and an onboard computer to calculate the required launch vector and muzzle
Figure 7. Inflatable Decoys Displayed by Scientific Production Enterprise RUSBAL at ARMY-2016
32 Research Notes
Spider net with a maximum range of 15 meters.
Final Thoughts
The growing UAV market will spark further growth in the counter-UAV market over the next decade. One market forecast estimates that between 2016 and 2026, counter-UAV systems “will be equally attractive to customers in the civilian and military sectors due to the rising security threat posed by UAVs with numerous opportunities for companies wanting to enter the market to offer existing or newly developed C-UAV products” (“Global Counter UAV Market” 2017). Continuing to monitor offerings at international arms and homeland security exhibitions will provide insight into the emerging counter-UAV market as various countries and companies continue to refine and develop their market-driven solutions to satisfy this growing threat dynamic.
velocity for intercept. The intelligent projectile receives continuous flight-update information, and when it reaches the target, a net and parachute are deployed to capture the UAV and bring it back to earth safely. The Net Gun X1 system uses two different kinds of capture nets: (1) a 3×3 meter mesh net with a maximum range of 10 meters, and (2) the smaller 2×2 meter
Source: TeleRadio Engineering Pte Ltd (2016).
Figure 8. TeleRadio Engineering of Singapore SkyDroner
Source: (a) OpenWorks Engineering (2017); (b) Drone Defence Services Ltd (2017).
(a) (b)
Figure 9. (a) SkyWall from Openworks; (b) Net Gun X1 from Drone Defense
33ida.org
References
Drone Defence Services Ltd. 2017. “Drone Defence - Net Gun XI.” Accessed July 17, 2017. http://www.dronedefence.co.uk/net-gun-x1.
“Global Counter UAV Market.” 2017. ADSNews. Accessed July 10, 2017. http://www.asdnews.com/news-67625/Global_Counter_UAV_Market.htm.
OpenWorks Engineering. 2017. “SkyWall Capture Drones – Protect Assets.” Accessed July 17, 2017. https://openworksengineering.com/skywall.
Rodday, Nils. 2016. “Hacking a Professional Drone.” Briefing at the RSA® Conference 2016, San Francisco, CA, February 29–March 4. https://www.rsaconference.com/writable/presentations/file_upload/ht-w03-hacking_a_professional_police_drone.pdf.
TeleRadio Engineering Pte Ltd. 2016. “SkyDroner.” Accessed July 17, 2017. http://www.skydroner.com/.
Thales Group. 2017. “RAPIDFire.” Accessed June 29, 2017. https://www.thalesgroup.com/en/worldwide/defence/rapidfire.
Mr. Andrew Hull (left) is a Research Staff Member in IDA’s Strategy, Forces and Resources Division. He holds a Master of Arts from the University of Kentucky, William Andrew Patterson School of Diplomacy and International Commerce.
Mr. David Markov (right) is a Research Staff Member in IDA’s Strategy, Forces and Resources Division. He holds a Master of Arts in international security affairs from the University of Kentucky, William Andrew Patterson School of Diplomacy and International Commerce.
34 Research Notes
The Problem
The Department of Homeland Security’s 2013 National Infrastructure Protection plan sets forth goals for a national, coordinated effort to strengthen security and resilience of our nation’s critical infrastructure against both physical and cyber threats. The plan challenges the community to consider both physical and cyber security in an integrated, rather than separate, manner.
Background
In 2005, under DHS sponsorship, IDA initiated the development of the Common Risk Model (CRM) for evaluating and comparing risks associated with the nation’s critical infrastructure. This model incorporates commonly used risk metrics that are designed to be transparent and mathematically justifiable. It also enables comparisons of risks to critical assets within and across critical infrastructure sectors.
IDA has continued to develop this model in collaboration with the U.S. Army Corps of Engineers (USACE). The extended model—the Common Risk Model for Dams (CRM D)—takes into account the unique features of dams and navigation locks and provides a systematic approach for evaluating and comparing risks from terrorist threats across a portfolio of dam projects.
In the CRM-D, risk is considered as a function of three variables: threat (T), vulnerability (V), and consequences (C):
R = f (T, V, C). (1)
The three variables are defined as follows: threat—the probability of a specific attack scenario being attempted by the adversary, given an attack on one of the targets in the portfolio under assessment, denoted as P(A); vulnerability—the probability of defeating the target’s defenses, given that the attack is attempted, denoted as P(S|A); and consequences—the estimated loss in terms of human life or economic damage given that the target’s defenses are defeated, denoted as C.
The CRM-D calculates risk as the product of these three variables:
R = P(A) × P(S|A) × C. (2)
Operationalizing Cyber Security Risk Assessments for the Dams SectorKevin Burns, Jason Dechant, Darrell Morgeson, and Reginald Meeson, Jr.
To evaluate vulnerability to the postulated threat, it is necessary ... to describe the defenses onsite that can be used to mitigate potential vulnerabilities.

35ida.org
CRM-D also defines conditional risk (RC) as risk for the attack scenario, given that this scenario is chosen: RC = P(S|A) × C. (3)
The consequence and risk metrics currently considered in the CRM-D are loss of life (LOL) and total economic impacts.
Cyber Security Module of the CRM-D
The National Infrastructure Protection Plan (Department of Homeland Security 2013) set forth goals for a national, coordinated effort to strengthen the security and resilience of our nation’s critical infrastructure against human, physical, and cyber threats. It outlines a coordinated risk management framework to secure the cyber elements of critical infrastructure in an integrated fashion with physical security, rather than as a separate consideration.
To support this goal at USACE-maintained dams, IDA, in collaboration with USACE, developed a cyber-risk model focused on cyber attacks against industrial control systems (ICS) that regulate critical dam functions. This model, the Common Risk Model for Dams Cybersecurity Module (CRM-D CSM), enables the assessment of cyber risks and assists in the identification of control systems where stronger cybersecurity defenses are needed to reduce risks to an acceptable level.
The CRM-D CSM is consistent with the Risk Management Framework (RMF) defined by the Committee on National Security Systems Instruction (CNSSI) Policy No. 22 (Committee on
National Security Systems 2016) and National Institute of Standards and Technology (NIST) Special Publication (SP) 800-39 (National Institute of Standards and Technology 2011). The CRM-D CSM is intended to complement current processes and give USACE the capability to quickly assess the status of cybersecurity at dams and to move to adopt stronger cyber-defense measures, where needed, in accordance with risk estimates. Risk in the CRM-D CSM depends on the cyber attack chosen and is therefore determined by cyber vulnerability and consequences given a successful cyber attack. The following sections discuss how vulnerability, consequences, and risk are estimated in the CRM-D CSM.
Estimating Vulnerability
Cyber vulnerability is defined as the likelihood of defeating cyber defenses, given a cyber attack. To evaluate vulnerability to the postulated threat, it is necessary to characterize the architecture of the ICS at the dam project and to describe the defenses onsite that can be used to mitigate potential vulnerabilities. These architectures provide different levels of protection against cyber attacks.
ICS configurations have been classified into four system architecture categories representative of USACE dams:
l Platform Information Technology (PIT) System Restricted Interconnection. Refers to a system connected to a project owned by an entity external to USACE.
l PIT System Closed-Restricted. A set of multiple interconnected
36 Research Notes
systems capable of enabling remote operations.
l PIT System. A system with no external connections.
l PIT Product. The simplest control system with minimal computing resources.
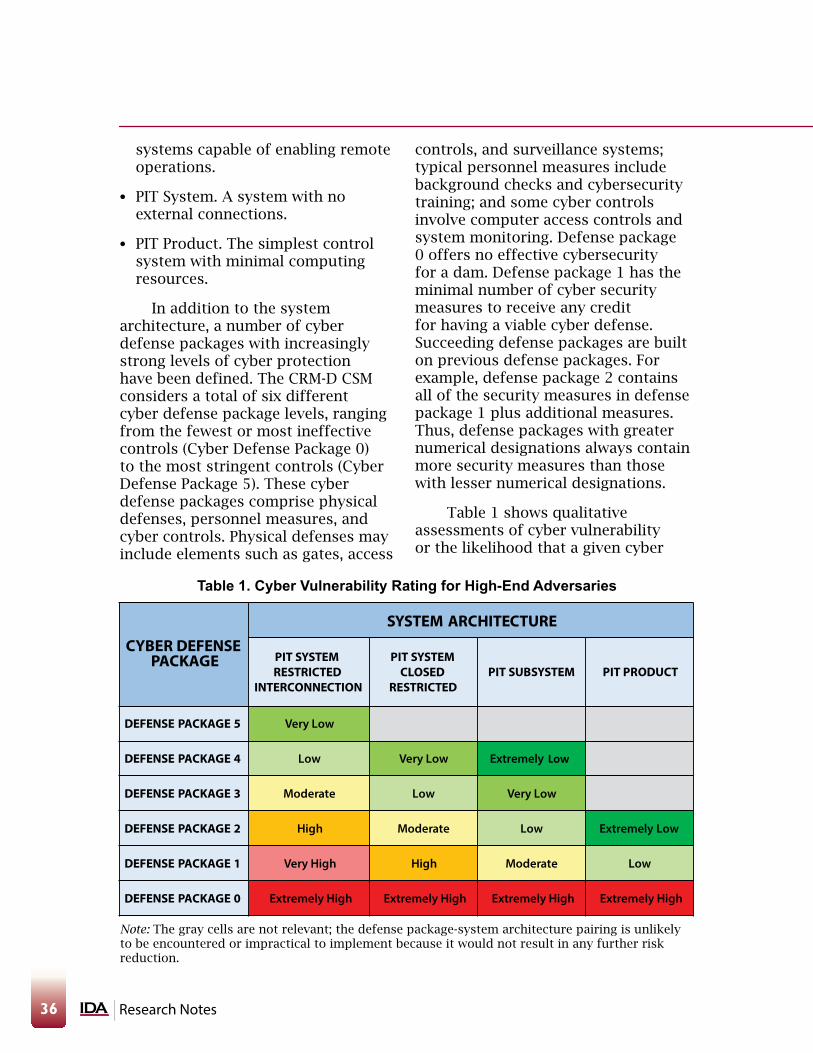
In addition to the system architecture, a number of cyber defense packages with increasingly strong levels of cyber protection have been defined. The CRM-D CSM considers a total of six different cyber defense package levels, ranging from the fewest or most ineffective controls (Cyber Defense Package 0) to the most stringent controls (Cyber Defense Package 5). These cyber defense packages comprise physical defenses, personnel measures, and cyber controls. Physical defenses may include elements such as gates, access
controls, and surveillance systems; typical personnel measures include background checks and cybersecurity training; and some cyber controls involve computer access controls and system monitoring. Defense package 0 offers no effective cybersecurity for a dam. Defense package 1 has the minimal number of cyber security measures to receive any credit for having a viable cyber defense. Succeeding defense packages are built on previous defense packages. For example, defense package 2 contains all of the security measures in defense package 1 plus additional measures. Thus, defense packages with greater numerical designations always contain more security measures than those with lesser numerical designations.
Table 1 shows qualitative assessments of cyber vulnerability or the likelihood that a given cyber
CYBER DEFENSE PACKAGE PIT SYSTEM
RESTRICTED INTERCONNECTION
PIT SYSTEM CLOSED
RESTRICTEDPIT SUBSYSTEM PIT PRODUCT
DEFENSE PACKAGE 5 Very Low
DEFENSE PACKAGE 4 Low Very Low Extremely Low
DEFENSE PACKAGE 3 Moderate Low Very Low
DEFENSE PACKAGE 2 High Moderate Low Extremely Low
DEFENSE PACKAGE 1 Very High High Moderate Low
DEFENSE PACKAGE 0 Extremely High Extremely High Extremely High Extremely High
SYSTEM ARCHITECTURE
Table 1. Cyber Vulnerability Rating for High-End Adversaries
Note: The gray cells are not relevant; the defense package-system architecture pairing is unlikely to be encountered or impractical to implement because it would not result in any further risk reduction.
37ida.org
1 Water management and safety are functions that are not considered to cause immediate consequences as a result of a cyber-attack. More sophisticated attack vectors executed over a longer period of time could cause damage to these two critical functions. USACE chose not to consider those attacks at this point.
attack, if attempted, will be successful in defeating cyber defenses (also known as the vulnerability or P(S|A)). These estimates were developed by subject matter experts (SMEs) who were considering a high-capability adversary. The resulting likelihoods that these defense configurations would defeat a cyber attack are shown in Table 1. The cyber vulnerability of critical dam functions at any dam site can be determined from its ICS architecture and the level of cyber-defense measures (defense package level) that have been implemented.
Estimating Consequences
Six critical functions can be performed at a dam, and any or all of them can be at risk: (1) flood risk management, (2) hydropower generation, (3) navigation, (4) water supply, (5) water management, and (6) safety. With the exception of water management and safety,1 a cyber attack from a high-capability adversary can cause damage and consequences when directed against these critical functions.
The USACE Critical Infrastructure Cyber-Security Center of Excellence
(CICSCX) maintains and provides a set of rule-based cyber scenarios that includes damage estimates for successful cyber attacks. Using these rules, project personnel choose applicable scenarios for their dams to determine potential damages (e.g., if hydropower governors are cyber vulnerable, then generators and turbines could be destroyed in a cyber attack). Potential damages include destruction of critical items (e.g., generators, locks) and loss of critical functions for an estimated period of time (e.g., a hydropower loss for 36 hours). All rule-based scenarios that are applicable are evaluated for consequences and risk.
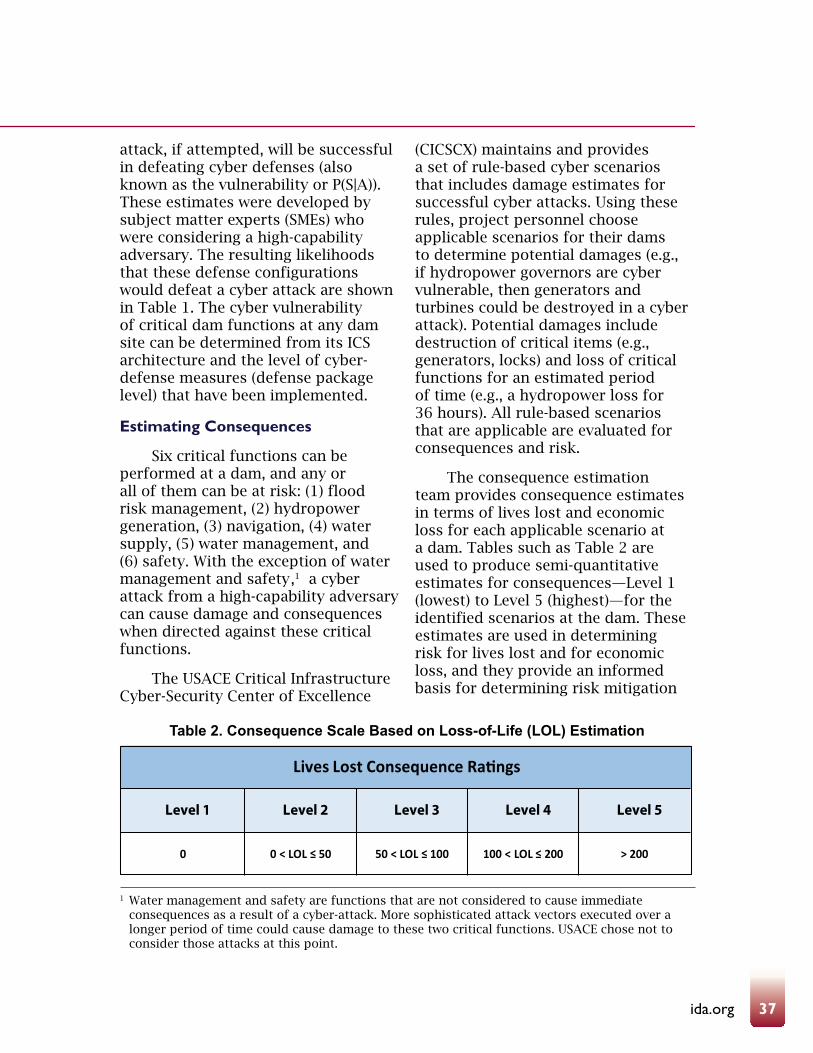
The consequence estimation team provides consequence estimates in terms of lives lost and economic loss for each applicable scenario at a dam. Tables such as Table 2 are used to produce semi-quantitative estimates for consequences—Level 1 (lowest) to Level 5 (highest)—for the identified scenarios at the dam. These estimates are used in determining risk for lives lost and for economic loss, and they provide an informed basis for determining risk mitigation
Lives Lost Consequence Ra�ngs
Level 1 Level 2 Level 3 Level 4 Level 5
0 0 < LOL ≤ 50 50 < LOL ≤ 100 100 < LOL ≤ 200 > 200
Table 2. Consequence Scale Based on Loss-of-Life (LOL) Estimation
38 Research Notes
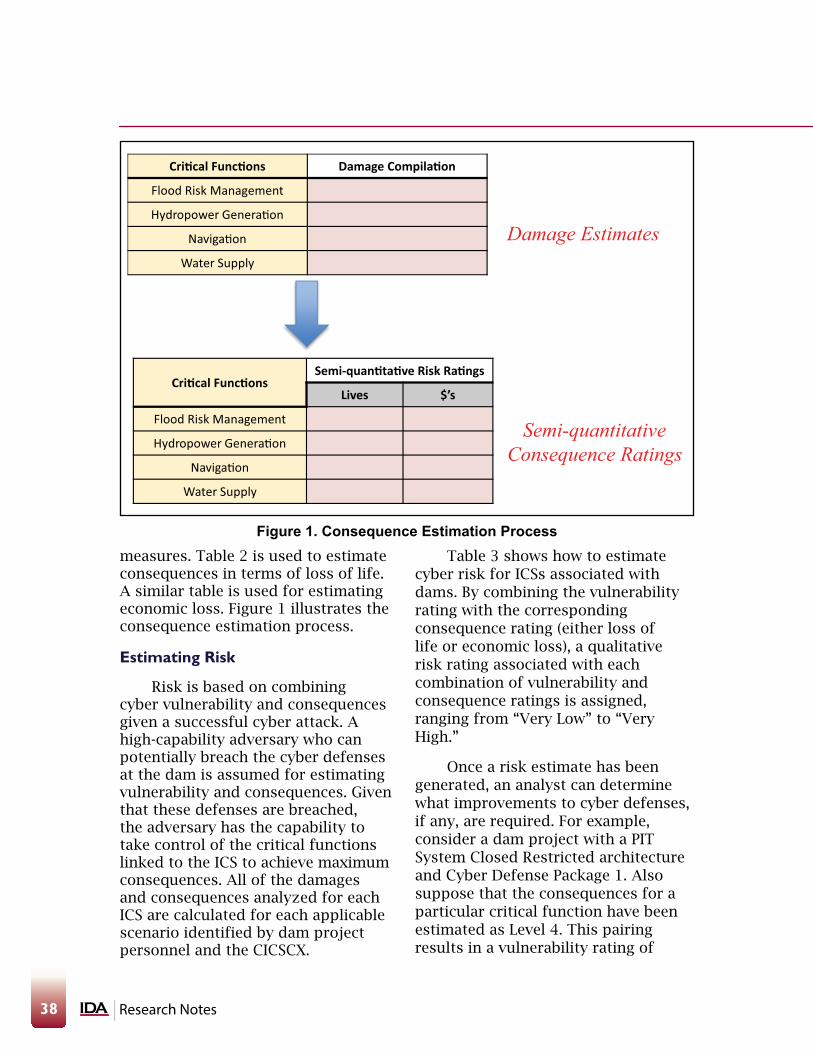
measures. Table 2 is used to estimate consequences in terms of loss of life. A similar table is used for estimating economic loss. Figure 1 illustrates the consequence estimation process.
Estimating Risk
Risk is based on combining cyber vulnerability and consequences given a successful cyber attack. A high-capability adversary who can potentially breach the cyber defenses at the dam is assumed for estimating vulnerability and consequences. Given that these defenses are breached, the adversary has the capability to take control of the critical functions linked to the ICS to achieve maximum consequences. All of the damages and consequences analyzed for each ICS are calculated for each applicable scenario identified by dam project personnel and the CICSCX.
Table 3 shows how to estimate cyber risk for ICSs associated with dams. By combining the vulnerability rating with the corresponding consequence rating (either loss of life or economic loss), a qualitative risk rating associated with each combination of vulnerability and consequence ratings is assigned, ranging from “Very Low” to “Very High.”
Once a risk estimate has been generated, an analyst can determine what improvements to cyber defenses, if any, are required. For example, consider a dam project with a PIT System Closed Restricted architecture and Cyber Defense Package 1. Also suppose that the consequences for a particular critical function have been estimated as Level 4. This pairing results in a vulnerability rating of
Figure 1. Consequence Estimation Process
Cri�cal Func�ons Damage Compila�on
Flood Risk Management
Hydropower Generaon
Navigaon
Water Supply
Damage Estimates
Cri�cal Func�onsSemi-quan�ta�ve Risk Ra�ngs
Lives $’s
Flood Risk Management
Hydropower Generaon
Navigaon
Water Supply
Semi-quantitativeConsequence Ratings
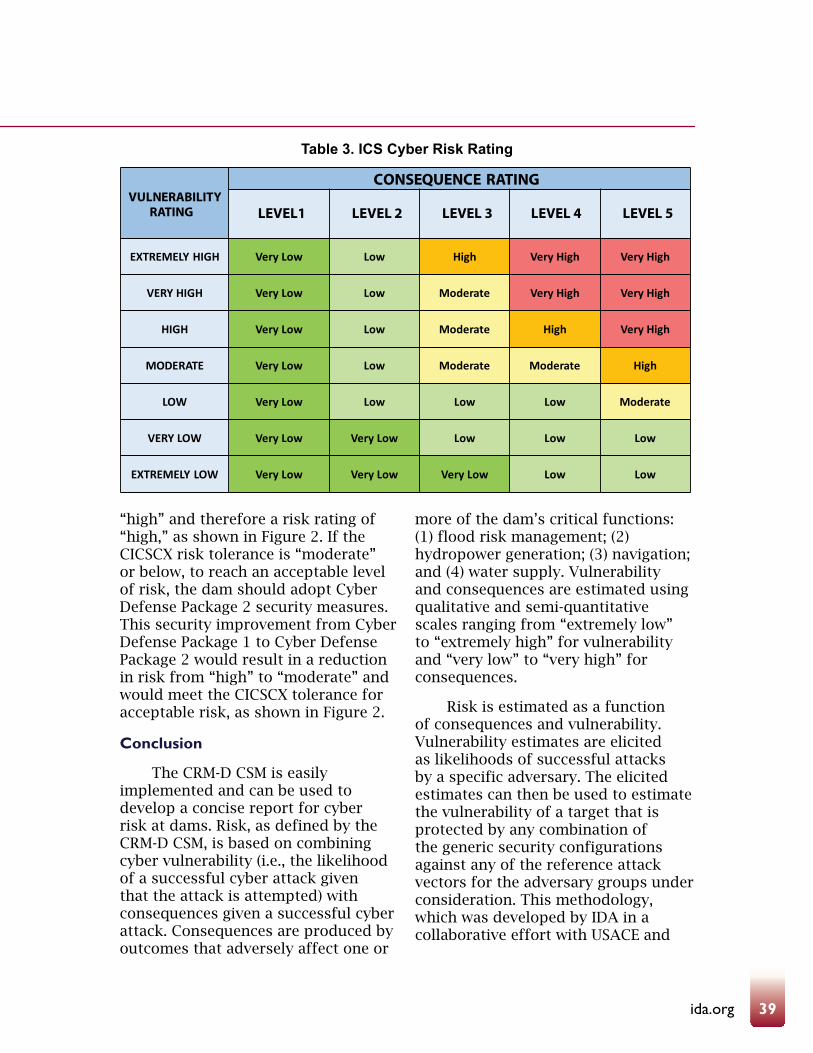
39ida.org
“high” and therefore a risk rating of “high,” as shown in Figure 2. If the CICSCX risk tolerance is “moderate” or below, to reach an acceptable level of risk, the dam should adopt Cyber Defense Package 2 security measures. This security improvement from Cyber Defense Package 1 to Cyber Defense Package 2 would result in a reduction in risk from “high” to “moderate” and would meet the CICSCX tolerance for acceptable risk, as shown in Figure 2.
Conclusion
The CRM-D CSM is easily implemented and can be used to develop a concise report for cyber risk at dams. Risk, as defined by the CRM-D CSM, is based on combining cyber vulnerability (i.e., the likelihood of a successful cyber attack given that the attack is attempted) with consequences given a successful cyber attack. Consequences are produced by outcomes that adversely affect one or
Table 3. ICS Cyber Risk Rating
VULNERABILITYRATING
CONSEQUENCE RATING
LEVEL1 LEVEL 2 LEVEL 3 LEVEL 4 LEVEL 5
EXTREMELY HIGH Very Low Low High Very High Very High
VERY HIGH Very Low Low Moderate Very High Very High
HIGH Very Low Low Moderate High Very High
MODERATE Very Low Low Moderate Moderate High
LOW Very Low Low Low Low Moderate
VERY LOW Very Low Very Low Low Low Low
EXTREMELY LOW Very Low Very Low Very Low Low Low
more of the dam’s critical functions: (1) flood risk management; (2) hydropower generation; (3) navigation; and (4) water supply. Vulnerability and consequences are estimated using qualitative and semi-quantitative scales ranging from “extremely low” to “extremely high” for vulnerability and “very low” to “very high” for consequences.
Risk is estimated as a function of consequences and vulnerability. Vulnerability estimates are elicited as likelihoods of successful attacks by a specific adversary. The elicited estimates can then be used to estimate the vulnerability of a target that is protected by any combination of the generic security configurations against any of the reference attack vectors for the adversary groups under consideration. This methodology, which was developed by IDA in a collaborative effort with USACE and
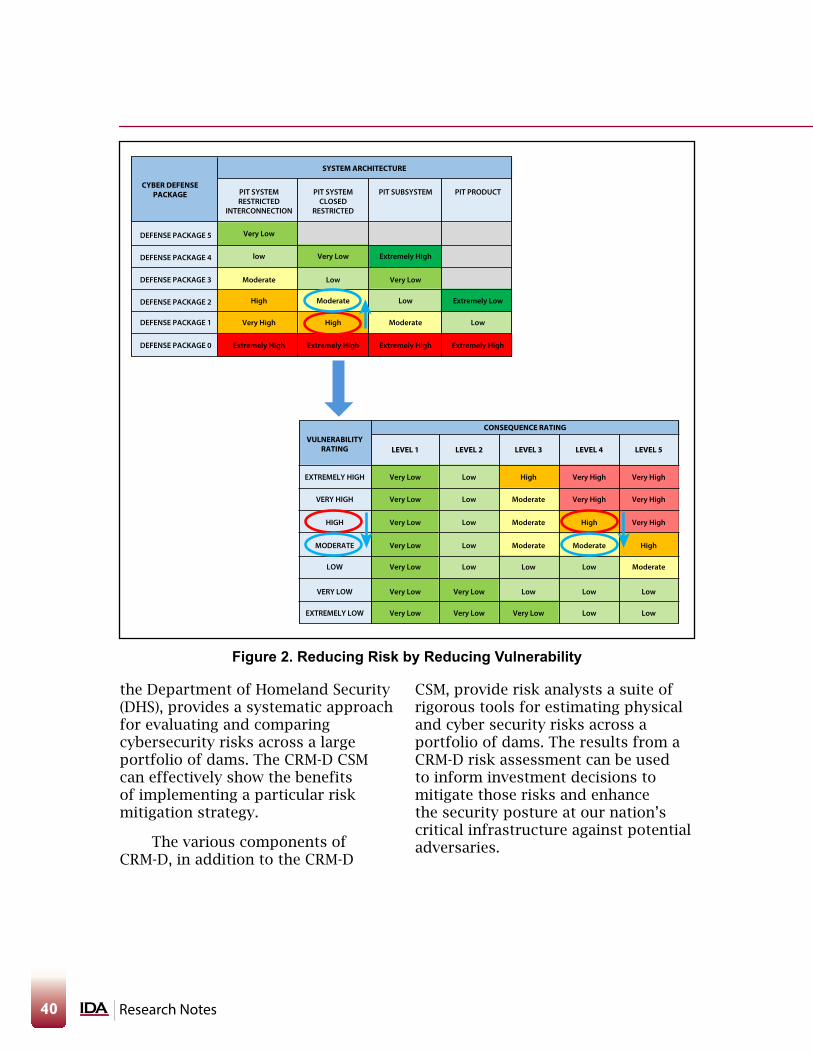
40 Research Notes
the Department of Homeland Security (DHS), provides a systematic approach for evaluating and comparing cybersecurity risks across a large portfolio of dams. The CRM-D CSM can effectively show the benefits of implementing a particular risk mitigation strategy.
The various components of CRM-D, in addition to the CRM-D
Figure 2. Reducing Risk by Reducing Vulnerability
CSM, provide risk analysts a suite of rigorous tools for estimating physical and cyber security risks across a portfolio of dams. The results from a CRM-D risk assessment can be used to inform investment decisions to mitigate those risks and enhance the security posture at our nation’s critical infrastructure against potential adversaries.
PIT SYSTEMRESTRICTED
INTERCONNECTION
CYBER DEFENSEPACKAGE
Very Low
low
Moderate
High
Very High
Extremely High
PIT PRODUCT
Extremely Low
Low
Extremely High
PIT SUBSYSTEM
Extremely High
Very Low
Low
Moderate
Extremely High
PIT SYSTEMCLOSED
RESTRICTED
Very Low
Low
Moderate
High
Extremely High
DEFENSE PACKAGE 5
DEFENSE PACKAGE 4
DEFENSE PACKAGE 3
DEFENSE PACKAGE 2
DEFENSE PACKAGE 1
DEFENSE PACKAGE 0
SYSTEM ARCHITECTURE
LEVEL 1 LEVEL 2
Very Low
Very Low
Very Low
Very Low
Very Low
Very Low
Very Low
Low
Low
Low
Low
Low
Very Low
Very Low
LEVEL 5
Very High
Very High
Very High
High
Moderate
Low
Low
LEVEL 4
Very High
Very High
High
Moderate
Low
Low
Low
LEVEL 3
High
Moderate
Moderate
Moderate
Low
Low
Very Low
VULNERABILITYRATING
EXTREMELY HIGH
VERY HIGH
HIGH
MODERATE
LOW
VERY LOW
EXTREMELY LOW
CONSEQUENCE RATING

41ida.org
References
Committee on National Security Systems. 2016. Cybersecurity Risk Management. CNSSP 22. Fort Meade, MD: National Security Agency, CNSS Secretariat (1E414), August.
Department of Homeland Security. 2013. National Infrastructure Protection Plan (NIPP) 2013: Partnering for Critical Infrastructure Security and Resilience. Washington, DC: Department of Homeland Security.
National Institute of Standards and Technology. 2011. Managing Information Security Risk: Organization, Mission, and Information System View. NIST Special Publication 800-39. Gaithersburg, MD: National Institute of Standards and Technology, Computer Security Division, Information Technology Laboratory, March.
Dr. Kevin Burns is an Adjunct Research Staff Member in IDA’s Strategy, Forces and Resources Division. He holds a Doctor of Philosophy in operations research from the University of Georgia.
Dr. Jason Dechant is a Research Staff Member in IDA’s Strategy, Forces and Resources Division. He holds a Doctor of Philosophy in public policy from George Mason University.
Mr. Darrell Morgeson is an Adjunct Research Staff Member in IDA’s Strategy, Forces and Resources Division. He holds a Master of Science in operations research from the Naval Postgraduate School.
Dr. Reginald Meeson is a Research Staff Member in IDA’s Information Technology and Systems Division. He holds a Doctor of Philosophy in electrical and computer engineering from the University of California, Santa Barbara.
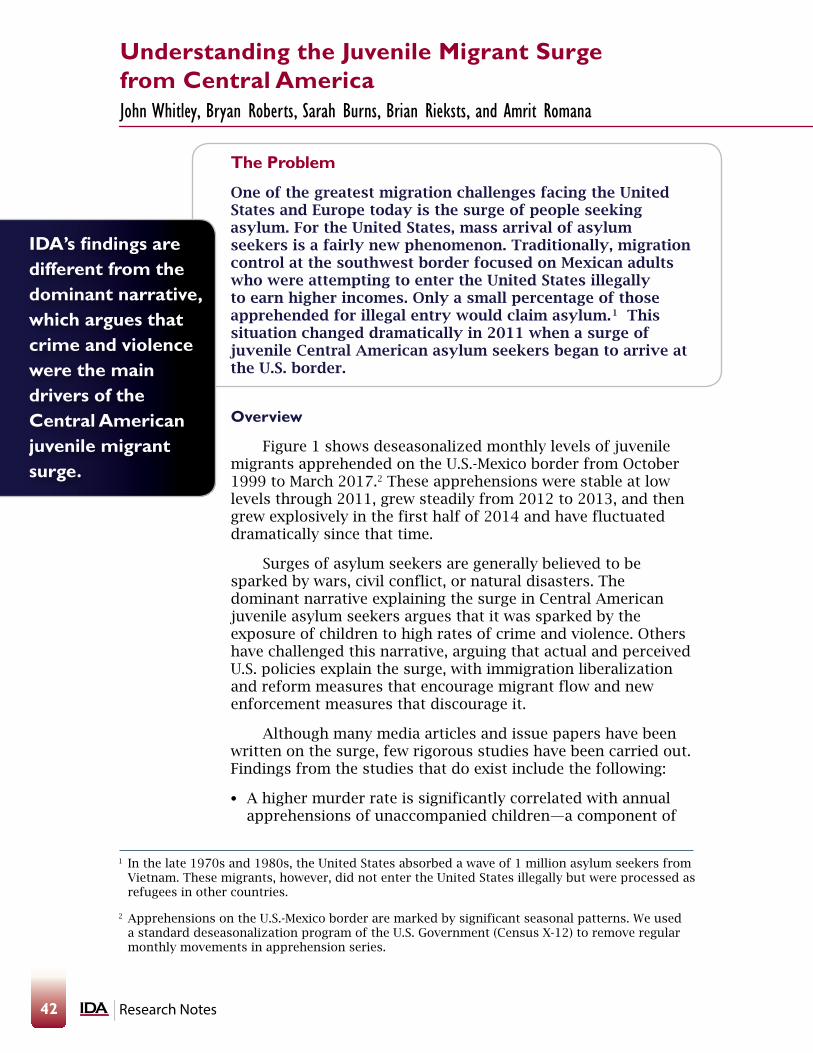
42 Research Notes
The Problem
One of the greatest migration challenges facing the United States and Europe today is the surge of people seeking asylum. For the United States, mass arrival of asylum seekers is a fairly new phenomenon. Traditionally, migration control at the southwest border focused on Mexican adults who were attempting to enter the United States illegally to earn higher incomes. Only a small percentage of those apprehended for illegal entry would claim asylum.1 This situation changed dramatically in 2011 when a surge of juvenile Central American asylum seekers began to arrive at the U.S. border.
Overview
Figure 1 shows deseasonalized monthly levels of juvenile migrants apprehended on the U.S.-Mexico border from October 1999 to March 2017.2 These apprehensions were stable at low levels through 2011, grew steadily from 2012 to 2013, and then grew explosively in the first half of 2014 and have fluctuated dramatically since that time.
Surges of asylum seekers are generally believed to be sparked by wars, civil conflict, or natural disasters. The dominant narrative explaining the surge in Central American juvenile asylum seekers argues that it was sparked by the exposure of children to high rates of crime and violence. Others have challenged this narrative, arguing that actual and perceived U.S. policies explain the surge, with immigration liberalization and reform measures that encourage migrant flow and new enforcement measures that discourage it.
Although many media articles and issue papers have been written on the surge, few rigorous studies have been carried out. Findings from the studies that do exist include the following:
l A higher murder rate is significantly correlated with annual apprehensions of unaccompanied children—a component of
Understanding the Juvenile Migrant Surge from Central America John Whitley, Bryan Roberts, Sarah Burns, Brian Rieksts, and Amrit Romana
1 In the late 1970s and 1980s, the United States absorbed a wave of 1 million asylum seekers from Vietnam. These migrants, however, did not enter the United States illegally but were processed as refugees in other countries.
2 Apprehensions on the U.S.-Mexico border are marked by significant seasonal patterns. We used a standard deseasonalization program of the U.S. Government (Census X-12) to remove regular monthly movements in apprehension series.
IDA’s findings are different from the dominant narrative, which argues that crime and violence were the main drivers of the Central American juvenile migrant surge.

43ida.org
juvenile migrants—from El Salvador, Guatemala, and Honduras (Amuedo-Dorantes and Puttitanun 2016; Clemens 2017).
l Children from El Salvador, Guatemala, Mexico, and Nicaragua are more likely to migrate to the United States with a parent or after a parent has migrated, emphasizing the importance of family reunification in juvenile migration (Donato and Sisk 2015).
l In El Salvador and Honduras, those people who had been a victim of crime in the past year stated intentions to migrate at a higher rate
than those people who had not been a victim (Hiskey et al. 2018).
What Root Causes Correlate with Juvenile Migrant Flows?
IDA used data on juvenile migrant apprehensions on the U.S.-Mexico border to evaluate the degree to which crime and violence, family reunification, and economic motives are correlated with this flow.3 Although most juvenile migrants come from the three Central American countries and Mexico, small flows of juvenile migrants also come from other countries in Latin America and the Caribbean. We analyzed the
3 Juvenile migrant apprehensions aggregate apprehensions at and between ports of entry on the U.S.-Mexico border of children aged 17 and younger who were designated as unaccompanied or accompanied by a family member or who were not given either designation.
Figure 1. Deseasonalized Monthly Juvenile Apprehensions (at and between ports; excluding Mexico)
0
1000
2000
3000
4000
5000
6000
7000
8000
Oct
Feb
Jun
Oct
Feb
Jun
Oct
Feb
Jun
Oct
Feb
Jun
Oct
Feb
Jun
Oct
Feb
Jun
Oct
Feb
Jun
Oct
Feb
Jun
Oct
Feb
Jun
Oct
Feb
Jun
Oct
Feb
Jun
Oct
Feb
Jun
Oct
Feb
Jun
Oct
Feb
Jun
Oct
Feb
Jun
Oct
Feb
Jun
Oct
Feb
Jun
Oct
Feb
1999 2000 2001 2002 2003 2004 2005 2006 2007 2008 2009 2010 2011 2012 2013 2014 2015 2016 2017
El Salvador Guatemala Honduras Other

44 Research Notes
0.0%
0.2%
0.4%
0.6%
0.8%
1.0%
1.2%
1.4%
1.6%
2000 2001 2002 2003 2004 2005 2006 2007 2008 2009 2010 2011 2012 2013 2014 2015 2016
El Salvador Guatemala Honduras
4 The countries include Belize, Bolivia, Brazil, Chile, Colombia, Costa Rica, Dominican Republic, Ecuador, El Salvador, Guatemala, Honduras, Jamaica, Mexico, Nicaragua, Panama, Peru, and Venezuela.
5 Rates for other countries are not shown in Figure 2 because they are much smaller and very close to zero.
relationship between annual flows from 17 countries and “root cause” explanatory factors.4
The dependent variable used in this analysis is an annual juvenile emigration rate, which reflects the likelihood that a child from a given country will be apprehended on the border. It is constructed as the number of juveniles apprehended from a given country in relation to that country’s total juvenile population. Figure 2 shows that this rate is substantially higher for El Salvador and Honduras than for Guatemala.5
The independent variables that proxy for the three proposed root causes are described as follows:
l Crime and violence. We use three proxies for crime and violence: murders per 100,000 population, an overall neighborhood safety variable, and a neighborhood gang presence variable. The neighborhood variables are derived from the Latin American Public Opinion Poll (LAPOP) that has been carried out biannually since the early 2000s.
Figure 2. Juvenile Migrant Apprehensions/TotalJuvenile Population: Juvenile Emigration Rate Proxy

45ida.org
6 Real per capita income (gross domestic product) in purchasing power parity prices.
l Family reunification. An ideal variable to capture family reunification would be the ratio of U.S. families with children still in origin country to these families plus families with children in origin country. This variable would capture the chance that a child observed in the origin-country juvenile population could potentially have a family wanting to reunify with her/him and that this family must bring the child into the United States illegally. No data are currently available to measure this ratio, so we use as a proxy the ratio of the unauthorized population from a particular origin country to the sum of that population and the total population of the origin country.
l Economic motives. Per capita income is used to capture economic motivations for migration.6
Table 1 shows that when we relate migration rate levels to explanatory variable levels, the unauthorized population ratio, per capita income, and the homicide rate significantly impact the level of the juvenile migration rate and in the directions anticipated. However, the unauthorized population ratio explains more variance in the migration rate than per capita income and the homicide rate. When we limit the panel to only the three Central American countries rather than all 17 countries, the only significant explanatory variable is the unauthorized population ratio. Table 1 also shows that when we relate change in the migration rate to change in the explanatory variables, no explanatory variable is significant. This result suggests that the juvenile migrant surge as reflected in rising annual numbers of migrants cannot
Table 1. Panel Regression Results
Full Panel of 17 Countries
ThreeCentral
American Countries
Only
LevelsFirst
Differences LevelsUnauthorized population ratio
0.44***(6.40)
0.40***(5.73)
0.31(1.45)
0.35*(1.90)
Per-capita income
-0.005**(-2.46)
-0.005*(-1.93)
-0.0003(-0.06)
0.09(0.75)
Homicide rate 0.47**(2.47)
0.28*(1.66)
0.02(0.13)
0.45(1.57)
Constant 0.0002(0.51)
-0.008***(-6.07)
0.006**(2.51)
-0.001*(-1.77)
-0.004(-1.24)
-0.0001(-0.43)
-0.07(-0.95)
R2 adjusted 0.37 0.54 0.40 0.41 0.57 0.05 0.82
Note: Country and year fixed effects are included in all regressions. Estimation technique is ordinary least squares (OLS). ***, **, and * denote statistical significance at the 1%, 5%, and 10% level, respectively.

46 Research Notes
be explained by change in crime or poverty in the Central American countries.
IDA’s findings are different from the dominant narrative, which argues that crime and violence were the main drivers of the Central American juvenile migrant surge. They suggest instead that the surge may be better explained by the unauthorized population ratio, which is our proxy for the presence of many separated families with unauthorized adult members living in the United States. Much of the juvenile migrant flow is, by definition, family reunification since roughly half of the unaccompanied children processed by the U.S. government from 2011 to 2015 were reunited with a parent and most of the other unaccompanied children were reunited with a sibling, grandparent, or other family member.7 Exposure to crime and violence may have caused some reunification to happen earlier than it otherwise would have, but a juvenile migrant surge from Central America may have been inevitable even if this exposure had been at significantly lower levels. Also worth noting is that the emigration of parents and other adult family members in the 2000s made children left behind more vulnerable to victimization due to lack of parental support and supervision, thus increasing pressure to reunify.8
Are U.S. Policies Correlated with Juvenile Migrant Flows?
Another fundamental question we analyzed is whether actual and perceived changes in U.S. policies are correlated with change in juvenile migrant apprehensions. Several policies may have had an impact on the incentives of juvenile migrants to come to the United States. Among these policies were the Trafficking Victims Protection Reauthorization Act (TVPRA) (December 2008), the Deferred Action for Childhood Arrivals (DACA) executive action (June 2012), passage of the Senate Comprehensive Immigration Reform (CIR) bill (June 2013), a range of enforcement actions carried out in the United States and Mexico from June to August 2014, the Deferred Action for Parents of Americans (DAPA) executive action (November 2014), the announcement by the Department of Homeland Security (DHS) that general deterrence is no longer being invoked as a factor in custody determination (June 2015), Operation Border Guardian (January 2016), and the election of President Donald Trump (November 2016).
Because we have not identified a statistical technique that is appropriate for estimating whether a policy change caused a turning point in apprehensions, we rely on a qualitative analysis of visual
7 Calculated from data given in annual reports of the Office of Refugee Resettlement, Department of Health and Human Services.
8 Berk-Seligson et al. (2014) carried out a large-scale interview project in Central America in 2014 and found that “there is near universal agreement in the stakeholder interviews that the major factor associated with youths dropping out of school and joining violent gangs is the ‘broken home’ (‘la familia desintegrada’).” Emigration of parents, by definition, creates a “broken home.” World Bank (2011) also notes that many families in Central America became separated due to emigration of parents, and that children in families with weak parenting are more likely to become victims and perpetrators of criminal acts.

47ida.org
100
1000
10000
Jan
Mar
May Ju
l
Sep
Nov Ja
n
Mar
May Ju
l
Sep
Nov Ja
n
Mar
May Ju
l
Sep
Nov Ja
n
Mar
May Ju
l
Sep
Nov Ja
n
Mar
May Ju
l
Sep
Nov Ja
n
Mar
May Ju
l
Sep
Nov Ja
n
Mar
2011 2012 2013 2014 2015 2016 2017
El Salvador Guatemala Honduras
June 2012: DACA
June 2013: CIR bill
June 2014 January 2016 Operation
Border Guardian
Nov 2016: Presidential
election
evidence. Figure 3 graphs juvenile apprehensions on a logarithmic scale for the period January 2011–March 2017.
Apprehensions of juvenile migrants from El Salvador, Guatemala, and Honduras have fluctuated dramatically from 2011 to 2017 and these fluctuations have been highly correlated across the three countries. This correlation suggests that migrant flows are responding more to actual or perceived U.S. policy changes rather than the root cause variables (e.g., violence and economic conditions), which change slowly over time and whose trends tend to vary across countries.
Visual evidence suggests that most policy changes are correlated
with subsequent acceleration or deceleration in juvenile migrant apprehensions. Figure 3 provides evidence that pro-immigrant reforms (such as DACA and the CIR bill) were followed by apprehension surges while perceived anti-immigration reforms/events (law enforcement operations and the 2016 election of President Trump) were followed by apprehension declines. While this qualitative analysis could not be considered causal, it does suggest that flows of juvenile migrants from Central America to the United States are responsive to U.S. policy changes.
Recommendations
l Analysis should be developed to help project the potential flow of juvenile migrants from Central
Figure 3. Deseasonalized Juvenile Migrant Apprehensions: Logarithmic Scale

48 Research Notes
American countries. The juvenile migrant surge seems to have come as a surprise to analysts, even though the problem of crime and violence in the region was well understood (e.g., see World Bank 2011) and estimates showing large unauthorized populations for these countries were available. Systematic review of quantitative and qualitative information should be
included as part of this effort, which should also include an attempt to quantify the total potential flow of juvenile migrants from Central America using U.S. and origin-country census and household survey data.
l The impacts of policies on migration flows should be anticipated and incorporated into planning.
References
Amuedo-Dorantes, Catalina, and Thitima Puttitanun. 2016. “DACA and the Surge in Unaccompanied Minors at the US-Mexico Border.” International Migration 54 (4): 102–117.
Berk-Seligson, Susan, Diana Orcés, Georgina Pizzolitto, Mitchell A. Seligson, and Carole J. Wilson. 2014. Impact Evaluation of USAID’s Community-Based Crime and Violence Prevention Approach in Central America: Regional Report for El Salvador, Guatemala, Honduras, and Panama. Nashville, TN: Vanderbilt University, The Latin American Public Opinion Project (LAPOP).
Clemens, Michael. 2017. “Violence, Development, and Migration Waves: Evidence from Central American Child Migrant Apprehensions.” Working Paper 459. Washington, DC: Center for Global Development, July.
Donato, Katharine M., and Blake Sisk. 2015. “Children’s Migration to the United States from Mexico and Central America: Evidence from the Mexican and Latin American Migration Projects.” Journal on Migration and Human Security 3 (1): 58–79.
Hiskey, Jonathan T., Abby Córdova, Mary Malone, and Diana Orcés. 2018. “Leaving the Devil You Know: Crime Victimization, U.S. Deterrence Policy, and the Emigration Decision in Central America.” Latin America Research Review 53 (3) (forthcoming).
World Bank. 2011. Crime and Violence in Central America: A Development Challenge. Washington, DC: The World Bank, Sustainable Development Department and Poverty Reduction and Economic Management Unit Latin America and the Caribbean Region.

49ida.org
Dr. Sarah Burns is a Research Staff Member in IDA’s Cost Analysis and Research Division. She holds a Doctor of Philosophy ineconomics from the University of Kentucky.
Dr. John Whitley is an Adjunct Research Staff Member in IDA’s Cost Analysis and Research Division. He holds a Doctor of Philosophy in economics from the University of Chicago.
Dr. Bryan Roberts is an Adjunct Research Staff Member in IDA’s Cost Analysis and Research Division. He holds a Doctor of Philosophy in economics from the Massachusetts Institute of Technology.
Dr. Brian Rieksts is a Research Staff Member in IDA’s Cost Analysis and Research Division. He holds a Doctor of Philosophy in industrial engineering and operations research from Pennsylvania State University.
Ms. Amrit Romana is a Research Associate in IDA’s Strategy, Forces, and Resources Division. She holds a Bachelor of Science in mathematics and economics from the University of Michigan.

50 Research Notes
The Problem
As critical infrastructure systems become increasingly interdependent, targeted research and development (R&D) is needed to anticipate evolving threats to infrastructure systems and to mitigate potential cascading effects across sectors. As part of a broad effort to achieve these objectives, IDA researchers facilitated the development of a Federal R&D Roadmap and associated performance metrics for interagency R&D priorities associated with key infrastructure topics.
Critical Infrastructure
Federal policy defines 16 critical infrastructure sectors that support the Nation’s economy, society, public health, and national security. These sectors must be protected against hazards that threaten to disrupt the services that they provide. Ensuring the security and resilience of these sectors is complex because critical infrastructure systems are increasingly interdependent, and R&D is needed to address emerging threats and mitigate potential cascading effects across sectors. Most critical infrastructure is owned and operated by non-Federal stakeholders, and these stakeholders’ ability to carry out critical R&D is impeded by the priority placed on continuity of operations. Federal departments and agencies are uniquely positioned to initiate much of the necessary R&D and are well positioned to work with key industry stakeholders to deploy the R&D output across critical infrastructure systems.
In 2016, the IDA Science and Technology Policy Institute supported the Department of Homeland Security National Protection and Programs Directorate in developing the Implementation Roadmap for the National Critical Infrastructure Security and Resilience (CISR) R&D Plan (National Science and Technology Council 2016) (“the Roadmap”). To meet national policy requirements and track the progress and impact of CISR R&D described in the Roadmap, IDA developed a novel metrics framework to evaluate the maturity and performance of R&D activities.
Policy Drivers
Presidential Policy Directive 21 (PPD-21) (The White House 2013) called for a national effort to strengthen and maintain a secure, functioning, and resilient critical infrastructure. PPD-21 directed the Secretary of DHS, in coordination with other Federal departments and agencies, to develop a National CISR
Implementing a Roadmap for Critical Infrastructure Security and ResilienceSteven Lev, Anne Ressler, and Seth Jonas
IDA researchers developed a novel metrics framework to evaluate the maturity and performance of R&D activities.

51ida.org
1 CIPAC was established by the Secretary of Homeland Security consistent with Section 201 of the Homeland Security Act of 2002 (6 U.S.C. § 121). It facilitates direct deliberation and development of consensus positions to assist the Federal Government in the coordination of Federal CISR programs. CIPAC develops policy advice and recommendations on CISR topics to DHS and other relevant Federal stakeholders.
R&D Plan (Department of Homeland Security 2015) (“the Plan”) and annual metrics. The Plan, released in December 2015, identified broad priority areas for critical infrastructure R&D. It called for the creation of an interagency CISR Subcommittee under the National Science and Technology Council (NSTC) to facilitate CISR R&D coordination, develop a Roadmap for implementation of the Plan, and establish annual performance metrics to track the progress of CISR R&D activities. IDA supported these three objectives through its work with DHS.
Identification of Infrastructure Challenge Areas
Given the breadth of risks to national critical infrastructure, areas of focus had to be identified and prioritized. IDA helped facilitate the identification and prioritization of “challenge areas” that address either a cross-cutting multi-sector issue or a lifeline function of national importance; lifeline functions include communications, energy, transportation, and water. We used quantitative (i.e., literature review and content analysis) and qualitative (i.e., expert opinion) approaches to identify potential challenge areas.
Literature Review and Content Analysis
To identify potential challenge area topics, we conducted a literature review of CISR-related documents
published between 2010 and 2015. The corpus of publicly available documents included sector-specific strategies, plans, and assessments and sector and government coordinating council charters. IDA performed a content analysis on the most relevant subset of the corpus to identify and compile R&D activities, priorities, and goals. We developed a coding system to assess the relevance of potential R&D topic areas. Using the output from the literature review and content analysis and considering existing Federal CISR R&D efforts, we proposed an initial list of challenge areas for consideration.
Review by CISR Subject Matter Experts and CISR Stakeholders
IDA provided the list of initial challenge areas to CISR Subcommittee subject matter experts (SME) for review. Using a modified Delphi method, the SMEs were asked to propose additional challenge area topics, which lead to a final list of 40 potential priorities.
The final step in the challenge area development process was a CISR stakeholder review, which was facilitated through the Critical Infrastructure Partnership Advisory Council (CIPAC).1 Potential challenge areas were presented to CIPAC members along with a questionnaire to elicit structured feedback from SMEs. With IDA’s facilitation, the CISR Subcommittee used the CIPAC feedback to refine the potential list

52 Research Notes
into the final five challenge areas—prioritized in the Roadmap as follows:
1. Understanding interdependencies in infrastructure vulnerabilities for improved decision making
2. Position, navigation, and timing support functions
3. Resilient, secure, and modernized water and wastewater infrastructure systems capable of integration with legacy systems
4. Next-generation building materials and applications for transportation infrastructure systems
5. Resilient and secure energy delivery systems.
Developing the Roadmap
After coordinating the identification and selection of challenge areas, IDA facilitated an interagency working group process under the CISR Subcommittee, with each working group focused on a challenge area. The working groups set goals and identified R&D activities, actors, deliverables, and timelines necessary to make progress across each challenge area. The Roadmap was published in December 2016.
The Maturity Scale Framework (MSF) and Measuring Performance to Achieve CISR R&D Goals
The Plan called for DHS to develop annual performance metrics within six months of the release of the Roadmap. Performance metrics allow agencies to track the progress of activities against the challenge areas challenge areas in the Roadmap and priority areas in the Plan. Performance metrics can
help inform future Federal CISR R&D program investment by identifying CISR programs that are effectively managed and meeting user needs.
To fulfill the Plan’s requirement and accomplish these objectives, IDA developed the MSF. The concept of tracking metrics through a codified framework is not new idea, but existing approaches to evaluating and tracking R&D progress are insufficient for the varied R&D activities in the Roadmap. For example, the Technology Readiness Assessment (TRA) evaluates linear innovation processes for an individual technology but does not assess non-technical processes required for successful R&D. The MSF builds on the TRA by providing a more holistic approach to metrics. It tracks and evaluates technical and non-technical processes associated with R&D and provides stakeholders a standard taxonomy for measuring progress across activities. When used together, technical metrics such as the TRA can complement the MSF’s holistic approach to create a more complete set of data to evaluate R&D progress and processes.
The MSF is divided into four phases (see Figure 1). The first phase focuses on identification of R&D challenge areas, goals, activities, and deliverables. The second phase focuses on the development (or refinement) of R&D programs to address and complete the identified goals, activities, and deliverables. The third phase focuses on the implementation of the R&D program. The fourth phase, which focuses on transferring the R&D product to the broader CISR community, includes piloting, confirming, and finalizing R&D results
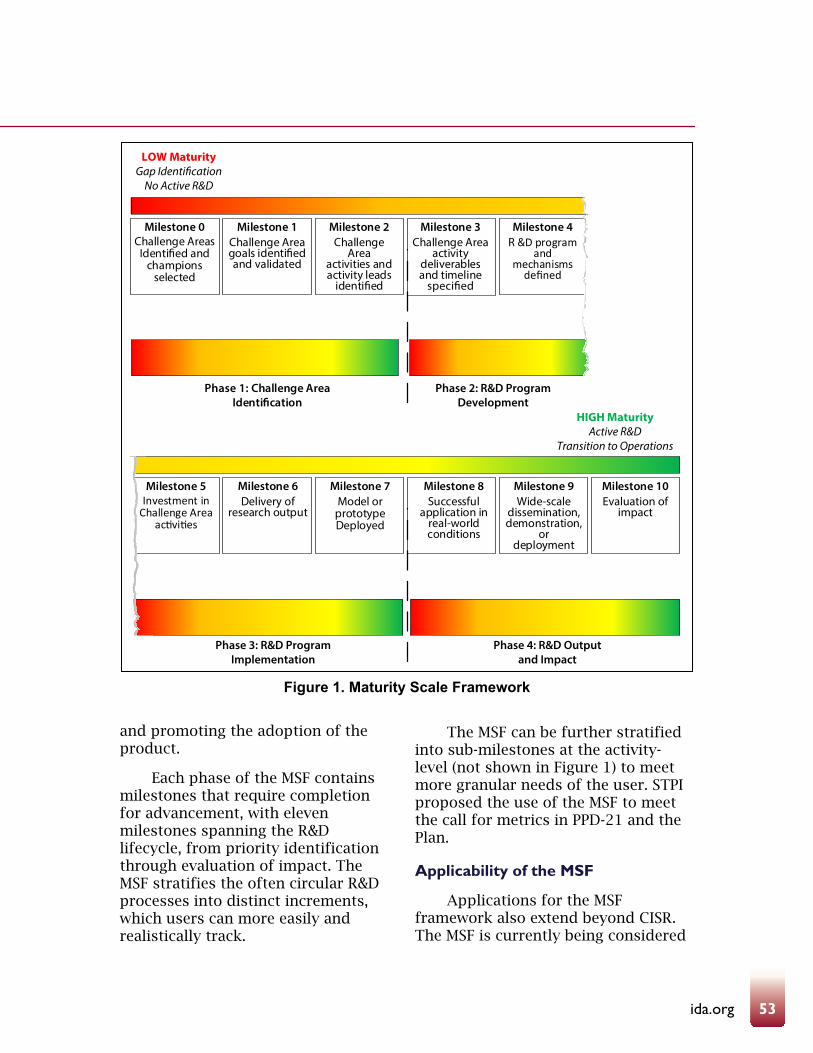
53ida.org
and promoting the adoption of the product.
Each phase of the MSF contains milestones that require completion for advancement, with eleven milestones spanning the R&D lifecycle, from priority identification through evaluation of impact. The MSF stratifies the often circular R&D processes into distinct increments, which users can more easily and realistically track.
The MSF can be further stratified into sub-milestones at the activity-level (not shown in Figure 1) to meet more granular needs of the user. STPI proposed the use of the MSF to meet the call for metrics in PPD-21 and the Plan.
Applicability of the MSF
Applications for the MSF framework also extend beyond CISR. The MSF is currently being considered
Figure 1. Maturity Scale Framework
Milestone 0Challenge Areas
Identi�ed andchampions
selected
Phase 1: Challenge Area Identi�cation
LOW MaturityGap Identi�cation
No Active R&D
Phase 2: R&D ProgramDevelopment
Milestone 1Challenge Areagoals identi�ed and validated
Milestone 2Challenge
Areaactivities andactivity leads
identi�ed
Milestone 3Challenge Area
activity deliverablesand timeline
speci�ed
Milestone 4R &D program
andmechanismsdefined
HIGH MaturityActive R&D
Transition to Operations
Phase 3: R&D ProgramImplementation
Phase 4: R&D Output and Impact
Milestone 5Investment in
Challenge Areaactivities
Milestone 6Delivery of
research output
Milestone 7Model or
prototypeDeployed
Milestone 8Successful
application in real-world conditions
Milestone 9Wide-scale
dissemination,demonstration,
ordeployment
Milestone 10Evaluation of
impact

54 Research Notes
for use in other efforts, and IDA researchers presented the framework at the 30th Annual American Evaluation Association Conference in
October 2016 to highlight its broad applicability to all R&D efforts inside and outside the Federal government.
References
Department of Homeland Security. 2015. National Critical Infrastructure Security and Resilience Research and Development Plan. Washington, DC: Department of Homeland Security, November.
National Science and Technology Council. 2016. Implementation Roadmap for the National Critical Infrastructure Security and Resilience Research and Development Plan. Washington, DC: Executive Office of the President, December.
The White House. 2013. Presidential Policy Directive 21 – Critical Infrastructure Security and Resilience. PPD-21. Washington, DC: The White House, February.
Dr. Steven Lev (right) is a former Research Staff Member in IDA’s Science and Technology Policy Institute. He holds a Doctor of Philosophy in geochemistry from the State University of New York at Stony Brook.
Ms. Anne Ressler (left) is a former Policy Fellow in IDA’s Science and Technology Policy Institute. She holds two bachelor’s degrees, one in mechanical engineering and one in engineering sciences, both from Dartmouth College.
Dr. Seth Jonas (photo not available) is a Research Staff Member in IDA’s Science and Technology Policy Institute. He holds a Doctor of Philosophy in physics from Johns Hopkins University.
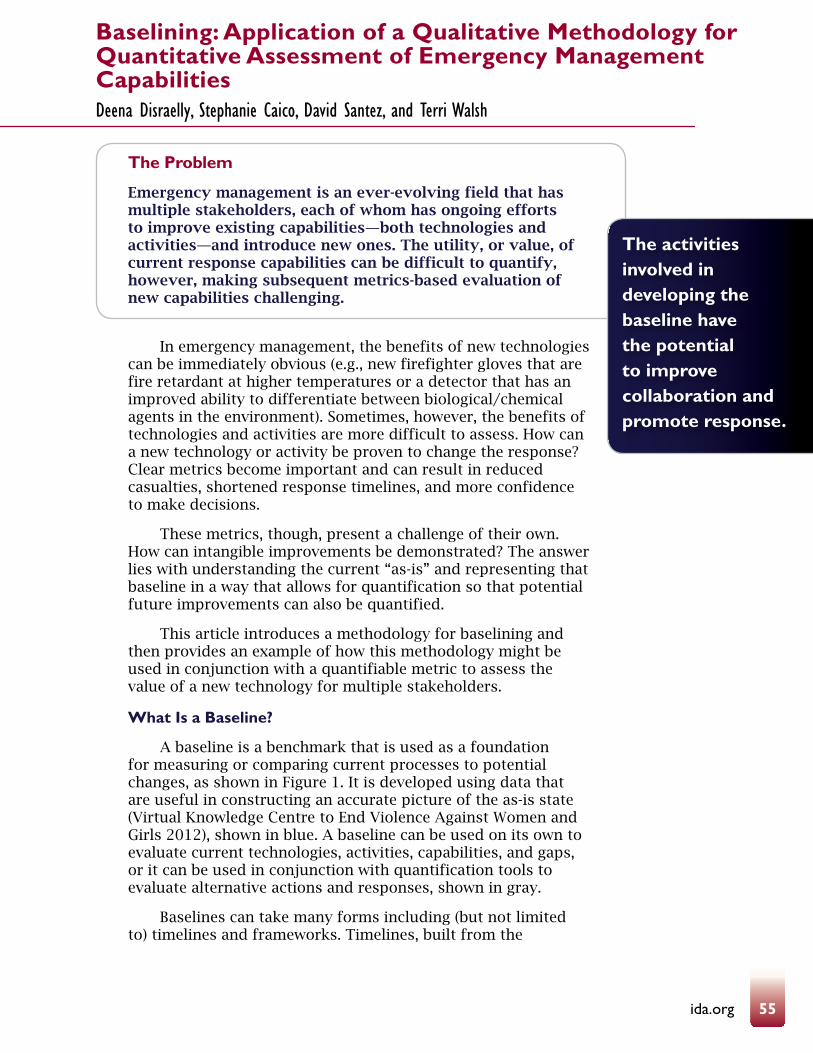
55ida.org
The Problem
Emergency management is an ever-evolving field that has multiple stakeholders, each of whom has ongoing efforts to improve existing capabilities—both technologies and activities—and introduce new ones. The utility, or value, of current response capabilities can be difficult to quantify, however, making subsequent metrics-based evaluation of new capabilities challenging.
In emergency management, the benefits of new technologies can be immediately obvious (e.g., new firefighter gloves that are fire retardant at higher temperatures or a detector that has an improved ability to differentiate between biological/chemical agents in the environment). Sometimes, however, the benefits of technologies and activities are more difficult to assess. How can a new technology or activity be proven to change the response? Clear metrics become important and can result in reduced casualties, shortened response timelines, and more confidence to make decisions.
These metrics, though, present a challenge of their own. How can intangible improvements be demonstrated? The answer lies with understanding the current “as-is” and representing that baseline in a way that allows for quantification so that potential future improvements can also be quantified.
This article introduces a methodology for baselining and then provides an example of how this methodology might be used in conjunction with a quantifiable metric to assess the value of a new technology for multiple stakeholders.
What Is a Baseline?
A baseline is a benchmark that is used as a foundation for measuring or comparing current processes to potential changes, as shown in Figure 1. It is developed using data that are useful in constructing an accurate picture of the as-is state (Virtual Knowledge Centre to End Violence Against Women and Girls 2012), shown in blue. A baseline can be used on its own to evaluate current technologies, activities, capabilities, and gaps, or it can be used in conjunction with quantification tools to evaluate alternative actions and responses, shown in gray.
Baselines can take many forms including (but not limited to) timelines and frameworks. Timelines, built from the
Baselining: Application of a Qualitative Methodology for Quantitative Assessment of Emergency Management Capabilities Deena Disraelly, Stephanie Caico, David Santez, and Terri Walsh
The activities involved in developing the baseline have the potential to improve collaboration and promote response.

56 Research Notes
stakeholders up, illustrate the as-is by showing decisions, activities, information sharing, and high-impact events and using time as the principal metric for comparison. Frameworks use a top-down approach to gather a baseline of current guidance and “best practices,” which can then be used in comparison with plans and protocols to identify divergences in practice and opportunities for guidance, activity, or technology improvements.
How Is a Baseline Developed?
Baselines can be developed using a number of techniques. While the exact methodologies employed to develop the baseline may vary, a number of fundamental steps build a baseline, as exemplified in Figure 2.
The first step, literature review, gathers inputs, or “unstructured data,” from sources including plans, guidance, policies, and other documents. These documents provide an introduction to the decisions, actions, and information sharing that occur as part of any emergency response activity and serve as a foundation for follow-on baselining efforts. The literature review can also help the study team identify relevant stakeholders who have roles and responsibilities that should be captured in the baseline.
In addition, because the literature review aims to provide a comprehensive view of the mission and response space, it allows for an identification of potential gaps
Figure 1. Building a Baseline for Use in Demonstrating the Potential of New Technologies and Activities
Plans & OtherDocuments
Stakeholders
How do we builda baseline?How is a baselineused?
Input
Methodology
Interim state
Outcome
Interventions
Technologies& Activities
MethodologyIncorporation
of possiblechanges
The“New State”
Modeling
Estimate ofImpacts“As-Is”
Estimate ofImpacts
“New State”
Measurementof Delta
Baseline:Understanding
the “As-Is”
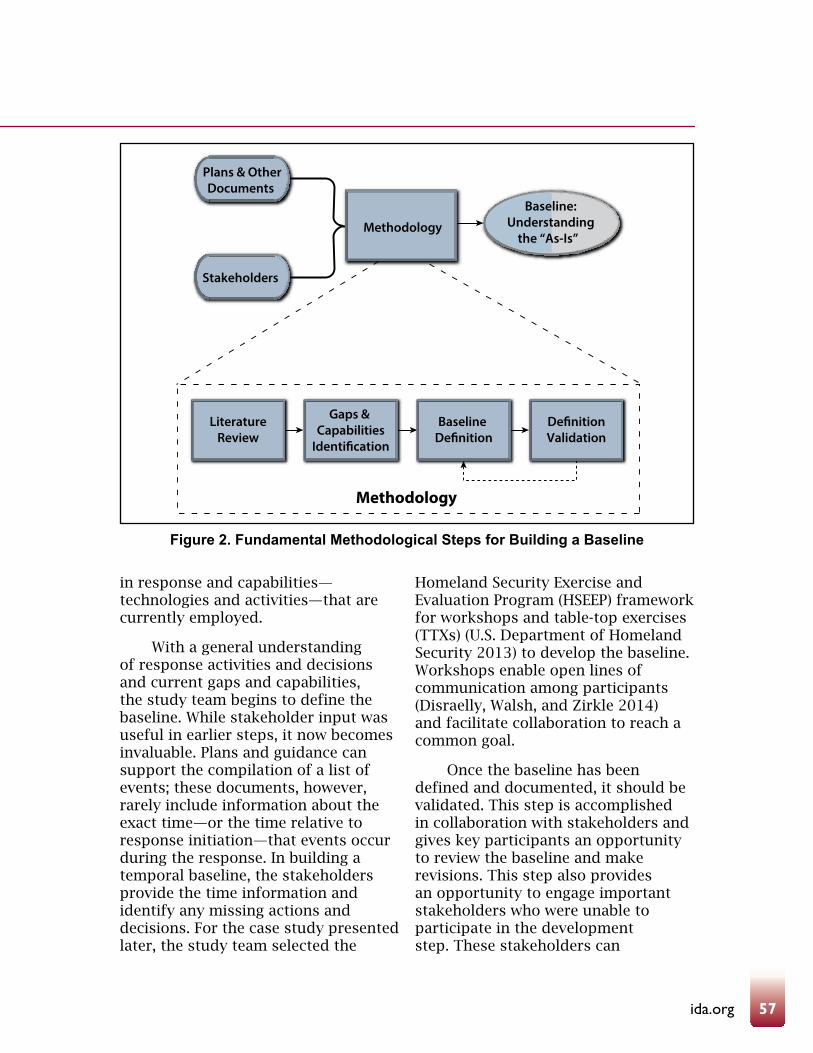
57ida.org
in response and capabilities—technologies and activities—that are currently employed.
With a general understanding of response activities and decisions and current gaps and capabilities, the study team begins to define the baseline. While stakeholder input was useful in earlier steps, it now becomes invaluable. Plans and guidance can support the compilation of a list of events; these documents, however, rarely include information about the exact time—or the time relative to response initiation—that events occur during the response. In building a temporal baseline, the stakeholders provide the time information and identify any missing actions and decisions. For the case study presented later, the study team selected the
Homeland Security Exercise and Evaluation Program (HSEEP) framework for workshops and table-top exercises (TTXs) (U.S. Department of Homeland Security 2013) to develop the baseline. Workshops enable open lines of communication among participants (Disraelly, Walsh, and Zirkle 2014) and facilitate collaboration to reach a common goal.
Once the baseline has been defined and documented, it should be validated. This step is accomplished in collaboration with stakeholders and gives key participants an opportunity to review the baseline and make revisions. This step also provides an opportunity to engage important stakeholders who were unable to participate in the development step. These stakeholders can
Figure 2. Fundamental Methodological Steps for Building a Baseline
Methodology
LiteratureReview
Gaps & Capabilities
Identi�cation
Baseline De�nition
De�nitionValidation
Baseline:Understanding
the “As-Is”
Plans & OtherDocuments
Stakeholders
Methodology
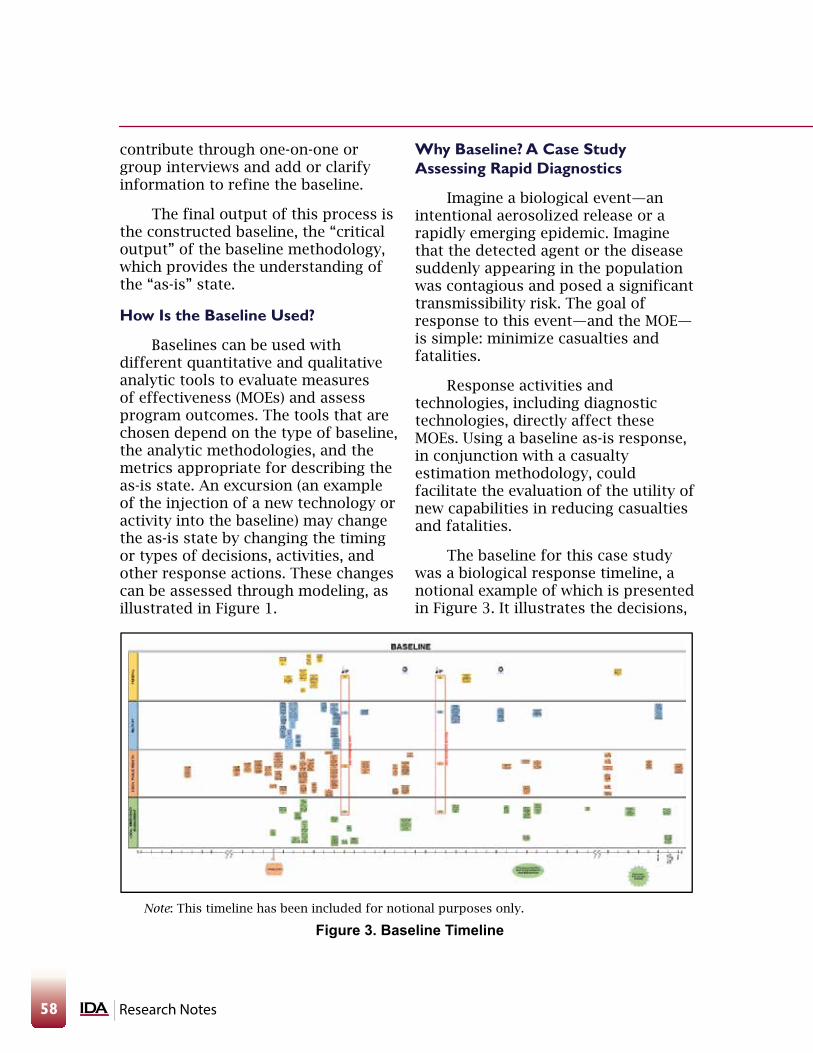
58 Research Notes
contribute through one-on-one or group interviews and add or clarify information to refine the baseline.
The final output of this process is the constructed baseline, the “critical output” of the baseline methodology, which provides the understanding of the “as-is” state.
How Is the Baseline Used?
Baselines can be used with different quantitative and qualitative analytic tools to evaluate measures of effectiveness (MOEs) and assess program outcomes. The tools that are chosen depend on the type of baseline, the analytic methodologies, and the metrics appropriate for describing the as-is state. An excursion (an example of the injection of a new technology or activity into the baseline) may change the as-is state by changing the timing or types of decisions, activities, and other response actions. These changes can be assessed through modeling, as illustrated in Figure 1.
Why Baseline? A Case Study Assessing Rapid Diagnostics
Imagine a biological event—an intentional aerosolized release or a rapidly emerging epidemic. Imagine that the detected agent or the disease suddenly appearing in the population was contagious and posed a significant transmissibility risk. The goal of response to this event—and the MOE—is simple: minimize casualties and fatalities.
Response activities and technologies, including diagnostic technologies, directly affect these MOEs. Using a baseline as-is response, in conjunction with a casualty estimation methodology, could facilitate the evaluation of the utility of new capabilities in reducing casualties and fatalities.
The baseline for this case study was a biological response timeline, a notional example of which is presented in Figure 3. It illustrates the decisions,
Note: This timeline has been included for notional purposes only.
Figure 3. Baseline Timeline

59ida.org
actions, and communications taken by different stakeholder organizations during a biological event response. The timeline demonstrates a common operating picture in which actions are coordinated across different groups.
IDA developed the Human Response Injury Profile (HRIP) casualty estimation methodology to assess potential injury status over time, illness progression resolutions, and disease spread (Disraelly et al. 2010). The study team used HRIP to estimate the casualties and fatalities that might be expected given the biological event and the as-is response, displayed in Figure 4, assuming that post-exposure prophylaxis (PEP) is available and would be distributed on Day 5 after release.
The scenario, as presented, could result in tens of thousands of casualties. Could the introduction of a new technology or activity change this outcome? What if a proposed rapid diagnostic tool was “injected”
into the baseline? How would this rapid diagnostic tool affect the number of casualties and fatalities? The technology aims to provide diagnostic information faster to allow for more rapid treatment of the ill and countermeasures to protect the susceptible populations. This scenario is not intended to imply that diagnostics can be done earlier in the course of the disease, since, for many diseases, effective diagnostics may not be possible during the incubation or even prodromal stages.
To evaluate the effect of the potential technology introduction, a “new response,” or “excursion,” was injected into the baseline. The injection of a notional rapid diagnostic tool could provide early indication of the emerging biological event and facilitate the implementation of intentional social distancing on Day 3 (vs. Day 5). With all other interventions and times remaining constant, the casualty and fatality estimates of this new response dropped as calculated
Figure 4. Baseline Daily Casualty and Fatality Estimations Resulting from an Emerging Contagious Biological Event
0
10,000
20,000
30,000
40,000
50,000
60,000
70,000
0 2 4 6 8 10 12 14 16 18 20 22 24 26
Days After Release
Casualties (Baseline)Fatalities (Baseline)
Casu
alti
es &
Fata
litie
s
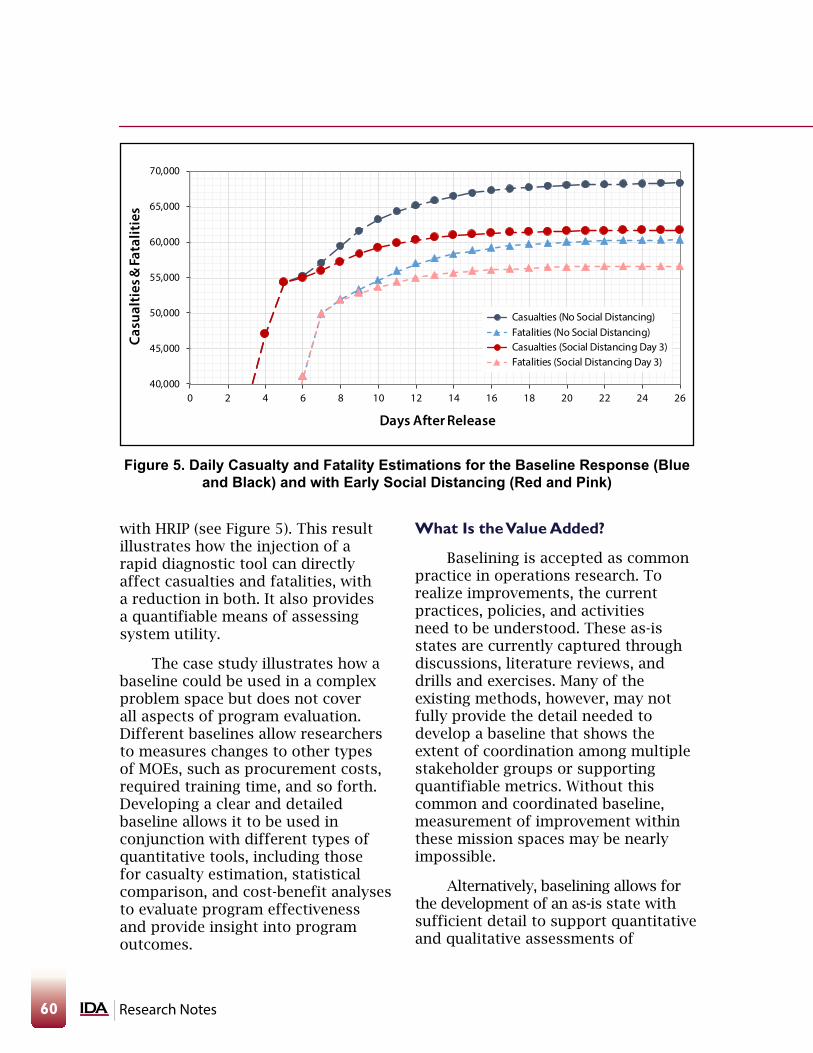
60 Research Notes
with HRIP (see Figure 5). This result illustrates how the injection of a rapid diagnostic tool can directly affect casualties and fatalities, with a reduction in both. It also provides a quantifiable means of assessing system utility.
The case study illustrates how a baseline could be used in a complex problem space but does not cover all aspects of program evaluation. Different baselines allow researchers to measures changes to other types of MOEs, such as procurement costs, required training time, and so forth. Developing a clear and detailed baseline allows it to be used in conjunction with different types of quantitative tools, including those for casualty estimation, statistical comparison, and cost-benefit analyses to evaluate program effectiveness and provide insight into program outcomes.
What Is the Value Added?
Baselining is accepted as common practice in operations research. To realize improvements, the current practices, policies, and activities need to be understood. These as-is states are currently captured through discussions, literature reviews, and drills and exercises. Many of the existing methods, however, may not fully provide the detail needed to develop a baseline that shows the extent of coordination among multiple stakeholder groups or supporting quantifiable metrics. Without this common and coordinated baseline, measurement of improvement within these mission spaces may be nearly impossible.
Alternatively, baselining allows for the development of an as-is state with sufficient detail to support quantitative and qualitative assessments of
Figure 5. Daily Casualty and Fatality Estimations for the Baseline Response (Blue and Black) and with Early Social Distancing (Red and Pink)
40,000
45,000
50,000
55,000
60,000
65,000
70,000
0 2 4 6 8 10 12 14 16 18 20 22 24 26
Casu
alti
es &
Fata
litie
s
Days After Release
Casualties (No Social Distancing)Fatalities (No Social Distancing)Casualties (Social Distancing Day 3)Fatalities (Social Distancing Day 3)
61ida.org
potential technology and activity changes. In addition, the activities involved in the baselining facilitate the coordination between stakeholders, the reviews and revisions of the as-is even without the introduction of new capabilities, and the identification of current capabilities and gaps that
must be filled. So, while baselining facilitates capability utility assessment for emergency response, even as the assessments are ongoing, the activities involved in developing the baseline have the potential to improve collaboration and promote response.
References
Disraelly, Deena S., Caroline R. Earle, Margaret H. Katz, and Terri J. Walsh. 2014. “Biosurveillance (BSV) Information Exchange Limited Objective Experiment (LOE) – Local Concepts of Operation Table Top Exercise (TTX).” IDA Fact Sheet. Alexandria, VA: Institute for Defense Analyses (IDA).
Disraelly, Deena S., Terri J. Walsh, and Robert A. Zirkle. 2010. “A New Methodology for Chemical, Biological, Radiological, and Nuclear Casualty Estimation over Time.” Journal of Defense Modeling and Simulation (JDMS) 7 (4): 226–240.
U.S. Department of Homeland Security. 2013. Homeland Security Exercise and Evaluation Program (HSEEP). Washington, DC: U.S. Department of Homeland Security, April.
Virtual Knowledge Centre to End Violence Against Women and Girls. 2012. “What Is a Baseline Assessment?” Accessed March 16, 2017.
Dr. Deena Disraelly (right foreground) is a Research Staff Member in IDA’s Strategy, Forces and Resources Division. She holds a Doctor of Philosophy in engineering management from the George Washington University.
Ms. Stephanie Caico (left foreground) is a Research Associate in IDA’s Strategy, Forces and Resources Division. She holds a Master of Public Health from New York University.
Mr. David Santez (left background) is a Research Associate in IDA’s Strategy, Forces and Resources Division. He holds a Master of Science in mechanical and aerospace engineering from George Washington University.
Ms. Terri Walsh (right background) is a Research Staff Member in IDA’s Strategy, Forces and Resources Division. She holds a Bachelor of Science from the University of Mary Washington.

62 Research Notes
The Problem
The Department of Homeland Security mission requires an enterprise’s systems-of-systems (SoS) analytic capability to allow DHS leaders to gain understanding of the combined effects of cross-component capabilities and processes from an SoS perspective, and to enhance DHS enterprise planning activities (e.g., joint assessment of requirements, strategic programming, acquisition decisions, operational assessments).
Background
Virtually all analyses currently performed in DHS—whether to justify an investment, assess the adequacy of an existing capability, or for some other reason—center, if not entirely then almost exclusively, on the individualized assessment of the focal system, platform, or capability. Few, if any, satisfactorily account, in a holistic way, for the mission contributions of related systems or combined effects of the overall SoS. Multiple Government Accountability Office (GAO) reports recognized that DHS core missions would benefit from joint assessments that consider competing and complementary platforms, systems, and activities across the Doctrine, Organization, Training, Materiel, Leadership and Education, Personnel, Facilities and Policy (DOTMLPF) spectrum.
To address this gap, the DHS Science and Technology Directorate is standing up a System of Systems Operational Analytics (SoSOA) investment to establish an analytic framework, designed and developed in partnership with the components and headquarters organizations, through the integration of existing and emerging analytic, modeling, and simulation (M&S) technologies. We describe the SoSOA in terms of an analysis use case, along with some of the analytic and technical challenges the program will need to address.
Analysis Use Case
In general, there are three sources of activities that may result in analysis due to the identification of a gap: a policy directive, an acquisition initiative, and an Inspector General or GAO request. In all three cases, the directive for analysis is assigned to a sponsor or stakeholder responsible for responding to the directive (usually with some kind of analytic activity). The stakeholder often seeks support (e.g., Federally Funded Research and Development Center, University Affiliated Research Center,
Analysis, Analysis Practices, and Implications for Modeling and SimulationAmy Henninger
The act of identifying, enumerating, evaluating, and mapping known technologies to inferred program requirements is an important foundation to enterprise planning activities.

63ida.org
or internal support) for the analysis, and a fair amount of interplay (e.g., problem definition/scoping, negotiation for resources) must take place to plan and execute the analysis.
Typically, and in the “as-is” case (see Figure 1), the directive does not identify a SoS view, only a single-platform, single-solution view. The needs analyses for the MQ-9 and the Multi-mission Enforcement Aircraft (MEA) are examples of this single platform approach. The quantities and laydown of these complementry aircraft, with overlapping capabilities, were analyzed without regard for each other. This is a common analytic challenge at DHS, where related analyses may spawn multiple directives for multiple studies or analyses, designed and executed by independent organizations using unique methods, tools, or data that are not normalized, not interoperable, and in some cases not even formally assessed for their fitness for use. In cases such as these, decision makers are faced with the difficult task of
using independently derived and inherently incomparable analytic results to envisage the combined effects of multiple systems.
In the “to-be” case (see Figure 2), on the other hand, the SoSOA intends to provide a capability set that helps to structure the study planning process to foster the use of normalized and validated tools, methods, and data. In this case, the analytical questions and supporting tools and data can be used to assess the interactions of all systems and their contributions to the overall mission. For example, if the mission contributions of Unmanned Ground Vehicles (UGs) interact with the mission contributions of Integrated Fixed Cameras, the analysis of the two systems jointly will reveal the relationship and allow for a more-refined characterization of the trade space. This insight allows better informed investments—not decided on a system-by-system isolated basis but on the contribution of the pieces to the overall capability.
Figure 1. As-Is Analytical Ecosystem at DHS
Analyst1Results1 Analysis
Quality1
AnalysisQuality2
AnalysisQuality3
Results2
Results3
CONOPS
Study Method1
Analytic Tools1
System Data1
Geospatial Data1
Border
Mission Essential Tasks
Decision Maker
CONOPS
Study Method2
Analytic Tools2
System Data2
Geospatial Data2
CONOPS
Study Method3
Analytic Tools3
System Data3
Geospatial Data3
Analyst2
Analyst3
S
S
Border
Border
Border
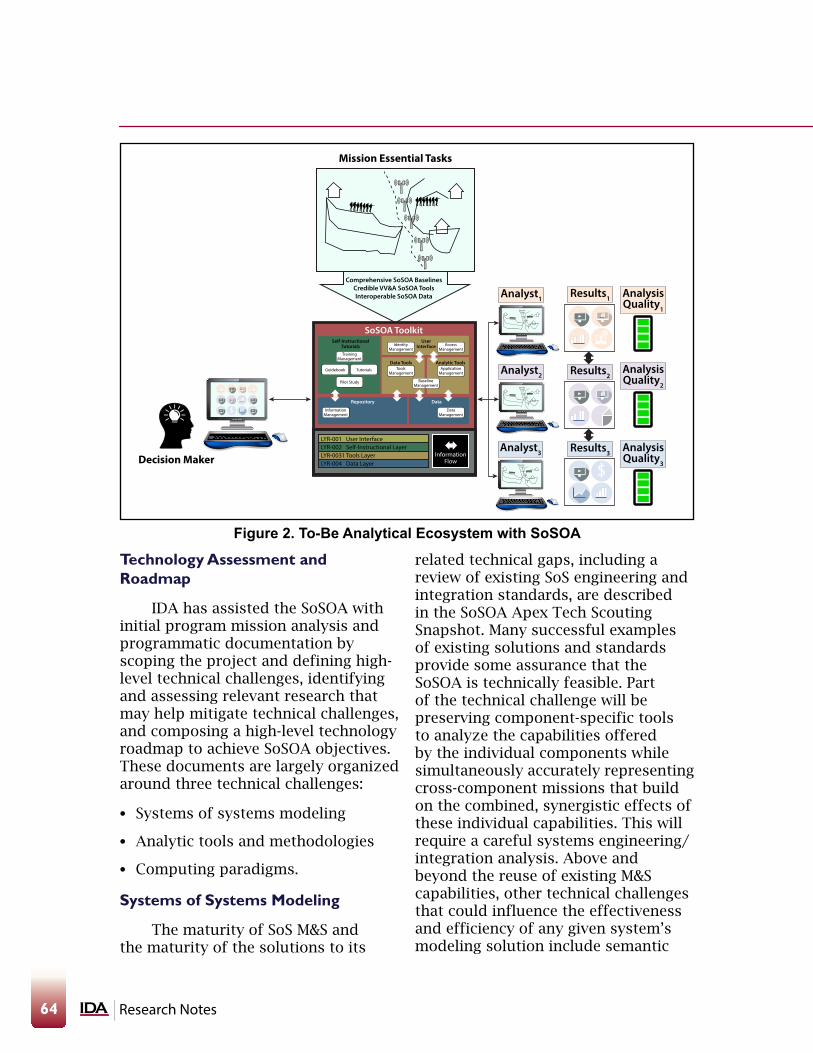
64 Research Notes
Technology Assessment and Roadmap
IDA has assisted the SoSOA with initial program mission analysis and programmatic documentation by scoping the project and defining high-level technical challenges, identifying and assessing relevant research that may help mitigate technical challenges, and composing a high-level technology roadmap to achieve SoSOA objectives. These documents are largely organized around three technical challenges:
l Systems of systems modeling
l Analytic tools and methodologies
l Computing paradigms.
Systems of Systems Modeling
The maturity of SoS M&S and the maturity of the solutions to its
related technical gaps, including a review of existing SoS engineering and integration standards, are described in the SoSOA Apex Tech Scouting Snapshot. Many successful examples of existing solutions and standards provide some assurance that the SoSOA is technically feasible. Part of the technical challenge will be preserving component-specific tools to analyze the capabilities offered by the individual components while simultaneously accurately representing cross-component missions that build on the combined, synergistic effects of these individual capabilities. This will require a careful systems engineering/integration analysis. Above and beyond the reuse of existing M&S capabilities, other technical challenges that could influence the effectiveness and efficiency of any given system’s modeling solution include semantic
Figure 2. To-Be Analytical Ecosystem with SoSOA
Analyst1Results1 Analysis
Quality1
AnalysisQuality2
AnalysisQuality3
Results2
Results3
Border
Mission Essential Tasks
Analyst2
Analyst3
SBorder
Border
Border
S
LYR-001 User InterfaceLYR-002 Self-Instructional LayerLYR-0031 Tools LayerLYR-004 Data Layer
InformationFlow
SoSOA ToolkitSelf-Instructional
Tutorials
Repository Data
UserInterface
TrainingManagement
IdentityManagement
AccessManagement
ToolsManagement
ApplicationManagement
DataManagement
InformationManagement
BaselineManagement
Pilot Study
Guidebook Tutorials
Data Tools Analytic Tools
Comprehensive SoSOA BaselinesCredible VV&A SoSOA ToolsInteroperable SoSOA Data
Decision Maker

65ida.org
interoperability, correlated representation of the environment, fair fight anomalies, and entity aggregation and disaggregation.
Analytic Tools and Methodologies
In general, the SoSOA toolkit should comprise a variety of tools to provide for robust analysis (Davis and Henninger 2007). Beyond the SoSOA M&S infrastructure, SoSOA is intended to include a number of methodological advancements both to improve analytic forecasts and to serve as a catalyst in striking the right business model for enterprise participation. One of these methodological advancements is ensemble modeling (Henninger, Pratt, and Roske 2006). Ensemble modeling is the process of running a number of related but phenomenologically diverse analytical models and then synthesizing the results to improve the accuracy of the overall system. The maturity of these analytic capabilities and the maturity of the solutions to its related technical gaps are described in the SoSOA Tech Scouting Snapshot.
Computing Paradigms
Finally, the platform on which the SoSOA will be implemented is a technical choice that still must be evaluated. Contemporary efforts similar in scope to SoSOA have used cloud platforms (Henninger 2016), high-performance computing platforms (Bouwens et al. 2012), and
SoS modeling efforts in distributed environments based on client-server architectures (Henninger et al. 2008).
After identifying relevant capabilities and applicable technologies across all of these areas and expressing them in terms of maturity and degree of interest to SoSOA, IDA prepared a high-level Technology Roadmap. The Roadmap additionally identified a number of APEX engines and programs that may contribute to the SoSOA capability, and highlighted some of the interrelationships between the various instantiations of these three high-level technical areas. For example, both the simulation architecture and the ensemble architecture would change depending on the computing paradigm adopted.
Conclusion
While only an initial step, the act of identifying, enumerating, evaluating, and mapping known technologies to inferred program requirements is an important foundation to the program. The maturity of these technologies and, in some cases, the existence of similar capabilities, provide some degree of confidence that the undertaking is indeed feasible and achievable within the estimated bounds of program costs, and that the potential payoff in improved capability is worthy of continued research investment at the institutional level.

66 Research Notes
References
Bouwens, Christina, Amy Henninger, Gloria Flowers, and Alicia Paschel. 2012. “OneSAF as a Simulation Service Using High Performance Computing.” Paper presented at the ALASIM 2012 Conference, Huntsville, AL, May 1–3.
Davis, Paul K. and Henninger, Amy. 2007. Analysis, Analysis Practices, and Implications for Modeling and Simulation. RAND Occasional Paper. Arlington, VA: RAND Corporation.
Henninger, A., Pratt, D., and Roske, V. 2006. “Using Ensembles to Reduce Uncertainty.” In Proceedings of the 74th MORS Symposium (MORSS). Colorado Springs, CO: United States Air Force Academy.
Henninger, Amy, Dannie Cutts, Margaret Loper, Robert Lutz, Robert Richbourg, Randy Saunders, and Steve Swenson. 2008. Live Virtual Constructive Architecture Roadmap (LVCAR). Final Report. Alexandria, VA: Institute for Defense Analyses, September.
Henninger, Amy. 2016. Implications of Cloud Computing on Modeling and Simulation. Arlington, VA: National Defense Industrial Association (NDIA) Systems Engineering Committee, April 19.
Dr. Amy Henninger is a former Research Staff Member in IDA’s Information Technology and Systems Division. She holds a Doctor of Philosophy in computer engineering from the University of Central Florida.
67ida.org
The Problem
Reliable systems cost less to operate, are more likely to be available when called upon, and have longer life spans. Unfortunately, we continue to observe systems that fail to meet reliability requirements.
IDA developed and presented reliability training to the DHS Office of Test and Evaluation (T&E). The organization requested this training after realizing that programs were focusing on availability metrics, when better test programs could be developed around reliability metrics. IDA’s training provides information to assist the DHS T&E community in their understanding, review, and assessment of system reliability. We provide an overview of the reliability training we presented to DHS in this article.
The evaluation of system suitability in DHS typically focuses on three components: reliability, availability, and maintainability, often referred to as RAM:
l Reliability. The ability of a system to perform a required function under given operating and environmental conditions for a stated period of time
l Availability. The probability that the system is operating properly when needed for use
l Maintainability. The ability of an item to be retained in, or restored to, a specific condition within a given period of time when maintenance is performed.
For many DHS programs, availability is treated as the primary metric of interest (key performance parameter), and reliability a secondary metric (key system attribute). The focus in this article, however, is on the test and evaluation of reliability. Arguably, reliability is the most informative measure of the three because reliability failures depend on the context of the environment and inform the relevance of the other two measures. It can also be measured more credibly during system development than availability or maintainability. By improving reliability, we improve availability and minimize the impact of maintenance. Note that the definition of availability does not have a mission context; it is strictly a mathematical expression, which can mask underlying reliability problems. A system can achieve high availability despite having poor reliability. Unlike
Test and Evaluation for Reliability Laura Freeman and Rebecca Dickinson
Reliability is a key enabler of suitability and robust reliability leads to reduced life cycle costs.

68 Research Notes
availability, reliability is a direct expression of the likelihood that a system will complete a mission. What matters to system operators is not whether the system works when it is available, but that it works when it is needed.
Notably, a National Research Council report on reliability growth (National Research Council 2015) recommended that reliability be designated as a key performance parameter, making compliance contractually mandatory and helping to ensure that delivered systems are reliable. However, that recommendation has not yet been adopted.
Despite the importance of acquiring reliable systems, we continue to see systems that fail to meet reliability requirements. The 2015 IDA reliability assessment (Freeman et al. 2016) showed that only about 50 percent of systems under Department of Defense (DoD) oversight meet reliability requirements. This trend has been consistent over time and is continually highlighted by the Director, Operational Test and Evaluation (DOT&E) in the Annual Report to Congress on DoD systems (U.S. Department of Defense 2015; U.S. Department of Defense 2016).
The reasons for failure are complex. Case studies show that a lack of design for reliability effort during the design phase, unrealistic requirements, lack of contractual support, insufficient developmental test time, absence of or disagreement on reliability scoring procedures, and failure to correct significant reliability problems discovered in early testing
all contribute to poor reliability outcomes.
Figure 1 shows that a successful reliability program requires many levels of effort, beginning early in the program with writing adequate requirements.
To ensure success, it is important to understand all of the aspects of a good reliability program. As discussed below, IDA researchers have developed training that spans the full range of successful reliability program activities, including developing requirements, implementing a design for reliability program, and testing and evaluating reliability. We have also applied methods to assess reliability more efficiently. For example, IDA often leverages Bayesian methods for combining reliability data for systems with multiple test phases and for systems with common base platforms to maximize the information.
Defining Reliability Requirements
A first step toward producing reliable systems is to ensure that the requirements are appropriate. Appropriate requirements should be attainable, testable, and grounded in operational relevance:
l Attainable. Do similar technologies have comparable requirements? Is there adequate schedule time and funding to reach the requirement? Do the contracting documents contain a reliability specification?
l Testable. High requirements necessitate long tests. For example, it requires a much longer test to evaluate a requirement of 99 percent probability of completing a two-hour
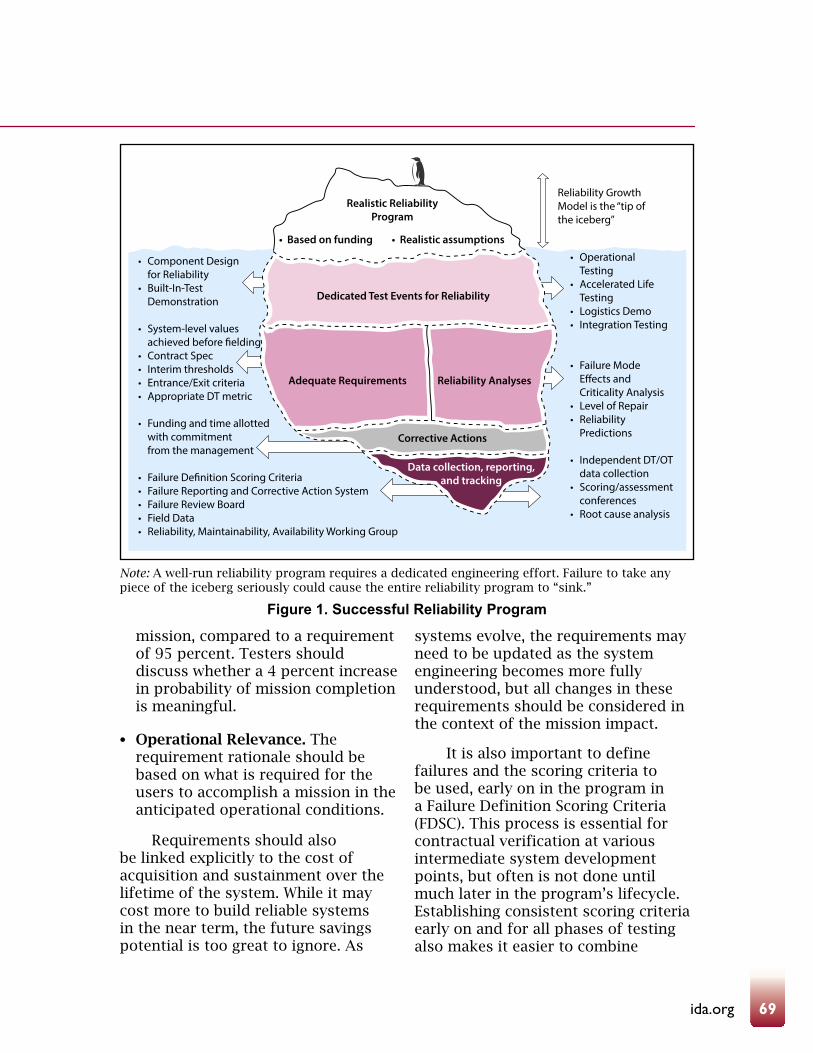
69ida.org
Note: A well-run reliability program requires a dedicated engineering effort. Failure to take any piece of the iceberg seriously could cause the entire reliability program to “sink.”
Figure 1. Successful Reliability Program
• Component Designfor Reliability
• Built-In-TestDemonstration
• System-level valuesachieved before �elding
• Contract Spec• Interim thresholds• Entrance/Exit criteria• Appropriate DT metric
• Funding and time allottedwith commitmentfrom the management
• Failure De�nition Scoring Criteria• Failure Reporting and Corrective Action System• Failure Review Board• Field Data• Reliability, Maintainability, Availability Working Group
Realistic ReliabilityProgram
• Based on funding • Realistic assumptions
Dedicated Test Events for Reliability
Adequate Requirements Reliability Analyses
Corrective Actions
Data collection, reporting,and tracking
• OperationalTesting
• Accelerated LifeTesting
• Logistics Demo• Integration Testing
• Failure ModeE�ects andCriticality Analysis
• Level of Repair• Reliability
Predictions
• Independent DT/OT data collection
• Scoring/assessment conferences
• Root cause analysis
Reliability GrowthModel is the “tip ofthe iceberg”
mission, compared to a requirement of 95 percent. Testers should discuss whether a 4 percent increase in probability of mission completion is meaningful.
l Operational Relevance. The requirement rationale should be based on what is required for the users to accomplish a mission in the anticipated operational conditions.
Requirements should also be linked explicitly to the cost of acquisition and sustainment over the lifetime of the system. While it may cost more to build reliable systems in the near term, the future savings potential is too great to ignore. As
systems evolve, the requirements may need to be updated as the system engineering becomes more fully understood, but all changes in these requirements should be considered in the context of the mission impact.
It is also important to define failures and the scoring criteria to be used, early on in the program in a Failure Definition Scoring Criteria (FDSC). This process is essential for contractual verification at various intermediate system development points, but often is not done until much later in the program’s lifecycle. Establishing consistent scoring criteria early on and for all phases of testing also makes it easier to combine

70 Research Notes
data analytically from different test phases to improve the precision of the estimated reliability parameters.
Requirements, contracting specifications, and reliability growth programs often focus only on a mission-level reliability requirement that includes only failures discovered during mission execution that result in an abort or termination of the mission in progress. A majority of failures that occur during testing, however, do not lead to mission aborts. Bell and Bearden (2014) note that reliability metrics limited to mission aborts are important, but exclude a large portion of failure modes that drive maintenance and cost and reduce system availability. A comprehensive reliability program should establish requirements on measures that include all failures of mission essential components that drive maintenance costs and degrade system availability, regardless of when the failure is discovered.
Design and Redesign for Reliability
Reliability must be designed into a system from its initial conceptualization. Finding failure modes and fixing them after system specifications are determined can provide a marginal improvement in reliability, but the largest gains are realized by designing the system with reliability as a key goal.
During the design and redesign stage, key engineering activities supporting a reliability growth program include the following:
l Allocating reliability to system components and subsystems
l Developing a reliability block diagram and predictions for completing system configurations
l Updating the FDSC
l Analyzing failure modes, mechanisms, and effects
l Refining system environmental loads and expected use profiles
l Dedicating test events for reliability (e.g., accelerated life testing, maintainability, and built-in test demonstrations).
In the early production of a system, reliability testing should shift from the subsystem level to the testing of the full system. It is essential to incorporate operational realism into the testing as early as possible to flesh out failure modes that will be discovered only in an operational environment. A test, analyze, fix, and test strategy should be used to identify and eliminate design weakness inherent to these intermediate system prototypes. A system’s rate of growth generally depends on the following:
l The rate at which failure modes surface
l The turnaround time for analyzing and implementing corrective actions
l The fraction of the initial failure rate addressed by corrective actions (i.e., management strategy)
l The fix effectiveness factor—percent decrease in a failure mode due to a corrective action.
Implementing a design for reliability approach early in system
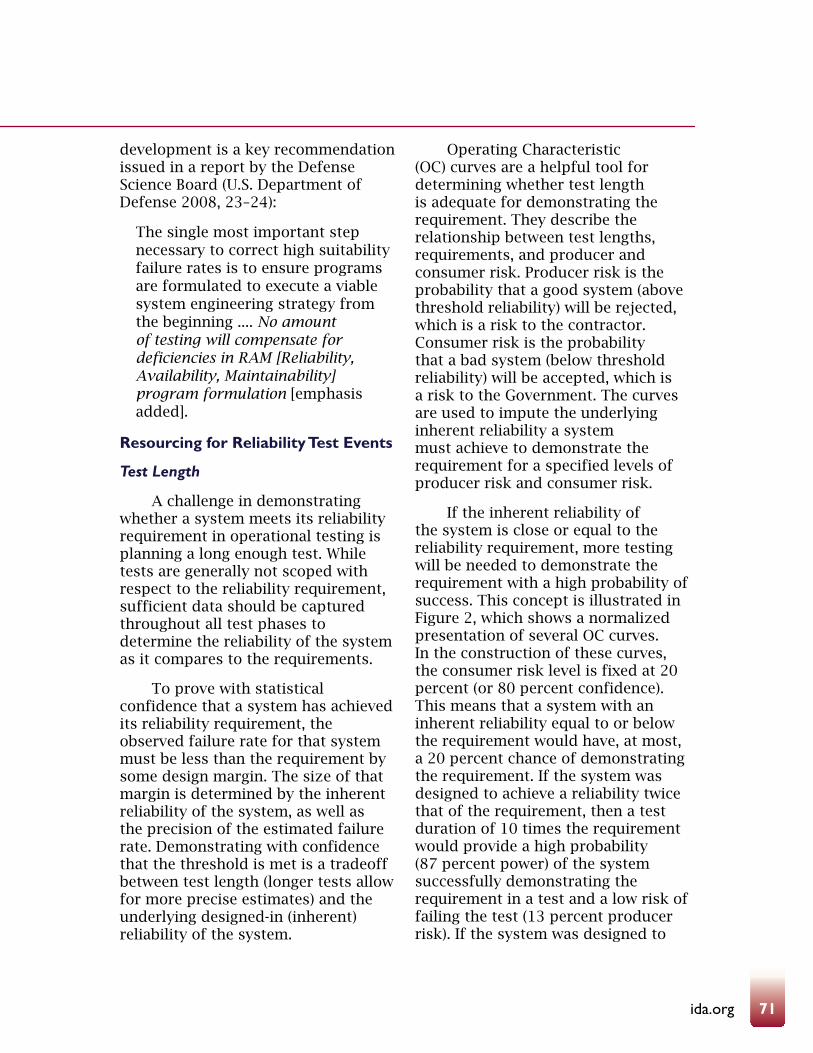
71ida.org
development is a key recommendation issued in a report by the Defense Science Board (U.S. Department of Defense 2008, 23–24):
The single most important step necessary to correct high suitability failure rates is to ensure programs are formulated to execute a viable system engineering strategy from the beginning .... No amount of testing will compensate for deficiencies in RAM [Reliability, Availability, Maintainability] program formulation [emphasis added].
Resourcing for Reliability Test Events
Test Length
A challenge in demonstrating whether a system meets its reliability requirement in operational testing is planning a long enough test. While tests are generally not scoped with respect to the reliability requirement, sufficient data should be captured throughout all test phases to determine the reliability of the system as it compares to the requirements.
To prove with statistical confidence that a system has achieved its reliability requirement, the observed failure rate for that system must be less than the requirement by some design margin. The size of that margin is determined by the inherent reliability of the system, as well as the precision of the estimated failure rate. Demonstrating with confidence that the threshold is met is a tradeoff between test length (longer tests allow for more precise estimates) and the underlying designed-in (inherent) reliability of the system.
Operating Characteristic (OC) curves are a helpful tool for determining whether test length is adequate for demonstrating the requirement. They describe the relationship between test lengths, requirements, and producer and consumer risk. Producer risk is the probability that a good system (above threshold reliability) will be rejected, which is a risk to the contractor. Consumer risk is the probability that a bad system (below threshold reliability) will be accepted, which is a risk to the Government. The curves are used to impute the underlying inherent reliability a system must achieve to demonstrate the requirement for a specified levels of producer risk and consumer risk.
If the inherent reliability of the system is close or equal to the reliability requirement, more testing will be needed to demonstrate the requirement with a high probability of success. This concept is illustrated in Figure 2, which shows a normalized presentation of several OC curves. In the construction of these curves, the consumer risk level is fixed at 20 percent (or 80 percent confidence). This means that a system with an inherent reliability equal to or below the requirement would have, at most, a 20 percent chance of demonstrating the requirement. If the system was designed to achieve a reliability twice that of the requirement, then a test duration of 10 times the requirement would provide a high probability (87 percent power) of the system successfully demonstrating the requirement in a test and a low risk of failing the test (13 percent producer risk). If the system was designed to
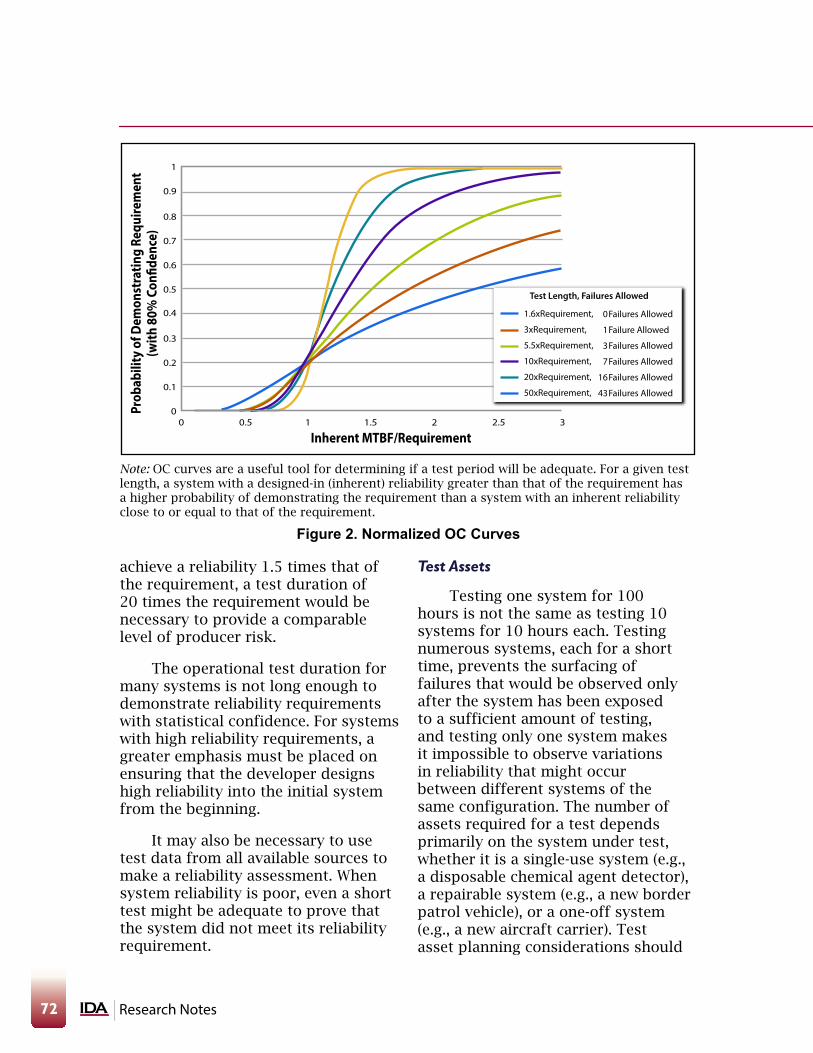
72 Research Notes
achieve a reliability 1.5 times that of the requirement, a test duration of 20 times the requirement would be necessary to provide a comparable level of producer risk.
The operational test duration for many systems is not long enough to demonstrate reliability requirements with statistical confidence. For systems with high reliability requirements, a greater emphasis must be placed on ensuring that the developer designs high reliability into the initial system from the beginning.
It may also be necessary to use test data from all available sources to make a reliability assessment. When system reliability is poor, even a short test might be adequate to prove that the system did not meet its reliability requirement.
Test Assets
Testing one system for 100 hours is not the same as testing 10 systems for 10 hours each. Testing numerous systems, each for a short time, prevents the surfacing of failures that would be observed only after the system has been exposed to a sufficient amount of testing, and testing only one system makes it impossible to observe variations in reliability that might occur between different systems of the same configuration. The number of assets required for a test depends primarily on the system under test, whether it is a single-use system (e.g., a disposable chemical agent detector), a repairable system (e.g., a new border patrol vehicle), or a one-off system (e.g., a new aircraft carrier). Test asset planning considerations should
0
1
3
7
16
43
1
0.9
0.8
0.7
0.6
0.5
0.4
0.3
0.2
0.1
00 0.5 1 1.5 2
Inherent MTBF/Requirement2.5 3
Failures Allowed
Failure Allowed
Failures Allowed
Failures Allowed
Failures Allowed
Failures Allowed
Test Length, Failures Allowed
1.6xRequirement,
3xRequirement,
5.5xRequirement,
10xRequirement,
20xRequirement,
50xRequirement,
Prob
abili
ty o
f Dem
onst
ratin
g Re
quire
men
t(w
ith 8
0% C
on�d
ence
)
Note: OC curves are a useful tool for determining if a test period will be adequate. For a given test length, a system with a designed-in (inherent) reliability greater than that of the requirement has a higher probability of demonstrating the requirement than a system with an inherent reliability close to or equal to that of the requirement.
Figure 2. Normalized OC Curves

73ida.org
include the following:
l How users will employ the system in operation (e.g., a representative unit might require five vehicles)
l Whether to test all variants of the system if there is more than one
l Whether additional assets are required to test under different environmental conditions
l Availability of assets due to cost constraints.
Monitoring, Evaluating, and Reporting Reliability
Reliability should be monitored and reported throughout the acquisition process to evaluate whether a program is on track to meeting its reliability requirements. It should not stop there; monitoring should continue for the duration of the system usage. During development testing, the system configuration typically changes as a result of corrective actions being made. A common monitoring approach is to compare demonstrated reliability to the anticipated reliability of the growth planning curve. If the analysis indicates that the system is not growing in accordance with the plan, it is important to update the growth strategy using more realistic inputs, consider whether additional resources/testing are necessary to reach goals and, if reliability is extremely poor, redesign the system.
During operational testing, the system configuration is usually fixed, and a primary evaluation goal is to determine whether the system meets its reliability requirement. When
reporting a reliability estimate, such as a mean time between failures (MTBF), it is important to include the corresponding statistical confidence intervals. Confidence intervals permit an assessment of the certainty in a result, showing how sure we are about system reliability. Figure 3 highlights the importance of bounding the certainty. In this example, both versions of the system “demonstrated” the system MTBF requirement of 100 hours, but there is more information from one test than the other. From the Operational Assessment, we can state that the system demonstrated the requirement but not with statistical confidence. From the Initial Operational Test, we can state that the system met the requirement with statistical confidence.
There is no single appropriate way to analyze reliability, despite the common misconception that one should simply divide the test duration by the number of failures. Several areas of consideration to address when reporting on reliability are as follows:
l Is the system sufficiently reliable to conduct its mission?
l What was the demonstrated reliability (point estimate and confidence interval)?
l Did the system meet the requirement? Is it a statically significant difference? Is the difference meaningful in an operational context?
l How does the system’s reliability compare to the legacy system? Did an upgrade improve reliability or did it degrade reliability?
74 Research Notes
We noted earlier that it is not always possible or cost effective to collect all of the data on system reliability in a single test. For such cases, using a range of additional sources of relevant information may provide a better assessment of the system reliability. Integrating multiple sources of information, including component, subsystem, and full system data, as well as possible previous test data or subject matter expert opinions, to inform a reliability assessment is not trivial. The Bayesian paradigm is tailor made for this situation. It allows for the combination of multiple sources of data and variability to obtain more robust reliability estimates and uncertainty quantification. For recent examples and discussion on combining information using a Bayesian framework, we recommend Dickinson
et al. (2015), Fronczyk and Freeman (2016), and Wilson and Fronczyk (2017).
Conclusion
Reliability is a key enabler of suitability and robust reliability leads to reduced life cycle costs. Although reliability design and growth testing can be expensive and require careful planning, the return on investment can also be high if properly executed. Using quantitative methods, IDA researchers have improved the estimation of the test durations required for confident evaluation of system reliability. IDA training is available for the community on topics spanning all aspects of reliability programs, including developing requirements, implementing a design for reliability program, and testing and evaluating reliability.
(a) (b)
Note: Confidence intervals quantify the certainty about a reliability estimate, such as the MTBF: (a) demonstrated requirement, but not with statistical confidence; (b) met requirement with statistical confidence.
Figure 3. Confidence Intervals
Operational Assessment (OA):Test Length: 723 hrs
Failures: 5
MTBF Estimate: 144.6 hrs80% CI (78, 297)
Initial Operational Test (IOT):Test Length: 7,052 hrs
Failures: 49
MTBF Estimate: 143.9 hrs80% CI (119.175)
Failure Time (Hours)
Coun
t
2.0
1.5
1.0
0.5
0.0
0 200 400 600
Requirement: 100 MTBF
Failure Time (Hours)Co
unt
15
10
5
0
0 200 400 600
Requirement: 100 MTBF
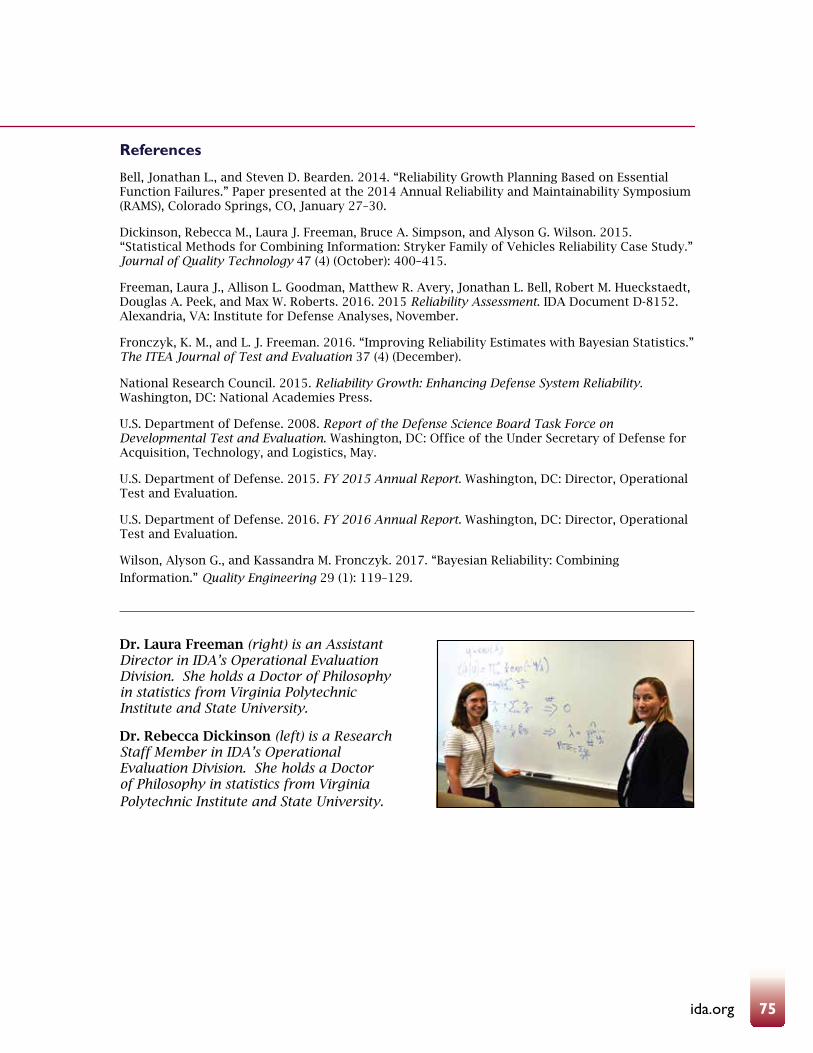
75ida.org
References
Bell, Jonathan L., and Steven D. Bearden. 2014. “Reliability Growth Planning Based on Essential Function Failures.” Paper presented at the 2014 Annual Reliability and Maintainability Symposium (RAMS), Colorado Springs, CO, January 27–30.
Dickinson, Rebecca M., Laura J. Freeman, Bruce A. Simpson, and Alyson G. Wilson. 2015. “Statistical Methods for Combining Information: Stryker Family of Vehicles Reliability Case Study.” Journal of Quality Technology 47 (4) (October): 400–415.
Freeman, Laura J., Allison L. Goodman, Matthew R. Avery, Jonathan L. Bell, Robert M. Hueckstaedt, Douglas A. Peek, and Max W. Roberts. 2016. 2015 Reliability Assessment. IDA Document D-8152. Alexandria, VA: Institute for Defense Analyses, November.
Fronczyk, K. M., and L. J. Freeman. 2016. “Improving Reliability Estimates with Bayesian Statistics.” The ITEA Journal of Test and Evaluation 37 (4) (December).
National Research Council. 2015. Reliability Growth: Enhancing Defense System Reliability. Washington, DC: National Academies Press.
U.S. Department of Defense. 2008. Report of the Defense Science Board Task Force on Developmental Test and Evaluation. Washington, DC: Office of the Under Secretary of Defense for Acquisition, Technology, and Logistics, May.
U.S. Department of Defense. 2015. FY 2015 Annual Report. Washington, DC: Director, Operational Test and Evaluation.
U.S. Department of Defense. 2016. FY 2016 Annual Report. Washington, DC: Director, Operational Test and Evaluation.
Wilson, Alyson G., and Kassandra M. Fronczyk. 2017. “Bayesian Reliability: Combining
Information.” Quality Engineering 29 (1): 119–129.
Dr. Laura Freeman (right) is an Assistant Director in IDA’s Operational Evaluation Division. She holds a Doctor of Philosophy in statistics from Virginia Polytechnic Institute and State University.
Dr. Rebecca Dickinson (left) is a Research Staff Member in IDA’s Operational Evaluation Division. She holds a Doctor of Philosophy in statistics from Virginia Polytechnic Institute and State University.

76 Research Notes
77ida.org
Past IssuesAcquisition Part 2: Executing and Managing Programsl Cost Growth, Acquisition Policy, and Budget Climate
l Improving Predictive Value of Poor Performance
l Root Cause Analysis of VTUAV Fire Scout’s Nunn-McCurdy Breach
l Evaluating Solid Rocket Motor Industrial Base Consolidation Scenarios
l Managing Supply Chain Cyber Risks To DoD Systems and Networks
l Looking Back at PortOpt: An Acquisition Portfolio Optimization Tool
l Predicting the Effect of Schedule on Cost
l Recent Developments in the Joint Strike Fighter Durability Testing
Test and Evaluation: Statistical Methods for Better System Assessmentsl Assessing Submarine Sonar Performance Using Statistically
Designed Tests
l Applying Advanced Statistical Analysis to Helicopter Missile Targeting Systems
l Tackling Complex Problems: IDA’s Analyses of the AN/TPQ-53 Counterfire Radar
l Improving Reliability Estimates with Bayesian Hierarchical Models
l Managing Risks: Statistically Principled Approaches to Combat Helmet Testing
l Validating the Probability of Raid Annihilation Test Bed Using a Statistical Approach
Technological Innovation for National Securityl Acquisition in a Global Technology Environment
l Lessons on Defense R&D Management
l Commercial Industry R&D Best Practices
l Strengthening Department of Defense Laboratories
l Policies of Federal Security Laboratories
l The Civilian Science and Engineering Workforce in Defense Laboratories
l Technology Transfer: DoD Practices
Acquisition, Part 1: Starting Viable Programsl Defining Acquisition Trade Space Through “DERIVE”
l Supporting Acquisition Decisions in Air Mobility
l Assessing Reliability with Limited Flight Testing
l Promise and Limitations of Software Defined Radios
l Implications of Contractor Working Capital on Contract Pricing and Financing
l The Mechanisms and Value of Competition
l Early Management of Acquisition Programs
Security in Africal Trends in Africa Provide Reasons for Optimism
l China’s Soft Power Strategy in Africa
l Sudan on a Precipice
l A New Threat: Radicalized Somali-American Youth
l Chinese Arms Sales to Africa
Challenges in Cyberspacel Cyberspace – The Fifth and Dominant Operational Domain
l Transitioning to Secure Web-Based Standards
l Information Assurance Assessments for Fielded Systems During Combat Command Exercises
l Supplier-Supply Chain Risk Management
l Internet-Derived Targeting: Trends and Technology Forecasting
l Training the DoD Cybersecurity Workforce
Today’s Security Challengesl A Framework for Irregular Warfare Capabilities
l Bridging the Interagency Gap for Stability Operations
l Developing an Adaptability Training Strategy
l Force Sizing for Stability Operations
l Detecting Improvised Explosive Devices
l Building Partner Capacity
l Combating the Trans-South Atlantic Drug Trade
l Countering Transnational Criminal Insurgents
l Understanding the Conflict in Sudan
l Planning Forces for Foreign Internal Defense and Counterinsurgency
l Test and Evaluation for Rapid Fielding Programs
l Using Economic and Financial Leverage
Resource Analysesl Evaluating the Costs and Benefits of Competition for Joint
Strike Fighter Engines
l Analysis and Forecasts of TRICARE Costs
l Effects of Reserve Mobilization on Employers
l Does DoD Profit Policy Motivate Contractors?
l Auctions in Military Compensation
Focusing on the Asia-Pacific Regionl Making Security Partners Better Resource Managers
l Collaborating with Singapore
l Inside North Korea
l Extending Trilateral Cooperation for Disasters
l Developing Human Capital in China

78 Research Notes


![faculty.kutztown.edufaculty.kutztown.edu/rieksts/447-F13/projects/bw/bw.pdf · 2013-10-08 · turns out to be NP-hard [GN91a]. Turning to the issue of the efficiency of plan generation,](https://img.pdfslide.us/doc/110x75/5e86409a3bf1bf39212e4aef/2013-10-08-turns-out-to-be-np-hard-gn91a-turning-to-the-issue-of-the-efficiency.jpg)