Embed Size (px)
Citation preview
NHTSA’s National Center for Statistics and Analysis 1200 New Jersey Avenue SE., Washington, DC 20590
TRAFFIC SAFETY FACTSResearch Note
DOT HS 811 701 December 2012
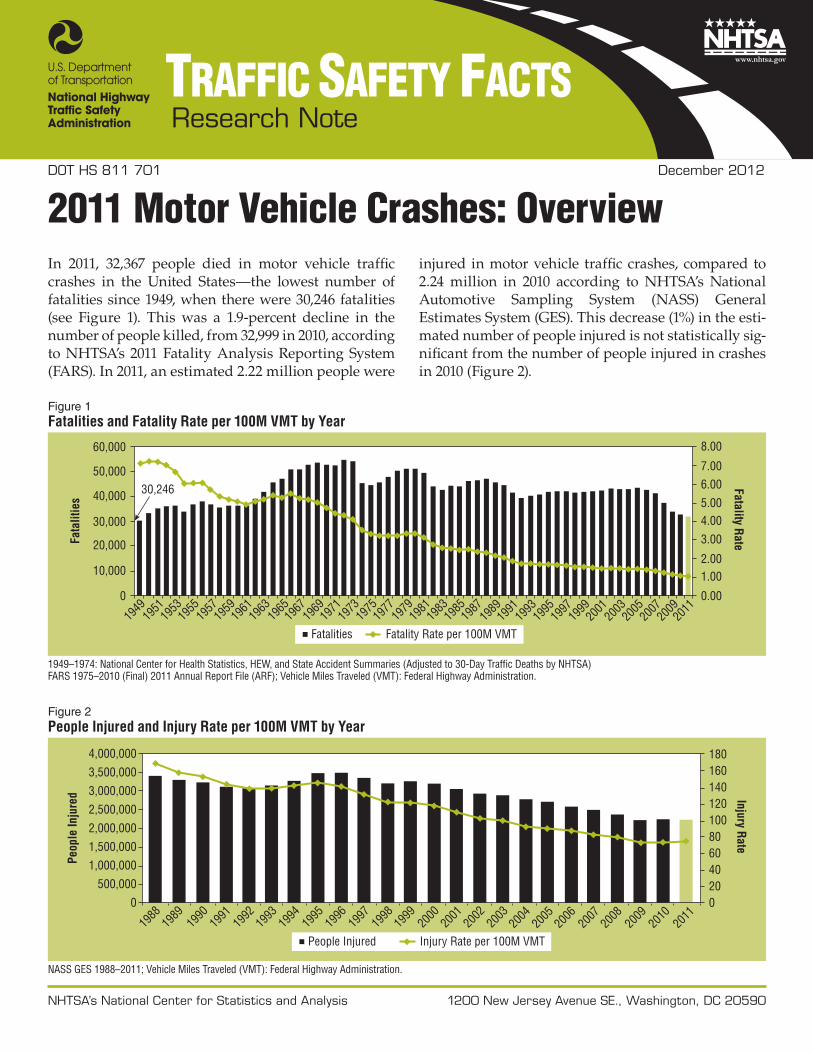
2011 Motor Vehicle Crashes: OverviewIn 2011, 32,367 people died in motor vehicle traffic crashes in the United States—the lowest number of fatalities since 1949, when there were 30,246 fatalities (see Figure 1). This was a 1.9-percent decline in the number of people killed, from 32,999 in 2010, according to NHTSA’s 2011 Fatality Analysis Reporting System (FARS). In 2011, an estimated 2.22 million people were
injured in motor vehicle traffic crashes, compared to 2.24 million in 2010 according to NHTSA’s National Automotive Sampling System (NASS) General Estimates System (GES). This decrease (1%) in the esti-mated number of people injured is not statistically sig-nificant from the number of people injured in crashes in 2010 (Figure 2).
Figure 1Fatalities and Fatality Rate per 100M VMT by Year
60,000
50,000
40,000
Fata
litie
sFatality Rate
30,000
20,000
10,000
0
1949
1951
30,246
1953
1955
1957
1959
1961
1963
1965
1967
1969
1971
1973
1975
1977
1979
1981
1983
1985
1987
1989
1991
1993
1995
1997
1999
2001
2005
2007
2003
2009
2011
6.00
5.004.00
3.00
7.00
8.00
1.002.00
0.00
Fatality Rate per 100M VMTFatalities
1949–1974: National Center for Health Statistics, HEW, and State Accident Summaries (Adjusted to 30-Day Traffic Deaths by NHTSA)FARS 1975–2010 (Final) 2011 Annual Report File (ARF); Vehicle Miles Traveled (VMT): Federal Highway Administration.
Figure 2People Injured and Injury Rate per 100M VMT by Year
4,000,000
3,500,000
3,000,000
2,500,000
2,000,000
1,500,000
1,000,000
500,000
0
Peop
le In
jure
d Injury Rate
1988
1989
1990
1991
1992
1993
1994
1995
1996
1997
1998
1999
2000
2001
2002
2003
2004
2005
2006
2007
2008
2009
2010
2011
180160140120100806040200
Injury Rate per 100M VMTPeople Injured
NASS GES 1988–2011; Vehicle Miles Traveled (VMT): Federal Highway Administration.
2
NHTSA’s National Center for Statistics and Analysis 1200 New Jersey Avenue SE., Washington, DC 20590
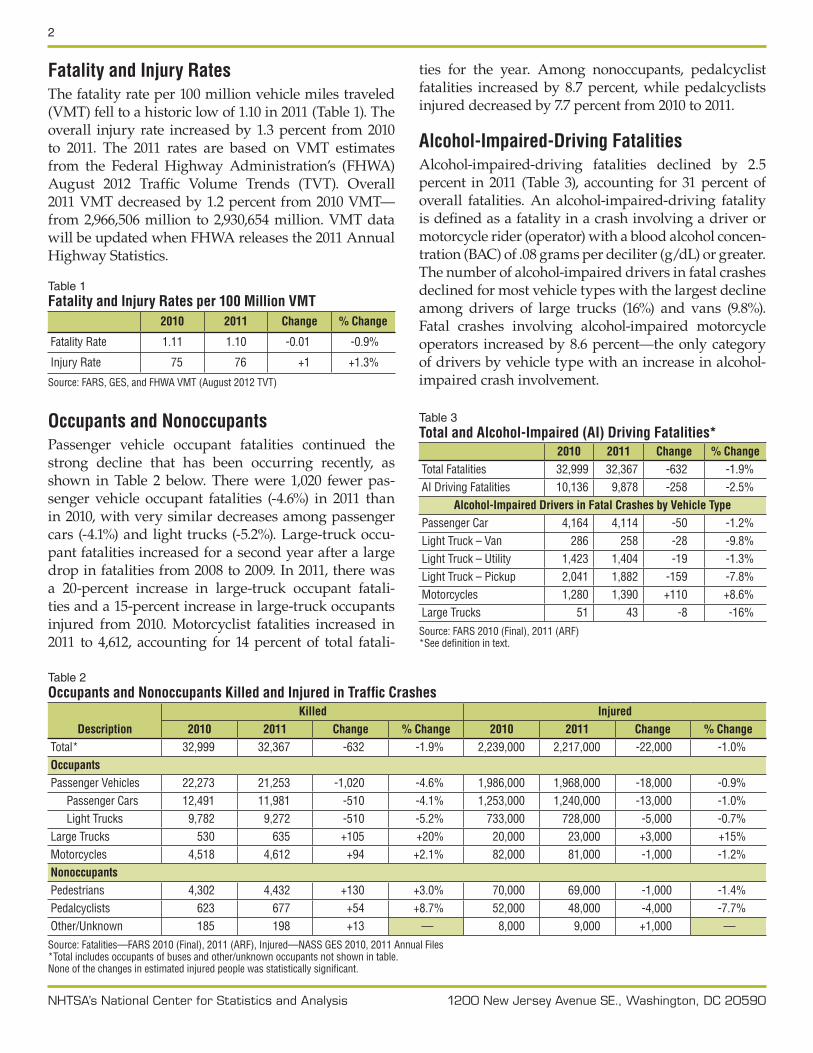
Fatality and Injury RatesThe fatality rate per 100 million vehicle miles traveled (VMT) fell to a historic low of 1.10 in 2011 (Table 1). The overall injury rate increased by 1.3 percent from 2010 to 2011. The 2011 rates are based on VMT estimates from the Federal Highway Administration’s (FHWA) August 2012 Traffic Volume Trends (TVT). Overall 2011 VMT decreased by 1.2 percent from 2010 VMT—from 2,966,506 million to 2,930,654 million. VMT data will be updated when FHWA releases the 2011 Annual Highway Statistics.
Table 1Fatality and Injury Rates per 100 Million VMT
2010 2011 Change % Change
Fatality Rate 1.11 1.10 -0.01 -0.9%
Injury Rate 75 76 +1 +1.3%
Source: FARS, GES, and FHWA VMT (August 2012 TVT)
Occupants and NonoccupantsPassenger vehicle occupant fatalities continued the strong decline that has been occurring recently, as shown in Table 2 below. There were 1,020 fewer pas-senger vehicle occupant fatalities (-4.6%) in 2011 than in 2010, with very similar decreases among passenger cars (-4.1%) and light trucks (-5.2%). Large-truck occu-pant fatalities increased for a second year after a large drop in fatalities from 2008 to 2009. In 2011, there was a 20-percent increase in large-truck occupant fatali-ties and a 15-percent increase in large-truck occupants injured from 2010. Motorcyclist fatalities increased in 2011 to 4,612, accounting for 14 percent of total fatali-
ties for the year. Among nonoccupants, pedalcyclist fatalities increased by 8.7 percent, while pedalcyclists injured decreased by 7.7 percent from 2010 to 2011.
Alcohol-Impaired-Driving FatalitiesAlcohol-impaired-driving fatalities declined by 2.5 percent in 2011 (Table 3), accounting for 31 percent of overall fatalities. An alcohol-impaired-driving fatality is defined as a fatality in a crash involving a driver or motorcycle rider (operator) with a blood alcohol concen-tration (BAC) of .08 grams per deciliter (g/dL) or greater. The number of alcohol-impaired drivers in fatal crashes declined for most vehicle types with the largest decline among drivers of large trucks (16%) and vans (9.8%). Fatal crashes involving alcohol-impaired motorcycle operators increased by 8.6 percent—the only category of drivers by vehicle type with an increase in alcohol-impaired crash involvement.
Table 2Occupants and Nonoccupants Killed and Injured in Traffic Crashes
DescriptionKilled Injured
2010 2011 Change % Change 2010 2011 Change % ChangeTotal* 32,999 32,367 -632 -1.9% 2,239,000 2,217,000 -22,000 -1.0%OccupantsPassenger Vehicles 22,273 21,253 -1,020 -4.6% 1,986,000 1,968,000 -18,000 -0.9%
Passenger Cars 12,491 11,981 -510 -4.1% 1,253,000 1,240,000 -13,000 -1.0%Light Trucks 9,782 9,272 -510 -5.2% 733,000 728,000 -5,000 -0.7%
Large Trucks 530 635 +105 +20% 20,000 23,000 +3,000 +15%Motorcycles 4,518 4,612 +94 +2.1% 82,000 81,000 -1,000 -1.2%NonoccupantsPedestrians 4,302 4,432 +130 +3.0% 70,000 69,000 -1,000 -1.4%Pedalcyclists 623 677 +54 +8.7% 52,000 48,000 -4,000 -7.7%Other/Unknown 185 198 +13 — 8,000 9,000 +1,000 —Source: Fatalities—FARS 2010 (Final), 2011 (ARF), Injured—NASS GES 2010, 2011 Annual Files*Total includes occupants of buses and other/unknown occupants not shown in table. None of the changes in estimated injured people was statistically significant.
Table 3Total and Alcohol-Impaired (AI) Driving Fatalities*
2010 2011 Change % ChangeTotal Fatalities 32,999 32,367 -632 -1.9%AI Driving Fatalities 10,136 9,878 -258 -2.5%
Alcohol-Impaired Drivers in Fatal Crashes by Vehicle TypePassenger Car 4,164 4,114 -50 -1.2%Light Truck – Van 286 258 -28 -9.8%Light Truck – Utility 1,423 1,404 -19 -1.3%Light Truck – Pickup 2,041 1,882 -159 -7.8%Motorcycles 1,280 1,390 +110 +8.6%Large Trucks 51 43 -8 -16%Source: FARS 2010 (Final), 2011 (ARF)*See definition in text.
3
NHTSA’s National Center for Statistics and Analysis 1200 New Jersey Avenue SE., Washington, DC 20590
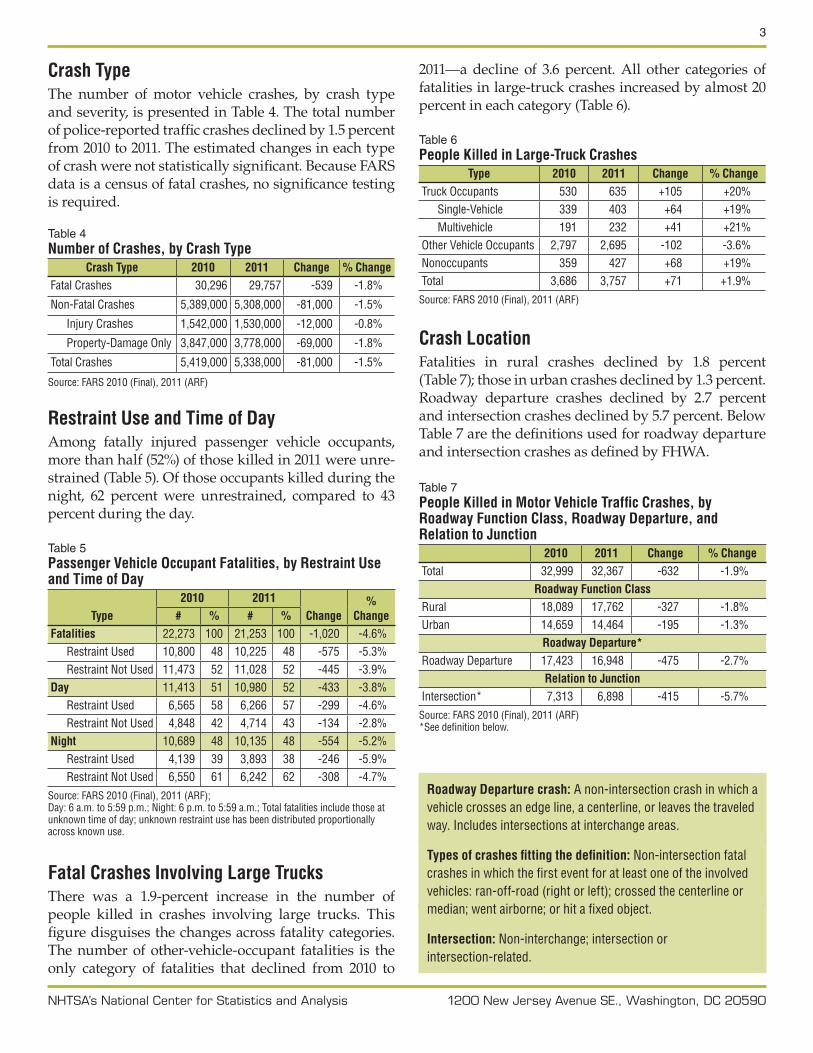
Crash TypeThe number of motor vehicle crashes, by crash type and severity, is presented in Table 4. The total number of police-reported traffic crashes declined by 1.5 percent from 2010 to 2011. The estimated changes in each type of crash were not statistically significant. Because FARS data is a census of fatal crashes, no significance testing is required.
Table 4Number of Crashes, by Crash Type
Crash Type 2010 2011 Change % ChangeFatal Crashes 30,296 29,757 -539 -1.8%
Non-Fatal Crashes 5,389,000 5,308,000 -81,000 -1.5%
Injury Crashes 1,542,000 1,530,000 -12,000 -0.8%
Property-Damage Only 3,847,000 3,778,000 -69,000 -1.8%
Total Crashes 5,419,000 5,338,000 -81,000 -1.5%
Source: FARS 2010 (Final), 2011 (ARF)
Restraint Use and Time of DayAmong fatally injured passenger vehicle occupants, more than half (52%) of those killed in 2011 were unre-strained (Table 5). Of those occupants killed during the night, 62 percent were unrestrained, compared to 43 percent during the day.
Table 5Passenger Vehicle Occupant Fatalities, by Restraint Use and Time of Day
Type2010 2011
Change%
Change# % # %Fatalities 22,273 100 21,253 100 -1,020 -4.6%
Restraint Used 10,800 48 10,225 48 -575 -5.3%Restraint Not Used 11,473 52 11,028 52 -445 -3.9%
Day 11,413 51 10,980 52 -433 -3.8%Restraint Used 6,565 58 6,266 57 -299 -4.6%Restraint Not Used 4,848 42 4,714 43 -134 -2.8%
Night 10,689 48 10,135 48 -554 -5.2%Restraint Used 4,139 39 3,893 38 -246 -5.9%Restraint Not Used 6,550 61 6,242 62 -308 -4.7%
Source: FARS 2010 (Final), 2011 (ARF); Day: 6 a.m. to 5:59 p.m.; Night: 6 p.m. to 5:59 a.m.; Total fatalities include those at unknown time of day; unknown restraint use has been distributed proportionally across known use.
Fatal Crashes Involving Large TrucksThere was a 1.9-percent increase in the number of people killed in crashes involving large trucks. This figure disguises the changes across fatality categories. The number of other-vehicle-occupant fatalities is the only category of fatalities that declined from 2010 to
2011—a decline of 3.6 percent. All other categories of fatalities in large-truck crashes increased by almost 20 percent in each category (Table 6).
Table 6People Killed in Large-Truck Crashes
Type 2010 2011 Change % ChangeTruck Occupants 530 635 +105 +20%
Single-Vehicle 339 403 +64 +19%Multivehicle 191 232 +41 +21%
Other Vehicle Occupants 2,797 2,695 -102 -3.6%Nonoccupants 359 427 +68 +19%Total 3,686 3,757 +71 +1.9%Source: FARS 2010 (Final), 2011 (ARF)
Crash LocationFatalities in rural crashes declined by 1.8 percent (Table 7); those in urban crashes declined by 1.3 percent. Roadway departure crashes declined by 2.7 percent and intersection crashes declined by 5.7 percent. Below Table 7 are the definitions used for roadway departure and intersection crashes as defined by FHWA.
Table 7People Killed in Motor Vehicle Traffic Crashes, by Roadway Function Class, Roadway Departure, and Relation to Junction
2010 2011 Change % ChangeTotal 32,999 32,367 -632 -1.9%
Roadway Function ClassRural 18,089 17,762 -327 -1.8%Urban 14,659 14,464 -195 -1.3%
Roadway Departure*Roadway Departure 17,423 16,948 -475 -2.7%
Relation to JunctionIntersection* 7,313 6,898 -415 -5.7%Source: FARS 2010 (Final), 2011 (ARF)*See definition below.
Roadway Departure crash: A non-intersection crash in which a vehicle crosses an edge line, a centerline, or leaves the traveled way. Includes intersections at interchange areas.
Types of crashes fitting the definition: Non-intersection fatal crashes in which the first event for at least one of the involved vehicles: ran-off-road (right or left); crossed the centerline or median; went airborne; or hit a fixed object.
Intersection: Non-interchange; intersection or intersection-related.
4
NHTSA’s National Center for Statistics and Analysis 1200 New Jersey Avenue SE., Washington, DC 20590
Other Highlights■■ Fatalities in distraction-affected crashes increased by 1.9 percent (3,267 fatalities in 2010 to 3,331 fatalities in 2011). The number of people injured in distraction-affected crashes declined by 7 percent (416,000 injured people in 2010 to 387,000 injured people in 2011).
■■ In 2011, there was a 4.6-percent decline in young-driver-related fatalities from 2010 and a 5.5-percent decline in young-driver crashes.
■■ Fatalities among females declined by 507, or 80 per-cent of the total decrease in fatalities.
■■ Motorcyclist fatalities increased by 94 fatalities from 2010 to 2011. When reviewing motorcyclist fatalities by age, the only age group with a decline in fatalities was the 40-to-49-year-old group.
■■ There were 392 fewer fatalities on Fridays in 2011 than in 2010. This is 62 percent of the total decrease in fatalities over the year.
■■ In 2011, 90 fewer children (age 15 and younger) were killed as a result of motor vehicle crashes than in 2010.
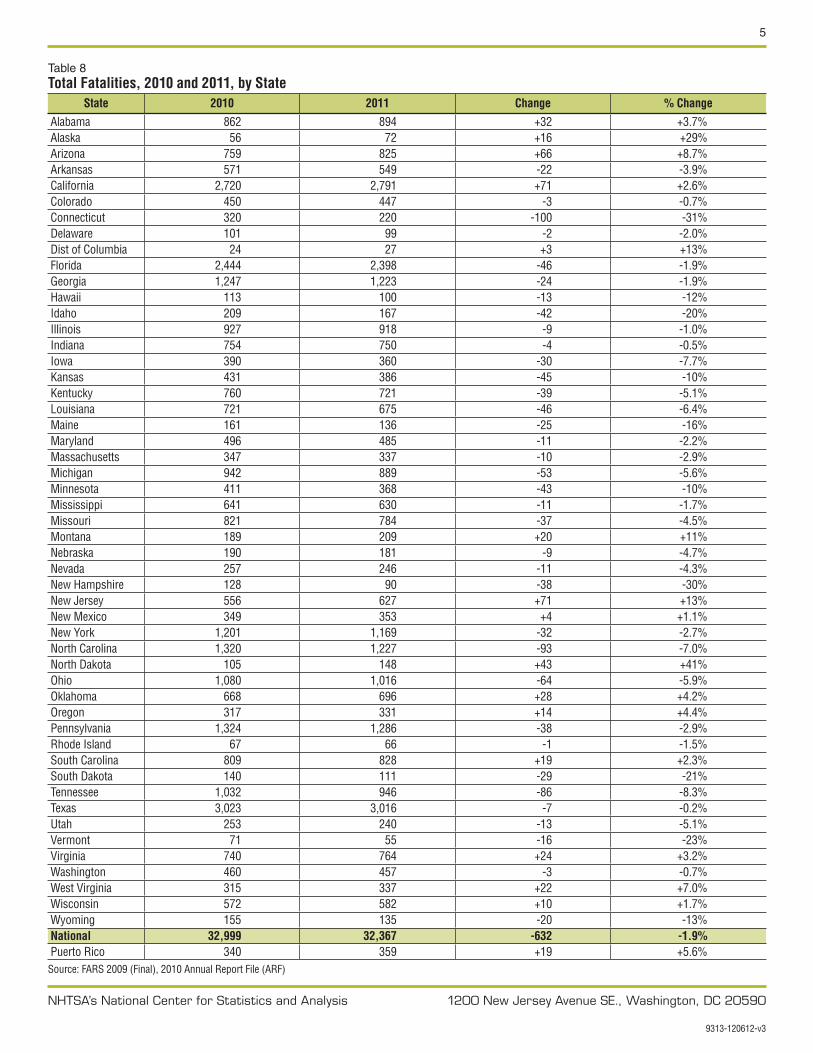
State by State Distribution of FatalitiesTable 8 compares the total number of fatalities for 2010 and 2011, the change in the number of total fatalities,
and the percentage change for each State, the District of Columbia, and Puerto Rico. Thirty-six States had reduc-tions in the number of fatalities. Five States had reduc-tions of over 50 fatalities, led by Connecticut with 100 fewer fatalities in 2011 than in 2010. North Carolina (-93), Tennessee (-86), Ohio (-64), and Michigan (-53) were the other States with more than 50 fewer fatalities in 2011 as compared to 2010. Three States saw increases of more than 50 overall fatalities from 2010 to 2011. California and New Jersey both had the greatest increase in the number of fatalities, going up 71 fatalities. The percent-age change was only 2.9 percent increase in California because of the typically large number of fatalities in California, and 13 percent increase in New Jersey. In Arizona there were 66 more fatalities in 2011 than 2010.
Additional State-level data is available at NCSA’s State Traffic Safety Information Web site www-nrd.nhtsa.dot.gov/de pa r t m e nt s/n r d- 3 0/n c s a/ST SI/USA%20WEB%20 REPORT.HTM
FARS is a census of all fatal crashes of motor vehicles traveling on public roadways in which a person died within 30 days of the crash. Data for the NASS/GES comes from a nationally representative sample of police-reported motor vehicle crashes of all types, from property-damage-only to fatal.
The information in this Research Note represents an overview of the 2011 FARS and GES files. Additional information and details will be available at a later date.
This research note and other general information on highway traffic safety may be accessed by Internet users at: www-nrd.nhtsa.dot.gov/CATS/index.aspx
5
NHTSA’s National Center for Statistics and Analysis 1200 New Jersey Avenue SE., Washington, DC 20590
Table 8Total Fatalities, 2010 and 2011, by State
State 2010 2011 Change % Change
Alabama 862 894 +32 +3.7%Alaska 56 72 +16 +29%Arizona 759 825 +66 +8.7%Arkansas 571 549 -22 -3.9%California 2,720 2,791 +71 +2.6%Colorado 450 447 -3 -0.7%Connecticut 320 220 -100 -31%Delaware 101 99 -2 -2.0%Dist of Columbia 24 27 +3 +13%Florida 2,444 2,398 -46 -1.9%Georgia 1,247 1,223 -24 -1.9%Hawaii 113 100 -13 -12%Idaho 209 167 -42 -20%Illinois 927 918 -9 -1.0%Indiana 754 750 -4 -0.5%Iowa 390 360 -30 -7.7%Kansas 431 386 -45 -10%Kentucky 760 721 -39 -5.1%Louisiana 721 675 -46 -6.4%Maine 161 136 -25 -16%Maryland 496 485 -11 -2.2%Massachusetts 347 337 -10 -2.9%Michigan 942 889 -53 -5.6%Minnesota 411 368 -43 -10%Mississippi 641 630 -11 -1.7%Missouri 821 784 -37 -4.5%Montana 189 209 +20 +11%Nebraska 190 181 -9 -4.7%Nevada 257 246 -11 -4.3%New Hampshire 128 90 -38 -30%New Jersey 556 627 +71 +13%New Mexico 349 353 +4 +1.1%New York 1,201 1,169 -32 -2.7%North Carolina 1,320 1,227 -93 -7.0%North Dakota 105 148 +43 +41%Ohio 1,080 1,016 -64 -5.9%Oklahoma 668 696 +28 +4.2%Oregon 317 331 +14 +4.4%Pennsylvania 1,324 1,286 -38 -2.9%Rhode Island 67 66 -1 -1.5%South Carolina 809 828 +19 +2.3%South Dakota 140 111 -29 -21%Tennessee 1,032 946 -86 -8.3%Texas 3,023 3,016 -7 -0.2%Utah 253 240 -13 -5.1%Vermont 71 55 -16 -23%Virginia 740 764 +24 +3.2%Washington 460 457 -3 -0.7%West Virginia 315 337 +22 +7.0%Wisconsin 572 582 +10 +1.7%Wyoming 155 135 -20 -13%National 32,999 32,367 -632 -1.9%Puerto Rico 340 359 +19 +5.6%Source: FARS 2009 (Final), 2010 Annual Report File (ARF)
9313-120612-v3