Embed Size (px)
Citation preview

Research MethodsPsych 402
LECTURE 4
COLLECT ASSIGNMENT #1VHS – Sci Am #1 not cc
(Double blind controlled, placebo)

Assignment 1: LIBRARY SEARCH
1. Number EEG papers on autism (autism, asperger, autistic)2. Number of sleep deprivation papers on high school kids3. Number of subjects in the one study on sleep deprivation, naps,
and caffeine in high school kids4. Number of papers published by Carl Sagan in English5. Number of sleep papers published since January 1, 19806. Number of co-authored papers by DA Kaiser & MB Sterman7. Maximum score on Autism Spectrum Quotient Test (AQ Test) 8. Maximum score on the AQ test a female has ever received9. Size in grams of Immanuel Kant’s brain 10. Publication year of the one book in Wallace library on a
feral/neglected child who was discovered in the 20th century
Use Medline for questions 1-5PsycInfo for question 6any source for remainder

STROOP EXPT

STROOP EXPERIMENT
Independent variable (IV) and levels: INK WORD CONGRUENCE, incongruent (1), neutral (2)
Dependent variable (DV): response time to name all ink colors
Control variables (CV): screen, order of colors, same colors (stimulus properties), three columns, number of words, subject demographic and related variables, room
Random variables (RV): people in room, distractions, motivation/anxiety
Possible Confounding variables: order could have

STROOP EXPERIMENT
Independent variable (IV): Ink-word congruence
Dependent variable (DV): Time to name entire list
Control variables (CV): Room, experimenter, stimulus properties
Random variables (RV): distractors, motivation
Possible Confounding variables: practice, fatigue

RESEARCH VARIABLES
Independent variable (IV): Variable manipulated by researcher
Dependent variable (DV): Variable measured by researcher, expected to change as a result of the IV
Control variables (CV): Factors kept constant
Random variables (RV): Factors allowed to vary randomly.
Confounding variable: Factors that vary systematically with the levels of the IV, often present in one level and not another

Principle of Falsifiability
Idea is not a testable hypothesis unless it can be proven false
Freud’s Oedipal complex may not be falsifiable in most implementations of it (and thus not a theory or hypothesis, but dogma)
– “if you don’t admit fear of father, sexual love of mother you’re repressing it”


Research MethodsPsych 402
LECTURE 5 – BIAS
VHS Sci Am #2

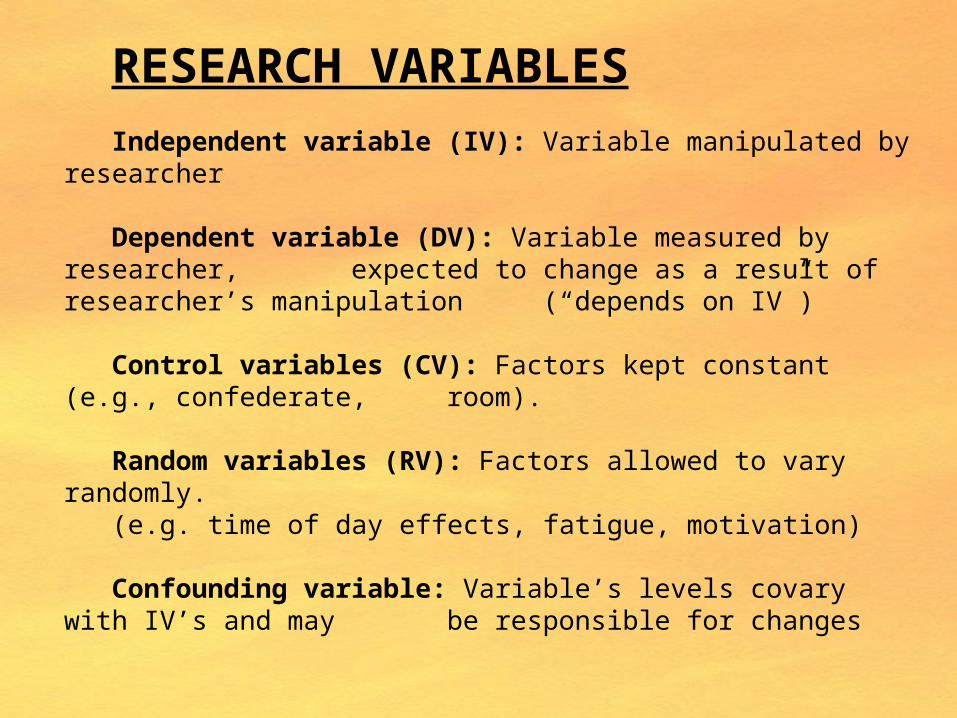
RESEARCH VARIABLESIndependent variable (IV): Variable manipulated by
researcher
Dependent variable (DV): Variable measured by researcher, expected to change as a result of researcher’s manipulation (“depends on IV”)
Control variables (CV): Factors kept constant (e.g., confederate, room).
Random variables (RV): Factors allowed to vary randomly.
(e.g. time of day effects, fatigue, motivation)
Confounding variable: Variable’s levels covary with IV’s and may be responsible for changes

Source of Experimental Bias
• Subject Bias– Social desirability– Expectancy effects like Hawthorne– Conform to demand characteristics
Solution: single blind, placebo, clever design, deception (e.g., hostile masculinity design)

Source of Experimental Bias
• Experimenter Bias– Confirmation bias– Halo effects– Assignment (self selection, nonrandom)
Solution: double blind, random assignment, predetermined administrative procedures (e.g., tape record instructions), use experimenters who don’t know hypothesis or expected outcomes
SciAm video #2

Incongruent/more difficult
REDGREENBLUEBLUEREDBROWNGREENREDGREENBLUEBROWN
REDGREENBLUEGREENBROWNREDBLUEGREENREDGREENBROWN
BLUEREDREDBLUEBROWNGREENREDBLUEGREENREDBROWN

Neutral, easier
RAWGRANDBOLDBOLDRAWBRAINGRANDRAWGRANDBOLDBRAIN
RAWGRANDBOLDGRANDBRAINRAWBOLDGRANDRAWGRANDBRAIN
BOLDRAWRAWBOLDBRAINGRANDRAWBOLDGRANDRAWBRAIN

Single-Blind and Double-Blind Designs
• Breaking the blind of placebo research
• In clinical trials, if treatment any good at all, experimenters figure out who got what– in depression study, patients receiving active
treatment show mood elevation, increased energy, etc.)
• AND participants can figure it out as well!

Efficacy & Effectivenss studies• Efficacy studies
– Active vs Placebo condition where there is no change in behavior expected
• (Placebo effect - spontaneous recovery - is around 30 % for numerous conditions)
• Effectiveness study:– Active vs current best treatment
e.g., new drug vs Prozac in depression
More ethical

Source of Experimental Bias
• Measurement Bias– Ceiling & Floor effects
• Data truncated at top or bottom, respectively, due to limits on possible scores.
• E.g., 100% or 0% accuracy - 2 words v 1000
• Choose realistic and reasonable levels. – If manipulation (IV) too strong (sledgehammer effects
uninteresting), too weak (miss effect). – If measurement (DV) crude (miss effect), insensitive
(trivial change).

Counterbalancing – arranging presentation levels of IV to eliminate confounding
• Multiple orders, reverse orders• (not needed for between subject designs)
• Control for “Items Effect”

Experimental research• 1. Formulate a testable hypothesis
– Translate idea into testable hypothesis. • Often expressed as predictions about how
changes in one variable will be related to changes in another. – E.g., Violent media leads to aggressive behavior
– Formulate and define predictions & variables precisely, unambiguously.
– E.g., BDI for depression

OPERATIONAL DEFINITION
Specify operations required to manipulate or measure concept.
e.g. Anxiety is not vaguely described but explicitly measured by objectively through subjective report scales, behavior checkboxes, etc

Beck Depression Inventory (BDI)Twenty-one dimensions of depression:1. Sadness 12. Social withdrawal2. Pessimism 13. Indecisiveness3. Sense of failure 14 Change in body image4. Dissatisfaction 15. Retardation5. Guilt 16. Insomnia6. Expectation of punishment 17. Fatigability7. Dislike of self 18. Loss of appetite8. Self Accusation 19. Loss of Weight9. Suicidal ideation 20. Somatic preoccupation10. Episodes of crying 21. Low level of energy11. Agitation
In past week including today:0 = I do not feel sad1= I feel sad2= I am sad all the time and I can’t snap out of it3= I am so sad that I can’t stand it
0-63 max score (30+ indicates severe depression)Aaron Beck

Experiment 1
• My idea: – Spoken words (or ASL) are encoded better
and less likely to be forgotten than written words
• Precisely: Spoken list will lead to better verbal free recall of short list than only written list

• 2. Select research method and design – Decide how to test your hypothesis. – How will data be collected (e.g., survey,
observation, experiment)? – Each method has advantages and
disadvantages. Select most suitable and practical strategy.
– Issue of control – too little (numerous potential confounds) vs too much (artificial)

Mini-Experiment 1
• Experiment
• Verbal list, 10 items each
• Two types of encoding: spoken/ASL, written
• Control for stimuli that could influence memory

Mini-Experiment 1: 5 letter nouns, high frequency, concrete, familiar
BOARD BREAK CHAIR CHILD CLOSE COAST COURT CROSS DEATH DRAMA DRINK EARTH EIGHT ESSAY FRONT GHOST GLASS GROUP HEART HOUSE LEVEL LIGHT LUNCH MONEY MONTH MOUTH MUSIC NIGHT NOVEL ORDER PAINT PAPER PARTY PHONE PIECE POINT QUIET RADIO RANGE RIGHT ROUND SCALE SCENE SENSE SHEER SHORT SIGHT SMALL SOUND SOUTH SPELL SPOKE STAFF STAND STATE STICK STILL STORY STYLE TABLE TASTE THEME THING THREE TOUCH TRAIN UNDER VOICE WASTE WATER WHITE WOMAN WORLD WRONG
MRC Psycholinguistic Database

• 3. Collect data – on whom? – Samples and populations– Ultimate goals – to generalize results
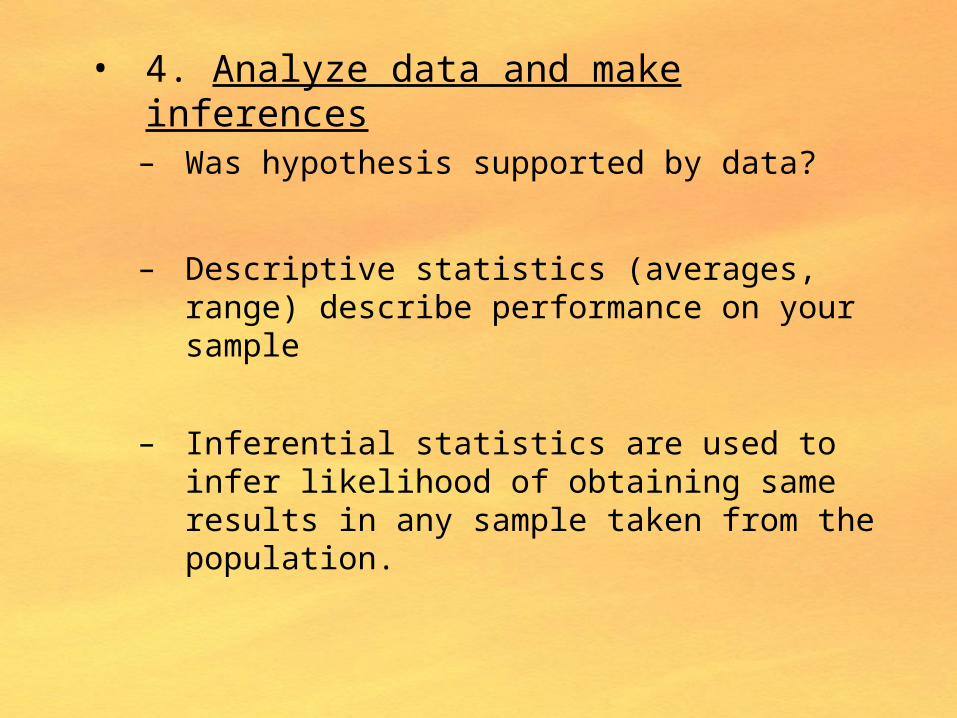
• 4. Analyze data and make inferences – Was hypothesis supported by data?
– Descriptive statistics (averages, range) describe performance on your sample
– Inferential statistics are used to infer likelihood of obtaining same results in any sample taken from the population.
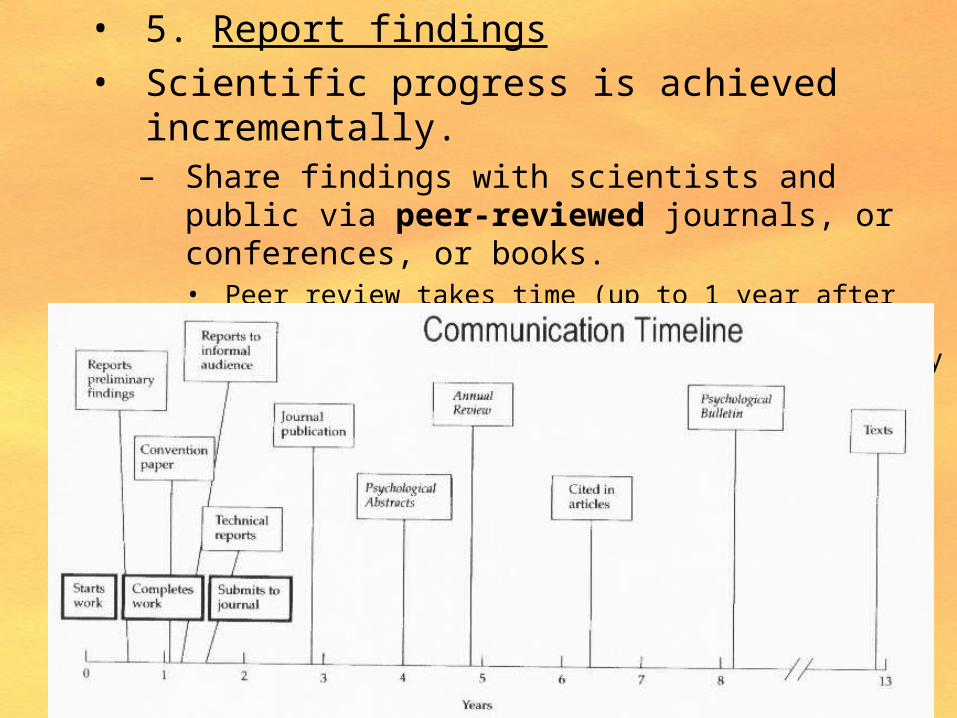
• 5. Report findings • Scientific progress is achieved incrementally.
– Share findings with scientists and public via peer-reviewed journals, or conferences, or books.• Peer review takes time (up to 1 year after submission), but
allows other experts to evaluate and critique your work, occasionally revealing flaws or limitations of the study.

Problems with peer review
• Common denominator
• Competitors review
• Cognitive dissonance on reviewer part– No changes suggested means no reason for
reviewing

Mini-Experiment 1
• Class exercise
• Left written; Right oral/ASL
• Left side of room will go first– BLANK SCREEN for oral/ASL

Left: written
• CHAIR • CHILD • DRINK • FRONT • GLASS • GROUP• HEART • LUNCH • NIGHT • PAPER
Right oral/ASL
• WORLD• TRAIN• RADIO• SHORT• WHITE• WATER• SMALL• HOUSE• TASTE• BOARD

Mini-Experiment List
• CHAIR • CHILD • DRINK • FRONT • GLASS • GROUP• HEART • LUNCH • NIGHT • PAPER
• WORLD• TRAIN• RADIO• SHORT• WHITE• WATER• SMALL• HOUSE• TASTE• BOARD
RESEARCH VARIABLESIndependent variable (IV): Variable manipulated by
researcher
Dependent variable (DV): Variable measured by researcher, expected to change as a result of researcher’s manipulation (“depends on IV”)
Control variables (CV): Factors kept constant (e.g., confederate, room).
Random variables (RV): Factors allowed to vary randomly.
(e.g. time of day effects, fatigue, motivation)
Confounding variable: Variable’s levels covary with IV’s and may be responsible for changes
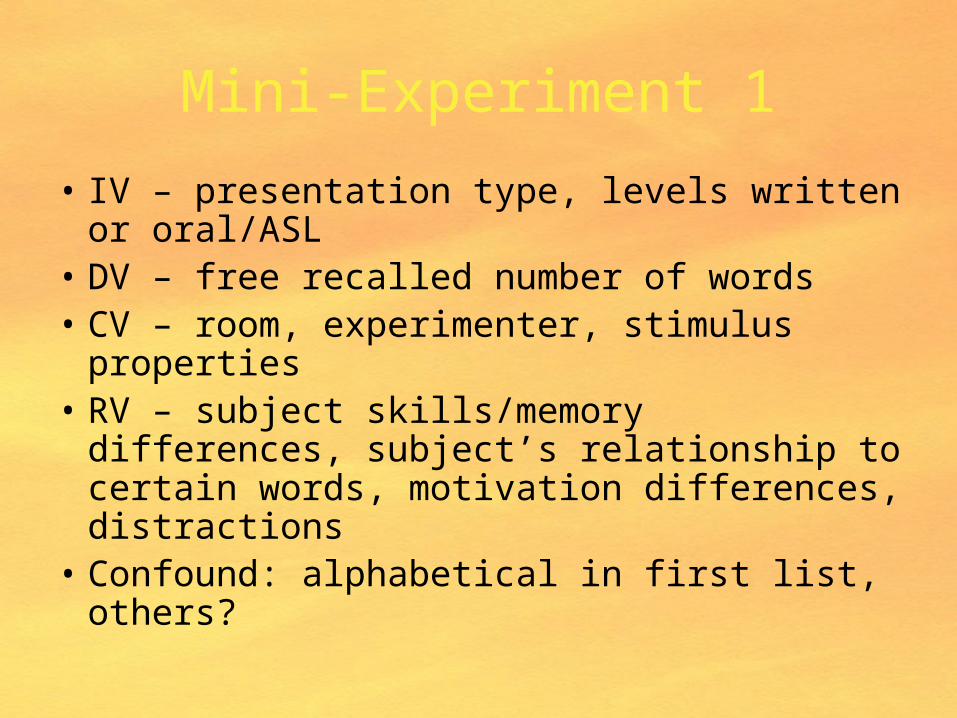
Mini-Experiment 1
• IV – presentation type, levels written or oral/ASL
• DV – free recalled number of words • CV – room, experimenter, stimulus
properties• RV – subject skills/memory differences,
subject’s relationship to certain words, motivation differences, distractions
• Confound: alphabetical in first list, others?

Research MethodsPsych 402
LECTURE 6
Measures: Distortion, reliability & validity
VHS Zimbardo #19 MilgramVHS 514 F (Framingham Heart & domestic violence)

Elements of a Research Study
Hypothesis
• Design
• Participants
• Measures – tools to quantify behavior
• Analysis

Issues with Measures• Access: how easily data obtained
(e.g., Studying self-identity and gender – It would be well illuminated by responses by those undergoing sex-change operations)
• Amount: how much data to collect (last year, decade)
• Truncation: ceiling & floor effects (e.g., aggression: violence is rare, displays of anger are not)
• Distortion: how situation and behavior varies from real world (e.g., Milgram’s experiment)
• Reliability: how consistent measure is
• Validity: does tool measure intended phenomenon?

Distortion / Ecological Validity(May not generalize to real world behavior)
“Effect of Punishment on Memory”
“Learner” is confederate; mentions untrue mild heart condition.
Teacher (true subject) straps learner, samples 45 volt jolt
Examiner says shocks may be painful but no permanent damage
STANLEY MILGRAM1933-1984


“Effect of Punishment on Memory”
Shocks on machine run from 15 (mild) to 450 volts (XXX) in steps of 15 volts
Learner’s script:120 shout about pain150 demand experiment stops180 “no more pain!”300 pounds on wall, screams330 single cry then answers no
more
Examiners prod subjects when they attempt to end experiment
“Learner” is an actor

Milgram’s Experiment
65% gave maximum
shock!

Reality of the experimentSubject is 50y unemployed man. After delivering 180-volt shock, he
pivots around and addresses experimenter in agitated tones:
• Subject: I can't stand it I'm not going to kill that man in there. You hear him hollering?
• Experimenter: As I told you before, the shocks may be painful, but • S: But he's hollering. He can't stand it. What's going to happen to him?• E: The experiment requires that you continue…• S: I refuse to take the responsibility. He's in there hollering• E: It's absolutely essential that you continue….• S: All right.
(He continues until learner ”passes” out at 330 volts.) • S: I think something's happened to that fellow in there. I don't get no
answer. He was hollering at less voltage. Can't you check in and see if he's all right, please?
• E: Not once we've started. Please continue, Teacher.• S (sits down): "Cool day, shade, water, paint." Answer please. Are you
all right in there? Are you all right,• E: Please continue, Teacher. Continue, please. (Subject pushes lever)• S: You accept all responsibility?• E: The responsibility is mine. Please go on. (Subject continues)

30% gave maximum shock when psychological distance “reduced”

“work all the variants”

Why so many people acted lethally?
Coercive factors:
Yale grounds
Assured not dangerous by experimenters
…many others
Results may not generalize to other settings and circumstances

Would Milgram’s effects occur in "real life"?
Hofling et al. (1966) • 22 nurses on night duty in psychiatric hospital in US• Unknown “doctor” phones nurse on duty and instructs her to
give medication to a patient at twice maximum dosage. Maximum dosage of 10 mg shown on bottle label; he instructs her to give 20 mg. He says he’ll sign relevant authorization papers when he arrives in a few minutes.
• Findings: 21/22 of the nurses obeyed telephone instruction and began to prepare dosage before they were stopped
• However: Drug was unknown to nurses. When experiment repeated with a drug that the nurses had heard of, NONE obeyed.

Further testing
• Rank and Jacobson (1977) carried out a similar study, but gave nurses opportunity to seek advice. – Only 2 out of 18 proceeded.
• Meeus and Raaijmakers (1986)– Similar procedure to Milgram but in Holland
with job applicants.– Had to deliver 15 ‘stress remarks’ to try and put
off ‘interviewee’.– 22 out of 24 delivered all 15 despite the fact
that at the time there was high unemployment in Holland.
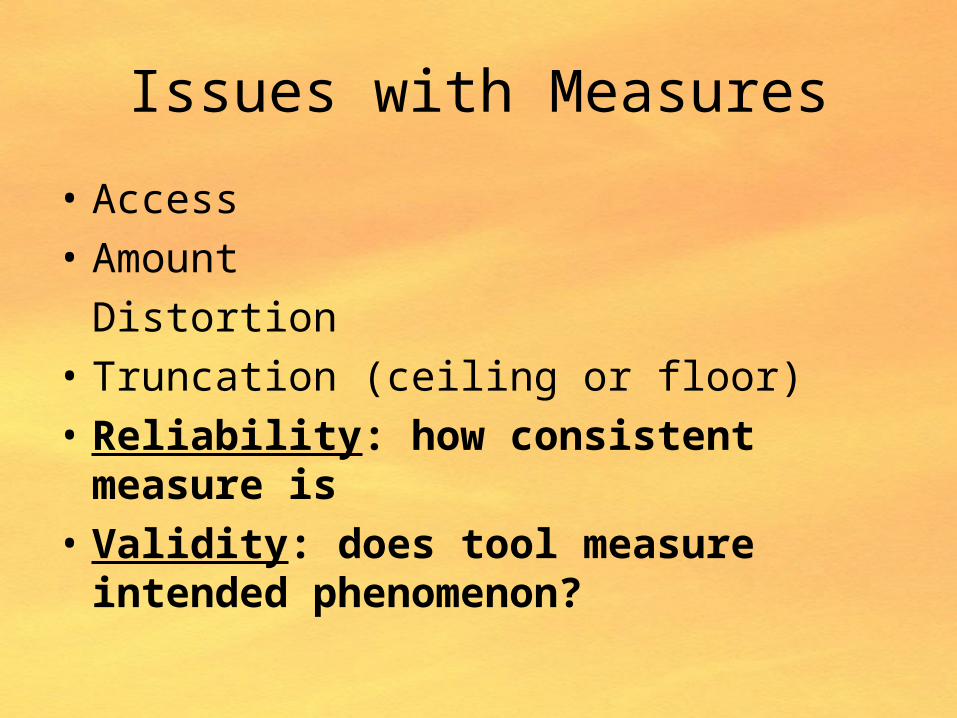
Issues with Measures
• Access
• Amount
Distortion
• Truncation (ceiling or floor)
• Reliability: how consistent measure is
• Validity: does tool measure intended phenomenon?

Validity of measure
• Does IQ measure Intelligence?
• Does respond to movie violence reflect true response to real violence
• Fear Factor Index of Courage
(e.g., time spent in coffin filled with worms)

Reliability
• Does measurement instrument yield consistent results when the characteristic being measured hasn’t changed?

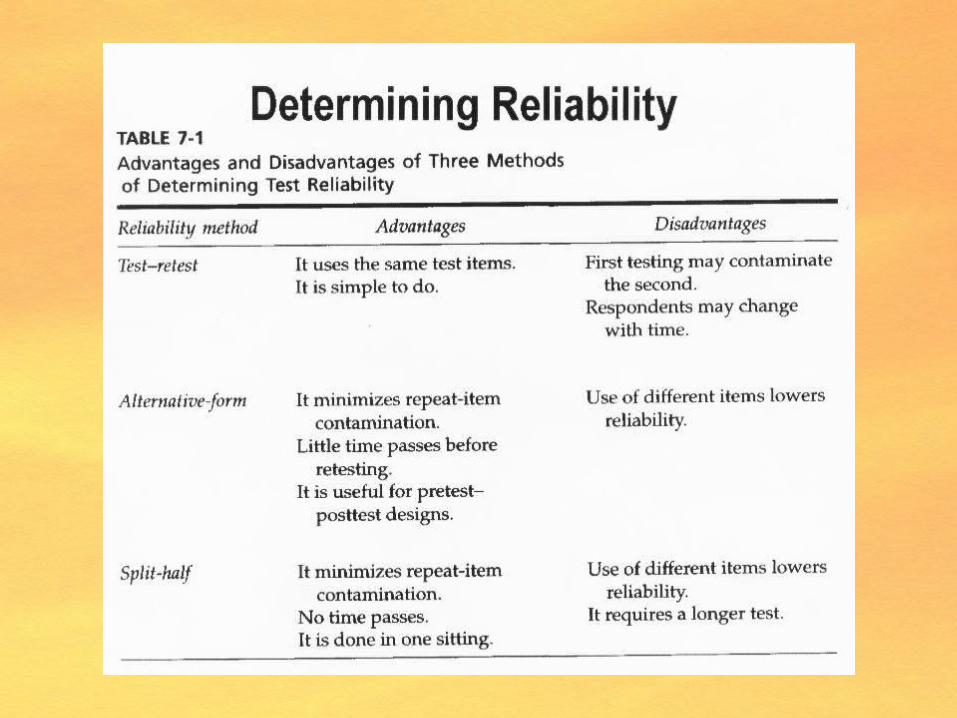
Different types of reliability
• Inter-rater reliability
• Test-retest reliability
• Internal reliability (Split-half)
• Alternative forms reliability

Inter-rater reliability
•Extent to which two or more individuals evaluate same product or performance give identical judgments.

Internal reliability
•Extent to which all the items within a single instrument yield similar results.
•More items more consistency (generally)

Alternative forms reliability
•Extent to which two different versions of the same instrument yield similar results.
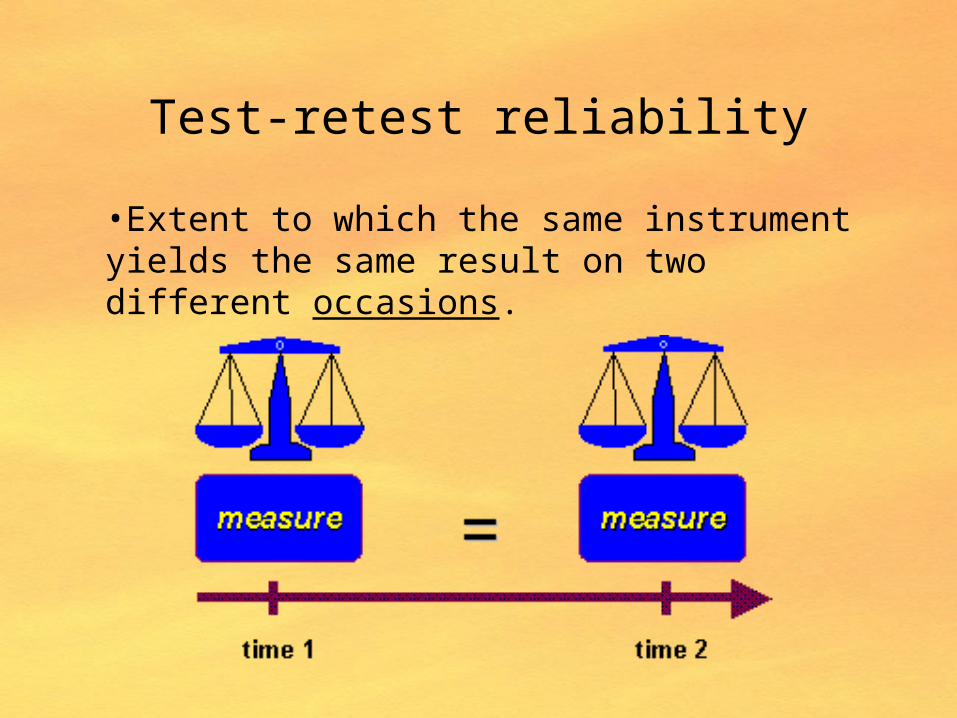
Test-retest reliability
•Extent to which the same instrument yields the same result on two different occasions.
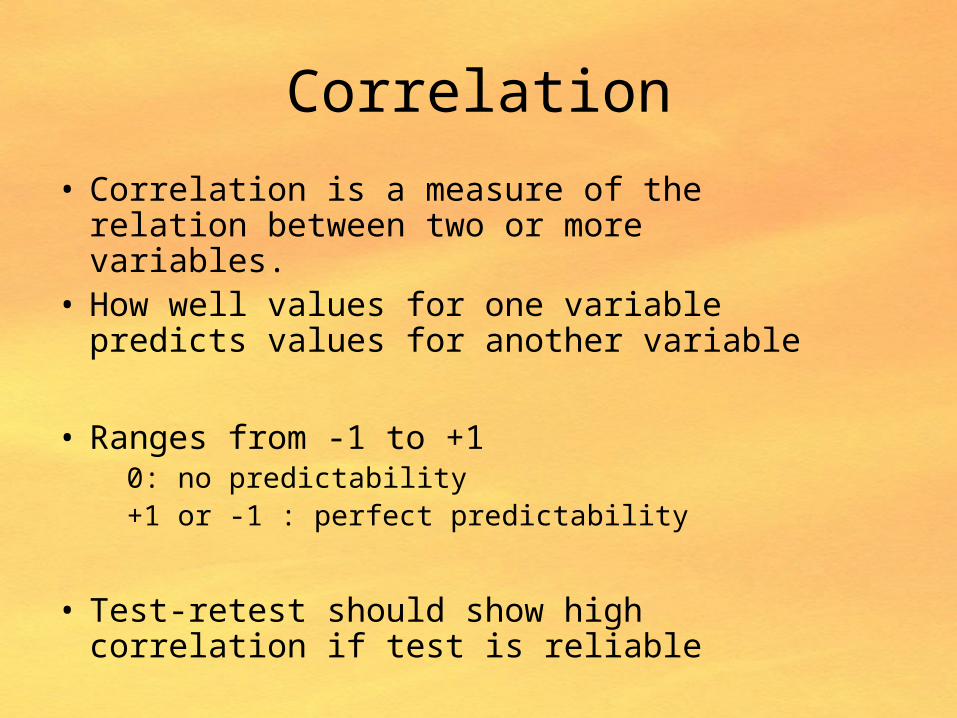
Correlation
• Correlation is a measure of the relation between two or more variables.
• How well values for one variable predicts values for another variable
• Ranges from -1 to +10: no predictability+1 or -1 : perfect predictability
• Test-retest should show high correlation if test is reliable


No predictability from one variable to the other
• More about correlation when we go over surveys & observational research

Reliability & Validity
• Reliability = consistency
• Validity = measure what is intended

Start here, get through lect07
VH 2729 “35 up”

VHS 514 F - Outcome• Sherman, L.W., Smith, D.A., Janell, D., & Rogan, D.P. (1992).
Crime, punishment, and stake in conformity: Legal and informal control of domestic violence. American Sociological Review, 57, 680-690.
• ABSTRACT:• Using police contacts for domestic violence offenses in
Milwaukee, the authors tested whether the effect of arrest on recidivism is conditional on key individual characteristics indicating a "stake in conformity." Ss were 1,200 cases of misdemeanor domestic battery. 91% were male, 79% were Black, and 56% were unemployed. Contrary to deterrence theories, arrest had no overall crime reduction effect in either the official or victim interview measures of repeat domestic violence. Consistent with labeling theories, arrest increased recidivism among those with a low stake in conformity: the unemployed and the unmarried. Neither race nor a record of prior offenses conditioned the effect of arrest on subsequent domestic violence.

Validity
• Extent to which the instrument measures what it is supposed to measure.
scale->weight, clock->time, thermometer->temperature,barometer->air pressure
IQ test -> intelligence?Time in coffin -> courage

Validity = Is it true & accurate?
– face validity (intuitively appears to measure intended phenomenon)
– convergent validity (correlates with similar measures)
– discriminant validity (doesn’t measure what it isn’t meant to)
– predictive validity (ability to predict something it should be able to predict)

Face validity
• On the surface, does instrument appear to measure a particular characteristic.
• IQ test – ask vocabulary questions vs questions about favorite sport team

Convergent validity
• Does instrument correlate with another, presumably related measure?
• Intelligence reflected in GPA, trivia contest outcomes, income, graduation rate – does IQ correlate with these?

Discriminant validity
• Does instrument not correlate with unrelated measures?
• IQ correlates weakly or not at all with language proficiency, test smarts, shoe size, etc

Predictive validity
• Ability to predict something it should theoretically be able to predict.
• IQ test correlates with future GPA?

Internal validity
• Study has sufficient contents (design, data) to ensure that our conclusions are truly warranted
–Or defending against sources of bias which would affect the cause-effect process being studied by introducing covert variables

Threat to Internal Validity, or possible source of confounds
• All studies– Experimenter bias– Subject bias
• All studies with control groups– Selection bias– Mortality bias– Social interaction
• Unintended treatment (Hawthorne effect)
• Compensatory rivalry or resentful demoralization
• Treatment imitation or diffusion
– benefit from info given to the treatment group
• Before/After studies– History: External events
take place between initial and latter measurements that has an effect on participants
– Maturation: Changes within participants during study
– Test experience: Exposure alters future performance
– Instrumentation: Unreliable measures or measurers
– Regression to the Mean

Subject “mortality”(different rates of leaving each group,
possibly treatment dependent)
0
10
20
30
40
50
60
70
80
90
100
1 2 3 4 5 6 7
meds
talk
Weeks
% in
Treatment

To ensure internal validity
Eliminate other possible explanations for the results we observed
– Controlled laboratory study - Regulate environmental conditions in a laboratory setting.
– Double-blind experiment - Both subject and test-conductor are not aware of research hypothesis, assignment.
– Unobtrusive measures - People do not know their performance is being monitored.
– Triangulation - Multiple sources of data are collected with the hope that they all converge to support one
hypothesis.

External validity
• Conclusions drawn from data generalize to other contexts, real-world settings

To enhance external validity
• Real-life settingTight controls of a laboratory setting may make results ungeneralizable – study phenomenon in the field.
• Representative sampleTested sample must be representative.
• Replication in different contextSimilar data or conclusions in dissimilar contexts suggests external validity (e.g., Milgram’s replications).

Study Country Participants %Obedient
Milgram (1963) USAMale general population Female general population
65 65
Rosenhan (1974) USA Students 85
Ancona & Pareyson (1968) Italy Students 85
Mantell (1971) Germany Male general population 85
Kilham and Mann (1974) AustraliaMale students Female students
40 16
Burley & McGuiness (1977) UK Male students 50
Shanab and Yahya (1978) Jordan Students 62
Miranda, et al (1981) Spain Students 90
Schurz (1985) Austria General population 80
Meeus & Raaijmakers (1986) Holland General population 92

Research MethodsPsych 402
LECTURE 7Longitudinal ResearchOr DVD 387 “42 up” or VH 2729 “35 up”

Pilot studies
• Pilot studies are initial attempts to study a phenomenon without sufficient numbers and/or controls to make firm conclusions about results– e.g., n=10, n=4, impure groups– Promising or unpromising only
Results from true (full) studies can confirmed or disconfirmed one’s hypothesis

Outliers
• Eliminating subjects– Predetermined criteria
of exclusion based on performance

• Abusing outlier elimination

DESIGN
Within-subject design - each participant exposed to
every level of IV (person acts as own control)
Between-subject design - each participants exposed to
one level of IV (and unaware of what other participants are exposed to)

Within-Subject Design
• Advantages• Fewer subjects
needed– Experimental time
shorter
• Subject acts as own control– Variability between
conditions smaller
• Disadvantages• Carryover effects• Counterbalancing
corrections presume linear transfer between conditions– Stroop example
• Incongruent/neutral
• Neutral/Incongruent

List 1
REDGREENBLUEBLUEREDBROWNGREENREDGREENBLUEBROWN
REDGREENBLUEGREENBROWNREDBLUEGREENREDGREENBROWN
BLUEREDREDBLUEBROWNGREENREDBLUEGREENREDBROWN

Slower when exposed to incongruent list first
RAWGRANDBOLDBOLDRAWBRAINGRANDRAWGRANDBOLDBRAIN
RAWGRANDBOLDGRANDBRAINRAWBOLDGRANDRAWGRANDBRAIN
BOLDRAWRAWBOLDBRAINGRANDRAWBOLDGRANDRAWBRAIN

Between-Subjects Design
• Advantages• No carryover effects• No counterbalancing
needed
• Disadvantages• More subjects needed
– More experimental time
• Group differences on skills, motivation, and numerous other factors are possible– Matching subjects
can reduce variability between conditions
– Random assignment eliminates bias

Longitudinal v Cross Sectional
• Longitudinal : same group compared at different times – (e.g., age 5 and at 10 and at 25 and at 40
years of old)
• Cross sectional: different age groups compared at one time – (e.g., Jan 2004)

Cross-sectional study• Easier to do, collect
data at one time.• Group differences• Cannot track how
attitudes, etc., evolve over time (free of culture)
Longitudinal study• Harder to do• Practice effects
Longitudinal v Cross Sectional