Embed Size (px)
Citation preview

Research methods in psychology
1. Content and aims
In psychology, large variety of research methods are applied, all of which are differing in
several respects. Researchers have the responsibility to choose a method which serves best
the purpose of the study, suits the studied construct and the investigated subjects available,
and eventually reflects the applied psychological approach. The decision must be cautious
and scientifically confirmed, as all methods imply not only advantages, but limitations and
downfalls.
The aim of this course is to establish, enrich and encourage scientific thinking regarding
psychological studies, and psychological problems. Students completed the course must
be able to analyze psychological research in terms of research method, variables, design
and identify the corresponding special advantages and disadvantages. The course enables
students to plan research studies in a scientifically established manner regarding
conceptualization and operational planning in detail. A special emphasis is made on
experimental research, namely on planning of experiments, experimental designs and
special problems of experimental studies. In general, the course develops critical thinking
regarding research.
Course activity includes collective discussion; analyzing several hypothetical and
historical psychological experiments; and research activities. The course book is C. James
Goodwin (2005). Research in psychology (Fourth edition). Hoboken, NY: Wiley.
Supplemental materials as tests and exercises are applied with the formal permission of
WileyEurope Higher Education.
2. Scientific approach to psychology
Scientific psychology is lead by the belief that human behavior has underlying rules which
can be discovered through scientific methods, thus can be predicted. These assumptions of
the scientific approach to psychology are termed (statistical) determinism and
discoverability, respectively. Based on this basic logic, empirical questions are
formulated, corresponding studies are planed, and data-based conclusions are drawn.
The third major feature of the scientific approach is objectivity, which enables different
researchers to derive the same conclusion from the same study. Furthermore, in order to
provide all necessary information for study replication, precise and detailed research
descriptions are required.
The basic difference between science and pseudoscience is that in the former, unlike in the
latter, every conclusion without solid empirical support is questioned. The more difficult
is to make a distinction of the two, the more important is to do so, in order to avoid
investing in research based on former false conclusions. An interesting example for a
pseudoscientific stream from the history of psychology is phrenology. Phrenology had the
aim to locate personality within the skull (Gall, 1938; see Figure 1). The first important
representative of this stream was Gall in the early 19th
century. Phrenologists believed that
touching, feeling bumps on the skull helps defining the personality of a subject, as they
indicate emphatic characteristics. Of course, the doctrines of phrenologist were disproved
(e.g., Flourens, 1846).

Figure 1
Skull with the locations of faculties proposed by phrenology, as an example for pseudoscience
(Wikipedia, 2009a)
The goal of scientific psychology is to describe behavior properly in detail, provide
explanation for human behavior in various settings, formulate general laws, establish
prediction, and support behavioral change. In order to have an example of a researcher
who is considered to clearly meet the requirements of scientific research, consider B. F.
Skinner (see Figure 2). His scientific work on operant conditioning was the first step of
experimental psychology (e.g., Skinner, 1935).
Related reading: Chapter one in the course book.
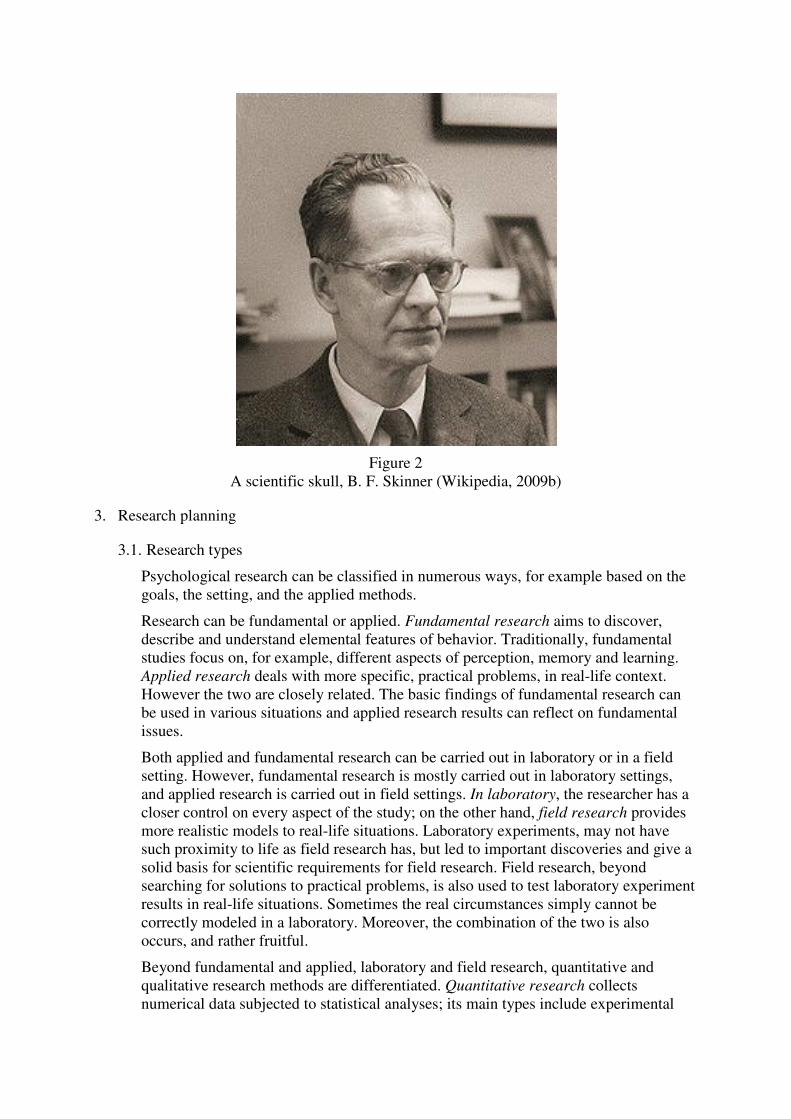
Figure 2
A scientific skull, B. F. Skinner (Wikipedia, 2009b)
3. Research planning
3.1. Research types
Psychological research can be classified in numerous ways, for example based on the
goals, the setting, and the applied methods.
Research can be fundamental or applied. Fundamental research aims to discover,
describe and understand elemental features of behavior. Traditionally, fundamental
studies focus on, for example, different aspects of perception, memory and learning.
Applied research deals with more specific, practical problems, in real-life context.
However the two are closely related. The basic findings of fundamental research can
be used in various situations and applied research results can reflect on fundamental
issues.
Both applied and fundamental research can be carried out in laboratory or in a field
setting. However, fundamental research is mostly carried out in laboratory settings,
and applied research is carried out in field settings. In laboratory, the researcher has a
closer control on every aspect of the study; on the other hand, field research provides
more realistic models to real-life situations. Laboratory experiments, may not have
such proximity to life as field research has, but led to important discoveries and give a
solid basis for scientific requirements for field research. Field research, beyond
searching for solutions to practical problems, is also used to test laboratory experiment
results in real-life situations. Sometimes the real circumstances simply cannot be
correctly modeled in a laboratory. Moreover, the combination of the two is also
occurs, and rather fruitful.
Beyond fundamental and applied, laboratory and field research, quantitative and
qualitative research methods are differentiated. Quantitative research collects
numerical data subjected to statistical analyses; its main types include experimental

and correlational research. Qualitative analysis stands for a more comprehensive,
realistic approach and usually the obtained data is summarized as an analytical
narrative. Observational research is an example for qualitative analysis. Qualitative
analysis often involves face to face interviews, focus groups, or case studies, which
cannot be summarize easily in a numerical way, but can provide a deeper
understanding of the investigated issue.
All research types will be further described in detail, with a special emphasis on
experimental research. Experimental research is accentuated, especially because the
close control on the situation enables the researchers to draw strong conclusions from
the results of experiments, even causal conclusions.
3.2. Developing research
Research ideas often come from everyday observations, or problems occurring in
unusual situations. Accidental findings can lead to research, which achievement is
known as serendipity. On the other hand, wide variety of literature is available on
psychological theories that organize and summarize existing knowledge. Therefore
literature and theories provide a good basis for creative associations, innovative
thoughts. When research ideas are deduced from theory, the results can support or
disprove existing theories. Finally, new studies can be arisen from earlier research
findings.
Thinking scientifically, research ideas must lead to empirical questions. Empirical
questions have two important requirements:
1. empirical data, which can be collected, must answer the question.
2. empirical question and the involved terms must be precisely, operationally
defined.
Operationism was a stream in physics in the early 20th, the members agreed that
scientific terms must be objective and precise. Therefore all concepts must be clearly
described as operations to conduct. The main concept of operationism can be
implemented also in psychology: general research ideas should be narrowed to
concrete specific questions in settings, concepts must be translated into measures. And
all important factor of the setting, method, registered variables and levels of variables
must be operationally defined.
Related reading: Chapter three in the course book.
4. Measurement and data analysis
As noted earlier, the first steps of research planning must involve the deliberate definition
of selected measures. All concepts must be translated into measures. In this section,
related to this step, measurement scales, evaluation of measures and data analysis will be
discussed. It is important to note, that research planning must deal not only with the
selection of measurements, but also with planning of data analysis. However, within the
frame of this course data analysis will not be discussed in great detail.
4.1. Measures, measurement scales
The operational definition of the measured concepts is required. The concepts should
be precisely, unambiguously defined and translated into applicable measures.
Statistical analysis of the obtained data enables us to make justifiable conclusions. The
type of collected data is essential to the selection of the valid statistical procedures.
Four measurement scales are differentiated: nominal, ordinal, interval, and ratio

scales. There are three features of numbers which make the distinction of the four
measurement scales: ordinality, cumulativity, and rationality of multiplication. A
comparative table is provided in Table 1.
Table 1.
Features of measurement scales
Nominal Ordinal Interval Ratio
The same
scale value
represents the
same category
The scale
values do not
have numeric
meaning.
Ordinality: Higher
scale value represents
more from the same
attitude, concept, or
behavior.
Differences between
adjacent scale values
are not constant.
Ordinality
Cumulativity: The
difference between a
scale value and the
former value or the
later value is equal.
Ratios of consecutive
scale values are not
equivalent
Ordinality
Cumulativity
Rational of
multiplication:
Ratios of
consecutive scale
values are
equivalent
There is an obvious
zero point fro the
scale
Nominal scale value does not have any of the above mentioned features of numbers; the
different levels of the variable represent distinct categories. Gender; marital status; extrovert
or introvert distinction of personality; treatment type with categories: control group, medical
treatment, training group are examples of nominal scale variables.
Ordinal scale variable values have a definite order, but the differences of the scale values are
ambiguous. Ranking values are ordinal scale variables: attractiveness (expressed by ranking)
of different holiday possibilities; rank order of student’s talent in music provided by the music
teacher and so on. But not only rankings, but other kinds of variables also have ordinal scale,
such as qualification expressed as low, medium and high qualification; or alcohol
consumption habits with categories: never, rarely, sometimes, often, always.
Interval scale measurements have the features of ordinality and cumulativity. This
measurement scale is in excess of the ordinal scale, in the sense that difference between the
scale values is meaningful and constant. Most personality scores have interval scale, a typical
example is the IQ measured by the Wechsler test.
Ratio scale variables have all features of numbers that is also the ratio of the scale values is
meaningful and constant. An important additional feature is the presence of an obvious zero
point for the scale. Ratio scale measurements are for example the reaction time, body
temperature, mostly physical measures.
Traditionally, interval and ratio scale measures are preferred as they easily can be analyzed in
various ways, given the wide variety of the available statistical procedures. Nowadays,
analyzing nominal or ordinal data is not a problem, but the researchers still intend to obtain
ratio or interval data if possible.
Categories as quantitative and qualitative measures are also used in practice. Nominal and
ordinal scale measures are rather qualitative, although ordinal scale variables with fine

calibration can be considered as quantitative measures, together with interval and ratio
measurements. Discrete and continuous measures are also differentiated. Discrete is a
measure which has limited number of values (nominal and ordinal scale), while continuous a
measure which has unlimited number of measures (interval and ratio scale).
4.2. Reliability and validity
Reliability and validity can be understood in respect to measures and to research
procedures. Here, these terms in respect to measures will be clarified. Useful measures
in psychology must have a degree of both reliability and validity. Reliability
guarantees an acceptable level of measurement error, while validity indicates that the
measure assess the concept it is supposed to assess. A valid measurement implies a
certain degree of reliability, but not vice versa. In real life situations, since these
concepts evaluate the applied measures, they have ethical implications. If an applied
measurement tool does not fulfill the requirements of reliability and validity, the
conclusions about people’s life (e.g., selection, dismissal, need for treatment) are not
correct, and makes the whole procedure unfair.
4.2.1. Reliability
A measure is reliable if the obtained results are repeatable. Reliability is a reverse
function of measurement error. Reaction time is a typical example for a highly reliable
measure. Reliability is high if reaction time is automatically registered, as for example
by a computer, but, of course, it can decrease if human factor is involved, think for
example of a stopwatch of a very old researcher. Reliability is often measured in case
of psychological tests, simply by correlational measures.
4.2.2. Validity
Validity means that a measurement instrument must measure truly the concept it is
required to measure, and not any other concept. A measure has face validity if it seems
to make sense to use. However, it does not make a valid measure by itself. A more
profound criterion of validity is criterion validity, which requires the measure to give
similar results as other measures of the same concept (1) and to provide reasonably
good predictions for the future (2). A third type of validity criterion is construct
validity, meaning that the applied measure measures the desired phenomenon, and at
the same time, this is the best measure to be taken.
4.3. Data analysis
Important to note that mostly the data is a sample from the population. Therefore, the
descriptive statistics summarize the features of the sample and inferential statistics
allow the researcher to draw conclusions about the population, based on the sample.
The data can be represented using descriptive statistics: central tendency, variability.
When the sample is summarized, several visual techniques can be used as well.
Depending on the scale of measurement, different methods are applied. Some of the
applicable methods are indicated in Table 2.

Table 2.
Some of the applicable visualization techniques and descriptive statistics for
the measurement scales
Nominal Ordinal Interval Ratio
Pie diagram
Mode
Bar chart
Mode
Median
Range
Bar chart with
intervals on the x-
axes
Mode
Median
Mean
Range
Interquartile range
Variance
Histogram
Mode
Median
Mean
Range
Interquartile range
Variance
Inferential statistics are used to describe tendencies beyond the effect of chance. In
hypothesis testing, inferential statistics answer concrete statements, usually about the
effect of some variable, the relationship of variables or the equality of some measures.
Conservative, null hypothesis (H0) states that there is no connection, groups are equal.
Alternative hypothesis (H1) states otherwise. It is important to note that statistical
hypothesis and research hypothesis are not the same, mostly the research hypothesis
agrees with H1. The concrete statistical analyses must be selected based on the
investigated hypothesis and the measurement scale of variables. Although the
selection of the proper statistical procedures is not dealt with in detail within the frame
of the course, general rules of hypothesis testing will be reviewed.
Table 3.
Statistical conclusion
Reality
Decision H0 true H0 false
H0 accepted Correct acceptance Type II error
H0 rejected Type I error Correct rejection
In Table 3, possible outcomes of the truth and decision about H0 and H1 are shown.
Naturally, hypothesis testing must reduce Type I and Type II error rates. The
probability of rejecting H0, although it is true (Type I error) is set by α criterion. α
mostly have a value of 0.05, but a more strict criterion, that is a smaller value, can also
be used. The other type of mistake regarding the conclusion is Type II error, when
although H0 is false, the researcher fails to reject it. Type II error can be caused by
measures not sensitive or not reliable enough.
There are special, important measures in connection with inferential statistics, which
must be outlined. Effect size provides an estimate of the magnitude of the proven
differences, effects. Confidence intervals show the range in which the calculated
statistic located with a high confidence, for example 95% of the cases. Finally power
of a test shows the possibility of correct rejection.
Related reading: Chapter four in the course book.

5. Experimental research planning
Experimental research is a type of quantitative research where the researcher has a great
control over the circumstances and the research setting. Therefore, the information
provided by experimental studies is especially valuable. The research plan has a great
responsibility to provide the proper control and must be well-overthought.
5.1. Variable types in experimental research
From the time the famous Experimental psychology of Woodworth (1938) was
published, experimental research was considered a scientific method of manipulation.
In an experiment, all conditions are held constant, except for the independent variable
which effect is investigated on the dependent variable. The values of the manipulated
independent variable are often different situations, tasks or instructions for different
research participants. The term dependent variable denotes the operationally defined,
observed behavior. All other factors are called extraneous variables which need to be
carefully controlled, in order not to interact with the investigated variables.
5.2. Validity of experiments
In connection with experimental research, the fourfold meaning of validity is
discussed below. A valid experiment requires a precise and meaningful definition of
dependent and independent variables (construct validity); the lack of confounding
variables (internal validity); correct use of statistics and careful conclusions from the
obtained results (statistical conclusion validity); and the confidently wide limits of
generalization (external validity).
Construct validity requires a rigorous operational definition of the variables, concepts
that are used. Internal validity implies a strong confidence of the researcher that the
obtained results are due to the manipulated variable and not the consequence of any
other factor. Statistical conclusion validity can be violated in several ways: the
researcher may choose a wrong type of analysis for the given purpose; ignore data
requirements for the used statistical analysis; report only a prosperous part of the
results; draw false, unproven conclusions. External validity tells us about the degree to
which the results can be generalized beyond the population, environment and
historical time which was present in the research. Ever so important external validity
is, usually the external validity of a result develops over experiments regarding the
same issue involving different people, settings, and time. Therefore, external validity
should be noted, but during the process of designing an experiment, it gets a smaller
weight.
5.3. Control problems in experimental research
While discussing control problems in experimental research, beyond the general
problems of bias, problems of between subject and within subject designs should be
differentiated. In a between subject design, the different values of the independent
variables occur in case of different groups of participants. In a within subject design,
the different values of the independent variable occur in case of the same subject. Both
situations lead to special problems.
5.3.1. Control problems in between subject design
In a study with a between subject design, the groups are selected to differ in terms of
the independent variable, but be equal in every other respect. In case of a large sample
size, random assignment can fulfill this requirement. Random assignment means that

every participant has an equal chance to be a member of any of the groups. It should
be noted that random selection is not equivalent with random assignment. After a
random selection, placing the participants to groups involves a random assignment.
Random assignment can easily lead to unequal groups, because nothing ensures that
the only difference among the groups is the value of the independent variable.
Block randomization ensures an equal number of participants per group. More
precisely, block randomization means that a member of each group is selected in each
round of the randomization, before a second member is selected to the same group.
The following steps must be carried out:
1. Decide the number of conditions, the sample size and the sample size per
condition. For example, three conditions, a sample size of 90, that is, 30 must
be the sample size per condition, if equal number of participants per
condition is preferred.
2. Designate the different conditions with numbers. Given the example, 1-3 are
the numbers.
3. Take a table with random numbers, following the rows, select numbers 1-3,
do not select any number the second time, before you select each in a block
once. A possible outcome for the first numbers (blocks are separated with
semicolon):
1,3,2; 2,1,3;2,1,3;2,3,1;3,2,1;1,2,3; and so on, till 90 numbers are collected.
4. Participants, in the order they volunteer to the experiment, are assigned to the
experimental conditions one after the other following the master sheet,
created in step 3.
Small sample size or the presence of an obvious confound calls rather for matching
procedures. Matching requires a preliminary testing (by a reliable and valid test) on
the matching variable, and depending on the number of conditions, pairs, triplets or
larger groups are formed with similar values on the matching variable. The group
members randomly assigned to the experimental conditions and the experiment only
can take place after all participants are assigned to the groups. The testing on the
matching variable may require an extra occasion and can cause logistical problems.
Furthermore, often it is not easy to decide which are the possible confounds and how
many matching variable must be used. Therefore, if possible, a large sample size
should be used, in order to avoid the special problems of matching.
5.3.2. Control problems in within subject design
In a study with a within subject design, each participant is tested on each condition,
hence this design is also called a repeated measure design. A within-subject design is
economic, as many observations derive from a small number of participants.
Therefore, it is a good choice when the number of available participants is small (when
the population is small). Another advantage is that the within-subject design eliminates
the problems stemming from nonequivalent groups.
However, the force for repetition raises the demand for control on sequence or order
effect, progressive and carryover effect. Sequence effect refers to the effect of an
earlier completed condition on the performance of a later condition, normally this
effect expressed in improvement in the performance. On the contrary, progressive
effect means the effect of repeated trials, and it normally associated with declining
performance. The direction of the carryover effect is not that evident. It simply means
that the experience of the former trial (condition) affect the performance in the

following trial(s). The reason can be the effect of the results on the self-esteem: some
tasks encourage, while others discourage the participants.
Control on the different effects stemming from within subject design can be provided
by applying more sequences (every condition is repeated per person) or partial,
complete counterbalancing when the subjects complete the tasks only once.
5.3.2.1.Participants complete every condition once
When complete counterbalancing is applied, every sequence of the conditions is
used at least once, therefore the minimally needed sample size is X!, where X
denotes the number of conditions. For example in case of five conditions
5!=5x4x3x2x1=120 participants are required. Obviously, complete
counterbalancing requires many participants when the number of conditions is
large.
Partial counterbalancing can be obtained in at least two ways: a random sampling
from the population of sequences, or using a Latin square. Random sampling from
the possible sequences clearly does not lead to a well balanced setting when the
sample size is far from X!.
However, the balanced Latin square ensures that every condition takes an order
position only once and every condition comes before and after every other
condition only once. The name of the design comes from an ancient Roman puzzle
where letters must have been placed taking into account similar criterions. How a
Latin square is constructed? Following the steps below, as an example a study with
six conditions is considered.
1. Construct the first row! A refers to the first condition of the experiment,
and ‘X’ refers to the last condition of the experiment. The first row is A
B X C X-1 D X-2 and so on. If six conditions are used, the first row is: A
B F C E D.
2. Construct the second row! Every letter in the second row is the following
letter in the alphabet of the one in the first row (in the same position).
The only exception is in the first letter in the second row under the last
letter in the first row. The general form is B C A D X E X-1 and so on. If
five conditions are used, the second row is: B C A D F E.
3. Construct the remaining rows in a way, that at the end a square is
obtained, that is the number of rows and columns are equal. Given the six
conditions a 6x6 square is obtained:
A B F C E D
B C A D F E
C D B E A F
D E C F B A
E F D A C B
F A E B D C
4. Finally, the conditions of the study are randomly assigned to the letters.
Latin square is always used following the above described steps when the
number of conditions is even, however, a second square is needed, when the
number of conditions is odd. The second square is the complete reverse of
the first square. Furthermore, when a Latin square is used, the minimal
sample size must equal the number of rows and the sample size must be a
multiple of the number of rows.
5.3.2.2.Participants complete each condition more than once
When the subjects can complete the tasks more than once, reverse
counterbalancing or block randomization can be used. Reverse counterbalancing
means that the different conditions are presented in an order and after that a
reverse order is used. Consider an experiment with five conditions, A B C D E E D
C B A is a possible design. If needed, the two orders can be repeated several times.
A B C D E E D C B A A B C D E E D C B A is one such design.
However, reverse counterbalancing, especially if the conditions repeated several
times, enables the participants to predict the subsequent condition. Block
randomization eliminates this problem. Block randomization can be used for
defining an order of the conditions, similarly as it has been mentioned earlier, that
is, every condition is used once before any condition is used the second time.
Block randomization may result in the design: D C A E B B A E D C.
Developmental research involves the special problems of age. When between
subject design is used in this context, which is termed cross-sectional design,
cohort effect can occur, that is nonequivalent groups may appear. When within
subject design is used in developmental research, which is termed longitudinal
design, attrition can be a problem. A combination of the two designs can be a
solution, when cohort is selected every year, or a cohort is tested longitudinally.
5.3.3. Bias
Bias is a more general problem and its source can be the experimenter expectancy or
the subject expectancy effect. In the first case, the experimenter behaves differently in
the different research groups and affects the responses. If double blind is applicable,
the procedure can control experimenter bias. Double blind means that the
experimenter who meets the subject does not know which group the subject belongs
to, therefore cannot affect the subjects’ behavior.
In the second case, when subject expectancy is involved, participants sense the reason
of the study and try to behave accordingly. Rosenthal (1966) called it evaluation
apprehension, as the participant desire a good evaluation. In order to eliminate
participant bias, demand characteristics (the aspects of study which would reveal the
hypothesis) are controlled. Furthermore, manipulation checks are used to detect
participant bias, for example the participants are asked about the possible aims of the
study.
An interesting type of participant bias is the so called Hawthorne effect (Gillespie,
1988). The expression simply refers to the effect produced by the knowledge of being
investigated. It was named after a famous study: between 1924 and 1933 workers’
productivity was studied at Western Electric Plant in Hawthorne. The often referred
study is called the Relay Assembly Test Room study, where the best working six
female workers were investigated. Independently of the conditions, the six females
produced more and more relays. Even when they were informed that the working
hours would increase with 6 hours a week, and free lunches would not be available
any more, their productivity increased. The only reason must have been that they were
the studied group, who seemed important, and was measured.
Related reading: Sections “The validity of experimental research” and “Threats to
internal validity” in Chapter five in the course book. Chapter six in the course book
6. Experimental designs

6.1. Single factor designs
A single factor experimental design involves only one independent variable. Four basic
single factor designs are differentiated, as it can be seen on Figure 3.
6.1.1. Single factor with two levels
The experimental design can have only one factor with two levels, this is the simplest
design. The two levels of the independent variables are either formed by manipulation
or selected as subject factors. Manipulation may involve random assignment
(independent group design), or assignment after matching on confounds (matched
group design).When subject factors form the independent variable, nonequivalent
groups design is the appropriate term to be used. While within subject single factor
design is called repeated measures design. The results of any of the above listed
designs are normally evaluated with a t-test, when the dependent variable is ratio or
interval type.
Figure 3.
Decision tree of single factor experimental designs (figure from the supplemental
materials of the course book)
6.1.2. Single factor with more than two levels
Experimental designs with a single factor with more than two levels enables us to
investigate the form of the relationship of the dependent and independent variables, if
the independent variable is at least an ordinal type. Even in this case, the independent
variable can create a within subject or a between subject design. The results of the
single factor design with more than two levels are normally investigated with a one-
way analysis of variance, when the dependent variable is appropriate.
6.1.3. Control group designs

The main characteristic of a control group is the presence of a group which does not
get the treatment. There are basically three types: the placebo group, the waiting list
group and yoked control group. Control group designs help the researcher identifying
the real effect of a treatment beyond the effect caused by the participant expectations
in change.
6.2. Factorial designs
Factorial design always involves more than one independent variable. The different
basic designs are indicated in Figure 4.
6.2.1. Features of factorial design
The description of the actual design, using the prevalent notation, indicates the number
of levels of each variable. For example a 4x2x3 design involves three independent
variables with four, two and three values. The advantage of such a design is the study
of interactions. The aim is not to study the effects of each independent variable
separately, but to reveal their interaction, that is, to study whether and how one
variable affects the effect of the other variable if it does so. The result can be an
interaction, main effect(s), both, or no significant effect.
6.2.2. Types of factorial design
In a factorial design, any of the independent variables can represent either between or
within subject factors. When all independent variables are within subject factors, the
design is called a repeated measures design. Otherwise, the independent variables can
be between subject factors which are manipulated yielding independent groups
factorial design (random assignment) or matched groups factorial design (matching).
On the other hand, the independent variables can be between subject factors which are
subject factors, yielding nonequivalent groups factorial design. And finally, between
subjects independent variables can include both subject and manipulated variables
resulting the so called PxE factorial design. When both within subject and between
subject variables are included in the design, depending on the latter, mixed PxE
factorial (subject variable) or mixed factorial design (manipulated) is obtained. The
notation PxE denotes person by environment design.

Figure 4.
Decision tree of factorial experimental designs (figure from the supplemental materials
of the course book)
Related reading: Chapter seven and eight in the course book.
7. Correlational research
Along with the experimental approach, correlational research is developed as a branch of
quantitative psychological research. In case of correlational research, naturally occurring
relationships are studied. Such studies rarely allow us to draw causal conclusions.
Notwithstanding, correlational research is valuable, because it can provide a good basis
for experimental research (1); sometimes, only correlational studies can be carried out (2);
and the obtained observation can be important by itself (3).
In the late 19th
Francis Galton (1869, 1886) was keenly studying intelligence, and believed
that intelligence is inherited. He developed a method to express the strength of co-
relations. During his heredity studies he identified that there is a tendency towards the
mean: tallest parents have less extremely tall children and shortest parents have less
extremely short children. Galton called this phenomenon regression to the mean. Hence,
when Karl Pearson developed a measure of correlation (see for e.g. Pearson, 1896), he
named it “r”, after regression, in honor of Galton.
The easiest way to study the intensity and type of an association, when continuous
variables are measured, is calculating Pearson’s r correlation coefficient. Correlation
expresses the direction and strength of a relation with numbers between –1 and 1. Zero
means no linear relation, smallest and largest numbers mean stronger association.
Negative correlation means reverse function, positive correlation means direct functions.
From the visual approaches, the scatter plot can also give an idea of the relationship.
When the cloud is circle-like, there is no sensible relation. The oval form of the cloud
indicates meaningful relation.
When the association is notable, regression analysis provides a possibility to give
predictions from the value of one of the variables to the value of another variable. When
the association of more than two variables is investigated, multivariate analyses, such as
multiple regression or factor analysis is required.
It is important to note, that although the terms independent and dependent variable are
used in correlational research, normally casual conclusions cannot be drawn. The direction
of the relationship is not evident. However, cross-lagged panel correlation may allow the
researcher to make assumptions about directionality. But it is always possible, that a third
variable, affects both variables. If a possible third variable is easy to note, partial
correlation can measure its effect.
Related reading: Chapter nine in the course book.
8. Quasi-experimental designs and applied research
8.1. Quasi-experimental design
A study where the participants cannot be randomly assigned to groups or participants
cannot be counterbalanced is understood to have quasi-experimental design. In such a
study, typically pretest-posttest changes are investigated regarding the experimental and
control group. The design can be time series or interrupted time series design, both

involving several measurements before and after treatment, but in the latter, trends also
can be evaluated.
A special type of quasi-experimental research, archival research, must be differentiated,
where the researchers rely on data gathered for a former study. Sometimes the stored
information is ready for analyses, but often content analyses should be applied first to
data. Content analysis may introduce experimenter bias through the data selection and also
through interpretation. The huge advantage of archival data is the enormous amount of
available information. However, casual conclusion neither from archival research can be
drawn.
8.2. Applied research
Applied research is developed on the ground of practical needs, in order to provide
solutions for practical problems. Although, the motivation is different, applied research
can also contribute to psychology theories, such as basic research. Applied research
normally takes place on the field, as for example at a company, in a clinic, in jail, but
sometimes also applied research can be carried out in a laboratory.
When an applied research is designed, special ethical issues (1), problems of between-
subject design (2) and within-subject design (3) must be considered, and an optimal
balance should be found between internal and external validity (4).
1. Participants often cannot be informed about the research, privacy may be
violated and sometimes subjects feel forced indirectly for participation.
2. Random assignment is often not possible, therefore, nonequivalent groups are
created and selection problem can cause loss of internal validity.
3. Similarly, often counterbalance neither can be properly carried out, causing
sequence effect and attrition.
4. As researchers loose control over several external factors in the field, internal
validity may decrease. At the same time external validity can be increasing based on
the application.
8.3. Program evaluation
Program evaluation is a type of applied research, which is used to assess policies and
programs. It may include needs analysis: the definition of the population who could
benefit from a concrete program; program evaluation: whether a program is following the
original plan, and if not, how it could be lead back to the predetermined path; and program
evaluation. Needs analysis can use census data, survey on available resources, survey on
participant needs, information forums (key informant, focus groups and community
forums can be used). Program evaluation combines formative evaluation, summative
evaluation and cost analyses. Both quantitative and qualitative research techniques are
used.
Related reading: Chapter ten in the course book.
9. Small N Designs
The earliest studies of psychology report small N designs or single subject designs. In the
early history of psychology, the data analysis techniques were not developed for large
sample sizes, partly this was the reason for such studies. However, sometimes only few
subjects are available, the cost must be reduced or the phenomenon is not so clear when
general tendencies are looked at. The advantage of small N design is high individual-

subject validity; on the other hand, clear disadvantage is the low external validity, and
susceptibility to experimenter bias.
When only one subject is investigated, behavioral change is measurable. Therefore, the
detection of a baseline level is essential. The simplest designs that can be used is A-B
design, where A is the section where baseline is determined, B is another section where
the treatment effect is registered. Maturation can also have a significant effect, therefore
withdrawal design is justified. A-B-A design and A-B-A-B designs are examples for
withdrawal design, which account for maturation. In multiple baseline designs, the
baseline is determined several times. A third type of single subject design is changing
criterion design. Such a design occurs in the context of shaping. When the required
behavior is complex and cannot be learned at once, changing criterion design is used.
After measuring the baseline level, a new measure is taken after treatment when certain
criterions are fulfilled, and the next measure is taken when even stronger criterions are
satisfied.
Case studies are well-known in clinical research. For example, Sigmund Freud described
many case studies (e.g., Breuer & Freud, 1955). A common feature of such studies, that
the detailed description and analysis of a single case is provided including history,
treatment and result effects. Although case studies have law external validity, they can
point at important features, co-relations and stimulate new research. Unfortunately, neither
the description of the person (especially regarding old events), nor the description of the
researcher is always precise. However, memory loss of the participant is smaller when
traumatic events are recalled.
Related reading: Chapter eleven in the course book.
10. Observational and survey research methods
10.1. Observational research
Observational studies provide descriptions of behavior. Mostly, naturalistic observations
are applied, that is, the researcher does not participate in the situation, and the participants
are either unaware of or habituated to the presence of the researcher. Another type is the
participant observation, which supposes that the researcher is an active member of the
group, the amount of interference can be on a wide range.
Three major problems of observations are in observational research is observer bias, lack
of control and subject reactivity. Observer bias can be reduced by behavior checklist
(consisting of operationally defined behaviors), training of the observers and using more
than one observer at a place. When more observers are present, interobserver reliability is
calculated, that is normally the number of agreements. Time sampling and event sampling
of the observed occasions can also be used to reduce bias, because if a sample is used,
continuous recording is not necessary. Furthermore, ethical issues may also arise. In spite
of all possible sources of bias, observational research is a good source of ideas for
experimental research.
10.2. Survey research
Survey research aims at describing the opinion, attitude, self-described behavior of
people. The most effective a survey is when the sample is representative. Probability
sampling is used to ensure representativeness of a sample, either random (every member
of the population has an equal chance to be selected), stratified (important groups have
proportional representation in the sample) or cluster sample (when all members cannot be

detected) can be used. The survey can be administered in an interview, by written
questionnaires, on the phone and via internet.
Survey wording must be very careful in several respects, detailed below. Survey questions
can be open ended to allow numerous possible answers, even answers the researcher could
not think of. Therefore an open ended question is a good source for all possible answers,
hence can be a ground for closed questions. Closed questions have a list of possible
answers, and the subject must choose among them. Closed questions do not require further
categorizing from the researcher, and the collected data is easy to handle. The simplest
example is a yes or no question. However, closed questions must contain all
distinguishable possible answers, and answers should not overlap. Whenever the
researcher is not confident about the completeness of the list, partially open ended
questions can be used, that is, the list of answers should include an “other” possibility.
A survey may also consist of several statements, where the subjects should indicate the
degree they agree with the statements. Most often a Likert type scale is used including 5-9
points with two extremes, such as strongly disagree, strongly agree.
When the memory or knowledge of subjects is challenged, there must be a possible
answer: “I do not know.”. The researcher may want to know demographical information,
such as age, income that may be delicate information for the participants. In such cases,
questions about demographic information must come at the end of the survey. Asking
about the date of birth is a better idea than asking for the age. And asking for a correct
placement among income ranges is also less delicate than asking for an average monthly
net income. In survey research, great care must be taken to avoid misunderstanding, social
desirability and response acquiescence (a tendency to agree with every statement).
Although wording may not seem essential, it can cause misunderstanding, different
understanding by different people, and the tendency to prefer one of the answers. To avoid
such problems, the following advises should be considered:
o Do not ask ambiguous questions (regarding the wording).
o Ask one question at a time.
o Avoid leading questions, such as questions of lawyers, when the question
appears as a part of a general idea.
o Use complete sentences.
o Avoid complexity.
o Avoid slang or jargon.
o Avoid abbreviations.
o Do not ask negatively phrased questions.
o Use balanced items.
Related reading: Chapter twelve in the course book.
11. Ethical issues in scientific research
Research planning must include a cost-benefit analysis regarding the risk for the
participants and the possible values of scientific outcome. Potential participants must get
enough information to be able to decide about participation. They must be informed about
the possibility of leaving the study whenever they feel like doing so. And subjects must be

ensured that refusal of participation has no effect on them. Special care must be taken for
these issues when children are involved in research or people in defenselessness situations
(in clinic, in jail). Confidentiality must be assured and promised.
Scientific fraud has several forms. Plagiarism involves the presentation of materials
belonging to other as one’s own. Data manufacturing and manipulation are in the group of
data falsification. Although academic pressure may lead to scientific fraud, it is often
discovered and has serious consequences, depending on the act and on the form.
Related reading: Chapter two in the course book.
12. References
Breuer, J., & Freud, S. (1955). Studies on hysteria. London: The Hogarth Press.
Flourens, P. (1846). Phrenology examined. Philadelphia: Hogan & Thompson.
Gall, F. J. (1938). On the functions of the brain and of each of its parts: With observations
on the possibility of determining the instincts, propensities and talents, or the moral
and intellectual dispositions of men and animals, by the configuration of the head
(Second edition). Edinburgh: Maclachlan & Stewart.
Galton, F. (1869). Hereditary Genius: An inquiry into its laws and consequences. London:
Macmillan.
Galton, F. (1886). Regression towards mediocrity in hereditary stature, Journal of the
Anthropological Institute, 15, 246-263.
Gillespie, R. (1988). The Hawthorne experiments and the politics of experimentation. In J.
G. Morawski (Ed.), The rise of experimentation in American psychology (pp 114-137).
New Haven, CT: Yale University Press.
Goodwin, J. (2005). Research in psychology (Fourth edition). Hoboken, NY: Wiley.
Pearson, K. (1896). Mathematical contributions to the theory of evolution. III. Regression,
heredity, panmixia. Philosophical transactions of the Royal Society of London. 187,
253-318.
Rosenthal, R. (1966). Experimenter effects in behavioral research. NY: Appleton-
Century-Crofts.
Skinner, B. F. (1935). The generic nature of the concepts of stimulus and response.
Journal of General Psychology, 12, 40-65.
Wikipedia (2009a) Phrenolog. Retrieved June 29, 2009, from
http://en.wikipedia.org/wiki/Phrenology
Wikipedia (2009b) B. F. Skinner. Rerieved June 29, 2009, from
http://en.wikipedia.org/wiki/B.F._Skinner
Woodworth , R. S. (1938). Experimental psychology. NY: Henry Holt.